


MARKET REPORT Midtown and Atlantic Station Condominium Mid-Year 2023
CONDO VIEW
During 2022 there was a long-awaited and dramatic shift in the housing market. In July 2023, the Federal Reserve raised interest rates for the 11th time in 17 months, to combat inflation. Mortgage rates have gone from around 3.25% in January 2022 to over 7%, drastically increasing the monthly cost of financing a home purchase and therefore reducing a Buyer’s “purchasing power.”
Most notably this market shift has caused a substantial decline in the number of closed transactions. The total number of single-family attached home sales year to date (“YTD”) through June 30th declined by 23% in 2023 as compared to 2022. This is consistent with the decline in number of transactions we saw in the last half of last year.
While the number of closed transactions for attached homes declined pretty significantly, the average sales price for condos YTD increased slightly in metro- Atlanta. The average sales price through June 30, 2023, was $378,997 vs. $372,932 for June 30, 2022. This represents a nominal increase in Average Sales Price of 2%.
Unlike single-family homes where the inventory of available homes has dropped, the inventory of available “attached homes” has increased. The active inventory of attached homes in metro Atlanta increased from 1,839 on June 30, 2022, to 2,157 at the end of June 2023, representing a 17% increase in available homes. We are still lower than historical inventory levels (e.g. December 2014 the listings were 2,751), but if this increase in inventory continues, eventually we will see a reduction in sales prices and longer time on the market.
In Midtown condominiums, we saw a 41% decline in the number of closed sales YTD from June 2022 to June 2023. During that same time frame, we saw the average sales price in Midtown increase slightly from $428,846 to $430,545 (less than half a percent increase) and the average sold price per square foot increased from $369 to $376 per square foot.
In Midtown, there was an increase in the total days on the market from an average of 37 days in 2022 to 51 days in 2023. The sales price to original list price ratio, a measure of how close sellers are getting to their asking price, decreased from 99.87% in June 2022 to 97.52% in June 2023. This means properties began selling slower and sellers started negotiating slightly more.
While it is hard to predict future real estate trends, we want our clients to understand what is happening in the market, so they will understand pricing and how quickly a home will likely sell in the community where they live or hope to live. We hope this report will help with that. If you would like a more in-depth analysis of a specific area or want to determine the value of your home, our neighborhood real estate experts are here to help.
We know the Atlanta market. Your building is our business.
Randal Lautzenheiser, Managing Broker and Owner
Len
Kwilos, Agent and Owner
David Vannort,
Agent and Owner
2
3 MIDTOWN.............................................................4 Midtown Condo Overview...............................................................6 1010 Midtown....................................................................................8 1065 Midtown Residences Loews...............................................10 1280 West.........................................................................................11 805 Peachtree..................................................................................13 905 Juniper.......................................................................................15 40 West 12th....................................................................................17 Above the Four Seasons.................................................................19 Ansley Above the Park...................................................................20 Ansley Terrace...................................................................................22 Aqua...................................................................................................23 The Belvedere...................................................................................24 The Belvedere - Lofts at the Belvedere........................................25 Colony Park CitiHomes...................................................................26 Colony Square - Colony House........................................................27 Colony Square - Hanover House....................................................29 Cornerstone Village - Reid Building...............................................30 Cornerstone Village - Newer Building..........................................31 Cornerstone Village - Loft Building.............................................33 Cotting Court....................................................................................35 The Dakota Condo Flats..................................................................36 The Dakota Townhomes.................................................................37 Harper On Piedmont......................................................................38 J-5.......................................................................................................39 Lofts at the Park I ..............................................................................41 Lofts at the Park II.............................................................................42 Luxe...............................................................................................43 Mayfair Renaissance........................................................................44 Mayfair Tower...................................................................................46 Metropolis.....................................................................................48 Midcity Lofts.....................................................................................50 One Museum Place..........................................................................52 Parc Vue.............................................................................................53 Park Central.......................................................................................55 Peachtree Lofts.................................................................................57 Peachtree Walk................................................................................59 Piedmont Crest................................................................................61 Plaza Midtown..................................................................................62 Reid House........................................................................................64 Seventh Midtown............................................................................65 Siena at Renaissance........................................................................66 Spire.............................................................................................67 Tuscany.....................................................................................69 Twelve Centennial Park..................................................................71 Viewpoint..................................................................................73 Virginia Hill........................................................................................75 W Residences...................................................................................76 Wilburn House - New......................................................................78 Wilburn House - Historic................................................................79 Windsor Over Peachtree................................................................80 ATLANTIC STATION/WHITE PROVISIONS....82 Atlantic Station/White Provisions Condo Overview...............84 Art Foundry.......................................................................................85 The Atlantic.......................................................................................87 The Lofts At Atlantic Station........................................................89 District Lofts.....................................................................................90 Element.......................................................................................91 Twelve Atlantic Station...................................................................93 White Provisions..............................................................................95
MIDTOWN
1010 MIDTOWN
1065 MIDTOWN RESIDENCES LOEWS
1280 WEST
805 PEACHTREE
905 JUNIPER
40 WEST 12TH
ABOVE THE FOUR SEASONS
ANSLEY ABOVE THE PARK
ANSLEY TERRACE
AQUA
THE BELVEDERE
THE BELVEDERE - LOFTS AT THE BELVEDERE
COLONY PARK CITIHOMES
COLONY SQUARE - COLONY HOUSE
COLONY SQUARE - HANOVER HOUSE
CORNERSTONE VILLAGE - REID BUILDING
CORNERSTONE VILLAGE - NEW BUILDING
CORNERSTONE VILLAGE - LOFT BUILDING
COTTING COURT
THE DAKOTA CONDO FLATS
THE DAKOTA TOWNHOMES
HARPER ON PIEDMONT
J-5
LOFTS AT THE PARK I
LOFTS AT THE PARK II
LUXE
MAYFAIR RENAISSANCE
MAYFAIR TOWER
METROPOLIS
MIDCITY LOFTS
ONE MUSEUM PLACE
PARC VUE
PARK CENTRAL
PEACHTREE LOFTS
PEACHTREE WALK
PIEDMONT CREST
PLAZA MIDTOWN
REID HOUSE
SEVENTH MIDTOWN
SIENA AT RENAISSANCE
SPIRE
TUSCANY
TWELVE CENTENNIAL PARK
VIEWPOINT
VIRGINIA HILL
W RESIDENCES
WILBURN HOUSE - NEWER
WILBURN HOUSE - HISTORIC
WINDSOR OVER PEACHTREE
4

10 13 14 35 30 41 28 5 16-18 8 36 11-12 27 25 29 39 37 7 6 19 22 23 31 42 1 4 3 33 45 15 9 32 26 24 38 20-21 34 2 43 44 46 47 48 49 40 1 1010 Midtown 19 Cotting Court 37 Plaza Midtown 2 1065 Midtown Residences Loews 20 The Dakota Condo Flats 38 Reid House 3 1280 West 21 The Dakota Townhomes 39 Seventh Midtown 4 805 Peachtree 22 Harper On Piedmont 40 Siena at Renaissance 5 905 Juniper 23 J-5 41 Spire 6 40 West 12th 24 Lofts at the Park I 42 Tuscany 7 Above the Four Seasons 25 Lofts at the Park II 43 Twelve Centennial Park 8 Ansley Above the Park 26 Luxe 44 Viewpoint 9 Ansley Terrace 27 Mayfair Renaissance 45 Virginia Hill 10 Aqua 28 Mayfair Tower 46 W Residences 11 The Belvedere 29 Metropolis 47 Wilburn House - Newer 12 The Belvedere - Lofts at the Belvedere 30 Midcity Lofts 48 Wilburn House - Historic 13 Colony Park CitiHomes 31 One Museum Place 49 Windsor Over Peachtree 14 Colony Square - Colony House 32 Parc Vue 15 Colony Square - Hanover House 33 Park Central 16 Cornerstone Village - Reid Building 34 Peachtree Lofts 17 Cornerstone Village - Loft Building 35 Peachtree Walk 18 Cornerstone Village - New Building 36 Piedmont Crest
Midtown Condo Overview


6 Building Total Units Year Built HOA/ Square Foot Total Closings Average Sales Price Total Days on Market Total Closings Average Sales Price Total Days on Market Average Sales Price / Original List Price Average Price per Square Ft 1010 Midtown 425 2008 $0.52 34 $600,390 28 16 $633,106 20 96.76% $544.98 1065 Midtown Residences Loews 52 2010 $0.88 4 $1,653,750 124 0 N/A N/A N/A N/A 1280 West 434 1989 $0.54 16 $266,513 31 17 $247,647 37 97.36% $314.92 805 Peachtree 118 1951 $0.56 8 $488,938 32 6 $415,150 49 96.89% $303.92 905 Juniper 92 2006 $0.63 9 $539,224 58 3 $796,667 118 98.20% $421.02 40 West 12th 64 2021 $0.77 10 $1,814,466 39 6 $1,610,004 82 98.39% $761.22 Above the Four Seasons 91 1992 $0.89 4 $1,001,250 26 3 $963,333 50 96.47% $539.14 Ansley Above the Park 127 1988 $0.54 7 $564,250 51 5 $526,900 43 96.70% $425.94 Ansley Terrace 74 1989 $0.45 2 $424,750 19 2 $493,450 91 97.04% $413.36 Aqua 83 2007 $0.63 9 $540,278 95 3 $687,667 17 98.08% $365.95 The Belvedere 39 2001 $0.37 3 $398,333 7 1 $572,500 12 99.57% $324.73 The Belvedere - Lofts at the Belvedere 48 2004 $0.39 3 $316,667 34 3 $378,000 3 100.50% $393.75 Colony Park CitiHomes 112 1984 $0.53 5 $311,900 12 2 $342,500 27 97.27% $373.11 Colony SquareColony House 193 1974 $0.79 7 $340,947 209 7 $426,000 49 95.72% $361.64 Colony SquareHanover House 71 1974 $0.79 4 $513,750 46 2 $712,500 46 93.43% $336.75 Cornerstone Village - Reid Building 40 of 310 1927 $0.44 2 $292,500 9 3 $294,167 35 99.36% $343.22 Cornerstone Village - Loft Building 115 of 310 1945 $0.51 10 $319,590 31 4 $305,250 50 100.07% $320.94 Cornerstone Village - New Building 155 of 310 2001 $0.47 12 $269,750 16 8 $281,188 39 98.47% $312.54 Cotting Court 60 2001 $0.66 4 $693,750 66 4 $602,125 23 95.62% $429.80 The Dakota Condo Flats 160 2000 $0.40 4 $600,625 11 2 $486,000 92 97.26% $391.64 The Dakota Townhomes 2000 $0.41 6 $595,167 23 0 N/A N/A N/A N/A Harper On Piedmont 111 2009 $0.38 8 $497,220 139 2 $390,000 58 98.87% $425.76 J-5 149 2020 $0.43 22 $652,499 22 13 $632,589 200 98.26% $498.77 Lofts at the Park I 54 2001 $0.33 4 $530,500 26 0 N/A N/A N/A N/A Lofts at the Park II 24 2001 $0.37 1 $552,500 4 0 N/A N/A N/A N/A 1/1/2022 - 6/30/2022 1/1/2023 - 6/30/2023


7 Building Total Units Year Built HOA/ Square Foot Total Closings Average Sales Price Total Days on Market Total Closings Average Sales Price Total Days on Market Average Sales Price / Original List Price Average Price per Square Ft Luxe 112 2008 $0.52 2 $589,000 5 3 $794,667 93 98.36% $483.64 Mayfair Renaissance 297 2002 $0.50 8 $510,063 15 6 $442,333 22 99.56% $395.38 Mayfair Tower 323 1992 $0.55 9 $303,111 10 5 $533,100 23 96.54% $411.64 Metropolis 498 2002 $0.52 24 $378,888 19 15 $343,627 26 99.70% $420.08 Midcity Lofts 132 2002 $0.46 8 $510,644 106 5 $535,480 83 97.05% $350.36 One Museum Place 44 2018 $0.92 2 $1,587,500 176 2 $2,830,000 162 87.35% $735.15 Parc Vue 136 1991 $0.60 8 $331,500 6 3 $316,333 94 97.36% $379.86 Park Central 397 1999 $0.45 18 $330,694 16 11 $408,218 30 97.67% $357.32 Peachtree Lofts 210 1951 $0.44 7 $301,257 40 6 $279,583 12 98.30% $363.39 Peachtree Walk 218 1996 $0.27 13 $309,417 9 12 $307,775 51 99.32% $351.18 Piedmont Crest 70 2005 $0.49 8 $428,125 11 3 $571,633 5 100.80% $427.28 Plaza Midtown 418 2006 $0.43 30 $384,228 17 18 $460,500 50 98.43% $422.16 Reid House 41 1924 $0.81 1 $410,742 505 2 $540,000 42 95.24% $373.41 Seventh Midtown 21 2016 $0.74 1 $999,000 44 0 N/A N/A N/A N/A Siena at Renaissance 227 1989 $0.42 6 $322,833 21 3 $356,500 29 96.27% $253.57 Spire 393 2005 $0.60 16 $370,020 33 18 $382,165 57 97.55% $433.02 Tuscany 230 1996 $0.45 11 $287,077 20 6 $342,650 60 96.80% $333.30 Twelve Centennial Park 517 2007 $0.45 30 $327,362 21 6 $342,167 46 97.51% $379.22 Viewpoint 378 2008 $0.70 21 $443,224 47 12 $450,292 59 96.85% $446.99 Virginia Hill 53 1990 $0.37 0 N/A N/A 1 $300,000 44 89.55% $375.00 W Residences 74 2010 $0.80 6 $569,167 223 2 $562,500 36 96.92% $319.46 Wilburn HouseNewer 37 2002 $0.49 1 $570,000 12 1 $395,000 5 100.00% $460.37 Wilburn HouseHistoric 32 1911 $0.49 2 $552,500 15 1 $345,000 66 90.79% $414.17 Windsor Over Peachtree 269 1965 $0.78 17 $252,265 42 8 $216,238 36 96.49% $256.82 1/1/2022 - 6/30/2022 1/1/2023 - 6/30/2023

8 Unit Number Square Feet Beds Baths List Date Original List Price List Price List Price per Square Foot 3315 2,416 3 3 3/27/2023 $1,599,900 $1,549,900 $641.51 2903 1,505 2 2 2/17/2023 $899,900 $849,900 $564.72 702 1,386 2 2 4/13/2023 $799,000 $775,000 $559.16 2213 1,145 2 2 6/5/2023 $649,000 $649,000 $566.81 ACTIVE as of 6/30/2023 1010 MIDTOWN 1080 Peachtree St NE Atlanta, GA 30309 Average Sold Price Per Square Foot: $544.98 Unit Number Square Feet Beds Baths List Date Original List Price List Price List Price per Square Foot 3207 872 1 1 5/31/2023 $445,000 $445,000 $510.32 PENDING as of 6/30/2023
9 Unit Number Square Feet Original List Price Close Date Sold Price Sold Price/ Original List Price Total Days on Market Sold Price per Square Foot 1607 872 $455,000 5/2/2023 $441,000 96.92% 45 $505.73 1907 872 $450,000 5/31/2023 $432,500 96.11% 4 $495.99 1713 789 $444,900 6/14/2023 $410,000 92.16% 29 $519.65 1905 867 $410,000 5/3/2023 $406,000 99.02% 5 $468.28 1313 789 $419,900 4/17/2023 $399,900 95.24% 14 $506.84 2308 805 $410,000 5/5/2023 $399,000 97.32% 20 $495.65 January - June 2023 AVERAGE $414,733 96.13% 20 $498.69 July - December 2022 AVERAGE $432,800 98.08% 32 $508.64 CLOSED - 1 BEDROOM January - June 2023 Unit Number Square Feet Original List Price Close Date Sold Price Sold Price/ Original List Price Total Days on Market Sold Price per Square Foot 2011 1,564 $960,000 2/3/2023 $940,000 97.92% 18 $624.33 2302 1,386 $899,900 5/2/2023 $885,000 98.34% 0 $595.01 1910 1,397 $859,900 6/14/2023 $859,900 100.00% 1 $527.73 1711 1,563 $940,000 6/23/2023 $850,000 90.43% 9 $627.71 1402 1,386 $749,900 3/2/2023 $749,900 100.00% 4 $559.73 801 1,236 $724,900 2/28/2023 $699,000 96.43% 39 $491.69 2612 1,196 $709,900 6/30/2023 $675,000 95.08% 106 $488.37 3212 1,196 $705,000 1/3/2023 $675,000 95.74% 46 $529.58 1612 1,196 $675,000 6/12/2023 $657,500 97.41% 302 $512.27 1712 1,196 $650,000 3/31/2023 $650,000 100.00% 35 $535.01 January - June 2023 AVERAGE $764,130 97.13% 20 $572.75 July - December 2022 AVERAGE $812,000 96.06% 34 $546.85 CLOSED - 2 BEDROOM January - June 2023

10
1065 Peachtree St NE
Unit Number Square Feet Beds Baths List Date Original List Price List Price List Price per Square Foot 3703 1,992 2 2 6/20/2023 $ 1,349,000 $ 1,349,000 $677.21 2701 1,182 1 1 6/29/2023 $ 699,900 $ 699,900 $592.13 ACTIVE as of 6/30/2023
CLOSED SALES
January - June 2023 Average Sold Price Per Square Foot: N/A NO
6/30/2023
1065 MIDTOWN RESIDENCES LOEWS
Atlanta, GA 30309
NO
-
PENDINGS as of

11 1280 WEST 1280 W. Peachtree St NW
NO ACTIVES OR PENDINGS as of 6/30/2021 Unit Number Square Feet Beds Baths List Date Original List Price List Price List Price per Square Foot 2805 645 1 1 6/16/2023 $230,000 $230,000 $356.59 1102 625 1 1 2/27/2023 $214,900 $209,900 $335.84 1001 457 0 1 6/20/2023 $160,000 $160,000 $350.11 ACTIVE as of 6/30/2023 Average Sold Price Per Square Foot: $314.92 Unit Number Square Feet Beds Baths List Date Original List Price List Price List Price per Square Foot 3102 625 1 1 3/24/2023 $242,000 $235,000 $376.00 2803 772 1 1 6/12/2023 $230,000 $230,000 $297.93 1014 457 0 1 5/12/2023 $175,000 $169,000 $369.80 PENDING as of 6/30/2023
Atlanta, GA 30309
CLOSED - 1 BEDROOM January - June 2023
12 Unit Number Square Feet Original List Price Close Date Sold Price Sold Price/ Original List Price Total Days on Market Sold Price per Square Foot 3308 813 $250,000 4/14/2023 $245,000 98.00% 8 $301.35 2508 813 $227,000 6/23/2023 $235,000 103.52% 2 $289.05 2511 645 $235,000 3/31/2023 $235,000 100.00% 13 $364.34 2412 772 $235,000 3/27/2023 $235,000 100.00% 4 $304.40 1108 813 $225,000 3/1/2023 $230,000 102.22% 9 $282.90 1412 772 $225,000 1/26/2023 $225,000 100.00% 18 $291.45 1911 645 $219,900 2/22/2023 $221,000 100.50% 13 $342.64 1113 625 $215,000 5/16/2023 $220,000 102.33% 15 $352.00 2305 645 $225,000 2/8/2023 $220,000 97.78% 5 $341.09 1812 772 $229,000 1/31/2023 $218,500 95.41% 75 $283.03 1513 625 $214,999 6/6/2023 $215,000 100.00% 55 $344.00 1103 772 $215,000 6/5/2023 $215,000 100.00% 60 $278.50 1710 645 $235,000 1/19/2023 $215,000 91.49% 94 $333.33 January - June 2023 AVERAGE $225,346 99.33% 29 $316.01 July - December 2022 AVERAGE $228,820 98.21% 23 $333.03
Unit Number Square Feet Original List Price Close Date Sold Price Sold Price/ Original List Price Total Days on Market Sold Price per Square Foot 1106 1,028 $374,900 5/24/2023 $363,000 96.83% 45 $353.11 2006 1,028 $335,000 1/26/2023 $314,000 93.73% 58 $305.45 2109 1,028 $375,000 1/17/2023 $303,500 80.93% 70 $295.23 1806 1,028 $325,000 2/23/2023 $300,000 92.31% 92 $291.83 January - June 2023 AVERAGE $320,125 90.95% 66 $311.41 July - December 2022 AVERAGE $347,500 93.75% 33 $338.04 CLOSED - 2 BEDROOM January - June 2023

13
Unit Number Square Feet Beds Baths List Date Original List Price List Price List Price per Square Foot 521 1,415 2 2 5/17/2023 $ 450,000 $ 434,900 $307.35 ACTIVE as of 6/30/2023 Average Sold Price Per Square Foot: $303.92 NO PENDINGS as of 6/30/2023 Unit Number Square Feet Original List Price Close Date Sold Price Sold Price/ Original List Price Total Days on Market Sold Price per Square Foot 506 1,175 $ 375,000 3/8/2023 $ 375,000 100.00% 3 $319.15 515 1,190 $ 320,000 1/9/2023 $ 310,000 96.88% 18 $260.50 514 1,100 $ 299,900 2/1/2023 $ 296,000 98.70% 34 $269.09 January - June 2023 AVERAGE $327,000 98.52% 18 $282.91 July - December 2022 AVERAGE $370,000 97.39% 2 $318.42 CLOSED - 1 BEDROOM January - June 2023
805 PEACHTREE 805 Peachtree St NE Atlanta, GA 30308
14 Unit Number Square Feet Original List Price Close Date Sold Price Sold Price/ Original List Price Total Days on Market Sold Price per Square Foot 320 1,600 $ 595,000 5/15/2023 $ 595,000 100.00% 173 $371.88 304 1,595 $ 499,900 3/1/2023 $ 465,000 93.02% 32 $291.54 316 1,445 $ 485,000 3/30/2023 $ 449,900 92.76% 34 $311.35 January - June 2023 AVERAGE $503,300 95.26% 80 $324.92 July - December 2022 AVERAGE $425,000 95.51% 157 $294.12 CLOSED - 2 BEDROOM January - June 2023

15
Average Sold Price Per Square Foot: $421.02 Unit Number Square Feet Beds Baths List Date Original List Price List Price List Price per Square Foot 414 2,219 2 3 5/31/2023 $ 1,095,000 $ 1,095,000 $493.47 303 1,432 2 2 4/17/2023 $ 924,900 $ 899,900 $628.42 ACTIVE as of 6/30/2023 Unit Number Square Feet Beds Baths List Date Original List Price List Price List Price per Square Foot 608 1,973 2 2 4/11/2023 $1,039,900 $1,039,900 $527.07 PENDING as of 6/30/2023 Unit Number Square Feet Original List Price Close Date Sold Price Sold Price/ Original List Price Total Days on Market Sold Price per Square Foot 705 1,889 $ 765,000 5/18/2023 $ 755,000 98.69% 75 $399.68 January - June 2023 AVERAGE $755,000 98.69% 75 $399.68 July - December 2022 AVERAGE N/A N/A N/A N/A CLOSED - 2 BEDROOM January - June 2023
905 JUNIPER 905 Juniper St NE Atlanta, GA 30309
16 Unit Number Square Feet Original List Price Close Date Sold Price Sold Price/ Original List Price Total Days on Market Sold Price per Square Foot 812 1,898 $ 889,900 2/17/2023 $ 865,000 97.20% 5 $455.74 805 1,889 $ 780,000 6/1/2023 $ 770,000 98.72% 274 $407.62 January - June 2023 AVERAGE $817,500 97.96% 140 $431.68 July - December 2022 AVERAGE N/A N/A N/A N/A CLOSED - 3 BEDROOM January - June 2023
PENDING as of
40 WEST 12TH
Average Sold Price Per Square Foot: $761.22

17
40 W 12th St NE Atlanta, GA 30309
Unit Number Square Feet Beds Baths List Date Original List Price List Price List Price per Square Foot 1903 2,071 3 3 6/15/2023 $2,250,000 $2,250,000 $1,086.43 1406 2,537 4 3 5/14/2023 $1,995,000 $1,995,000 $786.36 1004 2,352 3 3 5/26/2023 $1,739,840 $1,739,840 $739.73 1901 1,525 2 2 4/25/2023 $1,299,950 $1,299,950 $852.43 1906 2,537 4 3 8/24/2022 $2,638,797 $2,651,991 $1,045.33 1804 2,352 3 3 12/1/2022 $1,902,821 $1,912,335 $813.07 1102 1,652 2 2 12/1/2022 $1,228,556 $1,234,699 $747.40 1002 1,652 2 2 9/16/2022 $1,350,000 $1,195,000 $723.37
6/30/2023 Unit Number Square Feet Beds Baths List Date Original List Price List Price List Price per Square Foot 1602 1,652 2 2 9/27/2022 $1,330,361 $1,337,012 $809.33
ACTIVE as of
6/30/2023
18 Unit Number Square Feet Original List Price Close Date Sold Price Sold Price/ Original List Price Total Days on Market Sold Price per Square Foot 803 936 $715,000 1/5/2023 $675,000 94.41% 99 $721.15 January - June 2023 AVERAGE $675,000 94.41% 99 $721.15 July - December 2022 AVERAGE N/A N/A N/A N/A CLOSED - 1 BEDROOM January - June 2023 Unit Number Square Feet Original List Price Close Date Sold Price Sold Price/ Original List Price Total Days on Market Sold Price per Square Foot 903 1,970 $1,459,000 1/3/2023 $1,320,000 90.47% 107 $670.05 806 1,923 $1,308,234 2/15/2023 $1,308,234 100.00% 3 $680.31 January - June 2023 AVERAGE $1,314,117 95.24% 55 $675.18 July - December 2022 AVERAGE $1,355,736 100.00% 90 $820.66 CLOSED - 2 BEDROOM January - June 2023 Unit Number Square Feet Original List Price Close Date Sold Price Sold Price/ Original List Price Total Days on Market Sold Price per Square Foot 1605 2,547 $2,126,207 5/23/2023 $2,126,207 100.00% 0 $834.79 1205 2,547 $2,020,764 4/7/2023 $2,120,764 104.95% 219 $832.65 1505 2,547 $2,099,325 5/12/2023 $2,109,821 100.50% 64 $828.36 January - June 2023 AVERAGE $2,118,931 101.82% 94 $831.93 July - December 2022 AVERAGE $1,663,179 100.00% 7 $767.43 CLOSED - 3 BEDROOM January - June 2023

19
as of 6/30/2023 Unit Number Square Feet Original List Price Close Date Sold Price Sold Price/ Original List Price Total Days on Market Sold Price per Square Foot 3720 1,642 $ 950,000 1/31/2023 $ 935,000 98.42% 103 $569.43 3250 1,643 $ 899,000 5/12/2023 $ 865,000 96.22% 17 $526.48 January - June 2023 AVERAGE $900,000 97.32% 60 $547.95 July - December 2022 AVERAGE N/A N/A N/A N/A CLOSED - 2 BEDROOM January - June 2023 Average Sold Price Per Square Foot: $539.14 Unit Number Square Feet Beds Baths List Date Original List Price List Price List Price per Square Foot 4310 3,197 3 3 6/22/2023 $ 2,595,000 $ 2,595,000 $811.70 ACTIVE as of 6/30/2023 Unit Number Square Feet Original List Price Close Date Sold Price Sold Price/ Original List Price Total Days on Market Sold Price per Square Foot 4420 2,090 $ 1,150,000 1/26/2023 $ 1,090,000 94.78% 29 $521.53 January - June 2023 AVERAGE $1,090,000 94.78% 29 $521.53 July - December 2022 AVERAGE N/A N/A N/A N/A CLOSED - 3 BEDROOM January - June 2023
ABOVE THE FOUR SEASONS 75 14th St NW Atlanta, GA 30309 NO PENDINGS

20
1130 Piedmont Ave NE Atlanta, GA 30309 Average Sold Price Per Square Foot: $425.94 Unit Number Square Feet Beds Baths List Date Original List Price List Price List Price per Square Foot 1410 1,015 2 2 5/17/2023 $469,900 $469,900 $462.96 ACTIVE as of 6/30/2023 Unit Number Square Feet Beds Baths List Date Original List Price List Price List Price per Square Foot 712 1,811 3 3 6/1/2023 $849,000 $849,000 $468.80 PENDING as of 6/30/2023 Unit Number Square Feet Original List Price Close Date Sold Price Sold Price/ Original List Price Total Days on Market Sold Price per Square Foot 1005 790 $349,900 5/23/2023 $342,500 97.89% 9 $433.54 405 790 $337,000 2/27/2023 $329,000 97.63% 73 $416.46 January - June 2023 AVERAGE $335,750 97.76% 41 $425.00 July - December 2022 AVERAGE N/A N/A N/A N/A CLOSED - 1 BEDROOM January - June 2023
ANSLEY ABOVE THE PARK
21 Unit Number Square Feet Original List Price Close Date Sold Price Sold Price/ Original List Price Total Days on Market Sold Price per Square Foot 613 1,550 $695,000 2/17/2023 $659,000 94.82% 86 $425.16 601 1,526 $675,000 5/25/2023 $654,000 96.89% 33 $428.57 802 1,526 $675,000 4/17/2023 $650,000 96.30% 12 $425.95 January - June 2023 AVERAGE $654,333 96.00% 44 $426.56 July - December 2022 AVERAGE $432,200 99.63% 18 $404.50 CLOSED - 2 BEDROOM January - June 2023

22
Unit Number Square Feet Original List Price Close Date Sold Price Sold Price/ Original List Price Total Days on Market Sold Price per Square Foot 213 1,170 $ 539,900 4/20/2023 $ 507,900 94.07% 139 $434.10 215 1,220 $ 479,000 4/14/2023 $ 479,000 100.00% 43 $392.62 January - June 2023 AVERAGE $493,450 97.04% 91 $413.36 July - December 2022 AVERAGE $445,167 88.87% 53 $371.84 CLOSED - 2 BEDROOM January - June 2023 Average Sold Price Per Square Foot: $413.36 NO ACTIVES OR PENDINGS as of 6/30/2023
ANSLEY TERRACE 175 15th St NE Atlanta, GA 30309

23
Unit Number Square Feet Beds Baths List Date Original List Price List Price List Price per Square Foot 1403 2,835 3 3 6/3/2023 $ 1,123,000 $ 1,090,000 $384.48 ACTIVE as of 6/30/2023 NO PENDINGS as of 6/30/2023 Average Sold Price Per Square Foot: $365.95 Unit Number Square Feet Original List Price Close Date Sold Price Sold Price/ Original List Price Total Days on Market Sold Price per Square Foot 1501 1,478 $ 599,000 2/2/2023 $ 580,000 96.83% 30 $392.42 1005 1,321 $ 455,000 2/20/2023 $ 451,000 99.12% 4 $341.41 January - June 2023 AVERAGE $515,500 97.97% 17 $366.92 July - December 2022 AVERAGE $602,000 97.89% 56 $333.52 CLOSED - 2 BEDROOM January - June 2023 Unit Number Square Feet Original List Price Close Date Sold Price Sold Price/ Original List Price Total Days on Market Sold Price per Square Foot 1603 2,835 $ 1,050,000 6/2/2023 $ 1,032,000 98.29% 18 $364.02 January - June 2023 AVERAGE $1,032,000 98.29% 18 $364.02 July - December 2022 AVERAGE N/A N/A N/A N/A CLOSED - 3 BEDROOM January - June 2023
AQUA 20 10th St NE Atlanta, GA 30309

24 THE BELVEDERE 560 Dutch Valley Road NE Atlanta, GA 30324 CLOSED - 2 BEDROOM January - June 2023 NO ACTIVES OR PENDINGS as of 6/30/2023 Average Sold Price Per Square Foot: $324.73 Unit Number Square Feet Original List Price Close Date Sold Price Sold Price/ Original List Price Total Days on Market Sold Price per Square Foot 202 1,763 $ 575,000 2/17/2023 $ 572,500 99.57% 12 $324.73 January - June 2023 AVERAGE $572,500 99.57% 12 $324.73 July - December 2022 AVERAGE $530,000 100.95% 3 $325.15

25
Unit Number Square Feet Original List Price Close Date Sold Price Sold Price/ Original List Price Total Days on Market Sold Price per Square Foot 2313 960 $ 419,900 3/10/2023 $ 419,000 99.79% 4 $436.46 2307 960 $ 360,000 5/30/2023 $ 360,000 100.00% 2 $375.00 2205 960 $ 349,000 5/26/2023 $ 355,000 101.72% 4 $369.79 January - June 2023 AVERAGE $378,000 100.50% 3 $393.75 July - December 2022 AVERAGE $345,500 98.74% 10 $359.90 CLOSED - 1 BEDROOM January - June 2023 Average Sold Price Per Square Foot: $393.75 NO ACTIVES OR PENDINGS as of 6/30/2023
THE BELVEDERE - LOFTS AT THE BELVEDERE 560 Dutch Valley Rd NE Atlanta, GA 30324
26
209 14th St NE & 244 13th St NE Atlanta, GA 30309 Unit Number Square Feet Original List Price Close Date Sold Price Sold Price/ Original List Price Total Days on Market Sold Price per Square Foot 104 680 $ 275,000 6/16/2023 $ 260,000 94.55% 47 $382.35 January - June 2023 AVERAGE $260,000 94.55% 47 $382.35 July - December 2022 AVERAGE N/A N/A N/A N/A CLOSED - 1 BEDROOM January - June 2023 Average Sold Price Per Square Foot: $373.11 Unit Number Square Feet Original List Price Close Date Sold Price Sold Price/ Original List Price Total Days on Market Sold Price per Square Foot 214 1,168 $ 425,000 3/22/2023 $ 425,000 100.00% 6 $363.87 January - June 2023 AVERAGE $425,000 100.00% 6 $363.87 July - December 2022 AVERAGE $435,000 99.09% 18 $372.43 CLOSED - 2 BEDROOM January - June 2023 Unit Number Square Feet Beds Baths List Date Original List Price List Price List Price per Square Foot 112 811 1 1 4/4/2023 $ 305,000 $ 290,000 $357.58 ACTIVE as of 6/30/2023 Unit Number Square Feet Beds Baths List Date Original List Price List Price List Price per Square Foot 111 912 1 1 2/15/2023 $ 278,900 $ 269,000 $294.96 PENDING as of 6/30/2023
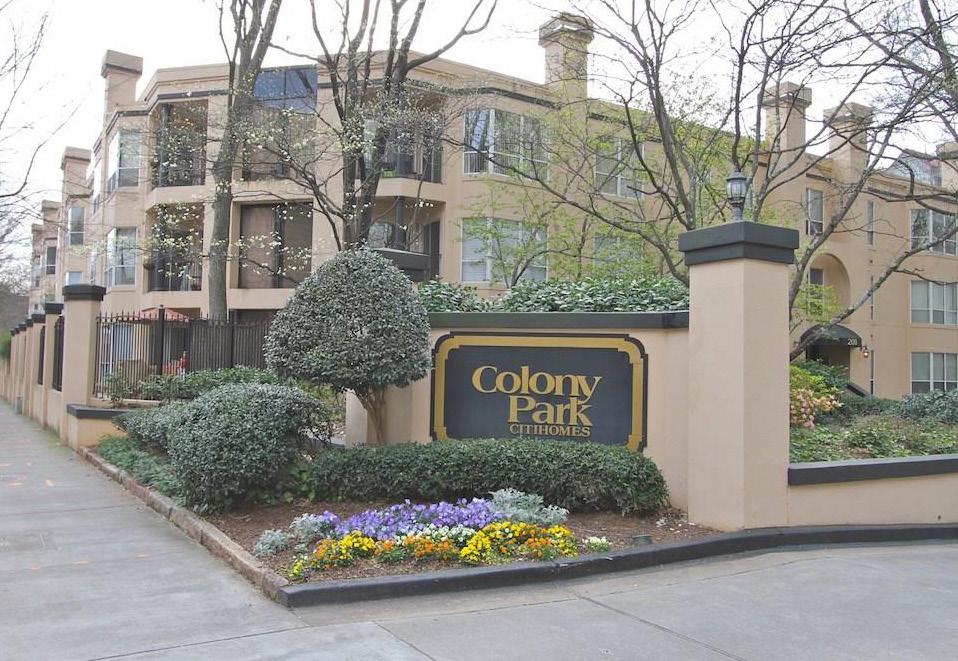
COLONY PARK CITIHOMES
COLONY SQUARE - COLONY HOUSE
145 15th St NE
Atlanta, GA 30309

27
Unit Number Square Feet Beds Baths List Date Original List Price List Price List Price per Square Foot 1033 4,648 0 0 7/6/2022 $ 1,350,000 $ 1,350,000 $290.45 603 1,780 2 2 5/16/2023 $ 549,900 $ 535,000 $300.56 627 1,780 2 3 3/17/2023 $ 537,000 $ 517,000 $290.45 224 1,364 2 1 6/22/2023 $ 420,000 $ 420,000 $307.92 211 862 1 1 6/30/2023 $ 375,000 $ 375,000 $435.03 ACTIVE as of 6/30/2023
as of 6/30/2023 Average Sold Price Per Square Foot: $361.64
NO PENDINGS
28 Unit Number Square Feet Original List Price Close Date Sold Price Sold Price/ Original List Price Total Days on Market Sold Price per Square Foot 1206 1,168 $ 375,000 4/27/2023 $ 362,000 96.53% 2 $309.93 207 862 $ 329,500 6/15/2023 $ 340,000 103.19% 3 $394.43 1209 862 $ 325,000 2/24/2023 $ 325,000 100.00% 4 $377.03 1402 704 $ 265,000 1/11/2023 $ 255,000 96.23% 27 $362.22 January - June 2023 AVERAGE $320,500 98.99% 9 $360.90 July - December 2022 AVERAGE $286,250 98.61% 5 $332.08 CLOSED - 1 BEDROOM January - June 2023 Unit Number Square Feet Original List Price Close Date Sold Price Sold Price/ Original List Price Total Days on Market Sold Price per Square Foot 1227 1,641 $ 685,000 6/16/2023 $ 625,000 91.24% 11 $380.87 1237 1,641 $ 649,000 3/15/2023 $ 550,000 84.75% 238 $335.16 404 1,412 $ 535,000 4/20/2023 $ 525,000 98.13% 56 $371.81 January - June 2023 AVERAGE $566,667 91.37% 102 $362.61 July - December 2022 AVERAGE $545,000 81.36% 95 $332.11 CLOSED - 2 BEDROOM January - June 2023

29
Unit Number Square Feet Beds Baths List Date Original List Price List Price List Price per Square Foot 10D 1,980 3 3 5/3/2023 $ 750,000 $ 750,000 $378.79 16D 1,980 2 2 5/31/2023 $ 695,000 $ 695,000 $351.01 8B 1,869 2 2 6/9/2023 $ 549,000 $ 549,000 $293.74 11E 1,349 2 2 6/15/2023 $ 525,000 $ 525,000 $389.18 ACTIVE as of 6/30/2023 Average Sold Price Per Square Foot: $336.75
as of 6/30/2023 Unit Number Square Feet Original List Price Close Date Sold Price Sold Price/ Original List Price Total Days on Market Sold Price per Square Foot 5D 1,946 $ 800,000 1/18/2023 $ 750,000 93.75% 66 $385.41 2A 2,343 $ 725,000 4/12/2023 $ 675,000 93.10% 26 $288.09 January - June 2023 AVERAGE $712,500 93.43% 46 $336.75 July - December 2022 AVERAGE N/A N/A N/A N/A CLOSED - 2 BEDROOM January - June 2023
COLONY SQUARE - HANOVER HOUSE 147 15th St NE Atlanta, GA 30309
NO PENDINGS

30
800 Peachtree St NE Atlanta, GA 30308 NO PENDINGS as of 6/30/2023 Average Sold Price Per Square Foot: $343.22 Unit Number Square Feet Original List Price Close Date Sold Price Sold Price/ Original List Price Total Days on Market Sold Price per Square Foot 504 905 $ 324,500 5/10/2023 $ 320,000 98.61% 5 $353.59 102 832 $ 289,000 5/16/2023 $ 287,500 99.48% 92 $345.55 402 832 $ 275,000 3/9/2023 $ 275,000 100.00% 7 $330.53 January - June 2023 AVERAGE $294,167 99.36% 35 $343.22 July - December 2022 AVERAGE N/A N/A N/A N/A CLOSED - 1 BEDROOM January - June 2023 Unit Number Square Feet Beds Baths List Date Original List Price List Price List Price per Square Foot 408 928 1 1 6/28/2023 $ 289,900 $ 289,900 $312.39 101 945 1 1 6/15/2023 $ 289,900 $ 289,900 $306.77 ACTIVE as of 6/30/2023
CORNERSTONE - NEEL REID BUILDING

31
BUILDING 800 Peachtree St NE Atlanta, GA 30309 NO PENDINGS as of 6/30/2023 Average Sold Price Per Square Foot: $312.54 ACTIVES as of 6/30/2023 Unit Number Square Feet Beds Baths List Date Original List Price List Price List Price per Square Foot 1404 775 1 1 5/7/2023 $269,500 $249,900 $322.45 1501 647 1 1 4/22/2023 $235,000 $235,000 $363.21 Unit Number Square Feet Original List Price Close Date Sold Price Sold Price/ Original List Price Total Days on Market Sold Price per Square Foot 1507 1,094 $290,000 4/28/2023 $275,000 94.83% 23 $251.37 1518 775 $270,000 4/19/2023 $265,000 98.15% 34 $341.94 2305 775 $263,000 2/10/2023 $260,000 98.86% 39 $335.48 1224 775 $259,000 1/6/2023 $254,000 98.07% 35 $327.74 1314 775 $245,000 3/7/2023 $240,000 97.96% 101 $309.68 1126 775 $250,000 3/17/2023 $233,000 93.20% 77 $300.65 January - June 2023 AVERAGE $254,500 96.84% 52 $311.14 July - December 2022 AVERAGE $265,700 98.15% 29 $342.84 CLOSED - 1 BEDROOM January - June 2023
CORNERSTONENEW
32 Unit Number Square Feet Original List Price Close Date Sold Price Sold Price/ Original List Price Total Days on Market Sold Price per Square Foot 1,216 1,181 $375,000 5/2/2023 $400,000 106.67% 2 $338.70 2,304 1,094 $322,500 3/13/2023 $322,500 100.00% 4 $294.79 January - June 2023 AVERAGE $361,250 103.33% 3 $316.74 July - December 2022 AVERAGE $343,750 98.20% 39 $301.92 CLOSED - 2 BEDROOM January - June 2023

33
Average Sold Price Per Square Foot: $320.94 ACTIVES as of 6/30/2023 Unit Number Square Feet Beds Baths List Date Original List Price List Price List Price per Square Foot 8617 1,187 2 2 6/20/2023 $399,999 $399,999 $336.98 8514 852 1 1 6/23/2023 $285,000 $285,000 $334.51 8405 625 1 1 4/21/2023 $274,000 $255,000 $408.00 8208 699 1 1 6/13/2023 $235,000 $235,000 $336.19 PENDINGS as of 6/30/2023 Unit Number Square Feet Beds Baths List Date Original List Price List Price List Price per Square Foot 8631 1,399 2 2 3/30/2023 $444,900 $435,000 $310.94 Unit Number Square Feet Original List Price Close Date Sold Price Sold Price/ Original List Price Total Days on Market Sold Price per Square Foot 8512 852 $269,000 3/20/2023 $289,000 107.43% 3 $339.20 8408 699 $230,000 4/7/2023 $220,000 95.65% 108 $314.74 January - June 2023 AVERAGE $254,500 101.54% 56 $326.97 July - December 2022 AVERAGE $279,500 99.09% 35 $278.39 CLOSED - 1 BEDROOM January - June 2023
CORNERSTONELOFT BUILDING 800 Peachtree St NE Atlanta, GA 30308
34 Unit Number Square Feet Original List Price Close Date Sold Price Sold Price/ Original List Price Total Days on Market Sold Price per Square Foot 8417 1,187 $399,900 2/24/2023 $380,000 95.02% 49 $320.13 8604 1,072 $325,000 1/23/2023 $332,000 102.15% 39 $309.70 January - June 2023 AVERAGE $356,000 98.59% 44 $314.92 July - December 2022 AVERAGE $386,667 96.90% 40 $308.52 CLOSED - 2 BEDROOM January - June 2023

35
Peachtree
NE
Unit Number Square Feet Beds Baths List Date Original List Price List Price List Price per Square Foot 602 2,642 3 3 5/31/2023 $1,200,000 $1,200,000 $454.20 409 1,776 2 2 6/29/2023 $675,000 $675,000 $380.07 319 1,248 2 2 5/4/2023 $525,000 $515,000 $412.66 417 911 1 1 3/1/2023 $425,000 $425,000 $466.52 ACTIVE as of 6/30/2023 Average Sold Price Per Square Foot: $429.80 Unit Number Square Feet Beds Baths List Date Original List Price List Price List Price per Square Foot 411 1,382 2 2 6/10/2023 $575,000 $575,000 $416.06 606 3,426 3 3 6/22/2023 $1,500,000 $1,399,000 $408.35 PENDING as of 6/30/2023 Unit Number Square Feet Original List Price Close Date Sold Price Sold Price/ Original List Price Total Days on Market Sold Price per Square Foot 506 1,724 $850,000 3/1/2023 $840,000 98.82% 7 $487.24 109 1,406 $599,000 4/26/2023 $583,500 97.41% 10 $415.01 419 1,248 $510,000 4/28/2023 $500,000 98.04% 11 $400.64 404 1,165 $549,900 1/6/2023 $485,000 88.20% 63 $416.31 January - June 2023 AVERAGE $602,125 95.62% 23 $429.80 July - December 2022 AVERAGE $660,000 97.78% 33 $417.72 CLOSED - 2 BEDROOM January - June 2023
COTTING COURT 77
Pl
Atlanta, GA 30309

36
DAKOTA CONDO FLATS 850 Piedmont Avenue NE Atlanta, GA 30308 NO PENDINGS as of 6/30/2023 Unit Number Square Feet Original List Price Close Date Sold Price Sold Price/ Original List Price Total Days on Market Sold Price per Square Foot 1307 1,512 $ 610,000 6/8/2023 $ 592,000 97.05% 33 $391.53 January - June 2023 AVERAGE $592,000 97.05% 33 $391.53 July - December 2022 AVERAGE $625,000 100.00% 22 $394.07 CLOSED - 2 BEDROOM January - June 2023 Average Sold Price Per Square Foot: $391.64 Unit Number Square Feet Beds Baths List Date Original List Price List Price List Price per Square Foot 1404 1,512 2 2 6/29/2023 $ 585,000 $ 585,000 $386.90 ACTIVE as of 6/30/2023 Unit Number Square Feet Original List Price Close Date Sold Price Sold Price/ Original List Price Total Days on Market Sold Price per Square Foot 2409 970 $ 389,900 4/20/2023 $ 380,000 97.46% 151 $391.75 January - June 2023 AVERAGE $380,000 97.46% 151 $391.75 July - December 2022 AVERAGE $440,000 97.80% 18 $453.61 CLOSED - 1 BEDROOM January - June 2023
THE

37 THE DAKOTA TOWNHOMES 850 Piedmont Avenue NE Atlanta, GA 30308 NO CLOSED SALES - January - June 2023 Unit Number Square Feet Beds Baths List Date Original List Price List Price List Price per Square Foot 3326 1,704 2 2 6/9/2023 $650,000 $650,000 $381.46 ACTIVE as of 6/30/2023 Average Sold Price Per Square Foot: N/A NO PENDINGS as of 6/30/2023

38
PIEDMONT 625 Piedmont Ave NE Atlanta, GA 30308 Average Sold Price Per Square Foot: $425.76 Unit Number Square Feet Beds Baths List Date Original List Price List Price List Price per Square Foot 4027 1,419 2 2 6/7/2023 $589,900 $589,900 $415.72 PENDING as of 6/30/2023 Unit Number Square Feet Beds Baths List Date Original List Price List Price List Price per Square Foot 2003 1,415 2 2 5/24/2023 $600,000 $584,900 $413.36 3025 916 1 1 6/20/2023 $399,000 $399,000 $435.59 ACTIVE as of 6/30/2023 Unit Number Square Feet Original List Price Close Date Sold Price Sold Price/ Original List Price Total Days on Market Sold Price per Square Foot 2025 916 $390,000 6/22/2023 $390,000 100.00% 54 $425.76 1026 916 $399,000 2/16/2023 $390,000 97.74% 61 $425.76 January - June 2023 AVERAGE $390,000 98.87% 58 $425.76 July - December 2022 AVERAGE $395,000 99.00% 7 $431.22 CLOSED - 1 BEDROOM January - June 2023
HARPER ON
J-5
775 Juniper St NE
Atlanta, GA 30308

39
Unit Number Square Feet Beds Baths List Date Original List Price List Price List Price per Square Foot 313 1,282 2 2 6/15/2023 $589,900 $589,900 $460.14 220 1,224 2 2 4/21/2023 $549,900 $549,900 $449.26 208 834 1 1 4/18/2023 $410,000 $410,000 $491.61
Average Sold Price Per Square Foot: $498.77
Unit Number Square Feet Beds Baths List Date Original List Price List Price List Price per Square Foot 522 1,944 3 2 5/15/2023 $1,224,900 $1,224,900 $630.09 602 1,389 2 2 4/25/2023 $799,900 $799,900 $575.88 617 1,424 2 2 5/8/2023 $804,900 $764,900 $537.15 406 1,387 2 2 1/19/2023 $719,900 $719,900 $519.03 601 912 1 1 6/15/2023 $650,000 $650,000 $712.72 223 1,412 2 2 4/24/2023 $629,900 $629,900 $446.10 212 1,142 1 1 4/24/2023 $529,900 $529,900 $464.01 430 884 1 1 5/4/2023 $525,000 $499,900 $565.50 234 800 1 1 5/16/2023 $379,000 $379,000 $473.75 ACTIVE as of 6/30/2023
PENDING as of 6/30/2023
CLOSED - 2 BEDROOM January - June 2023
40 Unit Number Square Feet Original List Price Close Date Sold Price Sold Price/ Original List Price Total Days on Market Sold Price per Square Foot 410 834 $430,000 2/23/2023 $430,000 100.00% 1 $515.59 408 834 $430,000 3/21/2023 $430,000 100.00% 11 $515.59 January - June 2023 AVERAGE $430,000 100.00% 6 $515.59 July - December 2022 AVERAGE $572,450 100.54% 144 $539.77 CLOSED - 1 BEDROOM January - June 2023 Unit Number Square Feet Original List Price Close Date Sold Price Sold Price/ Original List Price Total Days on Market Sold Price per Square Foot 432 1,587 $950,000 1/6/2023 $950,000 100.00% 0 $598.61 603 1,345 $760,600 6/15/2023 $760,600 100.00% 492 $565.50 620 1,389 $825,000 4/28/2023 $760,000 92.12% 38 $547.16 307 1,422 $722,400 3/29/2023 $722,400 100.00% 278 $508.02 610 1,329 $714,900 2/1/2023 $712,900 99.72% 220 $536.42 319 1,282 $610,000 5/19/2023 $610,000 100.00% 485 $475.82 511 1,282 $604,050 5/26/2023 $604,050 100.00% 489 $471.18 213 1,282 $578,908 6/9/2023 $578,908 100.00% 488 $451.57 311 1,282 $589,900 6/26/2023 $565,000 95.78% 41 $440.72 215 1,282 $549,900 6/1/2023 $549,900 100.00% 29 $428.94 217 1,282 $612,400 5/26/2023 $549,900 89.79% 28 $428.94 January - June 2023 AVERAGE $669,423 97.95% 235 $495.72 July - December 2022 AVERAGE $718,148 99.96% 0 $517.64
206 11th St NE
Atlanta, GA 30309

Average Sold Price Per Square Foot: N/A
NO ACTIVES OR PENDINGS as of 6/30/2023
NO CLOSED SALES - January - June 2023
41
LOFTS AT THE PARK I
1058 Piedmont Ave NE
Atlanta, GA 30309

Average Sold Price Per Square Foot: N/A
NO ACTIVES OR PENDINGS as of 6/30/2023
NO CLOSED SALES - January - June 2023
42
LOFTS AT THE PARK II
Average Sold Price Per Square Foot: $483.64

43
LUXE 222 12th St NE Atlanta, GA 30309
as of 6/30/2023
NO ACTIVES OR PENDINGS
Unit Number Square Feet Original List Price Close Date Sold Price Sold Price/ Original List Price Total Days on Market Sold Price per Square Foot 806 1,820 $ 1,150,000 6/23/2023 $ 1,095,000 95.22% 103 $601.65 902 1,732 $ 689,900 6/8/2023 $ 689,000 99.87% 161 $397.81 905 1,329 $ 600,000 4/5/2023 $ 600,000 100.00% 15 $451.47 January - June 2023 AVERAGE $794,667 98.36% 93 $483.64 July - December 2022 AVERAGE $818,375 95.09% 34 $494.02 CLOSED - 2 BEDROOM January - June 2023

44
Unit Number Square Feet Beds Baths List Date Original List Price List Price List Price per Square Foot 604 693 1 1 6/27/2023 $350,000 $350,000 $505.05 ACTIVE as of 6/30/2023 Unit Number Square Feet Beds Baths List Date Original List Price List Price List Price per Square Foot 1412 755 1 1 6/16/2023 $300,000 $300,000 $397.35 PENDING as of 6/30/2023 Average Sold Price Per Square Foot: $395.38 Unit Number Square Feet Original List Price Close Date Sold Price Sold Price/ Original List Price Total Days on Market Sold Price per Square Foot 602 1,055 $369,900 4/19/2023 $375,000 101.38% 5 $355.45 501 627 $269,900 3/3/2023 $265,000 98.18% 23 $422.65 January - June 2023 AVERAGE $320,000 99.78% 14 $389.05 July - December 2022 AVERAGE $257,500 104.72% 4 $410.69 CLOSED - 1 BEDROOM January - June 2023
MAYFAIR RENAISSANCE 195 14th St Atlanta, GA 30309
45 Unit Number Square Feet Original List Price Close Date Sold Price Sold Price/ Original List Price Total Days on Market Sold Price per Square Foot PH402 1,434 $615,000 4/27/2023 $600,000 97.56% 92 $418.41 2304 1,401 $475,000 5/25/2023 $476,000 100.21% 2 $339.76 2203 1,122 $475,000 1/25/2023 $475,000 100.00% 0 $423.35 708 1,122 $463,000 5/12/2023 $463,000 100.00% 9 $412.66 January - June 2023 AVERAGE $503,500 99.44% 26 $398.54 July - December 2022 AVERAGE $566,667 98.26% 71 $396.50 CLOSED - 2 BEDROOM January - June 2023

46
NO PENDINGS as of 6/30/202 Average Sold Price Per Square Foot: $411.64 Unit Number Square Feet Beds Baths List Date Original List Price List Price List Price per Square Foot 1412 533 1 1 12/21/2022 $ 280,000 $ 280,000 $525.33 ACTIVE as of 6/30/2023 Unit Number Square Feet Original List Price Close Date Sold Price Sold Price/ Original List Price Total Days on Market Sold Price per Square Foot 604 750 $ 309,900 3/6/2023 $ 297,500 96.00% 23 $396.67 1104 750 $ 285,000 3/24/2023 $ 285,000 100.00% 5 $380.00 January - June 2023 AVERAGE $291,250 98.00% 14 $388.33 July - December 2022 AVERAGE $331,000 96.33% 20 $382.28 CLOSED - 1 BEDROOM January - June 2023
MAYFAIR TOWER 199 14th St NE Atlanta, GA 30309
47 Unit Number Square Feet Original List Price Close Date Sold Price Sold Price/ Original List Price Total Days on Market Sold Price per Square Foot 902 1,215 $ 455,000 1/5/2023 $ 418,000 91.87% 55 $344.03 910 919 $ 358,000 2/24/2023 $ 365,000 101.96% 5 $397.17 January - June 2023 AVERAGE $391,500 96.91% 30 $370.60 July - December 2022 AVERAGE $362,600 97.36% 16 $373.49 CLOSED - 2 BEDROOM January - June 2023 Unit Number Square Feet Original List Price Close Date Sold Price Sold Price/ Original List Price Total Days on Market Sold Price per Square Foot 3007 2,406 $ 1,399,900 3/15/2023 $ 1,300,000 92.86% 27 $540.32 January - June 2023 AVERAGE $1,300,000 92.86% 27 $540.32 July - December 2022 AVERAGE N/A N/A N/A N/A CLOSED - 3 BEDROOM January - June 2023
METROPOLIS
923 & 943 Peachtree St NE Atlanta, GA 30309

48
Unit Number Square Feet Beds Baths List Date Original List Price List Price List Price per Square Foot 1328 1,032 2 2 5/31/2023 $ 544,900 $ 539,900 $523.16 1901 926 2 1 3/2/2023 $ 425,000 $ 395,000 $426.57 1221 926 1 1 4/14/2023 $ 376,900 $ 369,900 $399.46 ACTIVE as of 6/30/2023 Unit Number Square Feet Beds Baths List Date Original List Price List Price List Price per Square Foot 1621 926 2 1 5/12/2023 $ 404,900 $ 374,900 $404.86
as of 6/30/2023 Average Sold Price Per Square Foot: $420.08
PENDING
49 Unit Number Square Feet Original List Price Close Date Sold Price Sold Price/ Original List Price Total Days on Market Sold Price per Square Foot 1413 867 $ 395,000 3/23/2023 $ 395,000 100.00% 4 $455.59 1313 867 $ 375,000 3/20/2023 $ 375,000 100.00% 5 $432.53 1802 849 $ 383,500 6/5/2023 $ 373,500 97.39% 33 $439.93 1435 768 $ 297,900 3/30/2023 $ 302,000 101.38% 2 $393.23 1724 768 $ 312,000 3/10/2023 $ 297,000 95.19% 43 $386.72 1504 768 $ 299,000 4/14/2023 $ 295,000 98.66% 23 $384.11 1807 696 $ 300,000 1/11/2023 $ 295,000 98.33% 57 $423.85 1536 665 $ 294,000 2/17/2023 $ 294,000 100.00% 9 $442.11 1329 668 $ 289,900 6/12/2023 $ 290,000 100.03% 7 $434.13 1127 696 $ 285,000 5/9/2023 $ 285,000 100.00% 3 $409.48 1105 754 $ 289,000 5/4/2023 $ 285,000 98.62% 24 $377.98 932 556 $ 259,900 6/6/2023 $ 283,000 108.89% 3 $508.99 709 668 $ 274,900 5/5/2023 $ 274,900 100.00% 15 $411.53 January - June 2023 AVERAGE $311,108 99.88% 18 $423.09 July - December 2022 AVERAGE $301,227 95.95% 39 $414.72 CLOSED - 1 BEDROOM January - June 2023 Unit Number Square Feet Original List Price Close Date Sold Price Sold Price/ Original List Price Total Days on Market Sold Price per Square Foot 1914 1,500 $ 625,000 4/11/2023 $ 630,000 100.80% 3 $420.00 1126 1,260 $ 499,000 3/27/2023 $ 480,000 96.19% 154 $380.95 January - June 2023 AVERAGE $555,000 98.50% 79 $400.48 July - December 2022 AVERAGE $492,167 98.14% 32 $390.61 CLOSED - 2 BEDROOM January - June 2023
845 Spring St NW Atlanta, GA 30308

50
MIDCITY LOFTS
Unit Number Square Feet Beds Baths List Date Original List Price List Price List Price per Square Foot 307 1,225 1 2 6/30/2023 $440,000 $440,000 $359.18 ACTIVE as of 6/30/2023 PENDING as of 6/30/2023 Average Sold Price Per Square Foot: $350.36 Unit Number Square Feet Original List Price Close Date Sold Price Sold Price/ Original List Price Total Days on Market Sold Price per Square Foot 108 800 $324,000 2/15/2023 $324,000 100.00% 69 $405.00 January - June 2023 AVERAGE $324,000 100.00% 69 $405.00 July - December 2022 AVERAGE $321,500 100.47% 5 $423.03 CLOSED - 1 BEDROOM January - June 2023 Unit Number Square Feet Beds Baths List Date Original List Price List Price List Price per Square Foot 519 1,225 1 2 6/7/2023 $485,000 $485,000 $395.92 122 900 1 1 3/30/2023 $325,000 $325,000 $361.11 103 800 1 1 6/15/2023 $307,000 $307,000 $383.75
51 Unit Number Square Feet Original List Price Close Date Sold Price Sold Price/ Original List Price Total Days on Market Sold Price per Square Foot PH 8 2,080 $725,000 3/1/2023 $654,900 90.33% 210 $314.86 PH4 2,116 $650,000 2/8/2023 $650,000 100.00% 106 $307.18 229 1,685 $599,900 2/28/2023 $588,500 98.10% 7 $349.26 414 1,225 $475,000 4/6/2023 $460,000 96.84% 25 $375.51 January - June 2023 AVERAGE $588,350 96.32% 87 $336.70 July - December 2022 AVERAGE N/A N/A N/A N/A CLOSED - 2 BEDROOM January - June 2023
ONE MUSEUM PLACE
1301 Peachtree St NE Atlanta, GA 30309

52
Unit Number Square Feet Beds Baths List Date Original List Price List Price List Price per Square Foot 5F 2,569 2 2 5/25/2023 $ 3,275,000 $ 3,275,000 $1,274.82 1-B 2,171 2 2 6/22/2023 $ 1,590,000 $ 1,590,000 $732.38 ACTIVE as of 6/30/2023 Unit Number Square Feet Original List Price Close Date Sold Price Sold Price/ Original List Price Total Days on Market Sold Price per Square Foot 2B 4,536 $ 3,500,000 5/23/2023 $ 2,935,000 83.86% 247 $647.05 4A 3,310 $ 3,000,000 5/30/2023 $ 2,725,000 90.83% 76 $823.26 January - June 2023 AVERAGE $2,830,000 87.35% 162 $735.15 July - December 2022 AVERAGE $2,400,000 93.20% 333 $727.27 CLOSED - 3 BEDROOM January - June 2023 Average Sold Price Per Square Foot: $735.15 PENDING as of 6/30/2023 Unit Number Square Feet Beds Baths List Date Original List Price List Price List Price per Square Foot 5L 4,840 3 3 1/18/2023 $4,500,000 $4,000,000 $826.45

53
VUE 275 13th St NE Atlanta, GA 30309 ACTIVE as of 6/30/2023 Average Sold Price Per Square Foot: $379.86 Unit Number Square Feet Beds Baths List Date Original List Price List Price List Price per Square Foot 405 1,150 2 2 6/13/2023 $ 450,000 $ 450,000 $391.30 PENDING as of 6/30/2023 Unit Number Square Feet Beds Baths List Date Original List Price List Price List Price per Square Foot 807 860 1 1 6/22/2023 $ 325,000 $ 325,000 $377.91 Unit Number Square Feet Original List Price Close Date Sold Price Sold Price/ Original List Price Total Days on Market Sold Price per Square Foot 805 780 $ 340,000 4/12/2023 $ 319,000 93.82% 191 $408.97 706 765 $ 285,000 3/3/2023 $ 280,000 98.25% 84 $366.01 January - June 2023 AVERAGE $299,500 96.03% 138 $387.49 July - December 2022 AVERAGE $325,000 101.59% 12 $424.84 CLOSED - 1 BEDROOM January - June 2023
PARC
54 Unit Number Square Feet Original List Price Close Date Sold Price Sold Price/ Original List Price Total Days on Market Sold Price per Square Foot 502 960 $ 350,000 6/9/2023 $ 350,000 100.00% 7 $364.58 January - June 2023 AVERAGE $350,000 100.00% 7 $364.58 July - December 2022 AVERAGE $439,000 101.40% 6 $369.13 CLOSED - 2 BEDROOM January - June 2023

55
CENTRAL
Juniper
NE Atlanta,
Unit Number Square Feet Beds Baths List Date Original List Price List Price List Price per Square Foot 1524 764 1 1 6/29/2023 $295,000 $295,000 $386.13 ACTIVE as of 6/30/2023 Unit Number Square Feet Beds Baths List Date Original List Price List Price List Price per Square Foot 331 1,185 2 2 5/8/2023 $419,000 $419,000 $353.59 PENDING as of 6/30/2023 Average Sold Price Per Square Foot: $357.32 Unit Number Square Feet Original List Price Close Date Sold Price Sold Price/ Original List Price Total Days on Market Sold Price per Square Foot 1209 868 $340,000 5/26/2023 $330,000 97.06% 39 $380.18 625 781 $329,900 3/24/2023 $323,000 97.91% 10 $413.57 132 1,005 $349,000 4/5/2023 $320,000 91.69% 66 $318.41 610 868 $309,900 1/9/2023 $310,000 100.03% 39 $357.14 January - June 2023 AVERAGE $320,750 96.67% 39 $367.33 July - December 2022 AVERAGE $304,971 100.06% 23 $375.27 CLOSED - 1 BEDROOM January - June 2023
PARK
1101
St
GA 30309
56 Unit Number Square Feet Original List Price Close Date Sold Price Sold Price/ Original List Price Total Days on Market Sold Price per Square Foot 304 1,161 $425,000 2/21/2023 $419,900 98.80% 19 $361.67 1401 1,008 $395,000 4/27/2023 $395,000 100.00% 6 $391.87 1411 1,169 $420,000 6/22/2023 $389,000 92.62% 33 $332.76 828 1,054 $389,900 6/6/2023 $370,000 94.90% 4 $351.04 515 1,161 $369,500 2/8/2023 $369,500 100.00% 109 $318.26 1021 1,158 $359,900 5/17/2023 $365,000 101.42% 2 $315.20 January - June 2023 AVERAGE $384,733 97.96% 29 $345.13 July - December 2022 AVERAGE $398,750 100.02% 25 $341.91 CLOSED - 2 BEDROOM January - June 2023 Unit Number Square Feet Original List Price Close Date Sold Price Sold Price/ Original List Price Total Days on Market Sold Price per Square Foot 1415 2,303 $899,000 5/24/2023 $899,000 100.00% 8 $390.36 January - June 2023 AVERAGE $899,000 100.00% 8 $390.36 July - December 2022 AVERAGE N/A N/A N/A N/A CLOSED - 3 BEDROOM January - June 2023
PEACHTREE LOFTS

878 Peachtree St NE Atlanta, GA 30309
Average Price Per Square Foot: $363.39
57
ACTIVE as of 6/30/2023 Unit Number Square Feet Beds Baths List Date Original List Price List Price List Price per Square Foot 525 1,611 2 2 5/11/2023 $ 629,000 $ 629,000 $390.44 530 1,136 1 1 4/7/2023 $ 364,900 $ 364,900 $321.21
PENDING as of 6/30/2023
Unit Number Square Feet Beds Baths List Date Original List Price List Price List Price per Square Foot 424 1,624 2 2 3/30/2023 $ 570,000 $ 555,000 $341.75 505 1,136 1 1 6/28/2023 $ 357,500 $ 357,500 $314.70 418 954 1 1 6/20/2023 $ 335,000 $ 335,000 $351.15
58 Unit Number Square Feet Original List Price Close Date Sold Price Sold Price/ Original List Price Total Days on Market Sold Price per Square Foot 828 1,138 $ 319,000 5/9/2023 $ 319,000 100.00% 3 $280.32 January - June 2023 AVERAGE $319,000 100.00% 3 $280.32 July - December 2022 AVERAGE $339,250 97.92% 19 $336.01 CLOSED - 2 BEDROOM January - June 2023 Unit Number Square Feet Original List Price Close Date Sold Price Sold Price/ Original List Price Total Days on Market Sold Price per Square Foot 406 1,120 $ 389,900 4/3/2023 $ 382,500 98.10% 3 $341.52 627 908 $ 325,000 5/15/2023 $ 325,000 100.00% 16 $357.93 523 515 $ 235,000 1/20/2023 $ 230,000 97.87% 4 $446.60 716 603 $ 235,000 3/31/2023 $ 224,000 95.32% 42 $371.48 826 515 $ 200,000 1/20/2023 $ 197,000 98.50% 5 $382.52 January - June 2023 AVERAGE $271,700 97.96% 14 $380.01 July - December 2022 AVERAGE $300,800 98.84% 10 $356.19 CLOSED - 1 BEDROOM January - June 2023
PEACHTREE WALK 1074 & 1075 Peachtree Walk NE Atlanta, GA 30309

59
Unit Number Square Feet Beds Baths List Date Original List Price List Price List Price per Square Foot A417 730 1 1 6/29/2023 $ 265,000 $ 265,000 $363.01 B504 1,000 2 2 6/15/2023 $ 385,000 $ 385,000 $385.00 NO ACTIVES as of 6/30/2023 PENDING as of 6/30/2023 Unit Number Square Feet Original List Price Close Date Sold Price Sold Price/ Original List Price Total Days on Market Sold Price per Square Foot A201 730 $ 274,900 5/24/2023 $ 272,400 99.09% 3 $373.15 A104 730 $ 264,900 5/26/2023 $ 269,000 101.55% 2 $368.49 A317 730 $ 255,000 2/15/2023 $ 262,000 102.75% 3 $358.90 310 720 $ 264,900 4/14/2023 $ 260,900 98.49% 8 $362.36 A116 730 $ 255,000 5/30/2023 $ 255,000 100.00% 3 $349.32 A402 730 $ 260,000 3/24/2023 $ 255,000 98.08% 111 $349.32 A411 730 $ 265,000 3/1/2023 $ 250,000 94.34% 69 $342.47 January - June 2023 AVERAGE $260,614 99.18% 28 $357.71 July - December 2022 AVERAGE $235,000 96.11% 10 $321.92 CLOSED - 1 BEDROOM January - June 2023 Average Sold Price Per Square Foot: $351.18
60 Unit Number Square Feet Original List Price Close Date Sold Price Sold Price/ Original List Price Total Days on Market Sold Price per Square Foot B209 1,119 $ 375,000 6/7/2023 $ 385,000 102.67% 2 $344.06 A517 1,000 $ 365,000 4/14/2023 $ 375,000 102.74% 7 $375.00 B206 1,119 $ 398,900 3/28/2023 $ 375,000 94.01% 183 $335.12 B402 1,119 $ 380,000 2/10/2023 $ 373,000 98.16% 89 $333.33 A310 1,119 $ 361,000 4/3/2023 $ 361,000 100.00% 131 $322.61 January - June 2023 AVERAGE $373,800 99.51% 82 $342.02 July - December 2022 AVERAGE $358,000 100.00% 10 $319.93
CLOSED - 2 BEDROOM January - June 2023

61
CREST
Unit Number Square Feet Original List Price Close Date Sold Price Sold Price/ Original List Price Total Days on Market Sold Price per Square Foot 408 803 $ 299,900 2/13/2023 $ 299,900 100.00% 6 $373.47 January - June 2023 AVERAGE $299,900 100.00% 6 $373.47 July - December 2022 AVERAGE N/A N/A N/A N/A CLOSED - 1 BEDROOM January - June 2023 NO ACTIVES OR PENDINGS as of 6/30/2023 Average Sold Price Per Square Foot: $427.28 Unit Number Square Feet Original List Price Close Date Sold Price Sold Price/ Original List Price Total Days on Market Sold Price per Square Foot 318 1,508 $ 750,000 6/22/2023 $ 745,000 99.33% 7 $494.03 316 1,617 $ 650,000 4/7/2023 $ 670,000 103.08% 1 $414.35 January - June 2023 AVERAGE $707,500 101.21% 4 $454.19 July - December 2022 AVERAGE N/A N/A N/A N/A CLOSED - 2 BEDROOM January - June 2023
PIEDMONT
1055 Piedmont Ave NE Atlanta, GA 30309

62
44 Peachtree Pl NW & 950 W Peachtree St NW Atlanta,
Unit Number Square Feet Beds Baths List Date Original List Price List Price List Price per Square Foot 1014 1,196 2 2 5/15/2023 $ 459,000 $ 454,000 $379.60 1729 774 1 1 3/3/2023 $ 350,000 $ 340,000 $439.28 629 774 1 1 4/27/2023 $ 324,800 $ 324,800 $419.64 ACTIVE as of 6/30/2023 Unit Number Square Feet Beds Baths List Date Original List Price List Price List Price per Square Foot 1901 1,196 2 2 6/9/2023 $ 464,900 $ 464,900 $388.71 1905 866 1 1 6/15/2023 $ 354,900 $ 354,900 $409.82 733 828 1 1 6/22/2023 $ 349,900 $ 349,900 $422.58 1527 768 1 1 5/25/2023 $ 344,000 $ 344,000 $447.92 PENDING as of 6/30/2023 Average Sold Price Per Square Foot: $422.16
PLAZA MIDTOWN
GA 30309
CLOSED - 1 BEDROOM January - June 2023
63 Unit Number Square Feet Original List Price Close Date Sold Price Sold Price/ Original List Price Total Days on Market Sold Price per Square Foot 826 774 $ 365,000 4/10/2023 $ 370,000 101.37% 27 $478.04 1633 828 $ 375,000 5/12/2023 $ 365,000 97.33% 10 $440.82 1910 866 $ 374,900 2/24/2023 $ 363,500 96.96% 24 $419.75 1733 828 $ 349,900 5/30/2023 $ 350,000 100.03% 21 $422.71 2027 768 $ 350,000 2/3/2023 $ 350,000 100.00% 12 $455.73 1033 828 $ 350,000 6/12/2023 $ 345,000 98.57% 71 $416.67 1626 774 $ 345,000 6/26/2023 $ 339,000 98.26% 45 $437.98 1529 774 $ 349,900 6/22/2023 $ 325,000 92.88% 53 $419.90 January - June 2023 AVERAGE $350,938 98.18% 33 $436.45 July - December 2022 AVERAGE $335,700 98.12% 26 $417.92
Unit Number Square Feet Original List Price Close Date Sold Price Sold Price/ Original List Price Total Days on Market Sold Price per Square Foot 1807 1,512 $ 635,000 2/28/2023 $ 620,000 97.64% 33 $410.05 1109 1,512 $ 599,000 4/21/2023 $ 595,000 99.33% 22 $393.52 2009 1,512 $ 620,000 4/14/2023 $ 595,000 95.97% 111 $393.52 709 1,512 $ 599,900 5/31/2023 $ 591,000 98.52% 17 $390.87 2012 1,260 $ 570,000 1/12/2023 $ 560,000 98.25% 157 $444.44 2023 1,260 $ 539,000 1/12/2023 $ 545,000 101.11% 69 $432.54 1812 1,260 $ 539,000 2/24/2023 $ 539,000 100.00% 147 $427.78 1203 1,260 $ 550,000 2/13/2023 $ 535,000 97.27% 70 $424.60 1114 1,196 $ 460,000 3/13/2023 $ 451,500 98.15% 0 $377.51 511 1,091 $ 449,900 3/13/2023 $ 450,000 100.02% 3 $412.47 January - June 2023 AVERAGE $548,150 98.63% 63 $410.73 July - December 2022 AVERAGE $521,000 99.67% 13 $381.87
January
2023
CLOSED - 2 BEDROOM
- June

64
Unit Number Square Feet Beds Baths List Date Original List Price List Price List Price per Square Foot 601 2,900 3 3 2/13/2023 $ 1,525,000 $ 1,345,000 $463.79 201 1,685 2 2 6/7/2023 $ 595,000 $ 595,000 $353.12 604 1,485 2 2 4/7/2023 $ 589,000 $ 589,000 $396.63 ACTIVE as of 6/30/2023 Unit Number Square Feet Original List Price Close Date Sold Price Sold Price/ Original List Price Total Days on Market Sold Price per Square Foot 101 1,405 $ 535,000 2/22/2023 $ 510,000 95.33% 30 $362.99 January - June 2023 AVERAGE $510,000 95.33% 30 $362.99 July - December 2022 AVERAGE N/A N/A N/A N/A CLOSED - 1 BEDROOM January - June 2023 Average Sold Price Per Square Foot: $373.41 NO PENDINGS as of 6/30/2023 Unit Number Square Feet Original List Price Close Date Sold Price Sold Price/ Original List Price Total Days on Market Sold Price per Square Foot 304 1,485 $ 599,000 3/2/2023 $ 570,000 95.16% 54 $383.84 January - June 2023 AVERAGE $570,000 95.16% 54 $383.84 July - December 2022 AVERAGE $595,000 94.82% 31 $375.51 CLOSED - 2 BEDROOM January - June 2023
REID HOUSE 1325 & 1327 Peachtree St NE Atlanta, GA 30309

65 SEVENTH MIDTOWN 867 Peachtree St Atlanta, GA 30308 NO CLOSED SALES January - June 2023 Average Sold Price Per Square Foot: N/A Unit Number Square Feet Beds Baths List Date Original List Price List Price List Price per Square Foot 302 2,340 3 3 6/21/2023 $ 1,299,000 $ 1,299,000 $555.13 ACTIVE as of 6/30/2023 NO PENDINGS as of 6/30/2023

66
Unit Number Square Feet Original List Price Close Date Sold Price Sold Price/ Original List Price Total Days on Market Sold Price per Square Foot 111 873 $ 240,000 6/12/2023 $ 235,000 97.92% 41 $269.19 January - June 2023 AVERAGE $235,000 97.92% 41 $269.19 July - December 2022 AVERAGE $242,450 101.18% 14 $276.53 CLOSED - 1 BEDROOM January - June 2023 Unit Number Square Feet Original List Price Close Date Sold Price Sold Price/ Original List Price Total Days on Market Sold Price per Square Foot 1306 1,582 $ 425,000 2/6/2023 $ 417,500 98.24% 10 $263.91 2316 1,832 $ 450,000 3/31/2023 $ 417,000 92.67% 35 $227.62 January - June 2023 AVERAGE $417,250 95.45% 23 $245.76 July - December 2022 AVERAGE $357,500 96.38% 84 $256.43 CLOSED - 2 BEDROOM January - June 2023 Average Sold Price Per Square Foot: $253.57 NO PENDINGS as of 6/30/2023 Unit Number Square Feet Beds Baths List Date Original List Price List Price List Price per Square Foot 2311 1,298 2 2 5/9/2023 $ 405,000 $ 390,000 $300.46 ACTIVE as of 6/30/2023
SIENA AT RENAISSANCE 220 & 240 Renaissance Pkwy NE Atlanta, GA 30308
SPIRE
860 Peachtree St NE Atlanta, GA 30308

67
Unit Number Square Feet Beds Baths List Date Original List Price List Price List Price per Square Foot 2710 796 1 1 1/30/2023 $ 365,000 $ 359,900 $452.14 907 792 1 1 6/26/2023 $ 329,000 $ 329,000 $415.40 1603 707 1 1 6/22/2023 $ 325,000 $ 325,000 $459.69 2603 707 1 1 6/1/2023 $ 329,900 $ 325,000 $459.69 1013 677 1 1 4/19/2023 $ 331,000 $ 315,000 $465.29 ACTIVE as of 6/30/2023 Unit Number Square Feet Beds Baths List Date Original List Price List Price List Price per Square Foot 2801 1,875 2 2 5/10/2023 $ 950,000 $ 925,000 $493.33 1605 1,208 2 2 6/12/2023 $ 539,950 $ 539,950 $446.98 2618 1,193 2 2 5/30/2023 $ 530,000 $ 530,000 $444.26 2107 792 1 1 6/8/2023 $ 359,900 $ 359,900 $454.42 2510 796 1 1 3/8/2023 $ 349,999 $ 339,500 $426.51 1811 745 1 1 6/14/2023 $ 335,000 $ 335,000 $449.66 1716 606 1 1 6/6/2023 $ 289,000 $ 289,000 $476.90 PENDING as of 6/30/2023 Average Sold Price Per Square Foot: $433.02
CLOSED - 1 BEDROOM January - June 2023
68 Unit Number Square Feet Original List Price Close Date Sold Price Sold Price/ Original List Price Total Days on Market Sold Price per Square Foot 1610 796 $ 394,900 1/30/2023 $ 375,000 94.96% 111 $471.11 2210 796 $ 350,000 4/26/2023 $ 342,750 97.93% 53 $430.59 2813 678 $ 340,000 2/1/2023 $ 340,000 100.00% 38 $501.47 2310 796 $ 355,000 5/18/2023 $ 331,000 93.24% 58 $415.83 812 808 $ 329,900 4/7/2023 $ 329,900 100.00% 20 $408.29 1103 707 $ 329,000 3/8/2023 $ 329,000 100.00% 4 $465.35 2403 707 $ 330,000 5/31/2023 $ 325,000 98.48% 24 $459.69 2208 738 $ 330,000 4/14/2023 $ 320,000 96.97% 27 $433.60 807 792 $ 326,000 6/15/2023 $ 317,300 97.33% 62 $400.63 1006 744 $ 310,000 6/23/2023 $ 310,000 100.00% 15 $416.67 1016 606 $ 315,000 5/26/2023 $ 305,000 96.83% 41 $503.30 1513 678 $ 289,900 1/18/2023 $ 270,000 93.14% 89 $398.23 January - June 2023 AVERAGE $324,579 97.41% 45 $442.06 July - December 2022 AVERAGE $349,036 97.11% 24 $447.85
Unit Number Square Feet Original List Price Close Date Sold Price Sold Price/ Original List Price Total Days on Market Sold Price per Square Foot 2517 1,193 $ 549,000 2/28/2023 $ 525,000 95.63% 29 $440.07 2505 1,208 $ 525,000 5/4/2023 $ 523,250 99.67% 4 $433.15 2114 1,211 $ 499,900 4/28/2023 $ 495,000 99.02% 9 $408.75 1917 1,193 $ 512,500 1/25/2023 $ 493,500 96.29% 184 $413.66 1817 1,193 $ 500,000 4/26/2023 $ 482,000 96.40% 52 $404.02 2118 1,193 $ 465,270 4/13/2023 $ 465,270 100.00% 214 $390.00 January - June 2023 AVERAGE $497,337 97.83% 82 $414.94 July - December 2022 AVERAGE $621,333 93.77% 120 $439.85 CLOSED - 2 BEDROOM January - June 2023

69
Unit Number Square Feet Beds Baths List Date Original List Price List Price List Price per Square Foot 3211 814 1 1 2/6/2023 $315,000 $305,000 $374.69 2222 821 1 1 6/30/2023 $254,900 $254,900 $310.48 ACTIVE as of 6/30/2023 Average Sold Price Per Square Foot: $333.30 Unit Number Square Feet Beds Baths List Date Original List Price List Price List Price per Square Foot 1118 789 1 1 5/23/2023 $260,000 $260,000 $329.53 3131 1,181 2 2 6/13/2023 $400,000 $400,000 $338.70 2211 692 1 1 5/15/2023 $290,000 $280,000 $404.62 3028 715 1 1 4/30/2023 $279,900 $278,900 $390.07 PENDING as of 6/30/2023 Unit Number Square Feet Original List Price Close Date Sold Price Sold Price/ Original List Price Total Days on Market Sold Price per Square Foot 4122 814 $310,000 2/22/2023 $285,000 91.94% 109 $350.12 3222 814 $337,500 2/22/2023 $285,000 84.44% 226 $350.12 January - June 2023 AVERAGE $285,000 88.19% 168 $350.12 July - December 2022 AVERAGE $288,667 98.01% 12 $374.11 CLOSED - 1 BEDROOM January - June 2023
TUSCANY 955 Juniper St NE Atlanta, GA 30309
70 Unit Number Square Feet Original List Price Close Date Sold Price Sold Price/ Original List Price Total Days on Market Sold Price per Square Foot 4212 1,181 $400,000 5/19/2023 $415,000 103.75% 2 $351.40 3231 1,181 $369,000 3/2/2023 $374,900 101.60% 21 $317.44 4220 1,181 $370,000 4/24/2023 $370,000 100.00% 2 $313.29 2328 1,027 $329,000 6/29/2023 $326,000 99.09% 2 $317.43 January - June 2023 AVERAGE $371,475 101.11% 7 $324.89 July - December 2022 AVERAGE $381,500 100.05% 7 $326.22 CLOSED - 2 BEDROOM January - June 2023

71
Average Sold Price Per Square Foot: $379.22 Unit Number Square Feet Beds Baths List Date Original List Price List Price List Price per Square Foot 3802 2,547 4 4 5/9/2023 $765,000 $780,000 $306.24 3401 1,200 2 2 6/8/2023 $485,000 $488,800 $407.33 2704 1,127 2 2 5/31/2023 $460,000 $449,900 $399.20 1306 1,075 2 2 3/26/2023 $425,000 $425,000 $395.35 1009 763 1 1 6/22/2023 $294,900 $294,900 $386.50 2403 743 1 1 5/19/2023 $289,000 $289,000 $388.96 1008 763 1 1 6/2/2023 $288,000 $288,000 $377.46 2507 730 1 1 6/15/2023 $284,900 $279,900 $383.42 2614 743 1 1 5/19/2023 $279,900 $279,900 $376.72 1002 729 1 1 4/28/2023 $279,900 $279,900 $383.95
as of 6/30/2023 Unit Number Square Feet Beds Baths List Date Original List Price List Price List Price per Square Foot 2004 1,127 2 2 11/7/2022 $459,000 $445,000 $394.85 1512 743 1 1 6/2/2023 $279,000 $279,000 $375.50 3414 743 1 1 4/3/2023 $284,900 $274,900 $369.99
TWELVE CENTENNIAL PARK 400 W Peachtree St NW Atlanta, GA 30308
ACTIVE
6/30/2023
PENDING as of
72 Unit Number Square Feet Original List Price Close Date Sold Price Sold Price/ Original List Price Total Days on Market Sold Price per Square Foot 1008 743 $279,900 2/21/2023 $285,000 101.82% 5 $383.58 1808 763 $283,000 6/9/2023 $280,000 98.94% 49 $366.97 1915 729 $290,000 1/30/2023 $280,000 96.55% 65 $384.09 3310 730 $279,000 2/17/2023 $279,000 100.00% 6 $382.19 January - June 2023 AVERAGE $281,000 99.33% 31 $379.21 July - December 2022 AVERAGE $288,333 98.32% 14 $384.36 CLOSED - 1 BEDROOM January - June 2023 Unit Number Square Feet Original List Price Close Date Sold Price Sold Price/ Original List Price Total Days on Market Sold Price per Square Foot 3801 1,380 $550,000 6/12/2023 $514,000 93.45% 77 $372.46 1511 1,075 $440,000 4/3/2023 $415,000 94.32% 76 $386.05 January - June 2023 AVERAGE $464,500 93.89% 77 $379.26 July - December 2022 AVERAGE $440,000 98.88% 75 $390.42 CLOSED - 2 BEDROOM January - June 2023
855 Peachtree St Atlanta, GA 30308

73
VIEWPOINT
Unit Number Square Feet Beds Baths List Date Original List Price List Price List Price per Square Foot 3304 1,201 2 2 3/14/2023 $630,000 $584,000 $486.26 2709 1,320 2 2 5/26/2023 $569,000 $564,000 $427.27 2807 1,184 2 2 3/9/2023 $529,000 $515,000 $434.97 3410 800 1 1 2/27/2023 $450,000 $439,000 $548.75 2301 802 1 1 6/22/2023 $400,000 $400,000 $498.75 2010 861 2 1 6/5/2023 $399,900 $399,900 $464.46 2901 802 1 1 5/21/2023 $405,000 $389,900 $486.16 1201 802 1 1 6/1/2023 $380,000 $380,000 $473.82 ACTIVE as of 6/30/2023 Unit Number Square Feet Beds Baths List Date Original List Price List Price List Price per Square Foot 2302 1,223 2 2 6/22/2023 $600,000 $600,000 $490.60 2013 2,002 3 3 2/20/2023 $1,100,000 $999,900 $499.45 2809 1,320 2 2 5/4/2023 $575,000 $575,000 $435.61 3013 1,158 2 2 5/5/2023 $558,000 $558,000 $481.87 2206 784 1 1 6/1/2023 $359,900 $359,900 $459.06 2806 783 1 1 5/18/2023 $349,900 $349,900 $446.87
as of 6/30/2023 Average Sold Price Per Square Foot: $446.99
PENDING
74 Unit Number Square Feet Original List Price Close Date Sold Price Sold Price/ Original List Price Total Days on Market Sold Price per Square Foot 1108 797 $375,000 5/31/2023 $385,000 102.67% 3 $483.06 2201 802 $385,000 4/28/2023 $380,000 98.70% 46 $473.82 1506 783 $335,000 6/2/2023 $325,000 97.01% 52 $415.07 1512 748 $350,000 1/9/2023 $325,000 92.86% 142 $434.49 January - June 2023 AVERAGE $353,750 97.81% 61 $451.61 July - December 2022 AVERAGE $370,000 97.88% 52 $453.48
- 1 BEDROOM January - June 2023
- 2 BEDROOM January - June 2023 Unit Number Square Feet Original List Price Close Date Sold Price Sold Price/ Original List Price Total Days on Market Sold Price per Square Foot 1709 1,320 $585,000 3/22/2023 $572,000 97.78% 12 $433.33 2903 1,148 $550,000 3/14/2023 $550,000 100.00% 3 $479.09 1503 1,148 $550,000 5/22/2023 $540,000 98.18% 4 $470.38 2509 1,320 $559,000 6/5/2023 $539,000 96.42% 61 $408.33 3305 986 $500,000 2/8/2023 $470,000 94.00% 44 $476.67 602 1,267 $540,000 6/16/2023 $460,000 85.19% 311 $363.06 1810 861 $375,000 6/23/2023 $372,500 99.33% 13 $432.64 2905 982 $485,000 4/24/2023 $485,000 100.00% 21 $493.89 January - June 2023 AVERAGE $498,563 96.36% 59 $444.68 July - December 2022 AVERAGE $505,645 96.46% 39 $451.00
CLOSED
CLOSED

75
HILL 587 Virginia Ave NE Atlanta, GA 30306 NO ACTIVES as of 6/30/2023 Average Sold Price Per Square Foot: $375.00 Unit Number Square Feet Original List Price Close Date Sold Price Sold Price/ Original List Price Total Days on Market Sold Price per Square Foot 802 800 $335,000 1/4/2023 $300,000 89.55% 44 $375.00 January - June 2023 AVERAGE $300,000 89.55% 44 $375.00 July - December 2022 AVERAGE $325,000 105.18% 102 $260.00 CLOSED - 2 BEDROOM January - June 2023 Unit Number Square Feet Beds Baths List Date Original List Price List Price List Price per Square Foot 808 800 2 2 6/5/2023 $350,000 $350,000 $437.50 PENDING as of 6/30/2023
VIRGINIA

76
Average Sold Price Per Square Foot: $319.46 Unit Number Square Feet Beds Baths List Date Original List Price List Price List Price per Square Foot 2602 1,823 1 1 6/16/2023 $946,000 $946,000 $518.92 1907 1,919 2 2 6/2/2023 $700,000 $700,000 $364.77 2207 1,587 2 2 2/1/2023 $525,000 $525,000 $330.81 1703 1,399 2 2 4/8/2023 $525,000 $500,000 $357.40 1805 868 1 1 1/17/2023 $349,000 $349,000 $402.07 2706 3,289 3 3 11/28/2022 $2,250,000 $2,225,000 $676.50 2301 1,774 2 2 12/9/2022 $799,999 $699,999 $394.59 ACTIVE as of 6/30/2023 Unit Number Square Feet Beds Baths List Date Original List Price List Price List Price per Square Foot 1908 1,587 2 2 5/15/2023 $520,000 $500,000 $315.06 PENDING as of 6/30/2023
W RESIDENCES 45 Ivan Allen Jr Boulevard NW Atlanta, GA 30308
77 Unit Number Square Feet Original List Price Close Date Sold Price Sold Price/ Original List Price Total Days on Market Sold Price per Square Foot 2504 2,171 $685,000 6/8/2023 $650,000 94.89% 67 $299.40 2003 1,399 $480,000 6/27/2023 $475,000 98.96% 4 $339.53 January - June 2023 AVERAGE $562,500 96.92% 36 $319.46 July - December 2022 AVERAGE N/A N/A N/A N/A CLOSED - 2 BEDROOM January - June 2023

78
273 12th St NE & 250 11th St NE Atlanta,
30309 Unit Number Square Feet Original List Price Close Date Sold Price Sold Price/ Original List Price Total Days on Market Sold Price per Square Foot 313 858 $395,000 5/17/2023 $395,000 100.00% 5 $460.37 January - June 2023 AVERAGE $395,000 100.00% 5 $460.37 July - December 2022 AVERAGE N/A N/A N/A N/A CLOSED - 1 BEDROOM January - June 2023 Average Sold Price Per Square Foot: $460.37 NO ACTIVES OR PENDINGS as of 6/30/2023
WILBURN HOUSE - NEW
GA

79
266 11th St NE Atlanta, GA 30309 Average Sold Price Per Square Foot: $414.17 Unit Number Square Feet Original List Price Close Date Sold Price Sold Price/ Original List Price Total Days on Market Sold Price per Square Foot 203 833 $380,000 1/31/2023 $345,000 90.79% 66 $414.17 January - June 2023 AVERAGE $345,000 90.79% 66 $414.17 July - December 2022 AVERAGE $389,950 100.00% 4 $516.47 CLOSED - 1 BEDROOM January - June 2023 NO ACTIVES OR PENDINGS as of 6/30/2023
WILBURN HOUSEHISTORIC

80
Unit Number Square Feet Beds Baths List Date Original List Price List Price List Price per Square Foot 502 786 1 1 6/26/2023 $229,599 $229,599 $292.11 1615 786 1 1 6/5/2023 $208,000 $204,000 $259.54 ACTIVE as of 6/30/2023 Unit Number Square Feet Beds Baths List Date Original List Price List Price List Price per Square Foot 1505 1235 2 2 6/16/2023 $342,500 $342,500 $277.33 1606 992 2 1 4/15/2023 $325,000 $300,000 $302.42 PENDING as of 6/30/2023 Average Sold Price Per Square Foot: $256.82 Unit Number Square Feet Original List Price Close Date Sold Price Sold Price/ Original List Price Total Days on Market Sold Price per Square Foot 1410 786 $199,900 5/11/2023 $190,000 95.05% 12 $241.73 1516 655 $199,000 5/25/2023 $185,000 92.96% 58 $282.44 515 786 $199,900 1/18/2023 $185,000 92.55% 34 $235.37 701 655 $170,000 3/3/2023 $164,900 97.00% 20 $251.76 1801 655 $165,000 5/31/2023 $160,000 96.97% 9 $244.27 January - June 2023 AVERAGE $176,980 94.91% 27 $251.11 July - December 2022 AVERAGE $199,333 98.78% 27 $256.11 CLOSED - 1 BEDROOM January - June 2023
WINDSOR OVER PEACHTREE 620 Peachtree St NE Atlanta, GA 30308
81 Unit Number Square Feet Original List Price Close Date Sold Price Sold Price/ Original List Price Total Days on Market Sold Price per Square Foot 812 1190 $299,000 4/27/2023 $315,000 105.35% 5 $264.71 411 992 $299,000 4/3/2023 $275,000 91.97% 149 $277.22 1911 992 $254,900 3/31/2023 $255,000 100.04% 4 $257.06 January - June 2023 AVERAGE $281,667 99.12% 53 $266.33 July - December 2022 AVERAGE $330,000 98.46% 11 $251.12 CLOSED - 2 BEDROOM January - June 2023
ATLANTIC STATION/ WHITE PROVISIONS
ART FOUNDRY
THE ATLANTIC ATLOFTS
DISTRICT LOFTS
ELEMENT
TWELVE ATLANTIC STATION
WHITE PROVISIONS
82

83 1 Art Foundry 2 The Atlantic 3 ATLofts 4 District Lofts 5 Element 6 Twelve Atlantic Station 7 White Provisions 6 2 3 5 1 7 4
Atlantic Station/White Provisions Condo Overview
84 Building Total Units Year Built HOA/ Square Foot Total Closings Average Sales Price Total Days on Market Total Closings Average Sales Price Total Days on Market Average Sales Price / Original List Price Average Price per Square Ft Art Foundry 347 2005 $0.45 11 $243,091 12 10 $275,000 29 99.17% $257.68 The Atlantic 401 2009 $0.49 30 $783,707 63 13 $629,906 112 97.28% $368.69 ATLofts 53 2006 $0.45 3 $298,750 71 0 N/A N/A N/A N/A District Lofts 60 2005 $0.44 9 $505,811 59 2 $429,900 16 100.00% $352.69 Element 322 2007 $0.57 32 $271,559 26 9 $304,878 82 96.55% $263.81 Twelve Atlantic Station 404 2005 $0.59 15 $279,560 38 12 $302,733 70 96.14% $350.57 White Provisions 94 2009 $0.56 3 $441,633 11 2 $652,500 116 88.79% $353.76 1/1/2022 - 6/30/2022 1/1/2023 - 6/30/2023
ART FOUNDRY 400 17th St NW Atlanta, GA 30363

85
Unit Number Square Feet Beds Baths List Date Original List Price List Price List Price per Square Foot 1121 980 1 1 5/25/2023 $239,900 $239,900 $244.80 2229 1,155 2 2 6/11/2023 $329,900 $329,900 $285.63 1421 1,147 1 1 6/20/2023 $305,000 $305,000 $265.91 2103 980 1 1 3/15/2023 $249,900 $244,900 $249.90 1412 884 1 1 4/27/2023 $199,000 $235,000 $265.84 1135 750 1 1 6/9/2023 $219,000 $219,000 $292.00 2235 750 1 1 4/18/2023 $229,000 $213,000 $284.00
as of 6/30/2023 Unit Number Square Feet Beds Baths List Date Original List Price List Price List Price per Square Foot 2027 1,080 2 1 6/28/2023 $289,900 $289,900 $268.43 2110 700 1 1 3/27/2023 $229,950 $221,999 $317.14 ACTIVE as of 6/30/2023 Average Sold Price Per Square Foot: $257.68
PENDING
86 Unit Number Square Feet Original List Price Close Date Sold Price Sold Price/ Original List Price Total Days on Market Sold Price per Square Foot 2409 1,155 $315,000 4/13/2023 $315,000 100.00% 12 $272.73 1201 1,433 $309,000 5/30/2023 $300,000 97.09% 0 $209.35 2029 1,155 $300,000 5/10/2023 $300,000 100.00% 10 $259.74 2025 1,080 $299,000 5/25/2023 $299,000 100.00% 20 $276.85 2317 1,155 $299,000 3/10/2023 $280,000 93.65% 36 $242.42 January - June 2023 AVERAGE $298,800 98.15% 16 $252.22 July - December 2022 AVERAGE $314,200 99.75% 31 $246.43 CLOSED - 2 BEDROOM January - June 2023 Unit Number Square Feet Original List Price Close Date Sold Price Sold Price/ Original List Price Total Days on Market Sold Price per Square Foot 1137 980 $250,000 6/30/2023 $250,000 100.00% 100 $255.10 1112 884 $215,000 5/26/2023 $225,000 104.65% 5 $254.52 2318 750 $217,900 2/22/2023 $217,900 100.00% 73 $290.53 1138 755 $215,000 4/25/2023 $213,000 99.07% 14 $282.12 January - June 2023 AVERAGE $226,475 100.93% 48 $270.57 July - December 2022 AVERAGE $230,500 100.98% 13 $301.46 CLOSED - 1 BEDROOM January - June 2023 Unit Number Square Feet Original List Price Close Date Sold Price Sold Price/ Original List Price Total Days on Market Sold Price per Square Foot 1334 1,500 $359,900 5/25/2023 $350,100 97.28% 22 $233.40 January - June 2023 AVERAGE $350,100 97.28% 22 $233.40 July - December 2022 AVERAGE $350,000 100.00% 32 $241.38 CLOSED - 3 BEDROOM January - June 2023
THE ATLANTIC 270 17th St NW Atlanta, GA 30363

87
Unit Number Square Feet Beds Baths List Date Original List Price List Price List Price per Square Foot 3908 2,091 3 3 6/1/2023 $874,900 $874,900 $418.41 3804 2,013 3 3 6/1/2023 $799,900 $799,900 $397.37 3107 1,801 2 2 5/18/2023 $749,900 $749,900 $416.38 2709 1,536 2 2 4/18/2023 $698,000 $698,000 $454.43 1704 1,744 2 2 4/5/2023 $630,000 $630,000 $361.24 4505 2,162 3 3 5/16/2023 $1,300,000 $1,300,000 $601.30 602 1,369 2 2 11/18/2022 $574,900 $549,900 $401.68 2905 1,244 1 1 6/5/2023 $422,000 $422,000 $339.23 ACTIVE as of 6/30/2023 Average Sold Price Per Square Foot: $368.69 Unit Number Square Feet Beds Baths List Date Original List Price List Price List Price per Square Foot 3905 2,033 3 3 10/17/2022 $874,900 $874,900 $430.35 3708 2,091 3 3 6/1/2023 $824,900 $824,900 $394.50 1104 1,744 2 2 6/1/2023 $580,000 $580,000 $332.57 2108 1,132 1 1 5/16/2023 $409,500 $409,500 $361.75 PENDING as of 6/30/2023
88 Unit Number Square Feet Original List Price Close Date Sold Price Sold Price/ Original List Price Total Days on Market Sold Price per Square Foot 3505 1,244 $475,000 5/31/2023 $475,000 100.00% 48 $381.83 608 1,132 $395,000 1/20/2023 $392,000 99.24% 96 $346.29 2007 1,244 $385,000 5/30/2023 $386,884 100.49% 83 $311.00 2106 1,049 $399,000 2/16/2023 $380,000 95.24% 76 $362.25 January - June 2023 AVERAGE $408,471 98.74% 76 $350.34 July - December 2022 AVERAGE $420,500 95.32% 43 $371.47 CLOSED
Unit Number Square Feet Original List Price Close Date Sold Price Sold Price/ Original List Price Total Days on Market Sold Price per Square Foot 4102 1,903 $924,900 5/30/2023 $850,000 91.90% 104 $446.66 2109 1,801 $679,500 6/9/2023 $650,000 95.66% 243 $360.91 1801 1,535 $675,000 6/2/2023 $630,000 93.33% 9 $410.42 2204 1,744 $650,000 4/12/2023 $625,000 96.15% 61 $358.37 January - June 2023 AVERAGE $688,750 94.26% 104 $394.09 July - December 2022 AVERAGE $668,114 96.39% 27 $388.01 CLOSED - 2 BEDROOM January - June 2023 Unit Number Square Feet Original List Price Close Date Sold Price Sold Price/ Original List Price Total Days on Market Sold Price per Square Foot 3705 1,912 $799,900 6/6/2023 $799,900 100.00% 479 $418.36 3508 2,152 $750,000 4/27/2023 $750,000 100.00% 29 $348.51 3504 2,152 $750,000 2/28/2023 $750,000 100.00% 0 $348.51 3304 2,152 $750,000 4/28/2023 $750,000 100.00% 49 $348.51 3308 2,135 $809,900 1/30/2023 $750,000 92.60% 183 $351.29 January - June 2023 AVERAGE $759,980 98.52% 148 $363.04 July - December 2022 AVERAGE $859,090 99.33% 46 $410.09 CLOSED - 3 BEDROOM January - June 2023
- 1 BEDROOM January - June 2023
NO PENDINGS as of 6/30/2023
NO CLOSED SALES - January - June 2023

89
Atlanta,
THE LOFTS AT ATLANTIC STATION 231 & 265 18th St NW 232 & 264 19th St NW
GA 30363
Average Sold Price Per Square
N/A Unit Number Square Feet Beds Baths List Date Original List Price List Price List Price per Square Foot 2424 1,552 2 2 6/23/2023 $450,000 $444,900 $286.66 2329 1,937 1 1 4/19/2023 $375,000 $374,500 $193.34
Foot:
ACTIVE as of 6/30/2023

90
Unit Number Square Feet Beds Baths List Date Original List Price List Price List Price per Square Foot 10316 1,586 2 2 6/9/2023 $564,900 $549,900 $346.72 10225 1,608 2 1 6/27/2023 $509,900 $509,900 $317.10 10213 1,094 2 2 4/12/2023 $449,000 $444,999 $406.76 10302 1,270 2 2 6/11/2023 $440,000 $440,000 $346.46 ACTIVE as of 6/30/2023 NO PENDINGS as of 6/30/2023 Average Sold Price Per Square Foot: $352.69 Unit Number Square Feet Original List Price Close Date Sold Price Sold Price/ Original List Price Total Days on Market Sold Price per Square Foot 10315 1,372 $434,900 5/24/2023 $434,900 100.00% 25 $316.98 10314 1,094 $424,900 5/24/2023 $424,900 100.00% 6 $388.39 January - June 2023 AVERAGE $429,900 100.00% 16 $352.69 July - December 2022 AVERAGE $445,000 96.74% 75 $350.39 CLOSED - 2 BEDROOM January - June 2023
DISTRICT LOFTS 260 18th St NW Atlanta, GA 30363

91
Unit Number Square Feet Beds Baths List Date Original List Price List Price List Price per Square Foot 3069 1344 3 2 5/19/2023 $376,000 $376,000 $279.76 4013 1166 2 2 6/16/2023 $349,900 $349,900 $300.09 3021 832 1 1 5/3/2023 $25,400 $254,900 $306.37 4041 868 1 1 6/30/2023 $250,000 $250,000 $288.02 2045 770 1 1 6/20/2023 $249,900 $249,900 $324.55 2059 783 1 1 4/3/2023 $245,000 $235,900 $301.28 ACTIVE as of 6/30/2023 Unit Number Square Feet Beds Baths List Date Original List Price List Price List Price per Square Foot 5049 1596 3 3 6/1/2023 $375,000 $375,000 $234.96 5010 868 1 1 6/24/2023 $230,000 $230,000 $264.98 PENDING as of 6/30/2023 Average old Price Per Square Foot: $263.81
ELEMENT 390 17th St NW Atlanta, GA 30363
92 Unit Number Square Feet Original List Price Close Date Sold Price Sold Price/ Original List Price Total Days on Market Sold Price per Square Foot 4030 868 $245,900 5/11/2023 $245,900 100.00% 25 $283.29 January - June 2023 AVERAGE $245,900 100.00% 25 $283.29 July - December 2022 AVERAGE $235,000 97.66% 22 $286.82
BEDROOM January
Unit Number Square Feet Original List Price Close Date Sold Price Sold Price/ Original List Price Total Days on Market Sold Price per Square Foot 2001 1,166 $299,900 5/18/2023 $310,000 103.37% 3 $265.87 3063 1166 $325,000 4/12/2023 $325,000 100.00% 18 $278.73 5055 1263 $329,000 3/13/2023 $325,000 98.78% 17 $257.32 2066 1263 $375,000 1/30/2023 $325,000 86.67% 182 $257.32 3036 1166 $315,990 4/19/2023 $310,000 98.10% 35 $265.87 4019 1166 $343,000 4/24/2023 $305,000 88.92% 294 $261.58 3005 1263 $319,900 4/11/2023 $300,000 93.78% 72 $237.53 2042 1117 $300,000 3/30/2023 $298,000 99.33% 93 $266.79 January - June 2023 AVERAGE $312,250 96.12% 89 $261.38 July - December 2022 AVERAGE $314,988 98.90% 23 $276.05
CLOSED - 1
- June 2023
CLOSED - 2 BEDROOM January - June 2023
TWELVE ATLANTIC STATION
361 17th St NW Atlanta, GA 30363

93
Unit Number Square Feet Beds Baths List Date Original List Price List Price List Price per Square Foot 1823 1,743 2 2 6/30/2023 $550,000 $550,000 $315.55 1201 1,067 2 2 5/4/2023 $389,900 $389,900 $365.42 2319 830 1 1 6/16/2023 $300,000 $300,000 $361.45 2510 816 1 1 6/15/2023 $290,900 $290,900 $356.50 ACTIVE as of 6/30/2023 Unit Number Square Feet Beds Baths List Date Original List Price List Price List Price per Square Foot 823 1,045 2 2 6/8/2023 $415,000 $415,000 $397.13 909 722 1 1 5/9/2023 $250,000 $232,500 $322.02 821 695 1 1 6/8/2023 $235,000 $225,000 $323.74
as of 6/30/2023 Average Sold Price Per Square Foot: $350.57
PENDING
94 Unit Number Square Feet Original List Price Close Date Sold Price Sold Price/ Original List Price Total Days on Market Sold Price per Square Foot 2307 830 $290,000 3/31/2023 $290,000 100.00% 10 $349.40 2013 832 $299,900 1/31/2023 $289,500 96.53% 140 $347.96 1019 830 $299,000 3/2/2023 $288,000 96.32% 72 $346.99 2318 886 $284,900 2/24/2023 $284,900 100.00% 2 $321.56 1613 832 $299,900 6/26/2023 $282,000 94.03% 56 $338.94 2420 796 $290,000 1/26/2023 $280,000 96.55% 89 $351.76 1720 746 $275,000 3/10/2023 $273,000 99.27% 11 $365.95 809 722 $249,900 4/20/2023 $249,900 100.00% 22 $346.12 1808 690 $249,900 6/28/2023 $224,000 89.64% 30 $324.64 January - June 2023 AVERAGE $273,478 96.93% 48 $343.70 July - December 2022 AVERAGE $280,125 94.60% 53 $357.88 CLOSED - 1 BEDROOM January - June 2023 Unit Number Square Feet Original List Price Close Date Sold Price Sold Price/ Original List Price Total Days on Market Sold Price per Square Foot 1123 1,045 $424,900 4/7/2023 $406,500 95.67% 37 $389.00 2122 1,045 $425,000 2/10/2023 $385,000 90.59% 124 $368.42 1524 1,067 $399,900 5/22/2023 $380,000 95.02% 252 $356.14 January - June 2023 AVERAGE $390,500 93.76% 138 $371.18 July - December 2022 AVERAGE $441,500 94.34% 39 $368.56 CLOSED - 2 BEDROOM January - June 2023

95 WHITE PROVISIONS 1100 Howell Mill Rd NW Atlanta, GA 30318 NO ACTIVES as of 6/30/2023 Average Sold Price Per Square Foot: $353.76 Unit Number Square Feet Original List Price Close Date Sold Price Sold Price/ Original List Price Total Days on Market Sold Price per Square Foot 213 1,218 $440,000 4/27/2023 $440,000 100.00% 7 $361.25 January - June 2023 AVERAGE $440,000 100.00% 7 $361.25 July - December 2022 AVERAGE $489,250 97.04% 16 $353.76 CLOSED - 2 BEDROOM January - June 2023 Unit Number Square Feet Beds Baths List Date Original List Price List Price List Price per Square Foot 711 1,256 2 2 6/1/2023 $469,000 $469,000 $373.41 411 1,256 2 2 6/12/2023 $464,000 $464,000 $369.43 PENDINGS as of 6/30/2023 Unit Number Square Feet Original List Price Close Date Sold Price Sold Price/ Original List Price Total Days on Market Sold Price per Square Foot 910 2,498 $1,115,000 6/13/2023 $865,000 77.58% 225 $346.28 January - June 2023 AVERAGE $865,000 77.58% 225 $346.28 July - December 2022 AVERAGE N/A N/A N/A N/A CLOSED - 3 BEDROOM January - June 2023
Data and most photos are from the First Multiple Listing Service. Information is deemed to be accurate but is not warranted. Please note that in many “new construction” condominium projects or buildings being converted to condominiums, not all sales are reported in FMLS. We are only reporting sales included in FMLS. This research is on 57 buildings in and around Midtown, but is not exhaustive.
If you are interested in receiving more information on additional properties or need help pricing your home, please contact your Atlanta Intown Agent, call 404.881.1810 or email brokers@atlantaintown.com .
96


/AtlantaIntownRE @AtlantaIntownRE @AtlantaIntown @AtlantaIntown RealEstateServices ©2022 Atlanta Intown Real Estate Services. All rights reserved. Atlanta Intown Real Estate Services is an Equal Opportunity Employer and support the Fair Housing Act. All information and photography was procured through FMLS® Information is deemed to be accurate but is not warranted. MAIN OFFICE: 181 10th St NE | Atlanta GA 30309 | 404.881.1810 atlantaintown.com KIRKWOOD OFFICE: 1963 Hosea Williams Dr SE | Atlanta GA 30317 | 404.370.3101
