BUCKHEAD
10 TERMINUS 2500 PEACHTREE 2828 PEACHTREE THE ARAMORE THE ASTORIA THE BORGHESE THE BROOKWOOD BROOKWOOD PLACE BUCKHEAD GRAND BUCKHEAD VILLAGE LOFTS CARRINGTON PARK THE CHARLES COSMOPOLITAN AT LINDBERGH ECLIPSE GALLERY THE GRANDVIEW THE GRAYDON BUCKHEAD HERITAGE PLACE MANOR HOUSE MATHIESON EXCHANGE MERIDIAN BUCKHEAD OVATION PACES 325


PARAMOUNT AT BUCKHEAD PARK AVENUE
PARK PLACE ON PEACHTREE PARK REGENCY
THE PEACHTREE RESIDENCES PHOENIX ON PEACHTREE PLAZA TOWERS REALM
THE RITZ CARLTON RESIDENCES SOVEREIGN ST REGIS RESIDENCES
THE VIEW AT CHASTAIN WALDORF ASTORIA THE WINSTON
4

5 1 10 Terminus 16 The Grandview 31 Realm 2 2500 Peachtree 17 The Graydon Buckhead 32 The Ritz Carlton Residences 3 2828 Peachtree 18 Heritage Place 33 Sovereign 4 The Aramore 19 Manor House 34 St Regis Residences 5 The Astoria 20 Mathieson Exchange 35 The View At Chastain 6 The Borghese 21 Meridian Buckhead 36 Waldorf Astoria 7 The Brookwood 22 Ovation 37 The Winston 8 Brookwood Place 23 Paces 325 9 Buckhead Grand 24 Paramount At Buckhead 10 Buckhead Village Lofts 25 Park Avenue 11 Carrington Park 26 Park Place On Peachtree 12 The Charles 27 Park Regency 13 Cosmopolitan At Lindbergh 28 The Peachtree Residences 14 Eclipse 29 Phoenix On Peachtree 15 Gallery 30 Plaza Towers 18 30 28 25 11 1 20 21 22 13 14 8 12 24 27 15 26 3 16 2 19 23 10 6 31 32 37 29 17 34 35 33 9 5 4 7 36
97.10% 61
Buckhead Village Lofts 104 1999 $0.50 18 $472,103 93.69% 103 20 $453,370 97.15% 43
Carrington Park 140 2000 $0.31 18 $214,161 98.81% 26 15 $262,300 102.00% 19
The Charles 56 2019 $0.82 7 $2,234,110 96.62% 157 2 $2,950,000 93.80% 113
Cosmopolitan At Lindbergh 244 2009 $0.35 31 $264,165 97.06% 41 16 $302,850 97.48% 10 Eclipse 325 2004 $0.46 54 $300,727 95.88% 87 45 $343,571 98.28% 40 Gallery 203 2007 $0.47 28 $654,063 95.65% 151 13 $633,538 94.48% 53
The Grandview 226 1990 $0.45 20 $268,508 94.37% 88 18 $311,472 100.01% 19
Heritage Place 89 1997 $0.44 7 $383,557 97.54% 27 8 $408,518 98.03% 75
Manor House 94 2002 $0.48 10 $352,184 95.72% 39 14 $370,607 99.04% 43
Mathieson Exchange 95 2001 $0.47 14 $522,307 94.09% 61 11 $621,250 92.63% 80


6 Buckhead Condo Overview Building Total Units Year Built HOA/ Square Foot Total Closings Avg sales Price Avg SP/ OLP Total Days on Market Total Closings Avg sales Price Avg SP/OLP Total Days on Market 10 Terminus
19 $612,337
98 22 $858,916
76
6
188 4
130
7
4
25
7
65 18
26
42 11
29
137 2008 $0.64
94.72%
94.58%
2500 Peachtree 59 2000 $0.61
$1,187,667 89.79%
$1,393,813 89.45%
2828 Peachtree 79 2002 $0.55
$721,664 95.31% 63
$419,750 95.98%
The Aramore 124 2003 $0.54
$257,271 98.57%
$289,800 97.57%
The Astoria 69 2009 $0.45 4 $715,000 98.95%
$609,309 97.74% 34 The Borghese 55 2001 $0.85 1 $630,000 96.92% 214 2 $1,052,500 94.11%
The Brookwood 219 2010 $0.44 28 $649,911 97.57% 75 18 $681,167 95.26% 62 Brookwood Place 286 2004 $0.39 11 $394,309 96.98% 49 10 $405,525 99.45% 22 Buckhead Grand 137 2000 $0.44 39 $377,221 97.51% 82 18 $420,517
The Graydon Buckhead 45 2021 $0.81 N/A N/A N/A N/A 15 $3,454,865 103.59% 147
Meridian Buckhead 232 1997 $0.46 23 $282,471 97.14% 81 23 $352,974 99.14% 59 Ovation 267 2006 $0.48 37 $292,468 93.15% 94 28 $307,657 97.03% 55 Paces 325 206 2004 $0.44 31 $294,240 97.32% 76 26 $387,581 99.00% 29 2021 2022
Building
Paramount At Buckhead 300 2006 $0.47 39 $351,546 95.26% 73 34 $445,004 97.05% 59
Park Avenue 123 1999 $0.63 4 $1,171,875 91.13% 99 9 $981,111 94.18% 106
Park Place On Peachtree 140 1987 $0.57 13 $1,066,423 93.34% 61 11 $1,193,000 90.35% 140
Park Regency 63 2001 $0.59 7 $573,714 93.74% 162 10 $531,603 98.27% 56
The Peachtree Residences 121 2001 $0.62 13 $273,758 97.80% 65 6 $350,833 100.20% 29
Phoenix On Peachtree 63 2001 $0.58 5 $525,580 97.10% 184 7 $813,286 96.94% 52
Plaza Towers 176 1969 $0.90 10 $528,831 88.60% 183 11 $576,552 90.93% 150
Realm 406 2005 $0.49 56 $309,083 96.72% 70 40 $357,626 99.78% 27
The Ritz Carlton Residences 126 2010 $0.90 21 $1,317,238 91.13% 133 8 $1,057,500 93.42% 40
Sovereign 82 2008 $1.08 4 $2,158,750 93.93% 78 5 $1,457,500 89.49% 129
St Regis Residences 53 2010 $0.90 3 $5,683,333 96.32% 165 3 $5,050,000 94.69% 81
The View At Chastain 125 2005 $0.49 13 $301,607 96.51% 64 11 $382,364 98.78% 33
Waldorf Astoria 45 2008 $0.81 5 $1,695,000 82.91% 494 8 $2,188,750 83.85% 197
The Winston 36 2001 $0.66 2 $711,000 98.53% 30 2 $890,000 91.82% 175

7
Total Units Year Built
Square Foot Total Closings Avg sales Price Avg SP/ OLP Total Days on Market Total Closings Avg sales Price Avg SP/OLP Total Days on Market
HOA/
2021 2022

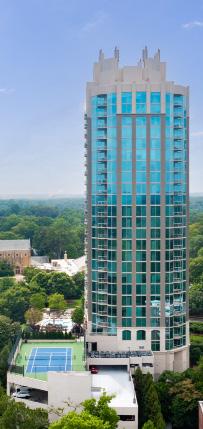
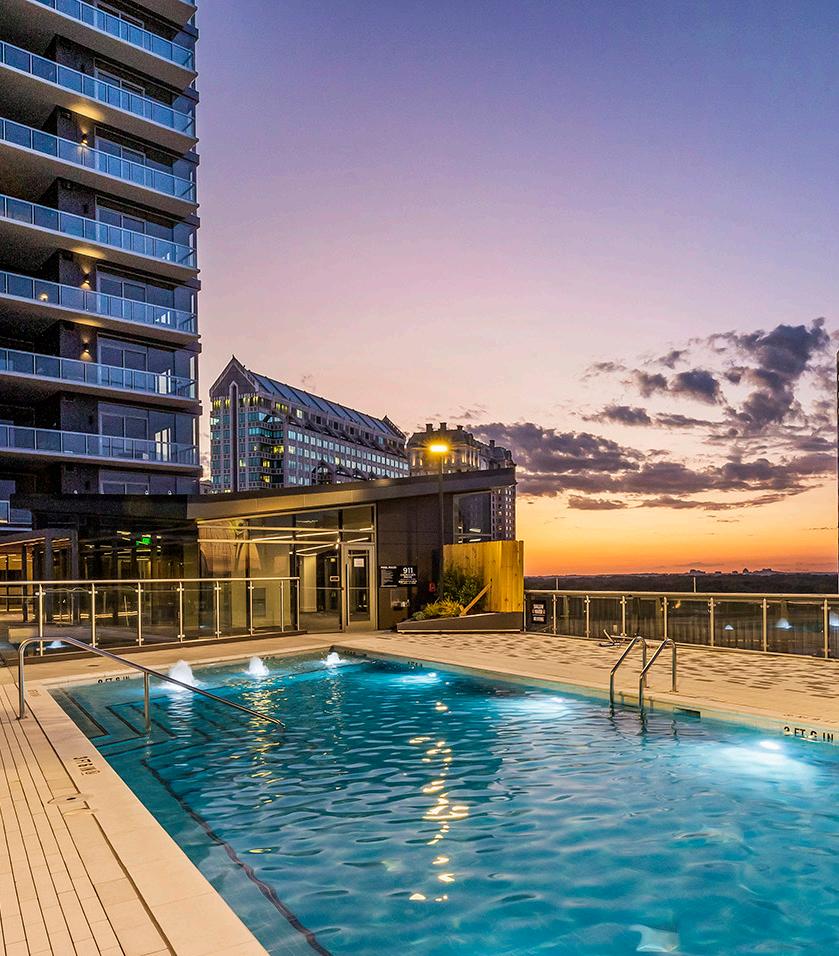
8 10 TERMINUS 3325 Piedmont Rd NE Atlanta, GA 30305 Unit Number Square Feet Beds Baths List Date Original List Price List Price List Price per Square Foot 2402
2 3
$798,900
2504
2 2
1708
1 1
1 1
1510
1 1
ACTIVE as of 12/31/2022 NO PENDINGS as of 12/31/2022 Average Sold Price Per Square Foot: $421.27 Unit Number Square Feet Original List Price Close Date Sold Price Sold Price/ Original List Price Total Days on Market Sold Price per Square Foot 2004 1,120 $489,000 8/18/2022 $447,000 91.41% 58 $399.11 1809 930 $485,000 7/15/2022 $385,000 79.38% 63 $413.98 2002 787 $359,000 7/22/2022 $359,000 100.00% 4 $456.16 July - December 2022 AVERAGE $397,000 90.26% 42 $423.08 January - June 2022 AVERAGE $421,500 98.01% 82 $408.99 CLOSED - 1 BEDROOM July - December 2022
1,932
11/3/2022
$798,900 $413.51
1,568
8/16/2022 $745,000 $745,000 $475.13
928
8/14/2022 $415,000 $399,900 $430.93 1810 930
12/1/2022 $369,900 $369,900 $397.74
930
11/2/2022 $375,000 $369,000 $396.77
9 Unit Number Square Feet Original List Price Close Date Sold Price Sold Price/ Original List Price Total Days on Market Sold Price per Square Foot 3002 2,762 $1,325,000 11/16/2022 $1,325,000 100.00% 9 $479.72 July - December 2022 AVERAGE $1,325,000 100.00% 9 $479.72 January - June 2022 AVERAGE $1,247,956 94.41% 115 $433.95 CLOSED - 3 BEDROOM July - December 2022 Unit Number Square Feet Original List Price Close Date Sold Price Sold Price/ Original List Price Total Days on Market Sold Price per Square Foot 2702 1,932 $789,000 10/14/2022 $777,500 98.54% 59 $402.43 1702 1,932 $815,000 11/28/2022 $760,000 93.25% 57 $393.37 2507 1,262 $599,000 8/26/2022 $510,000 85.14% 68 $404.12 July - December 2022 AVERAGE $682,500 92.31% 61 $399.98 January - June 2022 AVERAGE $701,200 96.37% 55 $408.52 CLOSED - 2 BEDROOM July - December 2022

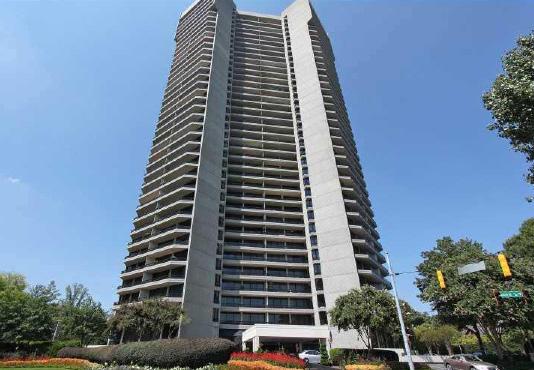
10 2500 PEACHTREE 2500 Peachtree Rd NW Atlanta, GA 30305 Unit Number Square Feet Original List Price Close Date Sold Price Sold Price/ Original List Price Total Days on Market Sold Price per Square Foot 104N 2,157 $750,000 9/15/2022 $690,000 92.00% 74 $319.89 July - December 2022 AVERAGE $690,000 92.00% 74 $319.89 January - June 2022 AVERAGE $1,135,000 90.80% 148 $435.53 CLOSED - 2 BEDROOM July - December 2022 NO ACTIVES as of 12/31/2022 Average Sold Price Per Square Foot: $406.74 Unit Number Square Feet Beds Baths List Date Original List Price List Price List Price per Square Foot 607S 2,261 2 2 10/27/2022 $1,095,000 $1,095,000 $484.30 PENDING as of 12/31/2022 Unit Number Square Feet Original List Price Close Date Sold Price Sold Price/ Original List Price Total Days on Market Sold Price per Square Foot 402N 3,080 $1,599,000 11/22/2022 $1,520,250 95.08% 88 $493.59 July - December 2022 AVERAGE $1,520,250 95.08% 88 $493.59 January - June 2022 AVERAGE $2,230,000 79.93% 208 $504.98 CLOSED - 3 BEDROOM July - December 2022

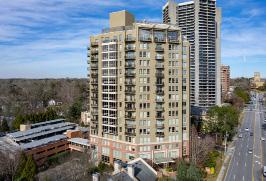
11 2828 PEACHTREE 2828 Peachtree Rd NW Atlanta, GA 30305 Unit Number Square Feet Original List Price Close Date Sold Price Sold Price/ Original List Price Total Days on Market Sold Price per Square Foot 1802 1,371 $472,500 8/10/2022 $440,000 93.12% 60 $320.93 1404 1,094 $399,000 11/3/2022 $399,000 100.00% 10 $364.72 1003 1,094 $429,000 11/18/2022 $380,000
20 $347.35 July - December 2022 AVERAGE $406,333 93.90% 30 $344.33 January - June 2022 AVERAGE $460,000 102.22% 9 $335.52 CLOSED - 2 BEDROOM July - December 2022 NO ACTIVES OR PENDINGS as of 12/31/2022 Average Sold Price Per Square Foot: $344.33
88.58%

12 THE ARAMORE 2255 & 2277 Peachtree Rd NE Atlanta, GA 30309 Unit Number Square Feet Beds Baths List Date Original List Price List Price List Price per Square Foot 522 930 2 2 12/16/2022 $325,000 $325,000 $349.46 411 737 1 1 10/20/2022 $245,000 $245,000 $332.43 ACTIVE as of 12/31/2022 NO PENDINGS as of 12/31/2022 Unit Number Square Feet Original List Price Close Date Sold Price Sold Price/ Original List Price Total Days on Market Sold Price per Square Foot 608 852 $280,000 7/8/2022 $275,000 98.21% 52 $322.77 403 751 $250,000 9/22/2022 $242,000 96.80% 34 $322.24 July - December 2022 AVERAGE $258,500 97.51% 43 $322.50 January - June 2022 AVERAGE $241,233 101.24% 22 $314.71 CLOSED - 1 BEDROOM July - December 2022 Average Sold Price Per Square Foot: $291.31
13 Unit Number Square Feet Original List Price Close Date Sold Price Sold Price/ Original List Price Total Days on Market Sold Price per Square Foot 828 1,511 $399,900 8/23/2022 $385,000
23 $254.80 604 1,281 $365,000 9/23/2022 $340,000
35
July - December 2022 AVERAGE $362,500 94.71% 29
January - June 2022 AVERAGE $315,875 95.55% 24 $265.35 CLOSED - 2 BEDROOM July - December 2022
96.27%
93.15%
$265.42
$260.11

THE ASTORIA 2233 Peachtree Rd NE Atlanta, GA 30309 Unit Number Square Feet Beds Baths List Date Original List Price List Price List Price per Square Foot 1101 3,167 3 3 12/2/2022 $1,695,000 $1,695,000 $535.21 802 1,794 2 2 9/30/2022 $650,000 $625,000 $348.38 ACTIVE as of 12/31/2022 NO PENDINGS as of 12/31/2022 14 Average Sold Price Per Square Foot: $370.70 Unit Number Square Feet Original List Price Close Date Sold Price Sold Price/ Original List Price Total Days on Market Sold Price per Square Foot Penthouse 1503 2,332 $1,095,500 11/21/2022 $995,000 90.83% 58 $426.67 804 1,849 $689,900 10/7/2022 $685,000 99.29% 8 $370.47 501 1,940 $645,000 8/29/2022 $611,000 94.73% 82 $314.95 July - December 2022 AVERAGE $763,667 94.95% 49 $370.70 January - June 2022 AVERAGE $600,233 98.59% 35 $339.73 CLOSED - 2 BEDROOM July - December 2022

15 THE BORGHESE 3286 Northside Pkwy NW Atlanta, GA 30327 ACTIVE as of 12/31/2022 Average Sold Price Per Square Foot: N/A NO PENDINGS as of 12/31/2022 Unit Number Square Feet Beds Baths List Date Original List Price List Price List Price per Square Foot 807
3 3 3/25/2022 $1,495,000 $1,195,000 $294.70 407
3 3 11/10/2022 $1,150,000 $1,150,000
901
3 3 8/26/2022 $975,000
604
2 2 9/8/2022 $850,000
NO CLOSED SALES July - December 2022
4,055
3,866
$297.47
2,779
$905,000 $325.66
2,223
$799,000 $359.42

16 THE BROOKWOOD 1820 Peachtree Rd Atlanta, GA 30309 Unit Number Square Feet Beds Baths List Date Original List Price List Price List Price per Square Foot 1509 1,689 2 3 12/19/2022 $699,000 $699,000
311 1,264 2 2 6/28/2022 $695,000
ACTIVE as of 12/31/2022 Unit Number Square Feet Beds Baths List Date Original List Price List Price List Price per Square Foot 606 1,235 2 2 8/31/2022 $550,000 $550,000 $445.34 1608 1,728 2 2 10/12/2022 $745,000
1114 1,709 3 3 8/16/2022 $748,500
PENDING as of 12/31/2022 Average Sold Price Per Square Foot: $393.54
$413.85
$640,000 $506.33
$729,900 $422.40
$696,000 $407.26
17 Unit Number Square Feet Original List Price Close Date Sold Price Sold Price/ Original List Price Total Days on Market Sold Price per Square Foot 1001 2,527 $995,000 12/20/2022 $975,000 97.99% 7 $385.83 907 1,700 $699,900 12/14/2022 $668,000 95.44% 23 $392.94 614 1,719 $684,000 8/18/2022 $650,000
86
312 1,889 $674,900 8/17/2022 $610,000
137
July - December 2022 AVERAGE $725,750 94.71% 63 $369.96 January - June 2022 AVERAGE $701,200
77
CLOSED - 3 BEDROOM July - December 2022 Unit Number Square Feet Original List Price Close Date Sold Price Sold Price/ Original List Price Total Days on Market Sold Price per Square Foot 805 1,391 $699,900 7/22/2022 $645,000 92.16% 48 $463.70 303 1,381 $600,000 9/15/2022 $555,000
53
404 1,521 $550,000 8/19/2022 $540,000
3
611 1,189 $599,000 8/26/2022 $532,500
111
July - December 2022 AVERAGE $568,125
54 $417.12 January - June 2022 AVERAGE $715,900
53 $423.44 CLOSED - 2 BEDROOM July - December 2022
95.03%
$378.13
90.38%
$322.92
96.14%
$400.64
92.50%
$401.88
98.18%
$355.03
88.90%
$447.86
92.93%
96.67%

Unit Number Square Feet Beds Baths List Date Original List Price List Price List Price per Square Foot 524 1,693 2 2 11/1/2022 $510,000 $499,900 $295.27 PENDING as of 12/31/2022 BROOKWOOD PLACE 1735 Peachtree St NE Atlanta, GA 30309 Unit Number Square Feet Beds Baths List Date Original List Price List Price List Price per Square Foot 225 1,355 2 2 11/1/2022 $400,000 $400,000 $295.20 312 1,355 2 2 9/21/2022 $385,000 $385,000 $284.13 ACTIVE as of 12/31/2022 18 Average Sold Price Per Square Foot: $315.13 Unit Number Square Feet Original List Price Close Date Sold Price Sold Price/ Original List Price Total Days on Market Sold Price per Square Foot 522 1,355 $430,000 10/11/2022 $427,000 99.30% 15 $315.13 July - December 2022 AVERAGE $427,000 99.30% 15 $315.13 January - June 2022 AVERAGE $406,042 100.64% 10 $251.56 CLOSED - 2 BEDROOM July - December 2022

19 Unit Number Square Feet Beds Baths List Date Original List Price List Price List Price per Square Foot 2501 1,429 2 2 11/9/2022 $509,900 $509,000 $356.19 707 1,270 2 2 8/18/2022 $469,500 $429,000 $337.80 703 1,002 1 1 11/18/2022 $308,000 $303,000 $302.40 906 997 1 1 12/29/2022 $300,000 $300,000 $300.90 ACTIVE as of 12/31/2022 BUCKHEAD GRAND 3338 Peachtree Rd NE Atlanta, GA 30326 NO PENDINGS as of 12/31/2022 Average Sold Price Per Square Foot: $337.86 Unit Number Square Feet Original List Price Close Date Sold Price Sold Price/ Original List Price Total Days on Market Sold Price per Square Foot 3208 936 $324,900 10/27/2022 $317,000 97.57% 2 $338.68 910 936 $294,900 7/7/2022 $294,900 100.00% 21 $315.06 1405 800 $265,000 7/22/2022 $260,000 98.11% 13 $325.00 July - December 2022 AVERAGE $290,633 98.56% 12 $326.25 January - June 2022 AVERAGE $254,350 95.43% 119 $285.38 CLOSED - 1 BEDROOM July - December 2022
20 Unit Number Square Feet Original List Price Close Date Sold Price Sold Price/ Original List Price Total Days on Market Sold Price per Square Foot 2101 1,429 $509,500 8/19/2022 $499,500 98.04% 55 $349.55 902 1,266 $440,000 8/19/2022 $415,000 94.32% 78 $327.80 July - December 2022 AVERAGE $457,250 96.18% 67 $338.67 January - June 2022 AVERAGE $501,500 98.06% 53 $338.29 CLOSED - 2 BEDROOM July - December 2022 Unit Number Square Feet Original List Price Close Date Sold Price Sold Price/ Original List Price Total Days on Market Sold Price per Square Foot 2805 1,682 $675,000 11/3/2022 $650,000 96.30% 19 $386.44 2105 1,876 $635,000 8/24/2022 $605,000 95.28% 56 $322.49 July - December 2022 AVERAGE $627,500 95.79% 38 $354.47 January - June 2022 AVERAGE N/A N/A N/A N/A CLOSED - 3 BEDROOM July - December 2022

21 Unit Number Square Feet Beds Baths List Date Original List Price List Price List Price per Square Foot 604 1,360 2 2 10/26/2022 $489,000 $489,000 $359.56 ACTIVE as of 12/31/2022 BUCKHEAD VILLAGE LOFTS 3235 Roswell Rd NE Atlanta, GA 30305 NO PENDING Sas of 12/31/2022 Average Sold Price Per Square Foot: $377.24 Unit Number Square Feet Original List Price Close Date Sold Price Sold Price/ Original List Price Total Days on Market Sold Price per Square Foot 709 1,230 $349,900 $349,900 $355,000 101.46% 9 $288.62 July - December 2022 AVERAGE $355,000 101.46% 9 $288.62 January - June 2022 AVERAGE $325,857 97.43% 60 $310.21 CLOSED - 1 BEDROOM July - December 2022
22 Unit Number Square Feet Original List Price Close Date Sold Price Sold Price/ Original List Price Total Days on Market Sold Price per Square Foot 1000 2,435 $1,295,000 7/20/2022 $1,212,500 93.63% 3 $497.95 704 1,360 $532,000 8/19/2022 $500,000 93.98% 28 $367.65 July - December 2022 AVERAGE $856,250 93.81% 16 $432.80 January - June 2022 AVERAGE $435,433 97.84% 43 $345.53 CLOSED - 2 BEDROOM July - December 2022 Unit Number Square Feet Original List Price Close Date Sold Price Sold Price/ Original List Price Total Days on Market Sold Price per Square Foot 511 2,255 $875,000 12/2/2022 $800,000 91.43% 7 $354.77 July - December 2022 AVERAGE $800,000 91.43% 7 $354.77 January - June 2022 AVERAGE N/A N/A N/A N/A CLOSED - 3 BEDROOM July - December 2022

23 CARRINGTON PARK 2700 Pine Tree Rd NE Atlanta, GA 30324 Unit Number Square Feet Original List Price Close Date Sold Price Sold Price/ Original List Price Total Days on Market Sold Price per Square Foot 1203 784 $220,000 10/20/2022 $230,000 104.55% 7 $293.37 2317 748 $215,000 7/20/2022 $230,000 106.98% 2 $307.49 July - December 2022 AVERAGE $230,000 105.76% 5 $300.43 January - June 2022 AVERAGE $216,667 107.37% 8 $280.96 CLOSED - 1 BEDROOM July - December 2022 Average Sold Price Per Square Foot: $271.19 NO ACTIVES as of 12/31/2022 Unit Number Square Feet Beds Baths List Date Original List Price List Price List Price per Square Foot 1107 784 1 1 12/16/2022 $218,000 $218,000 $278.06 PENDING as of 12/31/2022 Unit Number Square Feet Original List Price Close Date Sold Price Sold Price/ Original List Price Total Days on Market Sold Price per Square Foot 2301 1,337 $315,000 7/22/2022 $321,000 101.90% 2 $240.09 1217 1,130 $290,000 11/23/2022 $275,500 95.00% 60 $243.81 July - December 2022 AVERAGE $298,250 98.45% 31 $241.95 January - June 2022 AVERAGE $275,000 99.79% 26 $237.20 CLOSED - 2 BEDROOM July - December 2022

24 THE CHARLES 3107 Peachtree Road NE Atlanta, GA 30305 Unit Number Square Feet Beds Baths List Date Original List Price List Price List Price per Square Foot PH3 4,527 4 3 9/15/2022 $5,500,000 $5,500,000 $1,214.93 902 3,867 3 3 12/9/2022 $3,000,000 $3,000,000 $775.80 1201 3,290 3 3 10/20/2022 $2,895,000 $2,895,000 $879.94 1703 2,617 2 2 9/9/2022 $2,495,000 $2,495,000 $953.38 ACTIVE as of 12/31/2022 Unit Number Square Feet Beds Baths List Date Original List Price List Price List Price per Square Foot 804 4,996 4 4 10/12/2022 $3,750,000 $3,750,000 $750.60 PENDING as of 12/31/2022 Average Sold Price Per Square Foot: $967.35 Unit Number Square Feet Original List Price Close Date Sold Price Sold Price/ Original List Price Total Days on Market Sold Price per Square Foot 1905 2,481 $2,400,000 10/28/2022 $2,400,000 100.00% 16 $967.35 July - December 2022 AVERAGE $2,400,000 100.00% 16 $967.35 January - June 2022 AVERAGE N/A N/A N/A N/A CLOSED - 2 BEDROOM July - December 2022 *NEW CONSTRUCTION BUILDING *New construction buildings may have more sales than reported in FMLS

25 NO PENDINGS as of 12/31/2022 COSMOPOLITAN AT LINDBERGH 711 Cosmopolitan Dr NE Atlanta, GA 30324 Average Sold Price Per Square Foot: $293.01 Unit Number Square Feet Original List Price Close Date Sold Price Sold Price/ Original List Price Total Days on Market Sold Price per Square Foot 120 974 $250,000 10/17/2022 $255,000 102.00% 4 $261.81 TL1 855 $248,000 11/14/2022 $249,000 100.40% 3 $291.23 TL8 855 $250,000 7/5/2022 $248,100 99.24% 22 $290.18 123 671 $215,000 8/18/2022 $215,000 100.00% 1 $320.42 July - December 2022 AVERAGE $241,775 100.41% 8 $290.91 January - June 2022 AVERAGE $243,833 91.31% 4 $297.76 CLOSED - 1 BEDROOM July - December 2022 Unit Number Square Feet Beds Baths List Date Original List Price List Price List Price per Square Foot 502 901 1 1 11/9/2022 $285,000 $275,000 $305.22 ACTIVE as of 12/31/2022
107 1,489 $385,000 7/29/2022 $385,000 100.00% 6 $258.56 800 1,061 $350,000 9/26/2022 $340,000 97.14% 31 $320.45 812 1,082 $375,000 7/20/2022 $335,000 89.33% 19 $309.61 326 1,061 $335,000 7/29/2022 $332,000 99.10% 20 $312.91 138 1,195 $345,000 10/17/2022 $325,000 94.20% 3 $271.97
26 Unit Number Square Feet Original List Price Close Date Sold Price Sold Price/ Original List Price Total Days on Market Sold Price per Square Foot
July - December 2022 AVERAGE
January - June 2022 AVERAGE
CLOSED - 2 BEDROOM July - December 2022
$343,400 95.96% 16 $294.70
$357,500 101.08% 8 $313.87
2005 1,158 2 2 8/19/2022 $422,900 $422,900 $365.20 1601 1,056 2 2 5/7/2022 $425,000 $412,000 $390.15 709 1,003 2 2 7/31/2022 $395,000 $380,000 $378.86 305 1,158 2 2 12/20/2022 $359,900 $359,900 $310.79 1907 762 1 1 10/6/2022 $322,000 $315,000 $413.39 212 779 1 1 12/2/2022 $310,000 $310,000 $397.95 1204 867 1 1 10/11/2022 $310,000 $310,000 $357.55 1212 779 1 1 8/10/2022 $324,999 $294,999 $378.69 601 827 1 1 11/18/2022 $279,900 $279,900 $338.45 404 790 1 1 12/15/2022 $299,900 $264,900 $335.32

Number Square Feet Beds Baths List Date
List Price List Price List Price per Square Foot
ACTIVE as of 12/31/2022 ECLIPSE
Unit Number Square Feet Beds Baths List Date Original List Price List Price List Price per Square Foot
PENDING as of 12/31/2022 27
Unit
Original
250 Pharr Rd NE Atlanta, GA 30305 Average Sold Price Per Square Foot: $353.27
604 790 1 1 7/21/2022 $305,000 $289,000 $365.82
2015 779 $339,900 7/15/2022 $339,900 100.00% 6 $436.33 1015 779 $300,000 9/16/2022 $302,000 100.67% 32 $387.68 1314 791 $300,000 7/29/2022 $300,000 100.00% 8 $379.27 1814 792 $320,000 10/11/2022 $299,900 93.72% 96 $378.66 804 790 $279,000 8/31/2022 $284,000 101.79% 4 $359.49 616 797 $279,900 12/19/2022 $265,000 94.68% 28 $332.50
918 1,427 $475,000 11/10/2022 $465,000 97.89% 14 $325.86 1005 1,158 $419,900 11/23/2022 $419,900 100.00% 13 $362.61 413 1,233 $414,000 12/8/2022 $410,000 99.03% 68 $332.52 318 1,427 $449,000 7/15/2022 $407,000 90.65% 91 $285.21 210 1,060 $395,000 8/17/2022 $405,000 102.53% 6 $382.08 1109 1,003 $415,000 7/7/2022 $390,000 93.98% 103 $388.83 513 1,233 $385,000 10/17/2022 $380,000 98.70% 4 $308.19 405 1,274 $372,000 7/1/2022 $365,000 98.12% 21 $286.50 July - December 2022
28 Unit Number Square Feet Original List Price Close Date Sold Price Sold Price/ Original List Price Total Days on Market Sold Price per Square Foot
July - December 2022 AVERAGE
CLOSED - 1 BEDROOM July - December 2022 Unit Number Square Feet Original List Price Close Date Sold Price Sold Price/ Original List Price Total Days on Market Sold Price per Square Foot
BEDROOM July
$298,467 98.48% 29 $378.99 January - June 2022 AVERAGE $281,781 99.61% 29 $362.30
AVERAGE $405,238 97.61% 40 $333.98 January - June 2022 AVERAGE $398,536 96.84% 60 $358.82 CLOSED - 2
- December 2022

Unit Number Square Feet Beds Baths List Date Original List Price List Price List Price per Square Foot 503 1,389 2 2 11/17/2022 $589,000 $589,000 $424.05 2103 1,389 2 2 11/10/2022 $519,900 $519,900 $374.30 ACTIVE as of 12/31/2022 GALLERY 2795 Peachtree Rd Atlanta, GA 30305 Unit Number Square Feet Beds Baths List Date Original List Price List Price List Price per Square Foot 707 1,364 1 2 5/18/2022 $495,000 $450,000 $329.91 PENDING as of 12/31/2022 29 Average Sold Price Per Square Foot: $364.45 Unit Number Square Feet Original List Price Close Date Sold Price Sold Price/ Original List Price Total Days on Market Sold Price per Square Foot 1804 1,939 $829,900 11/14/2022 $740,000 89.17% 128 $381.64 607 1,364 $440,000 11/29/2022 $408,000 92.73% 35 $299.12 July - December 2022 AVERAGE $574,000 90.95% 82 $340.38 January - June 2022 AVERAGE N/A N/A N/A N/A CLOSED - 1 BEDROOM July - December 2022
30 Unit Number Square Feet Original List Price Close Date Sold Price Sold Price/ Original List Price Total Days on Market Sold Price per Square Foot 1904 1,939 $800,000 12/19/2022 $800,000 100.00% 22 $412.58 July - December 2022 AVERAGE $800,000 100.00% 22 $412.58 January - June 2022 AVERAGE $602,556 94.41% 51 $361.96 CLOSED - 2 BEDROOM July - December 2022

THE GRANDVIEW 3481 Lakeside Dr NE Atlanta, GA 30326 Unit Number Square Feet Beds Baths List Date Original List Price List Price List Price per Square Foot TS4 1,614 2 2 11/28/2022 $725,000 $725,000 $449.19 ACTIVE as of 12/31/2022 PENDING as of 12/31/2022 31 Average Sold Price Per Square Foot: $294.04 Unit Number Square Feet Original List Price Close Date Sold Price Sold Price/ Original List Price Total Days on Market Sold Price per Square Foot 2801 950 $250,000 7/28/2022 $262,000 104.80% 4 $275.79 1005 750 $259,900 10/11/2022 $255,000 98.11% 21 $340.00 2501 950 $230,000 8/12/2022 $245,000 106.52% 6 $257.89 2105 750 $235,000 8/29/2022 $235,000 100.00% 1 $313.33 July - December 2022 AVERAGE $249,250 102.36% 8 $296.75 January - June 2022 AVERAGE $235,000 95.92% 30 $278.95 CLOSED - 1 BEDROOM July - December 2022 Unit Number Square Feet Beds Baths List Date Original List Price List Price List Price per Square Foot 1607 1,230 2 2 7/29/2022 $385,000 $365,000 $296.75
2602 1,265 $392,500 9/9/2022 $385,000 98.09% 8 $304.35 1202 1,230 $375,000 11/8/2022 $367,000 97.87% 7 $298.37 1807 1,230 $365,000 12/22/2022 $365,000 100.00% 55 $296.75 1802 1,230 $375,000 8/31/2022 $365,000 97.33% 99 $296.75 1308 950 $250,000 7/15/2022 $250,000 100.00% 4 $263.16
$346,400 98.66% 35 $291.88
32 Unit Number Square Feet Original List Price Close Date Sold Price Sold Price/ Original List Price Total Days on Market Sold Price per Square Foot
July - December 2022 AVERAGE
January - June 2022 AVERAGE
CLOSED - 2 BEDROOM July - December 2022
$343,929 100.80% 10 $285.78

33 THE GRAYDON BUCKHEAD 2520 Peachtree Road Atlanta, GA 30305 Unit Number Square Feet Beds Baths List Date Original List Price List Price List Price per Square Foot 1701 3,510 3 3 12/28/2022 $4,250,000 $4,250,000 $1,210.83 1201 2,560 2 3 10/27/2022 $2,559,000 $2,559,000 $999.61 1402 2,170 2 3 10/27/2022 $2,149,000 $2,149,000 $990.32 401 2,560 2 3 12/16/2022 $1,939,000 $1,939,000 $757.42 ACTIVE as of 12/31/2022 NO PENDINGS as of 12/31/2022 Average Sold Price Per Square Foot: $959.16 Unit Number Square Feet Original List Price Close Date Sold Price Sold Price/ Original List Price Total Days on Market Sold Price per Square Foot 702 2,170 $1,749,000 9/29/2022 $1,924,000 110.01% 221 $886.64 1002 2,170 $2,100,000 11/4/2022 $1,875,000 89.29% 36 $864.06 July - December 2022 AVERAGE $1,899,500 99.65% 129 $875.35 January - June 2022 AVERAGE $1,971,167 103.23% 196 $827.64 CLOSED - 2 BEDROOM July - December 2022 *NEW CONSTRUCTION BUILDING
34 Unit Number Square Feet Original List Price Close Date Sold Price Sold Price/ Original List Price Total Days on Market Sold Price per Square Foot 1601 3,510 $3,599,000 7/1/2022 $3,955,000 109.89% 65 $1,126.78 July - December 2022 AVERAGE $3,955,000 109.89% 65
January - June 2022 AVERAGE $3,339,831
121 $978.95 CLOSED - 3 BEDROOM July - December 2022 *New construction buildings may have more sales than reported in FMLS
$1,126.78
104.66%

35 HERITAGE PLACE
Colonial Homes Dr NW Atlanta, GA 30309 NO ACTIVES OR PENDINGS as of 12/31/2022 Unit Number Square Feet Original List Price Close Date Sold Price Sold Price/ Original List Price Total Days on Market Sold Price per Square Foot
July - December 2022 AVERAGE
27
January - June 2022 AVERAGE $392,333
156
CLOSED - 2 BEDROOM July - December 2022 Average Sold Price Per Square Foot: $264.07
211
1107 1,693 $470,000 8/31/2022 $470,000 100.00% 0 $277.61 2106 1,556 $464,400 9/28/2022 $453,143 97.58% 38 $291.22 1204 1,693 $439,000 9/23/2022 $405,000 92.26% 35 $239.22 2505 1,556 $405,000 8/10/2022 $398,000 98.27% 12 $255.78 1205 1,423 $375,000 10/24/2022 $365,000 97.33% 50 $256.50
$418,229 97.09%
$264.07
99.59%
$243.81

36 MANOR HOUSE 50 Biscayne Dr NW Atlanta, GA 30309 Unit Number Square Feet Original List Price Close Date Sold Price Sold Price/ Original List Price Total Days on Market Sold Price per Square Foot 4102 981 $319,000 9/16/2022 $331,000 103.76% 3 $337.41 July - December 2022 AVERAGE $331,000 103.76% 3 $337.41 January - June 2022 AVERAGE $277,500 100.91% 54 $282.87 CLOSED - 1 BEDROOM July - December 2022 Unit Number Square Feet Beds Baths List Date Original List Price List Price List Price per Square Foot 5103 1,350 2 2 11/11/2022 $380,000 $370,000 $274.07 ACTIVE as of 12/31/2022 Average Sold Price Per Square Foot: $272.08 NO PENDINGS as of 12/31/2022 Unit Number Square Feet Original List Price Close Date Sold Price Sold Price/ Original List Price Total Days on Market Sold Price per Square Foot 2110 1,535 $370,000 10/5/2022 $370,000 100.00% 71 $241.04 1115 1,535 $380,000 9/14/2022 $365,000 96.05% 31 $237.79 July - December 2022 AVERAGE $367,500 98.03% 51 $239.41 January - June 2022 AVERAGE $382,222 99.19% 40 $268.07 CLOSED - 2 BEDROOM July - December 2022

37 MATHIESON EXCHANGE 3180 Mathieson Dr NE Atlanta, GA 30305 Unit Number Square Feet Beds Baths List Date Original List Price List Price List Price per Square Foot 906 3,066 3 3 9/12/2022 $1,395,000 $1,295,000 $422.37 808 1,309 2 2 11/19/2022 $549,000 $549,000 $419.40 ACTIVE as of 12/31/2022 Unit Number Square Feet Beds Baths List Date Original List Price List Price List Price per Square Foot 1206 1,775 2 2 12/5/2022 $749,000 $749,000 $421.97 PENDING as of 12/31/2022 Average Sold Price Per Square Foot: $414.01 Unit Number Square Feet Original List Price Close Date Sold Price Sold Price/ Original List Price Total Days on Market Sold Price per Square Foot 1505 1,354 $665,000 11/15/2022 $615,000 92.48% 140 $454.21 1103 1,014 $395,000 7/19/2022 $399,000 101.01% 6 $393.49 July - December 2022 AVERAGE $507,000 96.75% 73 $423.85 January - June 2022 AVERAGE $477,000 90.38% 109 $380.47 CLOSED - 1 BEDROOM July - December 2022
38 Unit Number Square Feet Original List Price Close Date Sold Price Sold Price/ Original List Price Total Days on Market Sold Price per Square Foot 706 1,358 $559,900 8/29/2022 $535,000 95.55% 38 $393.96 806 1,358 $530,000 10/4/2022 $510,000 96.23% 138 $375.55 July - December 2022 AVERAGE $522,500 95.89% 88 $384.76 January - June 2022 AVERAGE $714,583 91.74% 77 $395.91 CLOSED - 2 BEDROOM July - December 2022 Unit Number Square Feet Original List Price Close Date Sold Price Sold Price/ Original List Price Total Days on Market Sold Price per Square Foot 1501 2,650 $1,375,000 8/30/2022 $1,200,000 87.27% 0 $452.83 July - December 2022 AVERAGE $1,200,000 87.27% 0 $452.83 January - June 2022 AVERAGE N/A N/A N/A N/A CLOSED - 3 BEDROOM July - December 2022

39 MERIDIAN BUCKHEAD 3334 Peachtree Rd NE Atlanta, GA 30326 Unit Number Square Feet Beds Baths List Date Original List Price List Price List Price per Square Foot 208 1,804 2 2 12/31/2022 $419,000
1112 1,424 2 2
1607
2 2
1002 998 1 1
1004 793 1 1
301 1,025 1 1
$275,000
ACTIVE as of 12/31/2022 NO PENDINGS as of 12/31/2022 Average Sold Price Per Square Foot: $304.75 Unit Number Square Feet Original List Price Close Date Sold Price Sold Price/ Original List Price Total Days on Market Sold Price per Square Foot 1410 793 $295,000 7/29/2022 $280,000 94.92% 6 $353.09 714 1,025 $279,900 9/6/2022 $279,000 99.68% 126 $272.20 1105 793 $265,000 7/11/2022 $270,000 101.89% 1 $340.48 July - December 2022 AVERAGE $276,333 98.83% 44 $321.92 January - June 2022 AVERAGE $274,875 100.87% 74 $285.67 CLOSED - 1 BEDROOM July - December 2022
$419,000 $232.26
12/14/2022 $415,000 $415,000 $291.43
1,567
9/28/2022 $440,000 $415,000 $264.84
12/9/2022 $320,000 $320,000 $320.64
3/22/2022 $359,000 $319,000 $402.27
9/7/2022
$275,000 $268.29
40 Unit Number Square Feet Original List Price Close Date Sold Price Sold Price/ Original List Price Total Days on Market Sold Price per Square Foot 412 1,424 $445,000 11/7/2022 $435,000 97.75% 169 $305.48 809 1,386 $400,000 7/22/2022 $350,000 87.50% 89 $252.53 July - December 2022 AVERAGE $392,500 92.63% 129 $279.00 January - June 2022 AVERAGE $425,600 99.06% 41 $282.40 CLOSED - 2 BEDROOM July - December 2022

41 OVATION
Unit Number Square Feet Beds Baths List Date Original List Price List Price List Price per Square Foot
ACTIVE as of 12/31/2022 Unit Number Square Feet Beds Baths List Date Original List Price List Price List Price per Square Foot
PENDING as of 12/31/2022
Sold Price Per Square Foot:
3040 Peachtree Rd NW Atlanta, GA 30305
1312 1,233 2 2 12/2/2022 $500,000 $500,000 $405.52 815 1,018 1 1 12/20/2022 $342,000 $342,000 $335.95 906 800 1 1 6/16/2022 $310,000 $295,000 $368.75 1313 761 1 1 10/29/2022 $295,000 $294,000 $386.33 505 633 1 1 8/3/2022 $264,900 $247,900 $391.63 305 633 1 1 11/18/2022 $243,900 $244,900 $386.89
403 1,233 2 2 5/2/2022 $510,000 $469,999 $381.18 1808 800 1 1 11/5/2022 $315,000 $325,000 $406.25 1602 770 1 1 9/6/2022 $325,000 $309,900 $402.47
Average
$363.55
42 Unit Number Square Feet Original List Price Close Date Sold Price Sold Price/ Original List Price Total Days on Market Sold Price per Square Foot
July -
-
CLOSED - 2 BEDROOM July - December 2022 Unit Number Square Feet Original List Price Close Date Sold Price Sold Price/ Original List Price Total Days on Market Sold Price per Square Foot
- December 2022 AVERAGE
CLOSED - 1 BEDROOM July - December 2022
911 1,233 $450,000 7/14/2022 $444,000 98.67% 5 $360.10
December 2022 AVERAGE $444,000 98.67% 5 $360.10 January
June 2022 AVERAGE $405,833 95.52% 59 $329.14
1402 770 $299,000 8/31/2022 $313,000 104.68% 0 $406.49 1401 877 $310,000 9/13/2022 $310,000 100.00% 0 $353.48 1202 770 $290,000 7/28/2022 $300,000 103.45% 3 $389.61 1002 770 $289,000 8/26/2022 $289,000 100.00% 5 $375.32 1208 800 $299,000 9/30/2022 $287,500 96.15% 23 $359.38 909 800 $279,000 8/2/2022 $280,000 100.36% 8 $350.00 1810 633 $275,000 11/16/2022 $265,000 96.36% 13 $418.64 1805 800 $279,000 9/9/2022 $260,000 93.19% 65 $325.00 214 800 $249,999 9/1/2022 $238,000 95.20% 57 $297.50 July
$282,500 98.82% 19 $363.94 January - June 2022 AVERAGE $262,536 96.54% 86 $331.45

43 PACES 325 325 E Paces Ferry Rd NE Atlanta, GA 30305 Unit Number Square Feet Beds Baths List Date Original List Price List Price List Price per Square Foot 1705 1,491 2 2 8/29/2022 $495,000 $469,000 $314.55 1701 1,275 2 2 10/20/2022 $425,622 $425,622 $333.82 1201 1,275 2 2 11/1/2022 $420,000 $420,000 $329.41 1909 869 1 1 10/4/2022 $315,000 $299,000 $344.07 809 869 1 1 12/15/2022 $275,000 $275,000 $316.46 ACTIVE as of 12/31/2022 NO PENDINGS as of 12/31/2022 Average Sold Price Per Square Foot: $315.71 Unit Number Square Feet Original List Price Close Date Sold Price Sold Price/ Original List Price Total Days on Market Sold Price per Square Foot 704 869 $299,900 7/5/2022 $300,000 100.03% 15 $345.22 1203 979 $289,900 10/17/2022 $289,900 100.00% 6 $296.12 1503 979 $279,900 8/10/2022 $279,900 100.00% 9 $285.90 1703 979 $265,000 8/4/2022 $270,000 101.89% 4 $275.79 July - December 2022 AVERAGE $284,950 100.48% 9 $300.76 January - June 2022 AVERAGE $269,880 100.16% 18 $305.52 CLOSED - 1 BEDROOM July - December 2022
44 Unit Number Square Feet Original List Price Close Date Sold Price Sold Price/ Original List Price Total Days on Market Sold Price per Square Foot 1002 1,333 $499,000 9/30/2022 $460,000 92.18% 27 $345.09 702 1,333 $439,900 11/10/2022 $438,000 99.57% 48 $328.58 2001 1,275 $445,500 7/27/2022 $425,000 95.40% 10 $333.33 July - December 2022 AVERAGE $441,000 95.72% 28 $335.67 January - June 2022 AVERAGE $424,608 99.32% 42 $307.27 CLOSED - 2 BEDROOM July - December 2022 Unit Number Square Feet Original List Price Close Date Sold Price Sold Price/ Original List Price Total Days on Market Sold Price per Square Foot 2205 2,360 $800,000 10/24/2022 $745,000 93.13% 0 $315.68 July - December 2022 AVERAGE $745,000 93.13% 0 $315.68 January - June 2022 AVERAGE N/A N/A N/A N/A CLOSED - 3 BEDROOM July - December 2022

PARAMOUNT AT BUCKHEAD 3445 Stratford Rd NE Atlanta, GA 30326 Unit Number Square Feet Beds Baths List Date Original List Price List Price List Price per Square Foot
2 2
ACTIVE as of 12/31/2022 Unit Number Square Feet Beds Baths List Date Original List Price List Price List Price per Square Foot 2803 1,303 1 1 7/27/2022 $375,000 $369,000 $283.19 PENDING as of 12/31/2022 45 Average Sold Price Per Square Foot: $314.20
3405 1,764
8/23/2022 $580,000 $560,000 $317.46 3107 1,363 2 2 12/1/2022 $460,000 $460,000 $337.49 404 1,363 2 2 11/15/2022 $430,000 $430,000 $315.48 2303 1,303 1 1 8/11/2022 $365,000 $365,000 $280.12 1603 1,303 1 1 8/12/2022 $369,000 $363,000 $278.59
2905 1,764 $685,000 8/31/2022 $610,000 89.05% 88 $345.80 3301 1,776 $599,900 11/7/2022 $602,000 100.35% 125 $338.96 1801 1,776 $550,000 8/25/2022 $538,000 97.82% 0 $302.93 907 1,363 $420,000 12/8/2022 $405,000 96.43% 5 $297.14
46 Unit Number Square Feet Original List Price Close Date Sold Price Sold Price/ Original List Price Total Days on Market Sold Price per Square Foot
July - December 2022 AVERAGE
January - June 2022 AVERAGE
CLOSED - 2 BEDROOM July - December 2022 Unit Number Square Feet Original List Price Close Date Sold Price Sold Price/ Original List Price Total Days on Market Sold Price per Square Foot
July - December 2022 AVERAGE $315,678
January - June 2022 AVERAGE $309,152 96.66% 58 $277.12 CLOSED - 1 BEDROOM July - December 2022 Unit Number Square Feet Original List Price Close Date Sold Price Sold Price/ Original List Price Total Days on Market Sold Price per Square Foot 3603 1,868 $734,900 9/19/2022 $715,000 97.29% 52 $382.76 3703 1,868 $750,000 7/28/2022 $710,000 94.67% 69 $380.09 July - December 2022 AVERAGE $712,500 95.98% 61 $381.42 January - June 2022 AVERAGE $555,000 98.32% 56 $305.90 CLOSED - 3 BEDROOM July - December 2022
$538,750 95.91% 55 $321.21
$492,917 99.75% 24 $303.73
2208 1,303 $385,000 7/25/2022 $385,000 100.00% 26 $295.47 3003 1,303 $389,000 12/22/2022 $380,000 97.69% 269 $291.63 1108 1,303 $349,000 7/12/2022 $340,000 97.42% 38 $260.94 1708 1,303 $359,000 11/23/2022 $338,500 94.29% 181 $259.79 1606 880 $288,000 8/5/2022 $296,600 102.99% 7 $337.05 2105 880 $280,000 7/21/2022 $286,000 102.14% 5 $325.00 1609 972 $299,900 8/25/2022 $285,000 95.03% 8 $293.21 1406 880 $315,000 8/26/2022 $280,000 88.89% 87 $318.18 1005 880 $269,900 11/10/2022 $250,000 92.63% 150 $284.09
96.79% 86 $296.15

47 PARK AVENUE 750 Park Ave NE Atlanta, GA 30326 Unit Number Square Feet Beds Baths List Date Original List Price List Price List Price per Square Foot 34SE 3,373 3 2 12/27/2022 $1,549,000 $1,549,000 $459.24 29W 2,842 3 2 12/29/2022 $1,399,000 $1,399,000 $492.26 30N 2,842 2 2 8/23/2022 $1,399,000 $1,399,000 $492.26 ACTIVE as of 12/31/2022 Average Sold Price Per Square Foot: $338.27 PENDING as of 12/31/2022 Unit Number Square Feet Beds Baths List Date Original List Price List Price List Price per Square Foot 39SE 3,100 2 2 9/7/2022 $1,750,000 $1,650,000 $532.26 12S 2,262 2 2 11/30/2022 $1,379,000 $1,379,000 $609.64 Unit Number Square Feet Original List Price Close Date Sold Price Sold Price/ Original List Price Total Days on Market Sold Price per Square Foot 9S 2,262 $829,000 7/13/2022 $800,000 96.50% 43 $353.67 July - December 2022 AVERAGE $800,000 96.50% 43 $353.67 January - June 2022 AVERAGE $1,000,833 93.24% 151 $399.27 CLOSED - 2 BEDROOM July - December 2022
48 Unit Number Square Feet Original List Price Close Date Sold Price Sold Price/ Original List Price Total Days on Market Sold Price per Square Foot 15N 3,407 $1,200,000 9/30/2022 $1,100,000 91.67% 0 $322.86 July - December 2022 AVERAGE $1,100,000 91.67% 0 $322.86 January - June 2022 AVERAGE $925,000 100.00% 5 $325.48 CLOSED - 3 BEDROOM July - December 2022
$530.59
49 PARK PLACE ON PEACHTREE 2660
Rd Atlanta,
Unit Number Square Feet Beds Baths List Date Original List Price List Price List Price per Square Foot
ACTIVE as of 12/31/2022 NO PENDINGS as of 12/31/2022 Average Sold Price Per Square Foot: $375.65 Unit Number Square Feet Original List Price Close Date Sold Price Sold Price/ Original List Price Total Days on Market Sold Price per Square Foot 26E 2,951 $1,199,000 7/18/2022 $1,199,000 100.00% 21 $406.30 July - December 2022 AVERAGE $1,199,000 100.00% 21 $406.30 January - June 2022 AVERAGE $1,072,167 97.80% 144 $446.18 CLOSED - 2 BEDROOM July - December 2022
Peachtree
GA 30305
26CD 4,258 3 3 12/28/2022 $1,999,000 $1,999,000 $469.47 13B 3,206 3 3 12/29/2022 $1,300,000 $1,300,000 $405.49 29F 2,403 2 2 12/22/2022 $1,295,000 $1,295,000 $538.91 12C 2,403 2 2 12/1/2022 $1,275,000 $1,275,000
25E 2,951 2 2 12/6/2022 $1,250,000 $1,250,000 $423.59 22E 2,951 3 2 10/25/2022 $1,450,900 $1,185,000 $401.56 21H 2,403 2 2 12/28/2022 $999,000 $999,000 $415.73 23B 2,403 2 2 12/29/2022 $925,000 $925,000 $384.94
50 Unit Number Square Feet Original List Price Close Date Sold Price Sold Price/ Original List Price Total Days on Market Sold Price per Square Foot
3,206 $1,649,000 11/28/2022 $1,425,000
293
16E 2,951 $1,725,000 12/14/2022 $815,000
41
July - December 2022 AVERAGE $1,120,000
167 $360.33 January - June 2022 AVERAGE $1,204,375 92.44% 89 $391.13 CLOSED - 3 BEDROOM July - December 2022
22H
86.42%
$444.48
47.25%
$276.18
66.83%

51 PARK REGENCY 700 Park Regency Pl NE Atlanta, GA 30326 Unit Number Square Feet Beds Baths List Date Original List Price List Price List Price per Square Foot 1306 1,667 2 2 8/4/2022 $595,000 $595,000 $356.93 1108 1,384 2 2 8/12/2022 $495,000 $469,900 $339.52 ACTIVE as of 12/31/2022 NO PENDINGS as of 12/31/2022 Average Sold Price Per Square Foot: $320.90 Unit Number Square Feet Original List Price Close Date Sold Price Sold Price/ Original List Price Total Days on Market Sold Price per Square Foot 2302 2,494 $950,000 8/11/2022 $825,000 86.84% 166 $330.79 1003 1,703 $550,000 10/21/2022 $547,500 99.55% 4 $321.49 1704 1,680 $499,000 10/19/2022 $484,030 97.00% 1 $288.11 708 1,384 $499,000 10/17/2022 $475,000 95.19% 12 $343.21 July - December 2022 AVERAGE $582,883 94.64% 46 $320.90 January - June 2022 AVERAGE $489,667 101.49% 72 $290.75 CLOSED - 2 BEDROOM July - December 2022
THE PEACHTREE RESIDENCES 2626 Peachtree Rd Atlanta, GA 30305 Unit Number Square Feet Beds Baths List Date Original List Price List Price List Price per Square Foot 903 1,488 2 2 11/11/2022 $500,000 $475,000 $319.22 412 1,717 2 2 9/15/2022 $449,000 $442,500 $257.72 ACTIVE as of 12/31/2022 PENDINGS as of 12/31/2022 52 Average Sold Price Per Square Foot: $339.75 Unit Number Square Feet Original List Price Close Date Sold Price Sold Price/ Original List Price Total Days on Market Sold Price per Square Foot 1102 652 $299,900 10/17/2022 $250,000 83.36% 27 $383.44 1106 652 $239,900 7/21/2022 $245,000 102.13% 6 $375.77 July - December 2022 AVERAGE $247,500 92.74% 17 $379.60 January - June 2022 AVERAGE $285,000 112.01% 4 $302.60 CLOSED - 1 BEDROOM July - December 2022 Unit Number Square Feet Beds Baths List Date Original List Price List Price List Price per Square Foot 203 798 1 1 11/11/2022 $230,000 $220,000 $275.69
53 Unit Number Square Feet Original List Price Close Date Sold Price Sold Price/ Original List Price Total Days on Market Sold Price per Square Foot 1807 2,115 $600,000 11/30/2022 $550,000 91.67% 119 $260.05 July - December 2022 AVERAGE $550,000 91.67% 119 $260.05 January - June 2022 AVERAGE $489,999 100.00% 16 $317.97 CLOSED - 2 BEDROOM July - December 2022

54 PHOENIX ON PEACHTREE 2881 Peachtree Rd Atlanta, GA 30305 Unit Number Square Feet Original List Price Close Date Sold Price Sold Price/ Original List Price Total Days on Market Sold Price per Square Foot 1005 1,089 $399,000 7/15/2022 $410,000 102.76% 3 $376.49 1202 1,440 $449,000 7/20/2022 $399,000 88.86% 74 $277.08 July - December 2022 AVERAGE $404,500 95.81% 39 $326.79 January - June 2022 AVERAGE $922,500 98.35% 79 $404.65 CLOSED - 2 BEDROOM July - December 2022 Average Sold Price Per Square Foot: $336.11 NO ACTIVES OR PENDINGS as of 12/31/2022 Unit Number Square Feet Original List Price Close Date Sold Price Sold Price/ Original List Price Total Days on Market Sold Price per Square Foot 1701 3,157 $1,150,000 9/1/2022 $1,120,000 97.39% 46 $354.77 July - December 2022 AVERAGE $1,120,000 97.39% 46 $354.77 January - June 2022 AVERAGE $959,500 96.45% 43 $356.12 CLOSED - 3 BEDROOM July - December 2022

55 PLAZA TOWERS 2575 Peachtree Rd Atlanta, GA 30305 Unit Number Square Feet Beds Baths List Date Original List Price List Price List Price per Square Foot 20G 3,188 2 3 9/23/2022 $1,999,000 $1,999,000 $627.04 5G 2,457 3 3 10/7/2022 $995,000 $879,900 $358.12 ACTIVE as of 12/31/2022 Unit Number Square Feet Beds Baths List Date Original List Price List Price List Price per Square Foot 11C 1,594 2 2 11/1/2022 $679,000 $679,000 $425.97 PENDING as of 12/31/2022 Average Sold Price Per Square Foot: $277.14 Unit Number Square Feet Original List Price Close Date Sold Price Sold Price/ Original List Price Total Days on Market Sold Price per Square Foot 16C 1,594 $599,000 7/20/2022 $550,000 91.82% 266 $345.04 12B 1,594 $599,999 8/10/2022 $425,000 70.83% 146 $266.62 8D 1,594 $525,000 9/2/2022 $400,000 76.19% 129 $250.94 7G 1,594 $425,000 8/24/2022 $392,070 92.25% 1 $245.97 July - December 2022 AVERAGE $441,768 82.77% 136 $277.14 January - June 2022 AVERAGE $675,000 95.01% 184 $405.54 CLOSED - 2 BEDROOM July - December 2022
$383.68 1206 698 1 1 8/20/2022 $300,000 $299,900 $429.66 1512 783 1 1 11/15/2022 $295,500 $299,500 $382.50 906 698 1 1 11/1/2022 $295,000 $294,900 $422.49

56 REALM 3324 Peachtree Rd NE Atlanta, GA 30326 Unit Number Square Feet Beds Baths List Date Original List Price List Price List Price per Square Foot
ACTIVE as of 12/31/2022 Average Sold Price Per Square Foot: $403.90 NO PENDINGS as of 12/31/2022
1501 1,223 2 2 10/25/2022 $475,000 $475,000 $388.39 914 1,238 2 2 10/28/2022 $480,000 $475,000
1707 789 $309,000 7/28/2022 $314,000 101.62% 5 $397.97 1411 798 $305,000 10/21/2022 $310,000 101.64% 6 $388.47 2207 789 $310,000 9/26/2022 $310,000 100.00% 6 $392.90 2517 734 $299,000 8/1/2022 $310,000 103.68% 2 $422.34 2215 698 $304,000 7/25/2022 $307,000 100.99% 17 $439.83 1413 734 $299,000 8/9/2022 $302,500 101.17% 11 $412.13 910 764 $305,000 7/8/2022 $300,000 98.36% 3 $392.67 1304 706 $305,000 8/30/2022 $298,000 97.70% 12 $422.10 1006 698 $295,000 8/5/2022 $290,000 98.31% 12 $415.47 2303 655 $305,000 11/25/2022 $280,000 91.80% 22 $427.48 1808 736 $299,900 7/6/2022 $279,900 93.33% 53 $380.30 2416 620 $289,900 8/31/2022 $274,250 94.60% 12 $442.34
57
Number Square Feet Original List Price Close Date Sold Price Sold Price/ Original List Price
Days on
Unit
Total
Market Sold Price per Square Foot
July - December 2022 AVERAGE
January - June 2022 AVERAGE
CLOSED - 1 BEDROOM July - December 2022 Unit Number Square Feet Original List Price Close Date Sold Price Sold Price/ Original List Price Total Days on Market Sold Price per Square Foot
$499,900
$445,000
July - December 2022 AVERAGE
January - June 2022 AVERAGE
CLOSED - 2 BEDROOM July - December 2022
$297,971 98.60% 13 $411.17
$283,523 102.13% 14 $396.71
2501 1,223
8/26/2022 $499,900 100.00% 38 $408.75 2319 1,245 $480,000 8/17/2022 $499,000 103.96% 6 $400.80 1714 1,238 $499,900 9/7/2022 $490,000 98.02% 7 $395.80 1514 1,238 $479,900 9/7/2022 $475,000 98.98% 48 $383.68 2105 1,238
8/19/2022 $425,000 95.51% 39 $343.30
$477,780 99.29% 28 $386.47
$465,470 98.38% 60 $378.23

THE RITZ CARLTON RESIDENCES 3630 Peachtree Rd NE Atlanta, GA 30326 Unit Number Square Feet Beds Baths List Date Original List Price List Price List Price per Square Foot 1904
2 2 11/2/2022 $1,849,900 $1,849,900
2202
2 2
1902
2 2
2605
2 2
ACTIVE as of 12/31/2022 NO PENDINGS as of 12/31/2022 58 Average Sold Price Per Square Foot: $640.12 Unit Number Square Feet Original List Price Close Date Sold Price Sold Price/ Original List Price Total Days on Market Sold Price per Square Foot 2604 2,214 $1,645,000 7/28/2022 $1,600,000 97.26% 89 $722.67 3105 1,659 $1,095,000 8/26/2022 $925,000 84.47% 119 $557.56 July - December 2022 AVERAGE $1,262,500 90.87% 104 $640.12 January - June 2022 AVERAGE $1,117,500 93.97% 25 $650.55 CLOSED - 2 BEDROOM July - December 2022
2,098
$881.74
1,776
10/20/2022 $1,279,000 $1,279,000 $720.16
1,776
9/9/2022 $1,270,000 $1,230,000 $692.57
1,659
10/1/2022 $1,145,000 $1,095,000 $660.04
$713.70 4203 2,508 2 2 12/16/2022 $1,600,000 $1,600,000 $637.96 3303 1,662 2 2 12/2/2022 $1,300,000 $1,300,000 $782.19 3103 1,662 2 2 7/2/2022 $1,300,000 $1,250,000 $752.11

59 SOVEREIGN
Unit Number Square Feet Beds Baths List Date Original List Price List Price List Price per Square Foot
ACTIVE as of 12/31/2022 NO PENDINGS as of 12/31/2022 Unit Number Square Feet Original List Price Close Date Sold Price Sold Price/ Original List Price Total Days on Market Sold Price per Square Foot 3405 2,133 $1,499,000 10/5/2022 $1,362,500 90.89% 140 $638.77 3105 2,105 $1,450,000 12/15/2022 $1,275,000 87.93% 202 $605.70 July - December 2022 AVERAGE $1,318,750 89.41% 171 $622.24 January - June 2022 AVERAGE $1,550,000 89.54% 101 $621.45 CLOSED - 2 BEDROOM July - December 2022 Average Sold Price Per Square Foot: $622.24
3344 Peachtree Rd Atlanta, GA 30305
3703 2,485 2 2 11/7/2022 $1,850,000 $1,750,000 $704.23 3204 2,452 2 2 10/31/2022 $1,750,000 $1,750,000
88 W Paces Ferry Rd NW Atlanta, GA 30305

2010 4,132 3 3 1/16/2022 $5,500,000 $5,500,000 $1,331.07 1840 4,675 3 3 11/1/2022 $5,400,000 $5,400,000 $1,155.08 1740 4,132 3 3 3/22/2022 $5,400,000 $5,130,000 $1,241.53 2230 3,807 2 2 12/19/2022 $5,100,000 $5,100,000 $1,339.64 1620 3,583 3 3 2/28/2022 $4,250,000 $4,150,000 $1,158.25 2040 2,986 2 2 10/13/2022 $3,615,000 $3,615,000 $1,210.65
60 ST. REGIS RESIDENCES
Unit Number Square Feet Beds Baths List Date Original List Price List Price List Price per Square Foot
ACTIVE as of 12/31/2022 NO PENDINGS AND NO CLOSED SALES as of July - December 2022 Average Sold Price Per Square Foot:
N/A

61 THE VIEW AT CHASTAIN 3820 Roswell Rd NE Atlanta, GA 30342 ACTIVE as of 12/31/2022 NO PENDINGS as of 12/31/2022 Unit Number Square Feet Original List Price Close Date Sold Price Sold Price/ Original List Price Total Days on Market Sold Price per Square Foot 1007 1,215 $375,000 10/27/2022 $365,000 97.33% 101 $300.41 July - December 2022 AVERAGE $365,000 97.33% 101 $300.41 January - June 2022 AVERAGE $327,000 101.00% 9 $324.42 CLOSED - 1 BEDROOM July - December 2022 Average Sold Price Per Square Foot: $287.63 Unit Number Square Feet Beds Baths List Date Original List Price List Price List Price per Square Foot 802 1,270 2 2 11/17/2022 $389,900 $389,900 $307.01 504 964 1 1 11/11/2022 $375,000 $350,000 $363.07 914 964 1 1 12/15/2022 $344,000 $344,000 $356.85
62 Unit Number Square Feet Original List Price Close Date Sold Price Sold Price/ Original List Price Total Days on Market Sold Price per Square Foot 303 1,680 $475,000 7/14/2022 $460,000
62
401 1,448 $450,000 12/2/2022 $440,000
83
608 1,505 $479,000 9/2/2022 $410,000
67
July - December 2022 AVERAGE $436,667
71
January - June 2022 AVERAGE $448,000
CLOSED - 2 BEDROOM July - December 2022
96.84%
$273.81
97.78%
$303.87
85.59%
$272.43
93.40%
$283.37
102.04% 3 $306.06

63 WALDORF ASTORIA RESIDENCES 3376 Peachtree Rd NE Atlanta, GA 30326 Unit Number Square Feet Beds Baths List Date Original List Price List Price List Price per Square Foot 56 4,863 3 3 10/17/2022 $6,500,000 $6,500,000 $1,336.62 49 5,157 4 4 9/7/2022 $4,450,000 $4,450,000 $862.90 ACTIVE as of 12/31/2022 Average Sold Price Per Square Foot: $582.58 Unit Number Square Feet Original List Price Close Date Sold Price Sold Price/ Original List Price Total Days on Market Sold Price per Square Foot VILLA 3 4,045 $2,500,000 8/26/2022 $2,500,000 100.00% 47 $618.05 44B 3,541 $2,400,000 11/30/2022 $2,275,000 94.79% 66 $642.47 34A 3,407 $1,885,000 12/22/2022 $1,660,000 88.06% 171 $487.23 July - December 2022 AVERAGE $2,145,000 94.29% 95 $582.58 January - June 2022 AVERAGE $1,937,500 83.72% 189 $572.41 CLOSED - 3 BEDROOM July - December 2022 NO PENDINGS as of 12/31/2022

64 THE WINSTON 3657 Peachtree Rd Atlanta, GA 30319 Unit Number Square Feet Beds Baths List Date Original List Price List Price List Price per Square Foot 6B 2,394 2 2 11/22/2022 $895,000 $895,000 $373.85 PENDING as of 12/31/2022 Average Sold Price Per Square Foot: $336.62 NO ACTIVES as of 12/31/2022 Unit Number Square Feet Original List Price Close Date Sold Price Sold Price/ Original List Price Total Days on Market Sold Price per Square Foot 2B 3,550 $1,390,000 12/6/2022 $1,195,000 85.97% 333 $336.62 July - December 2022 AVERAGE $1,195,000 85.97% 333 $336.62 January - June 2022 AVERAGE N/A N/A N/A N/A CLOSED - 3 BEDROOM July - December 2022
Data and most photos are from the First Multiple Listing Service. Information is deemed to be accurate but is not warranted. Please note that in many “new construction” condominium projects or buildings being converted to condominiums, not all sales are reported in FMLS. We are only reporting sales included in FMLS. This research is on 45 buildings in and around Buckhead, but is not exhaustive.
If you are interested in receiving more information on additional properties or need help pricing your home, please contact your Atlanta Intown Agent, call 404.881.1810 or email brokers@atlantaintown.com .


65


/AtlantaIntownRE @AtlantaIntownRE @AtlantaIntown @AtlantaIntown RealEstateServices ©2021 Atlanta Intown Real Estate Services. All rights reserved. Atlanta Intown Real Estate Services is an Equal Opportunity Employer and support the Fair Housing Act. All information and photography was procured through FMLS® Information is deemed to be accurate but is not warranted. MAIN OFFICE: 181 10th St NE | Atlanta GA 30309 | 404.881.1810 atlantaintown.com KIRKWOOD OFFICE: 1963 Hosea Williams Dr SE | Atlanta GA 30317 | 404.370.3101