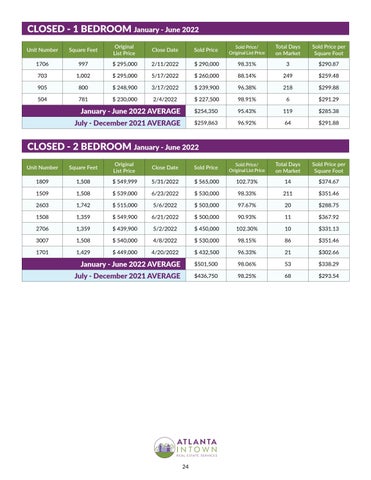
CLOSED - 1 BEDROOM January - June 2022 Unit Number
Square Feet
Original List Price
Close Date
Sold Price
Sold Price/ Original List Price
Total Days on Market
Sold Price per Square Foot
1706
997
$ 295,000
2/11/2022
$ 290,000
98.31%
3
$290.87
703
1,002
$ 295,000
5/17/2022
$ 260,000
88.14%
249
$259.48
905
800
$ 248,900
3/17/2022
$ 239,900
96.38%
218
$299.88
504
781
$ 230,000
2/4/2022
$ 227,500
98.91%
6
$291.29
January - June 2022 AVERAGE
$254,350
95.43%
119
$285.38
July - December 2021 AVERAGE
$259,863
96.92%
64
$291.88
CLOSED - 2 BEDROOM January - June 2022 Unit Number
Square Feet
Original List Price
Close Date
Sold Price
Sold Price/ Original List Price
Total Days on Market
Sold Price per Square Foot
1809
1,508
$ 549,999
5/31/2022
$ 565,000
102.73%
14
$374.67
1509
1,508
$ 539,000
6/23/2022
$ 530,000
98.33%
211
$351.46
2603
1,742
$ 515,000
5/6/2022
$ 503,000
97.67%
20
$288.75
1508
1,359
$ 549,900
6/21/2022
$ 500,000
90.93%
11
$367.92
2706
1,359
$ 439,900
5/2/2022
$ 450,000
102.30%
10
$331.13
3007
1,508
$ 540,000
4/8/2022
$ 530,000
98.15%
86
$351.46
1701
1,429
$ 449,000
4/20/2022
$ 432,500
96.33%
21
$302.66
January - June 2022 AVERAGE
$501,500
98.06%
53
$338.29
July - December 2021 AVERAGE
$436,750
98.25%
68
$293.54
24