Buckhead Condo Overview


6
Building Total Units Year Built HOA/ Square Foot Total Closings Avg sales Price Total Days on Market Total Closings Avg sales Price Total Days on Market Average Sales Price / Original List Price Average Price per Square Ft 10 Terminus 137 2008 $0.72 15 $955,510 90 3 $516,633 138 96.41% $393.71 2500 Peachtree 59 2000 $0.67 2 $1,682,500 90 3 $1,259,217 34 95.24% $487.12 2828 Peachtree 79 2002 $0.63 1 $460,000 9 2 $479,950 23 91.59% $393.93 The Aramore 124 2003 $0.57 14 $283,886 23 8 $321,500 36 96.40% $313.05 The Astoria 69 2009 $0.46 8 $551,425 28 1 $590,000 79 100.85% $387.14 The Borghese 55 2001 $0.94 2 $1,052,500 29 3 $868,333 192 86.69% $294.28 The Brookwood 219 2010 $0.48 10 $708,550 65 10 $687,610 76 94.23% $423.29 Brookwood Place 286 2004 $0.41 9 $403,139 23 3 $363,333 144 97.45% $269.82 Buckhead Grand 137 2000 $0.44 11 $411,627 77 8 $363,188 86 97.77% $317.63 Buckhead Village Lofts 104 1999 $0.53 16 $387,494 51 2 $397,000 71 90.28% $339.53 Carrington Park 140 2000 $0.31 11 $261,636 20 5 $259,320 28 97.37% $285.14 The Charles 56 2019 $0.82 1 $3,500,000 210 3 $3,118,333 59 96.78% $777.11 Cosmopolitan At Lindbergh 244 2009 $0.36 7 $308,786 7 7 $301,429 25 98.97% $319.95 Eclipse 325 2004 $0.50 30 $336,367 43 16 $313,281 75 96.32% $356.25 Gallery 203 2007 $0.49 10 $628,800 50 7 $595,071 49 94.16% $369.34 The Grandview 226 1990 $0.45 9 $319,722 14 9 $416,917 56 96.96% $315.33 The Graydon Buckhead 45 2021 $0.81 12 $3,672,414 157 5 $2,548,600 245 95.18% $963.69 Heritage Place 89 1997 $0.48 3 $392,333 156 1 $465,000 11 97.89% $274.66 Manor House 94 2002 $0.48 11 $374,773 45 2 $373,250 42 96.87% $258.63 Mathieson Exchange 95 2001 $0.47 6 $595,792 93 3 $485,000 34 93.60% $320.32 Meridian Buckhead 232 1997 $0.46 18 $361,356 76 6 $297,483 133 95.68% $299.10 Ovation 267 2006 $0.52 17 $313,112 76 10 $317,812 50 97.60% $363.53 Paces 325 206 2004 $0.47 18 $381,628 36 13 $360,223 72 97.01% $314.47 1/1/2022 - 6/30/2022 1/1/2023 - 6/30/2023
7 Building Total Units Year Built HOA/ Square Foot Total Closings Avg sales Price Total Days on Market Total Closings Avg sales Price Total Days on Market Average Sales Price / Original List Price Average Price per Square Ft Paramount At Buckhead 300 2006 $0.49 19 $458,369 48 16 $397,750 88 98.12% $305.97 Park Avenue 123 1999 $0.66 7 $990,000 130 7 $1,410,571 96 89.23% $470.81 Park Place On Peachtree 140 1987 $0.58 8 $1,210,000 148 3 $985,000 72 90.60% $382.21 Park Regency 63 2001 $0.60 6 $497,417 63 5 $656,200 51 97.03% $357.98 The Peachtree Residences 121 2001 $0.55 3 $353,333 8 3 $354,833 110 95.55% $264.50 Phoenix On Peachtree 63 2001 $0.62 4 $941,000 61 0 N/A N/A N/A N/A Plaza Towers 176 1969 $0.93 7 $653,571 159 7 $697,143 65 88.23% $352.13 Realm 406 2005 $0.53 23 $362,630 34 11 $328,309 58 98.26% $412.84 The Ritz Carlton Residences 126 2010 $0.97 6 $989,167 19 3 $1,615,000 130 93.20% $724.09 Sovereign 82 2008 $1.08 3 $1,550,000 101 0 N/A N/A N/A N/A St Regis Residences 53 2010 $0.90 4 $5,050,000 81 2 $4,092,500 89 95.50% $1,034.25 The View At Chastain 125 2005 $0.52 7 $361,571 7 1 $322,000 88 85.87% $334.02 Waldorf Astoria 45 2008 $1.15 4 $2,218,750 276 0 N/A N/A N/A N/A The Winston 36 2001 $0.66 1 $585,000 17 1 $885,000 9 98.88% $369.67 1/1/2022 - 6/30/2022 1/1/2023 - 6/30/2023
3325 Piedmont Rd NE Atlanta, GA 30305

8 10
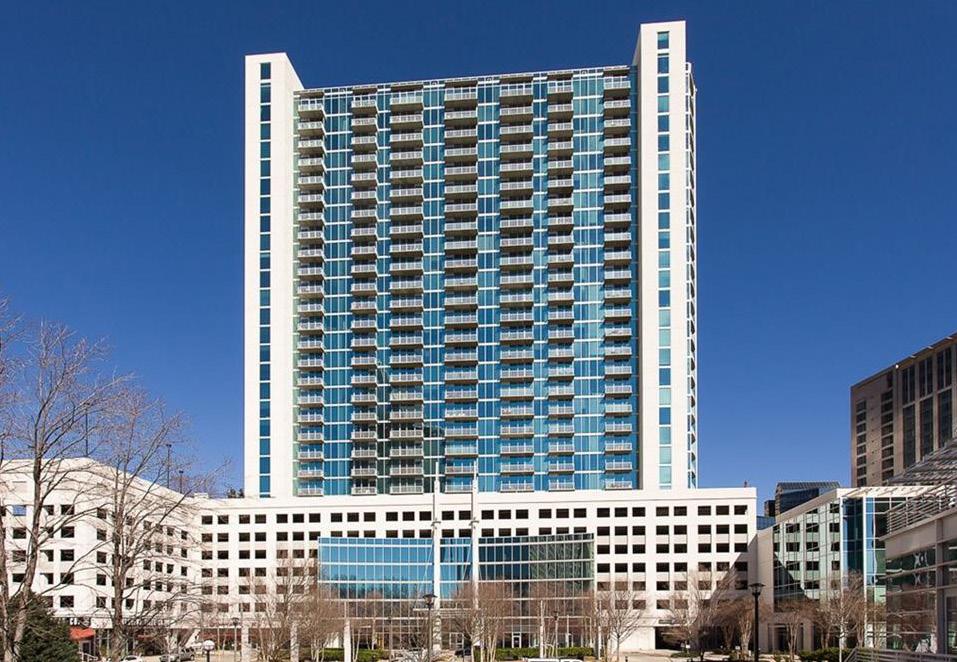
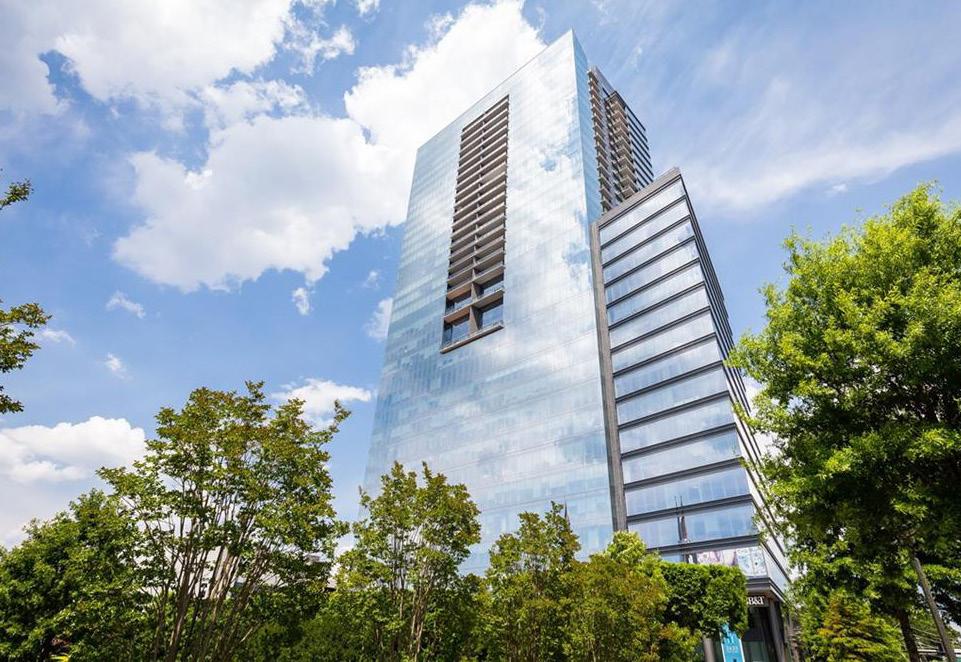
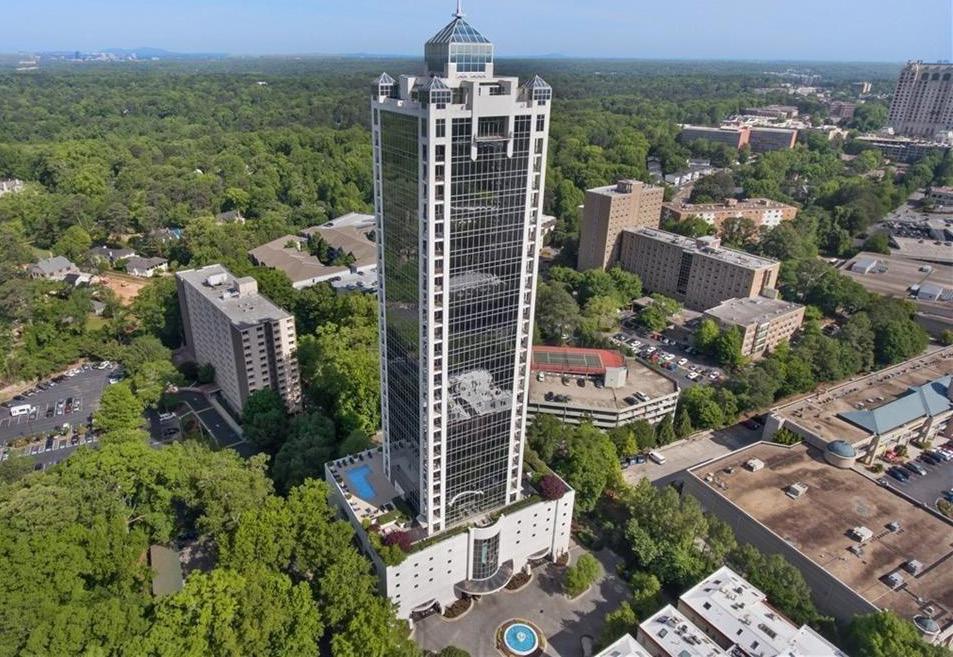
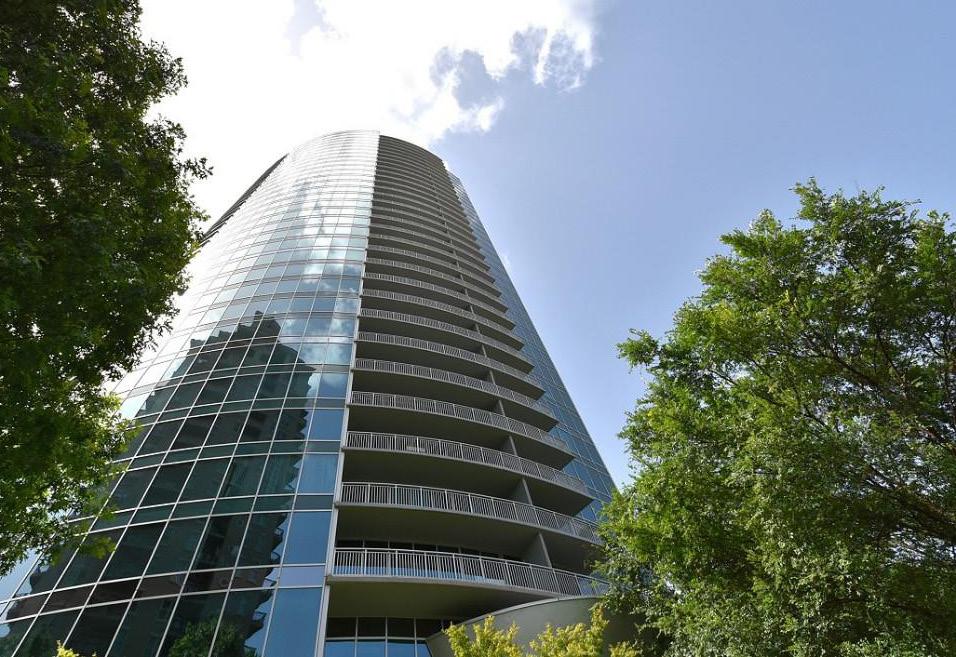
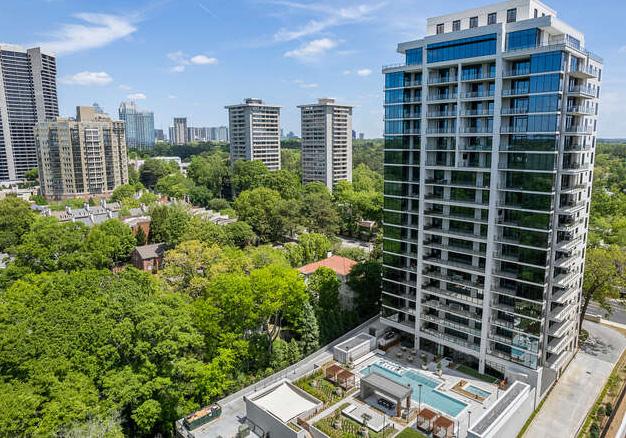
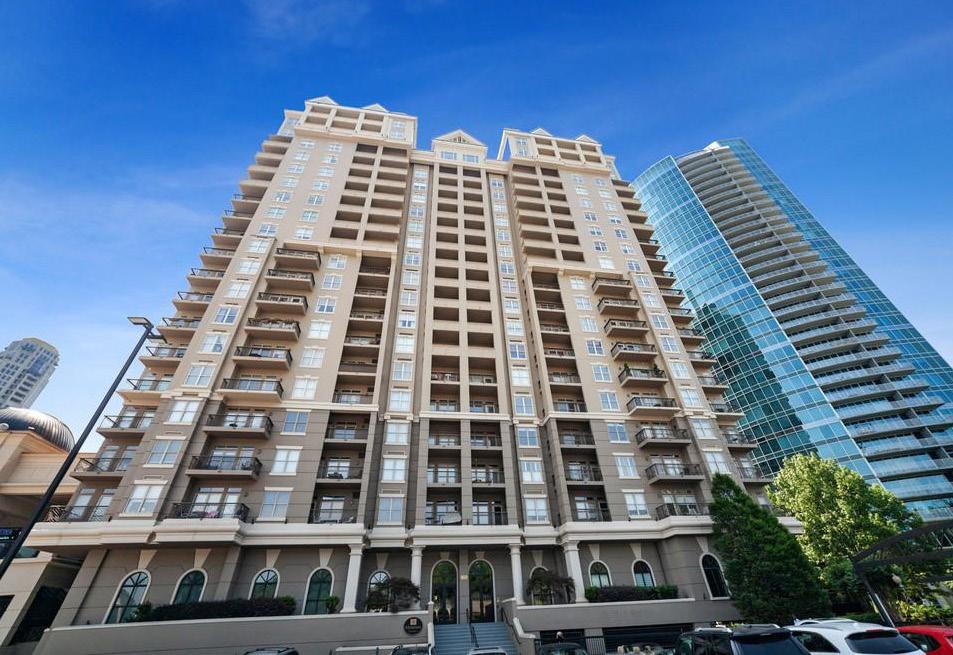
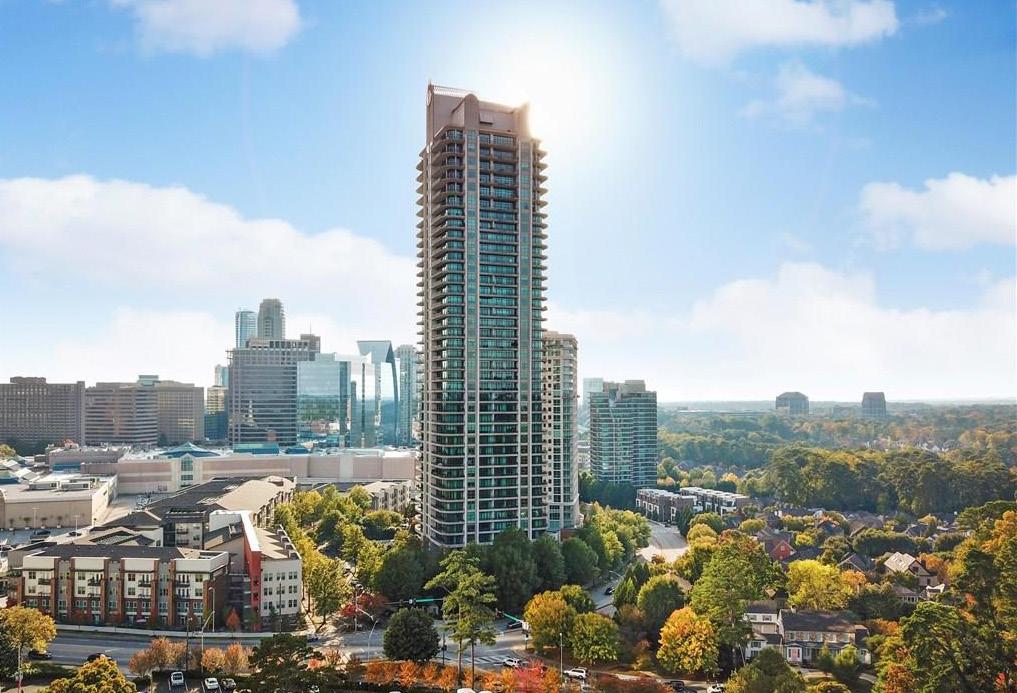
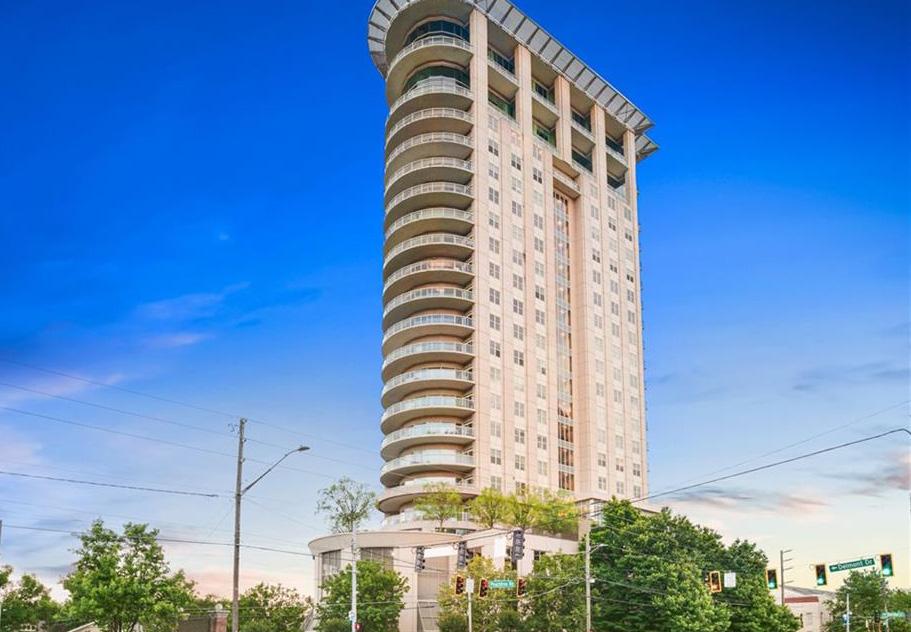
TERMINUS
Unit Number Square Feet Beds Baths List Date Original List Price List Price List Price per Square Foot 2108 1,554 2 2 5/16/2023 $ 695,000 $ 695,000 $447.23 1407 930 1 1 6/16/2023 $ 649,900 $ 649,900 $698.82 2206 930 1 1 6/2/2023 $ 475,000 $ 475,000 $510.75 ACTIVE as of 6/30/2023 Unit Number Square Feet Beds Baths List Date Original List Price List Price List Price per Square Foot 2205 2,748 3 3 4/26/2023 $ 1,325,000 $ 1,325,000 $482.17 1510 930 1 1 5/4/2023 $ 349,900 $ 349,900 $376.24 PENDING as of 6/30/2023 Average Price Per Square Foot: $393.71 Unit Number Square Feet Original List Price Close Date Sold Price Sold Price/ Original List Price Total Days on Market Sold Price per Square Foot 2703 1,120 $ 469,000 6/16/2023 $ 460,000 98.08% 109 $410.71 1810 930 $ 369,900 2/21/2023 $ 369,900 100.00% 251 $397.74 January - June 2023 AVERAGE $414,950 99.04% 180 $404.23 July - December 2022 AVERAGE $397,000 90.26% 42 $423.08 CLOSED - 1 BEDROOM January - June 2023
9 Unit Number Square Feet Original List Price Close Date Sold Price Sold Price/ Original List Price Total Days on Market Sold Price per Square Foot 2202 1,932 $ 789,900 4/12/2023 $ 720,000 91.15% 55 $372.67 January - June 2023 AVERAGE $720,000 91.15% 55 $372.67 July - December 2022 AVERAGE $682,500 92.31% 61 $399.98 CLOSED - 2 BEDROOM January - June 2023
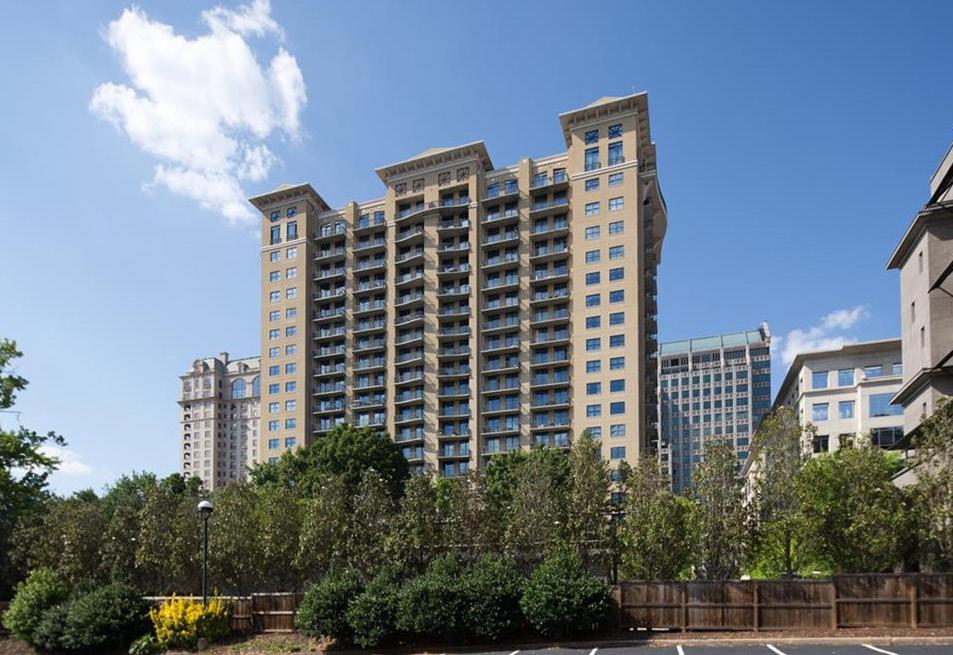
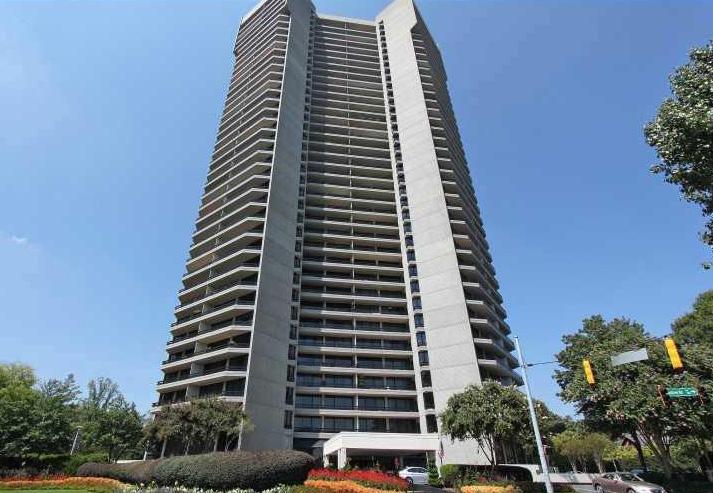
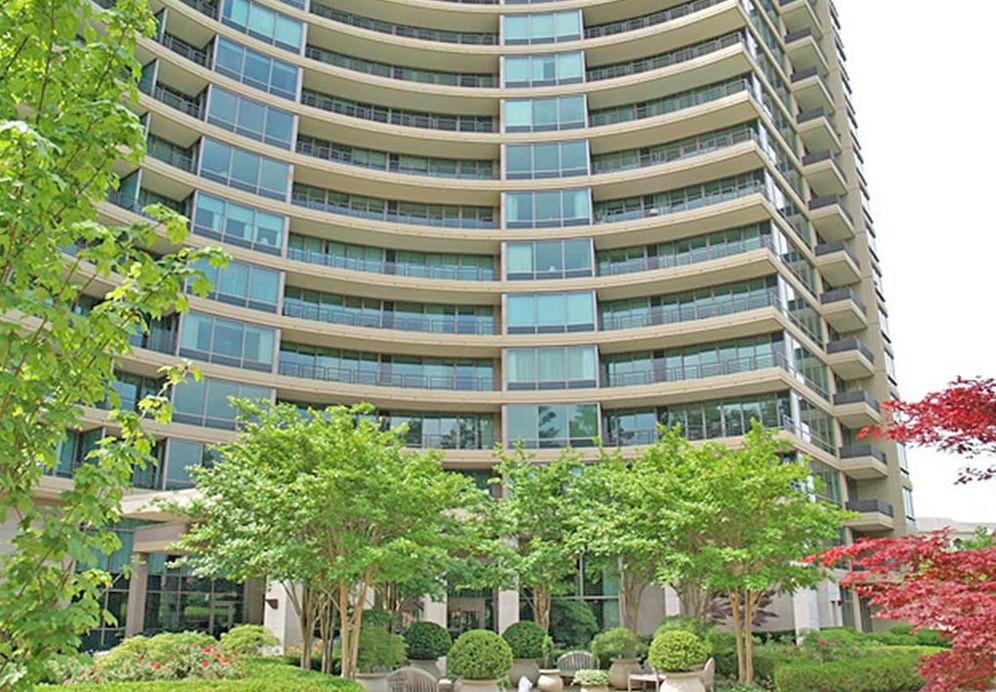
10 2500 PEACHTREE 2500 Peachtree Rd NW Atlanta, GA 30305 Unit Number Square Feet Original List Price Close Date Sold Price Sold Price/ Original List Price Total Days on Market Sold Price per Square Foot 508N 2,338 $ 1,200,000 5/18/2023 $ 1,095,150 91.26% 38 $468.41 January - June 2023 AVERAGE $1,095,150 91.26% 38 $468.41 July - December 2022 AVERAGE N/A N/A N/A N/A CLOSED - 1 BEDROOM January - June 2023 Unit Number Square Feet Beds Baths List Date Original List Price List Price List Price per Square Foot 506N 2,606 2 2 4/25/2023 $ 1,375,000 $ 1,375,000 $527.63 ACTIVE as of 6/30/2023 NO PENDINGS as of 6/30/2023 Average Price Per Square Foot: $487.12 Unit Number Square Feet Original List Price Close Date Sold Price Sold Price/ Original List Price Total Days on Market Sold Price per Square Foot 607S 2,261 $ 1,095,000 1/31/2023 $ 1,037,500 94.75% 43 $458.87 January - June 2023 AVERAGE $1,037,500 94.75% 43 $458.87 July - December 2022 AVERAGE $690,000 92.00% 74 $319.89 CLOSED - 2 BEDROOM January - June 2023
11 Unit Number Square Feet Original List Price Close Date Sold Price Sold Price/ Original List Price Total Days on Market Sold Price per Square Foot 402N 3,080 $ 1,650,000 3/30/2023 $ 1,645,000 99.70% 21 $534.09 January - June 2023 AVERAGE $1,645,000 99.70% 21 $534.09 July - December 2022 AVERAGE $1,520,250 95.08% 88 $493.59 CLOSED - 3 BEDROOM January - June 2023
12
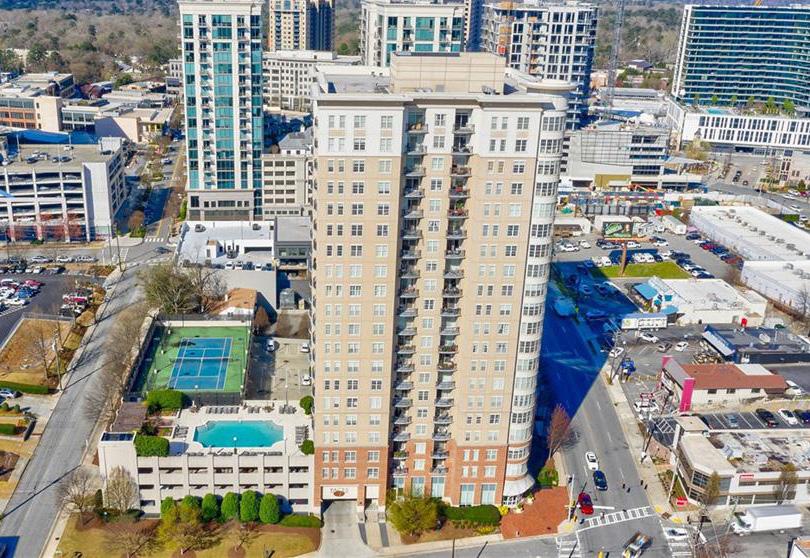
Unit Number Square Feet Original List Price Close Date Sold Price Sold Price/ Original List Price Total Days on Market Sold Price per Square Foot 2802 1,371 $ 550,000 5/9/2023 $ 484,900 88.16% 37 $353.68 1204 1,094 $ 499,900 6/16/2023 $ 475,000 95.02% 8 $434.19 January - June 2023 AVERAGE $479,950 91.59% 23 $393.93 July - December 2022 AVERAGE $406,333 93.90% 30 $344.33 CLOSED - 2 BEDROOM January - June 2023 Unit Number Square Feet Beds Baths List Date Original List Price List Price List Price per Square Foot 903 1,094 2 2 5/26/2023 $ 479,000 $ 479,000 $437.84 1703 1,094 2 2 5/22/2023 $ 425,000 $ 425,000 $388.48 2502 1,371 2 2 4/27/2023 $ 507,000 $ 499,900 $364.62 ACTIVE as of 6/30/2023 NO PENDINGS as of 6/30/2023 Average Price Per Square Foot: $393.93
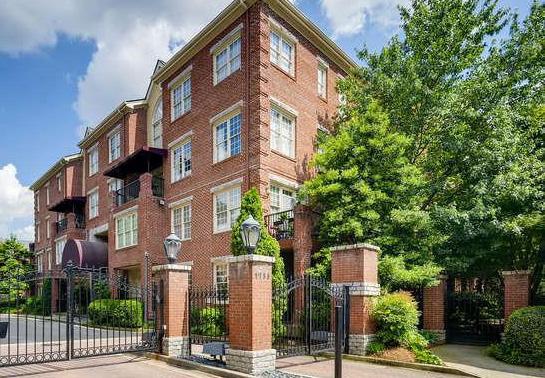
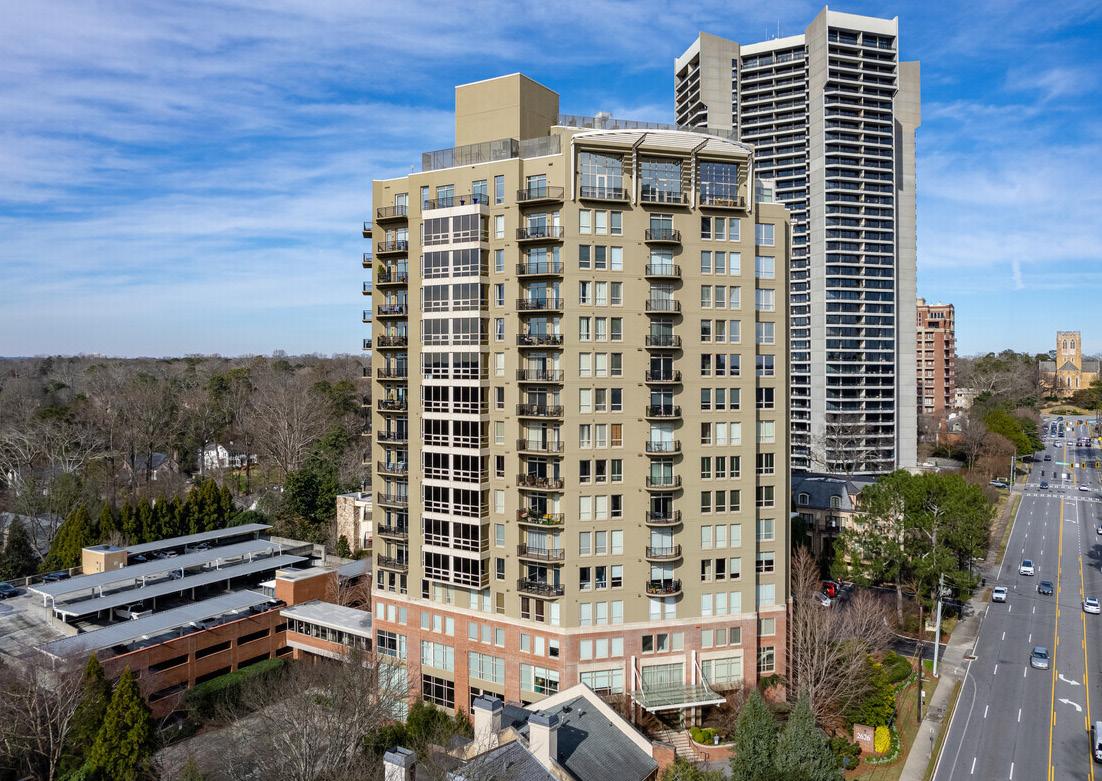
2828 PEACHTREE 2828 Peachtree Rd NW Atlanta, GA 30305
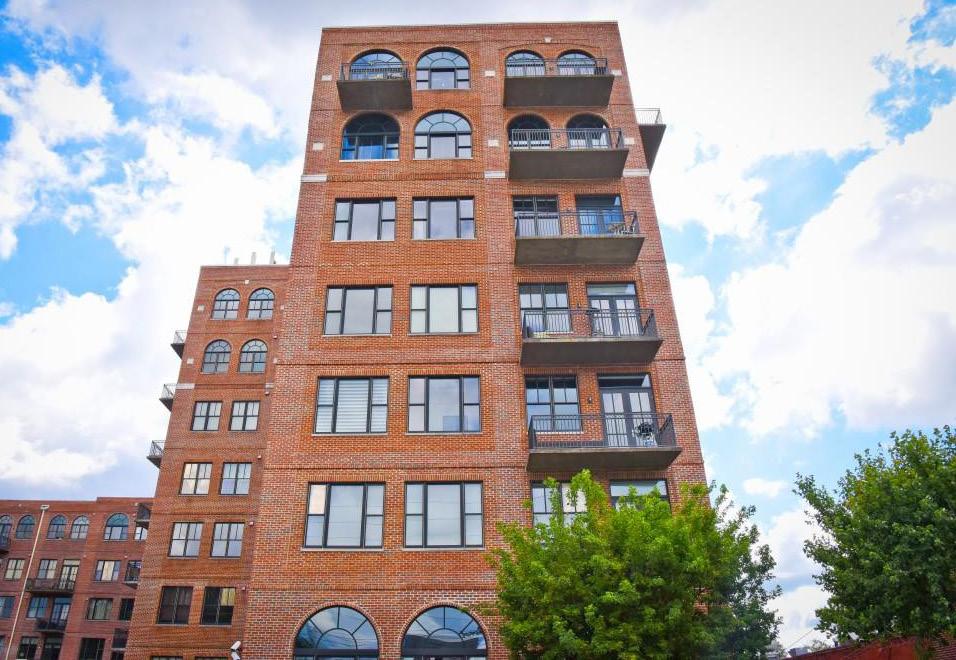
2255 & 2277 Peachtree Rd NE Atlanta, GA 30309
13
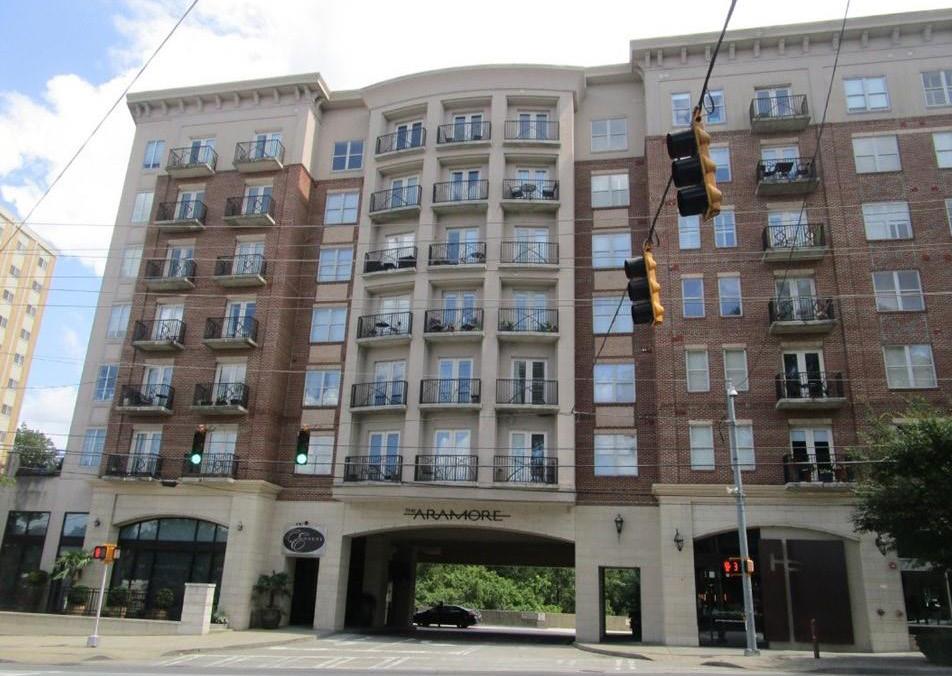
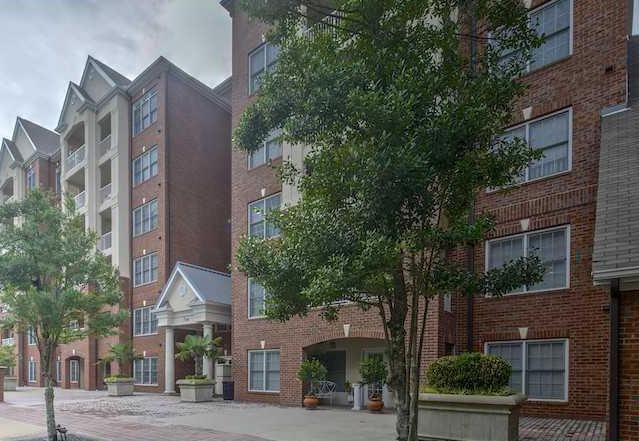
THE ARAMORE
Unit Number Square Feet Beds Baths List Date Original List Price List Price List Price per Square Foot 702 1,242 2 2 4/28/2023 $ 400,000 $ 400,000 $322.06 ACTIVE as of 6/30/2023 NO PENDINGS as of 6/30/2023 Unit Number Square Feet Original List Price Close Date Sold Price Sold Price/ Original List Price Total Days on Market Sold Price per Square Foot 808 852 $ 290,000 4/17/2023 $ 285,000 98.28% 3 $334.51 411 737 $ 245,000 3/9/2023 $ 238,000 97.14% 64 $322.93 January - June 2023 AVERAGE $261,500 97.71% 34 $328.72 July - December 2022 AVERAGE $258,500 97.51% 43 $322.50 CLOSED - 1 BEDROOM January - June 2023 Average Price Per Square Foot: $313.05
14 Unit Number Square Feet Original List Price Close Date Sold Price Sold Price/ Original List Price Total Days on Market Sold Price per Square Foot 405 1,144 $350,000 6/27/2023 $319,000 91.14% 56 $278.85 406 1,309 $ 399,900 6/14/2023 $ 390,000 97.52% 20 $297.94 602 1,242 $ 389,000 2/28/2023 $ 375,000 96.40% 9 $301.93 420 1,030 $ 350,000 6/26/2023 $ 350,000 100.00% 82 $339.81 820 1,030 $ 320,000 2/28/2023 $ 315,000 98.44% 5 $305.83 522 930 $ 325,000 2/28/2023 $ 300,000 92.31% 52 $322.58 January - June 2023 AVERAGE $341,500 95.97% 37 $307.82 July - December 2022 AVERAGE $362,500 94.71% 29 $260.11
January
CLOSED - 2 BEDROOM
- June 2023
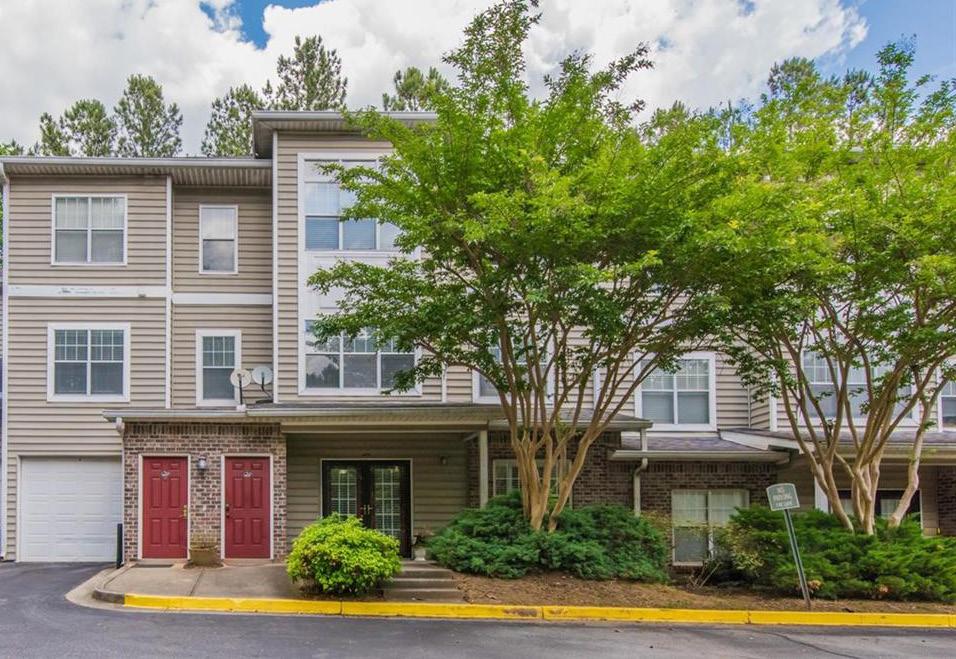
2233 Peachtree Rd NE Atlanta, GA 30309
THE ASTORIA
Unit Number Square Feet Beds Baths List Date Original List Price List Price List Price per Square Foot 1201 1,940 2 2 3/13/2023 $ 875,000 $ 850,000 $438.14 406 1,825 2 2 3/30/2023 $ 785,000 $ 765,000 $419.18 1102 1,794 2 2 6/22/2023 $ 625,000 $ 625,000 $348.38 ACTIVE as of 6/30/2023 Unit Number Square Feet Original List Price Close Date Sold Price Sold Price/ Original List Price Total Days on Market Sold Price per Square Foot 403 1,524 $ 585,000 5/22/2023 $ 590,000 100.85% 79 $387.14 January - June 2023 AVERAGE $590,000 100.85% 79 $387.14 July - December 2022 AVERAGE $763,667 94.95% 49 $370.70 CLOSED - 2 BEDROOM January - June 2023 15 Average Price Per Square Foot: $387.14 Unit Number Square Feet Beds Baths List Date Original List Price List Price List Price per Square Foot 802 1,794 2 2 2/13/2023 $ 625,000 $ 625,000 $348.38 402 1,794 2 2 2/3/2023 $ 640,000 $ 609,000 $339.46 PENDING as of 6/30/2023
16 THE BORGHESE
Northside Pkwy NW Atlanta, GA
NO PENDINGS as of 6/30/2023 Average Price Per Square Foot: $294.28 Unit Number Square Feet Beds Baths List Date Original List Price List Price List Price per Square Foot 1005 4,701 3 3 6/7/2023 $ 1,899,000 $ 1,899,000 $403.96 607 3,866 3 3 5/8/2023 $ 1,050,000 $ 1,050,000 $271.60 1201 2,683 3 3 6/22/2023 $ 935,000 $ 935,000 $348.49 407 3,866 3 3 6/1/2023 $ 900,000 $ 900,000 $232.80 ACTIVE as of 6/30/2023 Unit Number Square Feet Original List Price Close Date Sold Price Sold Price/ Original List Price Total Days on Market Sold Price per Square Foot 604 2,223 $ 762,000 3/31/2023 $ 715,000 93.83% 149 $321.64 January - June 2023 AVERAGE $715,000 93.83% 149 $321.64 July - December 2022 AVERAGE N/A N/A N/A N/A CLOSED - 2 BEDROOM January - June 2023
3286
30327
17 Unit Number Square Feet Original List Price Close Date Sold Price Sold Price/ Original List Price Total Days on Market Sold Price per Square Foot 807 4,055 $ 1,495,000 1/23/2023 $ 1,050,000 70.23% 257 $258.94 901 2,779 $ 875,000 2/27/2023 $ 840,000 96.00% 169 $302.27 January - June 2023 AVERAGE $945,000 83.12% 213 $280.60 July - December 2022 AVERAGE N/A N/A N/A N/A CLOSED - 3 BEDROOM January - June 2023

18
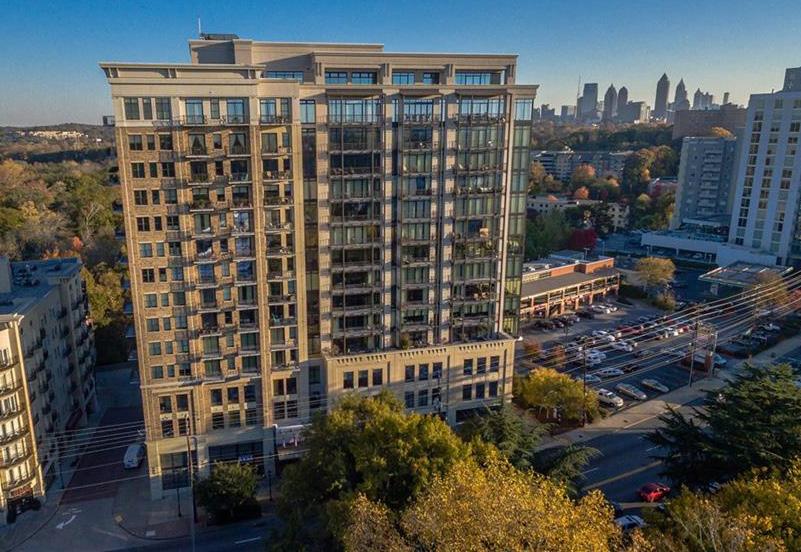
Unit Number Square Feet Beds Baths List Date Original List Price List Price List Price per Square Foot 1107 1,700 3 3 5/8/2023 $ 725,000 $ 725,000 $426.47 1104 1,521 2 2 3/30/2023 $ 670,000 $ 649,000 $426.69 1106 1,235 2 2 6/8/2023 $ 599,900 $ 599,900 $485.75 1806 1,235 2 2 4/21/2023 $ 650,000 $ 585,000 $473.68 ACTIVE as of 6/30/2023 Unit Number Square Feet Beds Baths List Date Original List Price List Price List Price per Square Foot 1203 1,381 2 2 5/12/2023 $ 599,999 $ 591,499 $428.31 PENDING as of 6/30/2023 Average Price Per Square Foot: $423.29
THE BROOKWOOD 1820 Peachtree Rd Atlanta, GA 30309
19 Unit Number Square Feet Original List Price Close Date Sold Price Sold Price/ Original List Price Total Days on Market Sold Price per Square Foot 1614 1,709 $ 815,000 4/7/2023 $ 737,200 90.45% 54 $431.36 1605 1,719 $ 729,900 3/17/2023 $ 716,000 98.10% 34 $416.52 1407 1,700 $ 719,900 6/15/2023 $ 703,000 97.65% 15 $413.53 1114 1,709 $ 748,500 2/17/2023 $ 679,000 90.71% 127 $397.31 January - June 2023 AVERAGE $708,800 94.23% 58 $414.68 July - December 2022 AVERAGE $725,750 94.71% 63 $369.96
- 3 BEDROOM January - June 2023 Unit Number Square Feet Original List Price Close Date Sold Price Sold Price/ Original List Price Total Days on Market Sold Price per Square Foot 1705 1,719 $ 982,000 6/5/2023 $ 749,900 76.36% 50 $436.24 602 1,888 $ 739,000 3/3/2023 $ 715,000 96.75% 15 $378.71 1608 1,728 $ 745,000 1/9/2023 $ 713,000 95.70% 58 $412.62 1509 1,689 $ 699,000 2/17/2023 $ 690,000 98.71% 37 $408.53 311 1,264 $ 634,900 5/4/2023 $ 633,000 99.70% 257 $500.79 606 1,235 $ 550,000 1/26/2023 $ 540,000 98.18% 117 $437.25 January - June 2023 AVERAGE $673,483 94.24% 89 $429.02 July - December 2022 AVERAGE $568,125 92.93% 54 $417.12
- 2 BEDROOM January - June 2023
CLOSED
CLOSED
Peachtree
Unit Number Square Feet Original List Price Close Date Sold Price Sold Price/ Original List Price Total Days on Market Sold Price per Square Foot 117 1,328 $ 334,900 6/20/2023 $ 335,000 100.03% 116 $252.26 January - June 2023 AVERAGE $335,000 100.03% 116 $252.26 July - December 2022 AVERAGE N/A N/A N/A N/A CLOSED - 1 BEDROOM January - June 2023 NO ACTIVES OR PENDINGS as of 6/30/2023 20 Average Price Per Square Foot: $269.82 Unit Number Square Feet Original List Price Close Date Sold Price Sold Price/ Original List Price Total Days on Market Sold Price per Square Foot 225 1,355 $ 400,000 4/13/2023 $ 390,000 97.50% 83 $287.82 312 1,355 $ 385,000 6/16/2023 $ 365,000 94.81% 234 $269.37 January - June 2023 AVERAGE $377,500 96.15% 159 $278.60 July - December 2022 AVERAGE $427,000 99.30% 15 $315.13 CLOSED - 2 BEDROOM January - June 2023
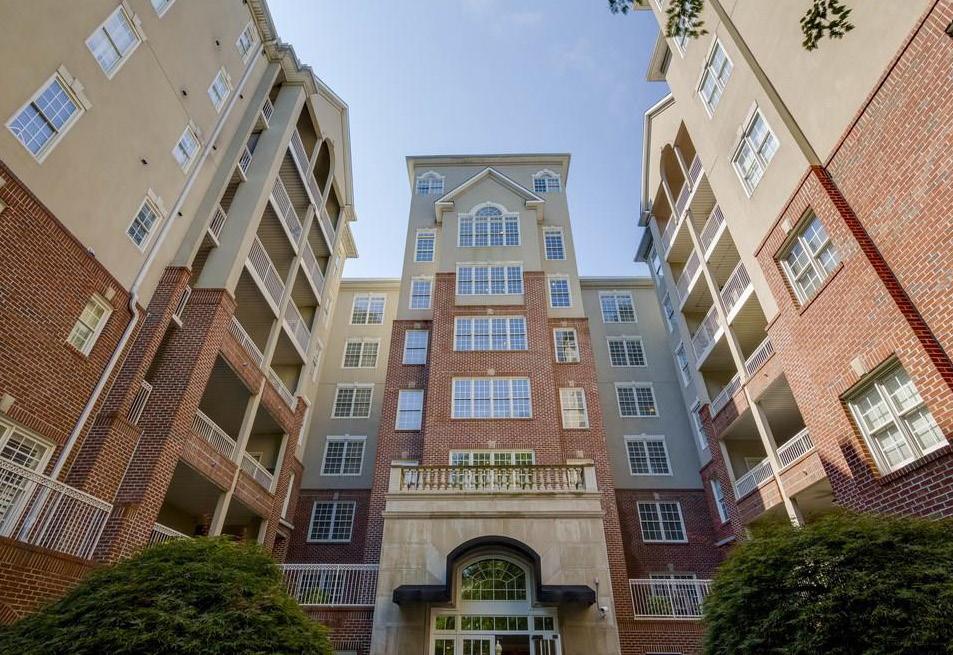
BROOKWOOD PLACE 1735
St NE Atlanta, GA 30309
21 Unit Number Square Feet Beds Baths List Date Original List Price List Price List Price per Square Foot 1607 1,270 2 2 6/15/2023 $ 525,000 $ 525,000 $413.39 1702 1,266 2 2 5/12/2023 $ 479,000 $ 460,000 $363.35 309 1,508 2 2 5/17/2023 $ 459,900 $ 449,900 $298.34 ACTIVE as of 6/30/2023 BUCKHEAD GRAND 3338 Peachtree Rd NE Atlanta, GA 30326 NO PENDINGS as of 6/30/2023 Average Price Per Square Foot: $317.63 Unit Number Square Feet Original List Price Close Date Sold Price Sold Price/ Original List Price Total Days on Market Sold Price per Square Foot 405 800 $ 287,000 6/30/2023 $287,000 100.00% 4 $358.75 2708 936 $ 299,900 4/28/2023 $ 300,000 100.03% 2 $320.51 703 1,002 $ 308,000 5/18/2023 $ 300,000 97.40% 329 $299.40 606 997 $ 289,900 4/17/2023 $ 298,500 102.97% 5 $299.40 906 997 $ 300,000 3/3/2023 $ 295,000 98.33% 43 $295.89 January - June 2023 AVERAGE $296,100 99.75% 77 $314.79 July - December 2022 AVERAGE $290,633 98.56% 12 $326.25 CLOSED - 1 BEDROOM January - June 2023
CLOSED - 2 BEDROOM January - June 2023
22 Unit Number Square Feet Original List Price Close Date Sold Price Sold Price/ Original List Price Total Days on Market Sold Price per Square Foot 2003 1,742 $ 525,000 6/12/2023 $ 525,000 100.00% 7 $301.38 2501 1,429 $ 509,900 3/31/2023 $ 490,000 96.10% 87 $342.90 707 1,270 $ 469,500 5/1/2023 $ 410,000 87.33% 212 $322.83 January - June 2023 AVERAGE $475,000 94.47% 102 $322.37 July - December 2022 AVERAGE $457,250 96.18% 67 $338.67
Unit Number Square Feet Beds Baths List Date Original List Price List Price List Price per Square Foot 602 1,585 2 2 5/26/2023 $ 585,000 $ 585,000 $369.09 919 1,125 2 2 6/16/2023 $ 430,000 $ 430,000 $382.22 ACTIVE as of 6/30/2023 BUCKHEAD VILLAGE LOFTS 3235 Roswell Rd NE Atlanta, GA 30305 NO PENDINGS as of 6/30/2023 23 Average Price Per Square Foot: $339.53 Unit Number Square Feet Original List Price Close Date Sold Price Sold Price/ Original List Price Total Days on Market Sold Price per Square Foot 408 980 $ 399,000 3/24/2023 $ 334,000 83.71% 9 $340.82 January - June 2023 AVERAGE $334,000 83.71% 9 $340.82 July - December 2022 AVERAGE $355,000 101.46% 9 $288.62 CLOSED - 1 BEDROOM January - June 2023 Unit Number Square Feet Original List Price Close Date Sold Price Sold Price/ Original List Price Total Days on Market Sold Price per Square Foot 604 1,360 $ 475,000 4/11/2023 $ 460,000 96.84% 132 $338.24 January - June 2023 AVERAGE $460,000 96.84% 132 $338.24 July - December 2022 AVERAGE $856,250 93.81% 16 $432.80 CLOSED - 2 BEDROOM January - June 2023
24 CARRINGTON PARK 2700 Pine Tree Rd NE Atlanta, GA 30324 Unit Number Square Feet Original List Price Close Date Sold Price Sold Price/ Original List Price Total Days on Market Sold Price per Square Foot 2315 748 $ 249,900 5/4/2023 $ 235,000 94.04% 35 $314.17 1107 784 $ 218,000 1/17/2023 $ 221,600 101.65% 4 $282.65 1003 784 $ 237,000 6/8/2023 $ 219,000 92.41% 31 $279.34 January - June 2023 AVERAGE $225,200 96.03% 23 $292.05 July - December 2022 AVERAGE $230,000 105.76% 5 $300.43 CLOSED - 1 BEDROOM January - June 2023 Average Price Per Square Foot: $285.14 Unit Number Square Feet Beds Baths List Date Original List Price List Price List Price per Square Foot 1114 784 1 1 6/15/2023 $ 234,900 $ 229,900 $293.24 1005 784 1 1 5/22/2023 $ 229,900 $ 219,900 $280.48 ACTIVE as of 6/30/2023 Unit Number Square Feet Beds Baths List Date Original List Price List Price List Price per Square Foot 2310 1,130 2 2 6/9/2023 $ 320,000 $ 320,000 $283.19 2011 1,130 2 2 6/12/2023 $ 295,000 $ 295,000 $261.06 PENDING as of 6/30/2023
25 Unit Number Square Feet Original List Price Close Date Sold Price Sold Price/ Original List Price Total Days on Market Sold Price per Square Foot 2112 1,130 $ 309,999 2/27/2023 $ 315,000 101.61% 2 $278.76 2314 1,130 $ 315,000 5/17/2023 $ 306,000 97.14% 69 $270.80 January - June 2023 AVERAGE $310,500 99.38% 36 $274.78 July - December 2022 AVERAGE $298,250 98.45% 31 $241.95 CLOSED - 2 BEDROOM January - June 2023

26 Unit Number Square Feet Beds Baths List Date Original List Price List Price List Price per Square Foot PH3 4,527 4 3 6/2/2023 $ 5,300,000 $ 5,300,000 $1,170.75 1102 3,867 3 3 2/24/2023 $ 3,200,000 $ 2,900,000 $749.94 1103 2,617 2 2 2/7/2023 $ 2,600,000 $ 2,400,000 $917.08 303 855 1 1 6/27/2021 $249,900 $249,900 $292.28 ACTIVE as of 6/30/2023 NO PENDINGS as of 6/30/2023 Average Price Per Square Foot: $777.11 THE CHARLES 3107 Peachtree Road NE Atlanta, GA 30305 *NEW CONSTRUCTION BUILDING Unit Number Square Feet Original List Price Close Date Sold Price Sold Price/ Original List Price Total Days on Market Sold Price per Square Foot 1201 3,290 $ 2,895,000 1/26/2023 $ 2,895,000 100.00% 76 $879.94 902 3,867 $ 3,000,000 3/30/2023 $ 2,710,000 90.33% 91 $700.80 January - June 2023 AVERAGE $2,802,500 95.17% 84 $790.37 July - December 2022 AVERAGE N/A N/A N/A N/A CLOSED - 3 BEDROOM January - June 2023
*New construction buildings may have more sales than reported in FMLS
27 Unit Number Square Feet Original List Price Close Date Sold Price Sold Price/ Original List Price Total Days on Market Sold Price per Square Foot 804 4,996 $ 3,750,000 1/5/2023 $ 3,750,000 100.00% 9 $750.60 January - June 2023 AVERAGE $3,750,000 100.00% 9 $750.60 July - December 2022 AVERAGE N/A N/A N/A N/A CLOSED - 4 BEDROOM January - June 2023
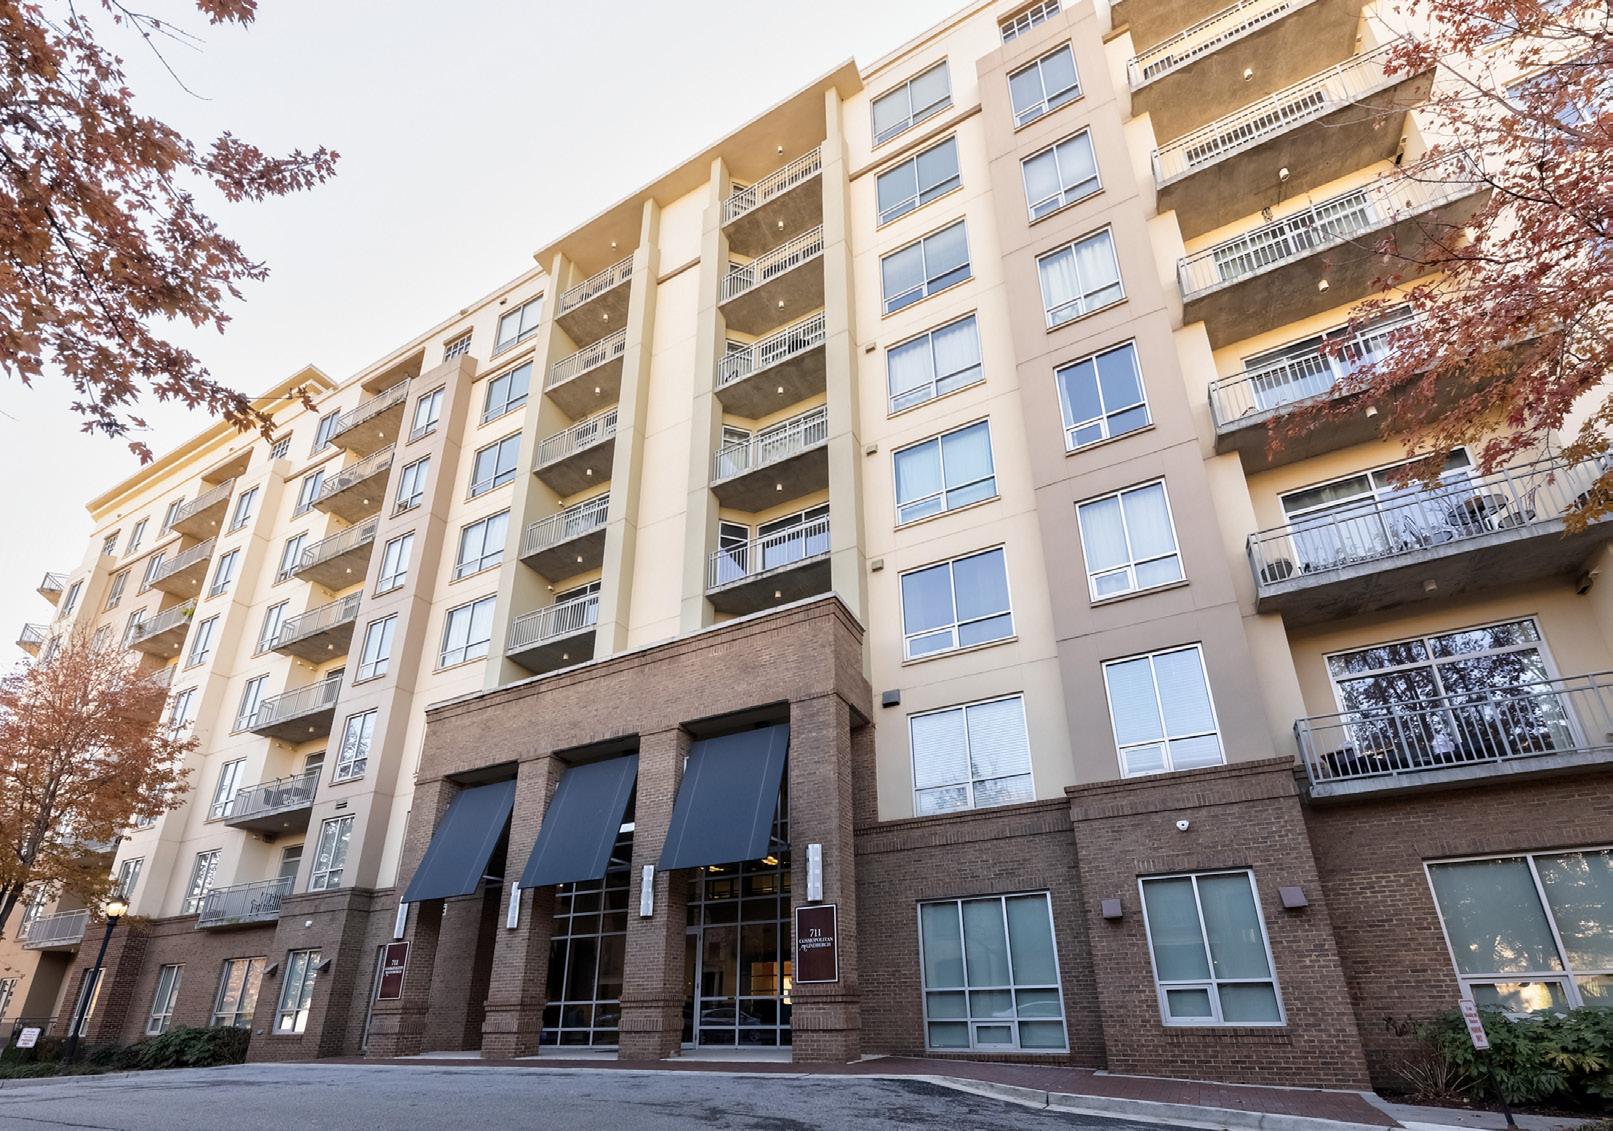
28 Unit Number Square Feet Beds Baths List Date Original List Price List Price List Price per Square Foot 207 1,489 2 2 5/2/2023 $ 430,000 $ 430,000 $288.78 624 1,061 2 2 6/28/2023 $340,000 $340,000 $320.45 ACTIVE as of 6/30/2023 Unit Number Square Feet Beds Baths List Date Original List Price List Price List Price per Square Foot 327 671 1 1 6/1/2023 $ 255,000 $ 255,000 $380.03 PENDING as of 6/30/2023 Average Price Per Square Foot: $319.95 COSMOPOLITAN AT LINDBERGH 711 Cosmopolitan Dr NE Atlanta, GA 30324 Unit Number Square Feet Original List Price Close Date Sold Price Sold Price/ Original List Price Total Days on Market Sold Price per Square Foot 409 852 $ 280,000 6/30/2023 $275,000 98.21% 27 $322.77 221 855 $ 275,000 4/12/2023 $ 275,000 100.00% 8 $321.64 447 852 $ 275,000 3/22/2023 $ 275,000 100.00% 14 $322.77 502 901 $ 285,000 3/3/2023 $ 275,000 96.49% 78 $305.22 625 671 $ 255,000 4/14/2023 $ 265,000 103.92% 17 $394.93 January - June 2023 AVERAGE $273,000 99.73% 29 $333.47 July - December 2022 AVERAGE $241,775 100.41% 8 $290.91 CLOSED - 1 BEDROOM January - June 2023
29 Unit Number Square Feet Original List Price Close Date Sold Price Sold Price/ Original List Price Total Days on Market Sold Price per Square Foot 307 1,489 $ 425,000 3/31/2023 $ 405,000 95.29% 21 $271.99 711 1,132 $ 344,000 4/14/2023 $ 340,000 98.84% 7 $300.35 January - June 2023 AVERAGE $372,500 97.07% 14 $286.17 July - December 2022 AVERAGE $343,400 95.96% 16 $294.70 CLOSED - 2 BEDROOM January - June 2023
30 Unit Number Square Feet Beds Baths List Date Original List Price List Price List Price per Square Foot 905 1,159 2 2 4/17/2023 $ 419,000 $ 419,000 $361.52 1601 1,056 2 2 3/4/2023 $ 420,000 $ 415,000 $392.99 1707 825 1 1 6/1/2023 $ 320,000 $ 320,000 $387.88 ACTIVE as of 6/30/2023 ECLIPSE 250 Pharr Rd NE Atlanta, GA 30305
Unit Number Square Feet Beds Baths List Date Original List Price List Price List Price per Square Foot 2111 779 1 1 6/23/2023 $ 314,900 $ 314,900 $404.24 218 1,427 2 2 4/11/2023 $ 475,000 $ 450,000 $315.35 2005 1,158 2 2 8/19/2022 $ 422,900 $ 422,900 $365.20 1014 791 1 1 6/1/2023 $ 310,000 $ 310,000 $391.91 PENDING as of 6/30/2023
Average Price Per Square Foot: $356.25
31 Unit Number Square Feet Original List Price Close Date Sold Price Sold Price/ Original List Price Total Days on Market Sold Price per Square Foot 315 779 $ 299,900 6/30/2023 $284,990 95.03% 102 $365.84 2114 779 $ 299,900 5/5/2023 $ 298,000 99.37% 20 $382.54 715 779 $ 314,500 5/9/2023 $ 295,000 93.80% 84 $378.69 806 771 $ 294,500 5/26/2023 $ 290,000 98.47% 8 $376.13 212 779 $ 310,000 2/3/2023 $ 290,000 93.55% 39 $372.27 1603 779 $ 295,000 3/9/2023 $ 285,000 96.61% 6 $365.85 604 790 $ 305,000 2/6/2023 $ 278,000 91.15% 146 $351.90 1204 867 $ 275,000 6/7/2023 $ 275,000 100.00% 61 $317.19 601 827 $ 265,000 5/9/2023 $ 275,000 103.77% 232 $332.53 1707 762 $ 284,900 5/18/2023 $ 275,000 96.53% 53 $360.89 1307 762 $ 275,000 5/2/2023 $ 267,000 97.09% 25 $350.39 January - June 2023 AVERAGE $282,999 96.85% 71 $359.48 July - December 2022 AVERAGE $298,467 98.48% 29 $378.99 CLOSED - 1 BEDROOM January - June 2023 Unit Number Square Feet Original List Price Close Date Sold Price Sold Price/ Original List Price Total Days on Market Sold Price per Square Foot 1313 1,233 $ 449,500 3/28/2023 $ 449,500 100.00% 2 $364.56 1509 1,003 $ 425,000 3/24/2023 $ 395,000 92.94% 12 $393.82 709 1,003 $ 395,000 5/11/2023 $ 360,000 91.14% 225 $358.92 310 1,060 $ 365,000 4/14/2023 $ 355,000 97.26% 30 $334.91 305 1,158 $ 359,900 4/28/2023 $ 340,000 94.47% 159 $293.61 January - June 2023 AVERAGE $379,900 95.16% 86 $349.16 July - December 2022 AVERAGE $405,238 97.61% 40 $333.98 CLOSED - 2 BEDROOM January - June 2023
Unit Number Square Feet Beds Baths List Date Original List Price List Price List Price per Square Foot 708 1,794 2 2 6/27/2023 $ 775,000 $ 775,000 $432.00 909 1,680 2 2 6/28/2023 $ 689,000 $ 689,000 $410.12 ACTIVE as of 6/30/2023 GALLERY 2795 Peachtree Rd Atlanta, GA 30305 NO PENDINGS as of 6/30/2023 32 Average Price Per Square Foot: $369.34 Unit Number Square Feet Original List Price Close Date Sold Price Sold Price/ Original List Price Total Days on Market Sold Price per Square Foot 1207 1,364 $ 479,000 6/20/2023 $ 455,000 94.99% 39 $333.58 707 1,364 $ 495,000 1/30/2023 $ 425,000 85.86% 196 $311.58 January - June 2023 AVERAGE $440,000 90.42% 118 $322.58 July - December 2022 AVERAGE $574,000 90.95% 82 $340.38 CLOSED - 1 BEDROOM January - June 2023
CLOSED - 2 BEDROOM January - June 2023
33 Unit Number Square Feet Original List Price Close Date Sold Price Sold Price/ Original List Price Total Days on Market Sold Price per Square Foot 1402 1,794 $ 799,000 4/18/2023 $ 799,000 100.00% 3 $445.37 1004 1,939 $ 779,000 3/16/2023 $ 770,000 98.84% 4 $397.11 801 1,680 $ 685,000 3/27/2023 $ 676,500 98.76% 8 $402.68 405 1,594 $ 629,000 6/14/2023 $ 580,000 92.21% 6 $363.86 2103 1,389 $ 519,900 2/28/2023 $ 460,000 88.48% 85 $331.17 January - June 2023 AVERAGE $657,100 95.66% 21 $388.04 July - December 2022 AVERAGE $800,000 100.00% 22 $412.58
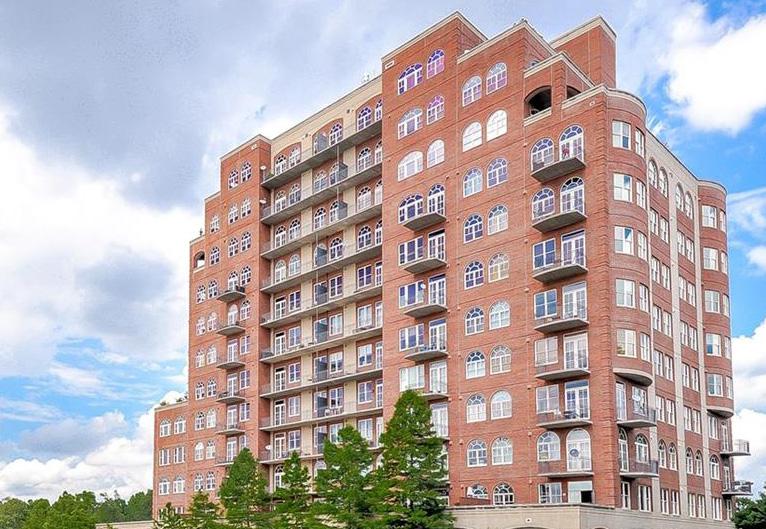
3481 Lakeside Dr NE Atlanta, GA 30326
THE GRANDVIEW
Unit Number Square Feet Beds Baths List Date Original List Price List Price List Price per Square Foot P201 2,100 3 3 6/20/2023 $ 799,900 $ 799,900 $380.90 TS3 / 3503 1,614 2 2 6/19/2023 $ 599,999 $ 599,999 $371.75 P302 1,265 2 2 3/31/2023 $ 615,000 $ 598,000 $472.73 1307 1,230 2 2 6/14/2023 $ 385,000 $ 385,000 $313.01 ACTIVE as of 6/30/2023 Unit Number Square Feet Beds Baths List Date Original List Price List Price List Price per Square Foot 1404 750 1 1 5/4/2023 $ 265,000 $ 262,500 $350.00 1805 750 1 1 5/9/2023 $ 260,000 $ 260,000 $346.67 2405 750 1 1 4/17/2023 $ 259,500 $ 259,500 $346.00
as of 6/30/2023 34 Average Price Per Square Foot: $315.33
PENDING
35 Unit Number Square Feet Original List Price Close Date Sold Price Sold Price/ Original List Price Total Days on Market Sold Price per Square Foot 2108 950 $ 265,000 4/19/2023 $ 265,000 100.00% 30 $278.95 2605 750 $ 259,000 4/24/2023 $ 250,000 96.53% 28 $333.33 804 750 $ 259,900 5/25/2023 $ 248,000 95.42% 49 $330.67 January - June 2023 AVERAGE $254,333 97.32% 36 $314.32 July - December 2022 AVERAGE $249,250 102.36% 8 $296.75 CLOSED - 1 BEDROOM January - June 2023 Unit Number Square Feet Original List Price Close Date Sold Price Sold Price/ Original List Price Total Days on Market Sold Price per Square Foot 2006 1,265 $ 392,500 4/13/2023 $ 384,900 98.06% 66 $304.27 1607 1,230 $ 385,000 1/9/2023 $ 365,000 94.81% 130 $296.75 2503 1,265 $ 375,000 4/26/2023 $ 350,000 93.33% 75 $276.68 1702 1,230 $ 365,000 4/17/2023 $ 349,350 95.71% 4 $284.02 January - June 2023 AVERAGE $362,313 95.48% 69 $290.43 July - December 2022 AVERAGE $346,400 98.66% 35 $291.88 CLOSED - 2 BEDROOM January - June 2023 Unit Number Square Feet Original List Price Close Date Sold Price Sold Price/ Original List Price Total Days on Market Sold Price per Square Foot P301 2,100 $ 799,900 6/2/2023 $ 790,000 98.76% 50 $376.19 P101 2,100 $ 750,000 6/7/2023 $ 750,000 100.00% 70 $357.14 January - June 2023 AVERAGE $770,000 99.38% 60 $366.67 July - December 2022 AVERAGE N/A N/A N/A N/A CLOSED - 3 BEDROOM January - June 2023
36 Unit Number Square Feet Beds Baths List Date Original List Price List Price List Price per Square Foot 903 2,557 2 3 1/23/2023 $ 2,339,000 $ 2,339,000 $914.74 703 2,557 2 3 1/23/2023 $ 2,149,000 $ 2,149,000 $840.44 501 2,528 2 3 6/15/2023 $ 1,999,000 $ 1,999,000 $790.74 401 2,528 2 3 12/16/2022 $1,939,000 $1,939,000 $767.01 ACTIVE as of 6/30/2023 THE GRAYDON BUCKHEAD 2520 Peachtree Road Atlanta, GA 30305 Average Price Per Square Foot: $963.69 Unit Number Square Feet Beds Baths List Date Original List Price List Price List Price per Square Foot 1202 2,170 2 3 1/19/2023 $ 2,550,000 $ 2,550,000 $1,175.12 2102 7,200 3 4 6/20/2023 $ 8,950,000 $ 7,950,000 $1,104.17
6/30/2023
PENDING as of
*New construction buildings may have more sales than reported in FMLS
37 Unit Number Square Feet Original List Price Close Date Sold Price Sold Price/ Original List Price Total Days on Market Sold Price per Square Foot 1201 2,557 $ 2,559,000 6/20/2023 $ 2,524,000 98.63% 357 $987.09 1101 2,528 $ 2,499,000 6/26/2023 $ 2,399,000 96.00% 220 $948.97 1402 2,170 $ 2,149,000 5/15/2023 $ 2,000,000 93.07% 350 $921.66 802 2,170 $ 1,875,000 6/7/2023 $ 1,720,000 91.73% 240 $792.63 January - June 2023 AVERAGE $2,160,750 94.86% 292 $912.59 July - December 2022 AVERAGE $1,899,500 99.65% 129 $875.35
January - June 2023 Unit Number Square Feet Original List Price Close Date Sold Price Sold Price/ Original List Price Total Days on Market Sold Price per Square Foot 1701 3,510 $ 4,250,000 3/16/2023 $ 4,100,000 96.47% 57 $1,168.09 January - June 2023 AVERAGE $4,100,000 96.47% 57 $1,168.09 July - December 2022 AVERAGE $3,955,000 109.89% 65 $1,126.78
January - June 2023
CLOSED - 2 BEDROOM
CLOSED - 3 BEDROOM
38
Unit Number Square Feet Beds Baths List Date Original List Price List Price List Price per Square Foot 1102 1,693 2 2 6/15/2023 $ 625,000 $ 625,000 $369.17 ACTIVE as of 6/30/2023 Unit Number Square Feet Beds Baths List Date Original List Price List Price List Price per Square Foot 2604 1,326 2 2 6/13/2023 $ 400,000 $ 400,000 $301.66 PENDING as of 6/30/2023 Unit Number Square Feet Original List Price Close Date Sold Price Sold Price/ Original List Price Total Days on Market Sold Price per Square Foot 2207 1,693 $ 475,000 3/16/2023 $ 465,000 97.89% 11 $274.66 January - June 2023 AVERAGE $465,000 97.89% 11 $274.66 July - December 2022 AVERAGE $418,229 97.09% 27 $264.07 CLOSED - 2 BEDROOM January - June 2023 Average Price Per Square Foot: $274.66
HERITAGE PLACE 211 Colonial Homes Dr NW Atlanta, GA 30309
39
50 Biscayne Dr NW Atlanta, GA 30309 Unit Number Square Feet Original List Price Close Date Sold Price Sold Price/ Original List Price Total Days on Market Sold Price per Square Foot 5112 1,535 $ 390,000 6/1/2023 $ 400,000 102.56% 5 $260.59 5103 1,350 $ 380,000 2/14/2023 $ 346,500 91.18% 79 $256.67 January - June 2023 AVERAGE $373,250 96.87% 42 $258.63 July - December 2022 AVERAGE $367,500 98.03% 51 $239.41 CLOSED - 2 BEDROOM January - June 2023 NO ACTIVES OR PENDINGS as of 6/30/2023 Average Price Per Square Foot: $258.63
MANOR HOUSE
EXCHANGE
Unit Number Square Feet Beds Baths List Date Original List Price List Price List Price per Square Foot 1206 1,775 2 2 12/5/2022 $749,000 $655,000 $369.01 ACTIVE as of 6/30/2023 Unit Number Square Feet Beds Baths List Date Original List Price List Price List Price per Square Foot 906 3,066 3 3 4/10/2023 $ 1,195,000 $ 1,175,000 $383.24 PENDING as of 6/30/2023 40 Unit Number Square Feet Original List Price Close Date Sold Price Sold Price/ Original List Price Total Days on Market Sold Price per Square Foot 803 1,014 $ 385,000 4/21/2023 $ 315,000 81.82% 88 $310.65 January - June 2023 AVERAGE $315,000 81.82% 88 $310.65 July - December 2022 AVERAGE $507,000 96.75% 73 $423.85 CLOSED - 1 BEDROOM January - June 2023 Average Price Per Square Foot: $320.32
MATHIESON
3180 Mathieson Dr NE Atlanta, GA 30305
41 Unit Number Square Feet Original List Price Close Date Sold Price Sold Price/ Original List Price Total Days on Market Sold Price per Square Foot 1007 2,029 $ 650,000 4/25/2023 $ 635,000 97.69% 5 $312.96 701 1,497 $ 498,500 6/14/2023 $ 505,000 101.30% 8 $337.34 January - June 2023 AVERAGE $570,000 99.50% 7 $325.15 July - December 2022 AVERAGE $522,500 95.89% 88 $384.76 CLOSED - 2 BEDROOM January - June 2023
3334 Peachtree Rd NE Atlanta, GA 30326
42
MERIDIAN BUCKHEAD
Unit Number Square Feet Beds Baths List Date Original List Price List Price List Price per Square Foot 1209 & 1210 3,246 3 3 1/27/2023 $ 2,200,000 $ 1,950,000 $600.74 ACTIVE as of 6/30/2023 Unit Number Square Feet Beds Baths List Date Original List Price List Price List Price per Square Foot 1407 1,567 2 2 5/11/2023 $ 424,900 $ 399,900 $255.20 1903 3,142 3 3 5/10/2023 $ 899,900 $ 899,900 $286.41 308 1,804 2 2 5/10/2023 $ 415,000 $ 399,900 $221.67 PENDING as of 6/30/2023 Average Price Per Square Foot: $299.10 Unit Number Square Feet Original List Price Close Date Sold Price Sold Price/ Original List Price Total Days on Market Sold Price per Square Foot 902 998 $ 318,000 5/3/2023 $ 300,000 94.34% 21 $300.60 1002 998 $ 320,000 3/6/2023 $ 292,000 91.25% 201 $292.59 301 1,025 $ 275,000 5/17/2023 $ 281,571 102.39% 199 $274.70 411 794 $ 270,000 5/15/2023 $ 258,825 95.86% 73 $325.98 904 793 $ 270,000 5/25/2023 $ 255,000 94.44% 40 $321.56 January - June 2023 AVERAGE $277,479 95.66% 107 $303.09 July - December 2022 AVERAGE $276,333 98.83% 44 $321.92
BEDROOM
CLOSED - 1
January - June 2023
43 Unit Number Square Feet Original List Price Close Date Sold Price Sold Price/ Original List Price Total Days on Market Sold Price per Square Foot 1112 1,424 $ 415,000 5/12/2023 $ 397,500 95.78% 261 $279.14 January - June 2023 AVERAGE $397,500 95.78% 261 $279.14 July - December 2022 AVERAGE $392,500 92.63% 129 $279.00 CLOSED - 2 BEDROOM January - June 2023
3040 Peachtree Rd NW Atlanta, GA 30305
44
OVATION
Unit Number Square Feet Beds Baths List Date Original List Price List Price List Price per Square Foot 412 1,250 2 2 2/24/2023 $ 479,990 $ 458,900 $367.12 1104 1,233 2 2 6/16/2023 $ 435,000 $ 435,000 $352.80 208 800 1 1 4/26/2023 $ 265,000 $ 199,000 $248.75 ACTIVE as of 6/30/2023 Unit Number Square Feet Beds Baths List Date Original List Price List Price List Price per Square Foot 703 1,233 2 2 6/10/2023 $ 450,000 $ 450,000 $364.96 1507 800 1 1 1/20/2023 $ 318,000 $ 305,000 $381.25 809 800 1 1 6/7/2023 $ 295,000 $ 295,000 $368.75 PENDING as of 6/30/2023 Average Price Per Square Foot: $363.53
45 Unit Number Square Feet Original List Price Close Date Sold Price Sold Price/ Original List Price Total Days on Market Sold Price per Square Foot 603 1,233 $ 499,900 5/26/2023 $ 489,900 98.00% 21 $397.32 1312 1,233 $ 500,000 3/23/2023 $ 484,000 96.80% 64 $392.54 January - June 2023 AVERAGE $486,950 97.40% 43 $394.93 July - December 2022 AVERAGE $444,000 98.67% 5 $360.10 CLOSED - 2 BEDROOM January - June 2023 Unit Number Square Feet Original List Price Close Date Sold Price Sold Price/ Original List Price Total Days on Market Sold Price per Square Foot 408 800 $ 248,000 6/29/2023 $248,000 100.00% 6 $310.00 815 1,018 $ 342,000 3/10/2023 $ 325,000 95.03% 58 $319.25 1808 800 $ 315,000 1/6/2023 $ 320,500 101.75% 28 $400.63 906 800 $ 310,000 2/8/2023 $ 285,000 91.94% 164 $356.25 1313 761 $ 295,000 3/22/2023 $ 272,500 92.37% 104 $358.08 506 800 $ 269,000 2/8/2023 $ 269,000 100.00% 8 $336.25 305 633 $ 243,900 5/5/2023 $ 246,217 100.95% 30 $388.97 205 633 $ 240,000 3/6/2023 $ 238,000 99.17% 17 $375.99 January - June 2023 AVERAGE $275,527 97.65% 52 $355.68 July - December 2022 AVERAGE $282,500 98.82% 19 $363.94 CLOSED - 1 BEDROOM January - June 2023
46
325 E Paces Ferry Rd NE Atlanta, GA 30305 NO ACTIVES as of 6/30/2023 Unit Number Square Feet Beds Baths List Date Original List Price List Price List Price per Square Foot 1909 869 1 1 10/4/2022 $ 315,000 $ 289,000 $332.57 PENDING as of 6/30/2023 Average Price Per Square Foot: $314.47 Unit Number Square Feet Original List Price Close Date Sold Price Sold Price/ Original List Price Total Days on Market Sold Price per Square Foot 903 979 $ 298,000 3/1/2023 $ 309,000 103.69% 6 $315.63 1107 874 $ 290,000 4/17/2023 $ 290,000 100.00% 7 $331.81 907 874 $ 289,900 2/21/2023 $ 289,900 100.00% 6 $331.69 312 922 $ 297,500 4/10/2023 $ 285,000 95.80% 33 $309.11 304 869 $ 289,000 5/9/2023 $ 273,000 94.46% 95 $314.15 809 869 $ 275,000 3/31/2023 $ 270,000 98.18% 66 $310.70 January - June 2023 AVERAGE $286,150 98.69% 36 $318.85 July - December 2022 AVERAGE $284,950 100.48% 9 $300.76 CLOSED - 1 BEDROOM January - June 2023
PACES 325
CLOSED - 2 BEDROOM January - June 2023
47 Unit Number Square Feet Original List Price Close Date Sold Price Sold Price/ Original List Price Total Days on Market Sold Price per Square Foot 1705 1,491 $ 495,000 4/3/2023 $ 455,000 91.92% 172 $305.16 1702 1,333 $ 450,000 3/13/2023 $ 450,000 100.00% 10 $337.58 908 1,417 $ 450,000 6/15/2023 $ 438,000 97.33% 16 $309.10 1708 1,417 $ 458,000 2/28/2023 $ 428,000 93.45% 37 $302.05 811 1,344 $ 415,000 6/16/2023 $ 400,000 96.39% 120 $297.62 1201 1,275 $ 420,000 5/3/2023 $ 400,000 95.24% 162 $313.73 1701 1,275 $ 417,000 6/20/2023 $ 395,000 94.72% 211 $309.80 January - June 2023 AVERAGE $423,714 95.58% 104 $310.72 July - December 2022 AVERAGE $441,000 95.72% 28 $335.67
Unit Number Square Feet Beds Baths List Date Original List Price List Price List Price per Square Foot 3602 1,857 2 2 3/31/2023 $ 699,800 $ 599,000 $322.56 1207 1,363 2 2 5/9/2023 $ 465,000 $ 465,000 $341.16 3108 1,303 1 1 5/19/2023 $ 399,000 $ 399,000 $306.22 2002 972 1 1 5/31/2023 $ 334,000 $ 334,000 $343.62 ACTIVE as of 6/30/2023 Unit Number Square Feet Beds Baths List Date Original List Price List Price List Price per Square Foot 2604 1,363 2 2 6/1/2023 $ 475,000 $ 475,000 $348.50 404 1,363 2 2 11/15/2022 $ 430,000 $ 424,000 $311.08 608 1,303 1 1 3/16/2023 $ 355,000 $ 349,500 $268.23
as of 6/30/2023 48 Average Price Per Square Foot: $305.97
PARAMOUNT AT BUCKHEAD 3445 Stratford Rd NE Atlanta, GA 30326
PENDING
CLOSED - 1 BEDROOM January - June 2023
CLOSED - 2 BEDROOM January - June 2023
49 Unit Number Square Feet Original List Price Close Date Sold Price Sold Price/ Original List Price Total Days on Market Sold Price per Square Foot 3405 1,764 $ 555,900 6/29/2023 $537,000 96.60% 262 $304.42 3105 1,764 $ 629,000 4/12/2023 $ 615,000 97.77% 1 $348.64 3201 1,776 $ 613,500 5/26/2023 $ 611,000 99.59% 272 $344.03 2504 1,363 $ 475,000 5/18/2023 $ 465,000 97.89% 50 $341.16 3107 1,363 $ 460,000 4/4/2023 $ 448,000 97.39% 92 $328.69 2804 1,363 $ 450,000 2/14/2023 $ 435,000 96.67% 15 $319.15 3307 1,363 $ 335,000 3/1/2023 $ 335,000 100.00% 8 $245.78 January - June 2023 AVERAGE $492,286 97.99% 100 $318.84 July - December 2022 AVERAGE $538,750 95.91% 55 $321.21
Unit Number Square Feet Original List Price Close Date Sold Price Sold Price/ Original List Price Total Days on Market Sold Price per Square Foot 609 972 $ 305,000 6/5/2023 $305,000 100.00% 12 $313.79 2303 1,303 $ 365,000 5/26/2023 $ 370,000 101.37% 255 $283.96 2803 1,303 $ 375,000 1/30/2023 $ 357,000 95.20% 157 $273.98 1603 1,303 $ 369,000 4/18/2023 $ 345,000 93.50% 208 $264.77 308 1,303 $ 347,500 5/5/2023 $ 335,000 96.40% 19 $257.10 3402 972 $ 327,000 3/31/2023 $ 334,000 102.14% 5 $343.62 302 972 $ 309,000 6/16/2023 $ 302,000 97.73% 48 $310.70 1109 972 $ 302,000 3/31/2023 $ 297,000 98.34% 2 $305.56 1005 880 $ 275,000 3/1/2023 $ 273,000 99.27% 9 $310.23 January - June 2023 AVERAGE $324,222 98.22% 79 $295.97 July - December 2022 AVERAGE $315,678 96.79% 86 $296.15
50
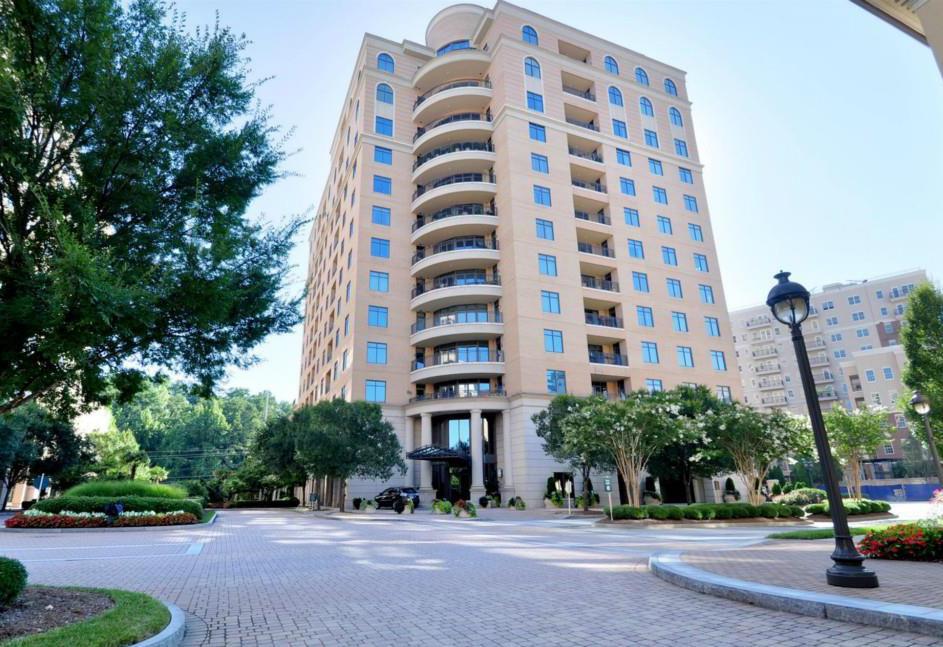
Unit Number Square Feet Beds Baths List Date Original List Price List Price List Price per Square Foot 37E 2,483 2 2 6/1/2023 $ 1,530,000 $ 1,530,000 $616.19 16N 2,842 2 2 6/13/2023 $ 1,100,000 $ 1,100,000 $387.05 ACTIVE as of 6/30/2023 Unit Number Square Feet Original List Price Close Date Sold Price Sold Price/ Original List Price Total Days on Market Sold Price per Square Foot 39SE 3,100 $ 1,750,000 1/30/2023 $ 1,530,000 87.43% 88 $493.55 12S 2,262 $ 1,379,000 1/27/2023 $ 1,359,000 98.55% 27 $600.80 30N 2,842 $ 1,399,000 2/24/2023 $ 1,100,000 78.63% 348 $387.05 January - June 2023 AVERAGE $1,329,667 88.20% 154 $493.80 July - December 2022 AVERAGE $800,000 96.50% 43 $353.67 CLOSED - 2 BEDROOM January - June 2023 Average Price Per Square Foot: $470.81 NO PENDINGS as of 6/30/2023
PARK AVENUE 750 Park Ave NE Atlanta, GA 30326
CLOSED - 3 BEDROOM January - June 2023
51 Unit Number Square Feet Original List Price Close Date Sold Price Sold Price/ Original List Price Total Days on Market Sold Price per Square Foot 32SE 3,373 $ 2,420,000 3/23/2023 $ 1,900,000 78.51% 61 $563.30 34SE 3,373 $ 1,549,000 2/9/2023 $ 1,430,000 92.32% 93 $423.95 29W 2,842 $ 1,399,000 3/20/2023 $ 1,347,500 96.32% 49 $474.14 15W 3,422 $ 1,300,000 5/1/2023 $ 1,207,500 92.88% 7 $352.86 January - June 2023 AVERAGE $1,471,250 90.01% 53 $453.56 July - December 2022 AVERAGE $1,100,000 91.67% 0 $322.86
2660 Peachtree Rd Atlanta, GA 30305
52
PARK PLACE ON PEACHTREE
Unit Number Square Feet Beds Baths List Date Original List Price List Price List Price per Square Foot 16E 2,951 3 3 3/20/2023 $ 1,650,000 $ 1,650,000 $559.13 39H 2,403 2 2 3/16/2023 $ 1,295,000 $ 1,295,000 $538.91 38F 2,403 2 2 1/13/2023 $ 1,275,000 $ 1,245,000 $518.10 29F 2,403 2 2 6/23/2023 $ 1,195,000 $ 1,195,000 $497.30 25E 2,951 2 2 5/9/2023 $ 1,099,000 $ 999,900 $338.83 23B 2,403 2 2 4/3/2023 $ 895,000 $ 849,000 $353.31 ACTIVE as of 6/30/2023 Average Price Per Square Foot: $382.21 Unit Number Square Feet Beds Baths List Date Original List Price List Price List Price per Square Foot 34G 2,403 2 2 4/25/2023 $ 995,000 $ 995,000 $414.07 PENDING as of 6/30/2023 Unit Number Square Feet Original List Price Close Date Sold Price Sold Price/ Original List Price Total Days on Market Sold Price per Square Foot 9H 2,403 $ 1,025,000 4/25/2023 $ 940,000 91.71% 46 $391.18 21H 2,403 $ 999,000 4/3/2023 $ 940,000 94.09% 47 $391.18 January - June 2023 AVERAGE $940,000 92.90% 47 $391.18 July - December 2022 AVERAGE $1,199,000 100.00% 21 $406.30 CLOSED - 2 BEDROOM January - June 2023
53 Unit Number Square Feet Original List Price Close Date Sold Price Sold Price/ Original List Price Total Days on Market Sold Price per Square Foot 22E 2,951 $ 1,250,000 4/10/2023 $ 1,075,000 86.00% 123 $364.28 January - June 2023 AVERAGE $1,075,000 86.00% 123 $364.28 July - December 2022 AVERAGE $1,120,000 66.83% 167 $360.33 CLOSED - 3 BEDROOM January - June 2023
54 PARK REGENCY 700 Park Regency Pl NE Atlanta, GA 30326 Unit Number Square Feet Beds Baths List Date Original List Price List Price List Price per Square Foot 1501 2,245 2 2 1/27/2023 $ 859,000 $ 859,000 $382.63 605 2,495 3 3 5/5/2023 $ 799,000 $ 765,000 $306.61 706 1,667 2 2 5/12/2023 $ 670,000 $ 670,000 $401.92 704 1,680 2 2 4/12/2023 $ 669,900 $ 669,400 $398.45 2004 1,680 2 2 5/12/2023 $ 659,900 $ 659,900 $392.80 ACTIVE as of 6/30/2023 NO PENDINGS as of 6/30/2023 Unit Number Square Feet Original List Price Close Date Sold Price Sold Price/ Original List Price Total Days on Market Sold Price per Square Foot 2007 1,940 $ 700,000 5/15/2023 $ 700,000 100.00% 29 $360.82 1906 1,667 $ 695,000 5/22/2023 $ 650,000 93.53% 38 $389.92 1306 1,667 $ 615,000 5/26/2023 $ 605,000 98.37% 8 $362.93 1108 1,384 $ 495,000 3/1/2023 $ 450,000 90.91% 178 $325.14 January - June 2023 AVERAGE $601,250 95.70% 63 $359.70 July - December 2022 AVERAGE $582,883 94.64% 46 $320.90 CLOSED - 2 BEDROOM January - June 2023 Average Price Per Square Foot: $357.98
55 Unit Number Square Feet Original List Price Close Date Sold Price Sold Price/ Original List Price Total Days on Market Sold Price per Square Foot 805 2,495 $ 856,000 5/18/2023 $ 876,000 102.34% 3 $351.10 January - June 2023 AVERAGE $876,000 102.34% 3 $351.10 July - December 2022 AVERAGE N/A N/A N/A N/A CLOSED - 3 BEDROOM January - June 2023
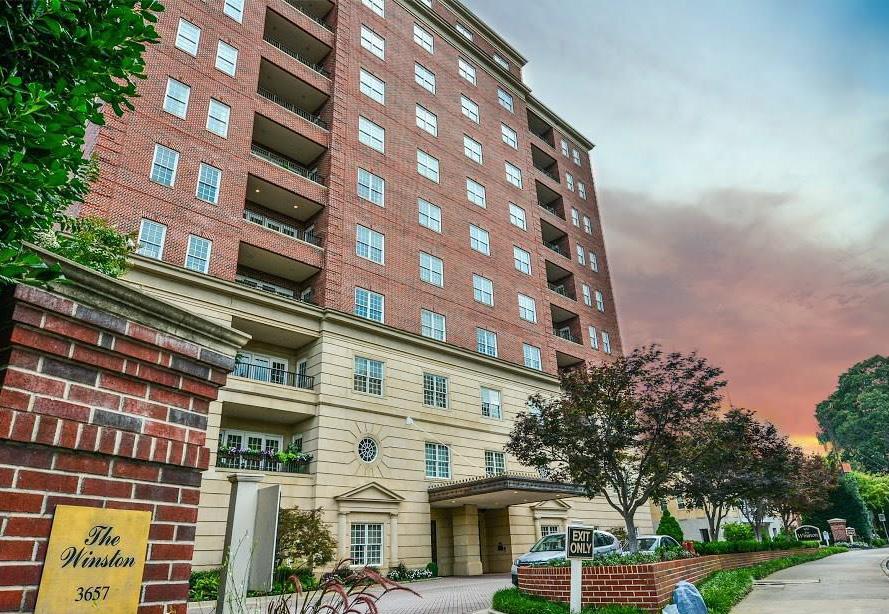
Unit Number Square Feet Beds Baths List Date Original List Price List Price List Price per Square Foot 1007 2,100 3 3 5/11/2023 $ 659,000 $ 675,000 $321.43 903 1,488 2 2 11/11/2022 $500,000 $425,000 $285.62 ACTIVE as of 6/30/2023 NO PENDINGS as of 6/30/2023 56 Average Price Per Square Foot: $264.50 Unit Number Square Feet Original List Price Close Date Sold Price Sold Price/ Original List Price Total Days on Market Sold Price per Square Foot 203 798 $ 230,000 2/16/2023 $ 206,500 89.78% 40 $258.77 January - June 2023 AVERAGE $206,500 89.78% 40 $258.77 July - December 2022 AVERAGE $247,500 92.74% 17 $379.60 CLOSED - 1 BEDROOM January - June 2023 Unit Number Square Feet Original List Price Close Date Sold Price Sold Price/ Original List Price Total Days on Market Sold Price per Square Foot 412 1,717 $ 442,500 4/10/2023 $ 442,500 100.00% 253 $257.72 901 1,500 $ 429,000 5/31/2023 $ 415,500 96.85% 36 $277.00 January - June 2023 AVERAGE $429,000 98.43% 145 $267.36 July - December 2022 AVERAGE $550,000 91.67% 119 $260.05 CLOSED - 2 BEDROOM January - June 2023
THE PEACHTREE RESIDENCES 2626 Peachtree Rd Atlanta, GA 30305
57
ON
Peachtree
Atlanta,
Unit Number Square Feet Beds Baths List Date Original List Price List Price List Price per Square Foot 2201 3,157 3 3 3/8/2023 $ 1,494,000 $ 1,350,000 $427.62 701 2,184 2 2 3/30/2023 $ 750,000 $ 750,000 $343.41 ACTIVE as of 6/30/2023 Average Price Per Square Foot: N/A
PHOENIX
PEACHTREE 2881
Rd
GA 30305
NO CLOSED SALES - January - June 2023 NO PENDINGS as of 6/30/2023
2575 Peachtree Rd Atlanta, GA 30305
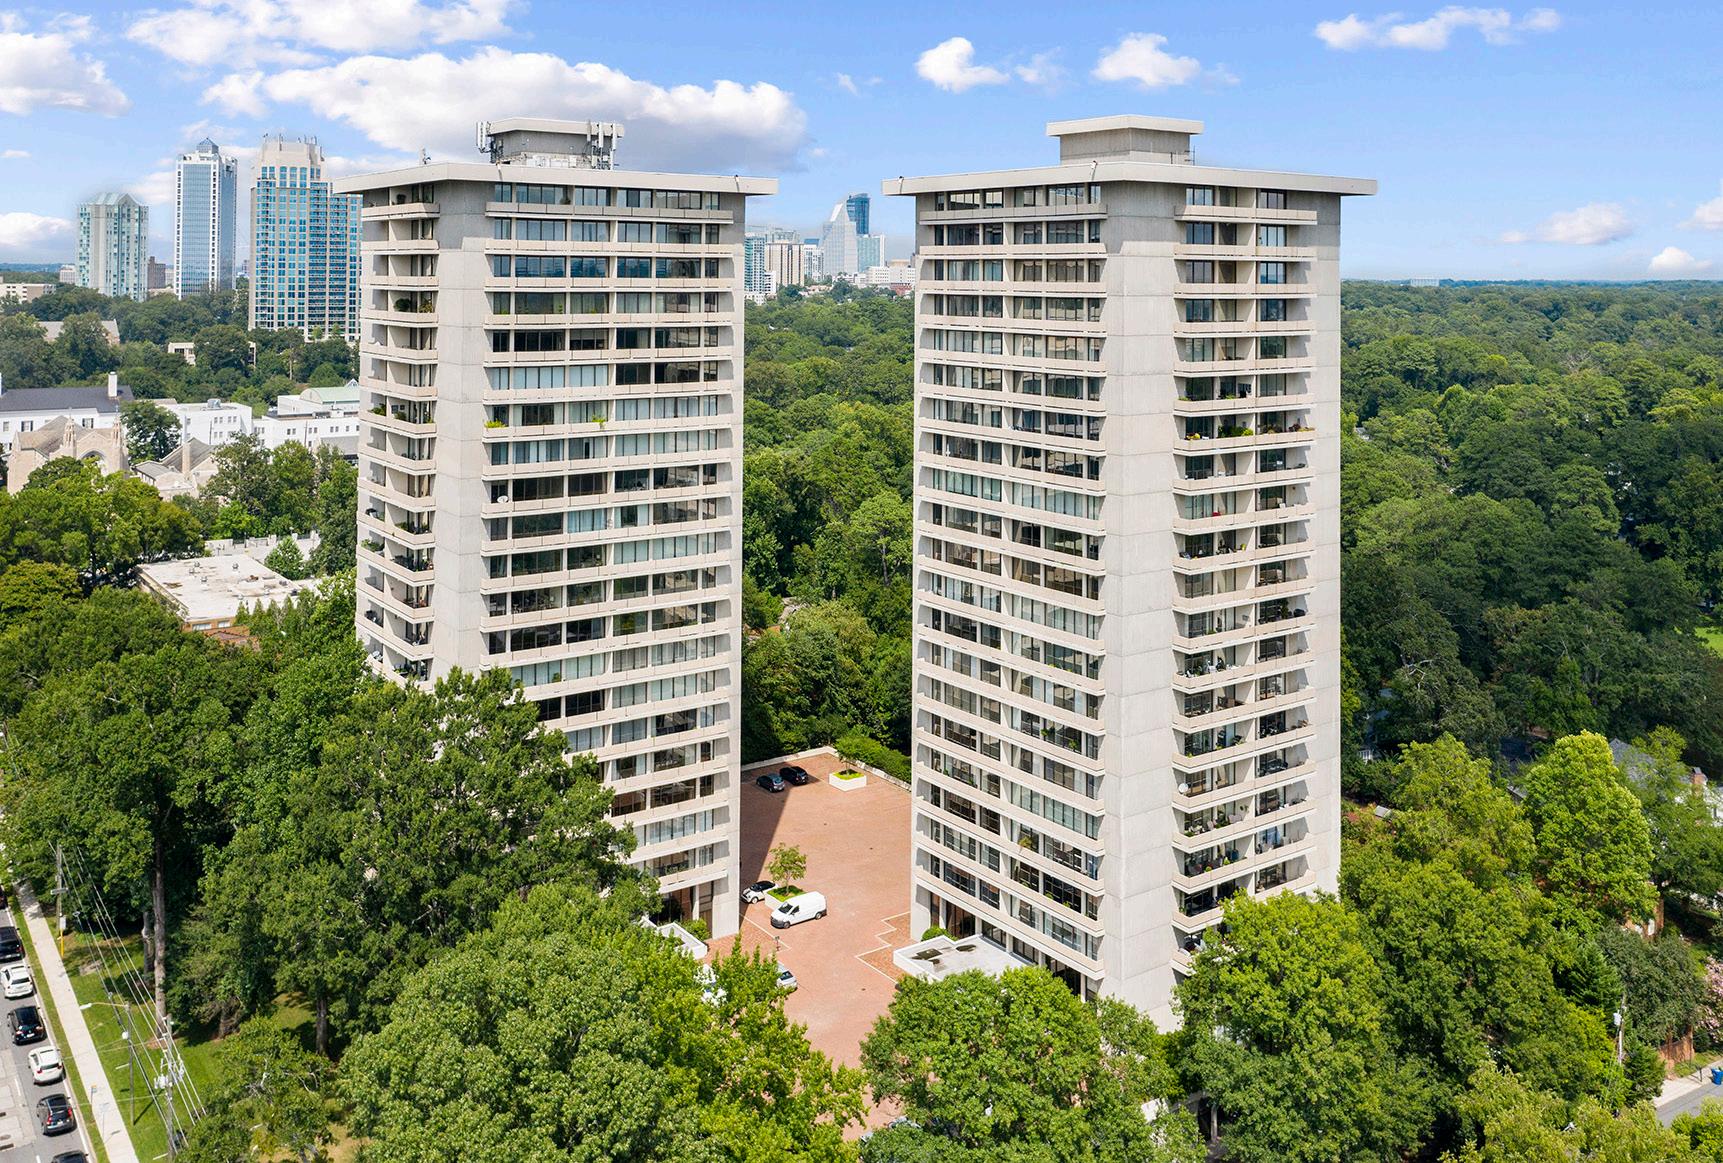
PLAZA TOWERS
Unit Number Square Feet Beds Baths List Date Original List Price List Price List Price per Square Foot 24C 5,300 3 3 5/17/2023 $ 1,895,000 $ 1,895,000 $357.55 25G-H 3,188 3 4 5/3/2023 $ 1,235,000 $ 1,235,000 $387.39 21H 1,594 2 2 4/10/2023 $ 975,000 $ 975,000 $611.67 2H 1,477 2 2 3/16/2023 $ 699,000 $ 699,000 $473.26 14F 1,594 2 2 5/11/2023 $ 650,000 $ 650,000 $407.78 5C 744 1 1 1/27/2023 $ 325,000 $ 325,000 $436.83 ACTIVE as of 6/30/2023 Unit Number Square Feet Original List Price Close Date Sold Price Sold Price/ Original List Price Total Days on Market Sold Price per Square Foot 21-A 1,594 $ 600,000 6/19/2023 $ 555,000 92.50% 56 $348.18 24H 1,244 $ 499,000 5/25/2023 $ 480,000 96.19% 26 $385.85 January - June 2023 AVERAGE $517,500 94.35% 41 $367.02 July - December 2022 AVERAGE N/A N/A N/A N/A CLOSED - 1 BEDROOM January - June 2023 58 Average Price Per Square Foot: $352.13 NO PENDINGS as of 6/30/2023
59 Unit Number Square Feet Original List Price Close Date Sold Price Sold Price/ Original List Price Total Days on Market Sold Price per Square Foot 20G 3,188 $ 1,850,000 5/31/2023 $ 1,775,000 95.95% 21 $556.78 11C 1,594 $ 679,000 1/30/2023 $ 600,000 88.37% 41 $376.41 8G 1,594 $ 539,000 5/11/2023 $ 505,000 93.69% 60 $316.81 6G 1,594 $ 425,000 5/4/2023 $ 400,000 94.12% 26 $250.94 January - June 2023 AVERAGE $820,000 93.03% 37 $375.24 July - December 2022 AVERAGE $441,768 82.77% 136 $277.14 CLOSED - 2 BEDROOM January - June 2023 Unit Number Square Feet Original List Price Close Date Sold Price Sold Price/ Original List Price Total Days on Market Sold Price per Square Foot 5G 2,457 $ 995,000 6/9/2023 $ 565,000 56.78% 228 $229.96 January - June 2023 AVERAGE $565,000 56.78% 228 $229.96 July - December 2022 AVERAGE N/A N/A N/A N/A CLOSED - 3 BEDROOM January - June 2023