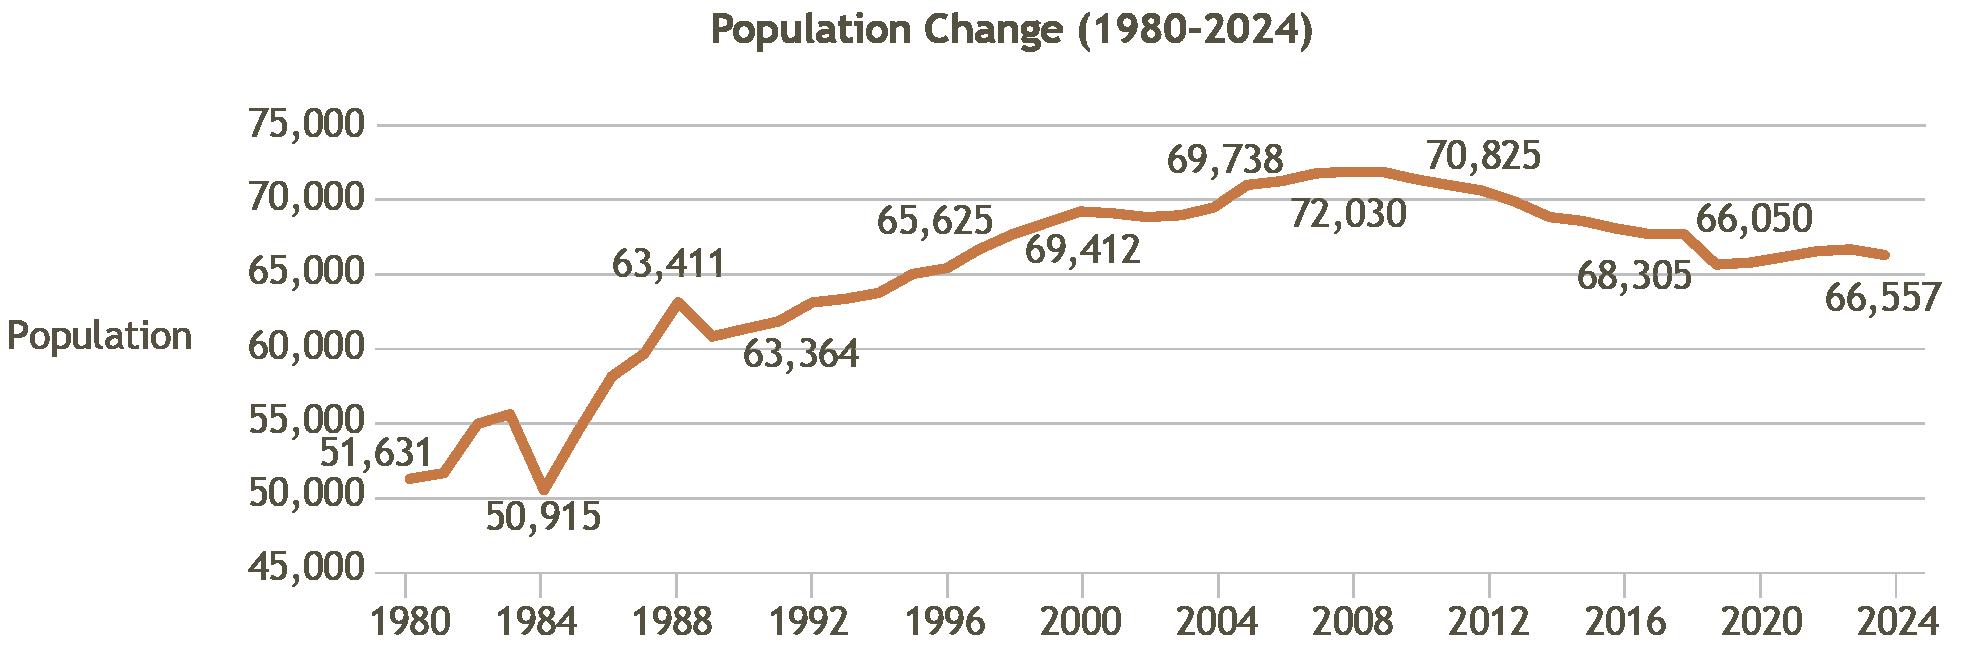
COUNTY SEAT: St. Johns LARGEST CITY: Eagar POPULATION 66,557 10th in State
HOMES 29,001
Population
Rank in State
In 2024, Apache County’s population was 66,557, making it the 10th largest county in Arizona. The population of Apache decreased by 7% from 2010 to 2023, making it one of three counties to decrease its population in that time. In 2023, there were 20,439 households, only a 0.2% increase since 2018, the 2 nd slowest growth rate of Arizona’s counties.
Source: AZ Office of Economic Opportunity, 2025
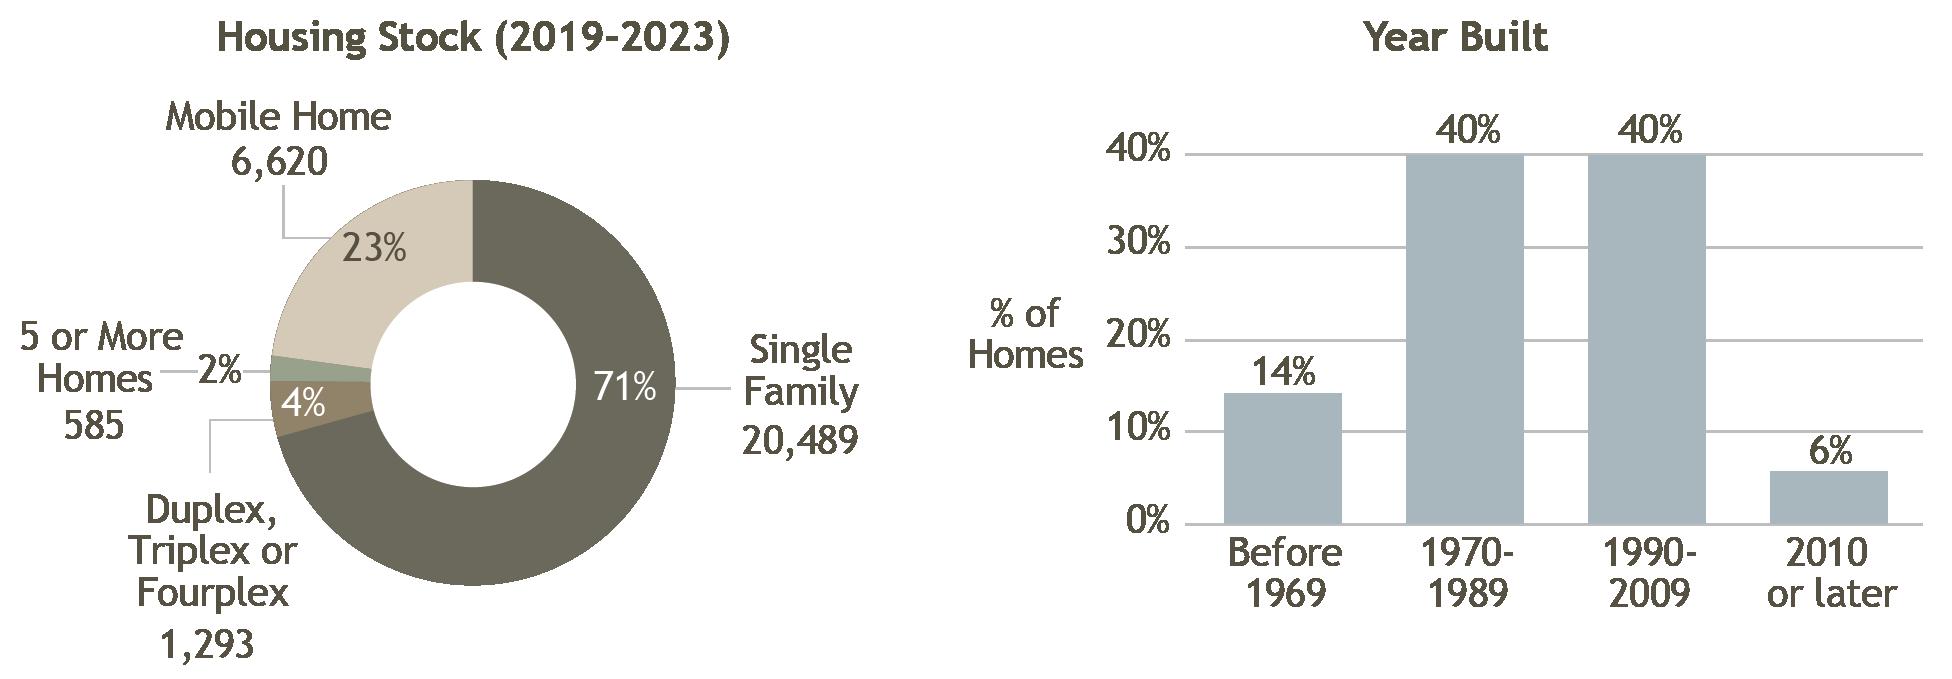
Housing Stock
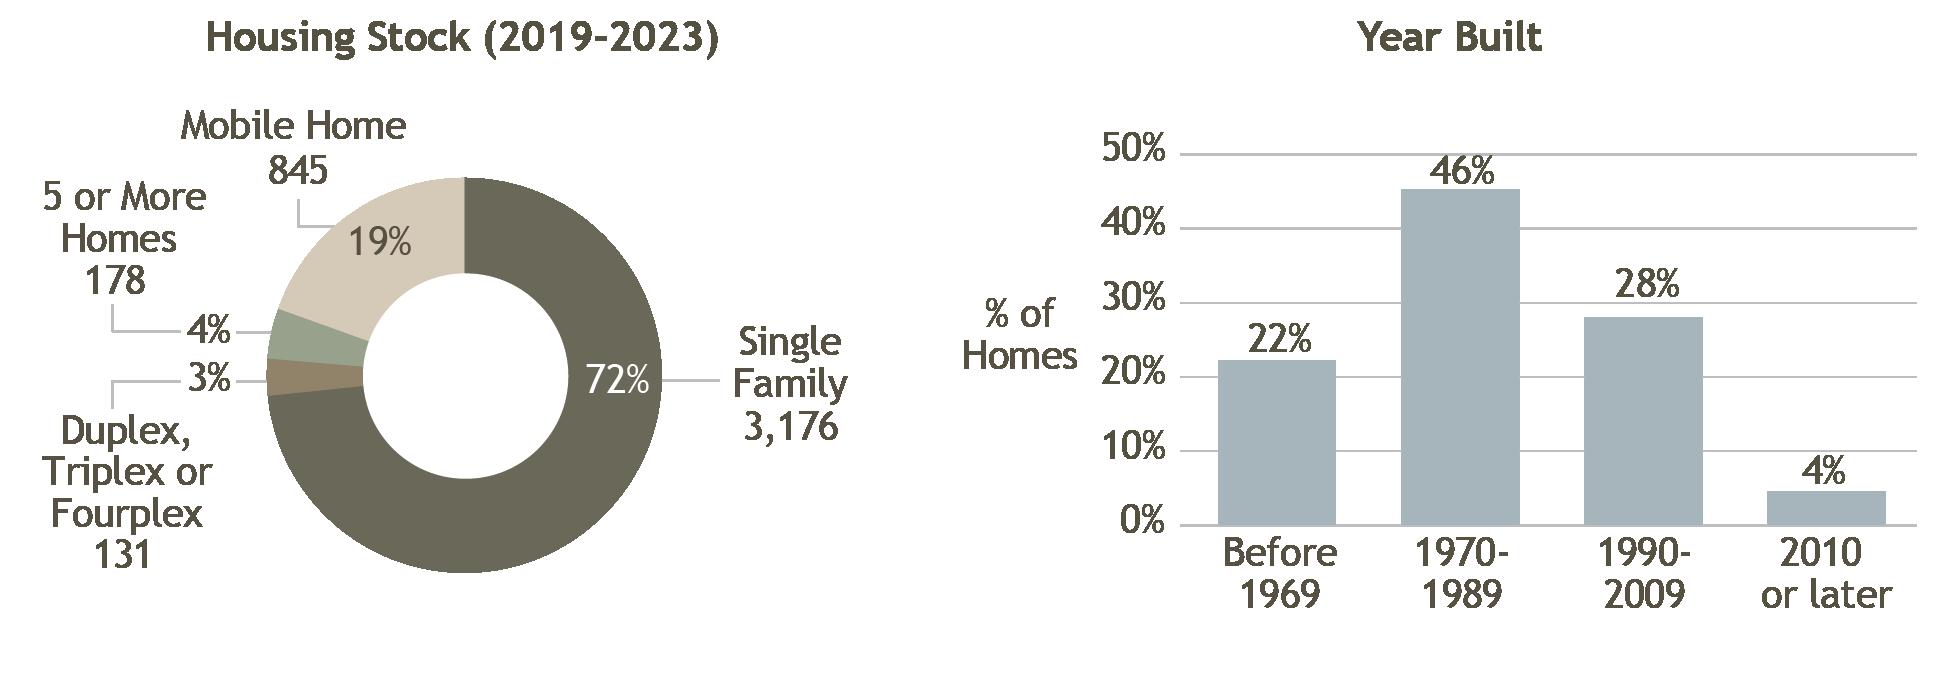
According to the 2019-2023 American Community Survey (ACS) estimates, there were 29,001 homes in Apache County. The majority (71%) were single-family homes (SFH).1 In 2024, 99 homes were permitted, 98% of which were SFH. Since 2018, the county has lost 12% of the homes in its housing stock. Almost half (46%) of all homes were built since 1990. The 2019-2023 ACS 5-year estimates show that 30% of homes in Apache County were vacant.2
Source: ACS 5-Year Estimates
Homeownership
Apache County
Apache County has more homeowners than renters with a 79% homeownership rate, the 2nd highest in the state, surpassing the state average of 67%. In 2022, 23% of all homes were primary residences, the lowest proportion among all counties in the state.
Income and Costs
The median household income for Apache County was $40,338, according to the 2019-2023 ACS 5-year estimates, the lowest in the state. Apache was one of three counties (including Greenlee and La Paz) where the median income for renters ($44,850) was higher than that of owners ($38,878). The median monthly housing cost (including utilities) in 2023 was $339, the lowest in the state. The median monthly cost for renters was $647, the 2nd lowest in the state. Zillow’s typical value for a home in Apache County in March 2024 was $294,851, an increase of 35% since 2018 (inflation-adjusted).3 Apache County had the 9th highest typical home value and the 12th highest value increase among Arizona counties. Apache County has the 14th highest rate of cost burden among Arizona counties, with 13% of households paying 30% or more of their income to housing costs. Only Greenlee County has a lower rate of cost burdened households.
Evictions
In 2024, 38 evictions were filed in Apache County. That is 5.7 per 10,000 people, the lowest rate in the state. Eviction filings have increased 73% since 2018.
For more information about Apache County and the other counties in Arizona, visit the ARCHES website at morrisoninstitute.asu.edu/arches/state-housing.
Notes
1. Margins of error for ACS data are high in Apache County, especially for the smallest percentages (e.g., Housing stock 5+ units and duplexes). These numbers should be interpreted cautiously.
2. Definition of vacant housing units (homes): Housing is vacant if no one lives there on a permanent basis, including if occupants have a usual residence elsewhere. Housing under construction is included if it has exterior walls, windows, and floors. Excluded empty housing are those that are exposed to the elements (missing walls, roof etc.) or not used primarily for residential purposes (such as for businesses). “Definitions and Explanations,” Census Bureau, Housing Vacancy Survey, https://www.census.gov/housing/hvs/definitions.pdf.
3. Calculated using the Zillow Home Value Index (ZHVI) which is a measure of the typical home value and market changes across a given region and housing type. It reflects the typical value for homes in the 35th to 65th percentile range. Also smoothed and seasonally adjusted. “ZHVI All Homes (SFR, Condo/Co-op) Time Series, Smoothed, Seasonally Adjusted ($), by County,” Zillow Housing Data, accessed January 2025, https://www.zillow.com/research/data/? msockid=3b31736dfb4e62cd18806790fa3163e7.
Sources
“Population Estimates,” Arizona Office of Economic Opportunity, accessed November 2024, https://oeo.az.gov/population/estimates.
“Table DP04: Selected Housing Characteristics,” US Census Bureau, 2023 American Community Survey 5-Year Survey, accessed December 2024. https://data.census.gov/table/ACSDP5Y202 3.DP04?q=dp04&g=040XX00US04$0500000
“Historic Property Records,” Cotality (formerly CoreLogic), 2022, ARCHES calculations include all residential properties (excluding corporate-owned).
“2024 Preliminary Annual.” Census Bureau Building Permit Survey, Permits by CBSA (Formerly Permits by MSA), accessed February 2025. https://www.census.gov/construction/bps/msamonthly.html
“Table S2503: Financial Characteristics,” US Census Bureau, 2023 American Community Survey 5-Year Estimate, accessed December 2024. https://data.census.gov/table?q=s2503&g=040XX00US04$0500000.
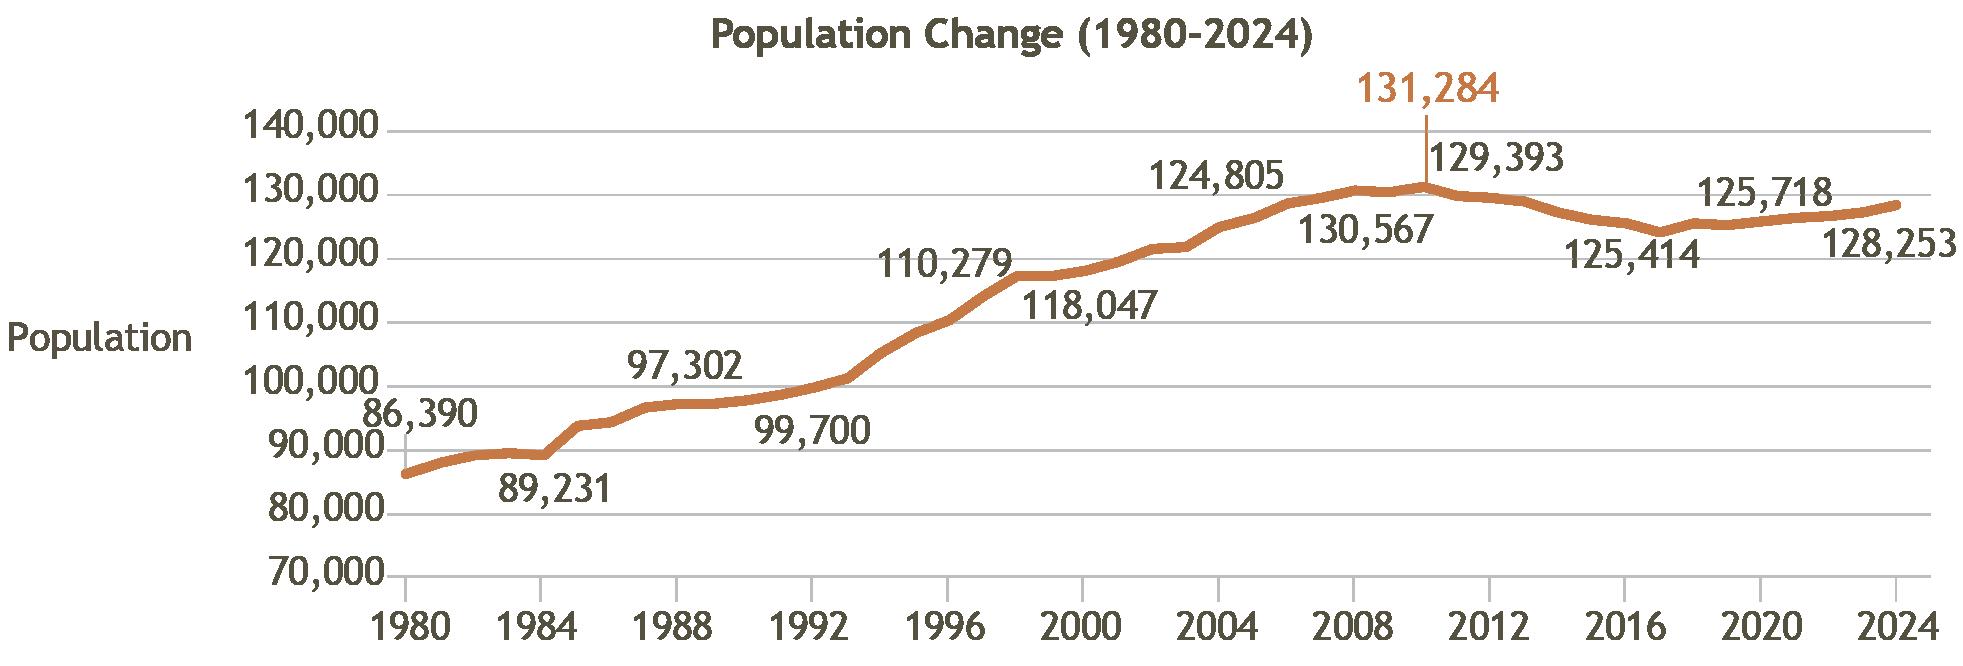
Cochise County’s population peaked in 2010 at 131,248. After a slight decrease thereafter, the population grew to 128,253 in 2024, making it the 8th most populous county in the state. In 2023, there were 50,476 households in Cochise, representing a 2.5% increase since 2018, the 3rd slowest growth rate of Arizona’s counties.
Source: AZ Office of Economic Opportunity, 2025
Housing Stock
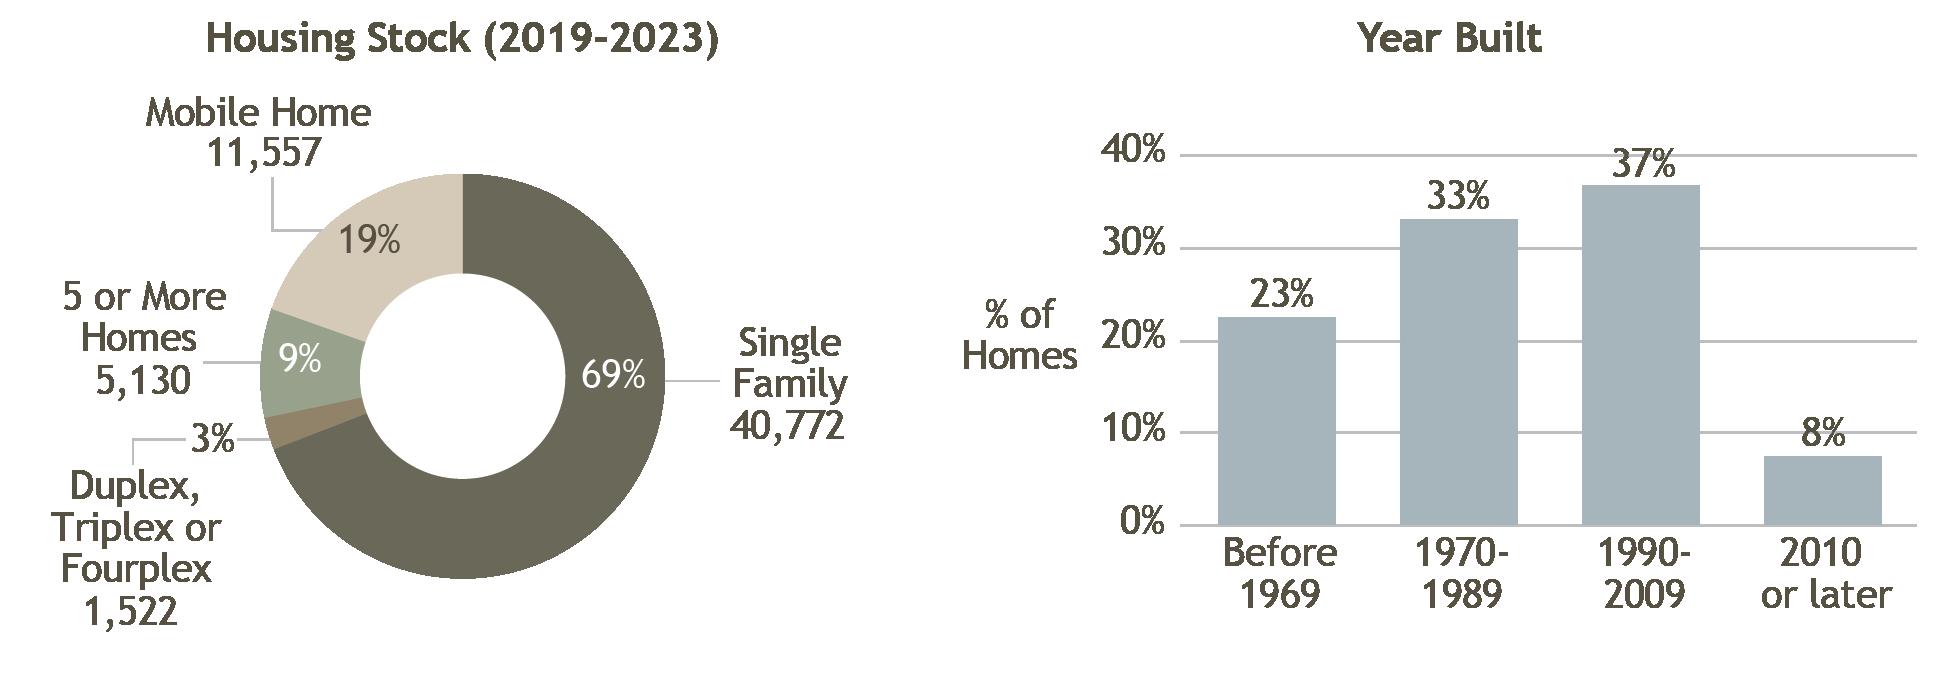
According to the 2019-2023 American Community Survey (ACS) estimates, there were 59,312 homes in Cochise County. The majority (69%) were single-family homes (SFH). In 2024, 473 homes were permitted, and all but six were SFH. Since 2018, the county has lost 2.6% of the homes in its housing stock. Almost half (45%) of all homes were built since 1990. In 2023, 15% of all homes in Cochise County were vacant.1
Source: ACS 5-Year Estimates
Population
Homeownership
Cochise County
Cochise County ranks 8th out of the Arizona counties with a 70% homeownership rate, surpassing the state average of 67%. In 2022, 74% of homes were primary residences, the 7th highest among Arizona’s counties.
Income and Costs
The median household income in Cochise County was $58,970, according to the 2019-2023 ACS 5-year estimates, the 10th highest in the state. Homeowners earned more than renters at $68,063, compared to $40,411. The median monthly housing cost (including utilities) in 2023 was $855, the 6th highest in the state. The median monthly cost for renters was $939, the 9th highest in the state. Zillow’s typical value for a home in Cochise County in March 2024 was $249,092, an increase of 28% since 2018 (inflationadjusted).2 Cochise County had the 2nd lowest typical home value and 2nd lowest value increase among Arizona counties. Cochise had the 10th highest rate of cost burden among Arizona counties, with just under 25% of households paying 30% or more of their income to housing costs.
Evictions
There were 477 evictions filed in Cochise in 2024 (Fiscal Year). That is 37.2 per 10,000 people, the 5th highest rate in the state. Eviction filings have increased 17% since 2018.
For more information about Cochise County and the other counties in Arizona, visit the ARCHES website at morrisoninstitute.asu.edu/arches/state-housing.
Notes
1. Definition of vacant housing units (homes): Housing is vacant if no one lives there on a permanent basis, including if occupants have a usual residence elsewhere. Housing under construction is included if it has exterior walls, windows, and floors. Excluded empty housing are those that are exposed to the elements (missing walls, roof etc.) or not used primarily for residential purposes (such as for businesses). “Definitions and Explanations,” Census Bureau, Housing Vacancy Survey, https://www.census.govhousing/ hvs/definitions.pdf
2. Calculated using the Zillow Home Value Index (ZHVI) which is a measure of the typical home value and market changes across a given region and housing type. It reflects the typical value for homes in the 35th to 65th percentile range. Also smoothed and seasonally adjusted. “ZHVI All Homes (SFR, Condo/Co-op) Time Series, Smoothed, Seasonally Adjusted ($), by County,” Zillow Housing Data, accessed January 2025, https://www.zillow.com/research/data/?msockid=3b31736dfb4e62cd18806790fa3163e7
Sources
“Population Estimates,” Arizona Office of Economic Opportunity, accessed November 2024, https://oeo.az.gov/population/estimates.
“Table DP04: Selected Housing Characteristics,” US Census Bureau, 2023 American Community Survey 5-Year Survey, accessed December 2024. https://data.census.gov/table/ACSDP5Y202 3.DP04?q=dp04&g=040XX00US04$0500000
“Historic Property Records,” Cotality (formerly CoreLogic), 2022, ARCHES calculations include all residential properties (excluding corporate-owned).
“2024 Preliminary Annual.” Census Bureau Building Permit Survey, Permits by CBSA (Formerly Permits by MSA), accessed February 2025. https://www.census.gov/construction/bps/msamonthly.html
“Table S2503: Financial Characteristics,” US Census Bureau, 2023 American Community Survey 5-Year Estimate, accessed December 2024. https://data.census.gov/table?q=s2503&g=040XX00US04$0500000.
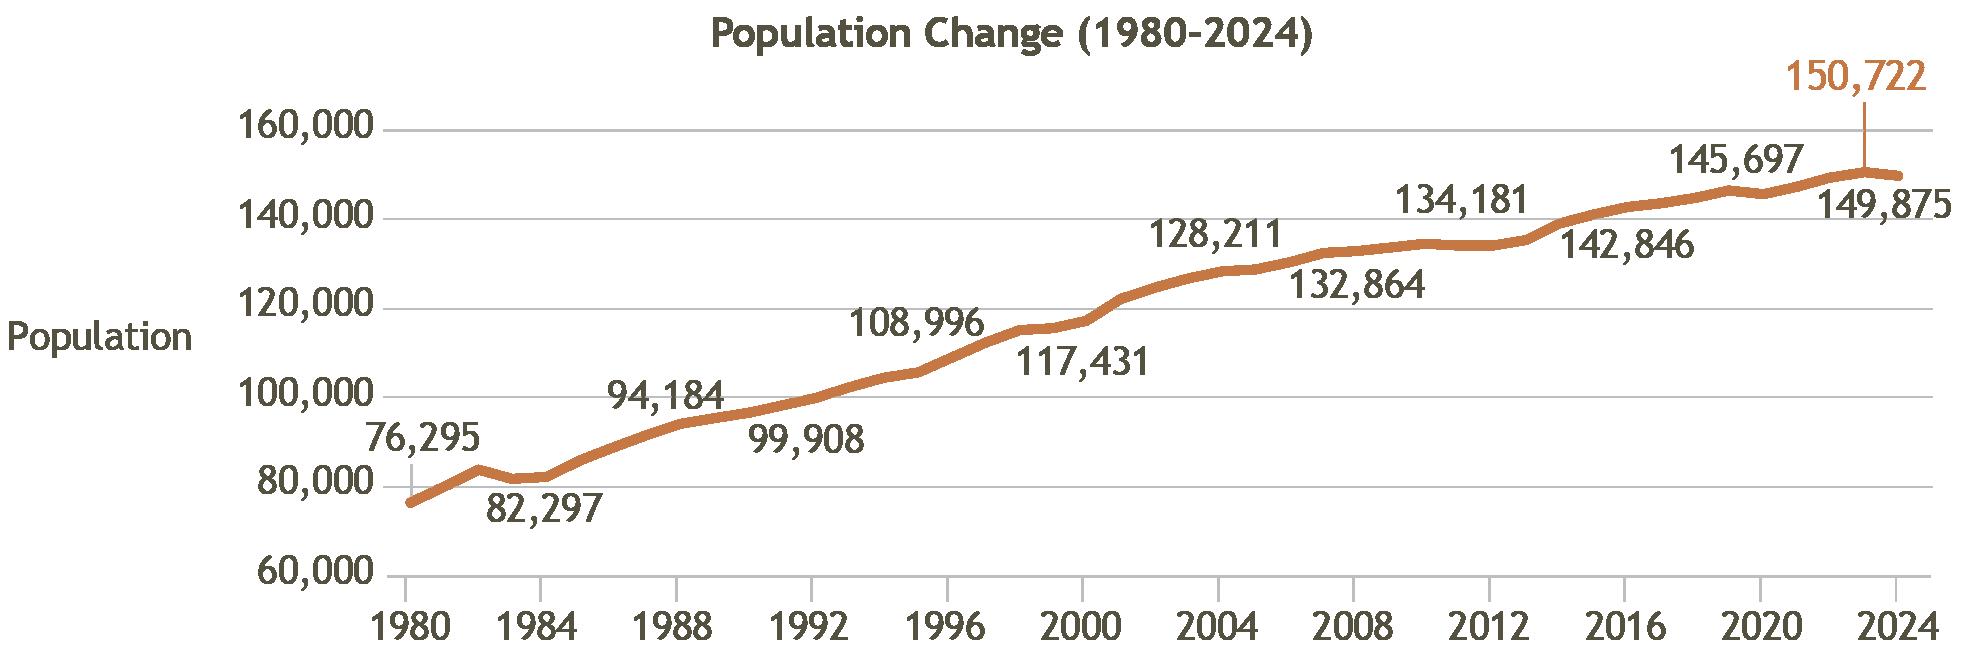
Coconino County peaked in population in 2023 at 150,722. In 2024, the population declined slightly to 149,875, making it the 7th most populous county in the state. There are 53,642 households in Coconino which grew 13.5% since 2018, the 4th fastest growth rate of Arizona’s counties.
Source: AZ Office of Economic Opportunity, 2025
Housing Stock
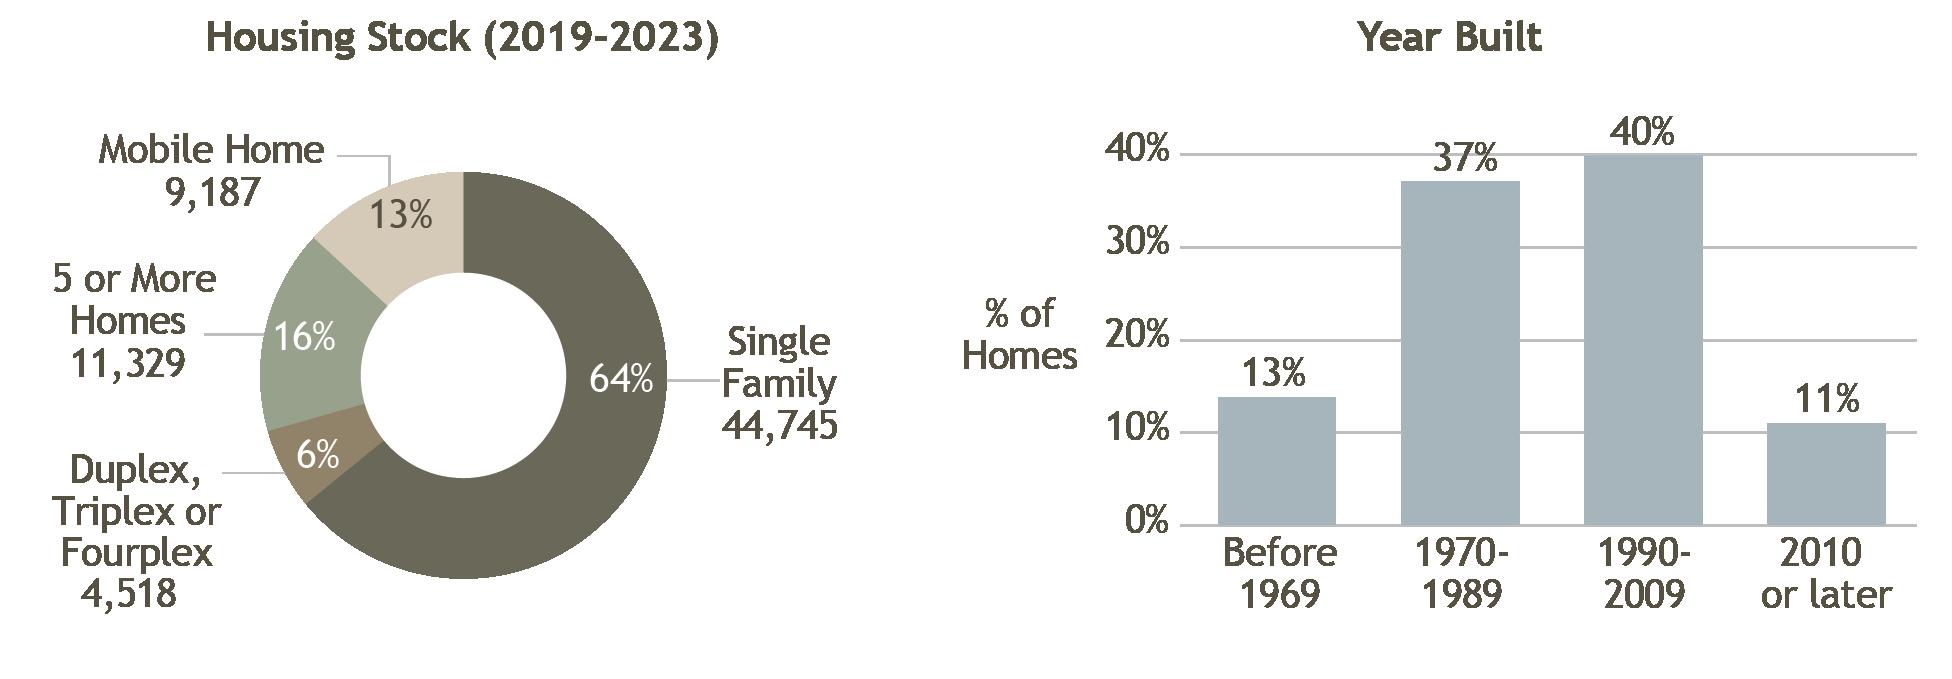
According to the 2019-2023 American Community Survey (ACS) estimates, there were 69,907 homes in Coconino County. The majority (64%) were single-family homes (SFH). In 2024, 698 homes were permitted, 46% of which were SFH. Since 2018, the county has increased the number of homes to its housing stock by 7%. Coconino was one of only two (2) Arizona counties that added, rather than lost, mobile/manufactured homes. Approximately half (51%) of all housing was built since 1990. The 2019-2023 ACS 5-year estimates show that 23% of all housing in Coconino County was vacant.1
Source: ACS 5-Year Estimates
Homeownership
Coconino County
Coconino County has more homeowners than renters, but it has the 2nd lowest homeownership rate of all Arizona’s counties at 59%, coming in below the state average of 67%. In 2022, 55% of homes in the county were primary residences, ranking Coconino 10th among Arizona’s counties, ahead of Greenlee (51%) and behind Mohave (62%) counties.
Income and Costs
The median household income in Coconino County was $69,748 according to the ACS 2019-2023 ACS 5-year estimate, the 4th highest in the state. Homeowners earned more than renters at a median income of $85,428, compared to $54,706. The median monthly housing cost (including utilities) in 2023 was $1,245, second only to Maricopa County. The median monthly cost for renters was $1,406, the 3rd highest in the state. Zillow’s typical value for a home in Coconino County in March 2024 was $601,352, a 41% increase since 2018 (inflation-adjusted).2 That is the highest typical home value in the state, and the 7th highest value increase among Arizona counties. Coconino had the highest rate of cost burden among Arizona counties, with 32% of households paying 30% or more of their income to housing costs.
Evictions
There were 404 evictions filed in Coconino in 2024 (Fiscal Year). That is 27.0 per 10,000 people, the 10th highest rate in the state. Eviction filings have decreased 16% since 2018.
Notes
For more information about Coconino County and the other counties in Arizona, visit the ARCHES website at morrisoninstitute.asu.edu/arches/state-housing.
1. Definition of vacant housing units (homes): Housing is vacant if no one lives there on a permanent basis, including if occupants have a usual residence elsewhere. Housing under construction is included if it has exterior walls, windows, and floors. Excluded empty housing are those that are exposed to the elements (missing walls, roof etc.) or not used primarily for residential purposes (such as for businesses). “Definitions and Explanations,” Census Bureau, Housing Vacancy Survey, https://www.census.gov/housing/hvs/ definitions.pdf.
2. Calculated using the Zillow Home Value Index (ZHVI) which is a measure of the typical home value and market changes across a given region and housing type. It reflects the typical value for homes in the 35th to 65th percentile range. Also smoothed and seasonally adjusted. “ZHVI All Homes (SFR, Condo/Co-op) Time Series, Smoothed, Seasonally Adjusted ($), by County,” Zillow Housing Data, accessed January 2025, https://www.zillow.com/research/data/?msockid=3b31736dfb4e62cd18806790fa3163e7.
Sources
“Population Estimates,” Arizona Office of Economic Opportunity, accessed November 2024, https://oeo.az.gov/population/estimates
“Table DP04: Selected Housing Characteristics,” US Census Bureau, 2023 American Community Survey 5-Year Survey, accessed December 2024. https://data.census.gov/table/ACSDP5Y202 3.DP04?q=dp04&g=040XX00US04$0500000 .
“Historic Property Records,” Cotality (formerly CoreLogic), 2022, ARCHES calculations include all residential properties (excluding corporate-owned).
“2024 Preliminary Annual.” Census Bureau Building Permit Survey, Permits by CBSA (Formerly Permits by MSA), accessed February 2025. https://www.census.gov/construction/bps/msamonthly.html.
“Table S2503: Financial Characteristics,” US Census Bureau, 2023 American Community Survey 5-Year Estimate, accessed December 2024. https://data.census.gov/table?q=s2503&g=040XX00US04$0500000.
Gila County’s population has plateaued since 2006. In 2024, the population was estimated at 54,006, making it the 10th most populous county in the state. In 2023, there were 23,253 households, a 7% increase since 2018, the 10th fastest growth rate of Arizona’s counties.
Source: AZ Office of Economic Opportunity, 2025
Housing Stock
According to the 2019-2023 American Community Survey (ACS) estimates, there were 32,614 homes in Gila County. The majority (73%) were single-family homes (SFH). In 2024, out of the 217 homes permitted, all but two were SFH. Since 2018, the county has lost 3.4% of the homes in its housing stock. Less than half (43%) of all homes were built since 1990. The 2019-2023 ACS 5-year estimates show that 29% of all housing in Gila County was vacant.1
Source: ACS 5-Year Estimates
Homeownership
Gila County
Gila County has more homeowners than renters with a 77% homeownership rate, the 3rd highest in the state, surpassing the state average of 67%. In 2022, half of all homes were primary residences, the 12th highest proportion among Arizona’s counties.
Income and Costs
The median household income in Gila County was $59,089, according to the 2019-2023 ACS 5-year estimates, the 9th highest in the state. Homeowners earned more than renters at a median income of $62,285, compared to $47,062. The median monthly housing cost (including utilities) in 2023 was $836, the 11th highest in the state. The median monthly cost for renters was $1,001, the 7th highest. The typical value for a home in Gila County in March 2024 was $356,924, a 43% increase since 2018 (inflationadjusted).2 Gila County had the 5th highest typical home value and the 5th highest value increase among Arizona’s counties. Gila County has the 7th highest rate of cost burden among Arizona counties, with 26% of households paying 30% or more of their income to housing costs.
Evictions
There were 185 evictions filed in Gila in 2024 (Fiscal Year). That is 34.3 per 10,000 people, the 6th highest rate in the state. Eviction filings have increased 12% since 2018.
Notes
For more information about Gila County and the other counties in Arizona, visit the ARCHES website at morrisoninstitute.asu.edu/arches/state-housing.
1. Definition of vacant housing units (homes): Housing is vacant if no one lives there on a permanent basis, including if occupants have a usual residence elsewhere. Housing under construction is included if it has exterior walls, windows, and floors. Excluded empty housing are those that are exposed to the elements (missing walls, roof etc.) or not used primarily for residential purposes (such as for businesses). “Definitions and Explanations,” Census Bureau, Housing Vacancy Survey, https://www.census.gov/housing/hvs/ definitions.pdf.
2. Calculated using the Zillow Home Value Index (ZHVI) which is a measure of the typical home value and market changes across a given region and housing type. It reflects the typical value for homes in the 35th to 65th percentile range. Also smoothed and seasonally adjusted. “ZHVI All Homes (SFR, Condo/Co-op) Time Series, Smoothed, Seasonally Adjusted ($), by County,” Zillow Housing Data, accessed January 2025, https://www.zillow.com/research/data/?msockid=3b31736dfb4e62cd18806790fa3163e7
3. Note: percentages do not add up to 100% due to rounding.
Sources
“Population Estimates,” Arizona Office of Economic Opportunity, accessed November 2024, https://oeo.az.gov/population/estimates
“Table DP04: Selected Housing Characteristics,” US Census Bureau, 2023 American Community Survey 5-Year Survey, accessed December 2024. https://data.census.gov/table/ACSDP5Y202 3.DP04?q=dp04&g=040XX00US04$0500000 .
“Historic Property Records,” Cotality (formerly CoreLogic), 2022, ARCHES calculations include all residential properties (excluding corporate-owned).
“2024 Preliminary Annual.” Census Bureau Building Permit Survey, Permits by CBSA (Formerly Permits by MSA), accessed February 2025. https://www.census.gov/construction/bps/msamonthly.html.
“Table S2503: Financial Characteristics,” US Census Bureau, 2023 American Community Survey 5-Year Estimate, accessed December 2024. https://data.census.gov/table?q=s2503&g=040XX00US04$0500000.
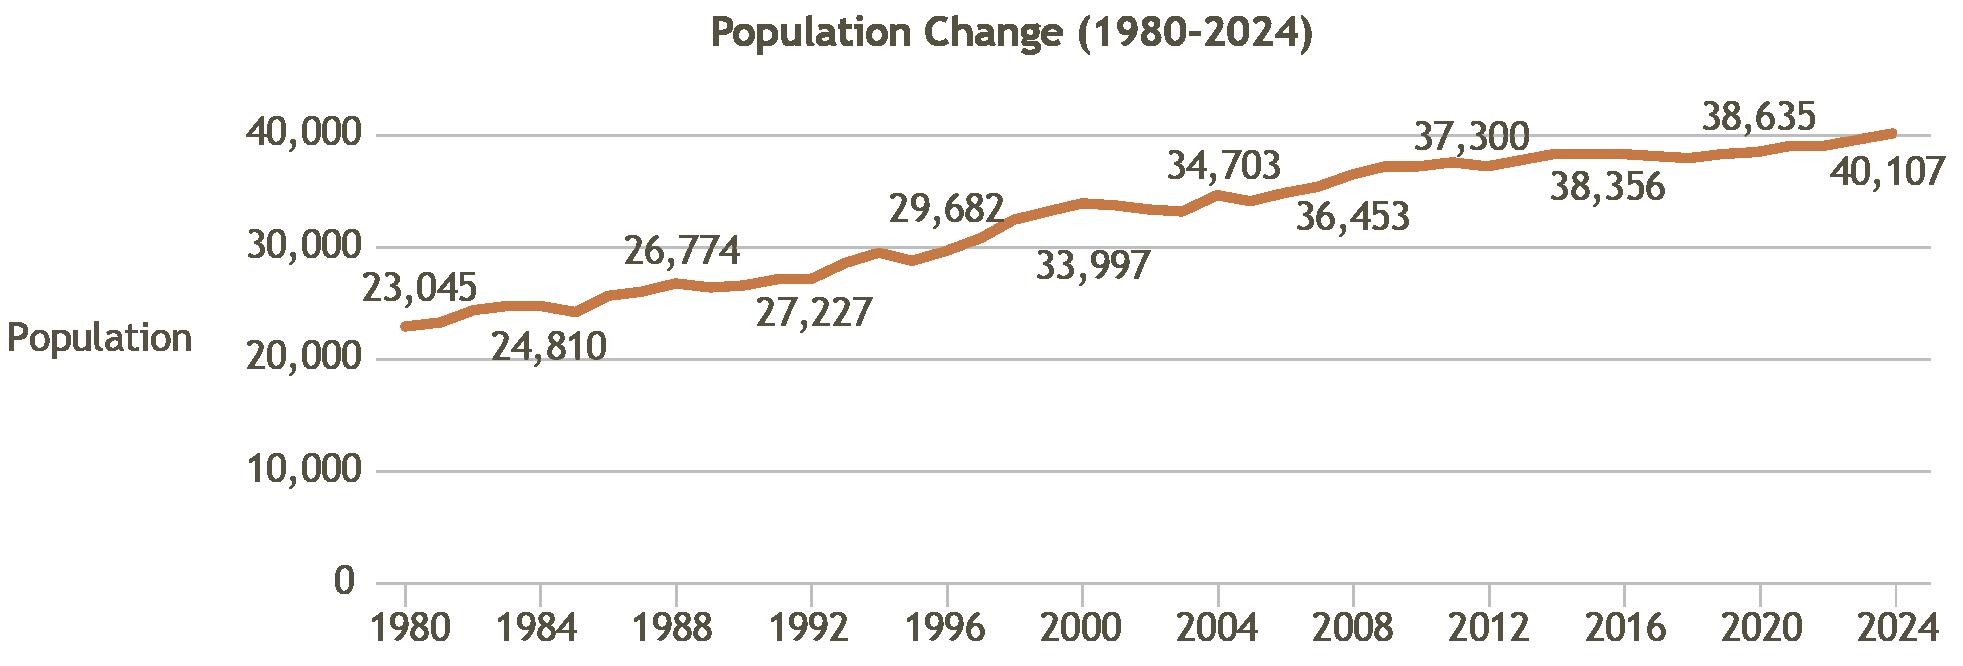
Graham County’s population has grown steadily over time, reaching a new high of 40,107 in 2024, making it the 13th most populous county in the state. In 2023, there were 12,460 households in Graham, which is a 15.6% increase since 2018, the fastest growth rate among Arizona’s counties.
Source: AZ Office of Economic Opportunity, 2025
Housing Stock
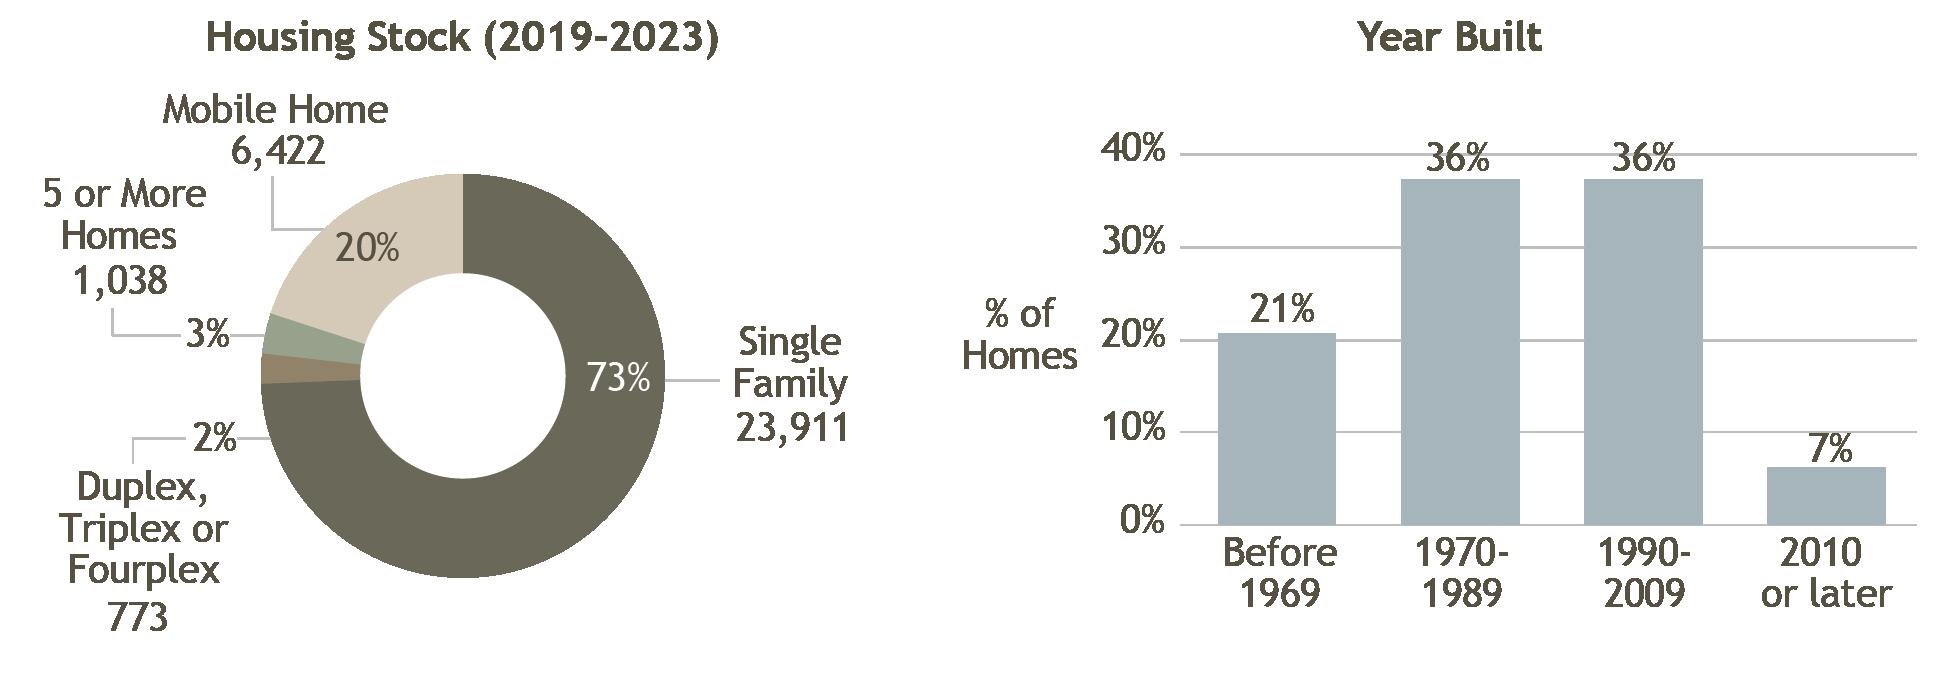
According to the 2019-2023 American Community Survey (ACS) estimates, there were 13,941 homes in Graham County. The majority (76%) of homes were single family homes (SFH).1 In 2024, out of the 137 homes permitted, all but four units were SFH. Since 2018, the county has increased the number of homes in its housing stock by 4%. Less than half (45%) of all homes were built since 1990. The 2019-2023 ACS 5-year estimates show that 10% of homes in Graham County were vacant.2
Source: ACS 5-Year Estimates
Homeownership
Graham County
Graham County has more homeowners than renters with a 74% homeownership rate, the 5th highest in the state, surpassing the state average of 67%. In 2022, 78% of all homes were primary residences, the 3rd highest proportion among all counties in the state.
Income and Costs
The median household income in Graham County was $67,326, according to the 2019-2023 ACS 5-year estimates, the 6th highest in the state. Homeowners earned more than renters at a median income of $74,402, compared to $57,810. The median monthly housing cost (including utilities) was $930, the 6th highest in the state. The median monthly cost for renters was $890 in 2023, the 10th highest in the state. Zillow’s typical value for a home in March 2024 was $269,541, an increase of 27% since 2018 (inflationadjusted).3 That is the 4th lowest typical home value and smallest value increase among Arizona counties. Graham County has the 11th highest rate of cost burden among Arizona counties, with 21% of households paying 30% or more of their income to housing costs.
Evictions
There were 53 evictions filed in Graham in 2024 (Fiscal Year). That is 13.2 per 10,000 people, the 3rd lowest rate in the state. Eviction filings have decreased 35% since 2018.
Notes
For more information about Graham County and the other counties in Arizona, visit the ARCHES website at morrisoninstitute.asu.edu/arches/state-housing.
1. Margins of error for ACS data are high in the county due to its small population. Small percentages given in the Housing Stock and Year Housing Built charts should be taken cautiously.
2. Definition of Vacant housing units (homes): Housing is vacant if no one lives there on a permanent basis, including if occupants have a usual residence elsewhere. Housing under construction is included if it has exterior walls, windows, and floors. Excluded empty housing are those that are exposed to the elements (missing walls, roof etc.) or not used primarily for residential purposes (such as for businesses). “Definitions and Explanations,” Census Bureau, Housing Vacancy Survey, https://www.census.gov/housing/hvs/ definitions.pdf
3. Calculated using the Zillow Home Value Index (ZHVI) which is a measure of the typical home value and market changes across a given region and housing type. It reflects the typical value for homes in the 35th to 65th percentile range. Also smoothed and seasonally adjusted. “ZHVI All Homes (SFR, Condo/Co-op) Time Series, Smoothed, Seasonally Adjusted ($), by County,” Zillow Housing Data, accessed January 2025, https://www.zillow.com/research/data/?msockid=3b31736dfb4e62cd18806790fa3163e7
Sources
“Population Estimates,” Arizona Office of Economic Opportunity, accessed November 2024, https://oeo.az.gov/population/estimates.
“Table DP04: Selected Housing Characteristics,” US Census Bureau, 2023 American Community Survey 5-Year Survey, accessed December 2024. https://data.census.gov/table/ACSDP5Y202 3.DP04?q=dp04&g=040XX00US04$0500000
“Historic Property Records,” Cotality (formerly CoreLogic), 2022, ARCHES calculations include all residential properties (excluding corporate-owned).
“2024 Preliminary Annual.” Census Bureau Building Permit Survey, Permits by CBSA (Formerly Permits by MSA), accessed February 2025. https://www.census.gov/construction/bps/msamonthly.html
“Table S2503: Financial Characteristics,” US Census Bureau, 2023 American Community Survey 5-Year Estimate, accessed December 2024. https://data.census.gov/table?q=s2503&g=040XX00US04$0500000.
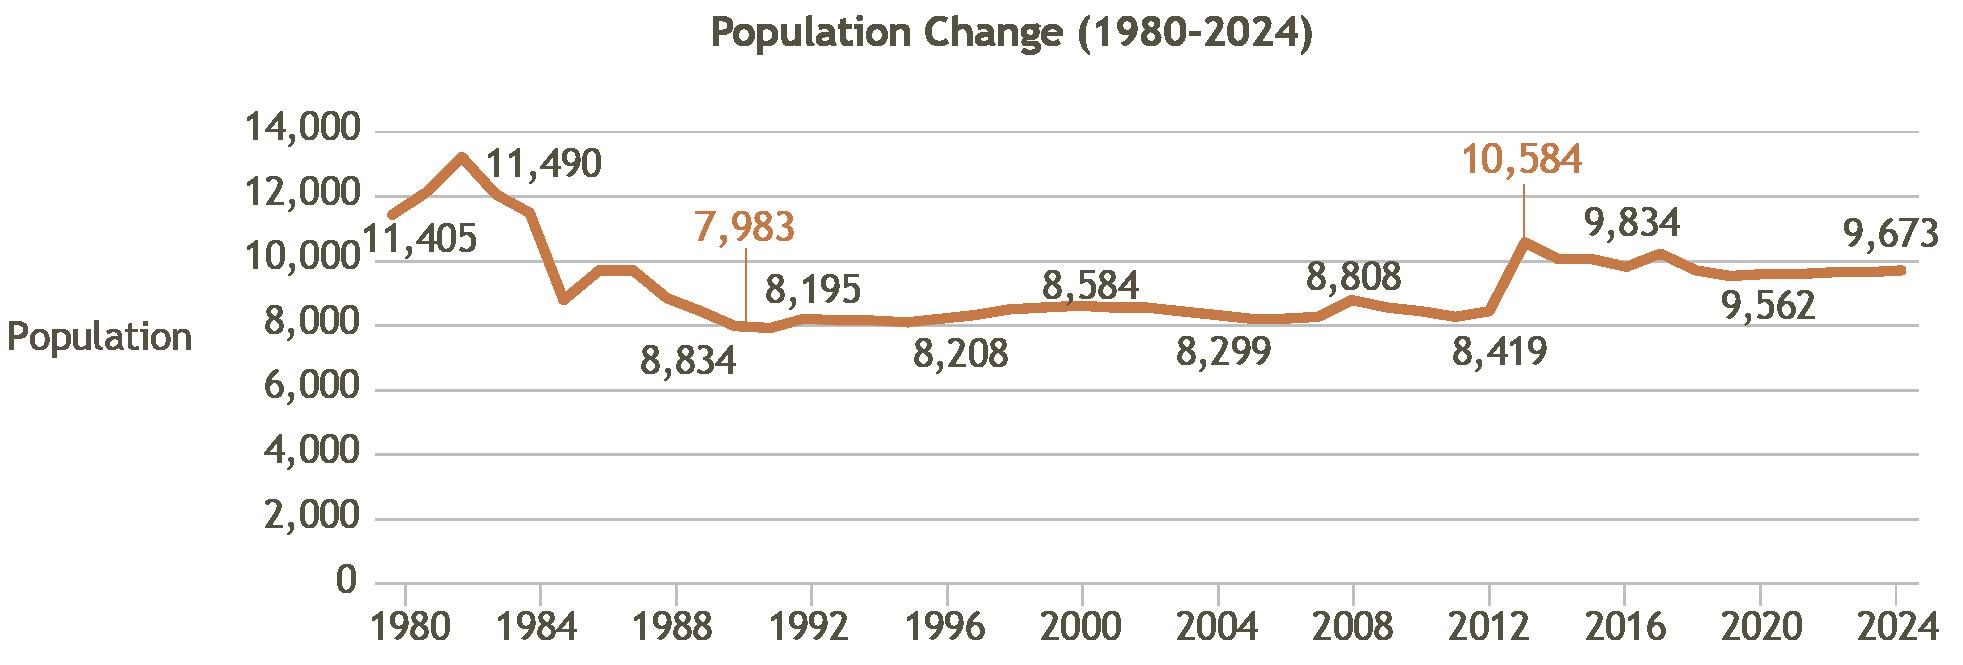
Population: Greenlee County’s population has stayed relatively flat since 1990 with a small increase in 2013. In 2024, the population was 9,673. In 2023, there were 3,444 households, making it the least populous county in the state. The number of households grew 6.8% since 2018, the 11th fastest growth rate of Arizona’s counties.
Source: AZ Office of Economic Opportunity, 2025
Housing Stock
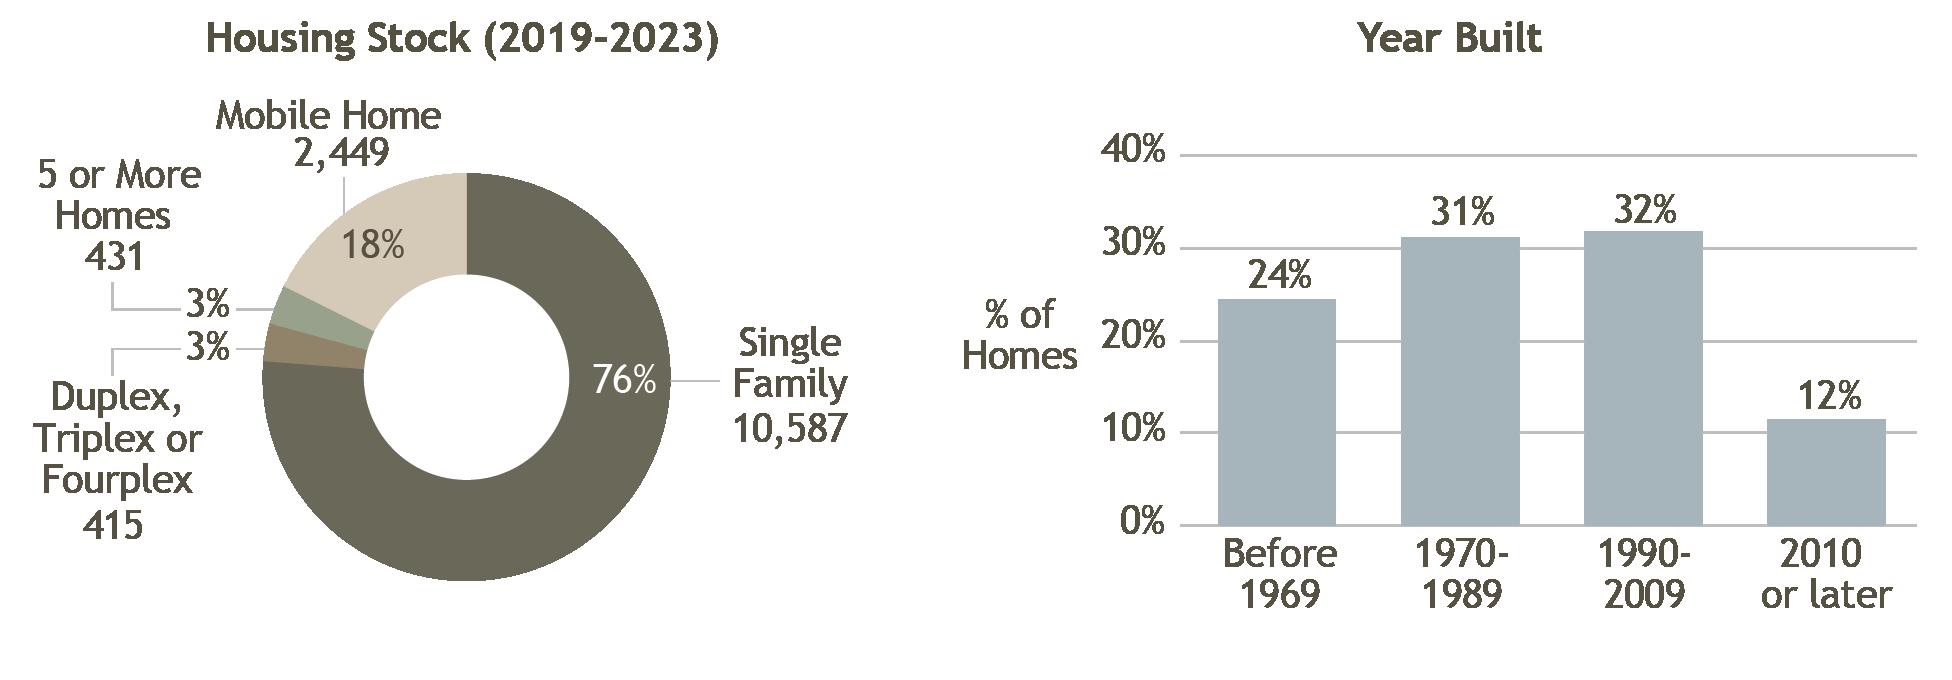
According to the 2019-2023 American Community Survey (ACS) estimates, there were 4,422 homes in Greenlee County. The majority (72%) were single-family homes (SFH).1 All 14 homes permitted in 2024 were SFH. Since 2018, the county has lost 0.3% of its homes. Less than a third (32%) were built since 1990. The 2019-2023 ACS 5-year estimates show that 22% of all housing in Greenlee County was vacant.2
Source: ACS 5-Year Estimates
Homeownership
Greenlee County
Greenlee County has slightly more homeowners than renters, with a 56% homeownership rate, the lowest in the state. In 2022, 51% of all homes were primary residences, ranking 11th among all counties in the state.
Income and Costs
The median household income in Greenlee County was $75,239, according to the 2019-2023 ACS 5-year estimates, the 3rd highest in the state. Greenlee is one of only three counties (including Apache and La Paz) where renters earned more than homeowners at a median income of $76,964, compared to $66,053, respectively. The median monthly housing cost (including utilities) in 2023 was $524, the 2nd lowest among counties. The median monthly cost for renters was $570, the lowest in the state. Zillow’s typical value for a home in Greenlee County in March 2024 was $151,270, the lowest value among all counties in Arizona.3 Greenlee County also has the lowest rate of cost burden among Arizona counties, with 8% of households paying 30% or more of their income to housing costs.
Evictions
There were seven evictions filed in Greenlee County in 2024 (Fiscal Year). That is 7.2 per 10,000 people, the 2nd lowest rate in the state. The number of eviction filings increased by five (5) from 2018.
Notes
For more information about Greenlee County and the other counties in Arizona, visit the ARCHES website at morrisoninstitute.asu.edu/arches/state-housing.
1. Margins of error for ACS data are high in the county due to its small population. Small percentages given in the Housing Stock and Year Housing Built charts should be taken cautiously.
2. Definition of Vacant housing units (homes): Housing is vacant if no one lives there on a permanent basis, including if occupants have a usual residence elsewhere. Housing under construction is included if it has exterior walls, windows, and floors. Excluded empty housing are those that are exposed to the elements (missing walls, roof etc.) or not used primarily for residential purposes (such as for businesses). “Definitions and Explanations,” Census Bureau, Housing Vacancy Survey, https://www.census.gov/housing/hvs/ definitions.pdf.
3. Calculated using the Zillow Home Value Index (ZHVI) which is a measure of the typical home value and market changes across a given region and housing type. It reflects the typical value for homes in the 35th to 65th percentile range. Also smoothed and seasonally adjusted. “ZHVI All Homes (SFR, Condo/Co-op) Time Series, Smoothed, Seasonally Adjusted ($), by County,” Zillow Housing Data, accessed January 2025, https://www.zillow.com/research/data/?msockid=3b31736dfb4e62cd18806790fa3163e7.
Sources
“Population Estimates,” Arizona Office of Economic Opportunity, accessed November 2024, https://oeo.az.gov/population/estimates.
“Table DP04: Selected Housing Characteristics,” US Census Bureau, 2023 American Community Survey 5-Year Survey, accessed December 2024. https://data.census.gov/table/ACSDP5Y202 3.DP04?q=dp04&g=040XX00US04$0500000
“Historic Property Records,” Cotality (formerly CoreLogic), 2022, ARCHES calculations include all residential properties (excluding corporate-owned).
“2024 Preliminary Annual.” Census Bureau Building Permit Survey, Permits by CBSA (Formerly Permits by MSA), accessed February 2025. https://www.census.gov/construction/bps/msamonthly.html.
“Table S2503: Financial Characteristics,” US Census Bureau, 2023 American Community Survey 5-Year Estimate, accessed December 2024. https://data.census.gov/table?q=s2503&g=040XX00US04$0500000.
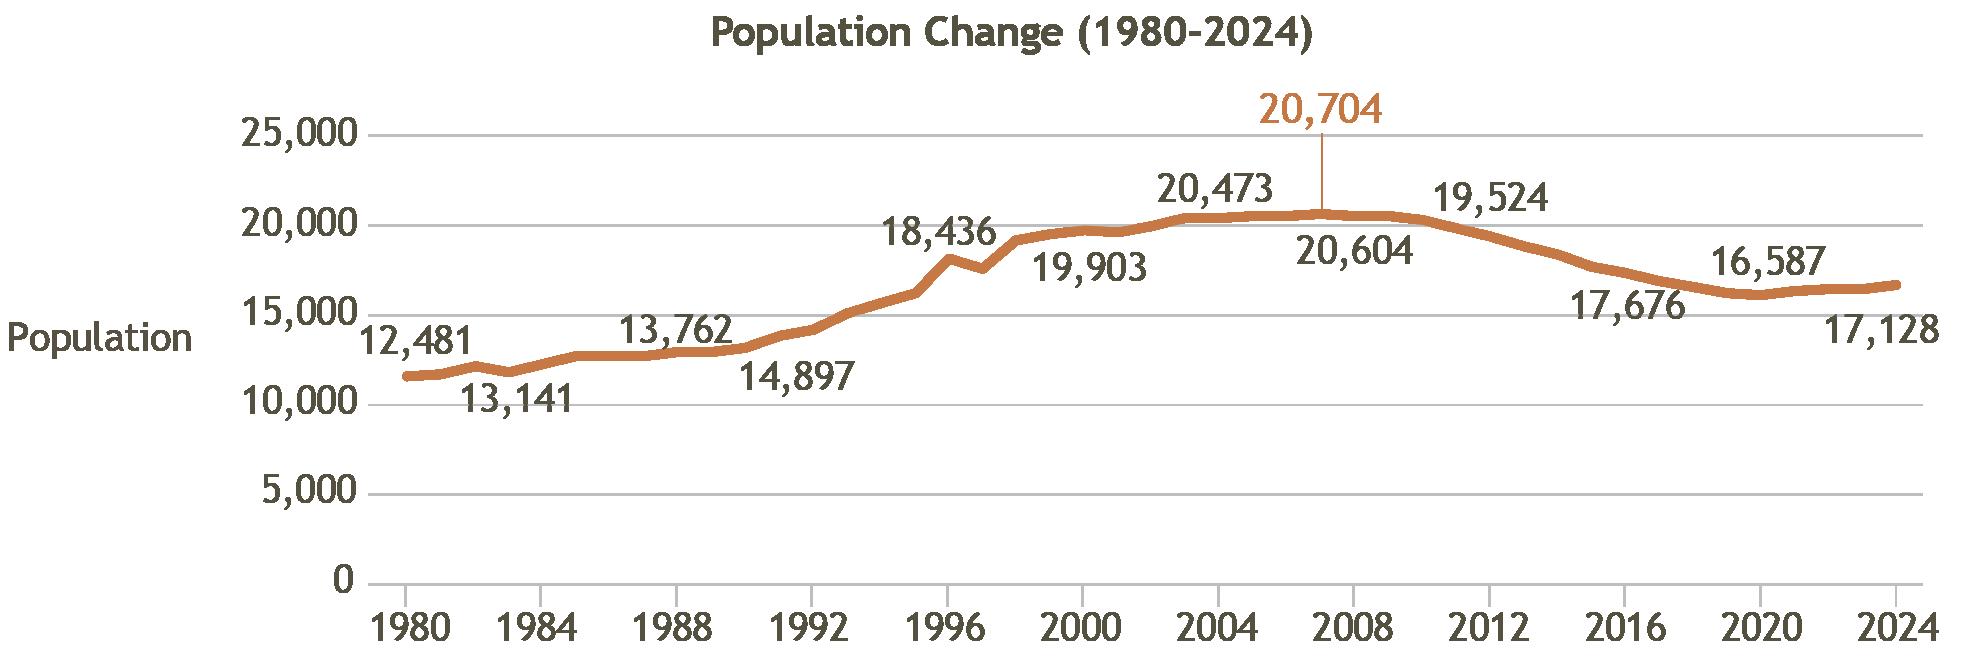
La Paz County peaked in population in 2007 at 20,704. After a population decline from 2008 to 2020, the population grew to 17,128 in 2024, making it the second-to-last in population in the state. In 2023, there were 8,887 households in La Paz, representing a 0.3% decrease since 2018, making it the only county with a decline in households during that time.
Source: AZ Office of Economic Opportunity, 2025
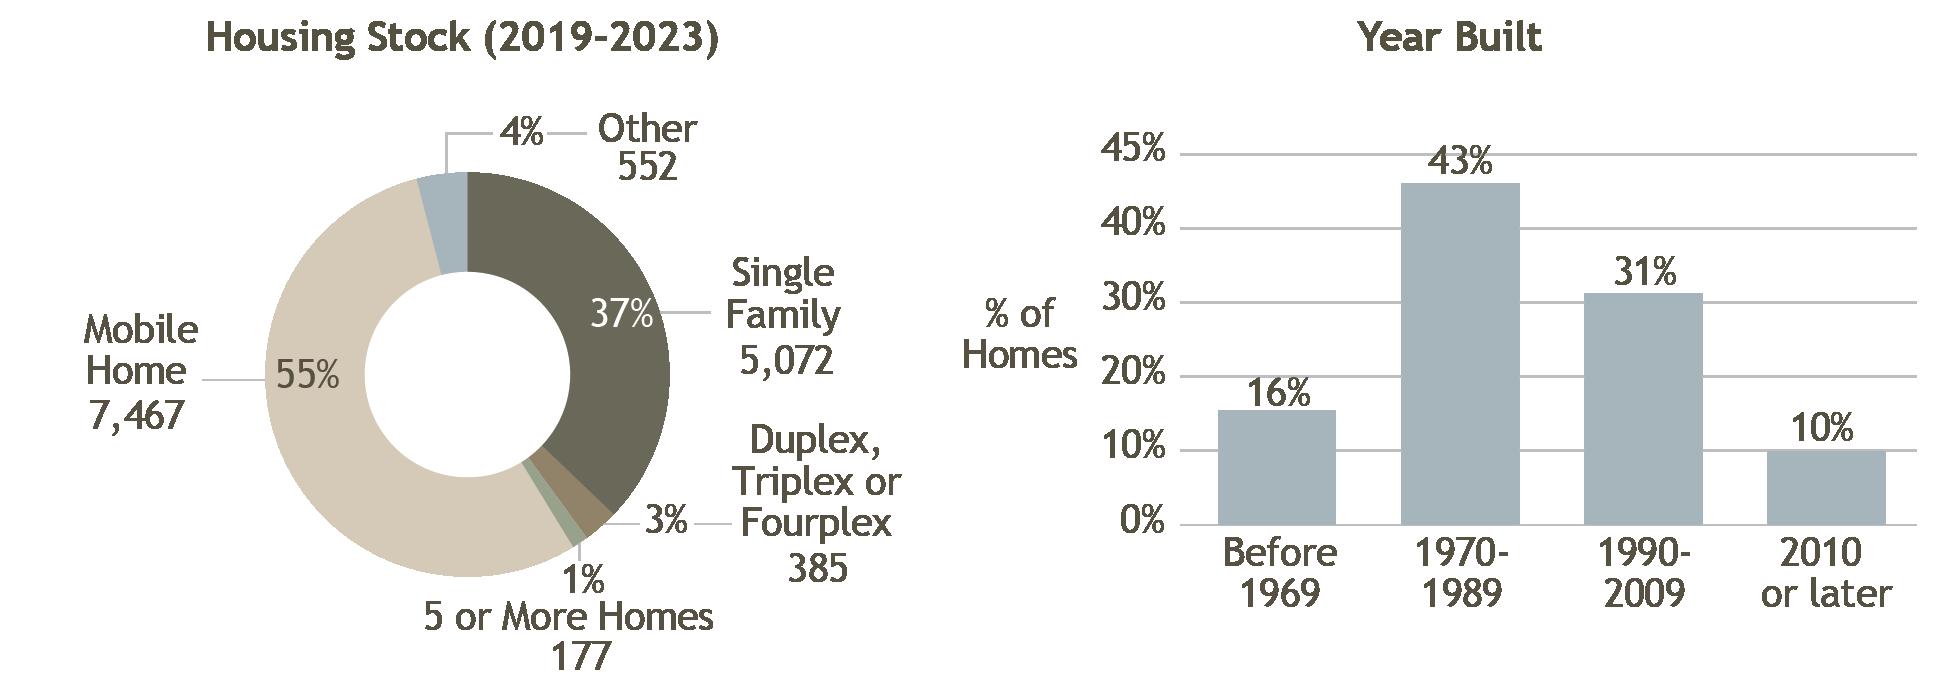
According to the 2019-2023 American Community Survey (ACS) estimates, there were 13,653 homes in La Paz County. Differing from state housing stock trends, the majority of homes (55%) were mobile homes, rather than single-family homes (SFH).1 All 92 of the homes permitted in 2024 were SFH. Since 2018, the county has lost 16% of its homes. Only 41% of all homes were built since 1990. The 2019-2023 ACS 5-year estimates show that 35% of homes in La Paz County were vacant.2
Source: ACS 5-Year Estimates
Homeownership
La Paz County
La Paz has more homeowners than renters with a 70% homeownership rate, the 11th highest in the state, surpassing the state average of 67%. In 2022, 38% of all homes were primary residences, ranking 13th among Arizona’s counties, ahead of only Coconino and Greenlee counties.
Income and Costs
The median household income in La Paz County was $49,506 according to the 2019-2023 ACS 5-year estimates, the 2nd lowest in the state, ahead of Apache County. La Paz is one of only three counties (including Apache and Greenlee) where the median income for renters ($51,528) was higher than that of owners ($48,829). The median monthly housing cost (including utilities) in 2023 was $539 in 2023, the 3 rd lowest in the state. The median monthly cost for renters was $735, also the 3rd lowest. Zillow’s typical value for a home in La Paz County in March 2024 was $287,191, a 45% increase since 2018 (inflationadjusted).3 La Paz had the 10th highest typical home value and the 3rd highest value increase among Arizona’s counties. La Paz tied with Navajo County for the 3rd lowest rate of cost burden among Arizona counties, with 19% of households paying 30% or more of their income to housing costs.
Evictions
There were 54 evictions filed in La Paz in 2024 (Fiscal Year). That is 31.5 per 10,000 people, the 8th highest rate in the state. Eviction filings have decreased by 22% since 2018.
Notes
For more information about La Paz County and the other counties in Arizona, visit the ARCHES website at morrisoninstitute.asu.edu/arches/state-housing.
1. Margins of error for ACS data are high in the county due to its small population. Small percentages given in the Housing Stock and Year Housing Built charts should be taken cautiously.
2. Definition of Vacant housing units (homes): Housing is vacant if no one lives there on a permanent basis, including if occupants have a usual residence elsewhere. Housing under construction is included if it has exterior walls, windows, and floors. Excluded empty housing are those that are exposed to the elements (missing walls, roof etc.) or not used primarily for residential purposes (such as for businesses). “Definitions and Explanations,” Census Bureau, Housing Vacancy Survey, https://www.census.gov/housing/hvs/ definitions.pdf.
3. Calculated using the Zillow Home Value Index (ZHVI) which is a measure of the typical home value and market changes across a given region and housing type. It reflects the typical value for homes in the 35th to 65th percentile range. Also smoothed and seasonally adjusted. “ZHVI All Homes (SFR, Condo/Co-op) Time Series, Smoothed, Seasonally Adjusted ($), by County,” Zillow Housing Data, accessed January 2025, https://www.zillow.com/research/data/?msockid=3b31736dfb4e62cd18806790fa3163e7.
Sources
“Population Estimates,” Arizona Office of Economic Opportunity, accessed November 2024, https://oeo.az.gov/population/estimates
“Table DP04: Selected Housing Characteristics,” US Census Bureau, 2023 American Community Survey 5-Year Survey, accessed December 2024. https://data.census.gov/table/ACSDP5Y202 3.DP04?q=dp04&g=040XX00US04$0500000 .
“Historic Property Records,” Cotality (formerly CoreLogic), 2022, ARCHES calculations include all residential properties (excluding corporate-owned).
“2024 Preliminary Annual.” Census Bureau Building Permit Survey, Permits by CBSA (Formerly Permits by MSA), accessed February 2025. https://www.census.gov/construction/bps/msamonthly.html.
“Table S2503: Financial Characteristics,” US Census Bureau, 2023 American Community Survey 5-Year Estimate, accessed December 2024. https://data.census.gov/table?q=s2503&g=040XX00US04$0500000
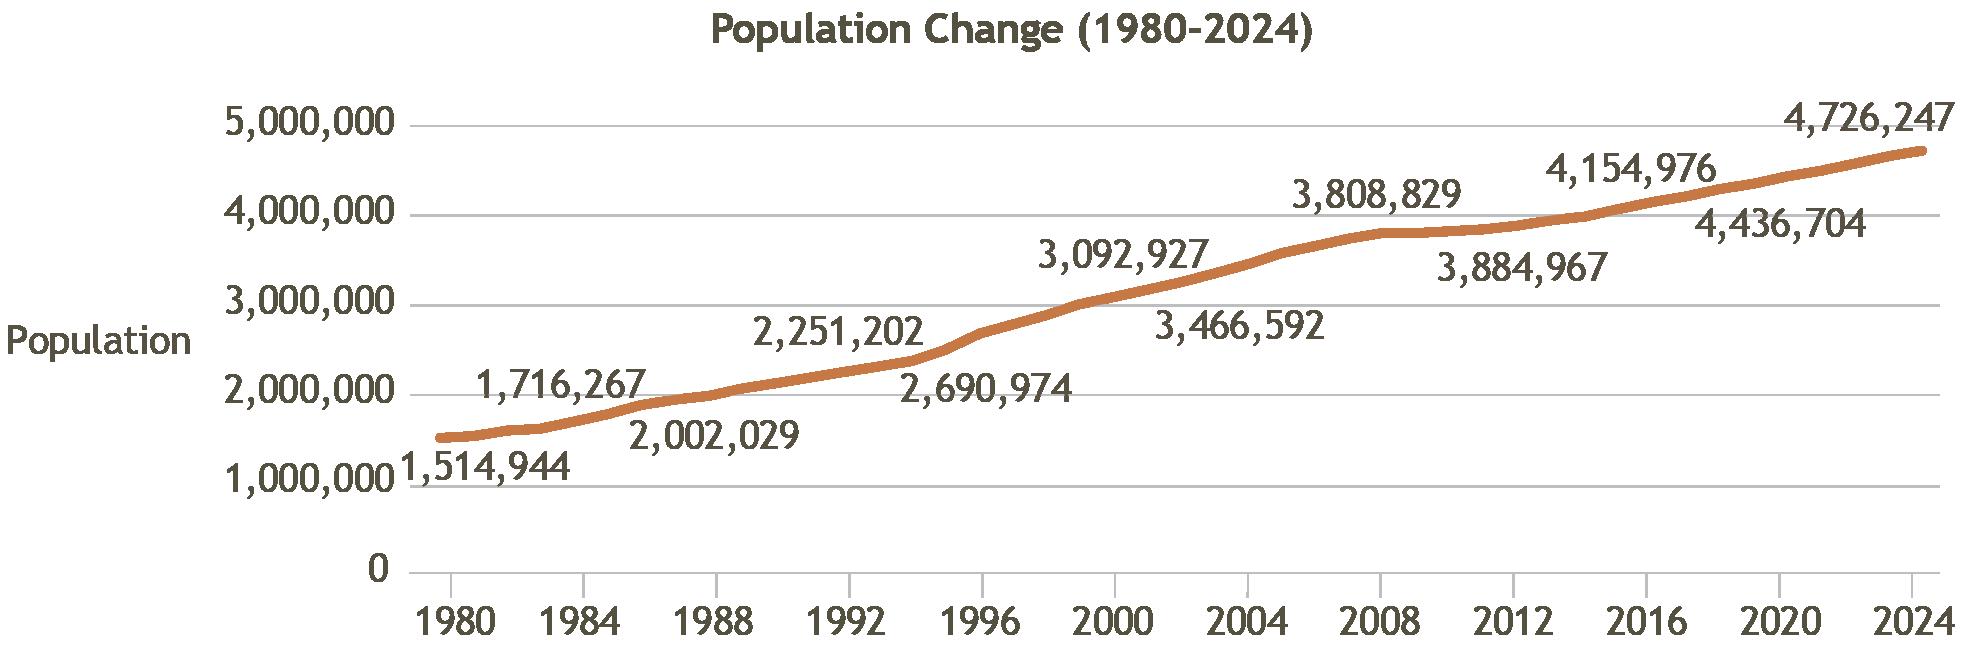
Maricopa County has more than tripled its population since 1980. In 2024, the population rose to 4,726,247, making it the most populous county in the state. In 2023, there were 1,697,342 households in Maricopa County, an 11.6% increase since 2018, the 7th fastest growth rate of Arizona’s counties.
Source: AZ Office of Economic Opportunity, 2025
Housing Stock
According to the 2019-2023 American Community Survey (ACS) estimates, there were 1,850,862 homes in Maricopa County. The majority (70%) of homes were single-family homes (SFH). Of the 36,011 homes permitted in 2024, 60% were SFH. Since 2018, the county has increased the number of homes in its housing stock by 8%. Just over half (53%) of all homes were built since 1990. The 2019-2023 ACS 5-year estimates show that 8% of homes in Maricopa County were vacant.1
Source: ACS 5-Year Estimates
Homeownership
Maricopa County
Maricopa County has more homeowners than renters, with a 65% homeownership rate, the 12th highest in the state, yet still falling below the state average of 67%. In 2022, 83% of all homes were primary residences, the 2nd highest proportion among Arizona counties, falling only 1% behind Pima.
Income and Costs
The median household income in Maricopa County was $85,518 according to the 2019-2023 ACS 5-year estimates, the highest in the state. Homeowners earned substantially more than renters, with a median income of $107,109 compared to $60,088. The median monthly housing cost (including utilities) in 2023 was $1,511, and the median monthly cost for renters was $1,587, the highest in the state. Zillow’s typical value for a home in Maricopa County in March 2024 was $467,781, a 40% increase since 2018 (inflationadjusted).2 That is the 3rd highest value and the 9th highest value increase among Arizona counties. Maricopa has the 3rd highest rate of cost burden among Arizona counties, with 30% of households spending 30% or more of their income on housing costs.
Evictions
A record 87,094 evictions were filed in Maricopa in 2024 (Fiscal Year). That is 184.3 per 10,000 people, the highest rate in the state. Eviction filings have increased 33% since 2018.
Notes
For more information about Maricopa County and the other counties in Arizona, visit the ARCHES website at morrisoninstitute.asu.edu/arches/state-housing.
1. Definition of Vacant housing units (homes): Housing is vacant if no one lives there on a permanent basis, including if occupants have a usual residence elsewhere. Housing under construction is included if it has exterior walls, windows, and floors. Excluded empty housing are those that are exposed to the elements (missing walls, roof etc.) or not used primarily for residential purposes (such as for businesses). “Definitions and Explanations,” Census Bureau, Housing Vacancy Survey, https://www.census.gov/housing/hvs/ definitions.pdf.
2. Calculated using the Zillow Home Value Index (ZHVI) which is a measure of the typical home value and market changes across a given region and housing type. It reflects the typical value for homes in the 35th to 65th percentile range. Also smoothed and seasonally adjusted. “ZHVI All Homes (SFR, Condo/Co-op) Time Series, Smoothed, Seasonally Adjusted ($), by County,” Zillow Housing Data, accessed January 2025, https://www.zillow.com/research/data/?msockid=3b31736dfb4e62cd18806790fa3163e7
Sources
“Population Estimates,” Arizona Office of Economic Opportunity, accessed November 2024, https://oeo.az.gov/population/estimates.
“Table DP04: Selected Housing Characteristics,” US Census Bureau, 2023 American Community Survey 5-Year Survey, accessed December 2024. https://data.census.gov/table/ACSDP5Y202 3.DP04?q=dp04&g=040XX00US04$0500000 .
“Historic Property Records,” Cotality (formerly CoreLogic), 2022, ARCHES calculations include all residential properties (excluding corporate-owned).
“2024 Preliminary Annual.” Census Bureau Building Permit Survey, Permits by CBSA (Formerly Permits by MSA), accessed February 2025. https://www.census.gov/construction/bps/msamonthly.html.
“Table S2503: Financial Characteristics,” US Census Bureau, 2023 American Community Survey 5-Year Estimate, accessed December 2024. https://data.census.gov/table?q=s2503&g=040XX00US04$0500000
COUNTY SEAT: Kingman LARGEST CITY: Lake Havasu City
HOUSEHOLDS
96,899 HOMES
119,593
Population
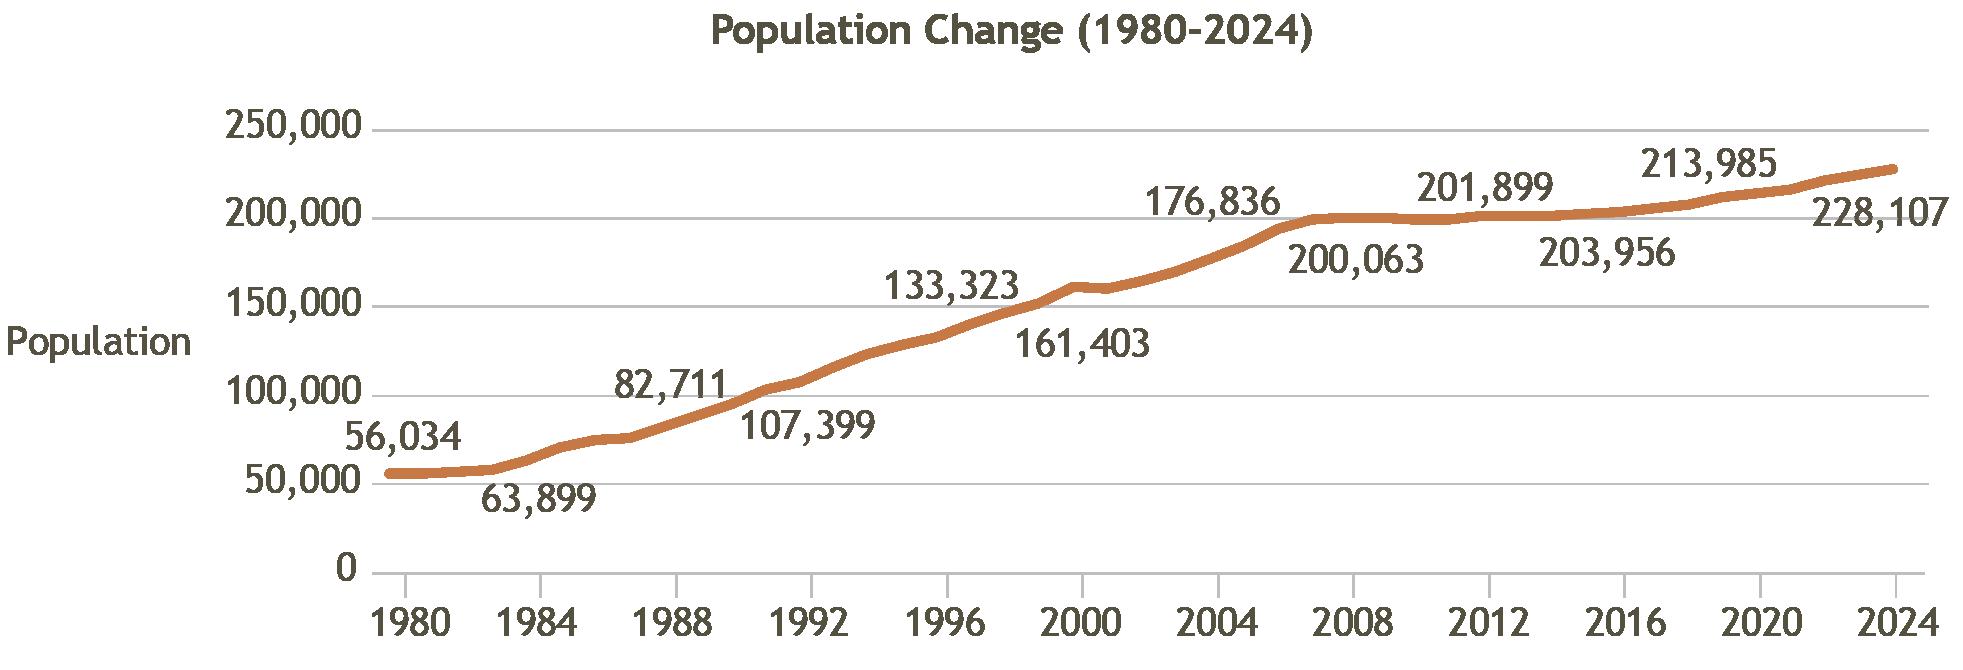
Mohave County’s population has tripled since 1980. In 2024, the population was 228,107, making it the 5 th most populous county in the state. In 2023, there were 96,899 households in Mohave County, an increase of 13.4% since 2018, the 6th fastest growth rate of Arizona’s counties.
Source: AZ Office of Economic Opportunity, 2025
Housing Stock
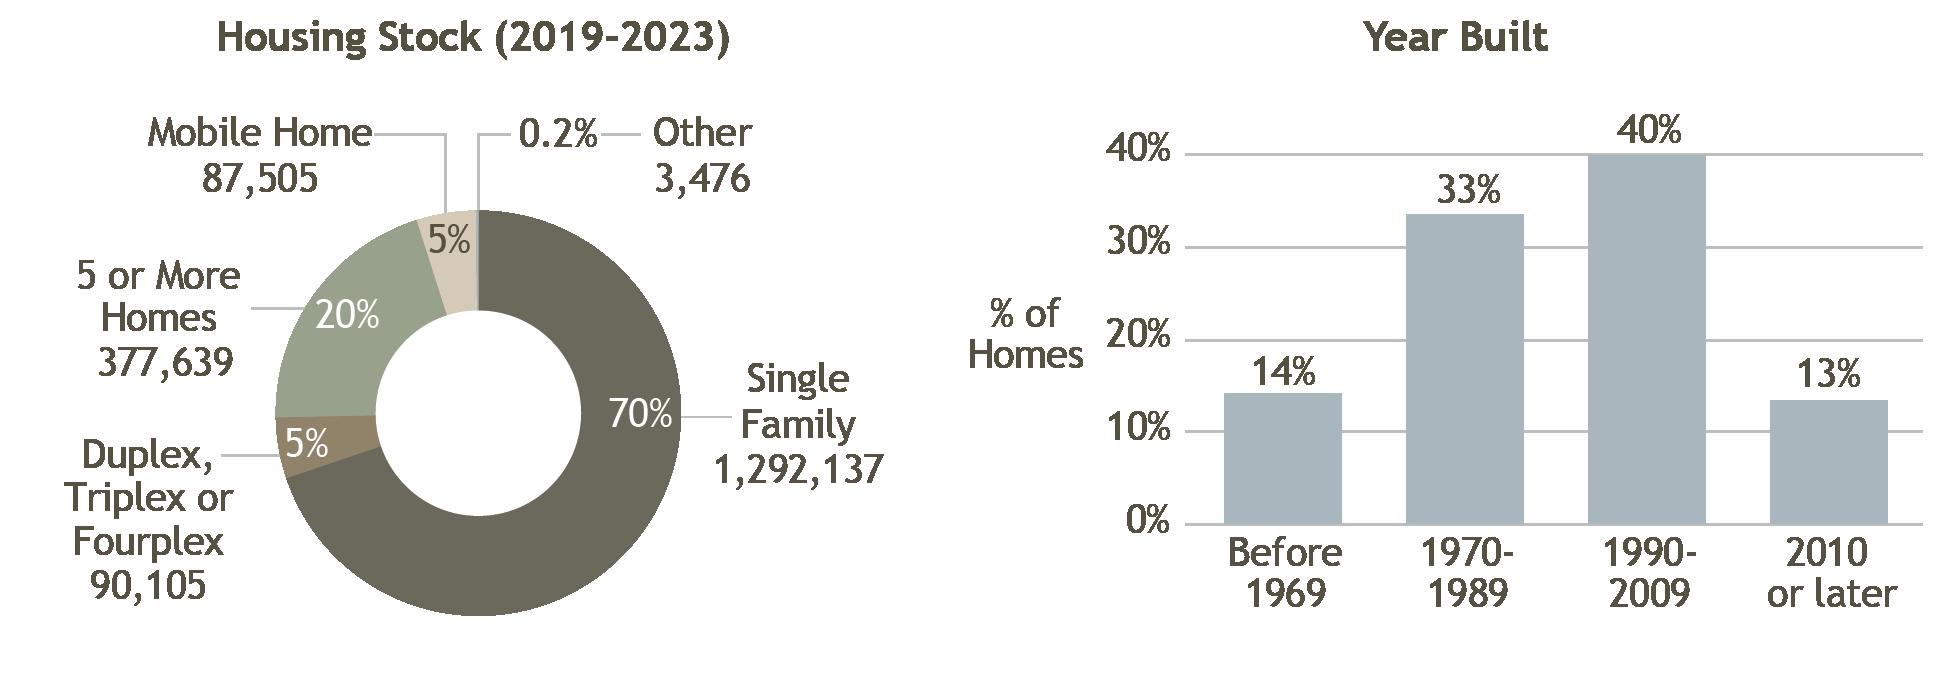
According to the 2019-2023 American Community Survey (ACS) estimates, there were 119,593 homes in Mohave County. Most (65%) homes were single-family homes (SFH). Of the 2,543 homes permitted in 2024, 97% were SFH. Since 2018, the county has increased the number of homes in its housing stock by 5%. A majority (60%) of all homes were built since 1990. The 2019-2023 ACS 5-year estimates show that 19% of all housing in Mohave County was vacant.1
Source: ACS 5-Year Estimates
Homeownership
Mohave County
Mohave County has more homeowners than renters, with a 74% homeownership rate, the 4th highest in the state. In 2022, 62% of all homes were primary residences, the 9th highest among Arizona’s counties.
Income and Costs
The median household income in Mohave County was $55,799, according to the 2019-2023 ACS 5-year estimates, 11th highest in the state. Homeowners earned more than renters, with a median income of $62,427, compared to $41,552. The median monthly housing cost (including utilities) in 2023 was $914, the 6th highest in the state. The median monthly cost for renters was $1,047, the 6th highest in the state. Zillow’s typical value for a home in Mohave County in March 2024 was $352,536, a 40% increase since 2018 (inflation-adjusted).2 That is the 7th highest value and 8th highest value increase among all Arizona counties. Mohave has the 6th highest rate of cost burden among Arizona counties, with 28% of households paying 30% or more of their income to housing costs.
Evictions
There were 881 evictions filed in Mohave in 2024 (Fiscal Year). That is 38.6 per 10,000 people, the 4th highest rate in the state. Eviction filings have decreased 6% since 2018.
For more information about Mohave County and the other counties in Arizona, visit the ARCHES website at morrisoninstitute.asu.edu/arches/state-housing.
Notes
1. Definition of vacant housing units (homes): Housing is vacant if no one lives there on a permanent basis, including if occupants have a usual residence elsewhere. Housing under construction is included if it has exterior walls, windows, and floors. Excluded empty housing are those that are exposed to the elements (missing walls, roof etc.) or not used primarily for residential purposes (such as for businesses). “Definitions and Explanations,” Census Bureau, Housing Vacancy Survey, https://www.census.gov/housing/ hvs/definitions.pdf
2. Calculated using the Zillow Home Value Index (ZHVI) which is a measure of the typical home value and market changes across a given region and housing type. It reflects the typical value for homes in the 35th to 65th percentile range. Also smoothed and seasonally adjusted. “ZHVI All Homes (SFR, Condo/Co-op) Time Series, Smoothed, Seasonally Adjusted ($), by County,” Zillow Housing Data, accessed January 2025, https://www.zillow.com/research/data/?msockid=3b31736dfb4e62cd18806790fa3163e7.
Sources
“Population Estimates,” Arizona Office of Economic Opportunity, accessed November 2024, https://oeo.az.gov/population/estimates.
“Table DP04: Selected Housing Characteristics,” US Census Bureau, 2023 American Community Survey 5-Year Survey, accessed December 2024. https://data.census.gov/table/ACSDP5Y202 3.DP04?q=dp04&g=040XX00US04$0500000
“Historic Property Records,” Cotality (formerly CoreLogic), 2022, ARCHES calculations include all residential properties (excluding corporate-owned).
“2024 Preliminary Annual.” Census Bureau Building Permit Survey, Permits by CBSA (Formerly Permits by MSA), accessed February 2025. https://www.census.gov/construction/bps/msamonthly.html
“Table S2503: Financial Characteristics,” US Census Bureau, 2023 American Community Survey 5-Year Estimate, accessed December 2024. https://data.census.gov/table?q=s2503&g=040XX00US04$0500000.
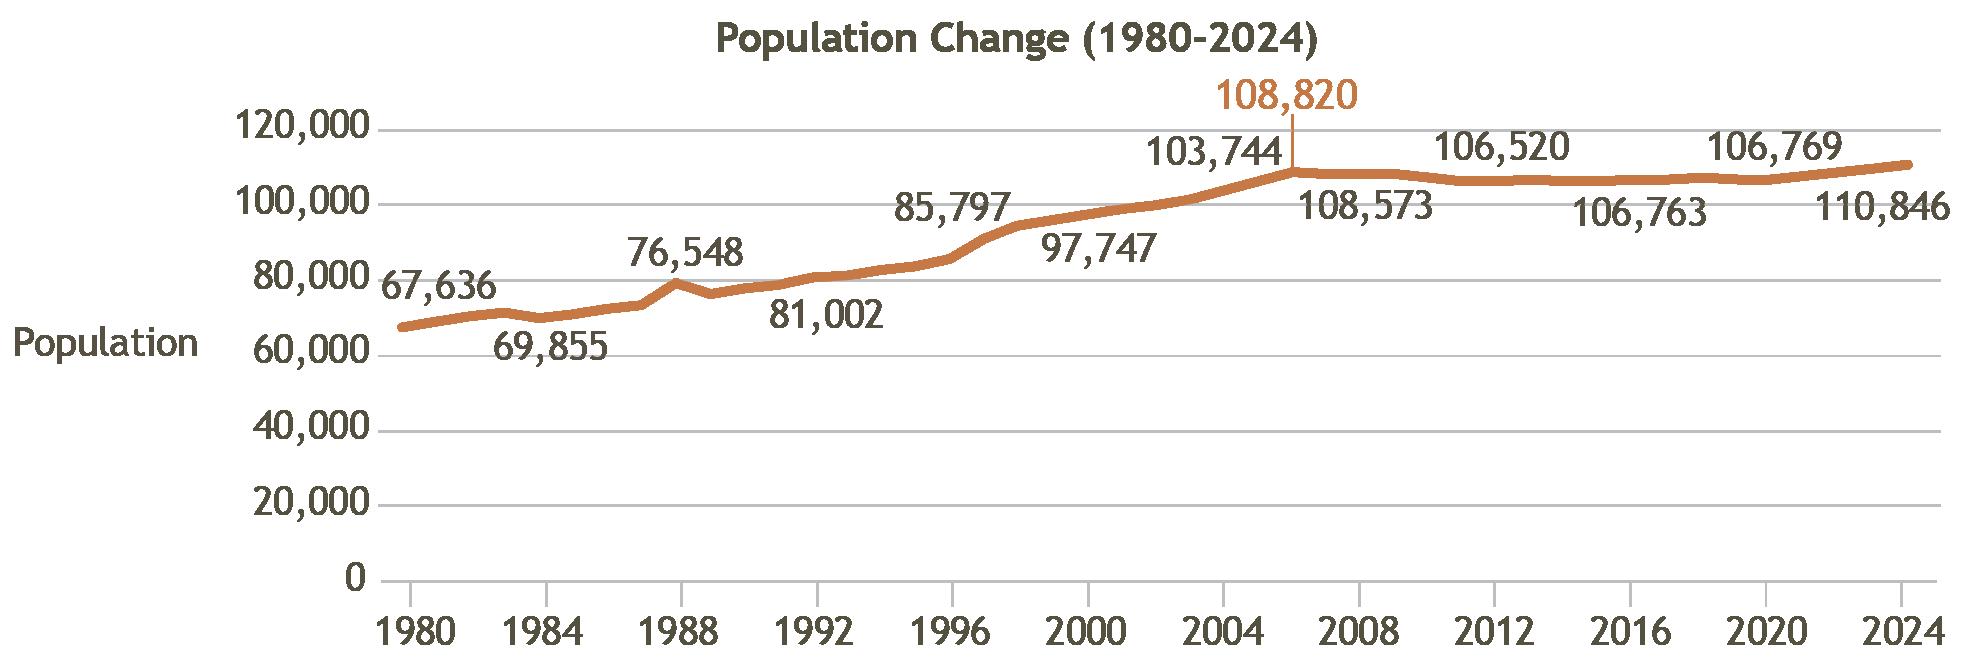
Navajo County’s population has plateaued since 2007 after a period of steady growth. In 2024, the population was 110,846, making it the 9th most populous county in the state. There were 39,171 households, marking a 13.8% increase since 2018, the 3rd fastest growth rate of Arizona’s counties.
Source: AZ Office of Economic Opportunity, 2025
Housing Stock
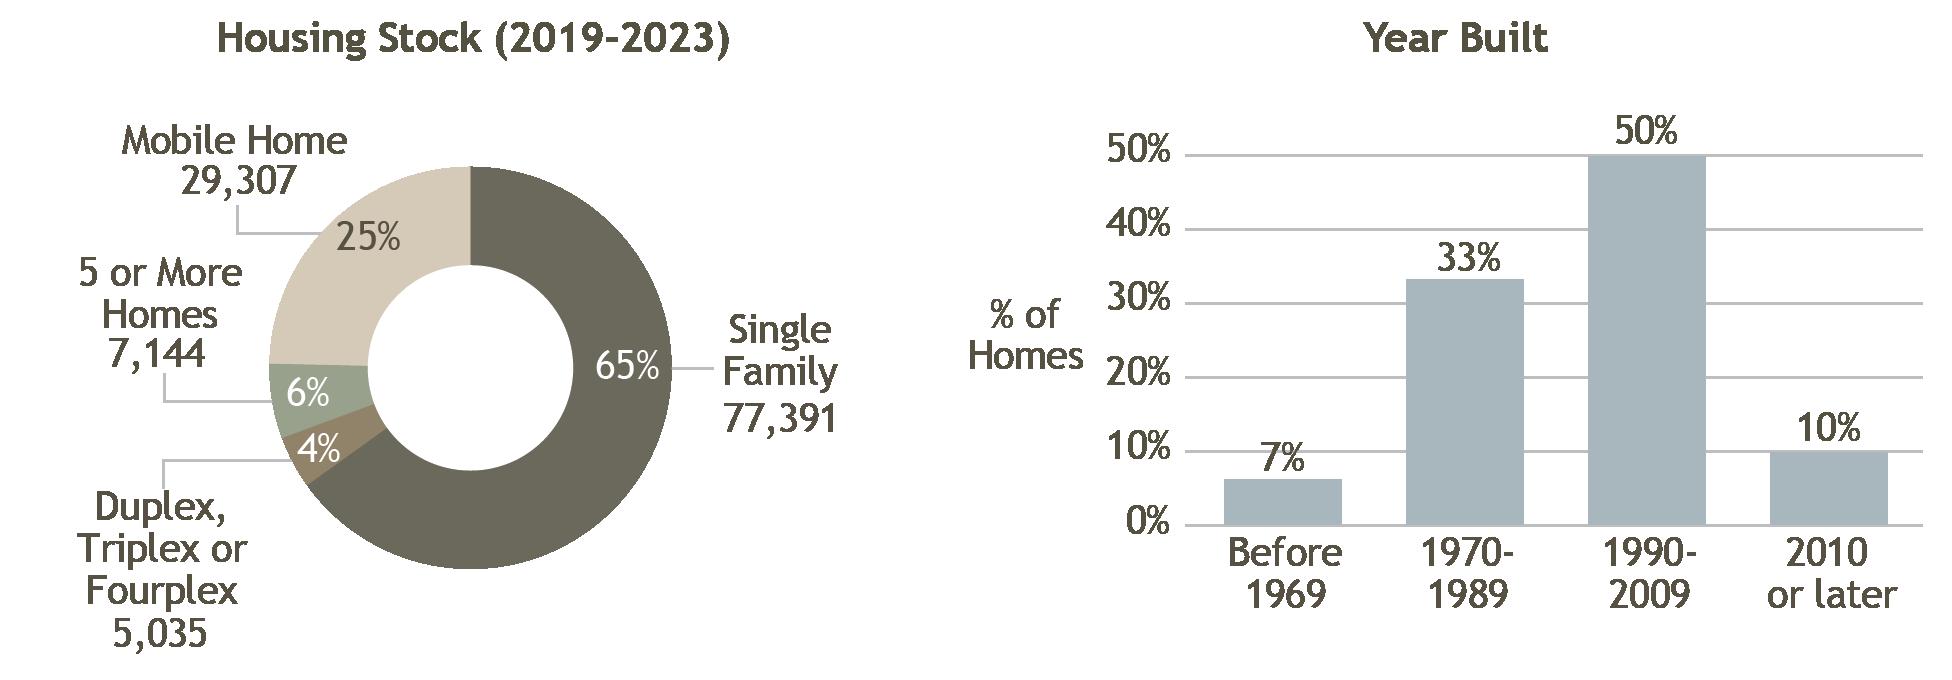
According to the 2019-2023 American Community Survey (ACS) estimates, there were 56,946 homes in Navajo County. The majority (74%) of homes were single-family homes (SFH). Of the 485 homes permitted in 2024, 93% were SFH. Since 2018, the county has lost 1.4% of homes from its housing stock. Nearly half (47%) of all homes were built since 1990. The 2019-2023 ACS 5-year estimates show that 31% of homes in Navajo County were vacant.1
Source: ACS 5-Year Estimates
Homeownership
Navajo County
Navajo County has more homeowners than renters with a 73% homeownership rate, coming in above the state average of 67%. In 2022, 37% of all home sales were for primary residences, the 2nd lowest among Arizona counties, behind only Apache at 23%.
Income and Costs
The median household income in Navajo County was $52,752 according to the 2019-2023 ACS 5-year estimates, the 3rd lowest in the state. Homeowners earned more than renters at a median income of $57,323, compared to $41,423. The median monthly housing cost (including utilities) in 2023 was $597, the 4th lowest in the state. The median monthly cost for renters was $832, the 11th highest. Zillow’s typical value for a home in Navajo County in March 2024 was $379,007, a 50% increase since 2018 (inflationadjusted).2 That is the 4th highest value and the highest value increase among all Arizona counties. Navajo has tied with La Paz County for the 3rd lowest rate of cost burden among Arizona counties, with 19% of households paying 30% or more of their income to housing costs.
Evictions
There were 186 evictions filed in Navajo in 2024 (Fiscal Year). That is 16.8 per 10,000 people, the 12th highest rate in the state. Eviction filings have decreased 2% since 2018.
Notes
For more information about Navajo County and the other counties in Arizona, visit the ARCHES website at morrisoninstitute.asu.edu/arches/state-housing.
1. Definition of Vacant housing units (homes): Housing is vacant if no one lives there on a permanent basis, including if occupants have a usual residence elsewhere. Housing under construction is included if it has exterior walls, windows, and floors. Excluded empty housing are those that are exposed to the elements (missing walls, roof etc.) or not used primarily for residential purposes (such as for businesses). “Definitions and Explanations,” Census Bureau, Housing Vacancy Survey, https://www.census.gov/housing/ hvs/definitions.pdf
2. Calculated using the Zillow Home Value Index (ZHVI) which is a measure of the typical home value and market changes across a given region and housing type. It reflects the typical value for homes in the 35th to 65th percentile range. Also smoothed and seasonally adjusted. “ZHVI All Homes (SFR, Condo/Co-op) Time Series, Smoothed, Seasonally Adjusted ($), by County,” Zillow Housing Data, accessed January 2025, https://www.zillow.com/research/data/?msockid=3b31736dfb4e62cd18806790fa3163e7
Sources
“Population Estimates,” Arizona Office of Economic Opportunity, accessed November 2024, https://oeo.az.gov/population/estimates.
“Table DP04: Selected Housing Characteristics,” US Census Bureau, 2023 American Community Survey 5-Year Survey, accessed December 2024. https://data.census.gov/table/ACSDP5Y202 3.DP04?q=dp04&g=040XX00US04$0500000
“Historic Property Records,” Cotality (formerly CoreLogic), 2022, ARCHES calculations include all residential properties (excluding corporate-owned).
“2024 Preliminary Annual.” Census Bureau Building Permit Survey, Permits by CBSA (Formerly Permits by MSA), accessed February 2025. https://www.census.gov/construction/bps/msamonthly.html
“Table S2503: Financial Characteristics,” US Census Bureau, 2023 American Community Survey 5-Year Estimate, accessed December 2024. https://data.census.gov/table?q=s2503&g=040XX00US04$0500000.
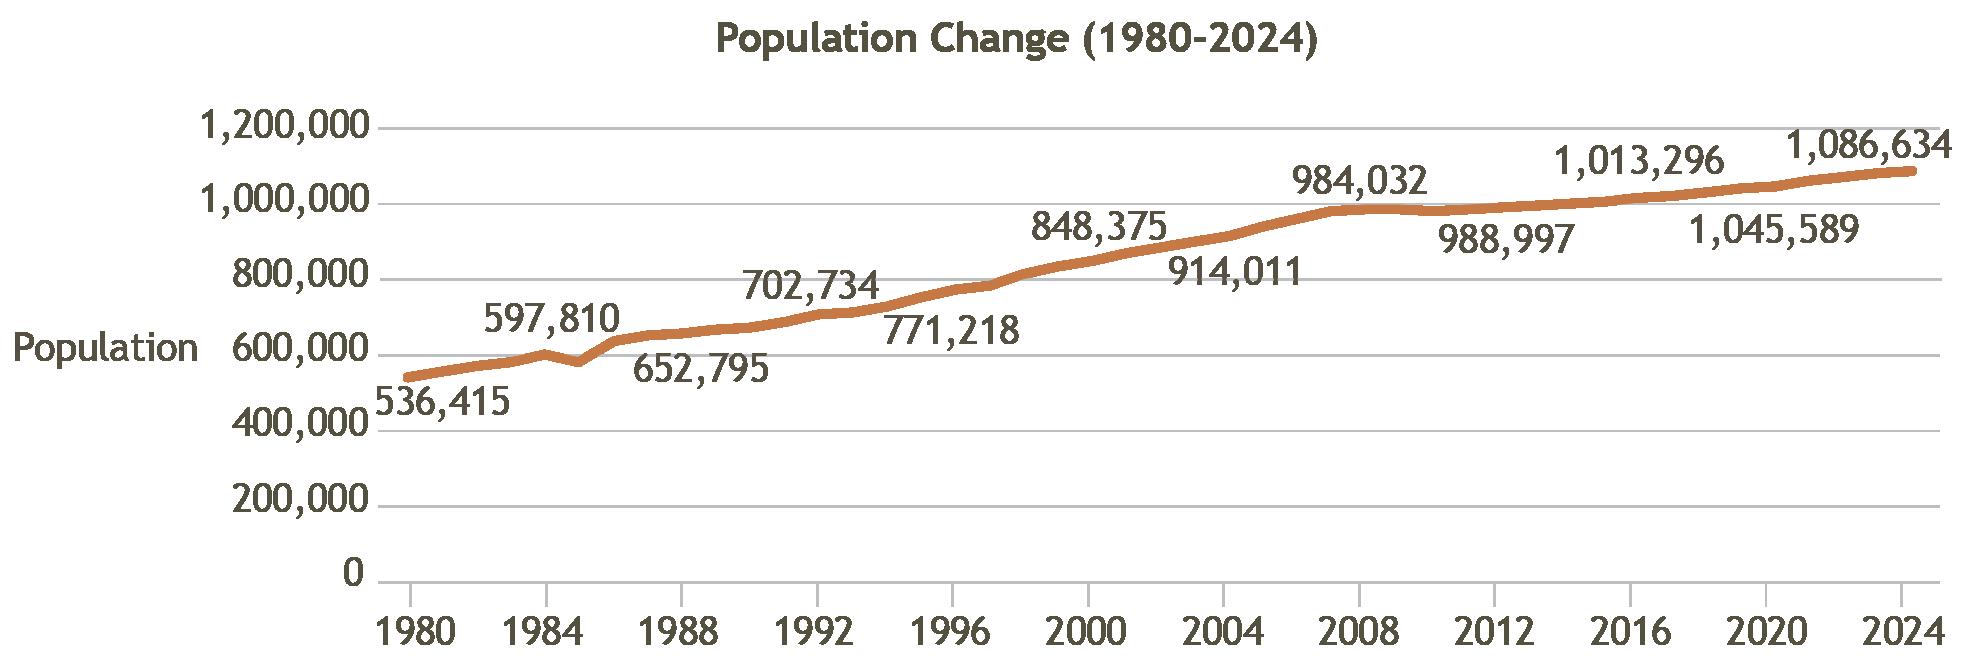
Pima County has grown steadily since the 1980s, with a population of 1,086,634 in 2024, making it the 2 nd most populous county in the state, behind Maricopa. There are 430,965 households in Pima, which grew 7.5% since 2018, the 9th fastest growth rate of Arizona’s counties.
Source: AZ Office of Economic Opportunity, 2025
Housing Stock
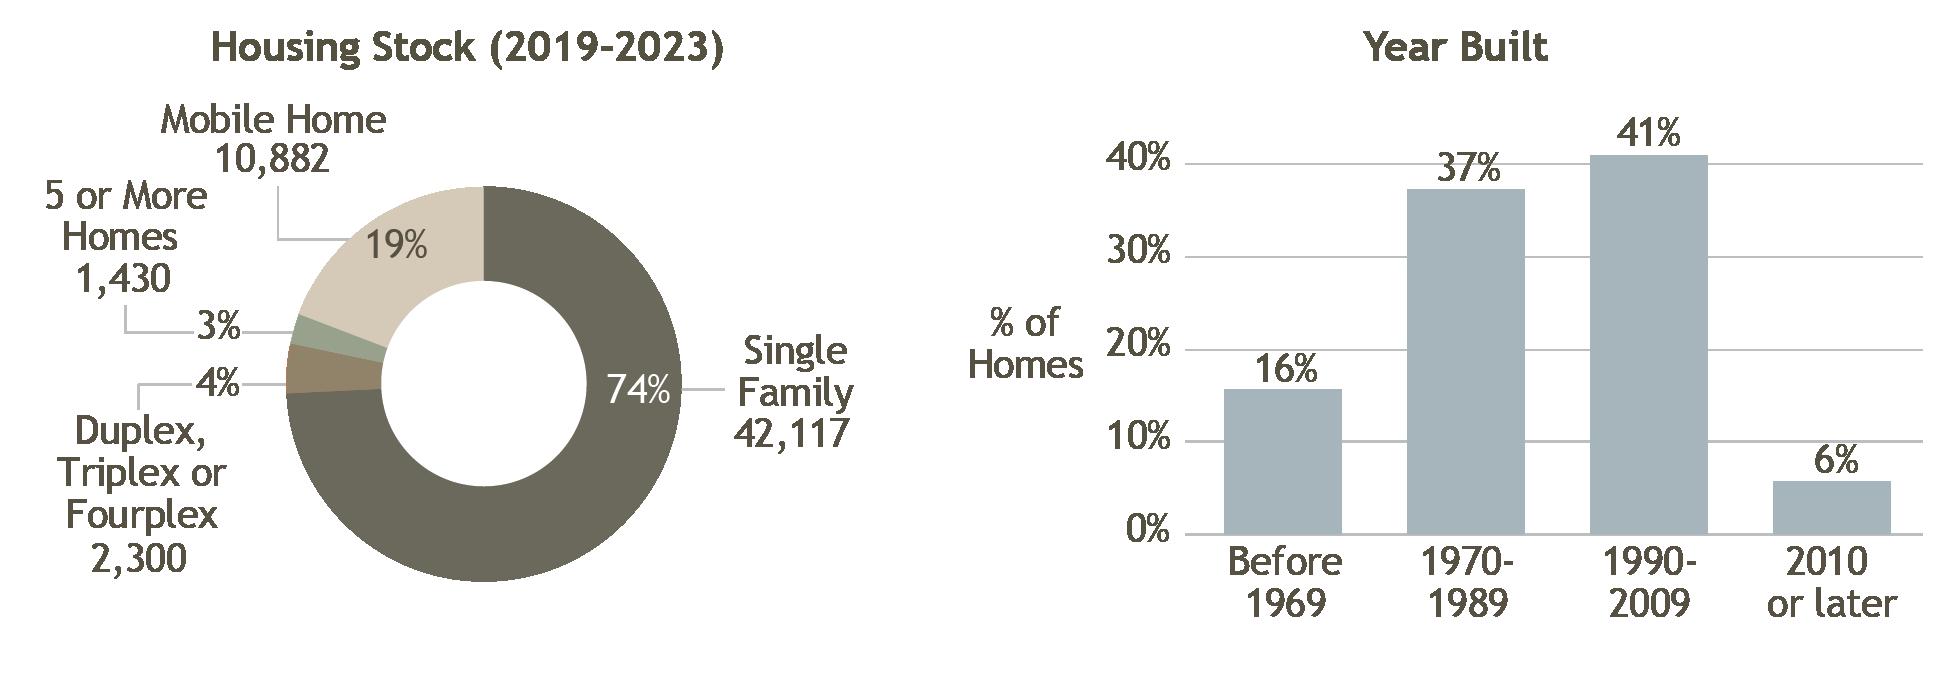
According to the 2019-2023 American Community Survey (ACS) estimates, there were 475,378 homes in Pima County. The majority (67%) of homes were single-family homes (SFH). Of the 5,268 homes permitted in 2024, 79% were SFH. Since 2018, the county has increased the number of homes in its housing stock by 4%. Under half (44%) of homes were built since 1990. The 2019-2023 ACS 5-year estimates show that 9.3% of homes in Pima County were vacant.1
Source: ACS 5-Year Estimates
Homeownership
Pima County
Pima County has more homeowners than renters; however, the county has the 3rd lowest homeownership rate in the state at 65%, falling below the state average of 67%. In 2022, 84% of all home sales were for primary residences. This is the highest percentage among all counties in the state.
Income and Costs
The median household income in Pima County was $67,929 according to the 2019-2023 ACS 5-year estimates, the 5th highest in the state. Homeowners earned nearly twice as much as renters (median income of $86,285 compared to $43,473). The median monthly housing cost (including utilities) in 2023 was $1,138, the 4th highest in the state. The median monthly cost for renters was $1,154, the 5th highest in the state. Zillow’s typical value for a home in Pima County in March 2024 was $344,166, a 37% increase since 2018 (inflation-adjusted).2 That is the 8th highest value and 10th highest value increase among all counties in Arizona. Pima County had the 2nd highest rate of cost burden (behind Coconino County), with 31% of households paying 30% or more of their income to housing costs.
Evictions
There were 12,904 evictions filed in Pima in 2024 (Fiscal Year). That is 118.8 per 10,000 people, the 2 nd highest rate in the state. Eviction filings have decreased by 2% since 2018.
For more information about Pima County and the other counties in Arizona, visit the ARCHES website at morrisoninstitute.asu.edu/arches/state-housing.
Notes
1. Definition of vacant housing units (homes): Housing is vacant if no one lives there on a permanent basis, including if occupants have a usual residence elsewhere. Housing under construction is included if it has exterior walls, windows, and floors. Excluded empty housing are those that are exposed to the elements (missing walls, roof etc.) or not used primarily for residential purposes (such as for businesses). “Definitions and Explanations,” Census Bureau, Housing Vacancy Survey, https://www.census.gov/housing/ hvs/definitions.pdf.
2. Calculated using the Zillow Home Value Index (ZHVI) which is a measure of the typical home value and market changes across a given region and housing type. It reflects the typical value for homes in the 35th to 65th percentile range. Also smoothed and seasonally adjusted. “ZHVI All Homes (SFR, Condo/Co-op) Time Series, Smoothed, Seasonally Adjusted ($), by County,” Zillow Housing Data, accessed January 2025, https://www.zillow.com/research/data/?msockid=3b31736dfb4e62cd18806790fa3163e7.
Sources
“Population Estimates,” Arizona Office of Economic Opportunity, accessed November 2024, https://oeo.az.gov/population/estimates
“Table DP04: Selected Housing Characteristics,” US Census Bureau, 2023 American Community Survey 5-Year Survey, accessed December 2024. https://data.census.gov/table/ACSDP5Y202 3.DP04?q=dp04&g=040XX00US04$0500000 .
“Historic Property Records,” Cotality (formerly CoreLogic), 2022, ARCHES calculations include all residential properties (excluding corporate-owned).
“2024 Preliminary Annual.” Census Bureau Building Permit Survey, Permits by CBSA (Formerly Permits by MSA), accessed February 2025. https://www.census.gov/construction/bps/msamonthly.html.
“Table S2503: Financial Characteristics,” US Census Bureau, 2023 American Community Survey 5-Year Estimate, accessed December 2024. https://data.census.gov/table?q=s2503&g=040XX00US04$0500000.
COUNTY SEAT: Florence LARGEST CITY: San Tan Valley
HOUSEHOLDS
157,193 HOMES
179,861
Population
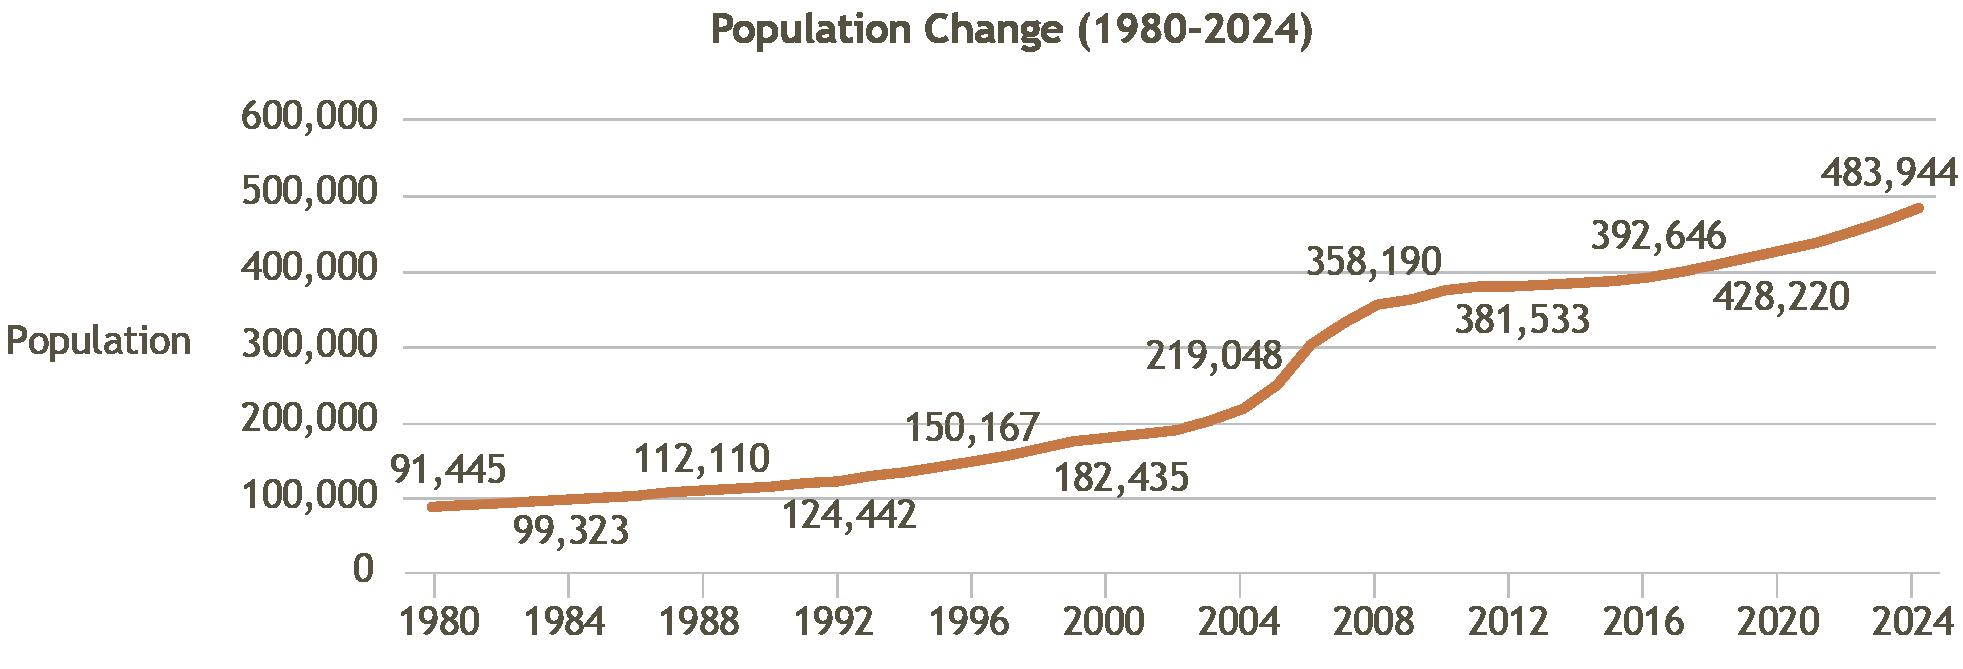
Pinal County has increased its population more than five times since 2000, with a population of 483,944 in 2024, making it the 3rd most populous county in the state. There are 157,193 households in Pinal County, a 14.5% increase since 2018, the 2nd fastest growth rate of Arizona’s counties.
Source: AZ Office of Economic Opportunity, 2025
Housing Stock
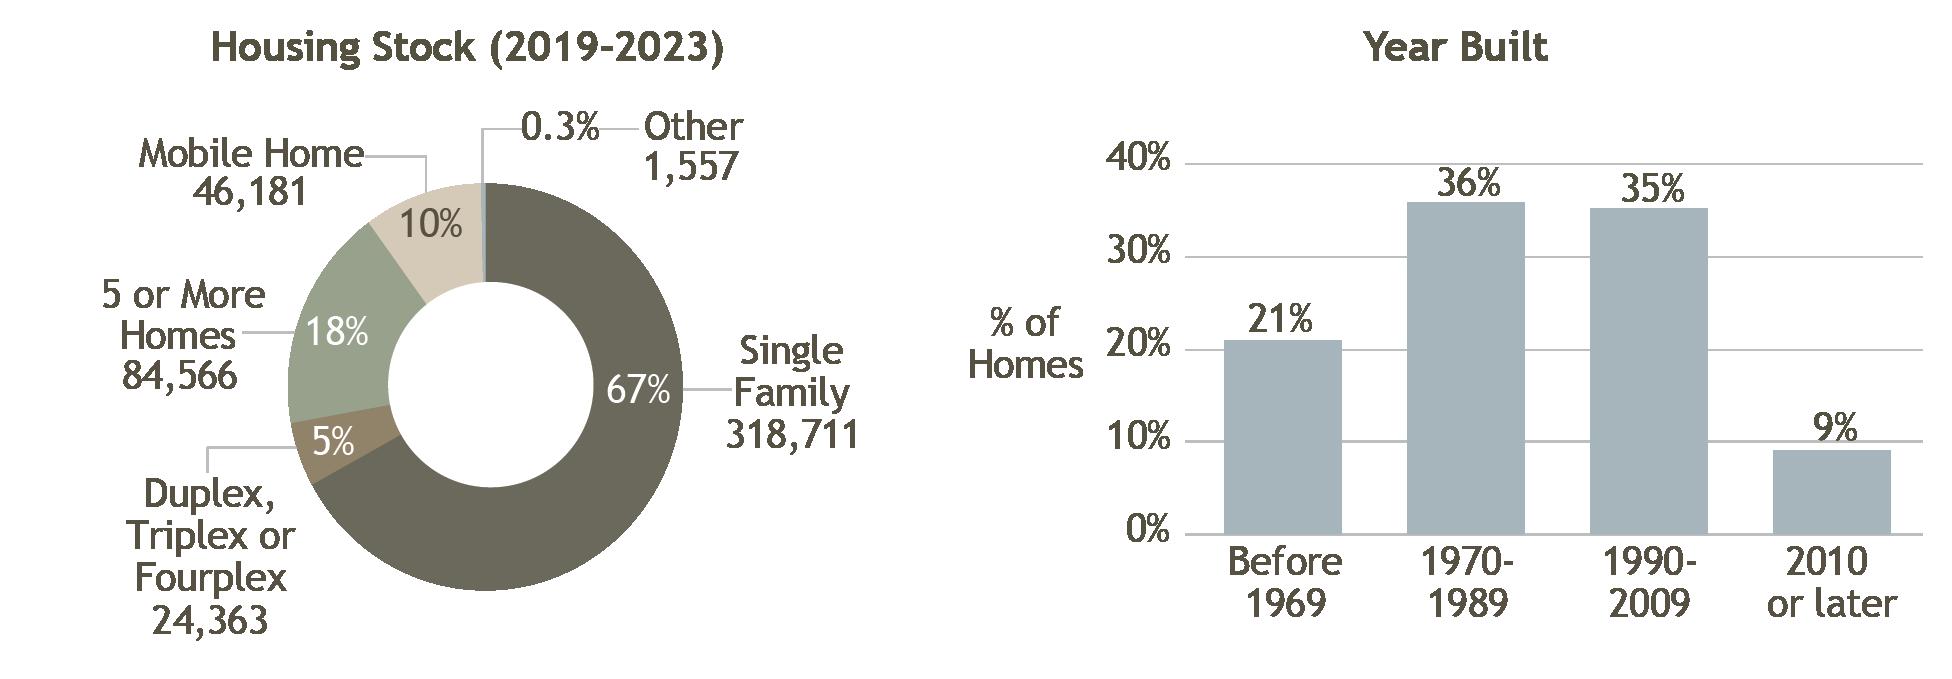
According to the 2019-2023 American Community Survey (ACS) estimates, there were 179,861 homes in Pinal County. The majority (78%) of homes were single-family homes (SFH). Of the 9,504 homes permitted in 2024, 91% were SFH. Since 2018, the county has increased the number of homes in its housing stock by 5%. A majority (77%) of all homes were built since 1990. The 2019-2023 ACS 5-year estimates show that 12.6% of all housing in Pinal County was vacant.1
Source: ACS 5-Year Estimates
Homeownership
Pinal County
Pinal has the highest homeownership rate of all of Arizona’s counties at 81%. In 2022, 78% of all homes were primary residences, tying with Graham and Santa Cruz counties for the 3rd highest percentage in the state.
Income and Costs
The median household income in Pinal County was $77,588 according to the 2019-2023 ACS 5-year estimates, the 2nd highest in the state. Homeowners earned more than renters at a median income of $83,633, compared to $55,895. The median monthly housing cost (including utilities) in 2023 was $1,230, the 3rd highest in the state. The median monthly cost for renters was $1,417, the 2nd highest. Zillow’s typical value for a home in Pinal County in March 2024 was $375,253, a 50% increase since 2018 (inflationadjusted).2 That is the 6th highest value and 2nd highest value increase among all counties in Arizona. Pinal County had the 9th highest rate of cost burden among Arizona counties, with 25% of households paying 30% or more of their income to housing costs.
Evictions
There were 2,835 evictions filed in Pinal in 2024 (Fiscal Year). That is 58.6 per 10,000 people, the 3 rd highest rate in the state. Eviction filings have increased 31% since 2018.
For more information about Pinal County and the other counties in Arizona, visit the ARCHES website at morrisoninstitute.asu.edu/arches/state-housing.
Notes
1. Definition of vacant housing units (homes): Housing is vacant if no one lives there on a permanent basis, including if occupants have a usual residence elsewhere. Housing under construction is included if it has exterior walls, windows, and floors. Excluded empty housing are those that are exposed to the elements (missing walls, roof etc.) or not used primarily for residential purposes (such as for businesses). “Definitions and Explanations,” Census Bureau, Housing Vacancy Survey, https://www.census.gov/housing/ hvs/definitions.pdf.
2. Calculated using the Zillow Home Value Index (ZHVI) which is a measure of the typical home value and market changes across a given region and housing type. It reflects the typical value for homes in the 35th to 65th percentile range. Also smoothed and seasonally adjusted. “ZHVI All Homes (SFR, Condo/Co-op) Time Series, Smoothed, Seasonally Adjusted ($), by County,” Zillow Housing Data, accessed January 2025, https://www.zillow.com/research/data/?msockid=3b31736dfb4e62cd18806790fa3163e7v
Sources
“Population Estimates,” Arizona Office of Economic Opportunity, accessed November 2024, https://oeo.az.gov/population/estimates.
“Table DP04: Selected Housing Characteristics,” US Census Bureau, 2023 American Community Survey 5-Year Survey, accessed December 2024. https://data.census.gov/table/ACSDP5Y202 3.DP04?q=dp04&g=040XX00US04$0500000 .
“Historic Property Records,” Cotality (formerly CoreLogic), 2022, ARCHES calculations include all residential properties (excluding corporate-owned).
“2024 Preliminary Annual.” Census Bureau Building Permit Survey, Permits by CBSA (Formerly Permits by MSA), accessed February 2025. https://www.census.gov/construction/bps/msamonthly.html.
“Table S2503: Financial Characteristics,” US Census Bureau, 2023 American Community Survey 5-Year Estimate, accessed December 2024. https://data.census.gov/table?q=s2503&g=040XX00US04$0500000
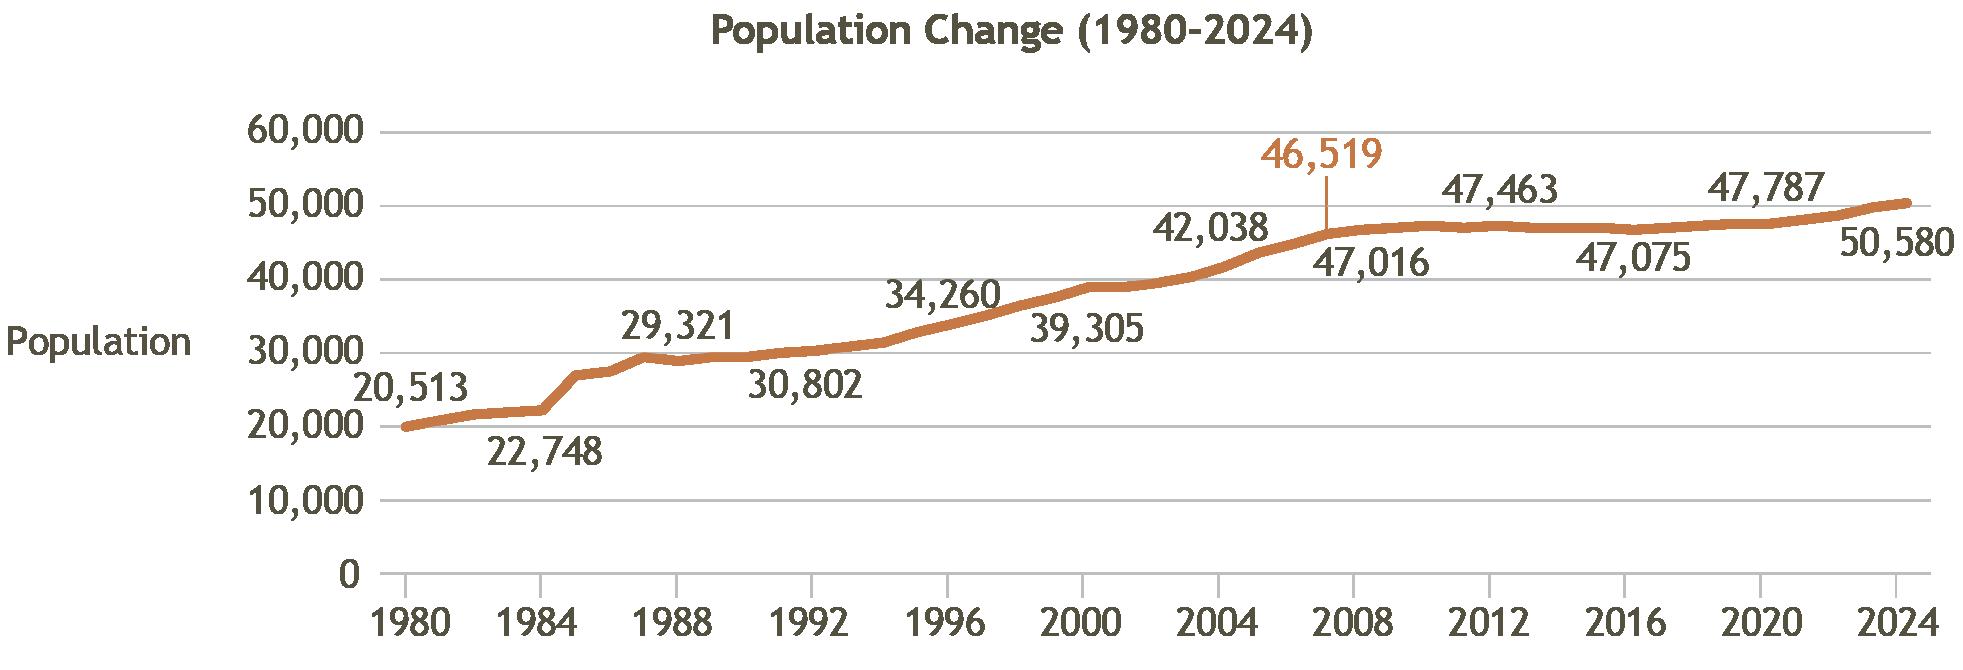
After a plateau starting in 2007, the population in Santa Cruz County has slightly increased. In 2024, the population was 50,580, making it the 11th most populous county in the state. There were 16,816 households in Santa Cruz, which grew 9% since 2018, the 8th fastest growth rate of Arizona’s counties.
Source: AZ Office of Economic Opportunity, 2025
Housing Stock
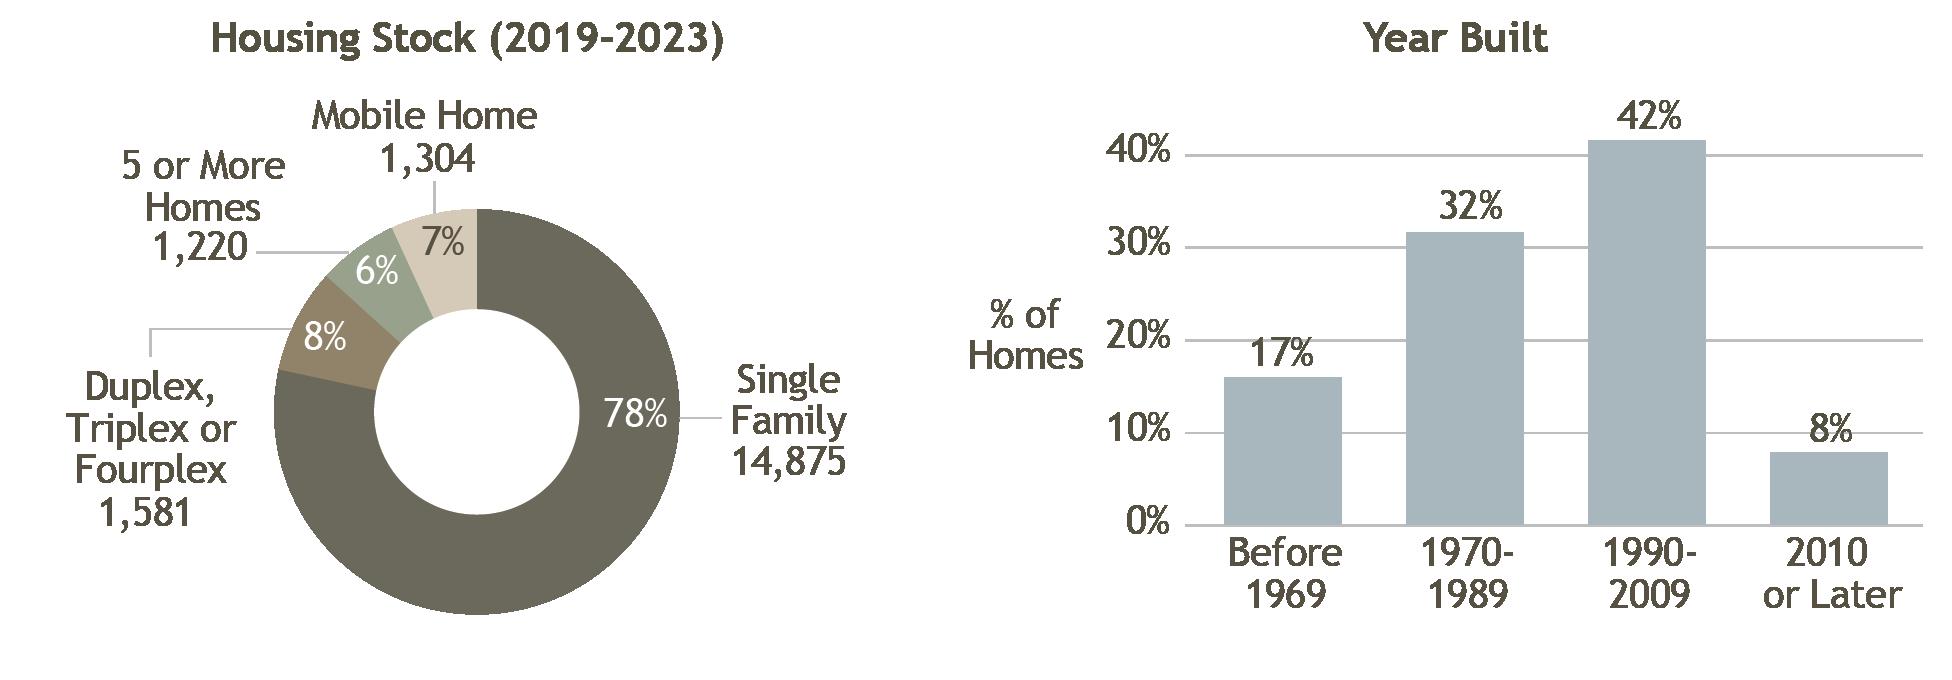
According to the 2019-2023 American Community Survey (ACS) estimates, there were 18,997 homes in Santa Cruz County. The majority (78%) of homes were single-family homes (SFH). Of the 340 homes permitted in 2024, all but two were SFH. Since 2018, the county has increased the number of homes in its housing stock by 4.1%. Santa Cruz was one of only two (2) Arizona counties that added, rather than lost, mobile/manufactured homes. Half (50%) of homes were built since 1990. The 2019-2023 ACS 5-year estimates show that 12% of homes in Santa Cruz County were vacant.1
Source: ACS 5-Year Estimates
Homeownership
Santa Cruz County
Santa Cruz County had more homeowners than renters, with a 68% homeownership rate, coming in just above the state average of 67%. In 2022, 78% of all homes were primary residences, tying with Pinal and Santa Cruz counties for the 3rd highest in the state.
Income and Costs
The median household income in Santa Cruz County was $53,614 according to the 2019-2023 ACS 5-year estimates, the 4th lowest in the state. Homeowners earned about double compared to renters at a median income of $64,455, compared to $32,234. The median monthly housing cost (including utilities) in 2023 was $866, the 9th highest in the state. The median monthly cost for renters was $781, ranking 12th highest in the state. Zillow’s typical value for a home in Santa Cruz County in 2024 was $264,354, a 42% increase since 2018 (inflation-adjusted).2 That is the 13th highest value and 6th highest value increase among all counties in Arizona. Santa Cruz has the 5th highest rate of cost burden among Arizona counties, with 28% of households paying 30% or more of their income to housing costs.
Evictions
There were 152 evictions filed in Santa Cruz in 2024 (Fiscal Year). That is 30.1 per 10,000 people, the 9 th highest rate in the state. Eviction filings have decreased 38% since 2018.
For more information about Santa Cruz County and the other counties in Arizona, visit the ARCHES website at morrisoninstitute.asu.edu/arches/state-housing.
Notes
1. Definition of vacant housing units (homes): Housing is vacant if no one lives there on a permanent basis, including if occupants have a usual residence elsewhere. Housing under construction is included if it has exterior walls, windows, and floors. Excluded empty housing are those that are exposed to the elements (missing walls, roof etc.) or not used primarily for residential purposes (such as for businesses). “Definitions and Explanations,” Census Bureau, Housing Vacancy Survey, https://www.census.gov/housing/hvs/ definitions.pdf.
2. Calculated using the Zillow Home Value Index (ZHVI) which is a measure of the typical home value and market changes across a given region and housing type. It reflects the typical value for homes in the 35th to 65th percentile range. Also smoothed and seasonally adjusted. “ZHVI All Homes (SFR, Condo/Co-op) Time Series, Smoothed, Seasonally Adjusted ($), by County,” Zillow Housing Data, accessed January 2025, https://www.zillow.com/research/data/?msockid=3b31736dfb4e62cd18806790fa3163e7.
Sources
“Population Estimates,” Arizona Office of Economic Opportunity, accessed November 2024, https://oeo.az.gov/population/estimates
“Table DP04: Selected Housing Characteristics,” US Census Bureau, 2023 American Community Survey 5-Year Survey, accessed December 2024. https://data.census.gov/table/ACSDP5Y202 3.DP04?q=dp04&g=040XX00US04$0500000 .
“Historic Property Records,” Cotality (formerly CoreLogic), 2022, ARCHES calculations include all residential properties (excluding corporate-owned).
“2024 Preliminary Annual.” Census Bureau Building Permit Survey, Permits by CBSA (Formerly Permits by MSA), accessed February 2025. https://www.census.gov/construction/bps/msamonthly.html.
“Table S2503: Financial Characteristics,” US Census Bureau, 2023 American Community Survey 5-Year Estimate, accessed December 2024. https://data.census.gov/table?q=s2503&g=040XX00US04$0500000
COUNTY SEAT: Prescott LARGEST CITY: Prescott Valley
HOUSEHOLDS
108,900 HOMES
124,032
Population
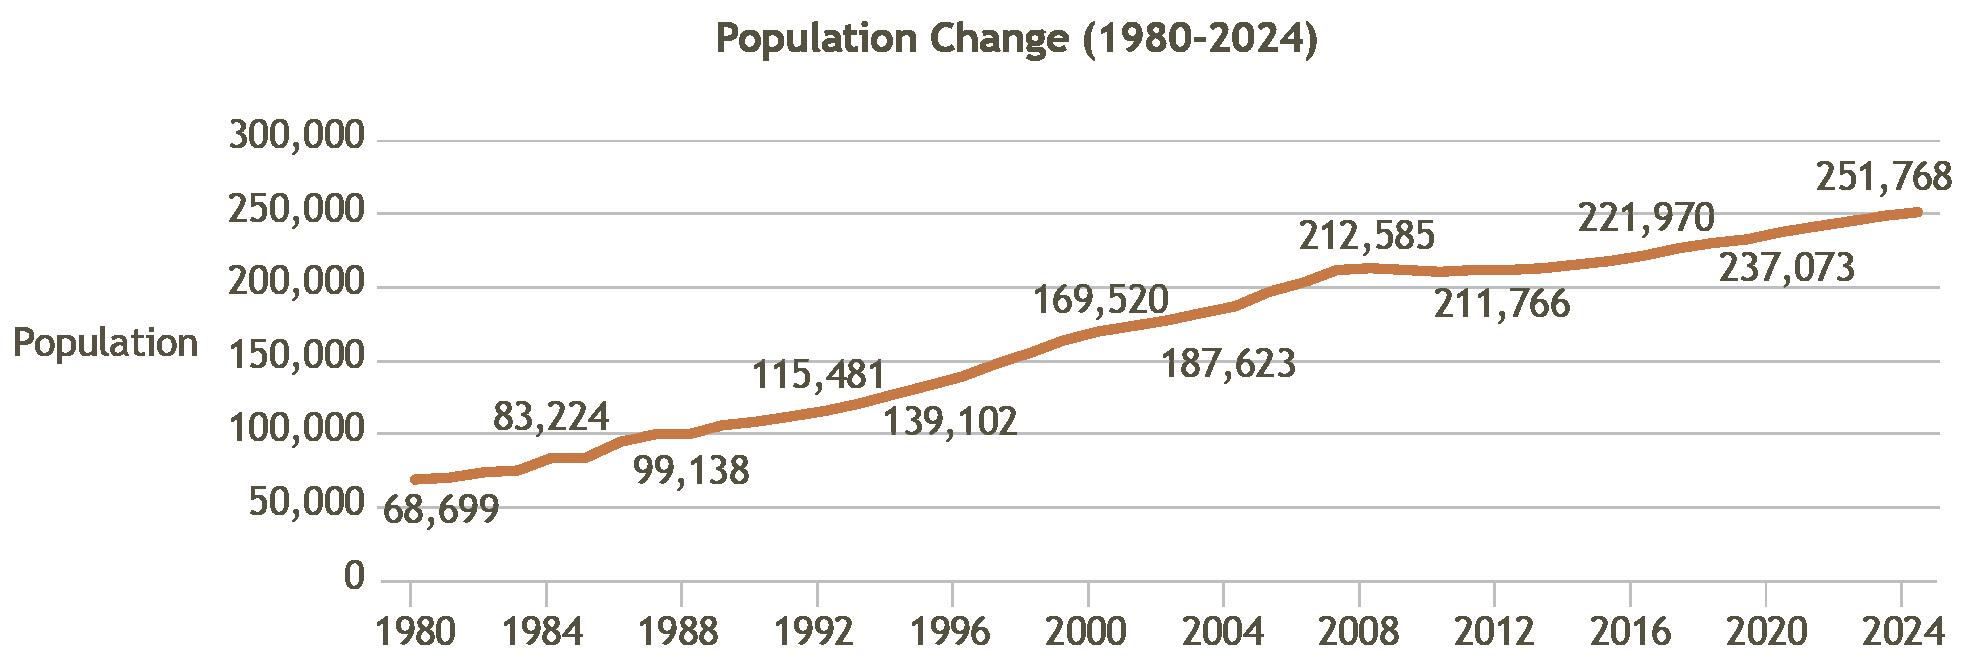
Yavapai County’s population has grown steadily since the 1980s. In 2024, the population was 251,768, making it the 4th most populous county in the state. There were 108,900 households in Yavapai County, evidencing a 13.4% increase since 2018, the 5th fastest growth rate of Arizona’s counties.
Source: AZ Office of Economic Opportunity, 2025
Housing Stock
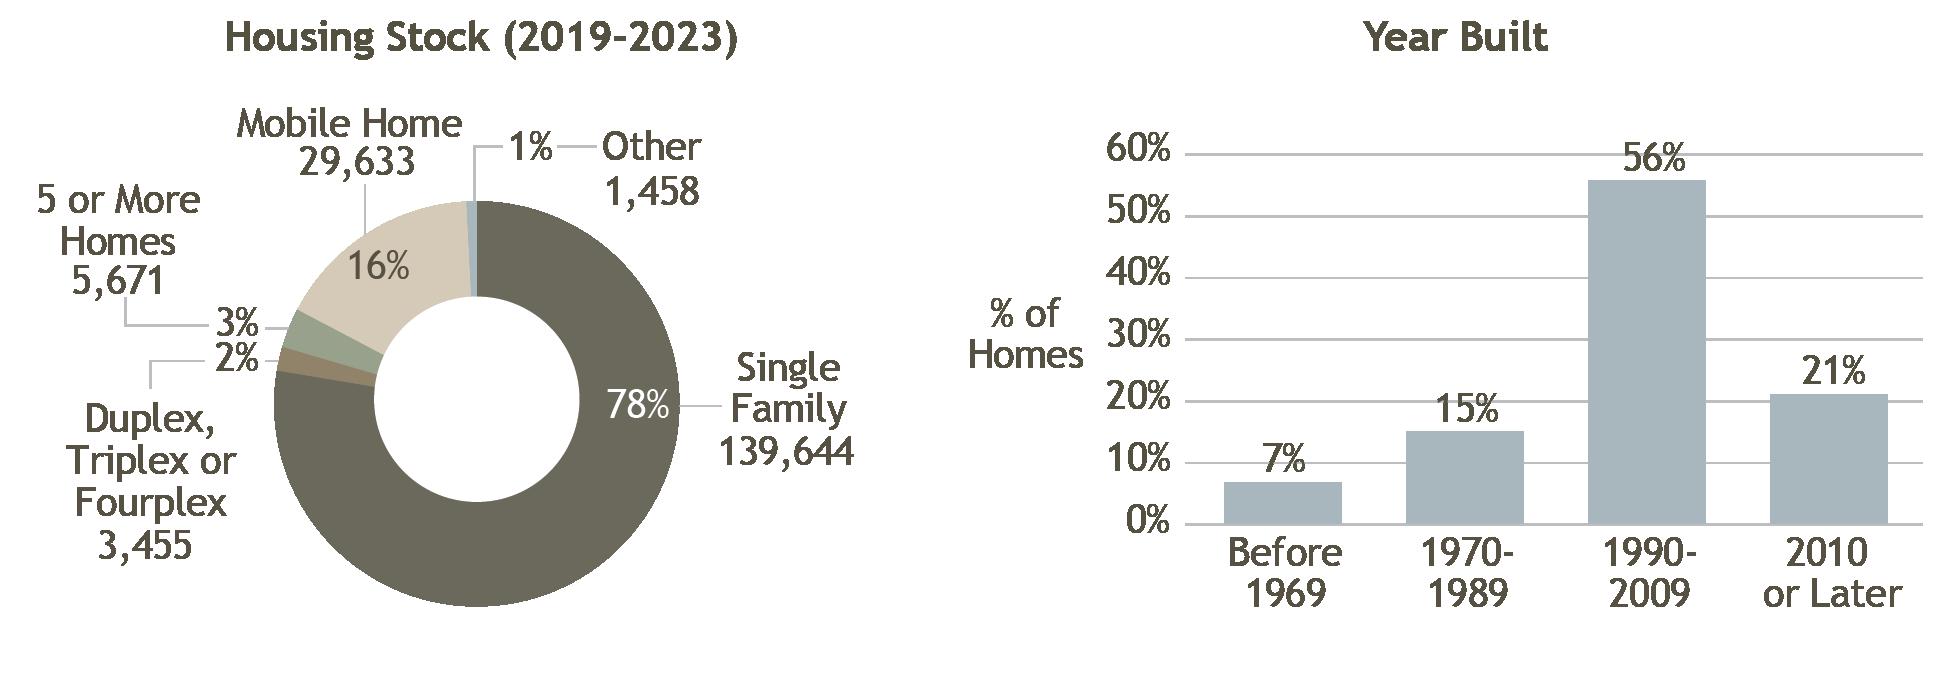
According to the 2019-2023 American Community Survey (ACS) estimates, there were 124,032 homes in Yavapai County. The majority (70%) of homes were single family homes (SFH). Of the 2,062 homes permitted in 2024, 89% were SFH. Since 2018, the county has increased the number of homes in its housing stock by 7.7%. Over half (59%) of homes were built since 1990. The 2019-2023 ACS 5-year estimates show that 12% of all homes in Yavapai County were vacant.1
Source: ACS 5-Year Estimates
Homeownership
Yavapai County
Yavapai County had more homeowners than renters, with a 74% homeownership rate, surpassing the state average of 67%. In 2022, 69% of all home sales were for primary residences, placing Yavapai 8th among Arizona counties.
Income and Costs
The median household income in Yavapai County was $66,106 according to the 2019-2023 ACS 5-year estimates, the 7th highest in the state. Homeowners earned more than renters, with a median income of $74,009 compared to $50,824. The median monthly housing cost (including utilities) in 2023 was $1,104, the 5th highest in the state. The median monthly cost for renters was $1,258, the 4th highest in the state. Zillow’s typical value for a home in Yavapai County in March 2024 was $494,441, a 35% increase since 2018 (inflation-adjusted).2 That is the 2nd highest value and 11th highest value increase among all counties in Arizona. Yavapai County has the 4th highest rate of cost burden among Arizona counties, with 29% of households paying 30% or more of their income to housing costs.
Evictions
There were 589 evictions filed in Yavapai in 2024 (Fiscal Year). That is 23.4 per 10,000 people, the 11th highest rate in the state. Eviction filings have decreased 9% since 2018.
For more information about Yavapai County and the other counties in Arizona, visit the ARCHES website at morrisoninstitute.asu.edu/arches/state-housing.
Notes
1. Definition of vacant housing units (homes): Housing is vacant if no one lives there on a permanent basis, including if occupants have a usual residence elsewhere. Housing under construction is included if it has exterior walls, windows, and floors. Excluded empty housing are those that are exposed to the elements (missing walls, roof etc.) or not used primarily for residential purposes (such as for businesses). “Definitions and Explanations,” Census Bureau, Housing Vacancy Survey, https://www.census.gov/housing/hvs/ definitions.pdf.
2. Calculated using the Zillow Home Value Index (ZHVI) which is a measure of the typical home value and market changes across a given region and housing type. It reflects the typical value for homes in the 35th to 65th percentile range. Also smoothed and seasonally adjusted. “ZHVI All Homes (SFR, Condo/Co-op) Time Series, Smoothed, Seasonally Adjusted ($), by County,” Zillow Housing Data, accessed January 2025, https://www.zillow.com/research/data/?msockid=3b31736dfb4e62cd18806790fa3163e7
Sources
“Population Estimates,” Arizona Office of Economic Opportunity, accessed November 2024, https://oeo.az.gov/population/estimates.
“Table DP04: Selected Housing Characteristics,” US Census Bureau, 2023 American Community Survey 5-Year Survey, accessed December 2024. https://data.census.gov/table/ACSDP5Y202 3.DP04?q=dp04&g=040XX00US04$0500000 .
“Historic Property Records,” Cotality (formerly CoreLogic), 2022, ARCHES calculations include all residential properties (excluding corporate-owned).
“2024 Preliminary Annual.” Census Bureau Building Permit Survey, Permits by CBSA (Formerly Permits by MSA), accessed February 2025. https://www.census.gov/construction/bps/msamonthly.html.
“Table S2503: Financial Characteristics,” US Census Bureau, 2023 American Community Survey 5-Year Estimate, accessed December 2024. https://data.census.gov/table?q=s2503&g=040XX00US04$0500000
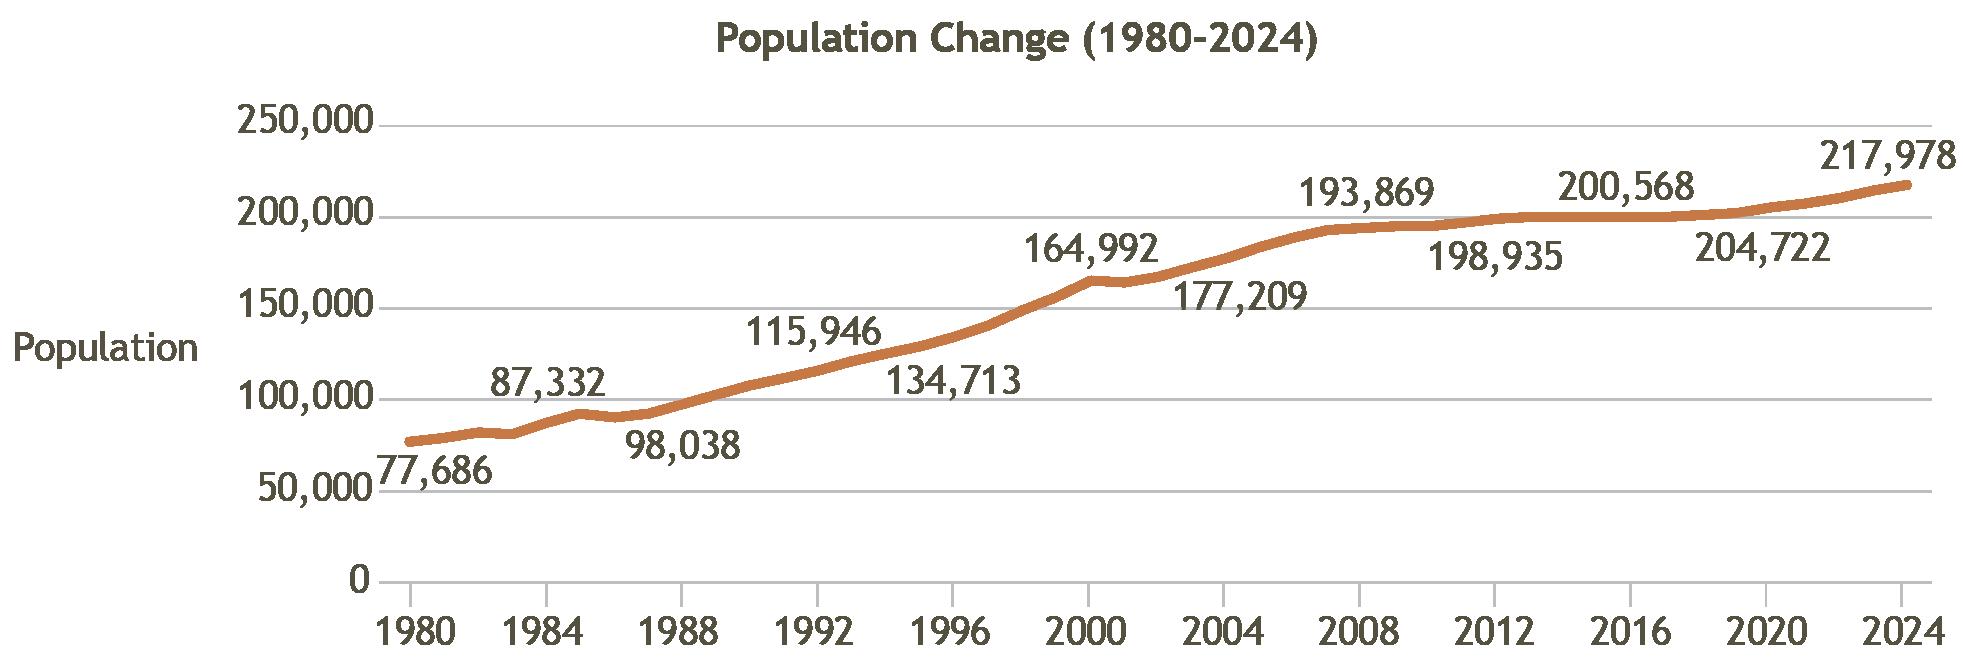
Yuma County’s population has steadily increased. In 2024, the population reached 217,978, making it the 6th most populous county in the state. There were 76,903 households in Yuma County, evidencing a 6.1% increase since 2018, the 12th fastest growth rate of Arizona’s counties.
Source: AZ Office of Economic Opportunity, 2025
Housing Stock
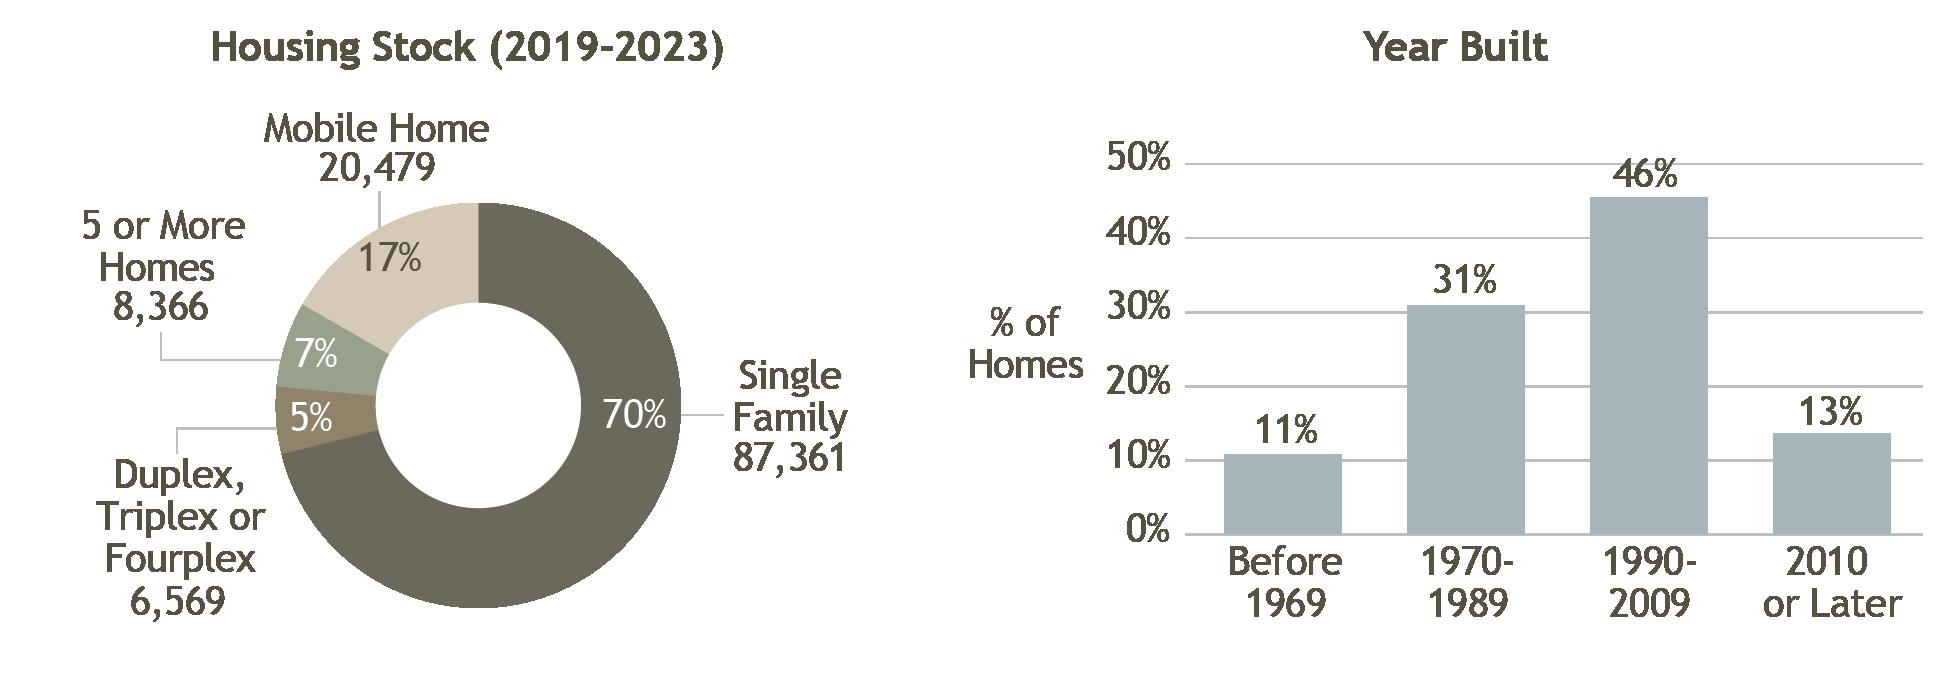
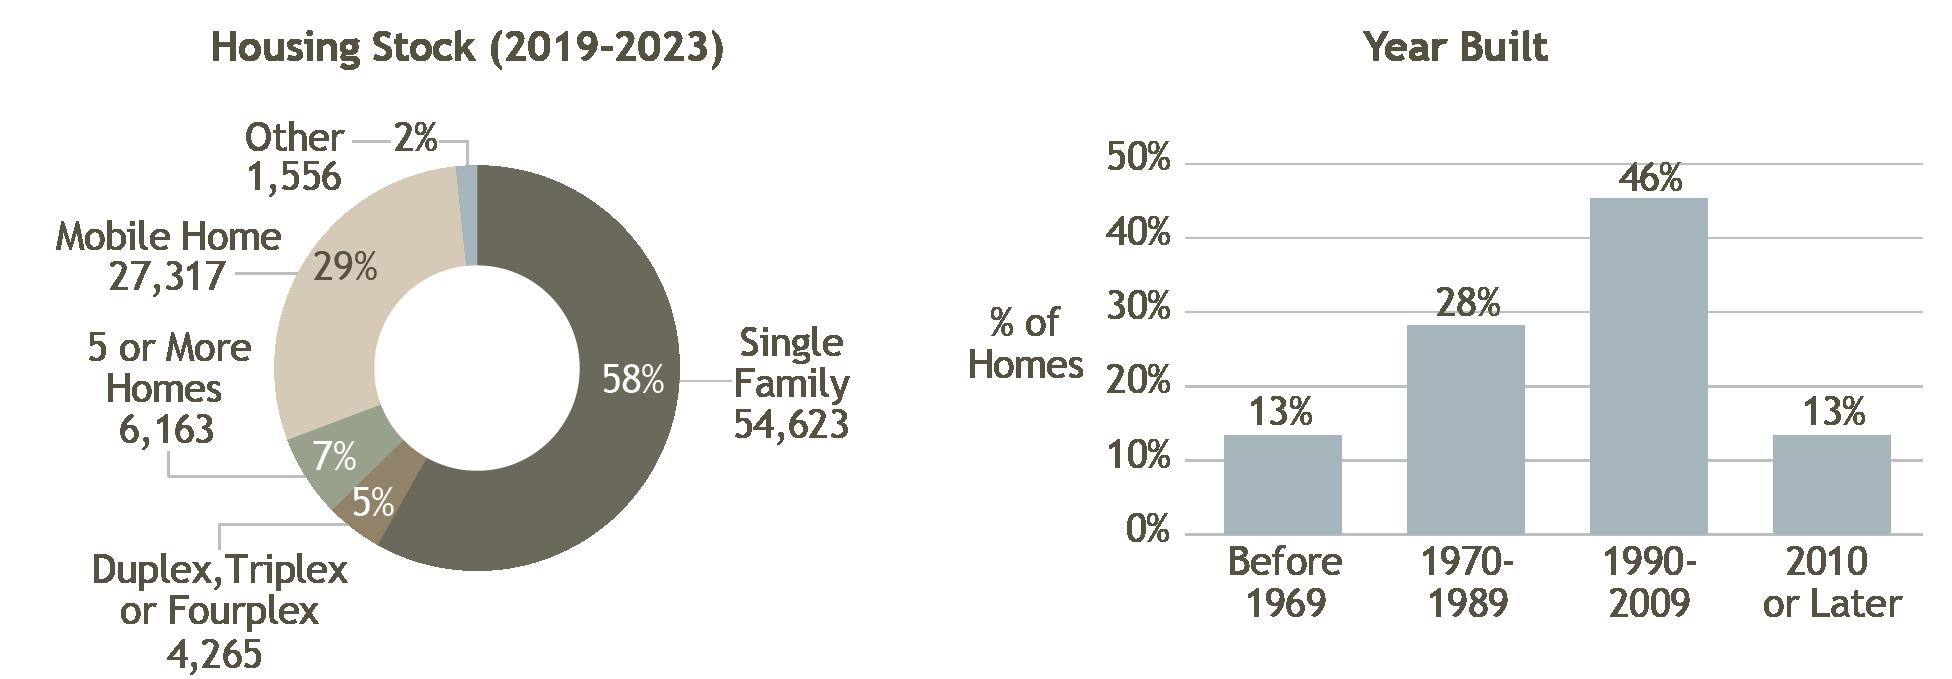
According to the 2019-2023 American Community Survey (ACS) estimates, there were 93,924 homes in Yuma County. Most (58%) homes were single-family homes (SFH). Of the 1,399 homes permitted in 2024, 85% were SFH. Since 2018, the county has increased the number of homes in its housing stock by 2.4%. Over half (59%) of homes were built since 1990. The 2019-2023 ACS 5-year estimates show that 18% of all homes in Yuma County were vacant.1
Source: ACS 5-Year Estimates
Homeownership
Yuma County
Yuma County has more homeowners than renters, with a 70% homeownership rate, surpassing the state average of 67%. In 2022, 76% of all home sales were for primary residences, the 6th highest among Arizona counties.
Income and Costs
The median household income in Yuma County was $60,417 according to the 2019-2023 ACS 5-year estimates, the 8th highest in the state. Homeowners earned more than renters, with a median income of $68,962 compared to $45,008. The median monthly housing cost (including utilities) in 2023 was $909, the 8th highest. The median monthly cost for renters was also the 8th highest at $983. Zillow’s typical value for a home in Yuma County in 2024 was $270,317, a 44% increase since 2018 (inflation-adjusted). 2 That is the 11th highest value and 4th highest value increase among all counties in Arizona. Yuma has the 8th highest rate of cost burden among Arizona counties, with 26% of households paying 30% or more of their income to housing costs.
Evictions
There were 728 evictions filed in Yuma County in 2024 (Fiscal Year). That is 33.4 per 10,000 people, the 7 th highest rate in the state. Eviction filings have increased 12% since 2018.
For more information about Yuma County and the other counties in Arizona, visit the ARCHES website at morrisoninstitute.asu.edu/arches/state-housing.
Notes
1. Definition of vacant housing units (homes): Housing is vacant if no one lives there on a permanent basis, including if occupants have a usual residence elsewhere. Housing under construction is included if it has exterior walls, windows, and floors. Excluded empty housing are those that are exposed to the elements (missing walls, roof etc.) or not used primarily for residential purposes (such as for businesses). “Definitions and Explanations,” Census Bureau, Housing Vacancy Survey, https://www.census.gov/housing/hvs/ definitions.pdf.
2. Calculated using the Zillow Home Value Index (ZHVI) which is a measure of the typical home value and market changes across a given region and housing type. It reflects the typical value for homes in the 35th to 65th percentile range. Also smoothed and seasonally adjusted. “ZHVI All Homes (SFR, Condo/Co-op) Time Series, Smoothed, Seasonally Adjusted ($), by County,” Zillow Housing Data, accessed January 2025, https://www.zillow.com/research/data/?msockid=3b31736dfb4e62cd18806790fa3163e7.
Sources
“Population Estimates,” Arizona Office of Economic Opportunity, accessed November 2024, https://oeo.az.gov/population/estimates
“Table DP04: Selected Housing Characteristics,” US Census Bureau, 2023 American Community Survey 5-Year Survey, accessed December 2024. https://data.census.gov/table/ACSDP5Y202 3.DP04?q=dp04&g=040XX00US04$0500000 .
“Historic Property Records,” Cotality (formerly CoreLogic), 2022, ARCHES calculations include all residential properties (excluding corporate-owned).
“2024 Preliminary Annual.” Census Bureau Building Permit Survey, Permits by CBSA (Formerly Permits by MSA), accessed February 2025. https://www.census.gov/construction/bps/msamonthly.html.
“Table S2503: Financial Characteristics,” US Census Bureau, 2023 American Community Survey 5-Year Estimate, accessed December 2024. https://data.census.gov/table?q=s2503&g=040XX00US04$0500000