State of Housing in Arizona
The Arizona Research Center for Housing Equity and Sustainability (ARCHES) was funded by the Department of Housing and Urban Development (HUD) grant through its HSI Center of Excellence investment to advance knowledge and evidence-based solutions related to housing challenges focused on Hispanic and other underserved communities in Arizona and the Southwest.
The center is co-located at Arizona State University’s (ASU) Morrison Institute for Public Policy and the University of Arizona’s (UA) Drachman Institute and includes researchers from Northern Arizona University (NAU) and the University of New Mexico (UNM), all HispanicServing Institutions. The center includes over 24 researchers with expertise in housing planning, policy, architecture, geographical sciences, political science, economics, and real estate. It is supported by a community advisory board and community partners, which include Chicanos Por La Causa, Southwest Fair Housing Council, and Home Matters to Arizona. Researchers work directly with community partners and stakeholders across Arizona and the Southwest.
The center’s mission is to become the hub for research addressing housing and its intersections with security, climate, and health in Arizona and the Southwest. The center aims to create connections between research and practice and values place-based research that is community-engaged, equitable, evidence-based, and solution-focused.
Acknowledgments
AUTHORS
Alison Cook-Davis
Kristi Eustice
Audrey Nagle
Ashley Cooper
Liza C. Kurtz
Cambree Kanala
CONTRIBUTORS/EDITORS
Amira Abboud
Osei Akoto Kwarteng
Paul George-Blazevich
Shengwei Guo
Jacob Heid
Atticus Jaramillo
Daniel Kuhlmann
Juliana Panhorst
Lesley Perez
Deirdre Pfeiffer
Alyssa Ryan
Patricia Solis
Andrea Whitsett
Kimberly Winson-Geideman
Kenny Wong
The work that provided the basis for this publication was supported by funding under an award with the U.S. Department of Housing and Urban Development. The substance and findings of the work are dedicated to the public. The authors and publisher are solely responsible for the accuracy of the statements and interpretations contained in this publication. Such interpretations do not necessarily reflect the views of the Government.
Cover photo generated in part by Microsoft Copilot, June 3, 2025.
Additional photo editing and coloration in Photoshop.
THANK YOU TO OUR SPONSORS
Figure 1. State-to-State Net Migration to Arizona Per Year, 2010-2023
Figure 2. Change in Population by Type in Arizona, 2010-2024
3
4
Figure 3. Percent Change in Homes and Households Since 2010 Page 5
Figure 4. Percent Change of Racial/Ethnic Groups Compared to General Population, 2010-2023 Page 6
Figure 5. Percent Change in Age Groups, 2010-2023
Figure 6. Age Distribution, 2010-2023
Figure 7. Regional Price Parities (Price Levels): All Items, 2010-2023
Figure 8. Regional Price Parities (Price Levels): Rental Housing, 2010-2023
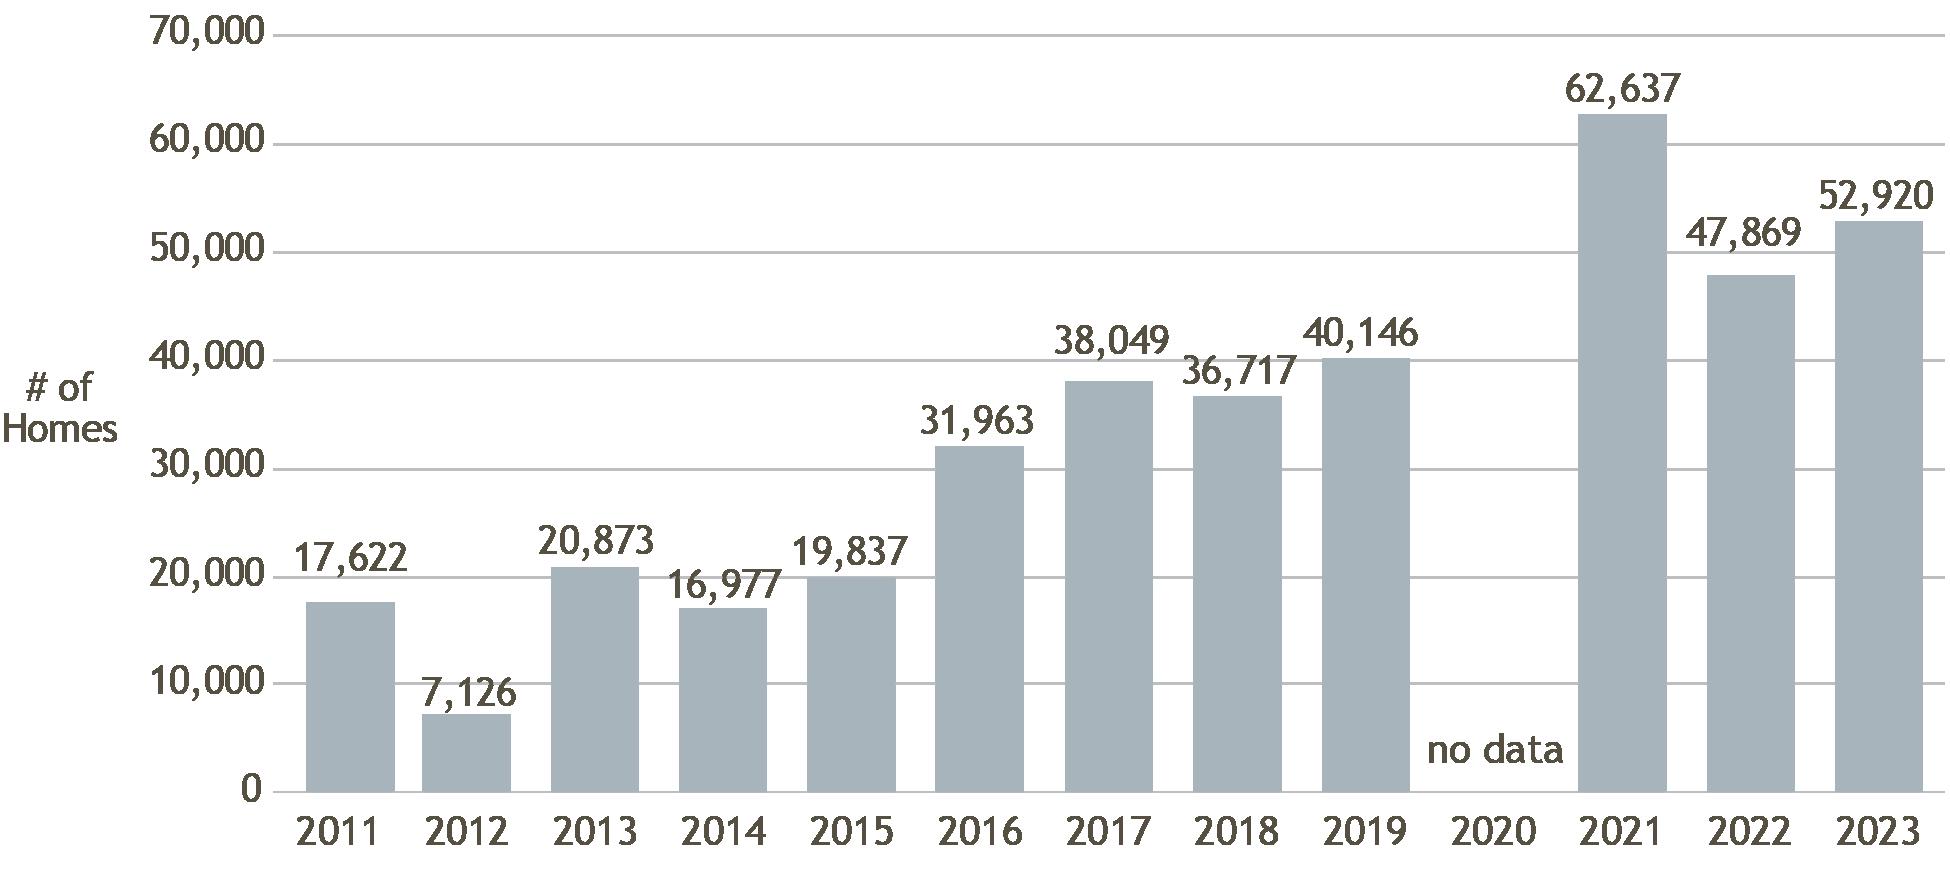
Figure 9. Homes Added Since the Prior Year
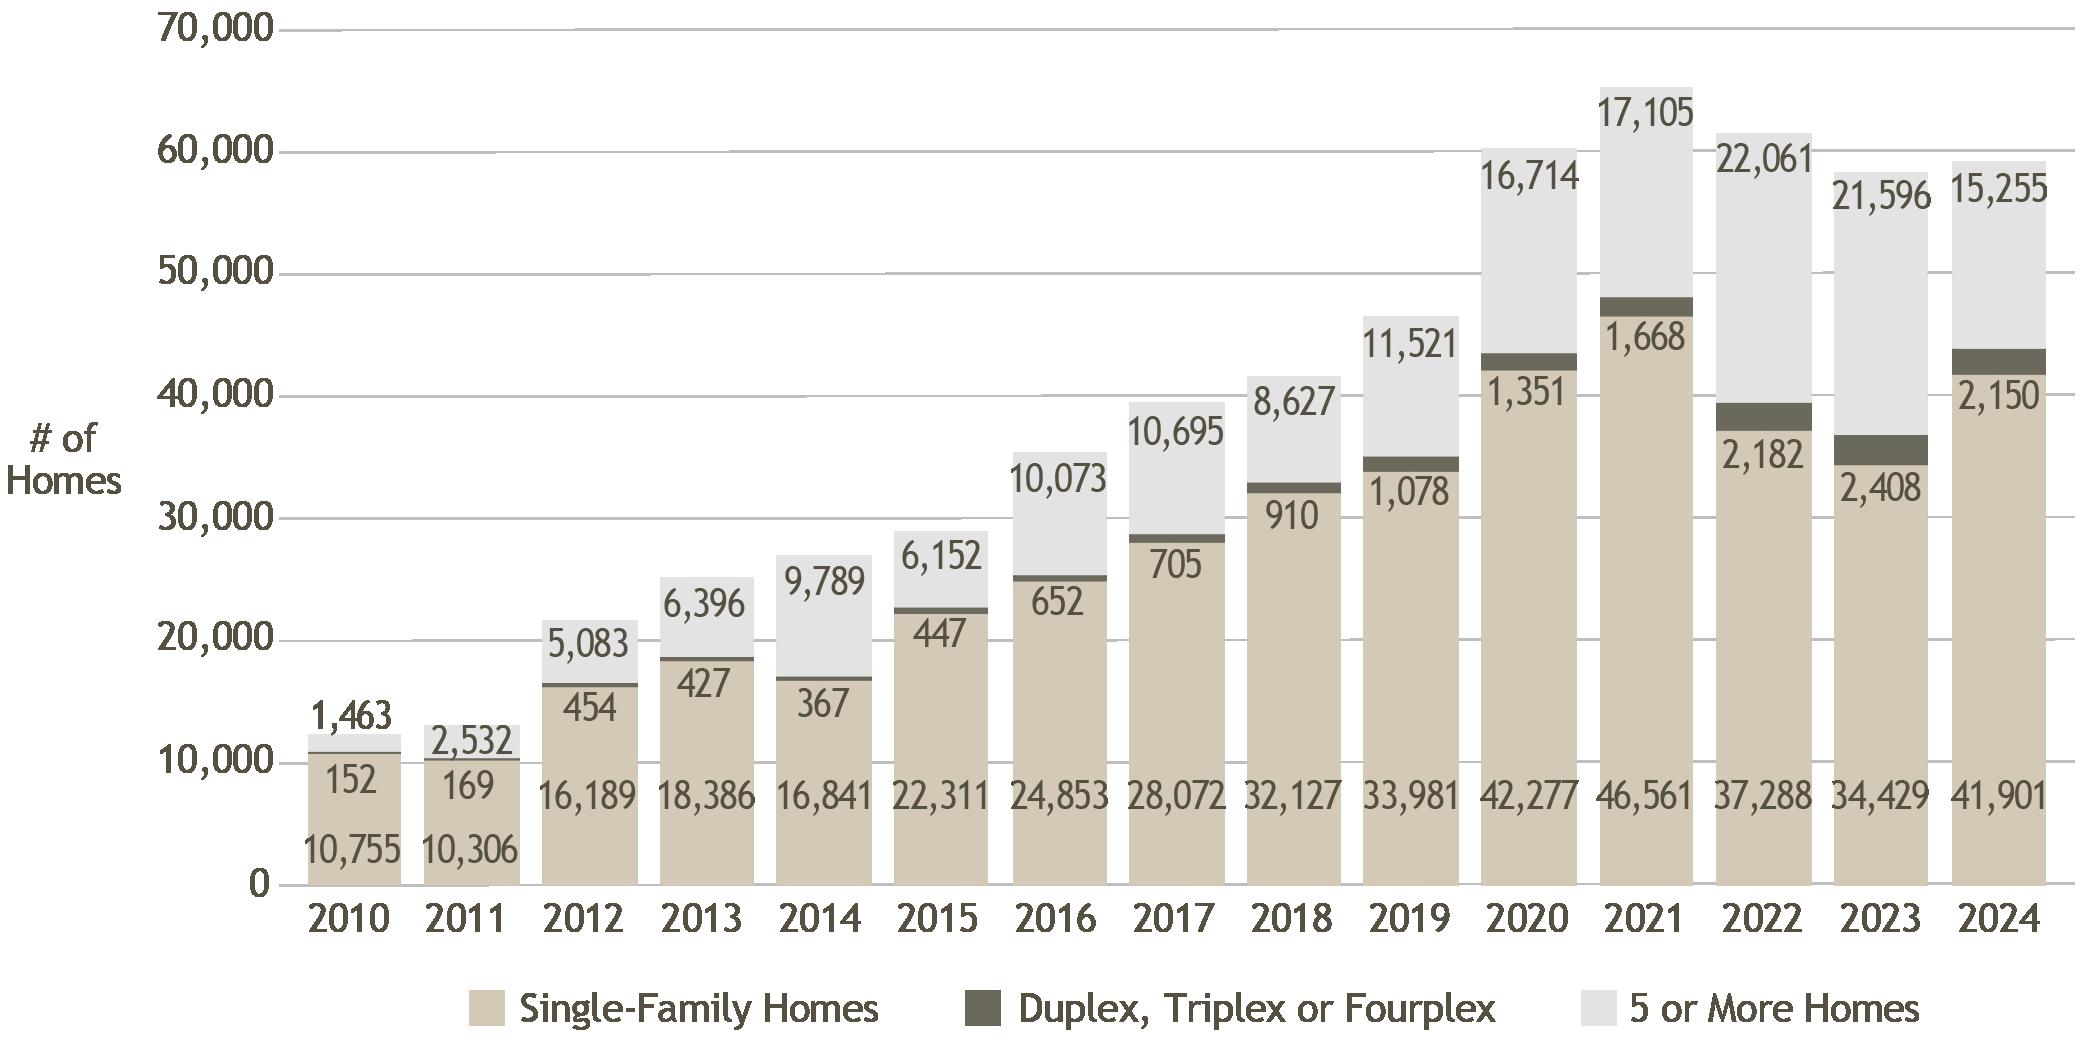
Figure 10. Number of Homes Permitted in Arizona by Structure Type, 2010-2024
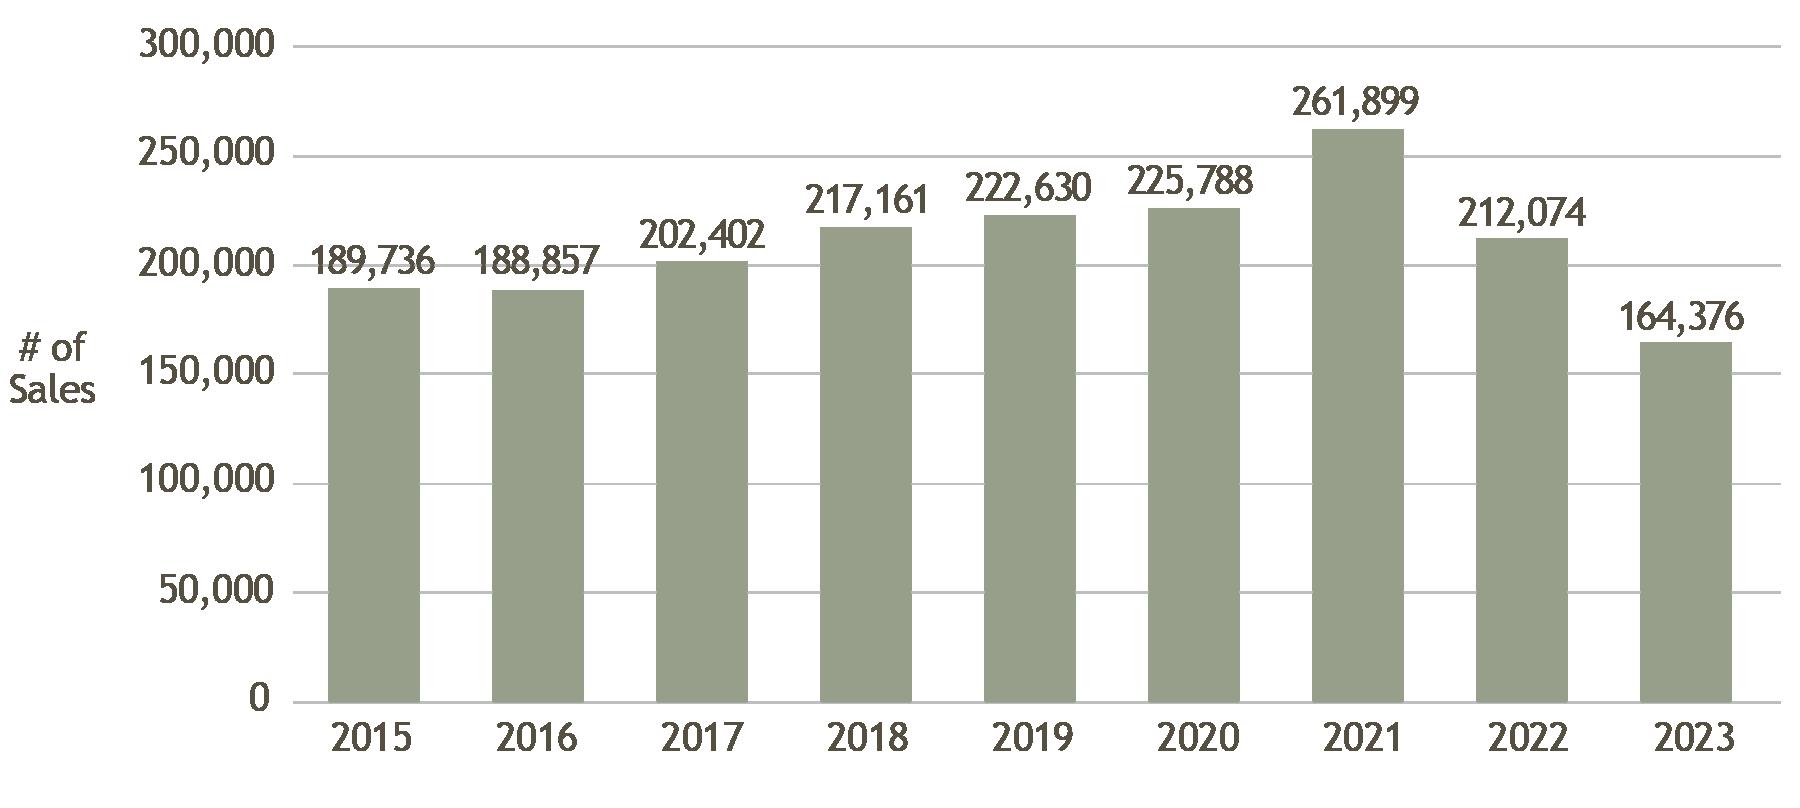
Figure 11. Total Arizona Residential Property Sale Transactions, 2015–2023 Page 10
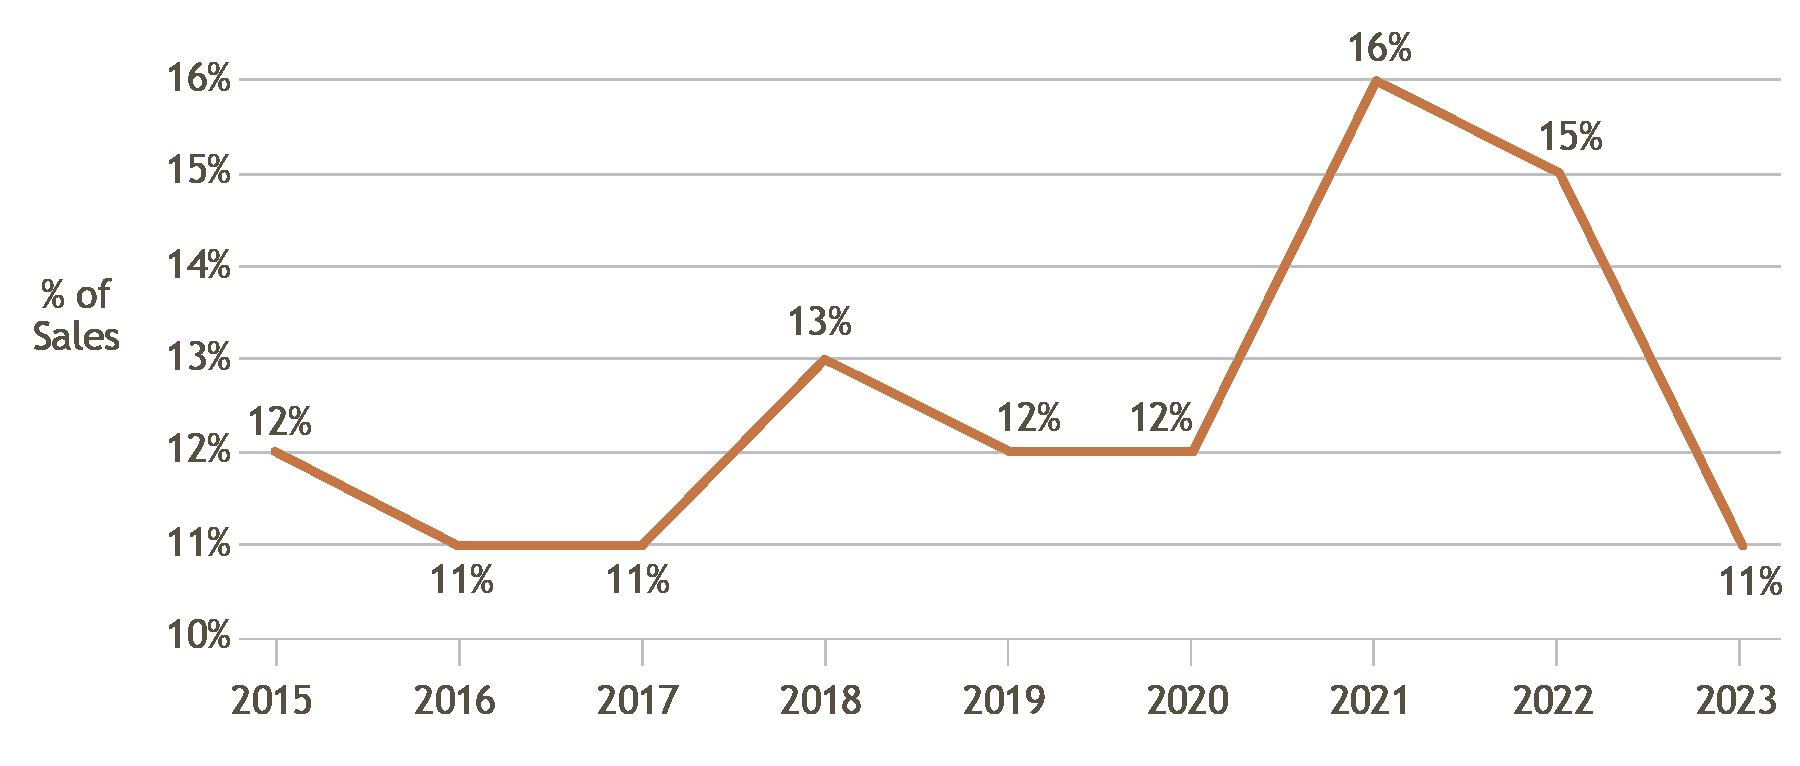
Figure 12. Percent of Residential Home Sales Originating Out of State, 2015-2023 Page 11
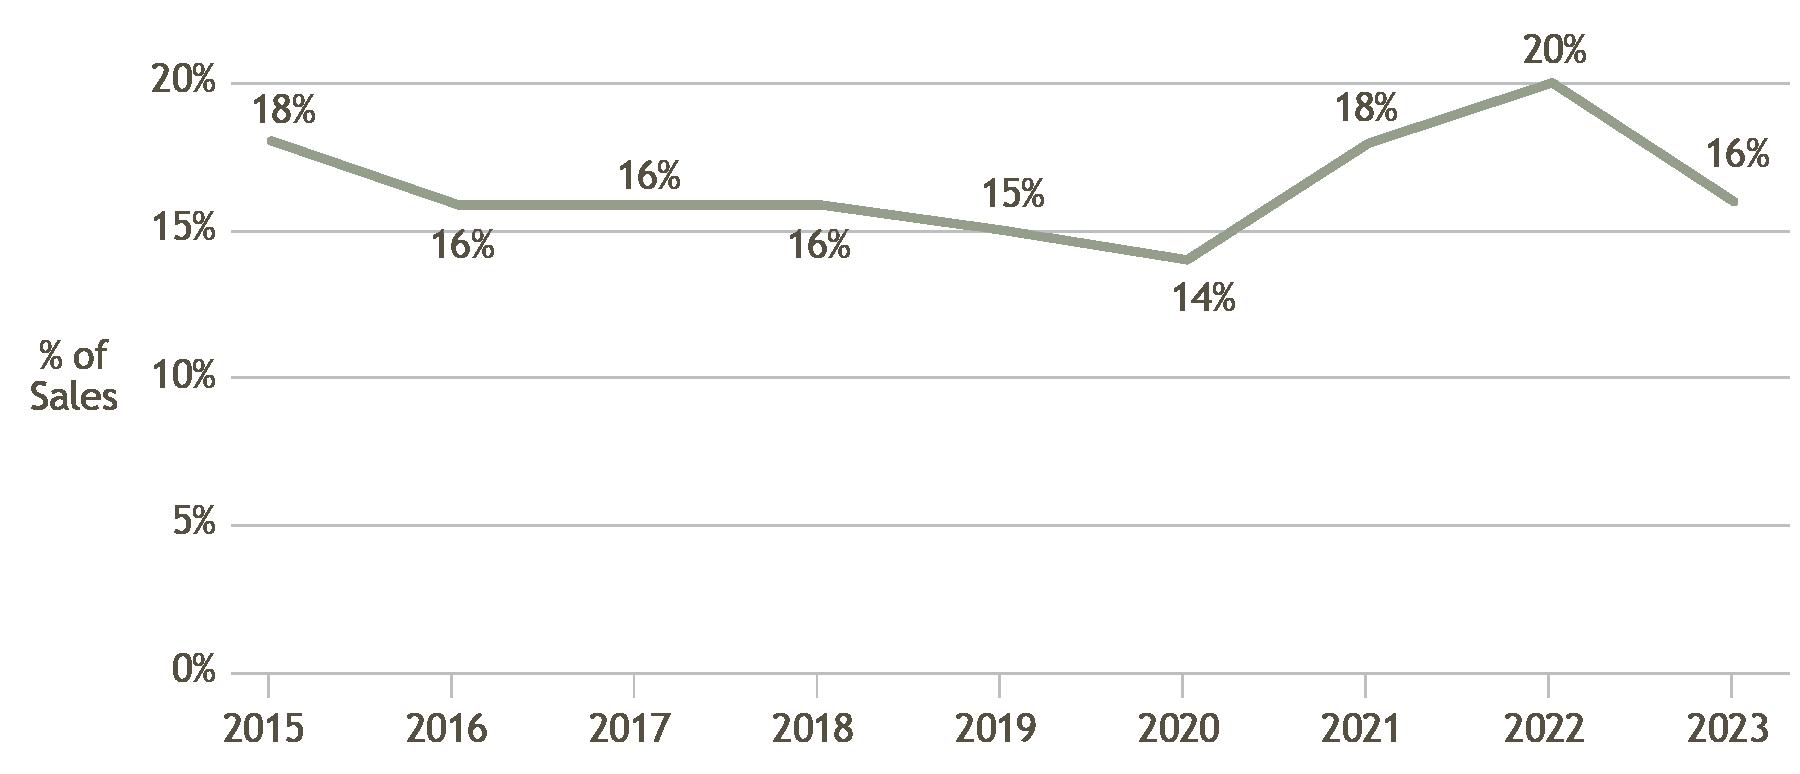
Figure 13. Percentage of Arizona Residential Sales Purchased by Investors, 2015-2023
Figure 14. Percent of Arizona Homeowners Who Are Cost Burdened, 2010-2023
Figure 15. Home Value Percent Increase, Inflation-Adjusted, 2010-2024
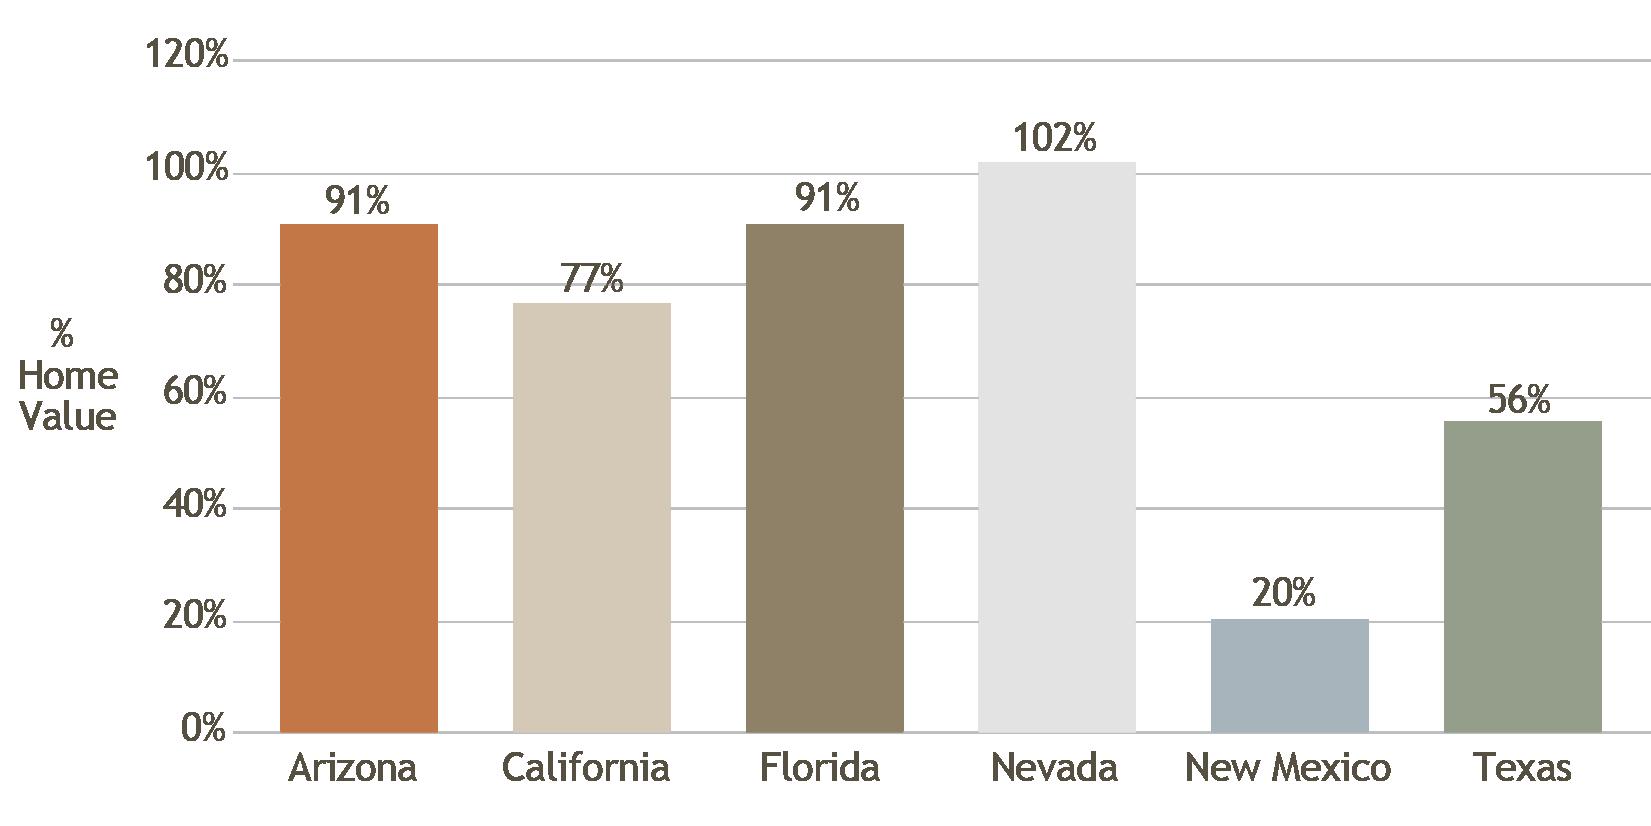
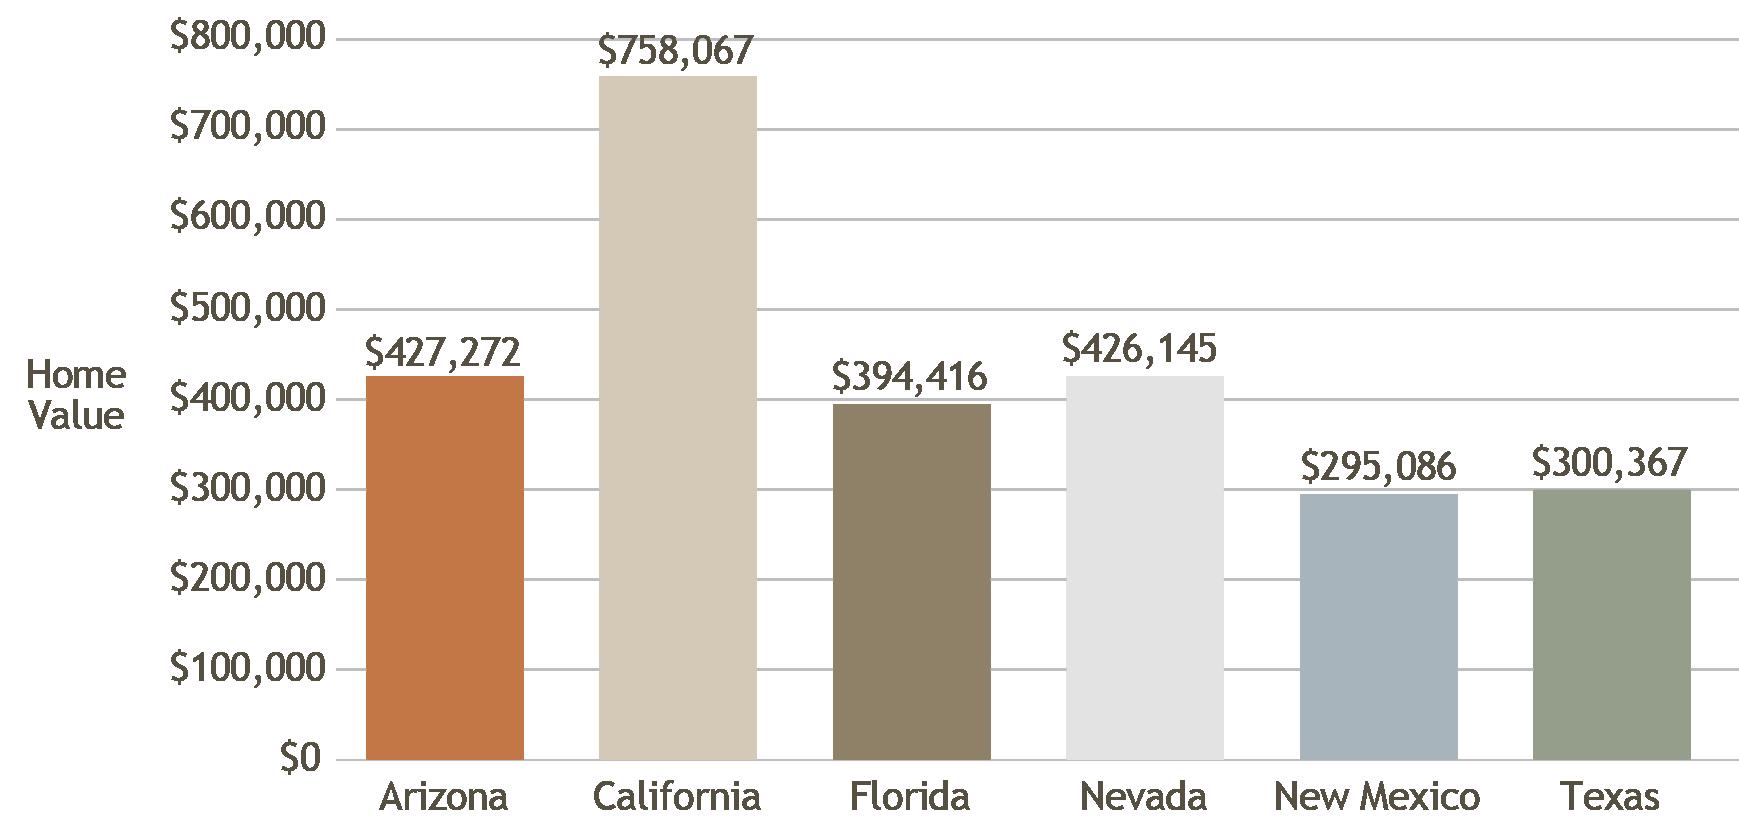
Figure 16. Typical Home Value by State
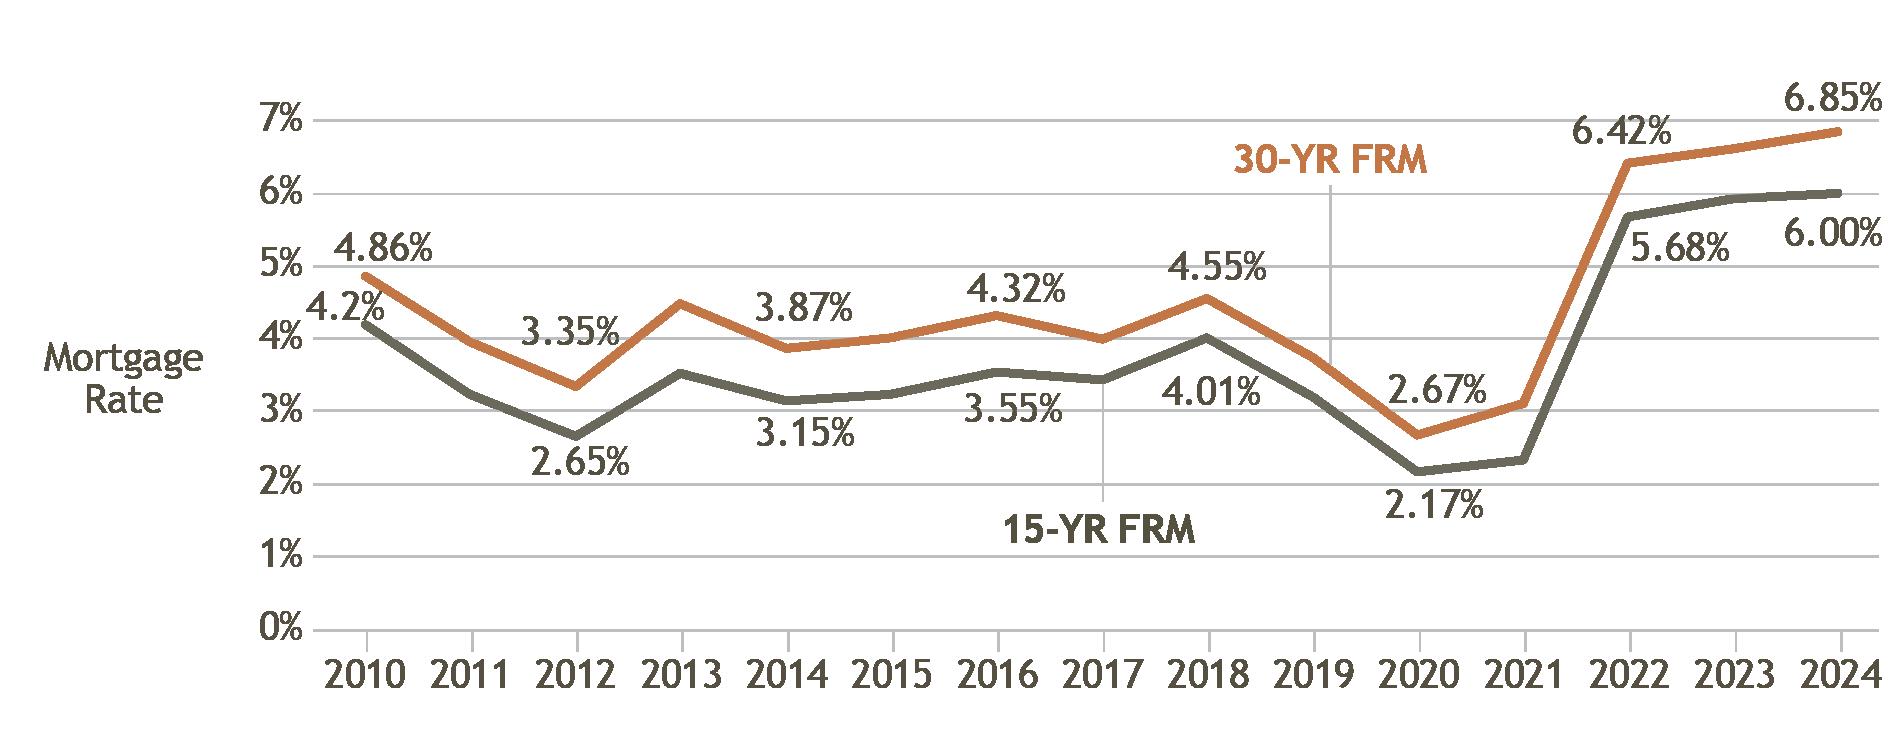
Figure 17. US 30- and 15-Year Fixed Mortgage Rates, 2010-2024
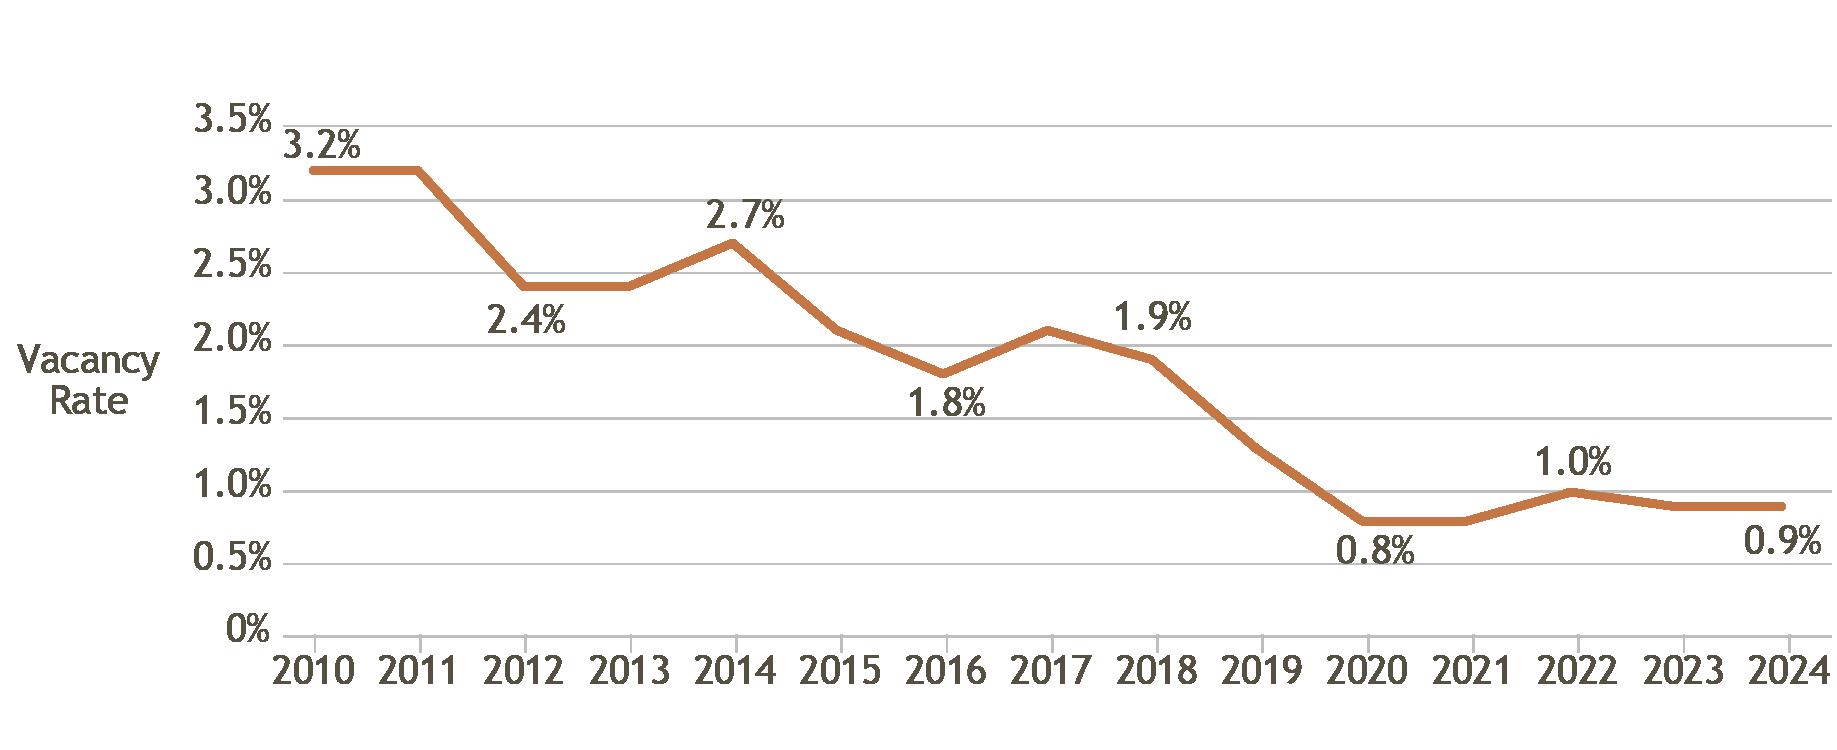
Figure 18. For Sale Vacancy Rate in Arizona, 2010-2024
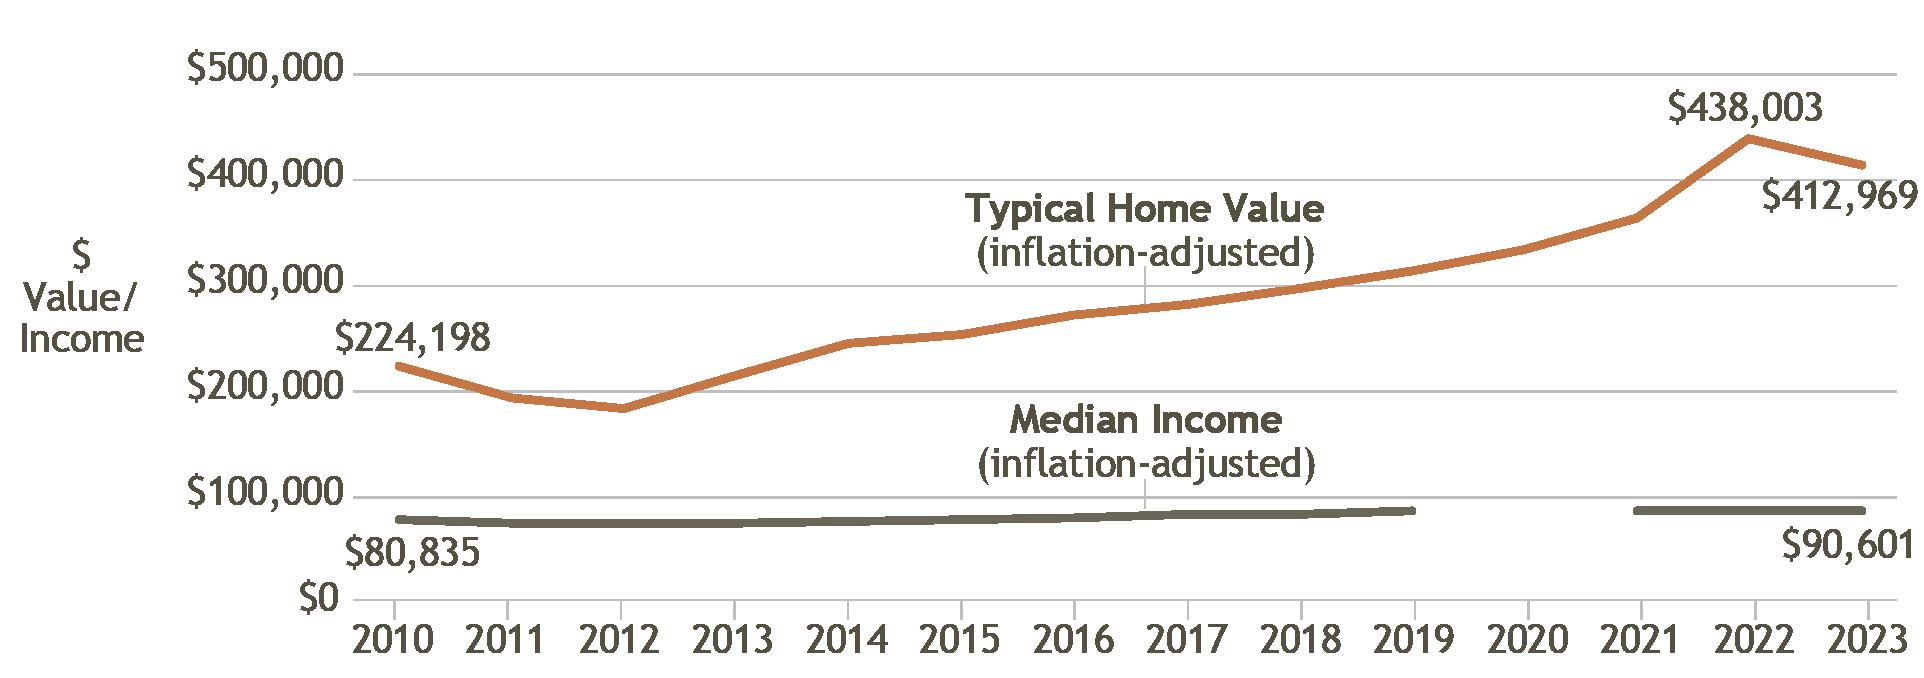
Figure 19. Typical Home Value vs. Homeowners’ Household Income, Inflation-Adjusted, 2010-2023
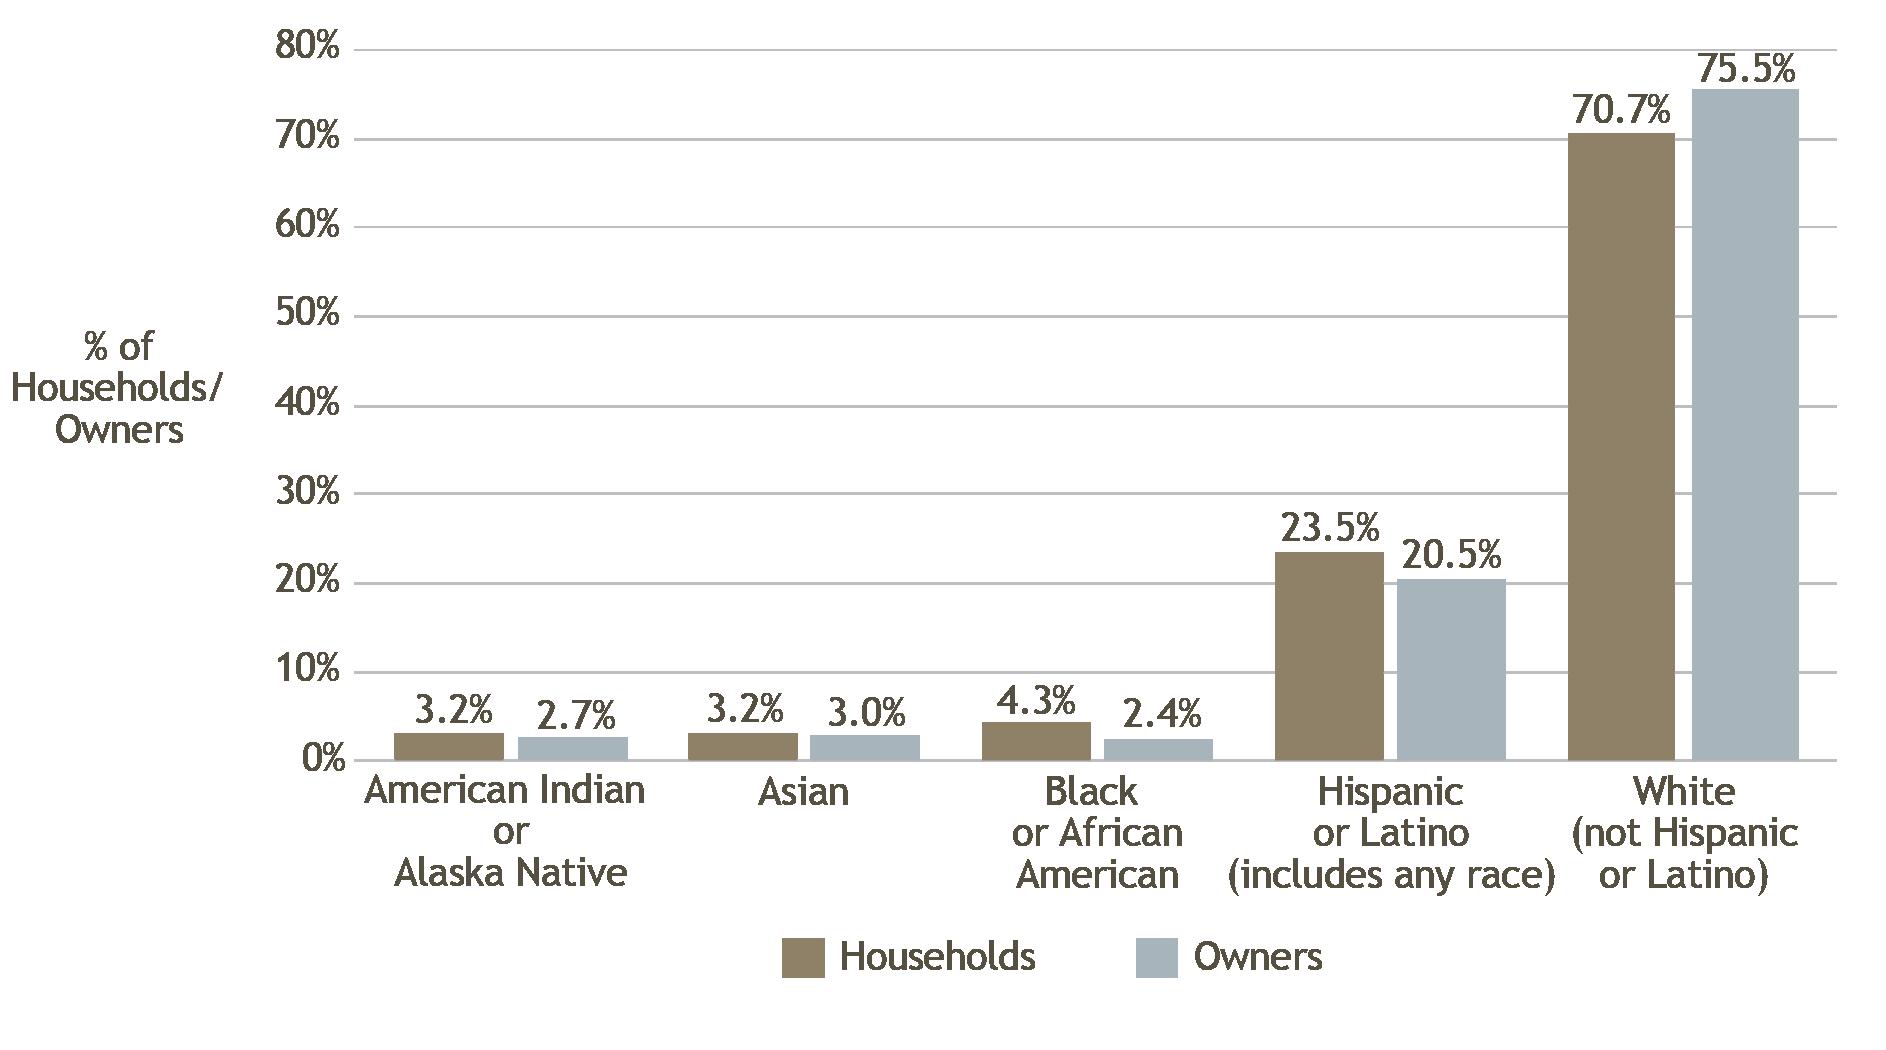
Figure 20. Homeownership is Not Proportional by Race and Ethnicity, 2023
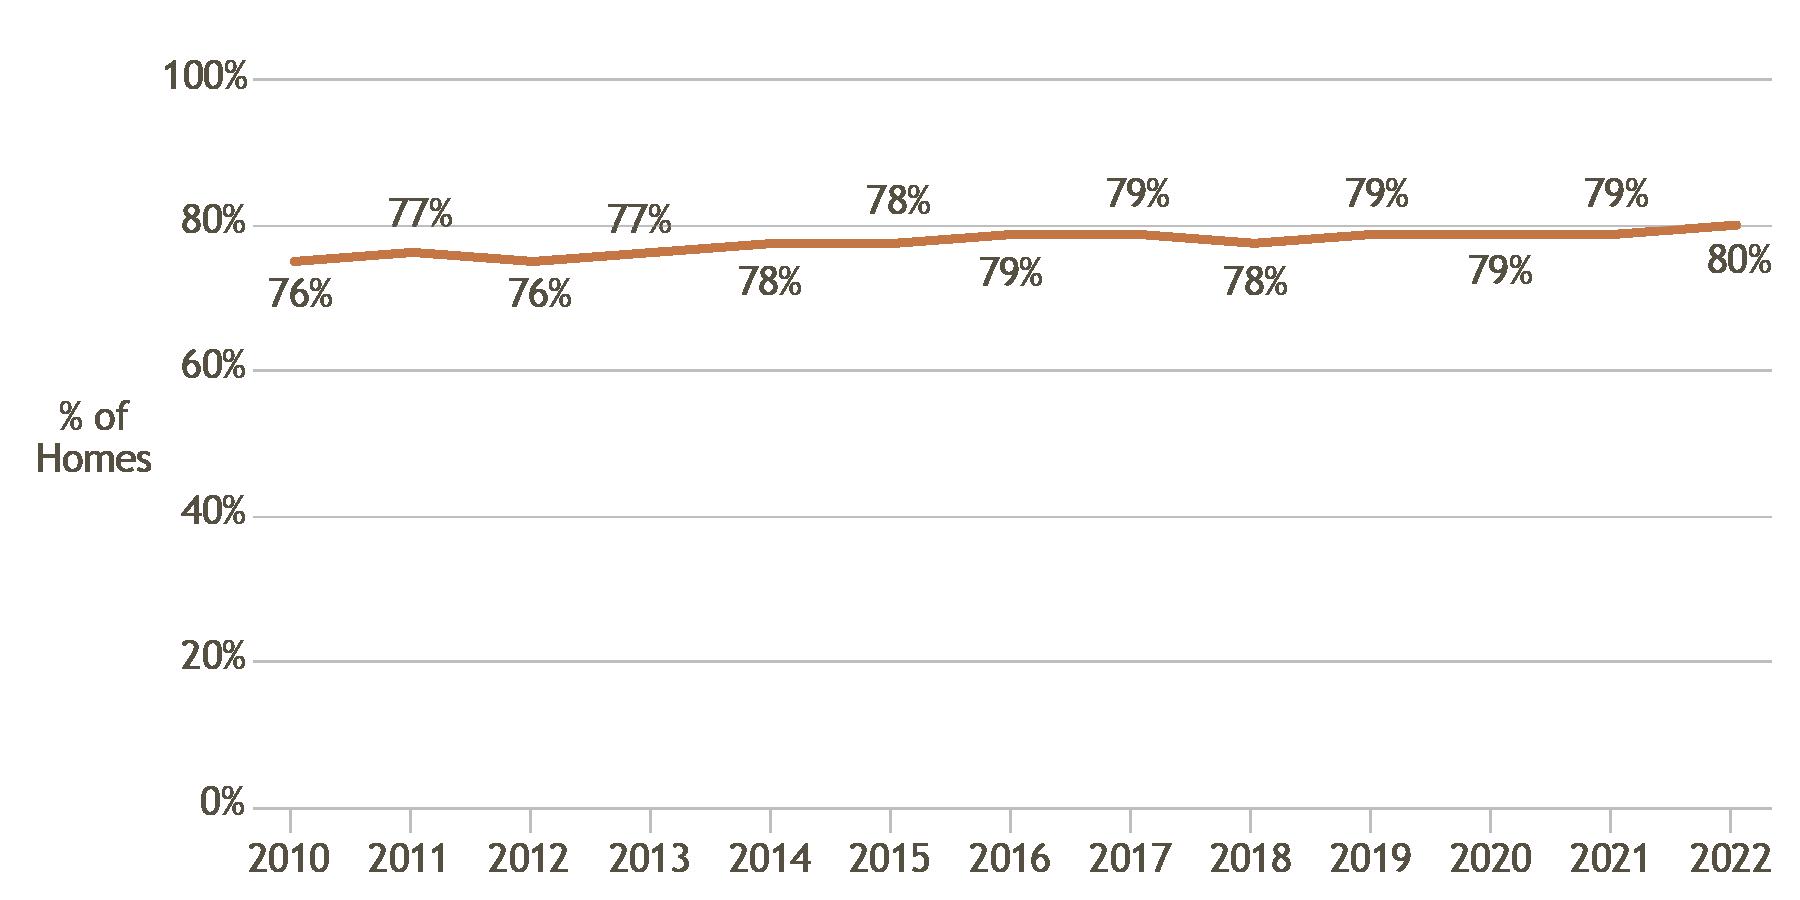
Figure 21. Percent of Arizona Homes that are Primary Residences, 2010-2022
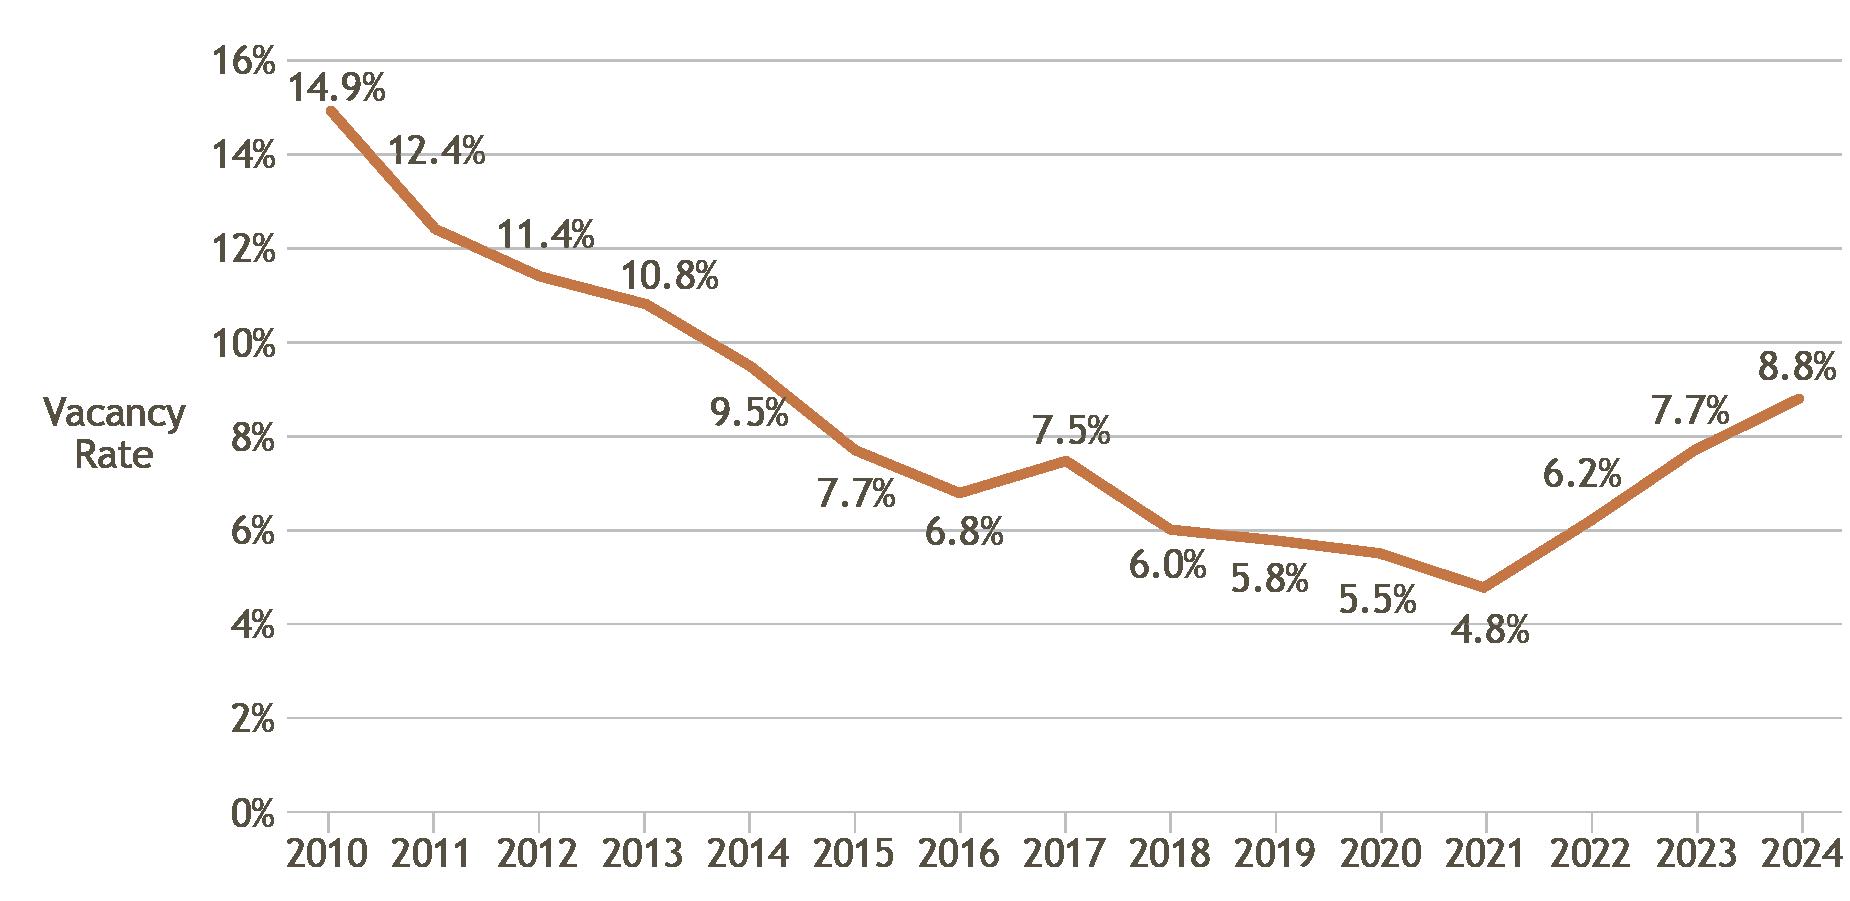
Figure 22. For Rent Vacancy Rates in Arizona, 2010-2024
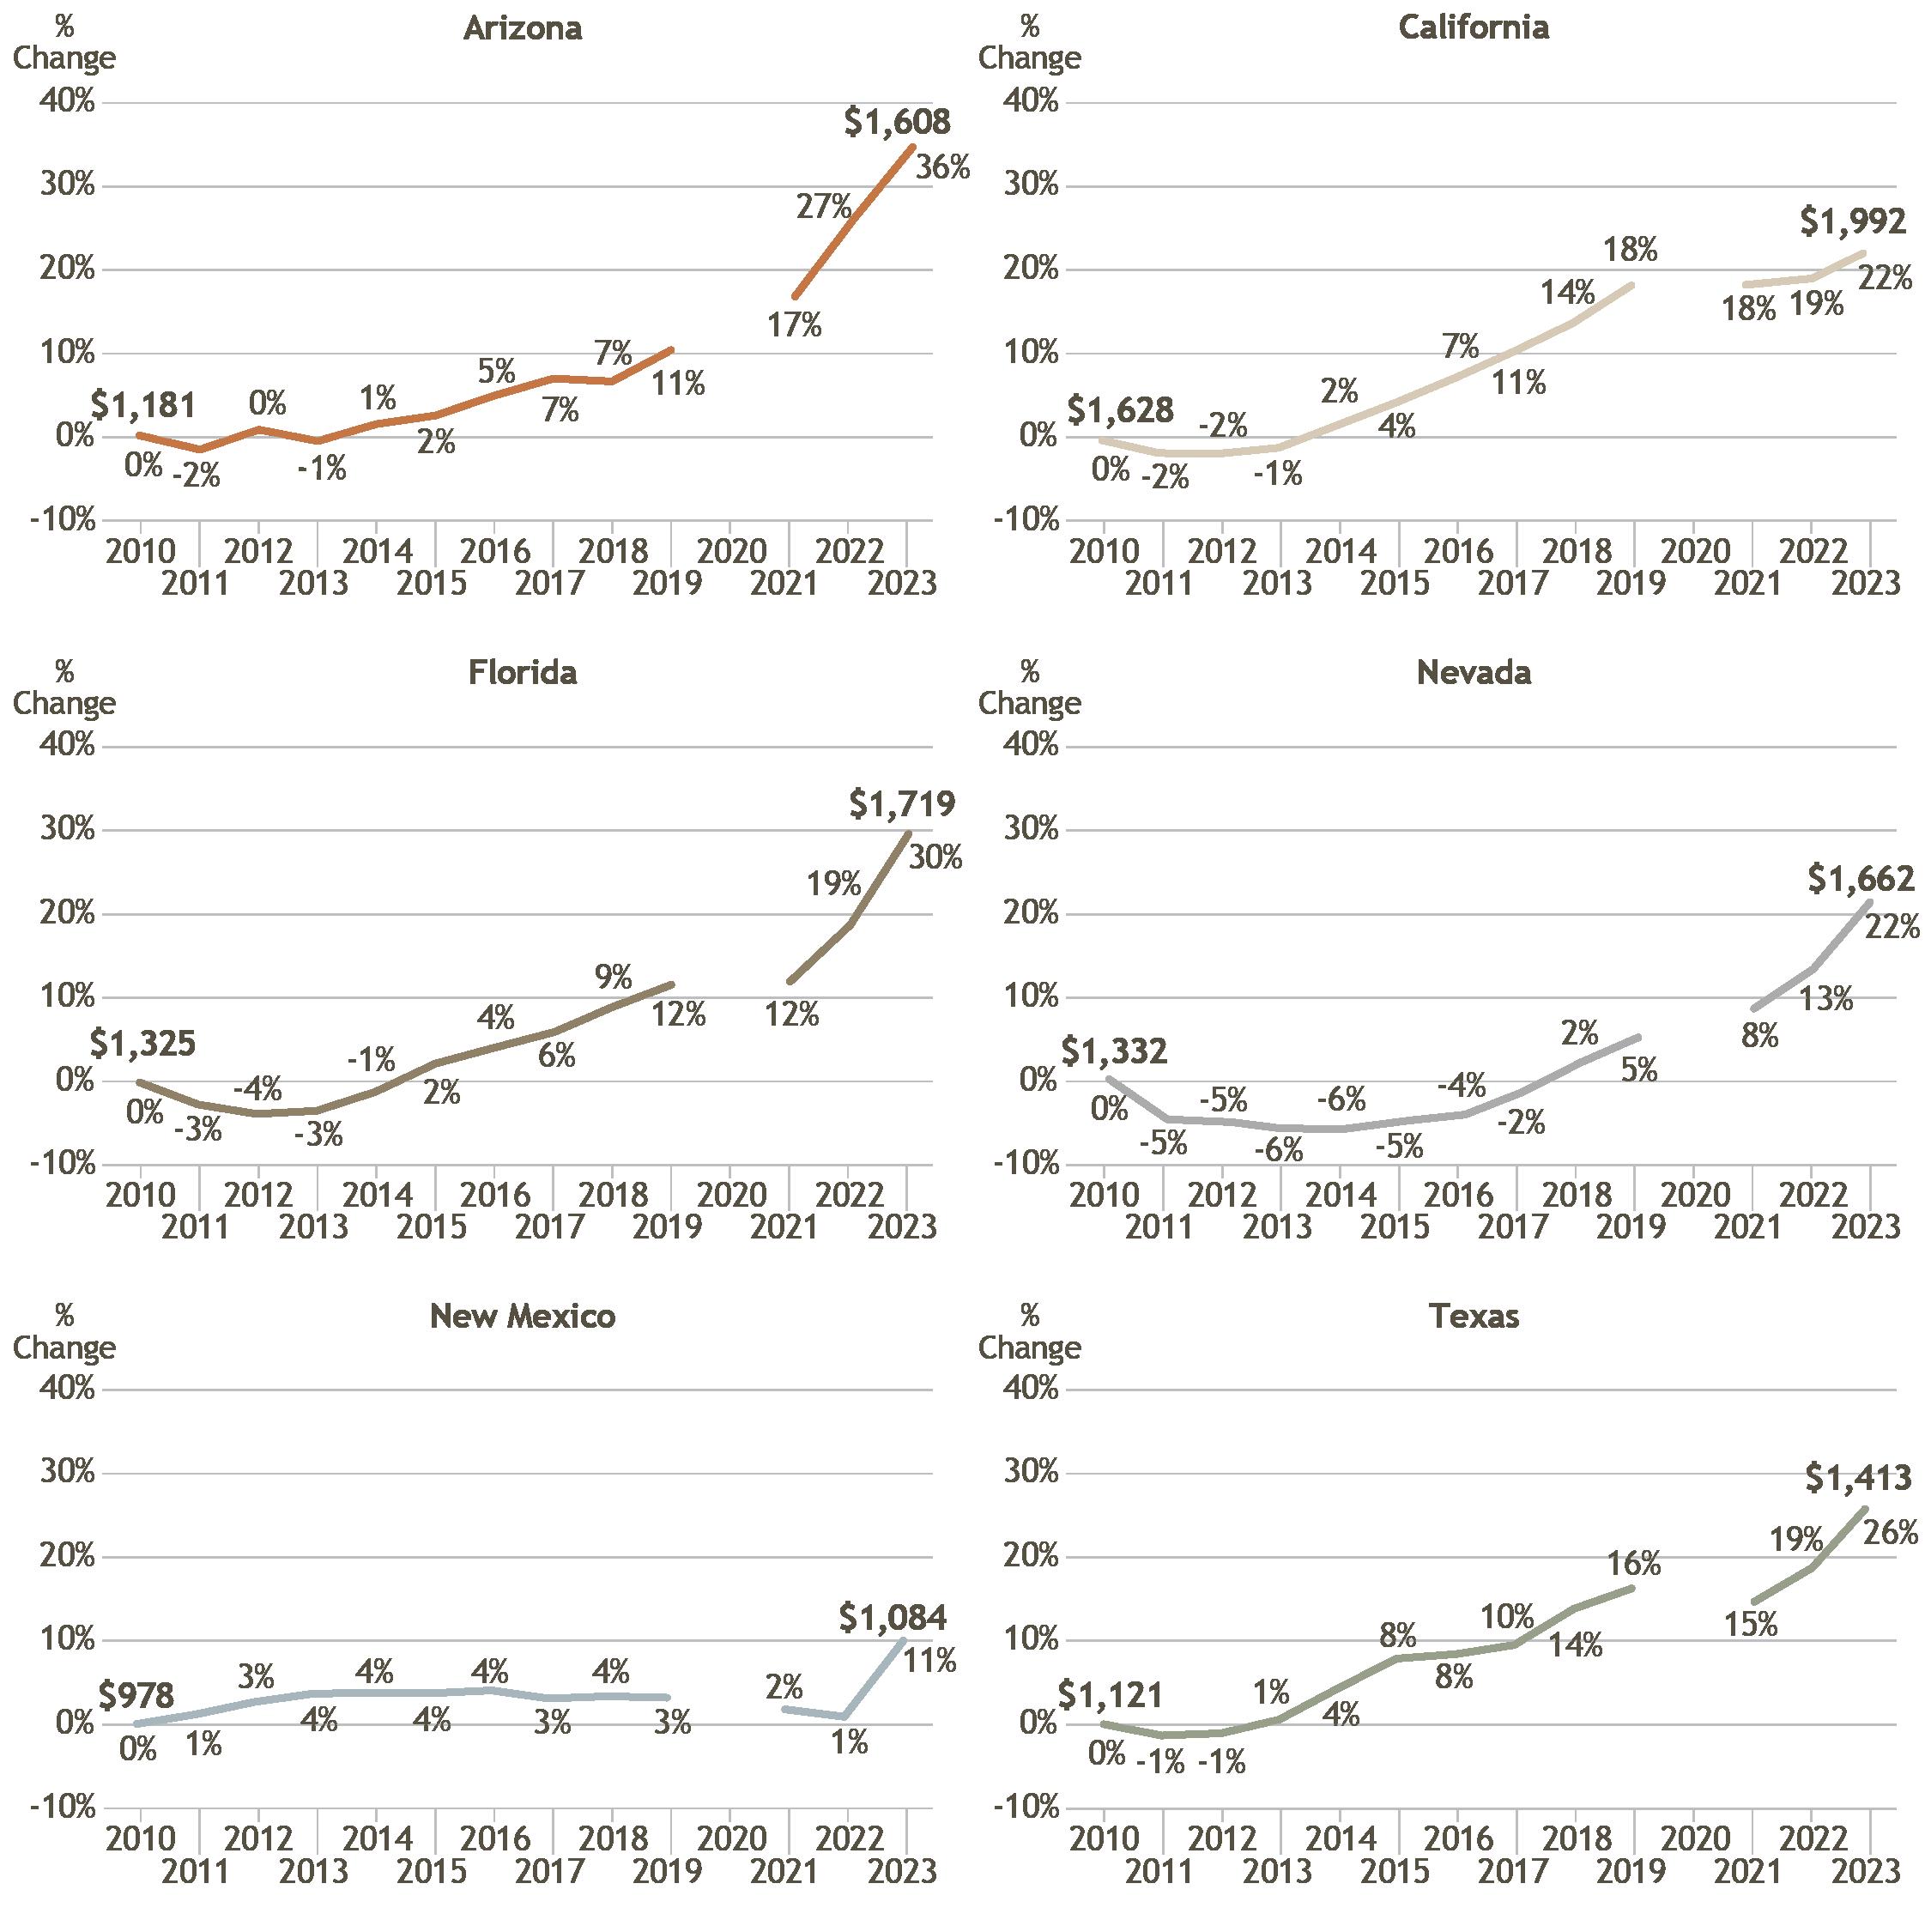
Figure 23. Percent Change in Median Gross Rent by State, Inflation-Adjusted, 2010-2023
14
Figure 24. Percent of Renters Paying 30 Percent or More of Their Income to Housing, 2010-2023 Page 22
Figure 25. Renter’s Median Monthly Housing Cost vs. Income, Inflation-Adjusted, 2010-2023 Page 22
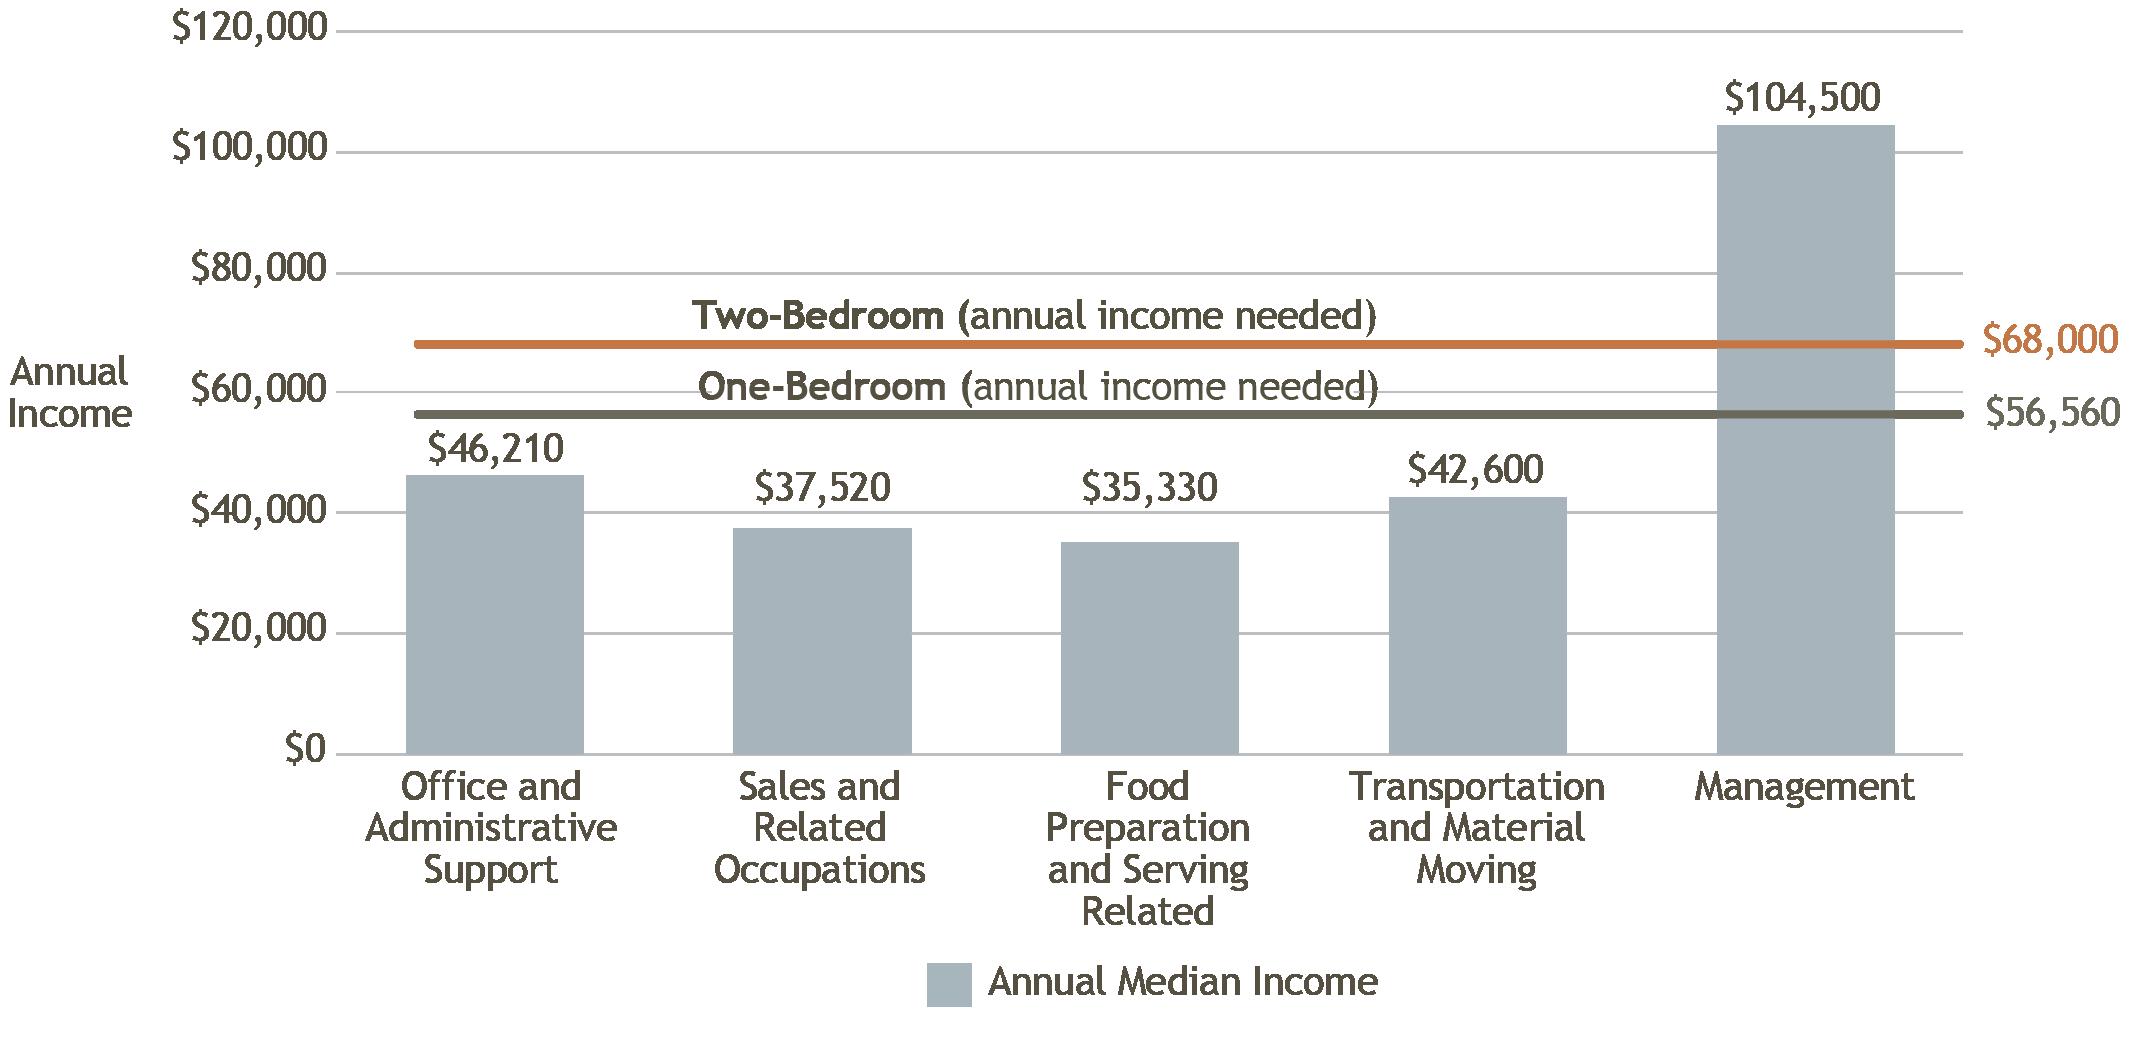
Figure 26. Affordability Among Arizona’s Top 5 Professions Page 23
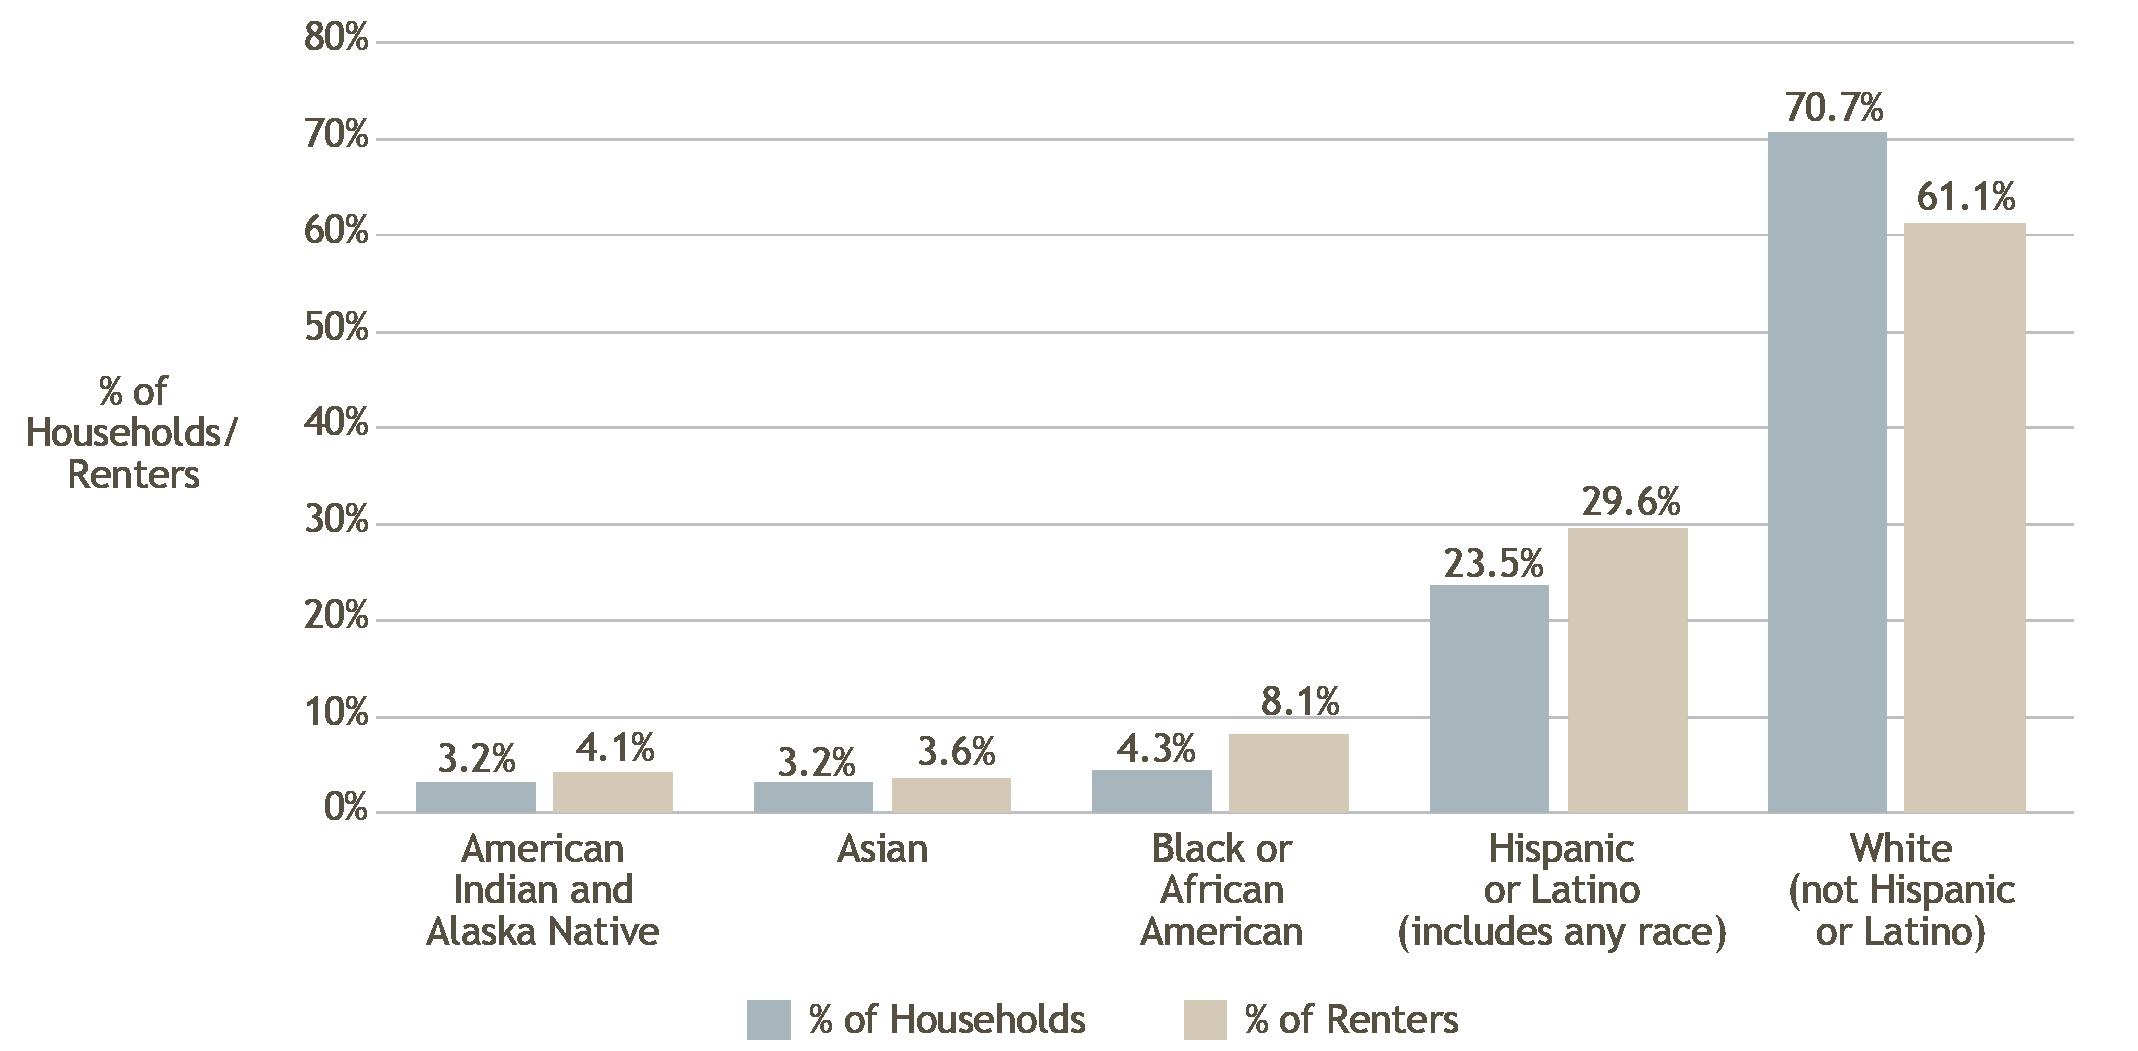
Figure 27. Non-white Households Are Disproportionately Renters Page 25
Figure 28. Affordable and Available Rental Homes per 100 Households at or Below Threshold by State Page 27
Figure 29. Eviction Filings in Arizona, 2010-2024 Page 30
Figure 30. Unhoused Persons Over Time, Sheltered and Unsheltered, 2010-2024 Page 30
Figure 31. Unhoused Children and Elderly in Arizona, 2024 Page 33
Tables
Table 1. Increases in Homeless Unaccompanied Youth (Age 24 and Younger) Page 32
Table 2. Homelessness by Race and Ethnicity, 2024 Page 33
Table 3. Existing Supportive Housing Page 34
Table 4. Homelessness and Supportive Housing by Area, 2024 Page 35
Executive Summary
This is the second annual report on the state of housing in Arizona that examines trends including population, housing stock and market, homeownership, rental housing, and homelessness. This report outlines policy changes and implementation from 2024 and highlights current local and state efforts to address housing challenges. To supplement the state-level report, additional data briefs including demographics and housing trends are available for all 15 Arizona counties on the ARCHES website.
Arizona continues to face challenges with housing accessibility and affordability. While housing development has increased, demand continues to outpace housing growth. Housing costs continue to outpace earnings, increasing the percentage of cost burdened households. Eviction rates and homelessness continue to rise while housing remains a priority for local and state policymakers.
KEY FINDINGS
Arizona’s cost of living surpassed the national average for the first time. Standardized data collection on the price of goods and services by geographic region by the federal government began in 2010; in the 14 years since, Arizona’s cost of living has consistently been below the national average. In 2023, the cost of living surpassed the national average by 1.1% for the first time since 2010. However, the average price of rental housing and utilities exceeded the national average for the last three years and has now surpassed the national average by 8.6% in 2023. The cost of living in Arizona has exceeded the cost of living in New Mexico, Texas, and Nevada (three of the five comparison Sun Belt states) for the past several years.
Annual new home construction continues to outpace years prior to the COVID-19 pandemic. In 2023, 52,920 new homes were added in Arizona. This set a new record for the number of homes constructed in a single year. The 2023 record is part of a recent trend in increasing housing construction overall; the number of new houses constructed per year since 2020 is greater than any year prior to 2020. The majority of homes constructed in Arizona since 2018 have been single-family, although there has been a 2% increase in the share of housing constructed with 20 or more units. The predominance of single-family home construction has implications for housing affordability, since single-family homes tend to be more expensive than multi-family homes.
High home prices and mortgage rates may be driving a decrease in home purchases. There was a 22% decrease in residential home purchases in 2023 compared to 2022. Some of this decrease may be due to the continued rise in home prices, with typical home values in Arizona reaching $428,156 in 2024—an increase of $160,000 since 2019. High mortgage interest rates also may have prompted a slowdown in home purchases; mortgage rates in December 2024 were the highest since 2010. From 2020 to 2024, the national average mortgage rate climbed from a low of 2.67% to 6.85%. High mortgage rates depress sales by increasing buyers’ monthly costs and discouraging owners with a mortgage from putting their homes on the market, since moving would require taking on a new, higher interest rate.
A record number of eviction filings reflects continued affordability challenges for renters. There were 106,587 court filings for eviction in Arizona in 2024, the highest number of eviction filings on record. Eviction filings have increased sharply since the COVID-19 pandemic eviction moratoriums
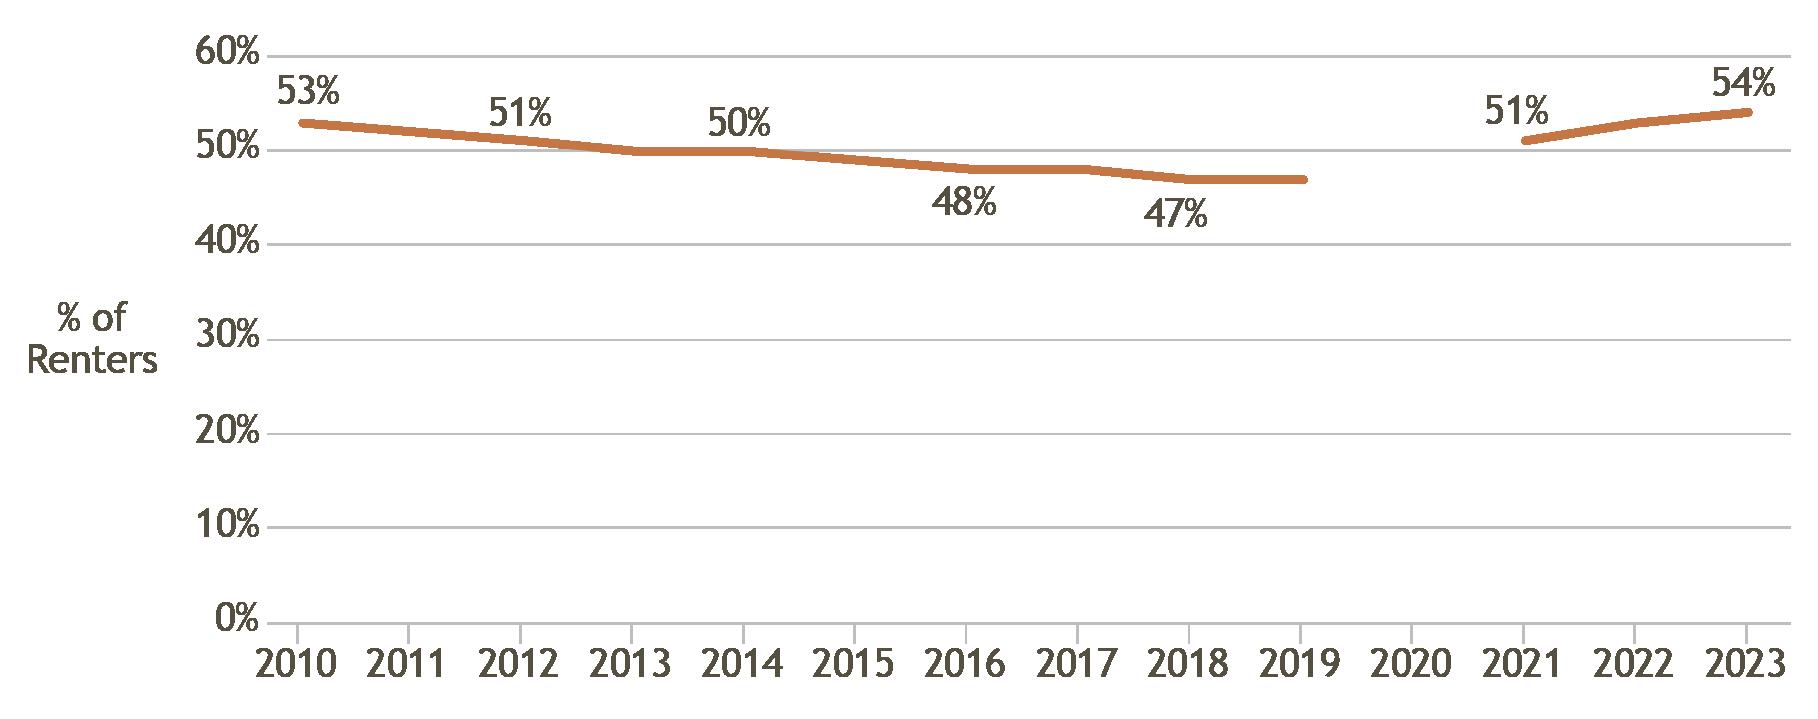
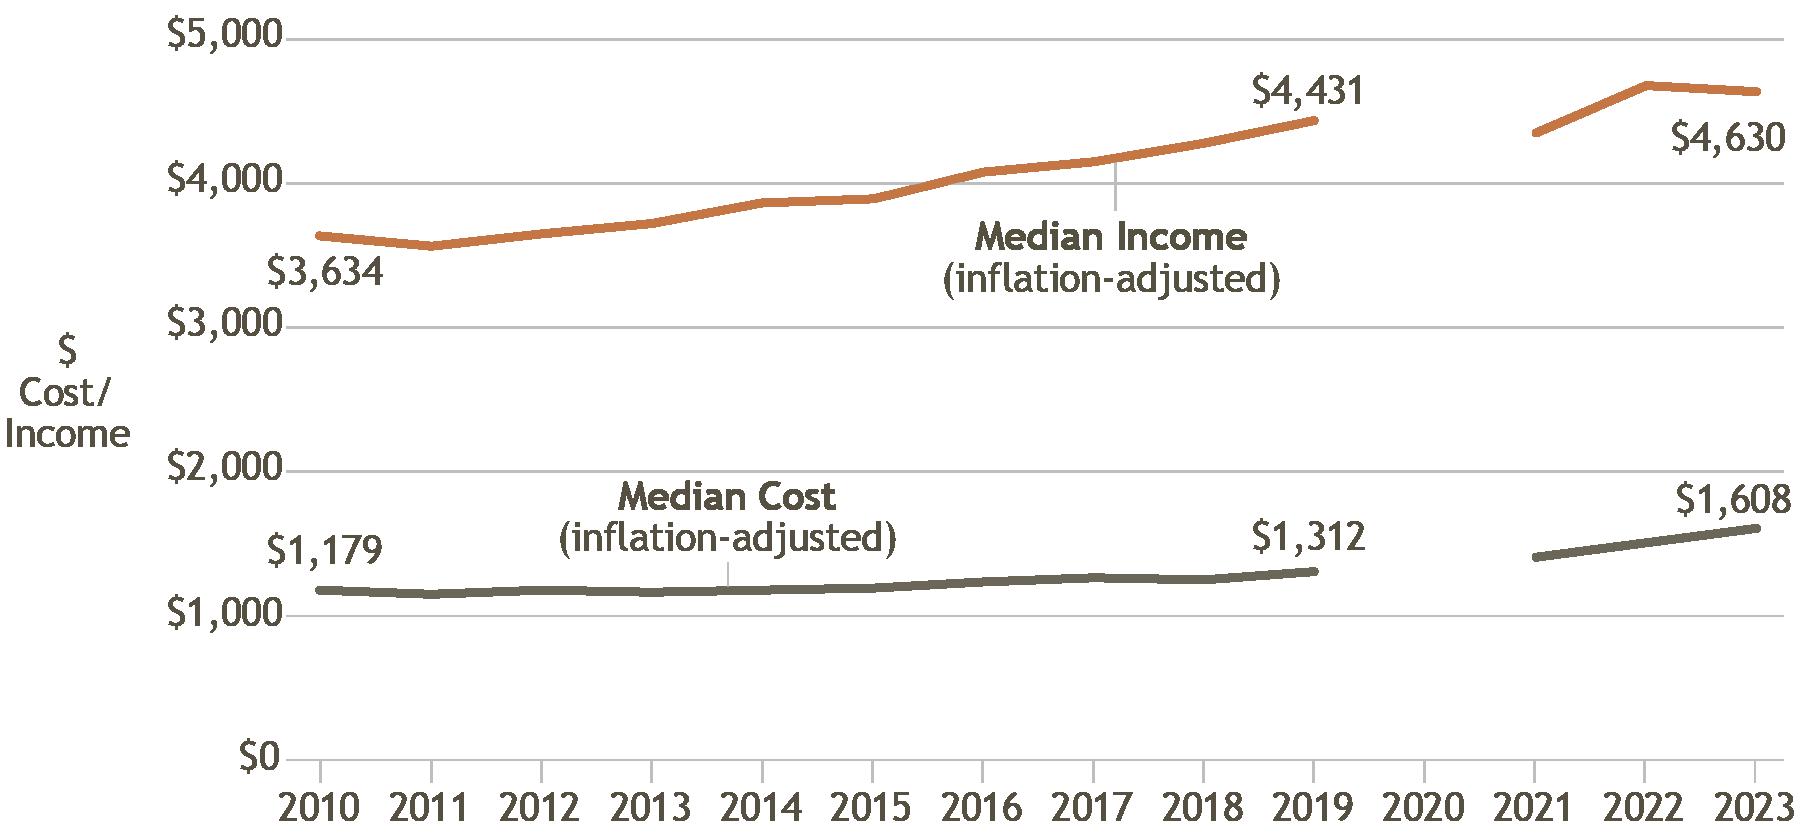
expired in 2021 and now far surpass pre-pandemic levels. These evictions are indicative of the challenges Arizona households face in rental affordability. In 2024, 54% of renters were cost burdened (spending 30% or more of their income on rent). Since 2010, renters’ housing costs have increased faster than incomes (36% vs. 27%). Housing access is particularly difficult for lower-income renters, with only 37 homes that are both affordable and available for every 100 households earning 50% or less of the area median income (AMI).
Homelessness reached an all-time high. The number of homeless individuals in Arizona reached 14,737 in 2024, exceeding 14,000 for the second consecutive year. This is a slight increase from 2023. The demographics of individuals experiencing homelessness, however, have shifted more substantially. The number of homeless families with children increased 15% from 2023 to 2024; families now represent 21% of all those experiencing homelessness. Arizona has also seen a 24% rise in unaccompanied homeless youth since 2017. (These statistics are based on the Point-in-Time count used by the U.S. Department of Housing and Urban Development and likely underestimate the number of individuals and families experiencing homelessness).
State and local governments are focused on creative solutions to housing shortages. The cities of Flagstaff and Sedona have declared housing emergencies and are urging the state legislature to allow local governments to regulate short-term rentals, as they impact housing costs and the availability of long-term rentals for permanent residents in high-tourism areas. Tucson and Pima County are exploring new pathways to reducing affordable housing shortages through a newly developed five-year plan as part of a competitive grant award from the U.S. Department of Housing and Urban Development. Local governments across the state have implemented revised housing statutes and regulations enacted during the 2024 state legislative session, while Arizona legislators continue to pass housing-related bills during the 2025 session.
Introduction
Access to safe, affordable, and stable housing is essential for individual well-being and community prosperity.1 Research consistently shows that access to affordable housing improves health outcomes, supports educational attainment, and strengthens local economies by promoting workforce stability and mobility.2 In Arizona, housing affordability continues to be an urgent concern as home prices and rents have risen sharply, while wage growth has failed to keep pace.
This widening affordability gap has left many Arizonans cost burdened—spending more than 30 percent of their income on housing—and has increased housing insecurity, especially among low- and moderate-income renters. As of 2023, over half of renter households in Arizona are considered cost burdened.3 The rapid increase in demand for housing—driven by population growth, in-migration, and investor activity—has outpaced supply, pushing prices higher and making it harder for many residents to find affordable options. Although new construction is underway, it has not been sufficient or fast enough to meet the state’s growing housing needs.4
In response, state and local governments have begun to prioritize housing policy reforms and investments aimed at improving affordability and stability. These include zoning reforms to allow more multifamily development, incentives for affordable housing construction, and expanded rental assistance programs. Addressing housing affordability will require sustained, coordinated efforts across the public and private sectors. Arizona’s commitment to ensuring equitable access to housing is essential for maintaining the state’s economic vitality and community well-being.

This is the second annual report on the state of housing in Arizona, which examines trends using data on population, housing stock and market, homeownership, rental housing, and homelessness. The report provides the most recent available data. It compares Arizona to five additional Sun Belt states with the highest Hispanic or Latino populations in the nation: Florida, New Mexico, Nevada, California, and Texas (also referred to as comparison states). Hispanic or Latino populations are highlighted because they drive population growth in much of the country (see Appendix A: Approach). Research spotlights throughout the report showcase ongoing ARCHES research and provide additional context for statewide trends. The report concludes by highlighting recent state and local efforts to solve housing issues in Arizona.
Population Considerations
Arizona’s demographic composition and trends are important for contextualizing the current housing market and anticipating future housing demand.5 Since households drive housing demand, understanding community characteristics is necessary to ensure that the housing market can meet the needs of Arizona’s evolving population.6 Housing needs and choices are different across different sectors of the population. Having homes that meet the needs of the population is critical and may come in the form of flexible living spaces. For example, an Accessory Dwelling Unit (ADU) can serve as a home office or as a semi-independent living option for older family members.7 As the statewide demographic profile changes over time, new and innovative housing solutions are needed to develop homes that meet the needs of every Arizonan.
ARIZONA’S POPULATION IS STILL GROWING DESPITE DECREASES IN NET MIGRATION
Due to natural growth (i.e., births minus deaths), international migration, and domestic migration, Arizona’s population continues to grow. In 2024, Arizona’s population was estimated at 7.62 million—marking an increase of more than 96,000 people year-over-year and approximately 1.22 million people since 2010.8
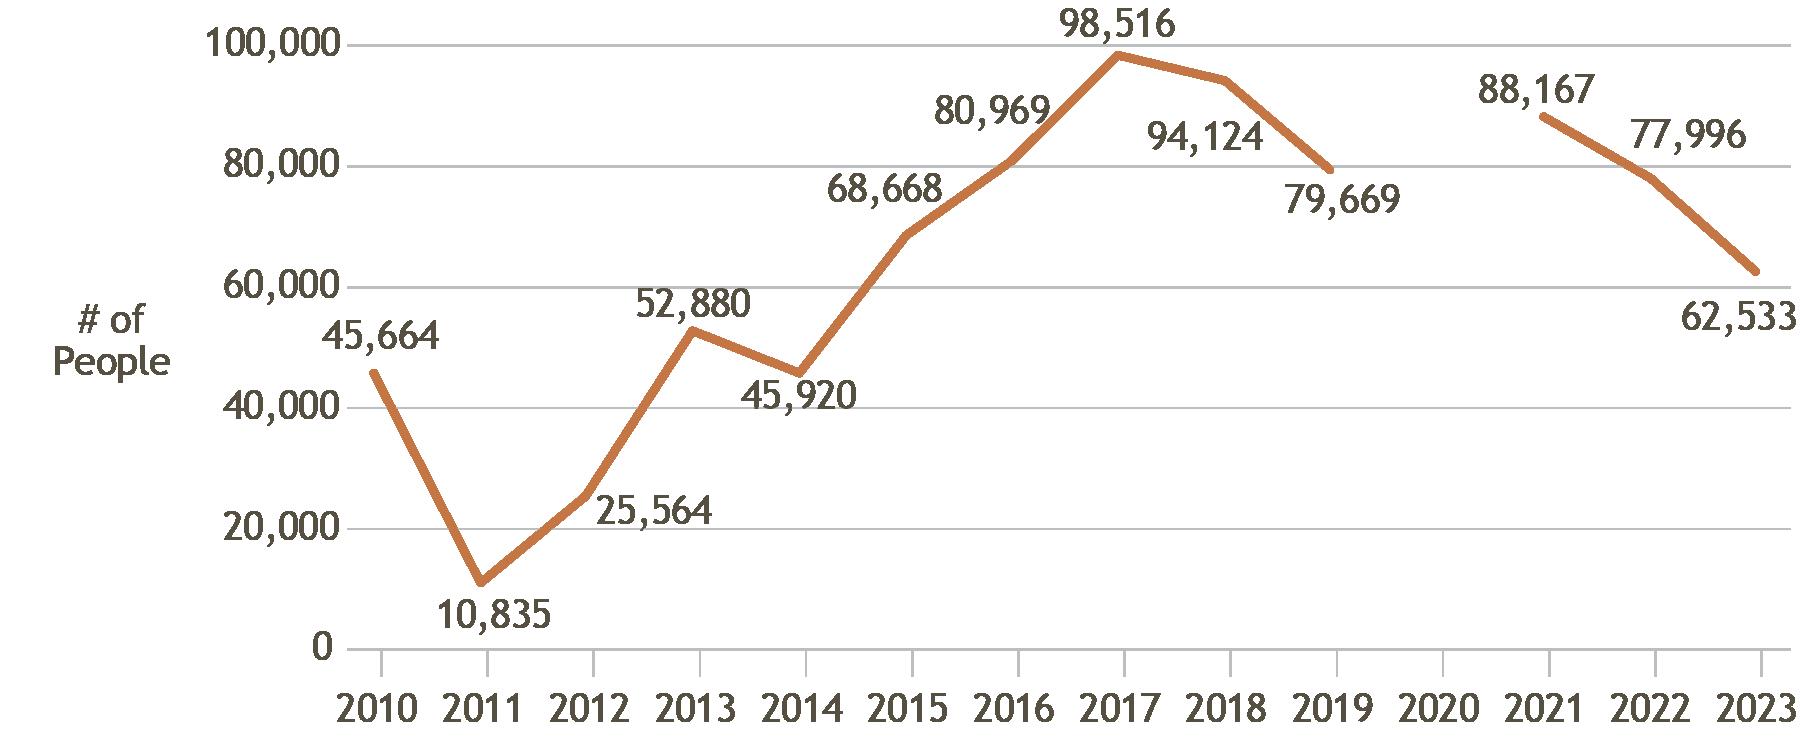
In 2023, 256,203 people moved to Arizona from other states, and 193,670 people left Arizona to relocate to a different state, resulting in a net gain of 62,533 people through state-to-state migration (Figure 1).9 The states with the highest number of residents moving to Arizona included California, Texas, Washington, and Oregon. The states where most Arizonans relocated to include California, Texas, Colorado, and Washington.
Figure 1. State-to-State Net Migration to Arizona Per Year, 2010-2023
Source: U.S. Census Bureau, State-to-State Migration Flows
Note: 2020 Data Unavailable
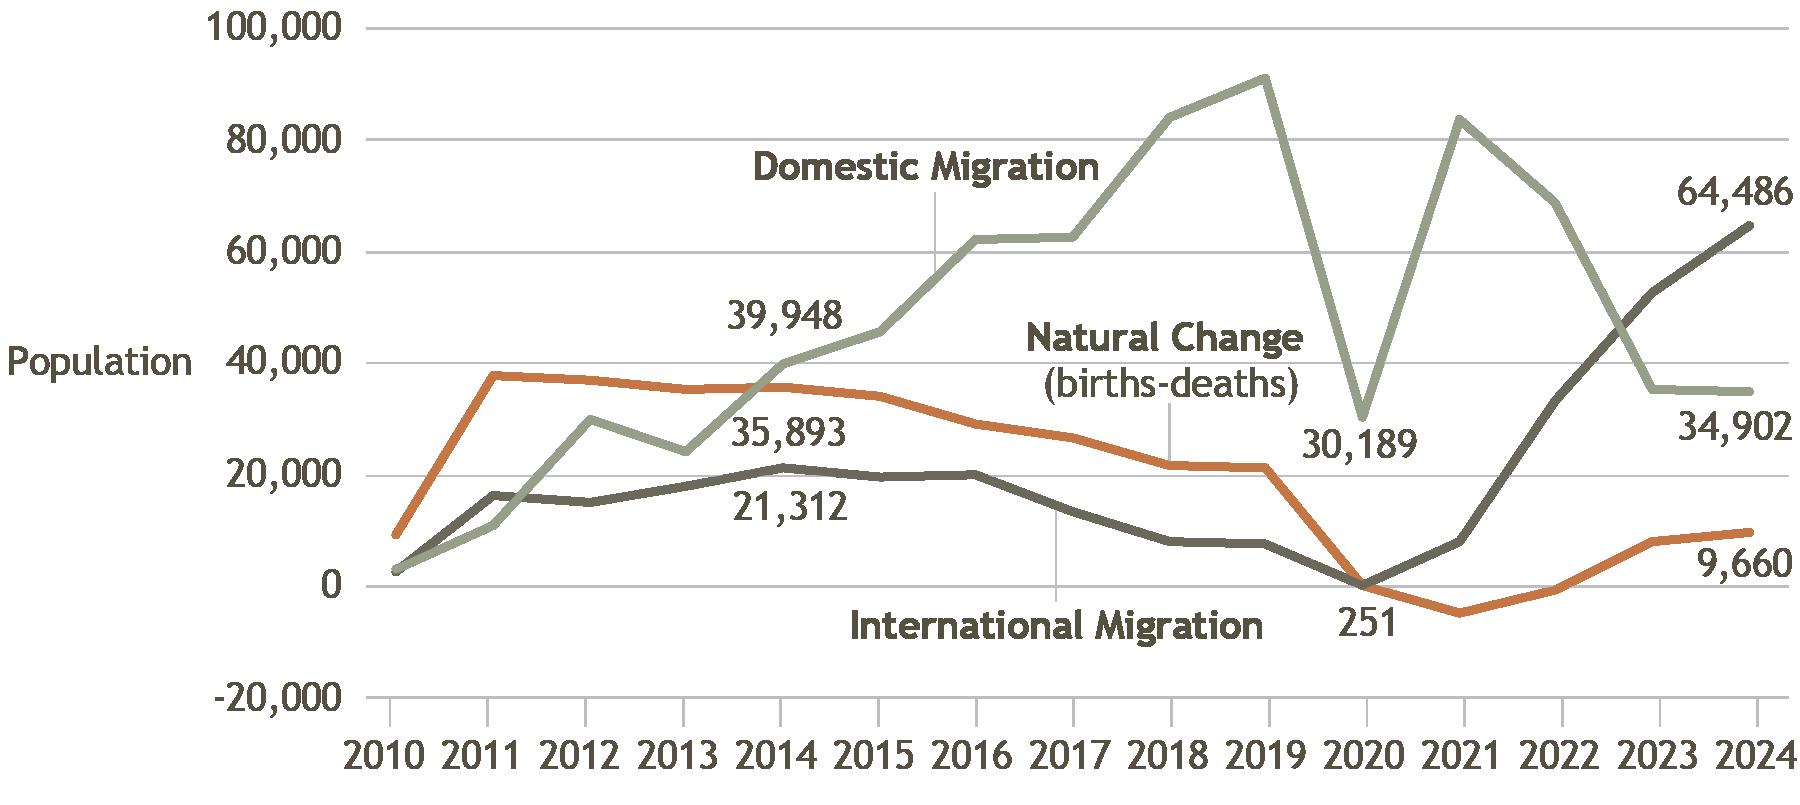
The factors that impact population growth have shifted over time in Arizona (Figure 2). In 2014, the driver of population growth changed from natural change (births and deaths) to domestic migration, which persisted until 2023, when international migration outpaced domestic migration as a source of population growth.10 Since 2020, both forms of migration have outpaced natural change, which remains the least impactful driver of population growth. In 2024, Arizona saw a net population gain of 109,357 people. International and domestic migration accounted for 99,388 people, and natural change resulted in a net gain of 9,660 people.
Figure 2. Change in Population by Type in Arizona, 2010-2024
Source: U.S. Census Bureau, State Population Totals
Moving forward, the current housing market has the potential to impact migration trends. People who cannot afford to buy or keep a home may decide to leave Arizona. A recent poll of registered voters showed that 28% of respondents have considered moving out of state because “housing is so expensive.” Moreover, only 13% of respondents reported feeling that housing is affordable in the state.11
BY 2060, ARIZONA’S POPULATION MAY EXCEED 10 MILLION
Projections from the Office of Economic Opportunity estimate that Arizona’s population will increase to 8.3 million by 2030.12 Geographically, nearly 5.8 million people are expected to live in the Phoenix Metro area, 1.1 million in the Tucson Metro area, and 1.4 million across the remainder of the state. By 2060, estimates show that the state’s population could reach 10.7 million. Arizona must address the housing supply gap to prepare for forecasted population growth.
THE GAP BETWEEN HOUSEHOLD GROWTH AND HOME GROWTH WIDENS POST-COVID
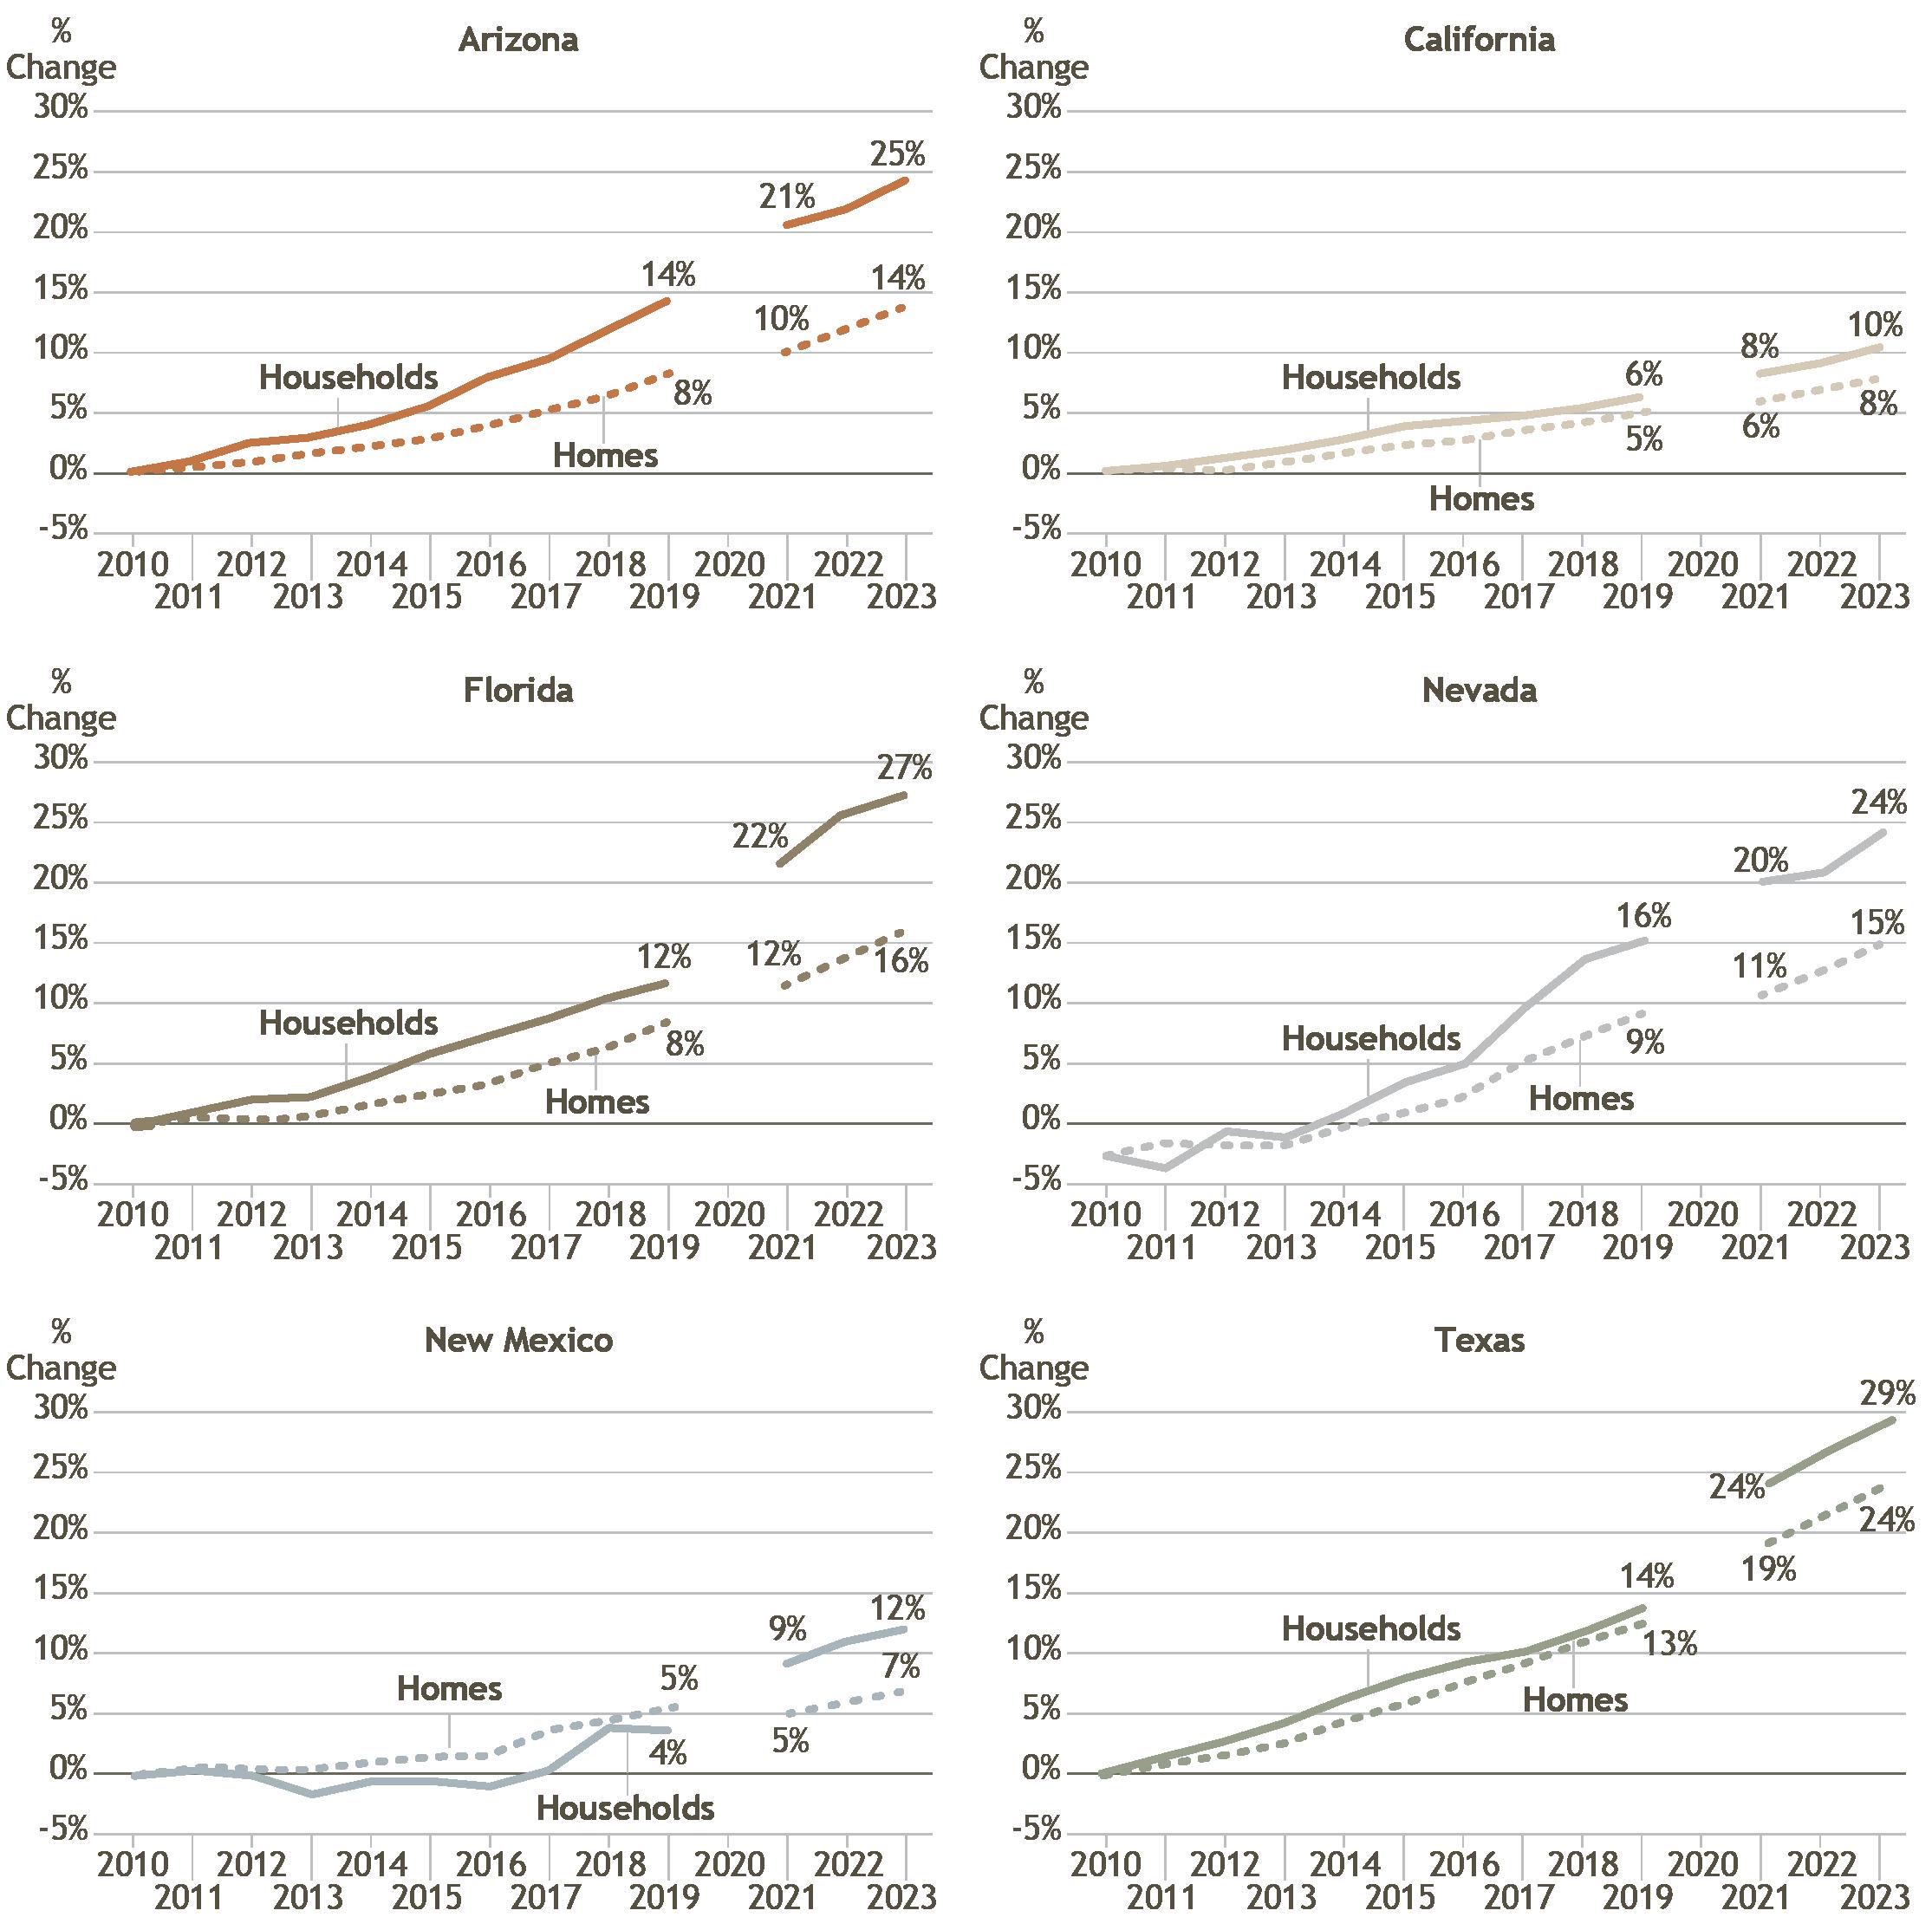
Since 2010, the number of households, measured by occupied homes, has consistently grown faster than the total number of homes in Arizona.13 Notably, this gap has widened steadily over time, with an increased gap in the difference between households and homes seen following the COVID-19 pandemic. This is also true for each comparison state, except New Mexico, where housing growth outpaced household growth until 2021 (Figure 3). In 2023, Arizona had the 2nd highest gap between the percent change in homes and households, behind Florida, with households growing almost twice as fast as homes, at 25% and 14%, respectively. Arizona ranks 3rd highest in household growth and 4th highest in housing growth among comparison states. Each of these metrics remained consistent from 2022 to 2023.
3. Percent Change in Homes and Households Since 2010
Source: American Community Survey (ACS) 1-Year Estimates, Table DP04. Note: 2020 data unavailable
ARIZONA’S POPULATION CONTINUES TO DIVERSIFY AND AGE
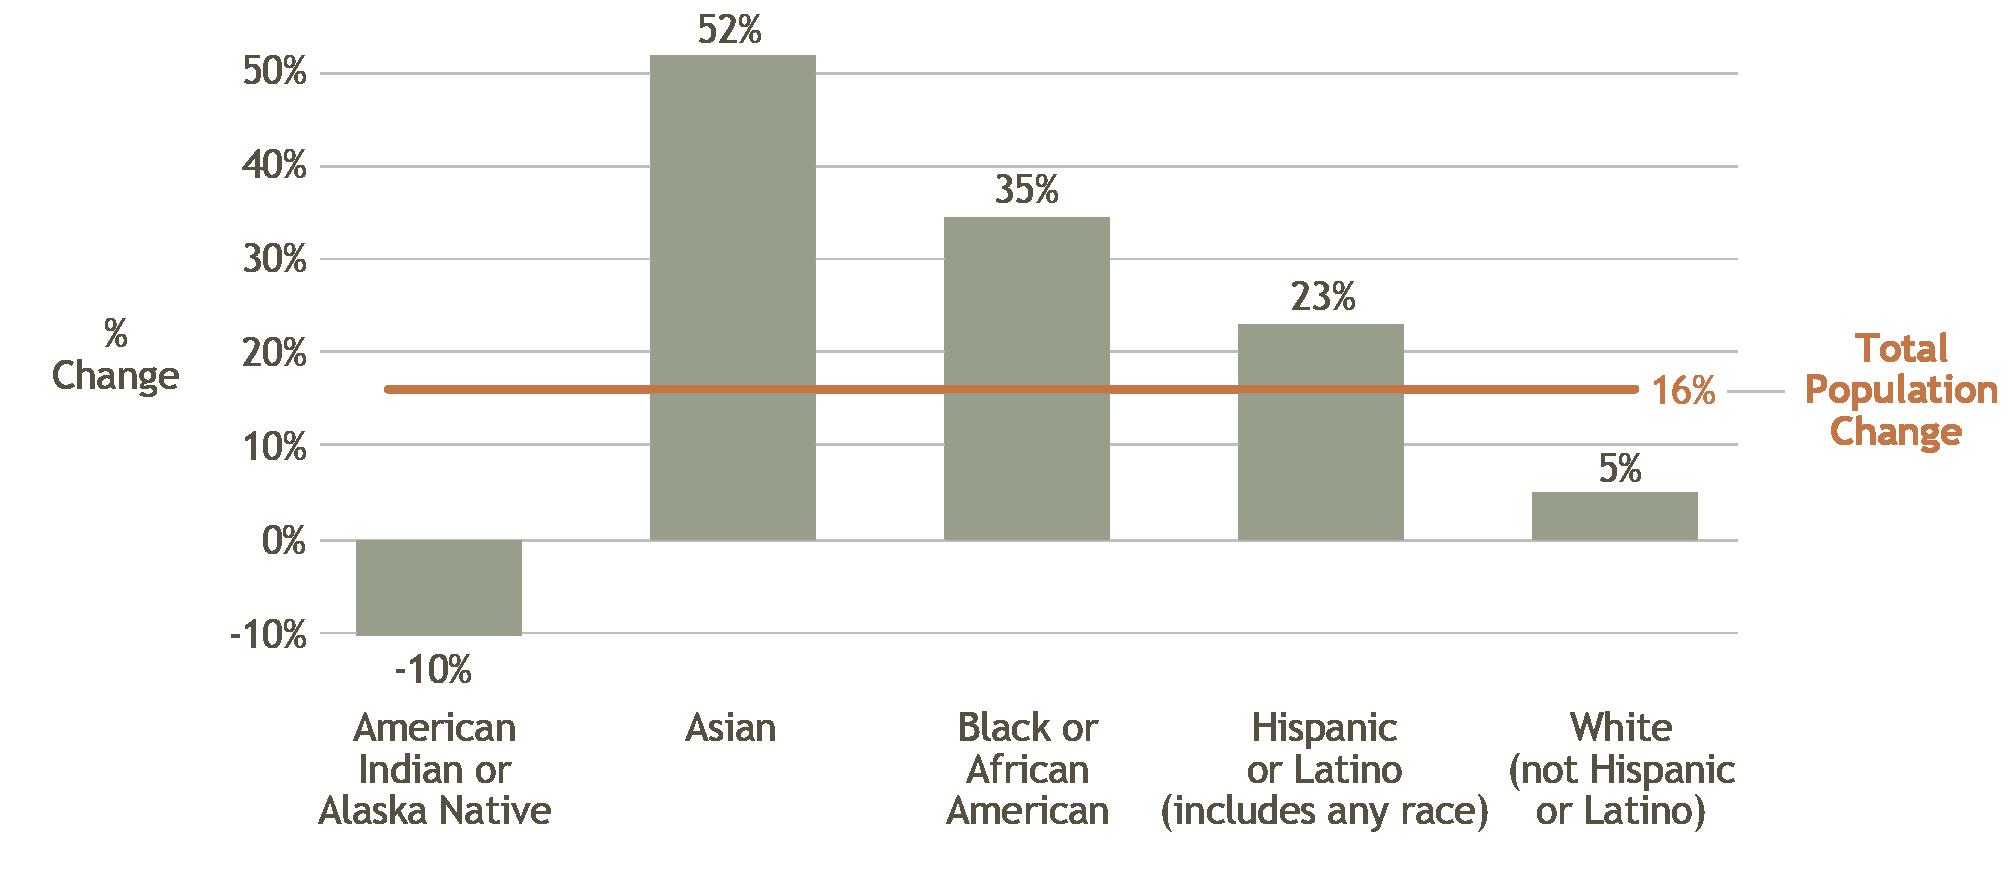
From 2010 to 2023, Arizona’s total population grew by 16%. Over this time, most racial and ethnic groups grew except for the American Indian and Alaska Native population (Figure 4).14 The Asian population grew 3.3 times faster than the total population, the Black or African American population grew 2.2 times faster, and Hispanics and Latinos grew 1.4 times faster than the total population. While increasing by 5% over time, the white population grew at a rate of only one-third of the total population.
Figure
Notably, the U.S. Census reported historical undercounts of American Indian and Alaska Native households on the decennial survey.15 This is due to a several factors, including data collection methods lacking cultural sensitivity (i.e., traditionally, researchers have not helped individuals identify as Native or ensured they are counted as head of household), accessibility issues such as lack of access to internet or reliable mail service, particularly for those living on tribal lands, and being part of an already “hard-to-reach” population.16
Source: American Community Survey (ACS) 1-Year Estimates, Table DP05, 2010 and 2023
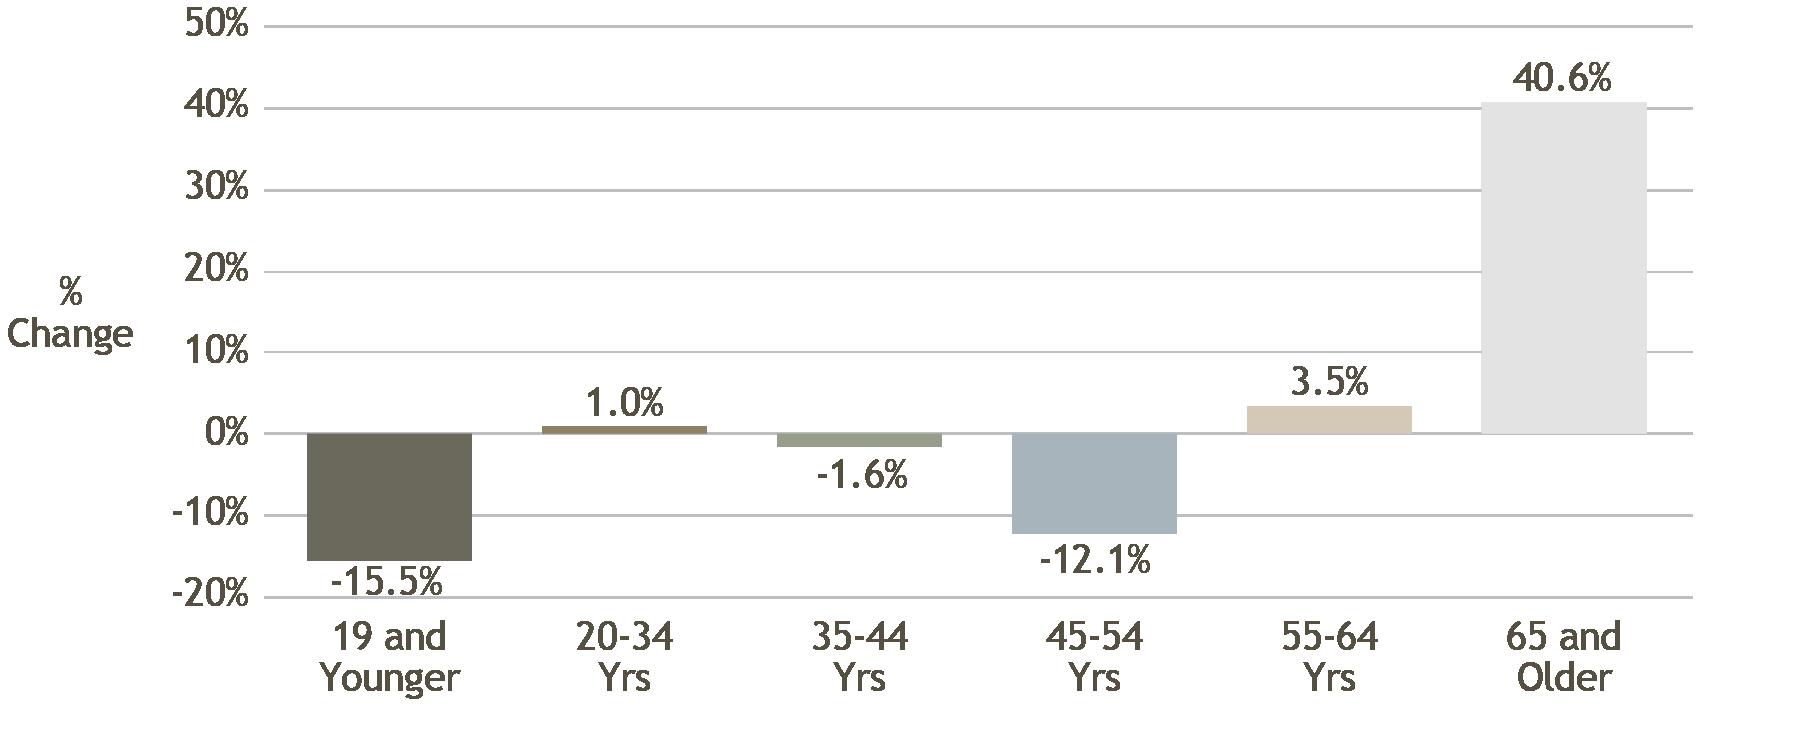
Arizona’s population is continuing to age.17 Arizonans aged 65 or older grew faster than other age groups, showing a 41% increase from 2010 to 2023 (Figure 5). Arizonans aged 55-64 and 20-34 grew slightly (3.5% and 1.0%, respectively) during this time. There was also a 16% decrease in the under 19 population (youth) and a 12% decrease among 45–54-year-olds. The 35-44 age group also declined slightly (-1.6%). The median age of Arizona’s population increased from 38 to 39.3.
Source: American Community Survey (ACS) 1-Year Estimates, Table DP05, 2010 and 2023
Figure 4. Percent Change of Racial/Ethnic Groups Compared to General Population, 2010-2023
Figure 5. Percent Change in Age Groups, 2010-2023
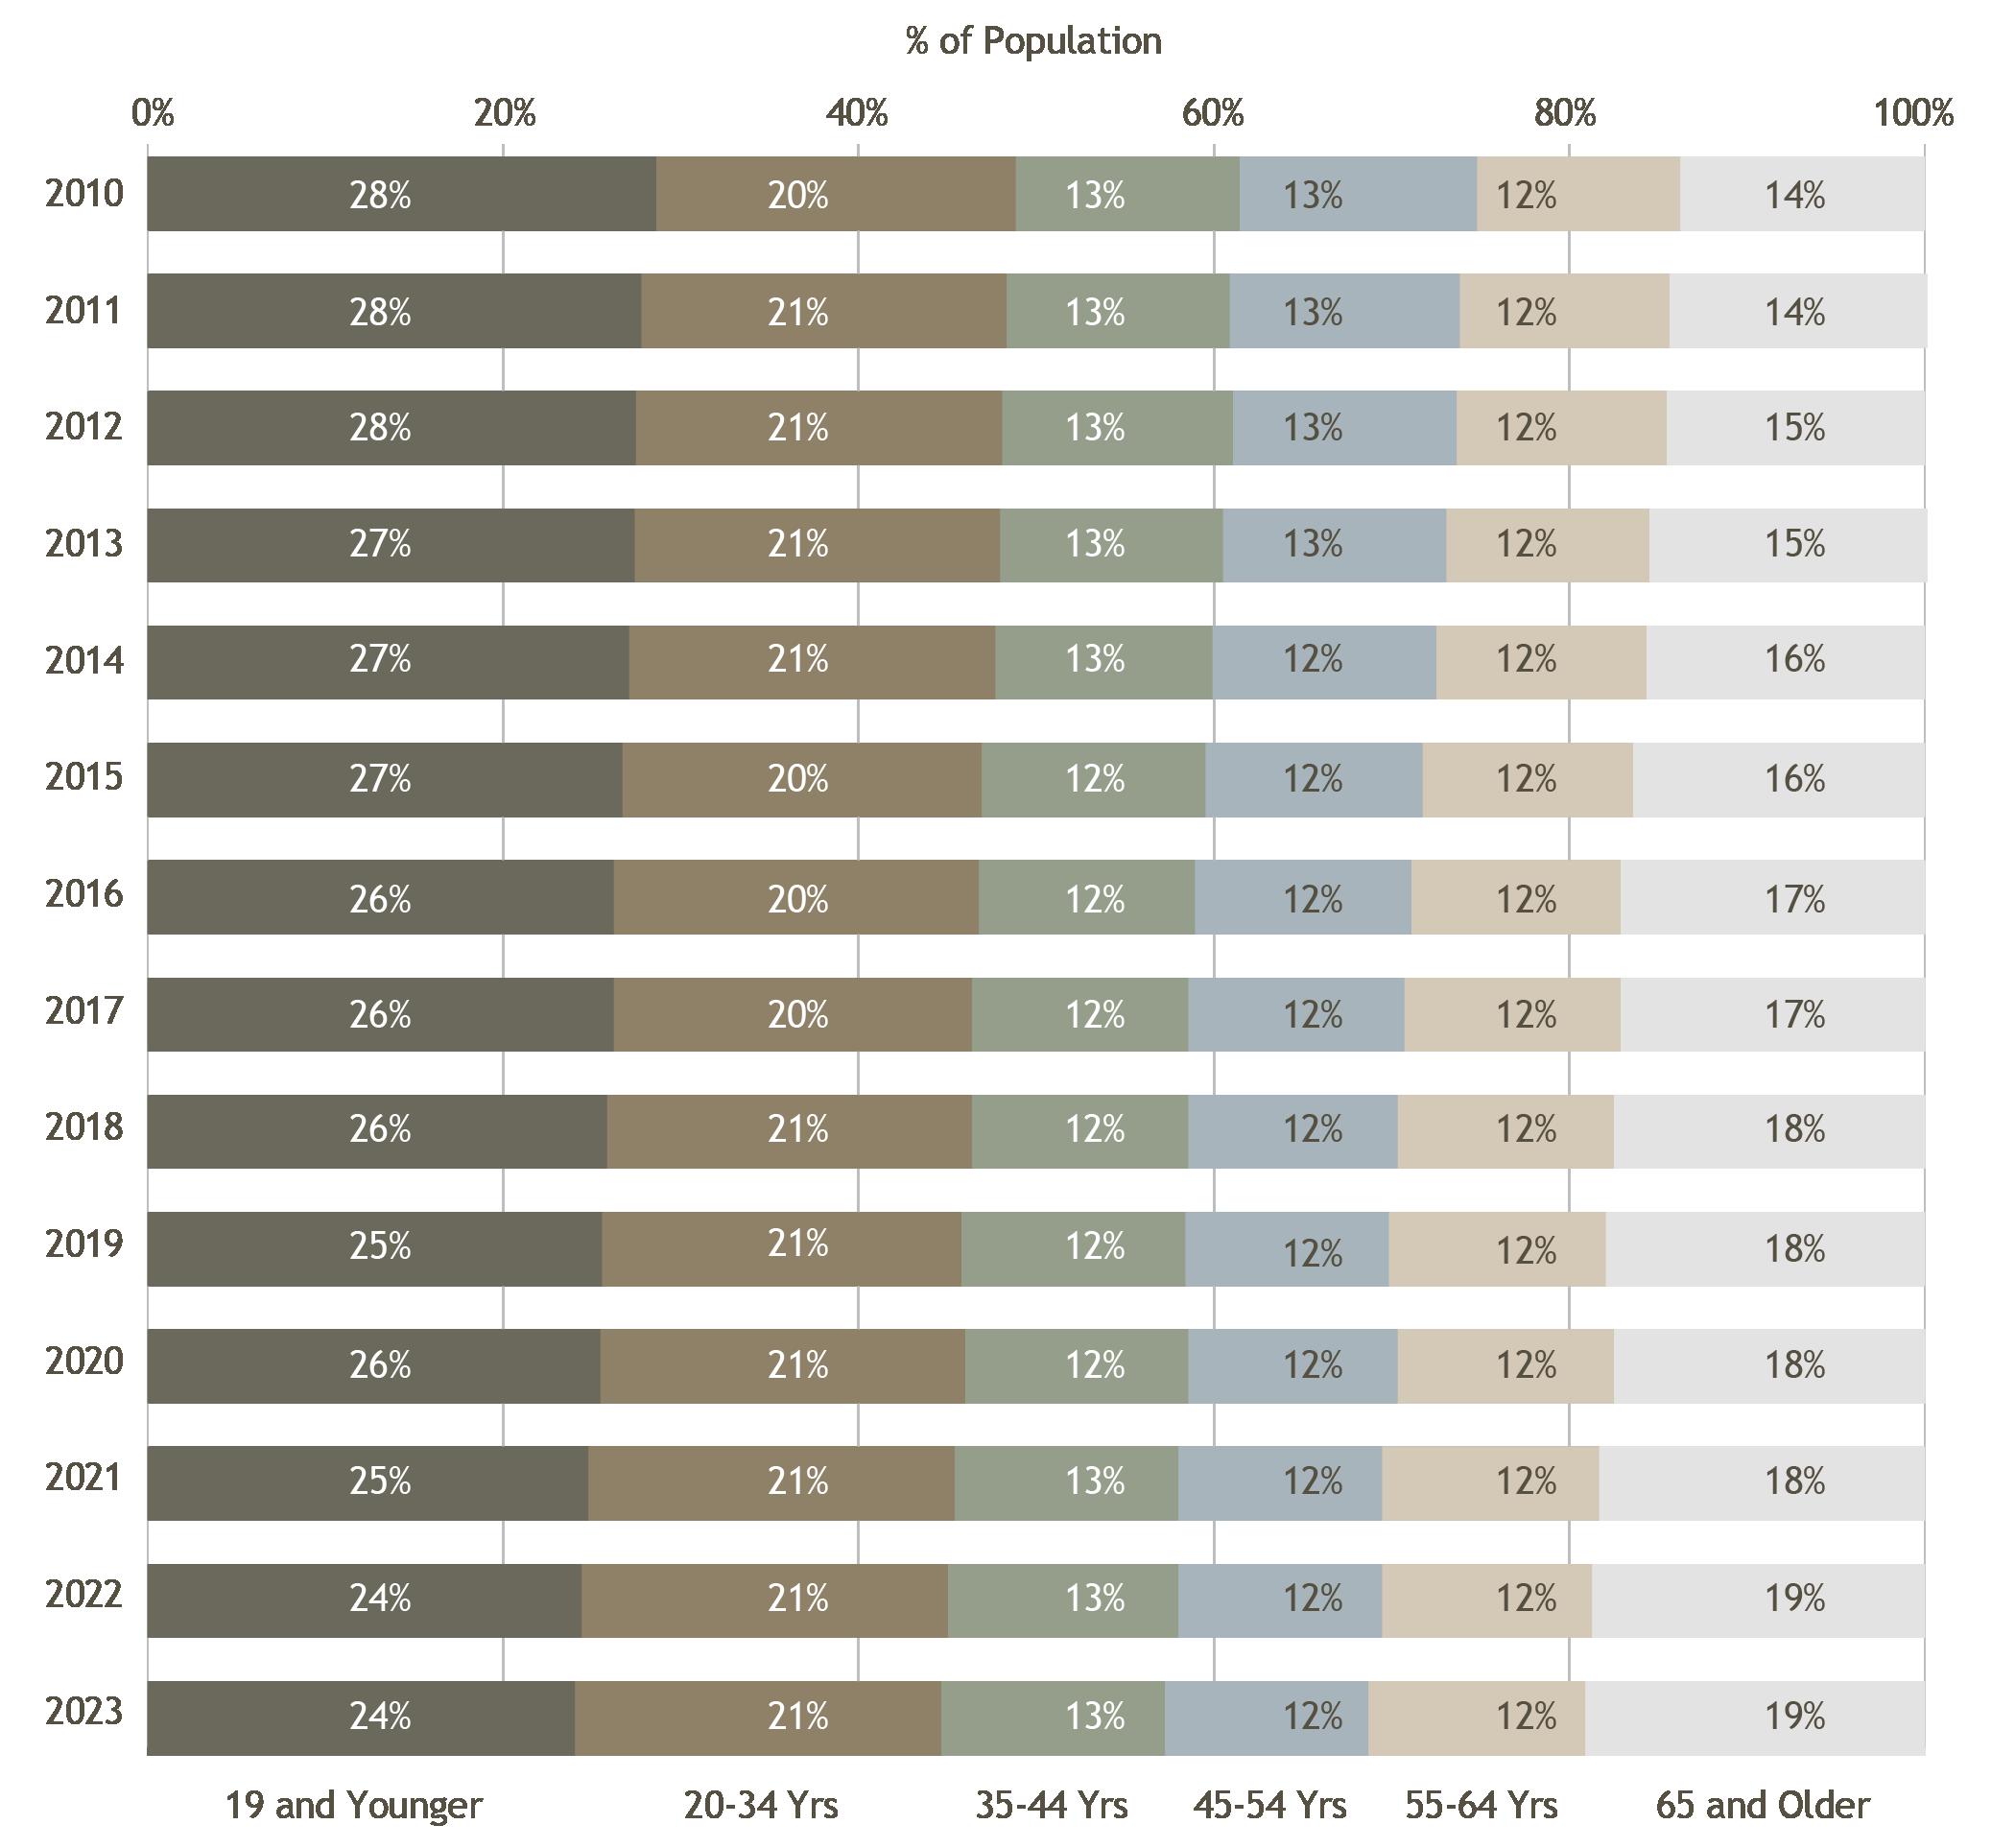
Figure 6 provides the age distribution of Arizonans since 2010. The percentage of older adults increased consistently, starting at 14% in 2010 and reaching 19% in 2023. Conversely, the 19 and younger population decreased from 28% to 24% over the same period.18
Figure 6. Age Distribution, 2010-2023
Source: American Community Survey (ACS) 1-Year Estimates, Table DP05; 2020 Decennial Census
ARIZONA’S COST OF LIVING SURPASSED THE NATIONAL AVERAGE
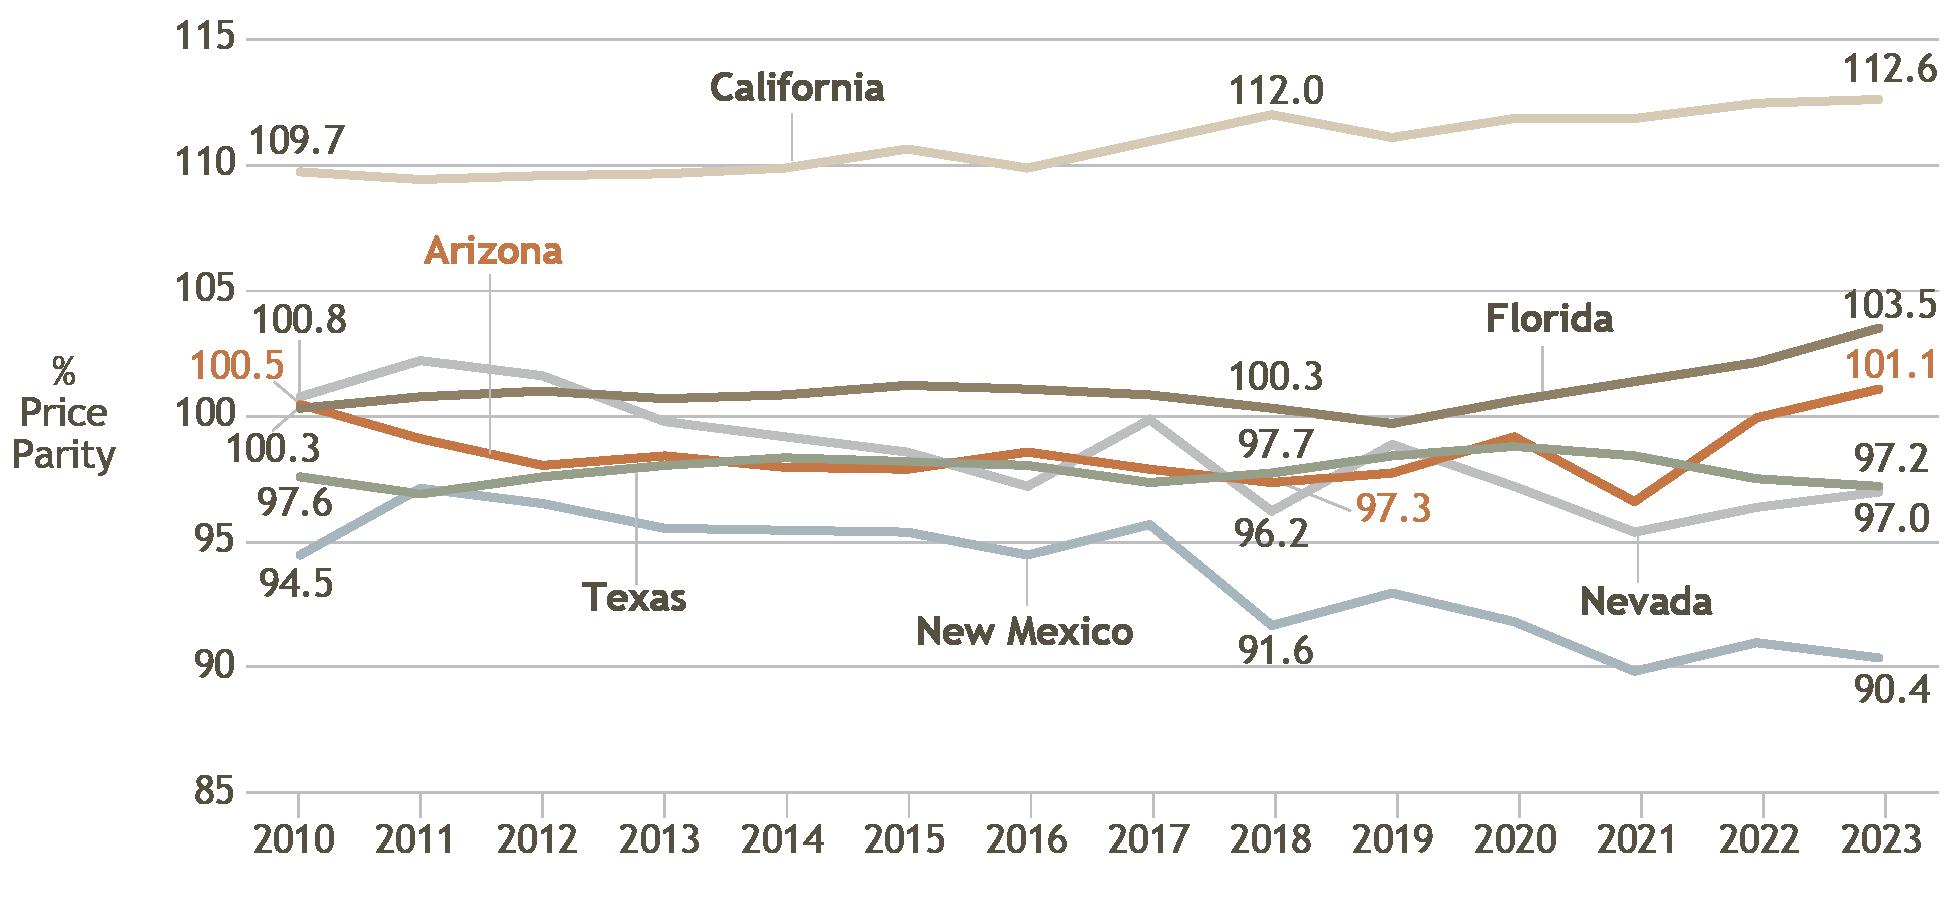
A Regional Price Parity (RPP) is a weighted average of the price level for goods and services for the average consumer in a certain geographic region (i.e., state, metro area).19 RPPs illustrate the cost of living in a geographic area for a single timepoint relative to the US, with the national average represented by a price level of 100.0. Areas with an RPP above 100.0 are more expensive places to live when compared to the national average, and conversely, values under 100.0 are less expensive.20 RPPs are important because they have an
impact on spending power. As regional price parities increase, buying power decreases as more household income is spent on goods and services.21
For the first time since data was recorded in 2010, Arizona’s cost of living surpassed the national level in 2023, recording an RPP of 101.1 (Figure 7).22 Arizona had the 3rd highest RPP among comparison states, behind California and Florida. Arizona saw the largest percent increase in cost of living since 2018 (4%).
7. Regional Price Parities (Price Levels): All Items, 2010-2023
Source: US Bureau of Economic Analysis, Regional Price Parities by State, 2024
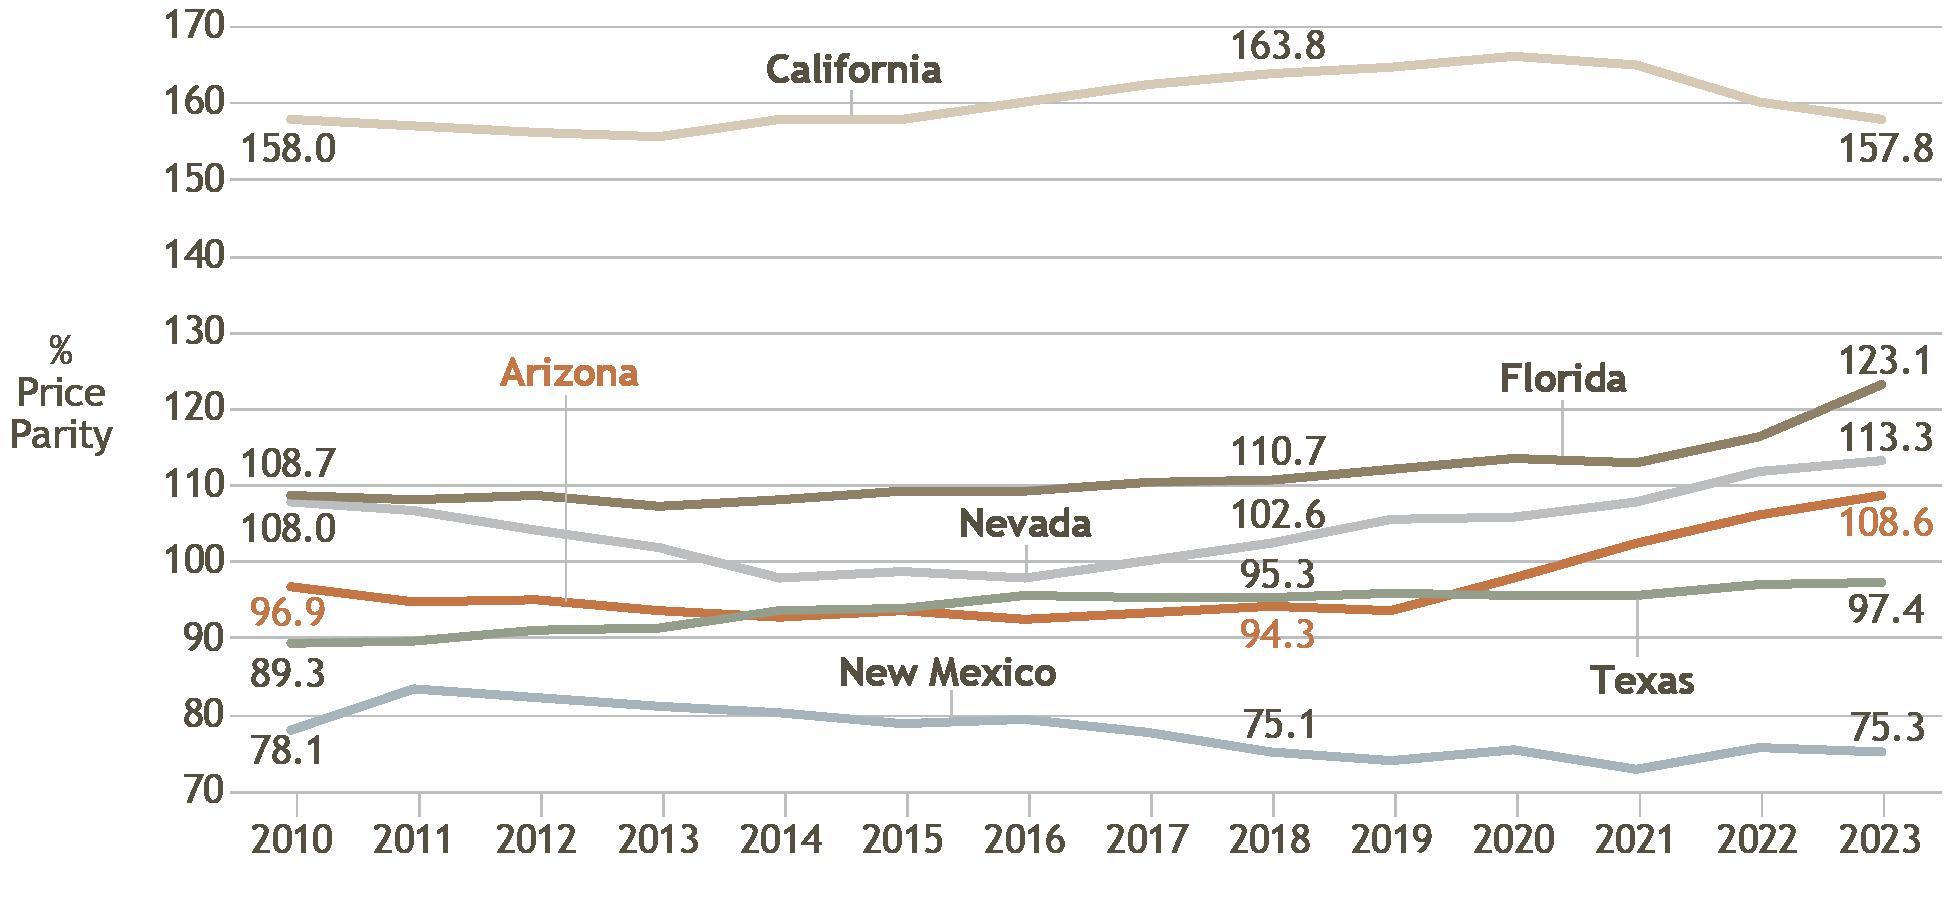
One cost of living category used to compute the overall RPP is the average price level of rental housing and utilities.23 From 2018 to 2023, Arizona experienced an increase from 94.3 to 108.6 (15%) in the rental housing RPP, the largest cost increase among comparison states (Figure 8).24
8. Regional Price Parities (Price Levels): Rental Housing, 2010-2023
Source: US Bureau of Economic Analysis, Regional Price Parities by State, 2024
Figure
Figure
In
Northern Arizona83
This study investigates the housing security challenges faced by Native American households living off reservation lands in Northern Arizona. These challenges include lack of culturally appropriate housing options, rising cost of rent, long waitlists for low-income housing, and systemic discrimination in housing access.
The study has conducted 5 focus group discussions in Flagstaff and found three overarching themes were most significant to participants: (1) economic hardship, systemic exclusion, and marginalization; (2) health issues; (3) limited housing access and concerns on the reservation.
The focus group discussions explored topics such as barriers to accessing affordable housing, experiences with housing assistance programs, the impact of housing instability on health and family life connections, housing access and security on reservations, and urban connection and disconnection in off-reservation housing environments.
Within these discussions, participants described the rising cost of living in Flagstaff in relation to securing stable housing, and housing insecurities and health. For some participants, financial strain remained overwhelming even when working multiple jobs. Further, participants described being excluded from stable housing due to income restrictions that required them to earn at least three times the monthly rent. This, combined with the stigma associated with their housing status and place of residence: “I don’t know if one of the employers kind of looked at the address and was like, no… I think we’re labeled,” reinforced a persistent cycle of housing instability. In addition, participants expressed how transitional housing programs, in some cases, can be unattainable.
The focus group discussions also revealed how housing instability affects health. Participants shared how difficulty in accessing stable housing relates to elevated stress levels, and frequent illnesses.
Participants also shared that, in reality, housing on reservations is limited. What housing does exist often has inadequate infrastructure including limited running water or electricity and barriers to home access and maintenance. For participants considering a return to reservation communities, housing shortages and overcrowding were concerns.
At the time of this report, the study has collected over 140 survey responses from Native American households in Northern Arizona. Preliminary survey data aligned with the focus group discussions in Flagstaff—over 70% of Native American respondents spend more than 30% of their income on housing. In the next stage of this study, researchers will conduct focus groups in Page and Winslow.
AFFORDABLE RENTAL HOUSING IS LIMITED
Rental housing is affordable when renters spend no more than 30% of their income on housing (including utilities).84 Arizona has a substantial shortage of affordable rental housing for low-income households.85 Housing affordable for low-income households is available through public investment primarily through federal programs like the Low-Income Housing Tax Credit Program (LIHTC) and through partnerships with private owners through the Housing Choice Voucher Program.86 Housing that is affordable to lower-income households without subsidy is naturally occurring affordable housing (NOAH), however this housing may not be accessible for the lowest income households.87
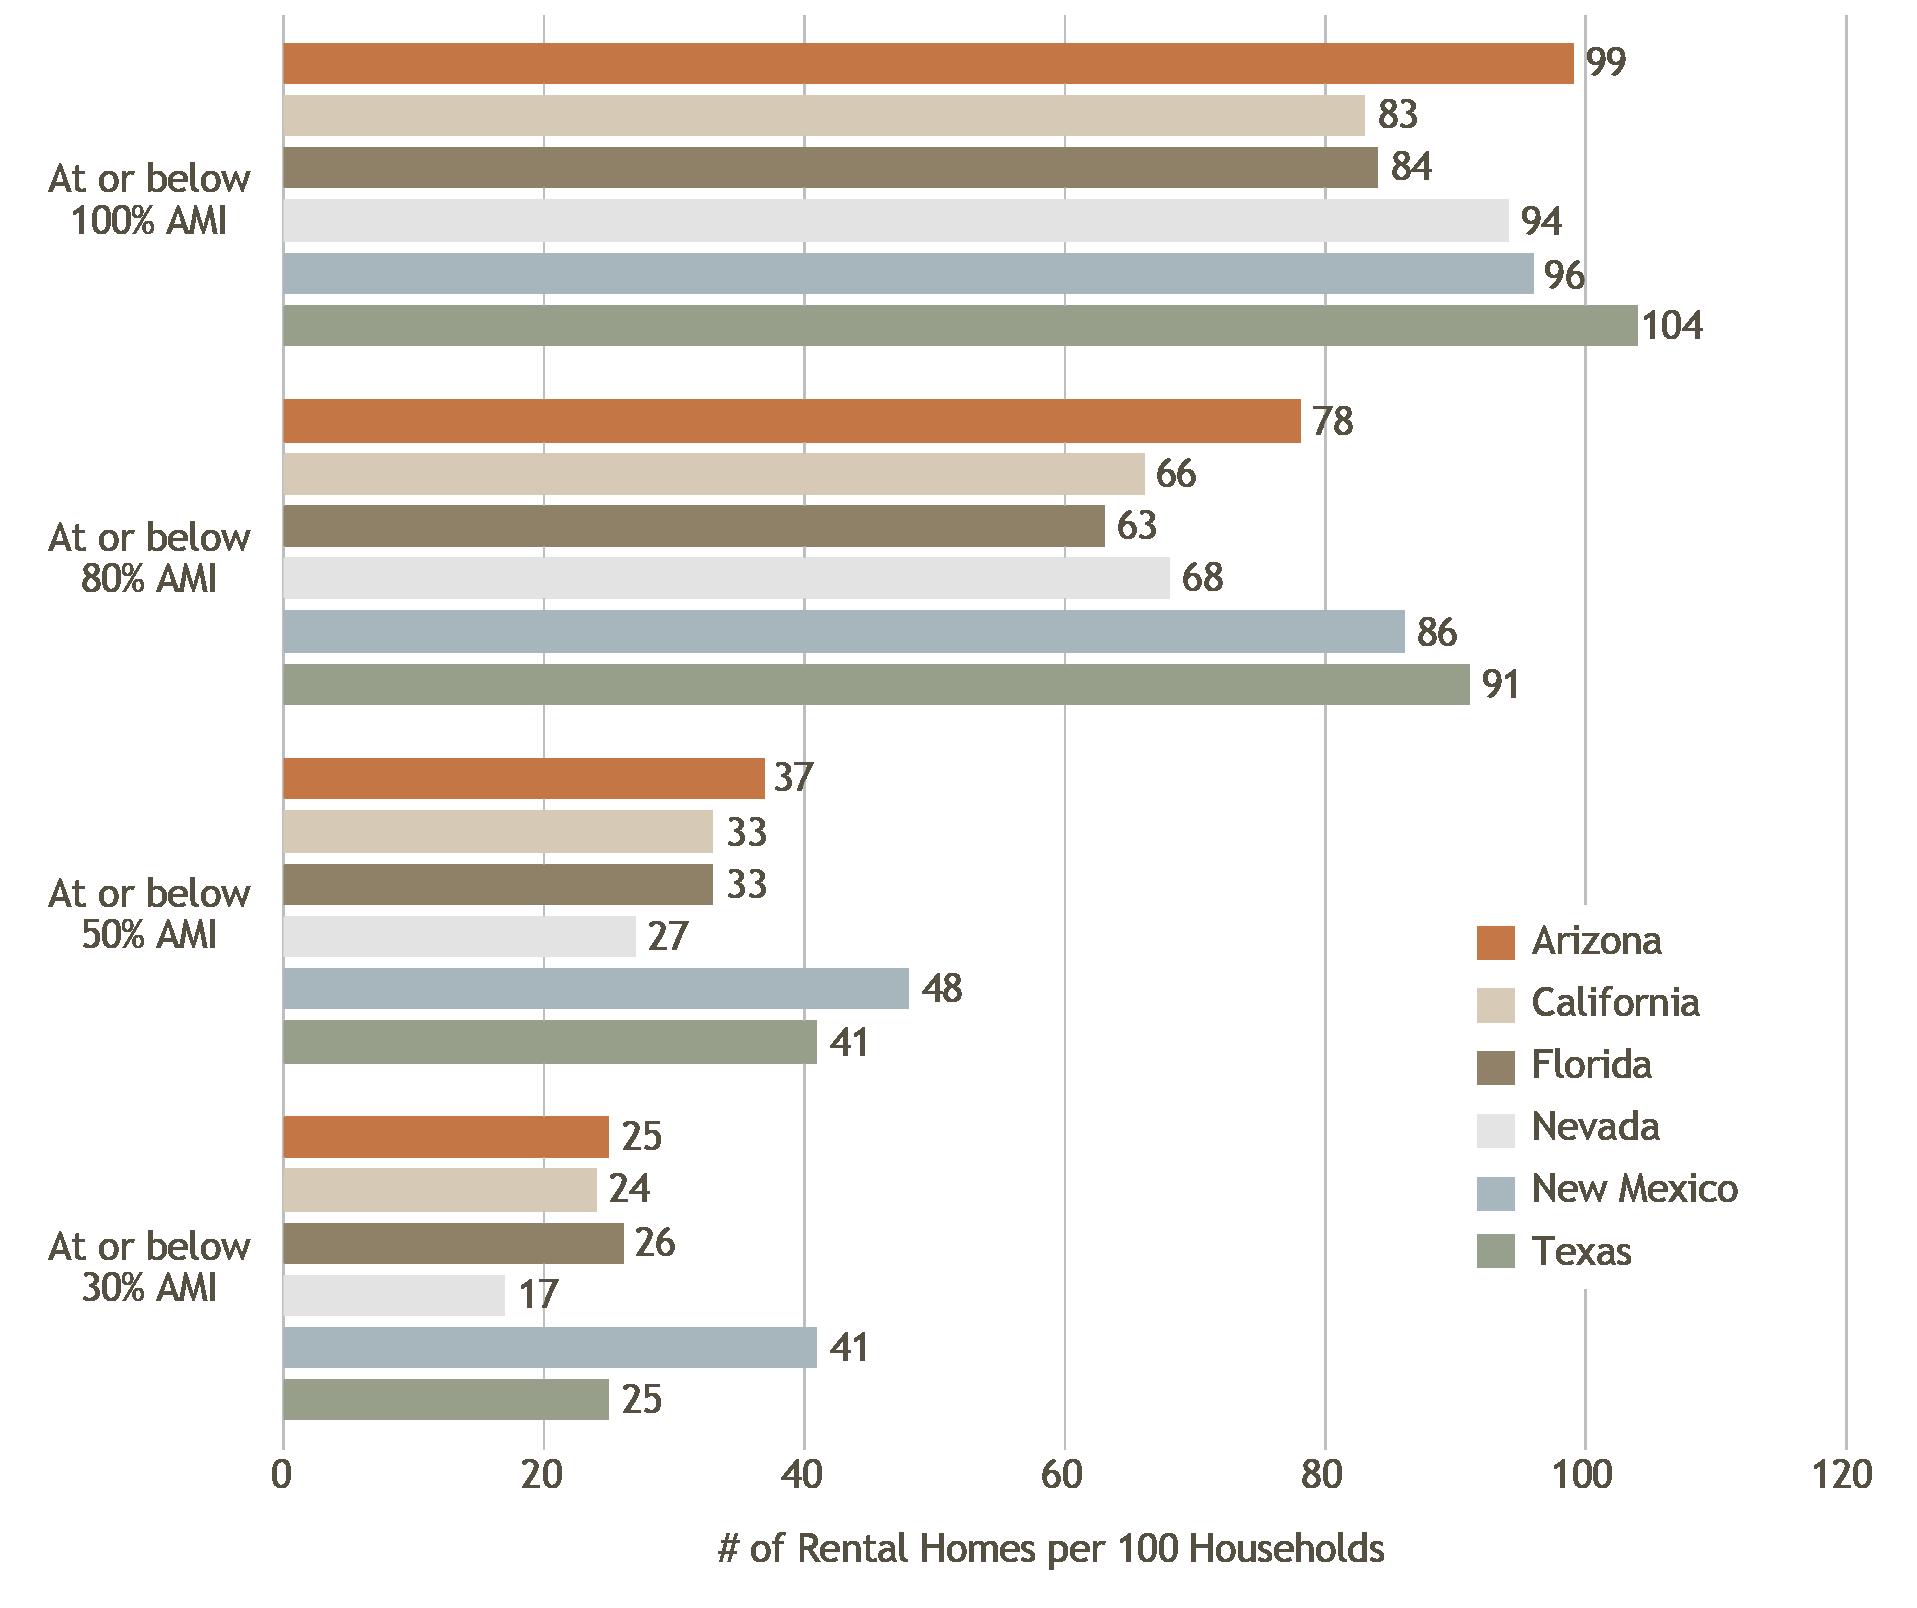
In Arizona, there are 99 affordable and available homes for every 100 households at or below 100% of the area median income (AMI; Figure 28).88 However, the number of affordable and available homes decreases as household incomes decrease. Among renters making at or below 80% AMI, there are only 78 homes for every 100 households. The number of homes drops to 37 for those making 50% or below the AMI, and 25 for extremely low-income households (30% or below the AMI). In 2023, Arizona had a deficit of 138,227 affordable and available rental homes for extremely low-income households (making 30% or below of the AMI) and a shortage of 198,422 homes for low-income households (at or below 50% AMI).89 Compared to its Sun Belt peers, Arizona has more homes available to extremely low-income households than California and Nevada.90
Figure 28. Affordable and Available Rental Homes per 100 Households at or Below Threshold by State
Source: NLIHC, The Gap Report, 2025
PUBLICLY-SUBSIDIZED HOUSING IS AT RISK OF EXPIRING
In February 2025, Arizona had 48,387 federally subsidized homes which were required to be rented at affordable prices.91 Federally subsidized housing usually maintains its affordability through 15- or 30-year agreements between private property owners and the federal government. While the private owners of these homes have the option of renewing their contracts and subsidies after that period to maintain affordability, they are not required to do so. Many owners return their homes to standard, unsubsidized rentals, since they may be more profitable on the open market than in a federal housing program. For landlords, rising rents often disincentivize participation in subsidized housing programs, reducing affordable rental housing stock during periods when renters already face increasing pressure in the housing market.
Arizona’s current landscape of high rent prices and relatively low vacancy rates may further encourage owners of rental homes to leave affordable housing programs and take advantage of a housing market that favors owners renting homes at more profitable market rates. Of Arizona’s nearly 50,000 subsidized homes, almost 4,186 have federal contracts that will expire in the next 5 years, and only 732 are renewable.92 Close to 20,000 homes will expire in the next 15 years.93 To counter the loss of subsidized affordable housing as private owners transition properties to market rents, new federally subsidized homes must be added at the same, or even faster pace than currently subsidized units expire. The homes that transition out of the subsidized programs often become naturally occurring affordable housing but tend to be affordable for middle-income rather than low-income households.94
Walkability and Housing Affordability95
Walkable neighborhoods play a significant role in households’ opportunity, including social, economic, and health outcomes, but not everyone has equal access to them.96 Historically disadvantaged populations, such as communities of color or low-income residents, have been concentrated in areas with low walkability, with fewer sidewalks, lower connectivity, and limited transit options.97
This research specifically explores the question: Who gets access to walkable neighborhoods, and how does current affordable housing policy support or undermine that access? We investigate how walkability and affordability intersect across six of the United States’ most populous cities: New York City, Los Angeles, Chicago, Houston, Phoenix, and Philadelphia. This study uses data from the LowIncome Housing Tax Credit (LIHTC) program, the largest source of federally subsidized housing in the U.S. and responsible for more than 3.65 million homes, to analyze the locations of affordable housing developments.98 For the purposes of this study, affordable or subsidized housing refers specifically to properties funded through the LIHTC program.
The results show that selected demographic variables were predictors of both walkability and subsidized housing status. Statistical analysis of the presence of federally subsidized housing indicated that the likelihood of a tract containing affordable housing projects is significantly associated with higher poverty rates and greater density, with variation across cities. Across all cities studied, subsidized housing was more concentrated in poorer communities. Cities were also more likely to be walkable where subsidized housing projects were present, while a higher percentage of residents over the age of 65 was associated with decreased walkability and a lower likelihood of containing subsidized housing.
In Phoenix, population density and walkability go hand-in-hand, as population density is more strongly associated with walkability than in other cities investigated. Overall, Phoenix was less walkable than other cities, but affordable housing is more likely to be in more walkable areas. Neighborhoods with higher proportions of married individuals in Phoenix were more likely to have lower walkability.
Our findings suggest that despite long-standing legal efforts to promote a more equitable distribution of subsidized housing; racial and ethnic disparities persist. In Phoenix, which has undergone rapid growth that has reshaped the housing landscape, subsidized developments remain largely concentrated in low-income areas.99 While affordable housing developments are often located in relatively walkable areas, further investment is necessary to bring infrastructure and accessibility in line with the standards seen in major urban centers.
These findings highlight the need to incorporate walkability into Arizona’s affordable housing planning, including investments in sidewalks, transit, and street connectivity which can help shape equitable access to affordable housing. Collaboration between housing and transportation professionals and departments in Arizona is critical to addressing these challenges.
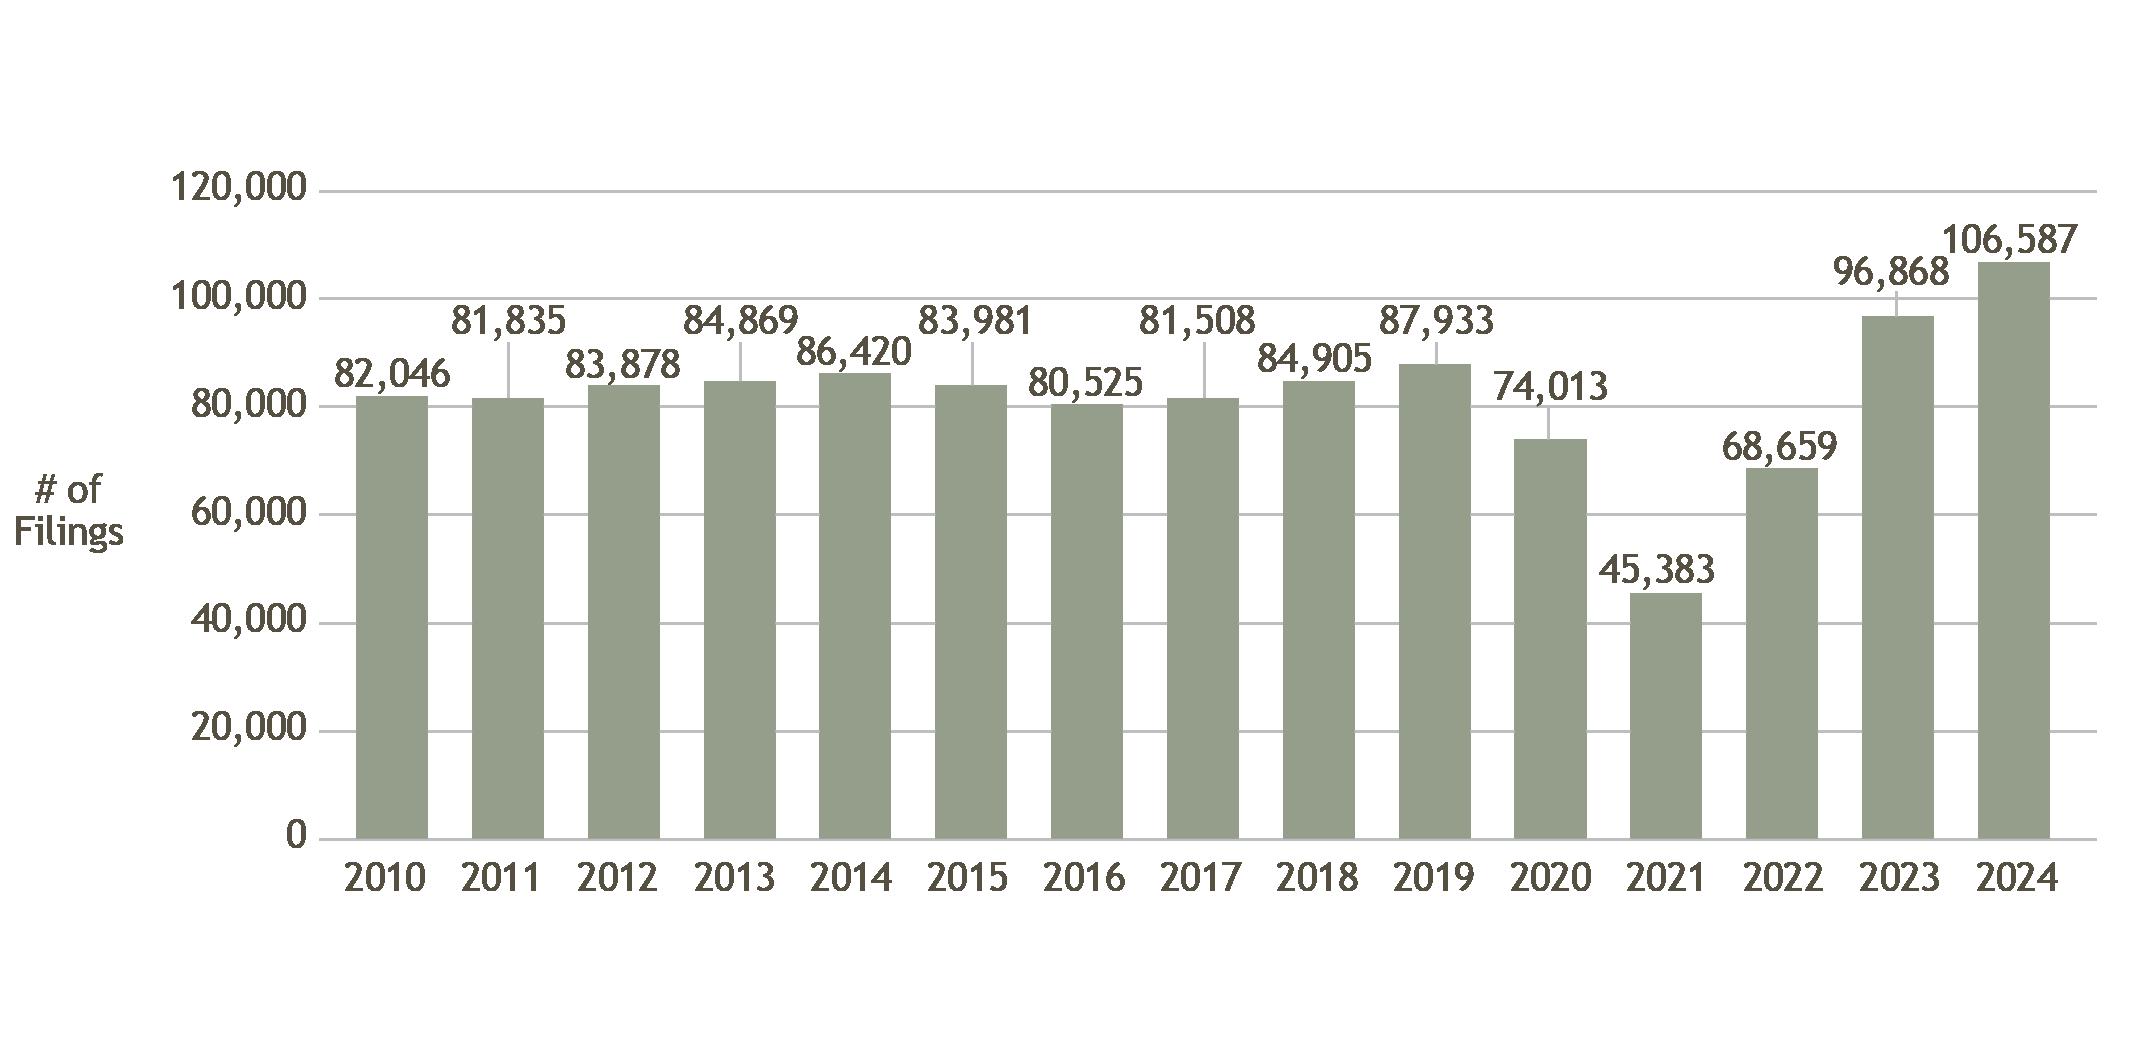
EVICTION FILINGS HAVE RISEN RAPIDLY SINCE MORATORIUMS EXPIRED
Eviction filings have increased substantially every year since the COVID-19 pandemic eviction moratorium expired in 2021.100 The number of eviction filings in Arizona reached its highest level (106,587) in 2024 since 2005, when data recording began through the Arizona Supreme Court (Figure 29).101 This represents a further 10% increase from 2023, which set the previous record for number of eviction filings.102 Maricopa County accounted for 87,197 of total eviction filings in the state in 2024, the highest number of evictions recorded.103 Research also suggests that informal eviction—or households choosing to leave their homes to avoid a formal eviction or because of the threat of an eviction filing, or other mechanisms such as landlords changing locks— is more common than a completed eviction judgement.104 Due to the prevalence of informal evictions, eviction filings likely underestimate true rates of housing loss, even though not all eviction filings lead to a finalized eviction.105
Source: AZ Justice Court, Eviction Filings by Fiscal Year and County, 2024
Homelessness
MORE ARIZONANS ARE EXPERIENCING HOMELESSNESS THAN EVER BEFORE
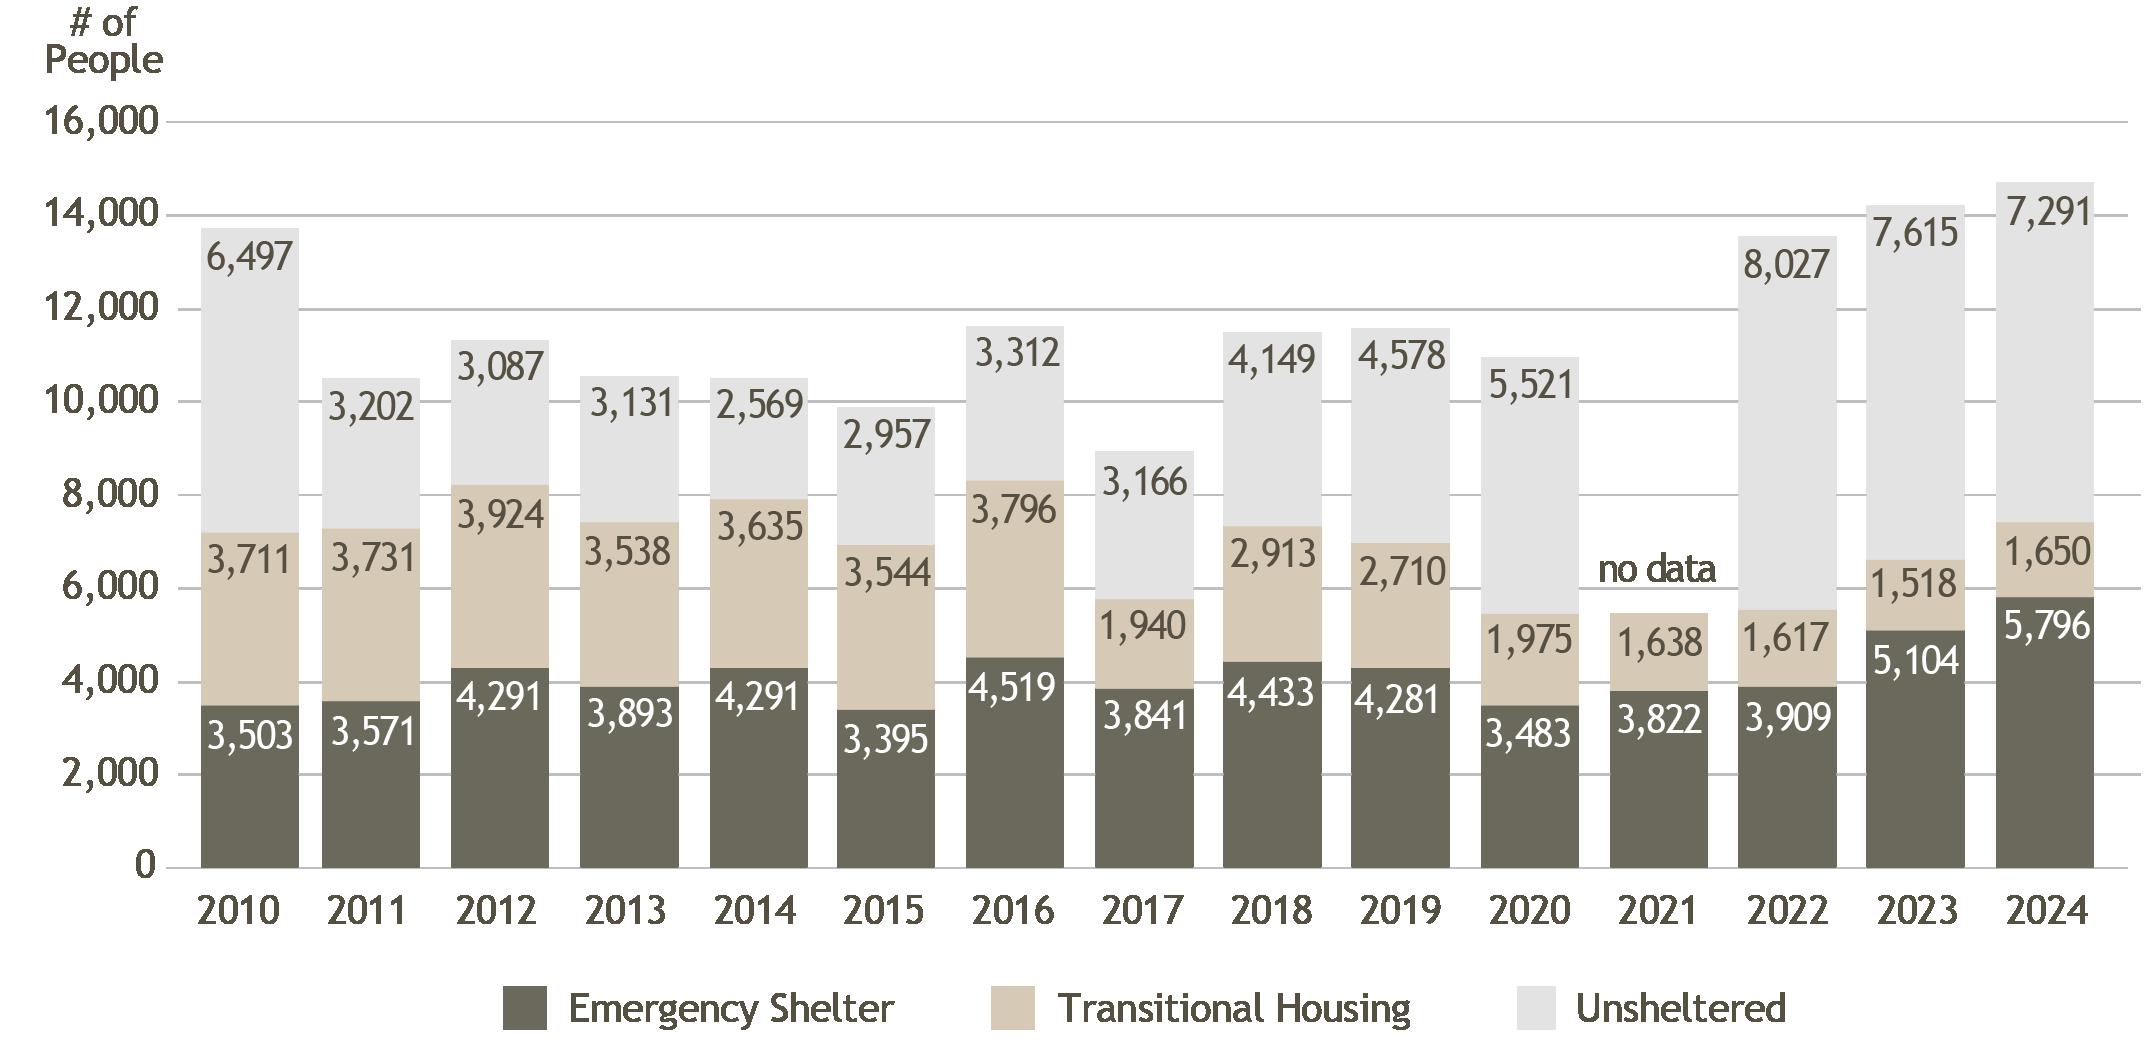
One of the most damaging consequences of unaffordable housing is homelessness. Both nationally and in Arizona, levels of homelessness reached an all-time high in 2024.106 According to the Point-In-Time (PIT) count coordinated by the US Department of Housing and Urban Development (HUD), 14,737 people experienced homelessness in Arizona in 2024. This number comprises 11,640 individuals and 3,097 people in families with children.107 It is important to note that PIT count data only measures those individuals who were counted on a single night in January 2024 and is broadly understood to undercount overall homelessness in communities. Of these individuals, approximately 7,291 (49%) were unsheltered.108 Since 2023, the share of sheltered unhoused has improved slightly, increasing from 47% to 51%. More alarmingly, however, the number of families with children experiencing homelessness increased by 15% between 2023 and 2024, reaching 21% of the total unhoused population in 2024.109 The number of unhoused Arizonans has fluctuated over time, but data indicates that it has been increasing since 2017, with a notable yearly increase since 2022 (Figure 30).
30. Unhoused Persons Over Time, Sheltered and Unsheltered, 2010-2024
Source: HUD, Continuum of Care Population and Subpopulations Reports, 2010-2024
In 2024, Arizona’s Continuum of Care Homeless Assistance Programs supported 5,796 individuals through emergency shelters and 1,650 individuals through transitional housing. However, nearly half (7,291) of individuals remained unsheltered.110
A MAJORITY OF ARIZONA’S UNHOUSED ARE MEN
Nearly twice as many men as women experienced homelessness in Arizona in 2024. In total, 9,325 men, 5,284 women, and 128 people with nonbinary gender identities were represented in the 2024 PIT count.111 Men comprise just under 50% of Arizona’s population but represent approximately 63% of individuals experiencing homelessness. While more unhoused men were counted in emergency shelters and transitional housing than women (57% and 59% of respective totals), only 46% of unhoused men in total were sheltered, compared to 59% of women and 45% of nonbinary individuals. Among those who are unsheltered, this gap is even more evident. The number of unsheltered men (5,071) is more than double that of women (2,149).112
ARIZONA HAS SEEN AN INCREASE IN UNHOUSED CHILDREN
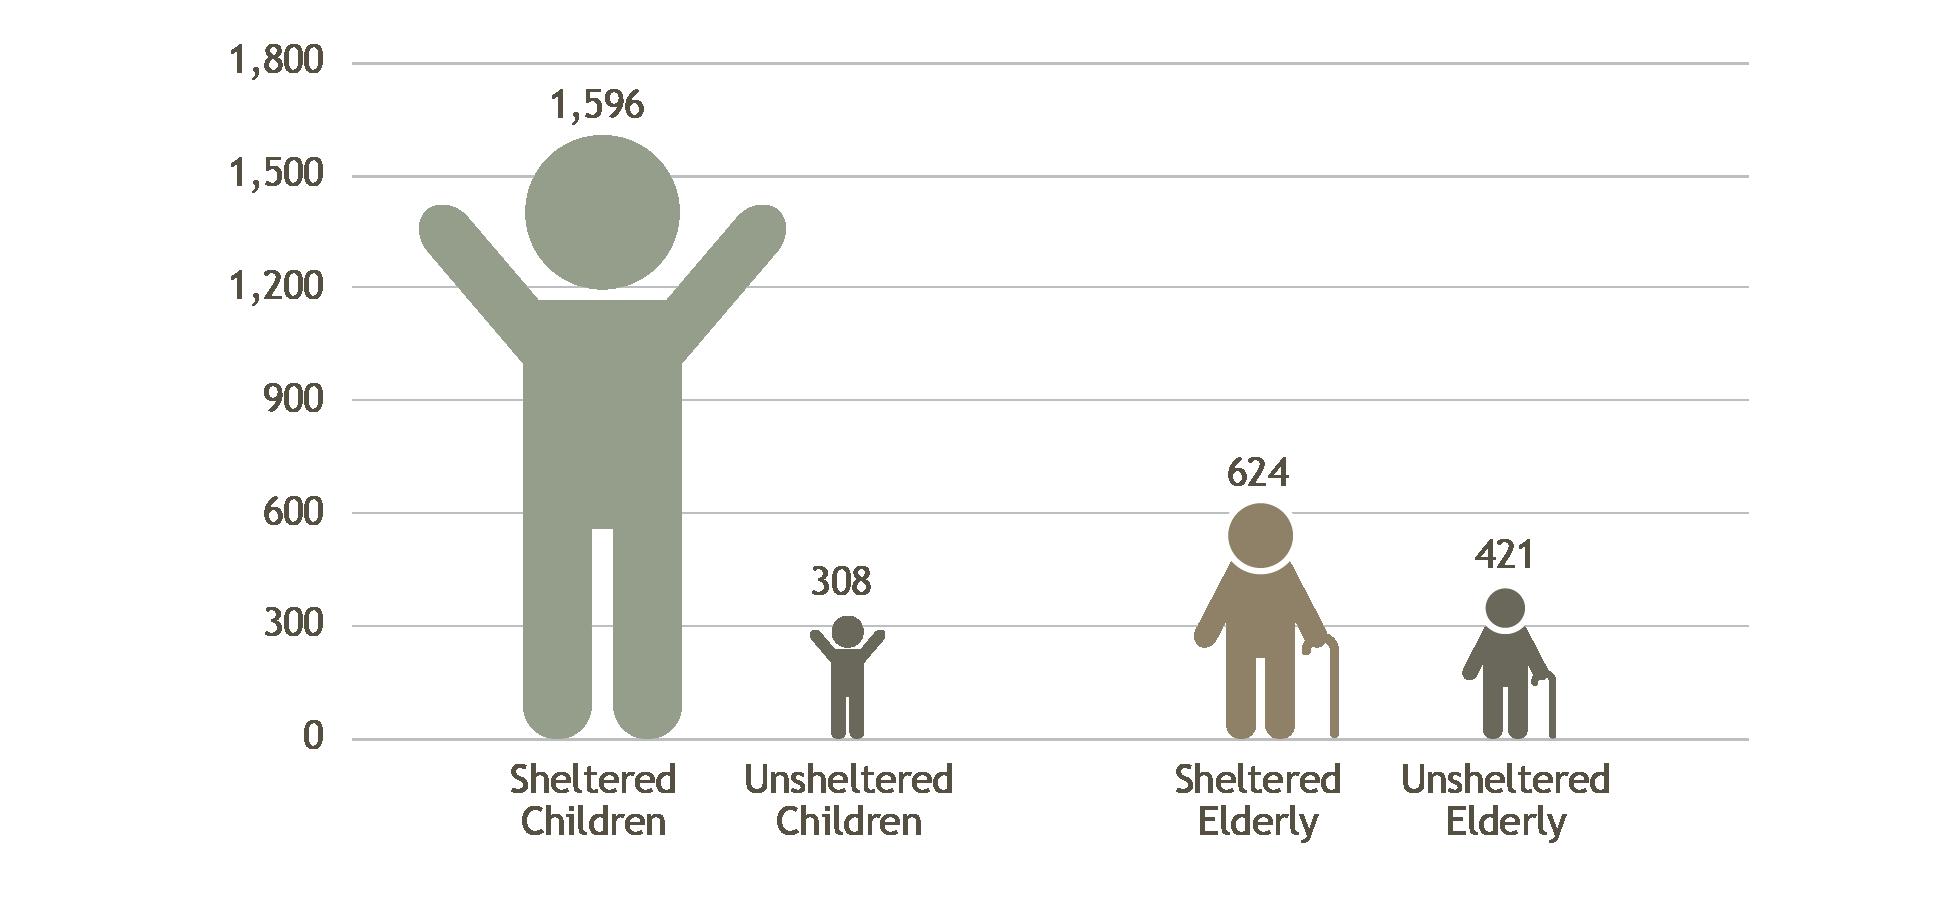
According to the 2024 PIT count, there were 319 more unhoused children in Arizona than in 2023. In 2024, 13% (1,904) of all unhoused individuals in Arizona were children (under 18). Most children (1,210) were in emergency shelters, 386 were in transitional shelters, and 308 were unsheltered (Figure 31).113 Unhoused children were present in 102 chronically homeless households, and 46 homeless children were unaccompanied by a parent or guardian at the time of the 2024 PIT count.114
Between 2017 and 2024, Arizona saw a 42% increase in homelessness among unaccompanied youth, including children under 18 and young adults under 24 (Table 1). Arizona had the highest increase in this category across the Sun Belt comparison states.115 In 2024, there were 775 unaccompanied homeless youth ages 18-24 in Arizona.116
Figure
Table 1. Increases in Homeless Unaccompanied Youth (Age 24 and Younger)
Source: HUD, Continuum of Care Population and Subpopulations Reports, 2017, 2024
According to data collected by the U.S. Department of Education’s Office of Elementary and Secondary Education, a total of 19,365 unhoused students were enrolled in pre-K-12 schools across Arizona during the 2022-2023 school year. Of these students, 44% (8,588) were in grades pre-K-5, or under 12 years old. Nearly half, or 49% (9,455), of students experiencing homelessness were Hispanic or Latino.117 While the PIT count definition of homelessness does not include individuals who are temporarily housed in motels or staying with other people, under the McKinney-Vento Act, the Department of Education collects data on youth in these situations.118 As such, the vast majority of reported unhoused students were sheltered (97%). Another 13,726 (71%) were “doubled up,” 2,122 (11%) were living in hotels or motels, and 2,841 (15%) were in shelters or transitional housing.119
Homelessness early in life can increase risks of trauma and post-traumatic stress disorder, challenges with mental health, substance use, young parenting, victimization, and higher rates of early death compared to their stably housed peers.120
OLDER ADULTS ARE AT ELEVATED RISK FOR HOUSING INSECURITY
The point-in-time count measured 1,045 people aged 64 or older experiencing homelessness in Arizona in 2024, representing 7% of all unhoused people. Of these, 624 were sheltered (474 were in emergency shelters and 150 were in transitional housing), and 421 were unsheltered.121
In Maricopa County, the only Arizona county to disaggregate PIT count data by age group prior to 2023, the number of older adults experiencing homelessness has more than doubled since 2017. The County reported 177 unhoused individuals over the age of 62 in 2017, 62 of whom were in emergency shelters, 37 in transitional housing, and 78 were unsheltered.122 By 2024, Maricopa County reported 579 unhoused adults over the age of 64, marking a 227% increase in the state’s most populated county.123
Older adults may struggle to find housing among the limited supply that accommodates their mobility needs.124 Low-income older renters are at an elevated risk of homelessness as increasing rents become cost-prohibitive on a fixed income.125 Older adults may also be at higher risk of entering homelessness due to the onset of health issues or other traumatic events such as the death of a spouse.126 Homelessness can be especially detrimental and dangerous for older adults due to impacts on health caused by a lack of access to medical care and supplies. Accessibility needs may also make living in shelters more difficult given tight spaces and bunk sleeping arrangements.127
Source: HUD, Continuum of Care Population and Subpopulations Reports, 2024
HOMELESSNESS IS EXPERIENCED DISPROPORTIONATELY BY SOME
RACIAL GROUPS
Most of the unhoused population in Arizona is white, followed by Hispanic or Latino and Black or African American. However, homelessness is experienced disproportionately by some races in Arizona (Table 2). Black and African American individuals make up 5% of the state’s population but comprise 20% of unhoused individuals; American Indians and Alaska Natives make up 4% of the population but 7% of the unhoused population; and Native Hawaiians and Pacific Islanders make up 0.3% of the population but represent 1% of unhoused individuals.128 Conversely, white, Asian, and Hispanic or Latino individuals were all underrepresented relative to their proportion of the state’s population.129
Source: HUD, Continuum of Care Population and Subpopulations Reports, 2024; 2023 ACS 5yr Survey, Table DP05
Figure 31. Unhoused Children and Elderly in Arizona, 2024
Table 2. Homelessness by Race and Ethnicity, 2024
ADDITIONAL FACTORS SHAPING HOMELESSNESS
HUD collects additional descriptive information about people experiencing homelessness, highlighting various adverse experiences that impact them. In 2024, 16.5% (2,438) of unhoused people experienced serious mental illness, 17% (2,514) struggled with chronic substance abuse, and 8% (1,131) were victims of domestic violence. Another 3,840 Arizonans, or 26% of the unhoused population, were chronically homeless, defined by HUD as having a disability and experiencing homelessness for at least 12 months over the last three years as of 2024.130 Arizona is among the states with the largest recent increase in veterans experiencing homelessness. Between 2023 and 2024, there was a 6.7% increase in the number of unhoused veterans in our state. In 2024, 994 individuals experiencing homelessness were veterans.131
REGIONAL ACTIONS ARE TACKLING HOMELESSNESS
Arizona has three regional Continuums of Care (CoCs), which are groups comprising representatives of organizations such as nonprofits, victims’ services, governments, school districts, mental health agencies, and more, intended to serve unhoused individuals and report homelessness trends for their designated geographic area.
The Maricopa Regional Continuum of Care reports that Phoenix Metro and Maricopa County were home to the majority of unhoused individuals, at 64%, which is proportional to the percentage of the statewide population concentrated in the area.132 Another 14% were recorded by the Tucson and Pima County Continuum of Care, and 21% across the rest of the state. Maricopa County has the highest rate of providing shelter to its unhoused residents at 57%, while Tucson/Pima County CoC and the Balance of State CoC sheltered closer to 40%.133
Supportive housing pairs access to shelter with supportive services to assist unhoused individuals with finding housing stability and navigating complex challenges associated with homelessness. The total number of homes for supportive housing has increased slightly from 2023, by an additional 326 units (Table 3). Of all types of supportive housing, 60% were permanent supportive housing, with the rest in emergency shelters or transitional housing (see Appendix B: Glossary of Terms).
Source: HUD, Continuum of Care Housing Inventory Count, 2023 and 2024
Table 3. Existing Supportive Housing
Supportive housing services are coordinated through the CoCs, and the available supportive housing varies by area (Table 4). About 2,900 beds (13%) were available in Pima County, 15,200 (69%) in Maricopa County, and 4,100 (19%) in all other counties combined (or the remaining balance of the state).134
Table 4. Homelessness and Supportive Housing by Area, 2024
Source: HUD, Continuum of Care Population and Subpopulations Reports, 2024
Arizona’s Department of Economic Security, in partnership with the Governor’s Interagency and Community Council on Homelessness (GICCH), has invested planning and funding support to better connect vulnerable Arizonans with resources to prevent homelessness. This includes allocating contracts to programs across 11 of Arizona’s 15 counties, including 16 emergency shelter programs, 6 street outreach programs, 12 rapid rehousing programs, and 10 homelessness prevention programs.135
The Maricopa Regional Continuum of Care (MRCoC) has worked to improve assessment and data exchange mechanisms, focusing on increasing transitions from shelters into permanent supportive housing. During 2024, over 50 individuals with experiences of domestic violence have utilized MRCoC’s new Coordinated Entry System, a tool to assess and provide access to appropriate resources, to connect them to permanent housing. Over 20 participants in MRCoC’s “Moving On” initiative, in partnership with Public Housing Authorities, have been able to transition into mainstream housing subsidies, such as Housing Choice Vouchers.136
The Tucson-Pima Collaboration to End Homelessness (TPCH) has focused its efforts on connecting unsheltered individuals living in encampments directly to weekly case conferencing and individually tailored services to stabilize them in permanent housing. Thus far, TPCH has successfully housed over 60 participants and aims to serve at least 100 households with this initiative. TPCH is also working to improve the equity of its referral process for housing opportunities to reach more of the unhoused population.137
The Arizona Department of Housing (ADOH) and the Balance of State Continuum of Care (BOSCOC) are working to increase resource capacity in rural regions of Arizona that are under greater strain for lack of affordable housing inventory. Additionally, their work has focused on the disproportionate need for services for individuals exiting corrections, healthcare, and foster care institutions.138
Appendix A: Approach
Data
Data used for this report is largely from publicly available sources, which are cited throughout. Researchers tried to show trends that went back to 2010 (when relevant American Community Survey (ACS) Data became available) and up to the most recent data available. In 2020, the American Community Survey did not meet its sampling requirements for full publication, so these data are missing.
Demographic categories used reflect those in the U.S. Census and the ACS data. Categories that reflect a change in data collection and prevent trend comparisons (e.g., “two or more races” and “some other race”) are excluded.
Comparison States
It is often helpful to compare Arizona data to peer states to get a sense of how other states are changing relative to Arizona. The five peer states selected for comparison in this report are Florida, Nevada, New Mexico, California, and Texas. These states were selected because they have the highest percentage of Hispanic or Latino populations in the U.S., and all are in the West, Southwest, and Sun Belt areas.184 Hispanic or Latino populations are important to track for housing data because they are driving population growth in much of the country, and they have distinct socioeconomic characteristics from other groups.185
Appendix B: Glossary of Terms
Accessory Dwelling Unit (ADU): A smaller, independent home located on the same property as another stand-alone unit. Commonly referred to as backyard homes, casitas, granny flats, or accessory apartments.
Affordable housing: Housing that costs 30% or less of household income.
Area Median Income (AMI): The midpoint of income across all households within a region, often the metropolitan statistical area (MSA) or county, defined by the U.S. Department of Housing and Urban Development (HUD).
Cost burden: Households that spend more than 30% of their income on housing costs are considered cost burdened.
Fair Market Rent: Rent that is calculated at the 40th percentile of gross rents for standard quality, non-subsidized units in a housing market.
Manufactured or mobile home: A manufactured home is defined as a movable dwelling, 8 feet or more wide and 40 feet or more long, designed to be towed on its own chassis, with transportation gear integral to the unit when it leaves the factory, and without need of a permanent foundation. These homes are built in accordance with the U.S. Department of Housing and Urban Development (HUD) Manufactured Home Construction and Safety Standards, or “HUD Code,” established in 1976. Mobile homes, while commonly used to describe all manufactured housing, is a term for homes built prior to the HUD Code.186
Market rate: Price for housing based on existing market values and demand. This housing does not rely on subsidies or government assistance.
Multi-family housing: A dwelling designed to have separate homes in one building, such as a duplex, triplex, condominium, or apartment complex.
Net migration: The difference between the number of people moving to an area and the number of people leaving an area.
Regional price parities (RPPs): Regional Price Parities (RPPs) measure price level differences across states and metropolitan areas. They are calculated as a percentage relative to 100.0, which represents the national average. RPPs are calculated for “Goods,” “Services: housing,” “Services: utilities,” “Services: other,” and “all items” (also known as all goods and services). They allow researchers and economists to adjust median income levels for the cost of living across professions and make comparisons about buying power across states.
Safe Haven: A program that provides supportive housing for unhoused individuals with severe mental illness who have been unable to participate in other services. The Safe Haven program is no longer able to be expanded under federal law.
Sheltered homelessness: People who are living in shelters for the homeless (emergency shelters, safe havens, and transitional housing). Not included are people living “doubled up,” people in permanent supportive housing, or people who live in a conventional home and receive temporary assistance from the Homelessness Prevention and Rapid Re-housing Program (HPRP).187
Transitional Housing: Often a shelter that provides interim (6-24 months) housing and support to maintain permanent housing.
Unsheltered homelessness: People experiencing homelessness who do not have a regular place to sleep and instead sleep in places not designed for or ordinarily used as regular sleeping accommodations (e.g., abandoned buildings, train stations, on the street, garage, or shed).188
Endnotes
1 “Why We Care,” National Low Income Housing Coalition, accessed June 6, 2025, https://nlihc.org/explore-issues/why-wecare.
2 Raj Chetty, Nathaniel Hendren, and Lawrence F. Katz, “The Effects of Exposure to Better Neighborhoods on Children: New Evidence from the Moving to Opportunity Experiment,” American Economic Review, vol. 106, no. 4 (2016): 855–902 https:// doi.org/10.1257/aer.20150572; Matthew Desmond and Rachel Tolbert Kimbro, “Eviction’s Fallout: Housing, Hardship, and Health,” Social Forces, vol. 94, no. 1 (2015): 295–324, https://doi.org/10.1093/sf/sov044.
3 “Table S2503: Financial Characteristics,” U.S. Census Bureau, American Community Survey 1-Year Estimates, accessed May 2025, https://data.census.gov/table/ACSST1Y2023.S2503?g=040XX00US04.
4 “Housing Underproduction in the U.S.,” Up for Growth, 2022, https://upforgrowth.org/apply-the-vision/housingunderproduction/.
5 Bill Ryan, Karina Ward, and Kellie Pederson, “Evaluating Housing Opportunities,” Community Economic Development Division of Extension, University of Wisconsin-Madison, March 2022, https://economicdevelopment.extension.wisc.edu/ articles/evaluating-housing-opportunities/#:~:text=Population%20and%20Households.,households%20including%20size%20 and%20type.
6 Martha Farnsworth Riche, “How Changes in the Nation’s Age and Household Structure Will Reshape Housing Demand in the 21st Century,” Issue Papers on Demographic Trends Important to Housing, U.S. Department of Housing and Urban Development, Office of Policy Development and Research, February 2003, https://www.huduser.gov/portal//Publications/ PDF/demographic_trends.pdf
7 Martha Farnsworth Riche, “How Changes in the Nation’s Age and Household Structure Will Reshape Housing Demand in the 21st Century,” Issue Papers on Demographic Trends Important to Housing, U.S. Department of Housing and Urban Development, Office of Policy Development and Research, February 2003, https://www.huduser.gov/portal//Publications/ PDF/demographic_trends.pdf.
8 Arizona Office of Economic Opportunity, Population Estimates, 2010-2023 (July 2024), https://oeo.az.gov/population/ estimates
9 U.S. Census Bureau, American Community Survey 1 Year Estimates, 2010-2023, State-to-State Migration Flows (2024), https://www.census.gov/data/tables/time-series/demo/geographic-mobility/state-to-state-migration.html .
10 “Table 4: Cumulative Estimates of the Components of Resident Population Change for the United States, Regions, States, and Puerto Rico: April 1, 2010 to July 1 2019,” U.S. Census Bureau (2019), https://www2.census.gov/programs-surveys/ popest/tables/2010-2019/state/totals/nst-est2019-04.xlsx; U.S. Census Bureau, Annual and Cumulative Estimates of the Components of Resident Population Change for the United States, Regions, States, District of Columbia, and Puerto Rico: April 1, 2020 to July 1 2024, (2024), https://www2.census.gov/programs-surveys/popest/tables/2020-2024/state/totals/ NST-EST2024-COMP.xlsx
11 Mike Noble, “Arizona Voters Fed Up with Soaring Housing Costs,” Noble Predictive Insights, March 4, 2025, https://www. noblepredictiveinsights.com/post/arizona-voters-fed-up-with-soaring-housing-costs.
12 Arizona Office of Economic Opportunity, Population Estimates, 2010-2023 (July 2024), https://oeo.az.gov/population/ estimates.
13 “Table DP04: Selected Housing Characteristics,” U.S. Census Bureau, American Community Survey 1-Year Estimates, 20102023, accessed December 2024, https://data.census.gov/table?q=dp04&g=040XX00US04
14 “Table DP05: ACS Demographic and Housing Estimates,” U.S. Census Bureau, American Community Survey 1-Year Estimates, 2010-2023, accessed December 2024, https://data.census.gov/table?q=dp05&g=040XX00US04.
15 U.S. Census Bureau, Censuses of American Indians (August 14, 2024), https://www.census.gov/about/history/censusrecords-family-history/census-records/censuses-of-american-indians.html#:~:text=Despite%20being%20the%20original%20 inhabitants,from%20enumeration%20in%20the%20census; Alek Zeymo,“Urban American Indian Undercount in the 2020 Census Went Underreported,” National Council of Urban Indian Health, August 28, 2023, https://ncuih.org/2023/08/28/ urban-american-indian-undercount-in-the-2020-census-went-underreported/ .
16 “Census 2020: Why and How to Be Counted as a Native American,” Potawatomi Nation, August 28, 2019, https://www. potawatomi.org/blog/2019/08/28/census-2020-why-and-how-to-be-counted-as-a-native-american/ ; Deborah Stempowski, “Counting Every Voice: Understanding Hard-to-Count and Historically Undercounted Populations,” U.S. Census Bureau, November 7, 2023, https://www.census.gov/newsroom/blogs/random-samplings/2023/10/understanding-undercountedpopulations.html.
17 “Table DP05: ACS Demographic and Housing Estimates,” U.S. Census Bureau, American Community Survey 1-Year Estimates, 2010-2023, accessed December 2024, https://data.census.gov/table?q=dp05&g=040XX00US04
18 “Table DP05: ACS Demographic and Housing Estimates,” U.S. Census Bureau, American Community Survey 1-Year Estimates, 2010-2023, accessed December 2024, https://data.census.gov/table?q=dp05&g=040XX00US04.
19 “Methodology for Regional Price Parities,” U.S. Bureau of Economic Analysis, April 2023, https://www.bea.gov/system/ files/methodologies/Methodology-for-Regional-Price-Parities_0.pdf.
20 “Methodology for Regional Price Parities,” U.S. Bureau of Economic Analysis, April 2023, https://www.bea.gov/system/ files/methodologies/Methodology-for-Regional-Price-Parities_0.pdf.
21 Elif Sen and Adam Scavette, “Regional Spotlight: Purchasing Power Across the U.S.,” Federal Reserve Bank of Philadelphia, https://www.philadelphiafed.org/-/media/FRBP/Assets/Economy/Articles/economic-insights/2017/q4/rs_purchasingpower.pdf.
22 “Regional Price Parities, Annual: Regional Price Parities by State,” Federal Reserve Bank of St. Louis, December 12, 2024, https://fred.stlouisfed.org/release/tables?rid=403&eid=233639#snid=233653
23 “Methodology for Regional Price Parities,” U.S. Bureau of Economic Analysis, April 2023, https://www.bea.gov/system/ files/methodologies/Methodology-for-Regional-Price-Parities_0.pdf
24 “Regional Price Parities, Annual: Regional Price Parities by State,” Federal Reserve Bank of St. Louis, December 12, 2024, https://fred.stlouisfed.org/release/tables?rid=403&eid=233639#snid=233653.
25 “Table DP05: ACS Demographic and Housing Estimates,” U.S. Census Bureau, American Community Survey 5-Year Estimates, 2019-2023, accessed December 2024, https://data.census.gov/table?q=dp05&g=040XX00US04.
26 “Comparison of Development Costs: Multi-Family & Single-Family Housing,” City of Detroit, Housing & Revitalization Department, March 21, 2025, https://detroitmi.gov/sites/detroitmi.localhost/files/2025-05/Multi%20%26%20Single%20 Fam%20Dev%20Cost%20Report%20%282025%29.pdf.
27 “Table DP04: Selected Housing Characteristics,” U.S. Census Bureau, American Community Survey 1-Year Estimates, 20102023, accessed December 2024, https://data.census.gov/table?q=dp04&g=040XX00US04.
28 “Permits by State,” U.S. Census Bureau, Building Permits Survey, 2010-2024, accessed May 2025, https://www.census.gov/ construction/bps/index.html
29 Alex Veiga, “2024 US home sales hit lowest level in nearly 30 years with ownership increasingly out of reach,” AP News, January 24, 2025, https://apnews.com/article/housing-home-sales-real-estate-home-pricesb7645724538b7a860c1d739e8b05380d.
30 Bob Christie and Howard Fischer, “Hobbs wants Arizonans, not investors, to benefit from ‘Starter Homes Act’,” Arizona Capital Times, March 10, 2025, https://azcapitoltimes.com/news/2025/03/10/hobbs-wants-arizonans-not-investors-tobenefit-from-starter-homes-act/; Richard Lawson, “Arizona’s Start Home push stalls amid local pushback,” The Builders Daily Policy, May 19, 2025, https://www.thebuildersdaily.com/arizonas-starter-home-push-stalls-amid-local-pushback/
31 Cotality (formerly Corelogic), Arizona Residential Sales, ARCHES calculations; To estimate investor purchases, for each year we estimated the share of all residential transaction purchased by non-individual buyers. Our method excludes any nonarms-length transactions, as well as transactions where the buyer was a Trust, government entity, I-Buyer (OpenDoor, etc.), or Home Builder. Our method does not capture residential investors who purchase properties in their own names.
32 “Table S2503: Financial Characteristics,” U.S. Census Bureau, American Community Survey 1-Year Estimates, accessed December 2024, https://data.census.gov/table?q=s2503&g=040XX00US04.
33 Chris Hess, Gregg Colburn, Ryan Allen, and Kyle Crowder, “Cumulative housing cost burden exposures and disadvantages to children’s well-being and health,” Social Science Research, vol. no. 119 (2024): 102984, https://doi.org/10.1016/j. ssresearch.2024.102984; Meghan Jenkins Morales and Stephanie A. Robert, “Housing cost burden and health decline among low-and moderate-income older renters,” The Journals of Gerontology: Series B 77, no. 4 (2022): 815-826, https://doi. org/10.1093/geronb/gbab184; Gum-Ryeong Park, Michel Grignon, Marisa Young, and James R. Dunn, “The association between housing cost burden and avoidable mortality in wealthy countries: cross-national analysis of social and housing policies, 2000-2017,” J Epidemiol Community Health vol. 77, no. 2 (2023): 65-73, https://doi.org/10.1136/jech-2022219545; Shomon Shamsuddin and Colin Campbell, “Housing cost burden, material hardship, and well-being,” Housing Policy Debate vol. 32, no. 3 (2022): 413-432, https://doi.org/10.1080/10511482.2021.1882532
34 Amira Abboud and Kimberly Winson-Geideman, “When the Smoke Clears: What Wildfires Cost Homeowners in Coconino County,” Arizona Research Center for Housing Equity and Sustainability, 2025, Working paper.
35 Patricia Born and W. Kip Viscusi, “The Catastrophic Effects of Natural Disasters on Insurance Markets,” Journal of Risk and Uncertainty, vol. 33, no. 1/2 (2006):55–72, https://doi.org/10.1007/s11166-006-0171-z.
36 Cotality (formerly Corelogic), Arizona Housing Data, ARCHES calculations.
37 Note: Calculated using the Zillow Home Value Index (ZHVI) which is a measure of the typical home value and market changes across a given region and housing type. It reflects the typical value for homes in the 35th to 65th percentile range. Also smoothed and seasonally adjusted; “ZHVI All Homes (SFR, Condo/Co-op) Time Series, Smoothed, Seasonally Adjusted ($),” Zillow Housing Data, accessed January 2025, https://www.zillow.com/research/ data/?msockid=3b31736dfb4e62cd18806790fa3163e7.
38 “ZHVI All Homes (SFR, Condo/Co-op) Time Series, Smoothed, Seasonally Adjusted ($),” Zillow Housing Data, accessed January 2025, https://www.zillow.com/research/data/?msockid=3b31736dfb4e62cd18806790fa3163e7.
39 “ZHVI All Homes (SFR, Condo/Co-op) Time Series, Smoothed, Seasonally Adjusted ($),” Zillow Housing Data, accessed January 2025, https://www.zillow.com/research/data/?msockid=3b31736dfb4e62cd18806790fa3163e7.
40 “Primary Mortgage Market Survey,” Freddie Mac, accessed December 2024, https://www.freddiemac.com/pmms; Note: rate from the last week of December each year.
41 Andrew Haughwout, Donghoon Lee, Daniel Mangrum, Joelle Scally, and Wilbert can der Klaauw, “The Great Pandemic Mortgage Refinance Boom,” Federal Reserve Bank of New York, May 15, 2023, https://libertystreeteconomics.newyorkfed. org/2023/05/the-great-pandemic-mortgage-refinance-boom/.
42 Note: The lock-in effect is defined as: “the disincentive for existing homeowners to sell their homes because their current mortgage rate is well below current market rates,”: Mark Palin and Rachel Zimmerman, “Lock-in Effect Not the Only Reason for Housing Supply Woes,” Fannie Mae, October 30, 2023, https://www.fanniemae.com/research-and-insights/perspectives/ lock-effect-not-only-reason-housing-supply-woes
43 “Table 4: Homeowner Vacancy Rate by State,” Housing and Vacancy Surveys, U.S. Census Bureau, 2025, https://www. census.gov/housing/hvs/data/prevann.html; Jonathan Spader, “Homeowner and Rental Vacancy Rates Declined During the Covid-19 Pandemic,” U.S. Census Bureau, May 12, 2022, https://www.census.gov/library/stories/2022/05/housing-vacancyrates-near-historic-lows.html.
44 Note: Calculated using the Zillow Home Value Index (ZHVI) which is a measure of the typical home value and market changes across a given region and housing type. It reflects the typical value for homes in the 35th to 65th percentile range. Also smoothed and seasonally adjusted; “ZHVI All Homes (SFR, Condo/Co-op) Time Series, Smoothed, Seasonally Adjusted ($),” Zillow Housing Data, accessed January 2025, https://www.zillow.com/research/ data/?msockid=3b31736dfb4e62cd18806790fa3163e7; “Table S2503: Financial Characteristics,” U.S. Census Bureau, American Community Survey 1-Year Estimates, accessed December 2024, https://data.census.gov/table?q=s2503&g=040XX00US04.
45 “Table B25003 (A-D, I): Tenure,” U.S. Census Bureau, 2023 American Community Survey 1-Year Estimates, accessed December 2024, https://data.census.gov/table?q=B25003:+Tenure&g=040XX00US04.
46 Katie Gentry and Alison Cook-Davis, “A Brief History of Housing Policy and Discrimination in Arizona,” Morrison Institute for Public Policy, November 2021, https://morrisoninstitute.asu.edu/sites/default/files/a-brief-history-of-housing-policy-anddiscrimination-in-arizona-nov-2021.pdf.
47 Alison Cook-Davis, et al., “Closing the Hispanic Homeownership Gap in Arizona: Insights from HUD Housing Counselors,” Arizona Research Center for Housing Equity and Sustainability, 2025, Working Paper.
48 “How Do Racial Inequities Limit Homeownership Opportunities?” Habitat for Humanity International, July 2021, https:// www.habitat.org/sites/default/files/documents/Research-series_Racial-inequities-and-homeownership-opportunities.pdf
49 “Housing Counseling Program Outcome Data Displays,” HUD Exchange, U.S. Department of Housing and Urban Development, accessed May 2025, https://www.hudexchange.info/programs/housing-counseling/9902/data-displays/.
50 Cotality (formerly CoreLogic), historical assessment records, ARCHES calculations; Residential properties owned by individuals; corporations, LLCs are excluded; defined primary residence if the property address and tax mailing address are the same.
51 Catherine Reagor, Juliette Rihl, and Kunle Falayi, “‘We are going to be homeless’: How mobile homeowners are being forced out in metro Phoenix,” Arizona Republic, Oct. 22, 2022, https://www.azcentral.com/story/news/local/ phoenix/2022/10/22/how-mobile-homeowners-being-forced-out-metro-phoenix/8064901001/
52 Jeanne Whalen, “Soaring mobile-home rents anger Arizona voters,” The Washington Post, March 11, 2024, https://www. washingtonpost.com/business/2024/03/11/mobile-home-rent-increase-arizona-biden-trump/
53 Jeanne Whalen, “Soaring mobile-home rents anger Arizona voters,” The Washington Post, March 11, 2024, https://www. washingtonpost.com/business/2024/03/11/mobile-home-rent-increase-arizona-biden-trump/.
54 Catherine Reagor, Juliette Rihl, and Kunle Falayi, “‘We are going to be homeless’: How mobile homeowners are being forced out in metro Phoenix,” Arizona Republic, Oct. 22, 2022, https://www.azcentral.com/story/news/local/ phoenix/2022/10/22/how-mobile-homeowners-being-forced-out-metro-phoenix/8064901001/ .
55 Jacob Heid, “Collective Ownership of Manufactured Housing Communities: One Answer to Arizona’s Hispanic Homeownership Gap?” Arizona Research Center for Housing Equity and Sustainability, 2025, Working paper.
56 “Table 3. Rental Vacancy Rates by State,” U.S. Census Bureau, Housing and Vacancy Surveys, accessed May 2025, https:// www.census.gov/housing/hvs/data/prevann.html
57 Note: Rental homes refer to all housing types (single family, duplexes, triplexes, quadplexes and apartment homes in buildings of 5+ units); “Table 3. Rental Vacancy Rates by State,” U.S. Census Bureau, Housing and Vacancy Surveys, accessed May 2025, https://www.census.gov/housing/hvs/data/prevann.html.
58 “Table B25064: Median Gross Rent (Dollars),” U.S. Census Bureau, American Community Survey 1-Year Estimates, accessed May 2025, https://data.census.gov/table/ACSDT1Y2023.B25064?g=040XX00US04
59 “Table S2503: Financial Characteristics,” U.S. Census Bureau, American Community Survey 1-Year Estimates, accessed May 2025, https://data.census.gov/table/ACSST1Y2023.S2503?g=040XX00US04.
60 “Table S2503: Financial Characteristics,” U.S. Census Bureau, American Community Survey 1-Year Estimates, accessed May 2025, https://data.census.gov/table/ACSST1Y2023.S2503?g=040XX00US04.
61 “Consumer Price Index for All Urban Consumers (CPI-U) - Energy in U.S. city average, all urban consumers, not seasonally adjusted, 2010 – 2024,” BLS Data Viewer, Bureau of Labor Statistics, https://data.bls.gov/dataViewer/view/timeseries/ CUUR0000SA0E.
62 “Table S2503: Financial Characteristics,” U.S. Census Bureau, American Community Survey 1-Year Estimates, accessed May 2025, https://data.census.gov/table/ACSST1Y2023.S2503?g=040XX00US04.
63 “Occupational Employment and Wage Statistics: Arizona,” US Bureau of Labor Statistics, accessed May 2025, https://data. bls.gov/oes/#/area/0400000
64 “Occupational Employment and Wage Statistics: Arizona,” US Bureau of Labor Statistics, accessed May 2025, https://data. bls.gov/oes/#/area/0400000; “Out of Reach: Arizona,” National Low Income Housing Coalition, 2024, https://nlihc.org/ oor/state/az.
65 “Occupational Employment and Wage Statistics: Arizona,” US Bureau of Labor Statistics, accessed May 2025, https://data. bls.gov/oes/#/area/0400000; “Out of Reach: Arizona,” National Low Income Housing Coalition, 2024, https://nlihc.org/ oor/state/az.
66 “Out of Reach: Arizona,” National Low Income Housing Coalition, 2024, https://nlihc.org/oor/state/az.
67 “Out of Reach: Arizona,” National Low Income Housing Coalition, 2024, https://nlihc.org/oor/state/az
68 “Out of Reach: Arizona,” National Low Income Housing Coalition, 2024, https://nlihc.org/oor/state/az.
69 “Out of Reach: Arizona,” National Low Income Housing Coalition, 2024, https://nlihc.org/oor/state/az.
70 Liza C. Kurtz and Alison Cook-Davis, “Hot at Home: Five Myths About Indoor Heat in Maricopa County,” Arizona Research Center for Housing Equity and Sustainability, 2025.
71 “Feedback from the Community on Cooling Centers: Maricopa County Cooling Center Evaluation 2023 Final Report,” Maricopa County Department of Public Health Epidemiology & Informatics, May 2024, https://www.maricopa.gov/ DocumentCenter/View/92026/Cooling-Center-General-Survey-Community-2023-Report .
72 Maricopa County Public Health Department, 2024, private communication; “Maricopa County Heat Morbidity Report 20062017,” Maricopa County Public Health, 2018, https://www.maricopa.gov/ArchiveCenter/ViewFile/Item/1373; “2018-2022 Heat Morbidity Report,” Maricopa County Department of Public Health Epidemiology and Informatics, July 2024, https:// www.maricopa.gov/ArchiveCenter/ViewFile/Item/5855
73 Soojin Han, Ming Hu, Xue Gao, Youqin Huang, Fei Guo, Gordon C. Shen, Donggen Wang, Shao Lin, and Kai Zhang, “Energy burden and mental health: A national study in the United States,” Science of The Total Environment 955 (2024): 176796, https://doi.org/10.1016/j.scitotenv.2024.176796; Marilyn A. Brown, Anmol Soni, Melissa V. Lapsa, Katie Southworth, and Matt Cox, “High energy burden and low-income energy affordability: conclusions from a literature review,” Progress in Energy vol. 2, no. 4 (2020): 042003, https://doi.org/10.1088/2516-1083/abb954; Diana Hernández and Eva Siegel, “Energy insecurity and its ill health effects: a community perspective on the energy-health nexus in New York City,” Energy Research & Social Science 47 (2019): 78-83, https://doi.org/10.1016/j.erss.2018.08.011; Diana Hernández and Jennifer Laird, “Surviving a shut-off: US households at greatest risk of utility disconnections and how they cope,” American Behavioral Scientist 66, no. 7 (2022): 856-880, https://doi.org/10.1177/00027642211013401.
74 “Feedback from the Community on Cooling Centers: Maricopa County Cooling Center Evaluation 2023 Final Report,” Maricopa County Department of Public Health Epidemiology & Informatics, May 2024, https://www.maricopa.gov/ DocumentCenter/View/92026/Cooling-Center-General-Survey-Community-2023-Report ; “Unable to Pay Energy Bill: January 9 – February 5 2024,” Household Pulse Survey, U.S. Census Bureau, 2024, https://www.census.gov/data-tools/ demo/hhp/#/?s_metro=38060&areaSelector=310&measures=ENERGYBILL&periodSelector=1&periodFilter=8,7,6,5,4,3,2,1 ; “Unable to Pay Energy Bill: Week 53 (January 4-16, 2023),” Household Pulse Survey, U.S. Census Bureau, 2023, https://www.census.gov/data-tools/demo/hhp-weeks/#/?measures=ENERGYBILL&s_state=&s_ metro=38060&areaSelector=msa&periodSelector=53
75 Trevor Memmott, Sanya Carley, Michelle Graff, and David M. Konisky, “Sociodemographic disparities in energy insecurity among low-income households before and during the COVID-19 pandemic,” Nature Energy vol. 6, no. 2 (2021): 186-193, https://doi.org/10.1038/s41560-020-00763-9; Diana Hernández and Eva Siegel, “Energy insecurity and its ill health effects: a community perspective on the energy-health nexus in New York City,” Energy Research & Social Science 47 (2019): 78-83, https://doi.org/10.1016/j.erss.2018.08.011; Michelle Graff, Sanya Carley, David M. Konisky, and Trevor Memmott, “Which households are energy insecure? An empirical analysis of race, housing conditions, and energy burdens in the United States,” Energy Research & Social Science vol. 79 (2021): 102144, https://doi.org/10.1016/j.erss.2021.102144; Tian Tang and Hyunji Kim, “Linking energy policy, energy insecurity, and health outcomes,” Frontiers in Sustainable Energy Policy vol. 2 (2023): 1231821, https://doi.org/10.3389/fsuep.2023.1231821; Carli Friedman, “Unsafe temperatures, going without necessities, and unpayable bills: energy insecurity of people with disabilities in the United States during the COVID-19 pandemic,” Energy Research & Social Science 92 (2022): 102806, https://doi.org/10.1016/j.erss.2022.102806; Cassandra R. O’Lenick, Amir Baniassadi, Ryan Michael, Andrew Monaghan, Jennifer Boehnert, Xiao Yu, Mary H. Hayden, Christine Wiedinmyer, Kai Zhang, Perter J. Crank, Jannik Heusinger, Paige Hoel, David J. Sailor, Olga V Wilhelmi, “A case-crossover analysis of indoor heat exposure on mortality and hospitalizations among the elderly in Houston, Texas,” Environmental Health Perspectives vol. 128, no. 12 (2020): 127007, https://doi.org/10.1289/EHP6340.
76 Reid Dorsey-Palmateer, “Outsized impacts of residential energy and utility costs on household financial distress,” Economics Bulletin vol. 40, no. 4 (2020): 3061-3070, https://www.accessecon.com/Pubs/EB/2020/Volume40/EB-20-V40I4-P266.pdf; Megan E. Hatch and Michelle Graff, “Housing costs are not a monolith: The association between neighborhood energy burdens and eviction filing rates,” Cities vol. 150 (2024): 104995, doi: 10.1016/j.cities.2024.104995.
77 Jeffrey A. Adams, Sanya Carley, and David M. Konisky, “Utility assistance and pricing structures for energy impoverished households: A review of the literature,” The Electricity Journal, 2024, vol. 37, no. 2: 107368, https://doi.org/10.1016/j. tej.2024.107368.
78 “Table S2502: Demographics Characteristics of Occupied Housing Units,” U.S. Census Bureau, American Community Survey 5-Year Estimate, accessed May 2025, https://data.census.gov/table/ACSST1Y2023.S2502?q=S2502:&g=040XX00US04.
79 “Table S2502: Demographics Characteristics of Occupied Housing Units,” U.S. Census Bureau, American Community Survey 5-Year Estimates, accessed May 2025, https://data.census.gov/table/ACSST1Y2023.S2502?q=S2502:&g=040XX00US04.
80 “Table B25003B: Tenure (Black or African American Alone Householder),” U.S. Census Bureau, American Community Survey 5-Year Estimates, accessed May 2025, https://data.census.gov/table/ACSDT5Y2023.B25003B?q=Owner/ Renter+(Tenure)&g=040XX00US04_860XX00US75215; “Table DP05: ACS Demographic and Housing Estimates,” U.S. Census Bureau, American Community Survey 5-Year Estimates, accessed May 2025, https://data.census.gov/table/ACSDP5Y2023. DP05?q=arizona.
81 “Table B25003C: Tenure (American Indian or Alaska Native Alone Householder),” U.S. Census Bureau, American Community Survey 5-Year Estimates, accessed May 2025, https://data.census.gov/table/ACSDT5Y2021. B25003C?q=B25003C&g=040XX00US04_500XX00US4808; “Table B25003D: Tenure (Asian Alone Householder),” U.S. Census Bureau, American Community Survey 5-Year Estimates, accessed May 2025, https://data.census.gov/table/ACSDT5Y2019. B25003D?q=B25003D:+TENURE+(ASIAN+ALONE+HOUSEHOLDER)&g=040XX00US04; “Table B25003I: Tenure (Hispanic or Latino Householder),” U.S. Census Bureau, American Community Survey 5-Year Estimates, accessed May 2025, https://data. census.gov/table/ACSDT5Y2020.B25003I?q=B25003I&g=040XX00US04_9700000US4828740 .
82 “Table B25003A: Tenure (White Alone Householder),” U.S. Census Bureau, American Community Survey 5-Year Estimates, accessed May 2025, https://data.census.gov/table/ACSDT1Y2023.B25003A?q=Owner/ Renter+(Tenure)&g=040XX00US04,15_050XX00US15001,15003,15007,15009 ; “Table DP05: ACS Demographic and Housing Estimates,” U.S. Census Bureau, American Community Survey 5-Year Estimates, accessed May 2025, https://data.census. gov/table/ACSDP5Y2023.DP05?q=arizona
83 Osei Akoto Kwarteng and Kathleen Frank, “Assessing the Housing Needs of Native Americans Working Off the Reservation in Northern Arizona,” Northern Arizona University, Arizona Research Center for Housing Equity and Sustainability, 2025, Working Paper.
84 “Glossary of Terms to Affordable Housing,” U.S. Department of Housing and Urban Development, Archives, https:// archives.hud.gov/local/nv/goodstories/2006-04-06glos.cfm
85 “2025 Arizona Housing Profile,” National Low Income Housing Coalition, 2025, https://nlihc.org/sites/default/files/SHP_ AZ.pdf
86 “Low-Income Housing Tax Credit (LIHTC): Property and Tenant Level Data,” US Department of Housing, accessed June 2025, https://www.huduser.gov/portal/datasets/lihtc.html; “Housing Choice Vouchers Fact Sheet,” US Department of Housing, accessed June 2024, https://www.hud.gov/topics/housing_choice_voucher_program_section_8; Ashlee Tziganuk, Liza C. Kurtz, Alison Cook-Davis, and Adison Hicks, “Housing Arizona: Meeting Development Challenges to Arizona’s Housing Shortage,” Morrison Institute for Public Policy, November 2022, https://morrisoninstitute.asu.edu/sites/default/files/ housing_arizona_final.pdf.
87 Steve Kling, Shannon Peloquin, Charles Riesenburg, and Lola Woetzel, “Preserving the largest and most at-risk supply of affordable housing,” McKinsey and Company, February 23, 2021, https://www.mckinsey.com/industries/public-sector/ our-insights/preserving-the-largest-and-most-at-risk-supply-of-affordable-housing; “Naturally Occurring Affordable Housing Benefits Moderate Income Households, but Not the Poor,” National Low Income Housing Coalition, 2016, https://nlihc.org/ resource/naturally-occurring-affordable-housing-benefits-moderate-income-households-not-poor
88 Raquel Harati, Dan Emmanuel, Katie Renzi, and Andrew Aurand, “The Gap: A Shortage of Affordable Homes,” National Low Income Housing Coalition, 2025, https://nlihc.org/gap?utm_source=NLIHC+All+Subscribers&utm_campaign=9b96f4c7b4report_042122&utm_medium=email&utm_term=0_e090383b5e-9b96f4c7b4-293444466&ct=t(report_042122) .
89 Raquel Harati, Dan Emmanuel, Katie Renzi, and Andrew Aurand, “The Gap: A Shortage of Affordable Homes,” National Low Income Housing Coalition, 2025, https://nlihc.org/gap?utm_source=NLIHC+All+Subscribers&utm_campaign=9b96f4c7b4report_042122&utm_medium=email&utm_term=0_e090383b5e-9b96f4c7b4-293444466&ct=t(report_042122) .
90 Raquel Harati, Dan Emmanuel, Katie Renzi, and Andrew Aurand, “The Gap: A Shortage of Affordable Homes,” National Low Income Housing Coalition, 2025, https://nlihc.org/gap?utm_source=NLIHC+All+Subscribers&utm_campaign=9b96f4c7b4report_042122&utm_medium=email&utm_term=0_e090383b5e-9b96f4c7b4-293444466&ct=t(report_042122)
91 Cate Asp, “Federal Assisted Housing Dashboard: Arizona,” 2025, Tableau Public, https://public.tableau.com/app/profile/ cateasp/viz/PreservationDashboard_17322891285080/US.
92 Cate Asp, “Federal Assisted Housing Dashboard: Arizona,” 2025, Tableau Public, https://public.tableau.com/app/profile/ cateasp/viz/PreservationDashboard_17322891285080/US.
93 Cate Asp, “Federal Assisted Housing Dashboard: Arizona,” 2025, Tableau Public, https://public.tableau.com/app/profile/ cateasp/viz/PreservationDashboard_17322891285080/US
94 “Naturally Occurring Affordable Housing Benefits Moderate Income Households, but Not the Poor,” National Low Income Housing Coalition, 2016, https://nlihc.org/resource/naturally-occurring-affordable-housing-benefits-moderate-incomehouseholds-not-poor.
95 Juliana Dawn Panhorst and Alyssa Ryan, “Who Has Access to Walkable, Affordable Housing? Marriage Rates, Demographics, and Policy Implications Across U.S. Cities,” The Journal of Transport and Health, 2025, Working Paper.
96 Sarah E. Conderino, Justin M. Feldman, Benjamin Spoer, Marc N. Gourevitch, and Lorna E. Thorpe, “Social and economic differences in neighborhood walkability across 500 U.S. cities,” American Journal of Preventive Medicine, vol. 61, no. 3 (2021): 394–401, https://doi.org/10.1016/j.amepre.2021.03.014.
97 Ayoung Woo, Chia-Yuan Yu, and Sugie Lee, “Neighborhood walkability for subsidized households: Revisiting neighborhood environments of Housing Choice Voucher and Low-Income Housing Tax Credit households,” Cities, vol. 89 (2019): 243–251, https://doi.org/10.1016/j.cities.2019.03.002.
98 “Low-Income Housing Tax Credit (LIHTC): Property and tenant level data,” HUD USER, accessed May 2025, https://www. huduser.gov/portal/datasets/lihtc.html; “American Community Survey,” U.S. Census Bureau, April 2, 2025, https://www. census.gov/programs-surveys/acs.
99 Subhrajit Guhathakurta and Alvin H. Mushkatel, “Does Locational Choice Matter?: A Comparison of Different Subsidized Housing Programs in Phoenix, Arizona,” Urban Affairs Review vol. 35, no. 4 (2000): 520–40, https://doi. org/10.1177/10780870022184516
100 “Justice Court Eviction Filings by Fiscal Year,” Arizona Judicial Branch, Statistics, 2025, https://www.azcourts.gov/ statistics/Interactive-Data-Dashboards/Justice-Court-Evictions.
101 “Justice Court Eviction Filings by Fiscal Year,” Arizona Judicial Branch, Statistics, 2025, https://www.azcourts.gov/ statistics/Interactive-Data-Dashboards/Justice-Court-Evictions.
102 “Justice Court Eviction Filings by Fiscal Year,” Arizona Judicial Branch, Statistics, 2025, https://www.azcourts.gov/ statistics/Interactive-Data-Dashboards/Justice-Court-Evictions
103 “Justice Court Eviction Filings by Fiscal Year,” Arizona Judicial Branch, Statistics, 2025, https://www.azcourts.gov/ statistics/Interactive-Data-Dashboards/Justice-Court-Evictions
104 “Evictions: National Data are Limited and Challenging to Collect,” United States Government Accountability Office, Report to Congressional Committees, February 2024, https://www.gao.gov/assets/d24106637.pdf
105 “Evictions: National Data are Limited and Challenging to Collect,” United States Government Accountability Office, Report to Congressional Committees, February 2024, https://www.gao.gov/assets/d24106637.pdf.
106 Tanya de Sousa and Meghan Henry, “The 2024 Annual Homelessness Assessment Report (AHAR) to Congress, Part 1: Pointin-Time Estimates of Homelessness,” US Department of Housing and Urban Development, December 2024, https://www. huduser.gov/portal/sites/default/files/pdf/2024-AHAR-Part-1.pdf
107 Tanya de Sousa and Meghan Henry, “The 2024 Annual Homelessness Assessment Report (AHAR) to Congress, Part 1: Pointin-Time Estimates of Homelessness,” US Department of Housing and Urban Development, December 2024, https://www. huduser.gov/portal/sites/default/files/pdf/2024-AHAR-Part-1.pdf.
108 Tanya de Sousa and Meghan Henry, “The 2024 Annual Homelessness Assessment Report (AHAR) to Congress, Part 1: Pointin-Time Estimates of Homelessness,” US Department of Housing and Urban Development, December 2024, https://www. huduser.gov/portal/sites/default/files/pdf/2024-AHAR-Part-1.pdf.
109 Tanya de Sousa and Meghan Henry, “The 2024 Annual Homelessness Assessment Report (AHAR) to Congress, Part 1: Pointin-Time Estimates of Homelessness,” US Department of Housing and Urban Development, December 2024, https://www. huduser.gov/portal/sites/default/files/pdf/2024-AHAR-Part-1.pdf.
110 “HUD 2024 Continuum of Care Homeless Assistance Programs Homeless Populations and Subpopulations,” US Department of Housing and Urban Development, December 2024, https://files.hudexchange.info/reports/published/CoC_PopSub_State_ AZ_2024.pdf
111 “HUD 2024 Continuum of Care Homeless Assistance Programs Homeless Populations and Subpopulations,” US Department of Housing and Urban Development, December 2024, https://files.hudexchange.info/reports/published/CoC_PopSub_State_ AZ_2024.pdf.
112 “HUD 2024 Continuum of Care Homeless Assistance Programs Homeless Populations and Subpopulations,” US Department of Housing and Urban Development, December 2024, https://files.hudexchange.info/reports/published/CoC_PopSub_State_ AZ_2024.pdf.
113 “HUD 2024 Continuum of Care Homeless Assistance Programs Homeless Populations and Subpopulations,” US Department of Housing and Urban Development, December 2024, https://files.hudexchange.info/reports/published/CoC_PopSub_State_ AZ_2024.pdf.
114 “HUD 2024 Continuum of Care Homeless Assistance Programs Homeless Populations and Subpopulations,” US Department of Housing and Urban Development, December 2024, https://files.hudexchange.info/reports/published/CoC_PopSub_State_ AZ_2024.pdf
115 Tanya de Sousa and Meghan Henry, “The 2024 Annual Homelessness Assessment Report (AHAR) to Congress, Part 1: Pointin-Time Estimates of Homelessness,” US Department of Housing and Urban Development, December 2024, https://www. huduser.gov/portal/sites/default/files/pdf/2024-AHAR-Part-1.pdf.
116 Tanya de Sousa and Meghan Henry, “The 2024 Annual Homelessness Assessment Report (AHAR) to Congress, Part 1: Pointin-Time Estimates of Homelessness,” US Department of Housing and Urban Development, December 2024, https://www. huduser.gov/portal/sites/default/files/pdf/2024-AHAR-Part-1.pdf.
117 “ED Data Express: Data about elementary and secondary schools in the U.S.,” U.S. Department of Education, accessed May 2025, https://eddataexpress.ed.gov/download/data-builder/data-download-tool?f%5B0%5D=level%3AState%20Education%20 Agency&f%5B1%5D=program%3AMcKinney-Vento%20Act&f%5B2%5D=school_year%3A2022-2023&f%5B3%5D=state_ name%3AARIZONA.
118 Note: Under the McKinney-Vento Act, Arizona’s Educational Agencies are required to report yearly data on homeless students to the Arizona Department of Education, which in turn reports to the U.S. Department of Education. This data is recorded and made accessible by ED Data Express. As stated above, the definition of homeless students under the McKinney-Vento Act includes those students who are temporarily sheltered, doubled up or staying with other people, or staying in hotels/motels. Thus, numbers of homeless youth are far higher than those included in the PIT count; “The McKinney-Vento Definition of Homeless,” National Center for Homeless Education, accessed May 2025, https://nche. ed.gov/mckinney-vento-definition/.
119 “ED Data Express: Data about elementary and secondary schools in the U.S.,” U.S. Department of Education, accessed May 2025, https://eddataexpress.ed.gov/download/data-builder/data-download-tool?f%5B0%5D=level%3AState%20Education%20 Agency&f%5B1%5D=program%3AMcKinney-Vento%20Act&f%5B2%5D=school_year%3A2022-2023&f%5B3%5D=state_ name%3AARIZONA.
120 Christine Bird, Tiffany Jenzer, and Jennifer P. Read, “Youth Experiencing, and Youth At Risk of, Homelessness: Associations Between Trauma Type, Posttraumatic Negative Cognitions, and Posttraumatic Stress Disorder,” Traumatology vol. 30, no. 4 (2024): 606-614, https://doi.org/10.1037/trm0000477; “Youth Homelessness Overview,” National Conference of State Legislatures, March 29, 2023, https://www.ncsl.org/human-services/youth-homelessness-overview
121 “HUD 2024 Continuum of Care Homeless Assistance Programs Homeless Populations and Subpopulations,” US Department of Housing and Urban Development, December 2024, https://files.hudexchange.info/reports/published/CoC_PopSub_State_ AZ_2024.pdf.
122 “Point in Time Homeless Count Analysis August 2017,” Maricopa Association of Governments, https://azmag.gov/Portals/0/ Documents/MagContent/2017-08_PIT-Report.pdf?ver=2b5ymDdSX2x6K7yJpdI4Gw%3d%3d
123 “HUD 2024 Continuum of Care Homeless Assistance Programs Homeless Populations and Subpopulations,” Department of Housing and Urban Development, December 2024, https://files.hudexchange.info/reports/published/CoC_PopSub_CoC_AZ502-2024_AZ_2024.pdf.
124 “Homelessness: Actions to Help Better Address Older Adults’ Housing and Health Needs,” United States Government Accountability Office Report to Congressional Requesters, September 2024, https://www.gao.gov/assets/gao-24-106300. pdf.
125 “Homelessness: Actions to Help Better Address Older Adults’ Housing and Health Needs,” United States Government Accountability Office Report to Congressional Requesters, September 2024, https://www.gao.gov/assets/gao-24-106300. pdf.
126 “Homelessness Prevention Series: Spotlight on Older Adults,” United States Interagency Council on Homelessness, January 8, 2025, https://www.usich.gov/guidance-reports-data/federal-guidance-resources/homelessness-prevention-seriesspotlight-older
127 “Homelessness Prevention Series: Spotlight on Older Adults,” United States Interagency Council on Homelessness, January 8, 2025, https://www.usich.gov/guidance-reports-data/federal-guidance-resources/homelessness-prevention-seriesspotlight-older.
128 “Table DP05: ACS Demographic and Housing Estimates,” U.S. Census Bureau, 2023 American Community Survey 5-Year Estimates, accessed December 2024, https://data.census.gov/table?q=dp05&g=040XX00US04; “HUD 2024 Continuum of Care Homeless Assistance Programs Homeless Populations and Subpopulations,” US Department of Housing and Urban Development, December 2024, https://files.hudexchange.info/reports/published/CoC_PopSub_State_AZ_2024.pdf
129 “Table DP05: ACS Demographic and Housing Estimates,” U.S. Census Bureau, 2023 American Community Survey 5-Year Estimates, accessed December 2024, https://data.census.gov/table?q=dp05&g=040XX00US04; “HUD 2024 Continuum of Care Homeless Assistance Programs Homeless Populations and Subpopulations,” US Department of Housing and Urban Development, December 2024, https://files.hudexchange.info/reports/published/CoC_PopSub_State_AZ_2024.pdf.
130 “HUD 2024 Continuum of Care Homeless Assistance Programs Homeless Populations and Subpopulations,” US Department of Housing and Urban Development, December 2024, https://files.hudexchange.info/reports/published/CoC_PopSub_State_ AZ_2024.pdf
131 Tanya de Sousa and Meghan Henry, “The 2024 Annual Homelessness Assessment Report (AHAR) to Congress, Part 1: Pointin-Time Estimates of Homelessness,” US Department of Housing and Urban Development, December 2024, https://www. huduser.gov/portal/sites/default/files/pdf/2024-AHAR-Part-1.pdf.
132 “HUD 2024 Continuum of Care Homeless Assistance Programs Housing Inventory Count Report,” US Department of Housing and Urban Development, December 2024, https://files.hudexchange.info/reports/published/CoC_HIC_State_AZ_2024. pdf; “Quick Facts: Arizona,” U.S. Census Bureau, accessed June 2024, https://www.census.gov/quickfacts/fact/table/AZ/ PST045224; “Quick Facts: Maricopa County, Arizona,” U.S. Census Bureau, accessed June 2024, https://www.census.gov/ quickfacts/fact/table/maricopacountyarizona/PST045224.
133 “HUD 2024 Continuum of Care Homeless Assistance Programs Homeless Populations and Subpopulations: Arizona Balance of State,” US Department of Housing and Urban Development, December 2024, https://files.hudexchange.info/reports/ published/CoC_PopSub_CoC_AZ-500-2024_AZ_2024.pdf; “HUD 2024 Continuum of Care Homeless Assistance Programs Homeless Populations and Subpopulations: Tucson/Pima County CoC,” US Department of Housing and Urban Development, December 2024, https://files.hudexchange.info/reports/published/CoC_PopSub_CoC_AZ-501-2024_AZ_2024.pdf ; “HUD 2024 Continuum of Care Homeless Assistance Programs Homeless Populations and Subpopulations: Phoenix, Mesa/Maricopa County CoC,” US Department of Housing and Urban Development, December 2024, https://files.hudexchange.info/reports/ published/CoC_PopSub_CoC_AZ-502-2024_AZ_2024.pdf.
134 “HUD 2023 Continuum of Care Homeless Assistance Programs Housing Inventory Count Report,” US Department of Housing and Urban Development, December 6, 2023, https://files.hudexchange.info/reports/published/CoC_HIC_State_AZ_2023. pdf; “HUD 2024 Continuum of Care Homeless Assistance Programs Housing Inventory Count Report,” US Department of Housing and Urban Development, December 6, 2024, CoC_HIC_State_AZ_2024.pdf.
135 “State of Homelessness Services: Homelessness in Arizona Annual Report 2024,” Arizona Department of Economic Security, December 2024, https://des.az.gov/sites/default/files/dl/2024-Annual-Report-on-Homelessness.pdf?time=1747254622466.
136 “State of Homelessness Services: Homelessness in Arizona Annual Report 2024,” Arizona Department of Economic Security, December 2024, https://des.az.gov/sites/default/files/dl/2024-Annual-Report-on-Homelessness.pdf?time=1747254622466.
137 “State of Homelessness Services: Homelessness in Arizona Annual Report 2024,” Arizona Department of Economic Security, December 2024, https://des.az.gov/sites/default/files/dl/2024-Annual-Report-on-Homelessness.pdf?time=1747254622466.
138 “State of Homelessness Services: Homelessness in Arizona Annual Report 2024,” Arizona Department of Economic Security, December 2024, https://des.az.gov/sites/default/files/dl/2024-Annual-Report-on-Homelessness.pdf?time=1747254622466
139 A. Jaramillo, D. Jin, J. Kuhlo, A. Adkins, and M. Ingram, “Implementing Medicaid Housing Solutions for Arizonans with Complex Health Needs,” Arizona Research Center for Housing Equity and Sustainability, 2025, Working Paper.
140 Perry Vandell, “Sedona declares housing shortage emergency, urges regulation of short-term rentals,” AZ Central, January 23, 2025, https://www.azcentral.com/story/news/local/arizona/2025/01/23/sedona-housing-shortageemergency/77893064007/; “City Council unanimously approves short-term rental resolution,” Arizona Daily Sun, March 8, 2025, https://azdailysun.com/news/local/city-council-unanimously-approves-short-term-rental-resolution/ article_077a86fe-fa08-11ef-b0eb-af661857dadb.html
141 “Rent Local Program,” City of Sedona, accessed May 13, 2025, https://www.sedonaaz.gov/your-government/departmentsand-programs/community-development/housing/owners/rent-local-program#:~:text=Incentives%20for%20converting%20 short%2Dterm,term%20rental%20for%20one%20year; Nick Karmia, “Flagstaff council wants the Legislature to let the city control short-term rentals,” KJZZ Phoenix, March 11, 2025, https://www.kjzz.org/business/2025-03-11/flagstaff-councilwants-the-legislature-to-let-the-city-control-short-term-rentals; Yang Yang and Zhenxing (Eddie) Mao, “Welcome to My Home! An Empirical Analysis of Airbnb Supply in US Cities,” Journal of Travel Research vol 58, no. 8 (December 2018): 1274–87, https://doi.org/10.1177/0047287518815984; Kyle Barron, Edward Kung, and Davide Proserpio, “The Effect of Home-Sharing on House Prices and Rents: Evidence from Airbnb,” Marketing Science vol. 40, no. 1 (March 2020): 23–47, https://doi.org/10.1287/mksc.2020.1227.
142 Jane Caffrey, “Sedona leaders say vacation rentals are driving housing shortage emergency,” ABC15 Arizona, February 3, 2025, https://www.abc15.com/news/state/sedona-leaders-say-vacation-rentals-are-driving-a-housing-shortageemergency.
143 Lauren Frick, “Short-term rentals and the housing crisis: one complicated piece of a complex puzzle,” The Lumberjack, April 15, 2025, https://www.jackcentral.org/news/short-term-rentals-and-the-housing-crisis-one-complicated-pieceof-a-complex-puzzle/article_d721312e-fb34-11ee-8897-a7b9f1246ecf.html; Nick Karmia, “Flagstaff council wants the Legislature to let the city control short-term rentals,” KJZZ, March 11, 2025, https://www.kjzz.org/business/2025-03-11/ flagstaff-council-wants-the-legislature-to-let-the-city-control-short-term-rentals
144 Perry Vandell, “Sedona declares housing shortage emergency, urges regulation of short-term rentals,” AZ Central, January 23, 2025, https://www.azcentral.com/story/news/local/arizona/2025/01/23/sedona-housing-shortageemergency/77893064007/; “City Council unanimously approves short-term rental resolution,” Arizona Daily Sun, March 8, 2025, https://azdailysun.com/news/local/city-council-unanimously-approves-short-term-rental-resolution/ article_077a86fe-fa08-11ef-b0eb-af661857dadb.html
145 “New Housing and Community Hub Planned for North Tempe,” City of Tempe, October 17, 2024, https://www.tempe.gov/ Home/Components/News/News/18030/
146 “New Housing and Community Hub Planned for North Tempe,” City of Tempe, October 17, 2024, https://www.tempe.gov/ Home/Components/News/News/18030/.
147 “Regular Council Meeting Legal Action Summary,” Tempe City Council, April 18, 2025, https://tempe.hylandcloud.com/ AgendaOnline/Meetings/ViewMeeting?id=1699&doctype=3.
148 “City and County Receive Grant to Reduce Affordable Housing Barriers,” City of Tucson, January 14, 2025, https://www. tucsonaz.gov/Departments/Housing-and-Community-Development/HCD-News/City-and-County-Receive-Grant-to-ReduceAffordable-Housing-Barriers.
149 “City and County Receive Grant to Reduce Affordable Housing Barriers,” City of Tucson, January 14, 2025, https://www. tucsonaz.gov/Departments/Housing-and-Community-Development/HCD-News/City-and-County-Receive-Grant-to-ReduceAffordable-Housing-Barriers.
150 “People, Communities, Housing, Investment Plan (P-CHIP),” City of Tucson, accessed May 13, 2025, https://p-chip. tucsonaz.gov/pages/plan
151 “People, Communities, Housing, Investment Plan (P-CHIP),” City of Tucson, accessed May 13, 2025, https://p-chip. tucsonaz.gov/pages/plan.
152 “Housing Phoenix Plan Quarterly Report: January–March 2025,” City of Phoenix, accessed May 13, 2025, https://www. phoenix.gov/content/dam/phoenix/housingsite/documents/housing-phx-plan/HPP_Qrtly_Report.pdf.
153 “Housing Phoenix Plan Quarterly Report: January–March 2025,” City of Phoenix, accessed May 13, 2025, https://www. phoenix.gov/content/dam/phoenix/housingsite/documents/housing-phx-plan/HPP_Qrtly_Report.pdf.
154 “City Council Formal Meeting Agenda: May 21, 2025,” City of Phoenix, accessed May 22, 2025, https://www.phoenix. gov/content/dam/phoenix/cityclerksite/city-council-meeting-files/2025/5-21-25%20Formal%20Agenda%20-%20Final1.pdf ; “City Council Formal Meeting Results: May 21, 2025,” City of Phoenix, accessed May 22, 2025, https://www.phoenix.gov/ content/dam/phoenix/cityclerksite/city-council-meeting-files/2025/5-21-25%20Formal%20Results.pdf
155 “City Council Formal Meeting Agenda: May 21, 2025,” City of Phoenix, accessed May 22, 2025, https://www.phoenix. gov/content/dam/phoenix/cityclerksite/city-council-meeting-files/2025/5-21-25%20Formal%20Agenda%20-%20Final1.pdf ; “City Council Formal Meeting Results: May 21, 2025,” City of Phoenix, accessed May 22, 2025, https://www.phoenix.gov/ content/dam/phoenix/cityclerksite/city-council-meeting-files/2025/5-21-25%20Formal%20Results.pdf .
156 “Phoenix Recognized as a National Leader in Affordable Housing Development,” City of Phoenix, May 8, 2025, https:// www.phoenix.gov/newsroom/housing-news/phoenix-recognized-as-a-national-leader-in-affordable-housing-de.html.
157 “Phoenix Recognized as a National Leader in Affordable Housing Development,” City of Phoenix, May 8, 2025, https:// www.phoenix.gov/newsroom/housing-news/phoenix-recognized-as-a-national-leader-in-affordable-housing-de.html.
158 State of Arizona, House of Representatives, Senate Engrossed House Bill accessory dwelling units; requirements, House Bill 2720, 56th Legislature, 2nd Regular Session, 2024, chap. 196, accessed May 13, 2025, https://www.azleg.gov/ legtext/56leg/2R/laws/0196.pdf.
159 Paul Maryniak, “New Casita Law Preempts Gilbert’s Regulations,” Gilbert Sun News, May 14, 2025, https://www. gilbertsunnews.com/news/new-casita-law-preempts-gilbert-s-regulations/article_1c16921a-1a07-11ef-adc3-f34c12d8a798. html; Christina Estes, “Phoenix Frustrated over Arizona Law That Allows Casitas to Be Short-Term Rentals,” KJZZ, October 9, 2024, https://www.kjzz.org/politics/2024-10-09/phoenix-frustrated-over-arizona-law-that-allows-casitas-to-beshort-term-rentals; Wayne Schutsky, “City Looks to Exclude Many from Building Casitas,” Scottsdale Progress, May 9, 2025, https://www.scottsdale.org/city_news/city-looks-to-exclude-many-from-building-casitas/article_df90acda-963a11ef-aaa3-57b2fda80dfb.html.
160 Lesley Perez and Paul George-Blazevich, “Accessory Dwelling Units and HB2720 in Arizona,” Arizona Research Center for Housing Equity and Sustainability, 2025.
161 State of Arizona, House of Representatives, Senate Engrossed House Bill accessory dwelling units; requirements, House Bill 2928, 57th Legislature, 1st Regular Session, 2025, chap. 217, accessed May 13, 2025, https://www.azleg.gov/ legtext/57leg/1R/laws/0217.pdf.
162 State of Arizona, House of Representatives, Senate Engrossed House Bill accessory dwelling units; requirements, House Bill 2928, 57th Legislature, 1st Regular Session, 2025, chap. 217, accessed May 13, 2025, https://www.azleg.gov/ legtext/57leg/1R/laws/0217.pdf
163 State of Arizona, House of Representatives, Senate Engrossed House Bill municipal zoning; middle housing, House Bill 2721, 56th Legislature, 2nd Regular Session, 2024, chap. 197, accessed May 13, 2025, https://www.azleg.gov/legtext/56leg/2R/ laws/0197.pdf.
164 State of Arizona, House of Representatives, Senate Engrossed House Bill municipal zoning; middle housing, House Bill 2721, 56th Legislature, 2nd Regular Session, 2024, chap. 197, accessed May 13, 2025, https://www.azleg.gov/legtext/56leg/2R/ laws/0197.pdf.
165 “Proposed Code Changes: Middle Housing,” City of Tempe, accessed May 13, 2025, https://www.tempe.gov/government/ community-development/planning/proposed-code-changes
166 Catherine Reagor, “New Law Allows Fourplexes to Replace Historic Phoenix Homes,” The Arizona Republic, April 25, 2025, https://www.azcentral.com/picture-gallery/money/real-estate/2025/04/25/new-law-allows-fourplexes-to-replacehistoric-phoenix-homes/83175872007/.
167 State of Arizona, House of Representatives, Senate Engrossed House Bill commercial buildings; adaptive reuse, House Bill 2297, 56th Legislature, 2nd Regular Session, 2024, chap. 141, accessed May 13, 2025, https://www.azleg.gov/ legtext/56leg/2R/laws/0141.pdf.
168 Josh Kristianto, “State lawmakers accuse Scottsdale of bucking new state housing law,” ABC15 Arizona, November 26, 2024, https://www.abc15.com/news/region-northeast-valley/scottsdale/state-lawmakers-accuse-scottsdale-of-buckingnew-state-housing-law; Jacob Thorington, “Lawmakers at odds with some cities over housing laws,” Arizona Capitol Times, November 29, 2024, https://azcapitoltimes.com/news/2024/11/29/lawmakers-at-odds-with-some-cities-over-housinglaws/.
169 State of Arizona, House of Representatives, Senate Engrossed House Bill development; adaptive reuse; rezoning; prohibition, House Bill 2110, 57th Legislature, 1st Regular Session, 2025, chap. 41, accessed May 13, 2025, https://www.azleg.gov/legtext/57leg/1R/laws/0041.pdf
170 State of Arizona, House of Representatives, Senate Engrossed House Bill development; adaptive reuse; rezoning; prohibition, House Bill 2110, 57th Legislature, 1st Regular Session, 2025, chap. 41, accessed May 13, 2025, https://www. azleg.gov/legtext/57leg/1R/laws/0041.pdf.
171 State of Arizona, House of Representatives, Senate Engrossed House Bill development; adaptive reuse; rezoning; prohibition, House Bill 2110, 57th Legislature, 1st Regular Session, 2025, chap. 41, accessed May 13, 2025, https://www. azleg.gov/legtext/57leg/1R/laws/0041.pdf.
172 State of Arizona, House of Representatives, Senate Engrossed House Bill development; adaptive reuse; rezoning; prohibition, House Bill 2110, 57th Legislature, 1st Regular Session, 2025, chap. 41, accessed May 13, 2025, https://www. azleg.gov/legtext/57leg/1R/laws/0041.pdf
173 State of Arizona, Senate, House Engrossed Senate Bill residential zoning; housing; assessment; hearings, Senate Bill 1162, 56h Legislature, 2nd Regular Session, 2024, chap. 172, accessed May 13, 2025, https://www.azleg.gov/legtext/56leg/2R/ laws/0172.pdf.
174 Ken Sain, “New Arizona Laws Impact Chandler’s Housing Regulations,” Chandler News, October 15, 2024, https://www. chandlernews.com/santan/news/new-arizona-laws-impact-chandler-s-housing-regulations/article_efd07bca-777c-11ef9e28-e74780eeb3de.html; Jason W. Brooks, “Clock will be ticking on development,” Florence Independent, October 7, 2024, https://www.fhtimes.com/stories/clock-will-be-ticking-on-development,538438
175 State of Arizona, Senate, House Engrossed Senate Bill residential zoning; housing; assessment; hearings, Senate Bill 1162, 56h Legislature, 2nd Regular Session, 2024, chap. 172, accessed May 13, 2025, https://www.azleg.gov/legtext/56leg/2R/ laws/0172.pdf.
176 “OEO Publishes SB 1162 Data Implementation Guidance to Municipalities,” Arizona Office of Economic Opportunity, December 17, 2024, https://oeo.az.gov/news/oeo-publishes-sb-1162-data-implementation-guidance-municipalities .
177 “New Laws & Implementation Guidelines: Housing Needs Assessments pursuant to SB1162,” League of Arizona Cities and Towns, accessed May 13, 2025, https://www.azleague.org/100/New-Laws-Implementation-Guidelines; “Tracking Housing Needs Assessments,” Tempe YIMBY, accessed May 13, 2025, https://tempeyimby.org/tracking-arizona-housing-needsassessments/
178 State of Arizona, House of Representatives, Senate Engrossed House Bill mobile homes; cooling; prohibition, House Bill 2146, 56th Legislature, 2nd Regular Session, 2024, chap. 64, accessed May 13, 2025, https://www.azleg.gov/ legtext/56leg/2R/laws/0064.pdf.
179 State of Arizona, House of Representatives, Senate Engrossed House Bill long-term RVs; cooling; prohibition, House Bill 2146, 57th Legislature, 1st Regular Session, 2025, chap. 164, accessed May 13, 2025, https://www.azleg.gov/ legtext/57leg/1R/laws/0164.pdf
180 State of Arizona, House of Representatives, Senate Engrossed House Bill mobile homes; cooling; prohibition, House Bill 2146, 56th Legislature, 2nd Regular Session, 2024, chap. 64, accessed May 13, 2025, https://www.azleg.gov/ legtext/56leg/2R/laws/0064.pdf; State of Arizona, House of Representatives, Senate Engrossed House Bill long-term RVs; cooling; prohibition, House Bill 2168, 57th Legislature, 1st Regular Session, 2025, chap. 164, accessed May 13, 2025, https://www.azleg.gov/legtext/57leg/1R/laws/0164.pdf; Haley Williams, “Heat deaths of people without air conditioning, often in mobile homes, underscore energy inequity,” 12News, August 2, 2025, https://www.12news.com/article/news/ local/heatbeat/heat-deaths-people-without-air-conditioning-often-in-mobile-homes-underscore-energy-inequity/75a317b3ac-ad3a-4653-8a39-ab6a1d733e78; Yana Kunichoff and John Washington, “Suffering hidden from view: Mobile home and RV residents in Pima County die from heat at high rates,” Arizona Luminaria, February 17, 2025, https://azluminaria. org/2025/02/17/suffering-hidden-from-view-mobile-home-and-rv-residents-in-pima-county-die-from-heat-at-highrates/#:~:text=Between%20May%202023%20and%20September,in%20mobile%20homes%20or%20RVs .
181 “Governor Katie Hobbs Announces $89 Million for New Affordable Housing and Homeless Response,” Office of the Governor Katie Hobbs, January 11, 2024, https://azgovernor.gov/office-arizona-governor/news/2024/01/governor-katie-hobbsannounces-89-million-new-affordable; “Arizona legislature passes contentious budget in face of $1.3 billion deficit,” AZ Mirror, June 15, 2024, https://azmirror. com/2024/06/15/arizona-legislature-passes-contentious-budget-in-face-of-1-3billion-defcit/.
182 “Governor Katie Hobbs Announces $89 Million for New Affordable Housing and Homeless Response,” Office of the Governor Katie Hobbs, January 11, 2024, https://azgovernor.gov/office-arizona-governor/news/2024/01/governor-katie-hobbsannounces-89-million-new-affordable.
183 “Arizona Department Of Housing State Housing Trust Fund Expenditure Report For FY24 And FY25,” Arizona Department of Housing, accessed May 13, 2025, https://housing.az.gov/sites/default/files/2025-04/ADOH%20State%20Housing%20 Trust%20Fund%20Expenditure%20Report%20FY%2024%20and%20FY%2025-Rvsd%202-13-25.pdf
184 “Table P9: Hispanic or Latino, and not Hispanic or Latino by Race,” U.S. Census Bureau, Decennial Census, DEC 118th Congressional District Summary File, 2020, accessed June 2024, https://data.census.gov/table?q=Hispanic%20or%20 Latino&g=040XX00US04,06,12,32,35,48.
185 “Latino population grows and makes gains in U.S., but differences exist among groups,” UCLA Latino Policy and Politics Institute, October 27, 2022, https://newsroom.ucla.edu/releases/latinos-make-gains-but-differences-exist-among-groups
186 “Glossary,” U.S. Census Bureau, accessed May 2025, https://www.census.gov/glossary/?term=HUD-code+Manufacture d+%28mobile%29+Home; “American Community Survey and Puerto Rico Community Survey: 2023 Subject Definitions,” U.S. Census Bureau, 2023, https://www2.census.gov/programs-surveys/acs/tech_docs/subject_definitions/2023_ ACSSubjectDefinitions.pdf.
187 “A Guide to Counting Sheltered Homeless People Third Revision,” US Department of Housing and Urban Development Office of Community Planning and Development, last revised January 2012, https://www.hudexchange.info/sites/onecpd/assets/ File/A-Guide-to-Counting-Sheltered.pdf
188 “HDX FAQ: FAQ ID 1818,” HUD Exchange, December 2014, https://www.hudexchange.info/faqs/1818/for-purposesof-the-point-in-time-pit-count-who-does-hud-consider/#:~:text=In%20general%2C%20for%20purposes%20of,)%20as%20 %E2%80%9Cunsheltered%E2%80%9D%20homeless.