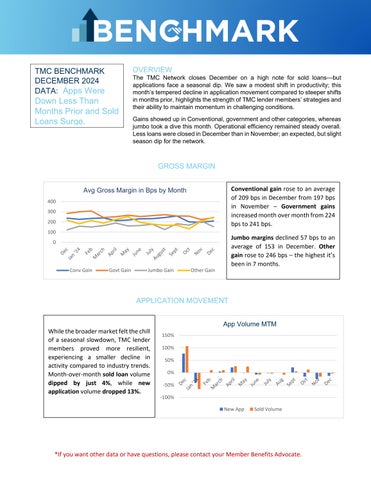
TMC BENCHMARK
DECEMBER 2024
DATA: Apps Were Down Less Than Months Prior and Sold Loans Surge.
OVERVIEW
The TMC Network closes December on a high note for sold loans—but applications face a seasonal dip. We saw a modest shift in productivity; this month’s tempered decline in application movement compared to steeper shifts in months prior, highlights the strength of TMC lender members’ strategies and their ability to maintain momentum in challenging conditions.
Gains showed up in Conventional, government and other categories, whereas jumbo took a dive this month. Operational efficiency remained steady overall. Less loans were closed in December than in November; an expected, but slight season dip for the network.
GROSS MARGIN
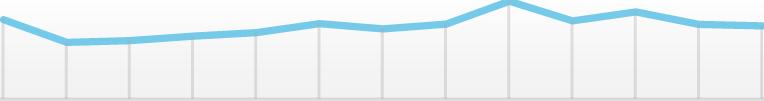
Conventional gain rose to an average of 209 bps in December from 197 bps in November – Government gains increased month over month from 224 bps to 241 bps.
Jumbo margins declined 57 bps to an average of 153 in December. Other gain rose to 246 bps – the highest it’s been in 7 months.
APPLICATION MOVEMENT
While the broader market felt the chill of a seasonal slowdown, TMC lender members proved more resilient, experiencing a smaller decline in activity compared to industry trends. Month-over-month sold loan volume dipped by just 4%, while new application volume dropped 13%.
*If you want other data or have questions, please contact your Member Benefits Advocate.
OPERATIONAL EFFICIENCY
Great news—the average time from application to clear-to-close has stabilized at an impressive 34 days! This steady improvement highlights the network’s unwavering dedication to streamlining processes and delivering results faster than ever.
December saw a small decrease in the number of sold loan units per full-time equivalent (FTE), edging down to 1.64 from 1.66 in November.
AVERAGE LOAN AMOUNT
$1,400,000.00
$1,200,000.00
$1,000,000.00
The TMC Network saw an increase in sold loans across every loan type in December. Conventional sold loans were up $1,784, Government sold loans increased by $5,943 and Jumbo increased by $1,675. However, monthover-month, applications took a dip in every category.
Year-over-year conventional loan amounts jumped by $8,500, jumbo loan amounts soared by an impressive $102,000, and government loan amounts climbed by $23,700
The average loan amounts for applications were also all higher this December compared to last year.
*If you want other data or have questions, please contact your
KEEPING UP WITH OUR TMC FAMILY
Read up on Partner Headlines, Member News, TMC Announcements, and more! 3/1/2023
TMC lender members saw a welcomed increase in applications to start o� 2023 Alternatively, the n closed loan production drop fairly signi�cantly compared to last month
New applications increased by 19% in January from the previous month as rates dipped down during pushing home purchasers o� the fence Conventional loans remained �at at 65% of new app sha interesting to see how the recently announced reduced FHA mortgage insurance premiums impact new business we see going forward
Closed loan units decreased by 38% in January when compared to the month prior Within that, l closed purchase loans and re�nances continue to remain �at month over month Re�nances went ba all closings in January
Here's the re�nance share we've seen in TMC Benchmark since the beginning of 2022:
January 2022: 39%
February 2022: 37%
March 2022: 29%
April 2022: 24%
May 2022: 16%
June 2022: 14%
July 2022: 13%
August 2022: 13%
September 2022: 13%
October 2022: 13%
November 2022: 13%
12%
January 2023: 13%
HOME ABOUT TMC BENEFITS JOIN OUR FAMILY OUR EVENTS OUR NETWORK TMC EMERGING TECH FUND
The % of conventional closings also remained �at again in January at 64% (units) Historically, conventional loans have represented 75-76% of all closed loan units these past six years Government loan closings remained at elevated levels, coming in at 28% of all closings this month, far above the 18-20% ranges we ’ ve historically seen in TMC Benchmark
Operational e�ciency declined for all categories in January The number of closed loan units closed per full-time processor lowered slightly to 537, and closed loan units per full-time closer lowered to 17 in January from 19 in December Closed loan units per full-time underwriter lowered to 14 in January from 16 in December The average loan originator closed 19 units in January, a drop from 22 in December LO comp came in at an average of 87 bps, down 109 basis points (bps) from last month's 979 total
Average annual compensation paid to operational sta� increased month-over-month, with average annual comp paid to FTE processors at $51,712 this month Underwriter annual comp lowered slightly to $85,194 Average annual comp paid to closers rose to $54,632
The average "app date to clear to close date" increased to 3833 this month Let's look at how this number trended throughout the course of 2021 and 2022:
January '21 - 479
February '21 - 431
March '21 - 428
April '21 - 457
May '21 - 438
June '21 - 418
July '21 - 432
August '21 - 425
September '21 - 423
October '21 - 426
November '21 - 410
December '21 - 340 ---
January '22 - 401
February '22 - 396
March '22 - 396
April '22 - 396
May ’22 – 423
June '22 – 397
July '22 – 392
August ’22 – 3845
September ’22 – 3893
October ’22 – 3707
November ’22 – 407
December ’22 – 3697 --January ’23 – 3833
The average cost per closed loan unit our members paid for their loan origination system (LOS) increased in January to $224 from $173 the previous month The average cost per closed loan unit for our members' point-ofsale (POS) system climbed $2091 to $9246 in January and rose 2 bps to $97 for their CRM
Average non-third-party lender fees for conventional loans crept up slightly once again to $1,246 in January compared to $1,225 the previous month Government lender fees rose slightly from $1,226 to $1,253 in this most recent month
58% of this month's participants in TMC Benchmark were depositories, and 42% were IMBs 38% originate under $500M a year in annual volume, 25% originate between $500M-$1B, and 37% originate over $1 billion per year in annual production
SHARE
0 COMMENTS
LEAVE A REPLY.
Name(required)
Email(notpublished)
Website
Comments(required)
Notifymeofnewcommentstothispostbyemail SUBMIT
DETAILS