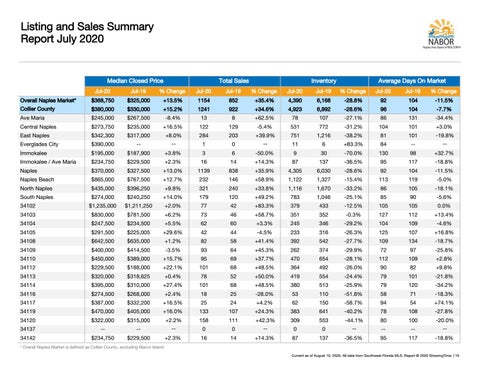
Listing and Sales Summary Report July 2020
Median Closed Price Jul-20
Jul-19
Total Sales
% Change
Jul-20
Jul-19
Inventory % Change
Jul-20
Jul-19
Average Days On Market % Change
Jul-20
Jul-19
% Change
Overall Naples Market*
$368,750
$325,000
+13.5%
1154
852
+35.4%
4,390
6,168
-28.8%
92
104
-11.5%
Collier County
$380,000
$330,000
+15.2%
1241
922
+34.6%
4,923
6,892
-28.6%
96
104
-7.7%
Ave Maria
$245,000
$267,500
-8.4%
13
8
+62.5%
78
107
-27.1%
86
131
-34.4%
Central Naples
$273,750
$235,000
+16.5%
122
129
-5.4%
531
772
-31.2%
104
101
+3.0%
East Naples
$342,300
$317,000
+8.0%
284
203
+39.9%
751
1,216
-38.2%
81
101
-19.8%
Everglades City
$390,000
--
--
1
0
--
11
6
+83.3%
84
--
--
Immokalee
$195,000
$187,900
+3.8%
3
6
-50.0%
9
30
-70.0%
130
98
+32.7%
Immokalee / Ave Maria
$234,750
$229,500
+2.3%
16
14
+14.3%
87
137
-36.5%
95
117
-18.8%
Naples
$370,000
$327,500
+13.0%
1139
838
+35.9%
4,305
6,030
-28.6%
92
104
-11.5%
Naples Beach
$865,000
$767,500
+12.7%
232
146
+58.9%
1,122
1,327
-15.4%
113
119
-5.0%
North Naples
$435,000
$396,250
+9.8%
321
240
+33.8%
1,116
1,670
-33.2%
86
105
-18.1%
South Naples
$274,000
$240,250
+14.0%
179
120
+49.2%
783
1,046
-25.1%
85
90
-5.6%
34102
$1,235,000
$1,211,250
+2.0%
77
42
+83.3%
379
433
-12.5%
105
105
0.0%
34103
$830,000
$781,500
+6.2%
73
46
+58.7%
351
352
-0.3%
127
112
+13.4%
34104
$247,500
$234,500
+5.5%
62
60
+3.3%
245
346
-29.2%
104
109
-4.6%
34105
$291,500
$225,005
+29.6%
42
44
-4.5%
233
316
-26.3%
125
107
+16.8%
34108
$642,500
$635,000
+1.2%
82
58
+41.4%
392
542
-27.7%
109
134
-18.7%
34109
$400,000
$414,500
-3.5%
93
64
+45.3%
262
374
-29.9%
72
97
-25.8%
34110
$450,000
$389,000
+15.7%
95
69
+37.7%
470
654
-28.1%
112
109
+2.8%
34112
$229,500
$188,000
+22.1%
101
68
+48.5%
364
492
-26.0%
90
82
+9.8%
34113
$320,000
$318,625
+0.4%
78
52
+50.0%
419
554
-24.4%
79
101
-21.8%
34114
$395,000
$310,000
+27.4%
101
68
+48.5%
380
513
-25.9%
79
120
-34.2%
34116
$274,500
$268,000
+2.4%
18
25
-28.0%
53
110
-51.8%
58
71
-18.3%
34117
$387,000
$332,200
+16.5%
25
24
+4.2%
62
150
-58.7%
94
54
+74.1%
34119
$470,000
$405,000
+16.0%
133
107
+24.3%
383
641
-40.2%
78
108
-27.8%
34120
$322,000
$315,000
+2.2%
158
111
+42.3%
309
553
-44.1%
80
100
-20.0%
34137
--
--
--
0
0
--
0
0
--
--
--
--
34142
$234,750
$229,500
+2.3%
16
14
+14.3%
87
137
-36.5%
95
117
-18.8%
* Overall Naples Market is defined as Collier County, excluding Marco Island. Current as of August 10, 2020. All data from Southwest Florida MLS. Report Š 2020 ShowingTime. | 16

