

Mark Blecher, Vishal Brijlal, Jonatan Daven, Sasha Stevenson, Marumo Maake, Noxolo Madela, Thulani Matsebula, Nikhil Khana
The period 2015 to 2020 was characterised by several developments relating to health financing reforms towards Universal Health Coverage (UHC). This chapter examines trends, problems, challenges and progress in a selection of public and private financing domains.
The chapter starts with an analysis of progress with National Health Insurance (NHI) and examines why progress has been slow. We also present research findings on building a consensus on the way forward. The chapter then examines trends in health spending at national and provincial level and spending through the private sector. It next looks at some of the pressures on future financing of health and the impact of COVID-19. The chapter ends with a discussion of the status of financing reforms, suggesting some re-evaluation of aspects of the model to get NHI reforms back on track.
National Health Insurance is about a common, central fund, which will purchase quality health care services that are needed by the people of South Africa. This must be done in a way whereby access is equitable and without prejudice. The White Paper represents government’s statement of intent on achieving UHC to ‘provide all people with access to a common set of comprehensive health services of sufficient quality, while also ensuring that the use of these services does not expose the user to financial hardship’. As such, it is important that there is progressive realisation of this principle over the transition period. Over time, all people will access a common set of comprehensive benefits.
Although an admirable reform in principle, it has progressed poorly in implementation. In 2017, Cabinet approved the White Paper on NHI,1 almost six years after the publication of its precursor, the Green Paper, in 2011.2
Previous publications have shown that NHI reforms made slow and insufficient progress in the period 2015–2020.3
Table 18.1 shows a brief summary of progress on NHI over the five-year period. While some progress was made with the release of a White Paper in 2017 and an NHI Bill was developed and introduced to Parliament4, there has been little progress with implementation. This is surprising given that NHI Pilots were launched already in 2012/13, and NHI discussions have been taking place since 2008 and indeed long before, noting that a Social Health Insurance was already proposed as government policy in the White Paper of 1997, more than 20 years prior to the release of the NHI white paper.5
Table18.1 Progress with NHI i
Area
Revenue raising Limited
New taxes No
Other sources of revenue
Funding/ allocations
Some tax options in White Paper, but no progress in implementation
Partial Medical tax credit capped and partially redirected to NDoH
Partial Indirect and direct NHI conditional grants put in place
Pooling No
Complexities pertaining to powers and funding of provinces
Integration of Government medical schemes: GEMS, Parmed, Polmed, Transmed
No
No
Medical Schemes reform No
Purchasing No
Re-imbursement reform: DRGs for hospital reimbursement No
Reimbursement for PHC: capitation and contracts
No
Besides the NHI Bill, no practical process has been put forward on how functions would be transferred to central government and delegated back to provinces for delivery
No practical work done on scheme alignment or consolidation
Medical Schemes Amendment Bill published for comments in 2018 but not taken forward and introduced to Parliament
Despite funding allocated for DRG development, only limited coding of diagnoses done. Overall, project did not proceed, although some progress in Western Cape province
Very good actuarial project to determine capitation rate and develop contracts, but never taken forward
Purchasing from public providers No No piloting of purchasing with public sector
Purchasing from private providers No
i Source: Authors
Minimal progress: COVID-19 critical care and COVID-19 vaccine programme has potential to build collaboration
Comment
Treasury unlikely to support until current underspending is addressed and more progress is made on mixed provision model and strategic purchasing
This reform was enacted to make medial scheme tax subsidy dispensation more equitable
Low spending on NHI indirect grant
Funding previously earmarked on NDoH budget for capitation development but not utilised
Area
CUP purchasing model No No progress with development
Institutions e.g. hospitals as semi-autonomous providers No No progress in this area
Legislative or regulatory framework for contracting No No progress except NHI Bill
Contract development
Limited Draft GP capitation contracts developed, but not taken forward
IT systems Limited Some progress on Health Patient Registration system, but limited modules and integration with other systems
Governance Limited
Policy Yes
NHI Bill Yes
Establishment of pre-cursor to NHI Fund No
Provision Limited
White Paper published in 2017
Very long delays in Parliament
NHI Fund has not been established, and interim structure not built in NDoH
Private GPs Limited Some contracting on sessional basis, but no strategic purchasing
Pharmacies Partial Centralised Chronic Medicine Dispensing and Distribution (CCMDD) model has had some successes but limited in scope
Other private No No progress in contracting private sector, except limited contracting under COVID-19
Quality of care Partial Ideal clinics and some other initiatives, Office of Health Standards Compliance established
Comment
There seems to be resistance within the public health sector for strategic purchasing, despite being the inherent feature of NHI model
NHI indirect grant partly reformed to focus on CUPs from 2022/23
NHI has been delayed in Parliament for over two years
Funding allocated for this from 2018 and onwards but no progress and no spending
Table 18.1 shows limited progress in many areas pertaining to NHI, particularly in strategic purchasing, pooling and developing a mixed provider platform. Many of the transition steps during the second phase of NHI preparation (2017–2022) outlined in the White Paper (Chapter 9) have not been accomplished.
Why has progress been so slow?
While COVID-19 has indeed delayed NHI work, this is relevant only for the final year of the period. A previous paper laid out a set of obstacles and solutions.3 Looking further into underlying causes, we deliberate on several probable reasons for slow progress:
• Weak management and capacity
• Inability to build compromise and consensus across interest groups
• Complexity and politics around provincial vs national powers and political interests
• Weak economic growth since 2010
Weak management and capacity
In many instances, progress on NHI has been stymied by managerial inability to deliver on key technical reforms as part of a transitional process. Some examples include:
• Inability to develop a Diagnostic-Related Group (DRG) system for hospital reimbursement, despite funding allocated for several years and access to diagnostic groupers at no cost. Many similar-income countries have drawn far ahead, e.g. Thailand has implemented DRG payments for over a decade.6
• Inability to implement a capitation system of reimbursement for private general practitioners or Contracting Units for Primary Health Care (CUPs), despite funding and enabling research which developed a financing model and capitation formula for South Africa.7,8,
• Inability to put in place an NHI interim management structure despite funding being allocated for this purpose since 2018/19.
• Inability to make progress with purchasing priority services for NHI funded through the indirect NHI Grant, such as school health, mental health, oncology and maternity care for high-risk pregnancies.
However, some areas where progress has been made, upon which further developments can be built are as follows:
Centralised Chronic Medicine Dispensing and Distribution programme (CCMDD): (see Chapter 5 on Accessing Access to Medicines and Health Technology).
Health Patient Registration System (HPRS): The HPRS contains over 50 million individual person records. Although the system is currently narrow in scope focussing mainly on patient registration, it provides an electronic tool on to which a capitation system could be built. Additional modules, such as patient diagnoses, laboratory tests and medicine prescriptions need to be added or linked over time. To date it is also largely limited to public sector facilities. Furthermore, some limited progress was made on Primary health care re-engineering, such as with the Ideal Clinic initiative (see Chapter 4 on Primary Health Care).
Progress in these areas demonstrates that where some management capacity exists for reforms, it is possible to innovate and make changes that can improve service delivery, make a difference to client experience and demonstrate benefits from NHI.
Successful health reform globally is dependent on a balance of forces and the ability of reformers to bring various stakeholders onboard. The NHI is a highly redistributive reform and given that South Africa is one of the most inequitable countries in the world, several scenarios can potentially be perceived to threaten the interests of some sections of the population.
While NHI has the potential to greatly benefit the country, some of the approaches that have been taken to it have the risk to turn potential allies into powerful opponents and jeopardise and endlessly delay the reforms. Some examples include:
• The inclusion of Section 33 in the NHI Bill,9 which states that medical schemes will only be able to provide top-up insurance once NHI is fully established, has been perceived as threatening by some. This provision does not exist in many countries and may be premature, as medical scheme members have not yet been able to build any trust in the NHI.
• The failure to demonstrate successful pilots of contracting private general practitioners and specialists has not built confidence among private sector users that they will be able to continue using service providers which they trust. It has also not brought private practitioners into the system, who are a powerful constituency.
• Low quality in the public sector (c.f. OHSC reports10), weak accountability, budget cuts, long queues, corruption, etc. can be perceived as obstacles, where users do not trust that the model being proposed is of acceptable quality and choice.
Addressing these kinds of challenges is a potential route for resolving constraints to reform.3 Prior to 2008, policy reforms had suggested a path of social health insurance focussing on the formally employed, which might have been an easier reform path, albeit less redistributive. After 2008, policy direction changed towards a universalist approach, echoing an emerging global direction towards UHC. However, given huge inequities, this shift potentially entails far greater redistribution (medical scheme spending exceeds government spending per capita more than five-fold). Addressing the needs of gaining as well as potentially losing parties is essential to build consensus around an implementable path.
The model selected for NHI (i.e. a centralised NHI Fund) requires legally shifting health services, which has been a provincial competency for almost a century, to become a national function (potentially delegated back to provinces). It is not only extremely complex administratively, but also threatens provincial power bases, noting also that health comprises almost 30% of provincial expenditure. These may not be stated explicitly, but nevertheless may be powerful underlying forces. In addition to natural reluctance of decentralised administrations to cede power to the centre, party political dynamics such as the Western Cape being governed by an opposition party and Gauteng having a narrow political majority in recent elections also complicate the reform.
Questions have been asked whether there is coherence across government on health financing reform for NHI. For its part, the Treasury is supportive of NHI financing reform, but is concerned by the slow pace of progress as described above and with on-the-ground reforms that citizens can see as improving options and services. The pace of funding and financing increases needs to be matched by performance and service improvements and good use of funds already allocated.
Recognising lack of progress and lack of consensus on health system and health financing reform, health and education rights law centre, SECTION27 sought to determine the views of different stakeholders across the system about the problems that exist currently and the kind of reforms that are needed. SECTION27 worked with Concentric Alliance, a conflict resolution and consensus-building company, to develop a questionnaire and to interview 34 people across the public and private health sectors, regulators and professional associations, civil society and labour. Interviews were conducted between November 2020 and August 2021 and dealt with the participants’ views on the foundational principles of a health system; what is most wrong with South Africa’s system at present; priority areas for reform; NHI as it is currently proposed; transitional steps in reform efforts; the potential of partnerships across the sector; and areas of consensus and divergence.
The interviews revealed important consensus on health and access to health care services as a right and that this requires both government provisioning and regulation. The inequality between public and private health sectors was recognised to be a problem by all participants. Many participants raised the need for greater investment in primary health care (PHC) services, both directly and through the training of professionals to work at this level. Almost all participants identified the absence of a universal system to monitor service provision, individual patients and health outcomes as a weakness.
In relation to NHI as it is currently formulated, the primary concerns related to its failure to address the problems in the public sector, such as NDoH capacity, weak governance, management and accountability, and in the private sector, in particular inefficiency and waste, and inadequate regulation. There was also a lack of clarity on priority issues including pricing, purchasing of services, financing and accreditation. They also identified as problems its targeting of medical schemes (largely through Section 33), which was described by people within both the public and private sectors as ideological and unnecessary and with insufficient consideration of transition (with reference to lack of evidence from piloting and lack of preparedness). Interestingly, nearly all participants felt that there is an important role for the private sector within NHI. While there was significant support for some form of NHI in South Africa amongst participants, the dominant view was that many questions remain unanswered, and this was seen as a problem by most participants.
Participants viewed the COVID-19 experience as instructive on what South Africa should expect with NHI. Some participants were impressed with the ‘reaching out’ of the private sector and expressed frustration (mostly from within the public service) with the public sector’s delays and lack of urgency in developing working relationships with the private sector. Others in the public sector had a different experience of private sector duplicity and unwillingness to contribute genuinely in the COVID-19 crisis. This recent experience coloured the participants’ views of NHI, its prospects and South Africa’s health system reform path.
ii Research undertaken by SECTION27
Recommendations included focussing on strengthened governance and accountability mechanisms, the improvement of public sector infrastructure, training and retention of appropriate human resources for health, and the establishment of monitoring and evaluation systems based on health outcomes. A number of participants mostly supported piloting of interventions at district level to build systems and processes that enable accountable implementation of the NHI locally. National government participants tended to favour provincial-level piloting. Some participants proposed focussing on particular types of services to demonstrate success. Importantly, almost all participants, including those from the private sector, recommended a focus on private sector reform, including in relation to pricing, market concentration and a lack of transparency (key issues identified in the Health Market Inquiry).
The research demonstrated that health stakeholders want to help. There is broad appetite for health system and health financing reform and a willingness to talk. There remains a lack of trust between many stakeholders, which hampers open engagement, and a feeling that ideological lines have been drawn. The role of the private sector is an area of conflict, as is the role of provinces. Stakeholders in both of these areas have not been properly engaged, further entrenching distrust and opening the health reform process up to years of litigation and other delays.
The importance of engaging and building trust with key stakeholders is also evident from international reform processes. For example, in Turkey, assuring existing scheme beneficiaries that their entitlements would not be reduced was essential in building support. Further, consolidating pools into a single national scheme was only done at the end of the reform process, following practical progress in the areas of standardisation of benefits, increased provider payments and enrolment of informal sector beneficiaries. In Mexico, the Minister of Health engaged closely with legislators, including from other political parties, to help usher the reform through legislative process, but also had to be willing to reach compromises with key stakeholders in order to move the reform forward.11 In Malaysia, on the other hand, several past attempts at health financing reforms have failed, partly due to a lack of openness and inclusiveness in the reform process.12
South Africa’s most recent National Health Accounts (NHA) data is for 2016/17 and showed that total health expenditure in the country was R392.6 billion. This translates to 8.86% of GDP, of which government health expenditure was 5.1% of GDP and 14.95% of total government expenditure. The latter two percentages are higher than estimates often reported, because the NHA methodology adds government tax subsidies and employer contributions (for public servants) to medical schemes (together amounting to around R40 billion per annum) to public as opposed to private financing. Interestingly, the latter figure is close to the Abuja target of 15%, although using alternate measurement approaches and definitions yields various estimates varying from 12.6%–16% of government expenditure.
More recent data bringing together public and private spending is shown in Table 18.2, using data available to the National Treasury. Notably, the total health expenditure number for 2016/17 of R392.3 billion is virtually identical to that reported by the NHA for that year. Total health spending is estimated to have risen to R540 billion by 2020/21, with some of the increase in the latter year due to the COVID-19 response. Table 18.2 covers different areas of expenditure in South Africa’s two-tiered health system from 2015/16 to 2020/21. The table also indicates
expenditure from the private sector, which is made up of medical schemes, out-ofpocket expenditure, and medical insurance as well as expenditure by donors.
Table18.2 Consolidated health spending (public and private sectors)
Public health spending is largely funded by general tax revenue raised nationally, which is divided among the national, provincial and local spheres of governments. Given that health is currently largely a provincial function, provinces receive the bulk of the health budget, averaging 92% since 2015/16 of total health expenditure. The provincial health budgets are funded via provincial equitable share formula allocations via provincial governments and direct conditional grants (transferred via the NDoH).
The average annual growth rate in provincial health expenditure was 8.1% from 2015/16–2019/20, similar to the growth rate of 8.6% observed from 2011/2012 to 2014/15. Budget 2020/21 was substantially higher due to special allocations for the COVID-19 pandemic. However, in the subsequent years from 2021/2022 to 2023/2024 budgets have been substantially reduced with annual growth rate projected at only 1.8%, from R210.9 billion in 2019/20 to R226.4 billion in 2023/24. The financially constrained period post COVID-19 is discussed in more detail in a latter section.
Some of the reforms during the 2015–2020 period include additional allocations in support of NHI and health promotion for non-communicable diseases (NCDs), following introduction of a sugar-sweetened beverages tax. An additional R4.2 billion over three years from 2018/19–2020/21 was allocated for strengthening the health system and contracting priority services in preparation for wider NHI roll-out. These funds were obtained through capping growth on the medical tax credit. In 2018, a health promotion levy on sugary beverages was initiated. Although these funds were not earmarked for use by the health sector only, a portion of revenue generated from this
was to further support prevention programmes related to NCDs. However, there was significant underspending in these areas, most likely due to management constraints and difficulties in conceptualising how to use the NHI indirect grant in the absence of NHI legislation and an independent NHI Fund.
Budget execution
Overall spending performance by provincial health departments was above 99% between 2015/16 and 2019/20. Underspending was somewhat higher in 2020/21, amounting to R3.2 billion. While spending on conditional grants also performed fairly well during this period, there was under-expenditure mainly of the Health Facility Revitalisation Grant, attributed mainly to slow contractor performance and other problems in infrastructure delivery. A significant portion of the under-expenditure emanated from KwaZulu-Natal (KZN) (R1.9 billion) and Gauteng (R1.1 billion).
Source: Authors
Between 2015/16 and 2020/21, provincial spending on health grew from R154 billion to R210 billion, an average annual rate of increase of 8.2% (Table 18.3). There are several factors that influenced the increase in expenditure in the sector over the period under review. The first is growth in the general population, which increased by over 4 million over the same period (at an annual growth rate of 1.6%). Secondly, expenditure on core goods and services items such as medicine and medical supplies are affected by medical inflation and by exchange rate fluctuation, which puts pressure on provincial budgets for these items. Despite the overall underspending, medicines and medical supplies were overspent by over R2 billion in total between 2015/16 and 2019/20. Furthermore, large amounts of accruals and payables not recognised were incurred by the sector during the same period, reflecting unpaid bills which increased from R10.2 billion at the end of 2015/16 to R15.3 billion at end of
2020/21, a strong signal of pressure on these budgets. This is likely to reflect both a degree of under-budgeting and inappropriate use and management of resources, e.g. over-prescribing, inadequate laboratory gatekeeping and inadequate controls over personnel costs.
Table18.3
Spending is expected to reach R226.4 billion in 2023/24 at an annual average growth rate of 4.9% since 2015/16. However, there is a declining trend between 2020/21 and 2023/24 which is partly attributed to once-off additional funding that was available for COVID-19 response in both 2020/21 and 2021/22. Furthermore, there were significant reductions in the baseline allocations for compensation of employees across national and provincial departments due to the anticipated zero increase in the salaries of public servants over the 2021 medium-term expenditure framework (MTEF) period. Reductions were also effected on other items as part of government-wide fiscal consolidation.
While the growth in provincial expenditure may seem favourable, there remains budget pressures and threats such as accruals, medico-legal claims (both discussed later in this chapter), widening and changing pattern of disease burden (because of NCDs), corruption, and poorly funded training of medical students, among other issues.
District health services make up approximately 46.3% of total provincial spending over the observed period, followed by central hospital services at 20.4% and provincial hospital services at 17.9%. It is also worth noting that significant investments in district health services, consequently PHC, is consistent with the country’s focus on achieving UHC through implementation of the NHI, which is highly embedded on the PHC service platform13. Sustainable financing of PHC is fundamental in achieving goals such as equity, improved access to health care services, reduced financial risk for users and providing care at low cost.14,15 However, achievement of these is not solely contingent on availability of funds but on other components as well such as availability of health workforce, medicines and supplies, leadership and governance, and good financial management.
While the focus is on strengthening investments in PHC services (housed under district health services), the central hospital services programme had a rapid growth at an annual average growth of 10.9% compared to 8.9% for overall district health services. In PHC services, the main driver of expenditure is the HIV/AIDS sub-programme,
also with the highest annual average growth rate of 15.6% from 2015/16 to 2019/20. This is largely due to additional allocations to the HIV/AIDS conditional grant from 2017/18 onwards, in support of the implementation of the universal test and treat policy, in line with the targets set by the United Nations Programme on HIV/AIDS16 (see also Chapter on National Health Programmes).
According to the World Health Organization (WHO), countries may find it difficult to achieve UHC with health spending less than 4–5% of GDP17 . In 2001, heads of state of the African Union pledged that 15% of the government annual budget should be allocated to the health sector, a target commonly referred to as the Abuja Declaration target18. As shown in, total government health expenditure has remained relatively stable at approximately 4.2% of GDP over the period under review and around 14% of the overall government budget. This is close to the Abuja Declaration target and higher than several other upper-middle-income countries’ (UMIC) spend (see Table 18.4 and), indicating significant political commitment in prioritising health.
Figure 18.2 Government health spending as percentage of GDP and as percentage of total government expenditure
Source: Authors
As shown in Table 18.4 and, South Africa’s level of public health financing compares fairly well with other UMICs, in terms of current health expenditure (CHE) and domestic general government health expenditure (GGHE-D) per capita, and as percentages of general government expenditure (GGE) and of GDP. Out-of-pocket (OOP) expenditure as a percentage of health expenditure is amongst the lowest in this group at 7.7%, far below the UMIC average of 32.6%. Catastrophic health expenditure is not routinely monitored, but a recent study by Koch and Setshegetso found that the share of household expenditure going to health increased between 1995 and 2010, but that catastrophic health expenditure was still relatively rare, and that very few households were impoverished due to health care costs. However, it may be more common for certain groups, such as chronic patients. South Africa does have a high burden of disease especially due to HIV/AIDS and has unit costs of personnel that exceed most comparable-income countries , and life expectancy is considerably below that of UMIC peer countries. Under NHI it has been projected that public financing will rise from 4% to 6% of GDP.
Table 18.4 Key health financing indicators in upper-middle-income countries, 2018
Acronyms: CHE = current health expenditure (including public and private); GDP = gross domestic product; GGHE-D = domestic general government health expenditure; GGE = general government expenditure; OOP = out-of-pocket expenditure
Source: Global Health Expenditure Database, accessed 29 August 2021
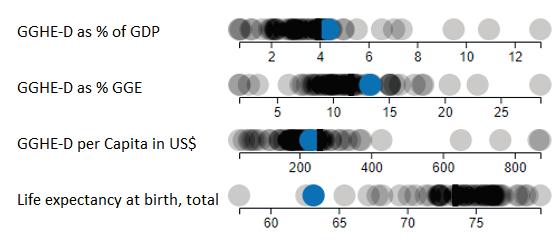
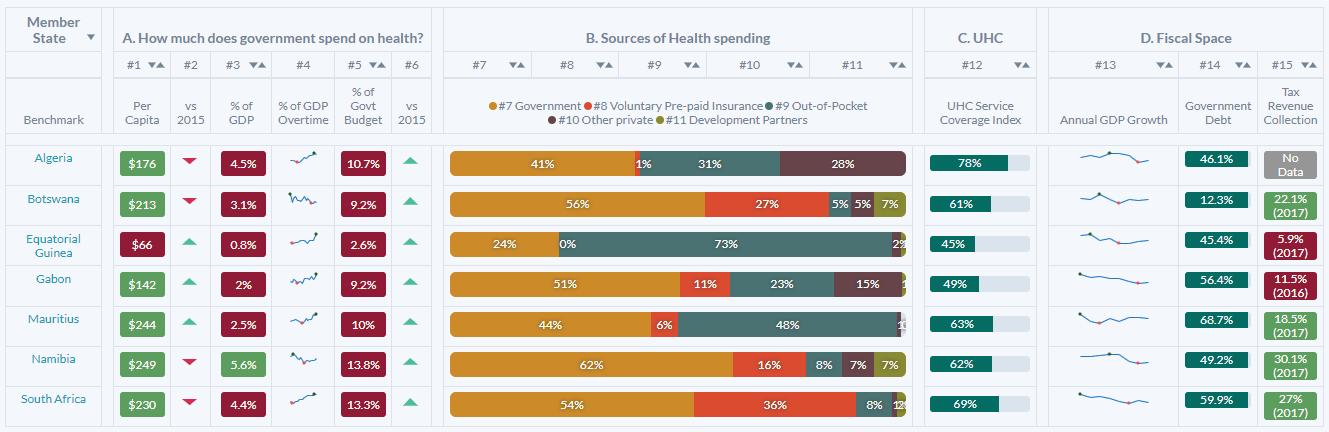
Figure 18.3 Health financing indicators and life expectancy compared to other UMICs, 2017
* South Africa shown as blue dot, other UMICs as grey dots and UMIC average as black line
Figure 18.3 is sourced from the Africa scorecard on domestic financing for health using 2017 data (https://scorecard.africa/23) and the countries presented here are African countries in the UMIC group. The figure indicates that South Africa is doing fairly well in terms of prioritising health in government expenditure, e.g. spending 13.3% of government budget in 2017 (their definition), which was an improvement from 2015, despite a low growth in revenue (from 5.7% in 2016/17 to 5.1% in 2017/18). The numbers also suggest that as government prioritises health expenditure (with a percentage of health expenditure against total government expenditure moving closer to 15%), performance in the UHC coverage index improves. Generally, countries that have a high proportion of domestic sources in financing health tend to perform better in the UHC service coverage index, e.g. South Africa, Namibia and Botswana. Countries such as Mauritius nevertheless scored fairly well, although domestic funding share is lower than 50%, and their government spending per capita is fairly high ($244), being closer to that of Namibia ($249). The WHO suggests that significant investments in domestic funding for health care is essential to achieve UHC24. In general, while public funding for health care in South Africa compares well with other UMICs, health outcomes such as life expectancy are much worse than most income comparable UMICs, such as Brazil, Vietnam, Thailand, Turkey and Indonesia. This is partly due to HIV/AIDS, but also due to significant levels of household poverty, unemployment and inequality, high input costs, substantial inequities betweenpublic and private spending and inefficiencies and management weaknesses.
Source: https://scorecard.africa/25
In the previous edition of this publication, McIntyre, Brijlal and Nkosi26 highlighted inequitable level of health care expenditure across provinces as a major challenge in the health system, with the lowest spending province per capita in 2012/13 (Mpumalanga) spending around 15% below the national average and the highest (Western Cape) more than 30% above this average. They recommended that these inequities be addressed by directing additional funds towards relatively under-resourced provinces (and districts) rather than ‘robbing Peter to pay Paul’ within a stagnant funding envelope.
As seen elsewhere in this chapter, real per capita expenditure has indeed increased over the past five years (although not so going forward – see Figure 18.8 below. Our estimates presented in show that while considerable differences remain, it seems as if the variations between provinces have narrowed, with both lower- and higher-spending provinces moving closer to the national average between 2015/16 and 2019/20. It thus seems that progress has been made in line with the aforementioned authors’ recommendations. This is likely the result of a combination of factors, including the provincial equitable share (PES) funding formula, annual benchmarking exercises with provincial treasuries, and the HIV conditional grant making up an increasing share of health expenditure and in many cases benefiting otherwise under-resourced provinces. The health component of the PES formula has been revised for Budget 2022 and onwards to further improve equity in inter-provincial resource distribution. It is also important to note that some variation between provinces may be warranted due to differences in demographics and disease burden, and that tertiary hospital services tend to be concentrated in urban centres with patients from more rural provinces often being referred to these.
Figure 18.5 Percentage deviation from the national public health spending per capita (uninsured)
Source: Author calculations based on data from National Treasury27
Health expenditure per capita varies, not only between provinces, but even more so between districts, often even within the same province.
Table 18.5 shows, for each province and for the whole country, PHC expenditure per capita in the lowest and highest spending districts and the ratio between the two.28 The highest spending district in the country in 2019/20 (Namakwa in Northern Cape) spent 2.5 times more than the lowest spending district (Joe Gqabi in Eastern Cape), which is a smaller ratio than in 2012/13 when the same ratio was 2.9. This ratio differs considerably between provinces with some provinces, e.g. Limpopo and Mpumalanga, having relatively small internal variation and others, e.g. Northern Cape and Western Cape, having a relatively high ratio of 2.2 and 2.0, respectively. More systematic and evidence-based approaches to allocating funding across districts would likely improve equity and could form the basis for the capitation reimbursement mechanism envisaged under NHI. The National Treasury and Western Cape Province have worked with actuaries to develop an equitable district allocation formula, which is under discussion.
The private health care industry in South Africa is substantial, consuming large proportions of the country’s available resources in the form of general practitioners, specialists, nurses, hospitals, and hospital beds.
Medical schemes are at the front and centre of the private health care industry due to their role as the main vehicle for providing financing. The medical schemes industry is broad and fulfils the roles of financing, pooling, managed care and administration30 Notwithstanding the contribution made by medical schemes towards private financing for health care, they are perceived partly as drivers of the inequality and inefficiencies that have been and remain a key feature of the South African health care system. The Health Market Inquiry (see below), discussed elsewhere in this chapter, has brought into focus a range of factors that are leading to affordability problems in the medical scheme environment.
According to the NHA exercise done in 2013/2014, South Africa invests 8.7% of its GDP on health expenditure. The proportions of health expenditure covered in both the public and private sectors were split almost evenly at 47% and 43%, respectively, despite more than 80% of the population relying on the public sector. This is notwithstanding the observed ‘maldistribution of resources between the public and private health sectors relative to the population each serves’31. The amount spent by a medical scheme beneficiary translates to a multiple of five times the amount per capita compared to that available to a patient funded by tax in the public sector. Annual contributions paid by members to medical schemes increased from R151.6 billion in 2015 to R205.8 billion in 2019, but the total number of medical scheme beneficiaries has on average either stagnated or declined over the same period,
showing negative growth between 2014 and 2017 and a slight increase in 2019. There is evidence to suggest that members are migrating to lower-cost benefit options or deregistering dependents as a result of affordability pressure.
The amount paid in contribution in terms of beneficiaries per capita has increased from R17 272 in 2015 to R22 891 in 2019, vs R4 667 per capita in the public sector. The rate of contribution increases has consistently exceeded the Consumer Price Index during the past 20 years. Medical schemes are subject to limited income cross-subsidisation through a tax credit applied to partially offset contributions. It has been argued by some that the tax credit is a subsidy to higher-income earners and that it must be removed. A counter argument is that the tax credit has the effect of alleviating pressure from health facilities in the public sector, and after introducing caps it is now smaller per person than the public sector subsidy. As NHI evolves it is likely that this tax subsidy will be progressively phased down, although this is partly dependent on acceptable alternate arrangements being put in place under the NHI.
The largest share of expenditure in the private sector goes to private hospitals, followed closely by pharmaceuticals and medical specialists, as illustrated in Figure 18.6 below.
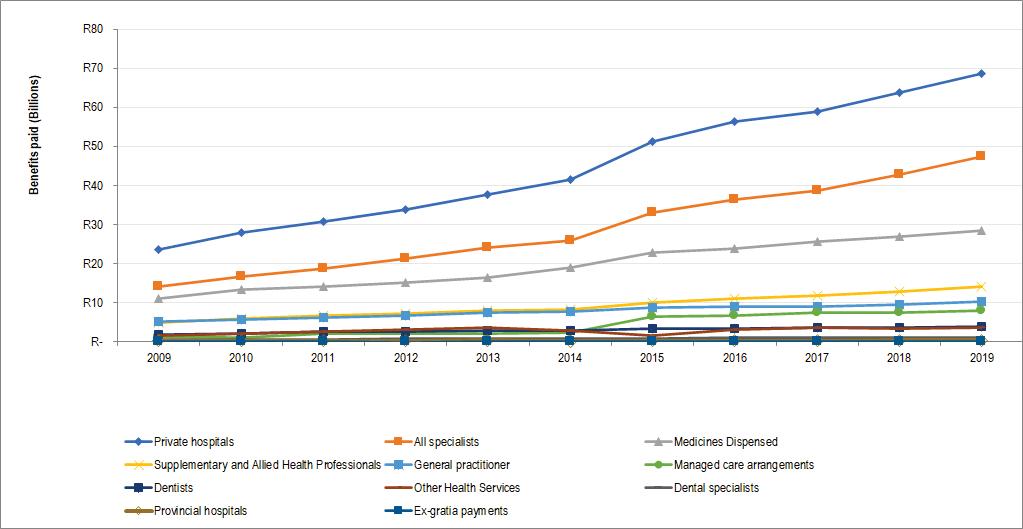
Figure 18.6 Private medical scheme expenditure by factor of provision, 2009–2019
Source: Authors
The Health Market Inquiry published its final report and recommendations in September 2019. The Inquiry had been instituted by the Competition Commission of South Africa in 2014 to investigate factors that were preventing, distorting, or restricting competition in the private health sector.32 The Inquiry was established after concerns from the national government that the nature of price determination and lack of competition were resulting in excessive pricing. A review of the HMI report shows that even though its focus was the private health care market, it covers many areas that are key to health system reform and has implications for the roll-out of the NHI. The HMI report provides a systematic and comprehensive documentation of issues plaguing the South Africa health system, albeit with a private health care sector focus.
The Inquiry notes that ‘the South African private health sector suffers from multiple market failures. The sector comprises a complex set of interrelated stakeholders who interact with one another in an imperfect environment replete with information asymmetry, a lack of transparency and moral hazard’.
The HMI makes important findings on the supply of practitioners, who are important for successful roll-out of the NHI. In particular, the inquiry concludes that better use of available practitioners could result in improved access and costs. While there are valid concerns on the shortage of practitioners in the country, there is sufficient indication that practitioners are concentrated in the private sector despite the medical scheme population remaining stagnant for a sustained period. The HMI found that practitioners are concentrated in the private sector at a rate of 1.75 per 1 000 population for specialists and just under 1 per 1 000 population for general practitioners. This is in stark contrast to the public sector where these ratios are 0.1 for specialists and 0.4 for general practitioners. Of interest to the NHI is that most doctors are concentrated in provincial capitals and metropolitan areas, which has implications for access for the population outside of these areas. The design of the NHI would either need to introduce incentives for doctors to consider relocating to undersupplied areas or put in place innovative referral mechanisms that enable the population in remote locations access to doctors. Another observation made by the inquiry is that doctors are accustomed to working in solo practices, except for single-discipline group practices such as radiologists, some anaesthetists, and corporate pathology groups (Nkonki et al., 2019). For health care service delivery under the NHI to function as envisaged, the introduction of multidisciplinary groups that allow for more efficient referral of patients would be necessary.
The inquiry identifies behaviour that contributes to wastage of resources such as inappropriate use of services of specialists by patients and unnecessary referrals to high care wards and ICUs. Hospital admission rates were observed to be increasing at 1.99% on a yearly basis between 2010 and 2014. The increase in hospital admissions is associated with the concentration of specialists, a finding which led the inquiry to conclude that supplier-induced demand existed.
The Inquiry recommended amongst others:
• changes to the way scheme options are structured to increase comparability between schemes and increase competition in that market;
• a system to increase transparency on health outcomes to allow for value purchasing;
• a set of interventions to improve competition in the market through a supply side regulator.
One of the key recommendations of the HMI is the introduction of a standardised benefit structure, as follows:
‘Alongside the standardisation of benefits, a risk adjustment mechanism must be implemented. The risk adjustment mechanism will “equalise” risk associated with the standard benefit option across all schemes. Risk adjustment would be of little use if it is not applied to a standard basket of benefits. In the absence of a standard package, it would be impossible to measure the risk across schemes fairly. Therefore, as indicated above, the HMI proposes that a risk adjustment mechanism be implemented for the base benefit package to be offered by all schemes.’
Importantly, the recommendation to introduce a risk adjustment mechanism was not new and earlier in 2005, the Council for Medical Schemes had started a process to simulate implementation of such an intervention. The effort was abandoned when implementation of the NHI was announced in 2009. A key concern with the medical schemes’ environment is the fragmentation of risk pools through the proliferation of numerous benefit options. The recommendation to formulate a standardised benefit package on which a risk-adjustment mechanism would be applied is a plausible option to alleviate this concern.
The HMI report has been characterised as the most systematic and comprehensive investigation carried out into the South Africa private health sector.33 Since publication of the report however, there has not been extensive debate of the key findings and recommendations and the NDoH has not yet given any signal that it would seek to investigate implementation of any of the recommendations.
The HMI recommended that the role of the Council for Medical Schemes be extended and that it should define a new base benefit package which would be part of the foundation to create a basic package for the NHI. The creation of a new base benefit package is recommended alongside the creation of a risk-sharing mechanism.
Currently, both the public and private sectors struggle with the provision of a comprehensive set of services.
In the public sector, the challenges can be summarised as:
a) Service delivery is organised in terms of levels of care, however, facilities of equal level of care do not provide the same set of services.
b) Access to resources – financial, human, medicines, equipment and supplies, are all contributors to inequity in access to services.
c) Quality of care and ability to maintain service delivery standards is another indicator of poor, or inequity in access.
The lack of providing people with equal treatment is not unique to the public sector. Private sector challenges include:
a) Every year, benefits are reduced, in terms of benefit limits or types of interventions that will be funded.
b) Primary health care is largely discretionary and not a prescribed minimum benefit, and used more from a competitive advantage perspective as opposed to ensuring access to care.
Inequity in access tends to be driven by income and contribution levels as compared to geographic access in the private sector. A costed service benefit framework, that is provided within both the public and private sectors is critical to ensuring the NHI is able to transition towards UHC. The key question is how to get there. During the time period covered by the review, the following key activities were initiated that began the movement towards a single common set of services and other financing reforms:
a) Approval of the White Paper on NHI
b) Draft NHI Bill was approved by Cabinet and submitted to Parliament for consideration
c) Draft Medical Schemes Act Amendment Bill was published for public comment.
In addition, various transition processes were initiated:
• In the public sector, the National Treasury commissioned development of a new formula for the health component of the Provincial Equitable Share formula, which takes into account population weighted by age and sex, deprivation index, rurality and premature mortality, amongst others. The new formula has now been adopted and is being phased in from 2022/23 and onwards and will contribute to more equitable provincial allocations. A potential district allocation formula was also developed, complementing regular reviews of district spending.28
• In the private sector, whilst the amendment to the Medical Schemes Act is required, the Council for Medical Schemes has started a process of drafting new regulations that replace the prescribed minimum benefits with a standard set of services that every benefit option provides for.
Although public sector health budgets increased in real terms and per capita during the period of review, these increases were to a large extent offset by growing cost pressures and other challenges in the sector, such as accruals, medico-legal claims, increasing personnel costs, and pressures in the goods and services budgets. These areas are discussed below.
Table 18.6 shows the total value of unpaid accounts/invoices between 2015/16 and 2020/21. The total value of these accounts increased from R10.2 billion in 2015/16 to R15.3 billion in 2020/21. However, there has been a notable year-on-year reduction between 2018/19 and 2019/20, mostly in Gauteng, Limpopo and Mpumalanga. There are large differences between provinces when looking at the annual growth rates of accruals, with the Eastern Cape (23%), Western Cape (18%) and North West (14%) showing the largest annual increases in the period. The year-on-year increase in 2020/21 amounted to R2.4 billion, with Gauteng and Eastern Cape as the main drivers.
Table 18.6 Accruals and payables not recognised (unpaid accounts), 2015/16 – 2019/20
To understand the budget impact of accruals it is useful to show them as a percentage of expenditure, as described in the table per province. One can note that the Eastern Cape is particularly badly affected by the unpaid accounts, as accruals was equivalent to around 16% of total provincial expenditure in 2019/20.
Spending on health personnel increased from R96.7 billion in 2015/16 to R131.2 billion in 2019/20, representing an annual average growth rate of 7.9% over the period (Table 18.7) (see also discussion in the Chapter on Human Resources for Health). The most significant increases were in the North West, Northern Cape and Gauteng. Personnel numbers overall were, however, on a declining trajectory between 2015/16 and 2018/19 before increasing significantly in 2019/20. However, some categories, such as doctors, have increased consistently during this period (Table 18.8). The main driver in expenditure growth in human resources relates mainly to wage increases, as the average CoE expenditure per employee increased from R312 874 in 2015/16 to R412 220 in 2019/20iii. There was a decline from 2021/22 to 2022/23 due to the once-off funding allocated for COVID-19 response and a reduction in budgets for compensation of employees over the 2021 MTEF.
Limpopo spends close to 70% of its budget on compensation of employees, which crowds out spending on medicines, medical supplies and other key service delivery costs, and moving forward the province needs to better control its personnel spending.
iii Authors’ calculations based on data presented in Tables 18.6 and 18.7.
The public sector provincial personnel numbers started increasing in 2019/20 driven mostly by increases in medical practitioners and professional nurses. The increase in the number of employees in the Free State, KZN, Limpopo and the North West relate to community health workers (CHWs). The Free State and Limpopo added over 2 000 and 8 000 CHWs from May 2019, respectively, but this reflects more the addition of these cadres to the government PERSAL system, as opposed to more feet on the ground. Further increases in 2020/21 were driven by additional appointments as part of the COVID-19 response.
Table 18.7 PDoH compensation of employees’ expenditure, 2015/16 – 2023/24
There is a skewed distribution of medical specialists across provinces (e.g. 24 per 100 000 in Western Cape vs 1 per 100 000 in Limpopo), with a high concentration in Gauteng and the Western Cape, partly since six of the country’s 10 central hospitals are in these two provinces (Table 18.9). The average number of medical specialists per 100 000 uninsured population has decreased from 11 per 100 000 in March 2016 to 10 per 100 000 in March 2020. The decline emanates mainly from Gauteng and the Western Cape, which account for the highest number of specialists. The number of doctors has increased between 2016 and 2020, but there are many provinces that experienced fluctuations over the same period. The number of professional nurses per 100 000 population declined from 153 to 151 during the same period (Table 18.9). Despite uninsured population increases, the number of nurses decreased in absolute terms in provinces such as the Free State and Limpopo.
As shown in Table 18.10, goods and services spending per capita (uninsured population) increased by 8.5% per year between 2015/16 and 2019/20 and is expected to increase by 4.6% per year between 2015/16 and 2023/24. The highest increases were in Limpopo and the Eastern Cape, though the two provinces are still spending below the national average. The Northern Cape has the highest spending per capita compared to other provinces followed by Gauteng, KZN and the Western Cape. The high spending in the Northern Cape could be partially attributed to population sparsity, which is one of the factors driving health expenditure across many countries. Spending per capita is projected to decline significantly in real terms between 2020/21 and 2023/24, mainly due to the once-off additional funding made available for COVID-19 response and fiscal constraints over the MTEF. These numbers will need to be continuously re-evaluated as the budget reductions over the MTEF are substantial in key goods areas.
The sector saw an explosion of medico-legal claims during the period. Table 18.11 shows that, between 2015/16 and 2020/21, the contingent liability on medico-legal claims more than doubled from R43.1 billion to R120.3 billion. Actual expenditure on settlements is much lower, but grew from R985 million to R1.7 billion during the same period. Eastern Cape accounts for the highest share of the contingent liability at 37.7% followed by Gauteng and KZNiv. The average annual growth rate of medical legal liabilities is around 23%, meaning that even though payments are less than 1% of liabilities, their budget impact is growing exponentially. Generally, provincial budgets for medico-legal payments are conservative or not budgeted for at all during the period under review and many reforms are required in the area of medico-legal.
Table 18.11 Medico-legal claims contingent liability, 2015/16 – 2020/21
iv It is important to note that each province uses its own ‘method’ to measure contingent liabilities, which makes cross-provincial comparison difficult.
Cerebral palsy-type claims make up around 50% of all claims and 60% of total liabilities. Effective interventions targeted at obstetrics and gynaecology would therefore likely demonstrate significant return on investment. The problem is also highly skewed to a set number of facilities, with around 4% of facilities representing 84% of the claims. Although quality of care in the public sector is often inadequate and is one of the root causes, this escalation cannot be explained merely by an increase in malpractice and negligence. There are several and often complex reasons, including increasingly litigious behaviour from law firms that target the sector. Many provincial health departments have struggled to cope with this pressure and are left partly defenceless due to weak legal capacity, inadequate processes for managing claims, poor record keeping (with some cases relating to incidences more than a decade old), and in some instances fraudulent claims and allegations of corruption. The South African Law Reform Commission has made some recommendations for coming to terms with this problem. The NDoH has established a central expert medical specialist team to assist provinces with medico-legal matters. Amendments to the State Liability Act of 1957 have been proposed to provide for periodic payments (rather than lump sums) and for future medical treatment to be provided by the state in kind instead of paying high private sector rates. Other reforms, which have been implemented by other countries and need to be explored in more detail in South Africa include a no-fault compensation system, capping of claims and defined schedules, mediation, doing away with once-and-for-all payments, and focusing more on rehabilitation and other interventions.
The health sector with National Treasury and the provincial treasuries initiated a Joint Health Action Plan to assist the sector to devise accrual intervention strategies; better align procurement plans with approved budgets and cash flow projections; and address procurement, supply chain, medico-legal and infrastructure issues. Joint projects are being undertaken in some provinces in the sector in order to improve financial management and human resources. Such projects include the piloting of the approved post lists and budget monitoring tools for hospitals in Mpumalanga and Free State which are working with the Western Cape to roll these out. A health system review is being undertaken in North West province.
National Treasury is drawing from international experience in attempting to introduce some aspects of gender-responsive budgeting. The new provincial equitable share formula, used to allocate funds to provinces contains elements which include age and sex and fertility, to take into account differential costs such as for maternity. Health service utilisation rates tend to be higher amongst women. More attention may need to be given to a number of specific reproductive health and other services.
The last year of the period in focus was marked by the global health security crisis caused by the COVID-19 pandemic (see Chapter on Emergencies and COVID-19).
Financing the health response to the COVID-19 pandemic
A special adjustments budget was tabled in June 2020, allocating or reprioritising more than R21 billion to the health sector’s response (Table 18.12), the vast majority going to provincial departments of health which together received a net budget increase of R17 billion, with further amounts reprioritised internally.
Table 18.12 Summary of health allocations for COVID-19 in the 2020 special adjustments budget
South Africa initially chose to procure vaccines via COVAX, with agreements signed in December 2020, but shortly thereafter also sourced vaccine supply directly from manufacturers, primarily Pfizer and Johnson & Johnson. To this end, a total of R15.3 billion has been allocated over 2021/22 and 2022/23 for purchasing and administering vaccines. Amounts of R8 billion in 2021/22 and R7.4 billion in 2022/23 have also been allocated to the sector for responding to further waves of infections.
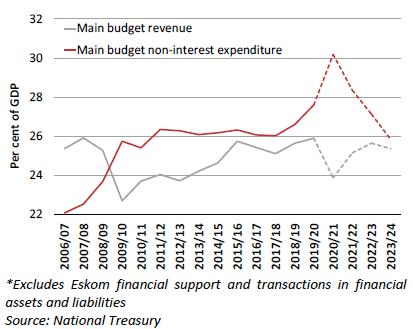
The economic impact of the pandemic and the ensuing lockdown measures were massive, with GDP contracting by -7% in 2020.34 Revenue in 2020/21 dropped considerably and coupled with the fiscal response package, it resulted in a government deficit of approximately 15% of GDP in that year Error! Reference source not found. The carry-through implications of the economic contraction on government budgets are severe, with Budget 2021 containing budget reductions of R264 billion over three years to stabilise debt by 2024/25 and avoid a sovereign debt crisis.35
Source: National Treasury
These reductions impact all sectors, including health, with R76.4 billion of reductions in provincial health departments between 2021/22 and 2023/24.v For the first time in over two decades, real per capita expenditure on health is expected to decline between 2020/21 and 2023/24 (Figure 18.8), even compared to pre-pandemic levels.
v Author calculations based on nine tabled provincial 2021/22 Estimates of Provincial Revenue and Expenditure
Source: Authors
A considerable share of these reductions could be absorbed by savings from a public sector wage freeze, given that over 60% of health budgets are spent on compensation of employees. However, the total reductions exceed these potential savings and will have to be managed carefully so as not to harm frontline services. As revenue projections improved somewhat for Budget 2022, additional allocations were made to the sector to partially reduce the impact of the previous budget reductions. These additions are not reflected in the tables presented in this chapter.
It is possible that the NHI model envisaged in the current NHI Bill may have been significantly challenged by the events that unfolded in 2021, when financial irregularities and capacity constraints emerged in the NDoH, especially around the Digital Vibes sagavi. This matter is likely to weaken public confidence in a monopolistic central NHI Fund controlled substantially by a small number of individuals. It would be a pity if this derailed the entire NHI permanently. However, spill-over effects of the scandal might prompt re-examination of aspects of the model, noting that there are many successful but different models of NHI internationally, including single vs multiple funds, centralisation vs decentralisation (c.f. Australia, Canada, Netherlands and German models) and the location, nature and balance of powers. For example, the Thai Universal Care Fund is under a diverse board with multiple different stakeholders from different constituencies providing a balance of powers.
Trust needs to be built for NHI, through manifest improvement in options and services. Compromise might be required around sections of the Bill such as Section 33 to avoid endless legal challenges. Attention needs to be given to building compromise around the Bill and subsequent reforms. Part of this is giving users greater rather than fewer choices and includes building mixed provider platforms in an effective and efficient way, using smart strategic purchasing and systems.
Confidence of provinces needs to be retained, through rapid re-introduction of delegation of responsibilities for service delivery (noting that legal shift of function to national sphere is required to centralise funding). Without this not only will provincial powerbases obstruct the reforms, but major risks arise in which parts of the health service could collapse in an interregnum in which functions and funds are transferred to the centre. NHI continues to offer major opportunities for the sector, however, opportunities in this regard have not been used to best advantage over the period reviewed.
COVID-19 and its associated lengthy lockdowns have caused severe damage to the fiscus, which is likely to take at least three years to fully recover36. As shown above, although health budgets were augmented for COVID-19 in 20/21, as the effect of the pandemic and prolonged economic lockdowns fed through to the fiscus, health budgets over the MTEF were substantially reduced by R76 billion in Budget 2021, as a result of the economic recession, weaker fiscal position and worsening debt position following COVID-19 and prolonged lockdowns37. In this context, funding major new policies such as NHI is likely to be difficult, also noting competing spending pressures. Because of this, if major new system reforms are not very well managed, are not building trust and consensus, and not showing evidence of strong performance, they are unlikely to compete effectively.
vi https://www.gov.za/speeches/minister-joe-phaahla-response-release-investigation-reportdigital-vibes-communication
1) The Portfolio Committee on Health and Government should review aspects of the model of NHI, including in the NHI Bill, to rebuild confidence, noting that a range of successful NHI models exist internationally. This might include reviewing single vs multiple funds, balance of centralisation vs decentralisation and vesting and balance of powers. Substantial improvements in managerial capacity to implement NHI reforms are required, since progress on this key reform has been jeopardised by poor progress and insufficient managerial capacity for implementation.
2) The COVID-19 pandemic has substantially threatened the fiscus and placed health and other social sectoral budgets at risk over the MTEF. This will require continued budgetary evaluation. Health outcomes after years of improvement have been significantly threatened by COVID-19 and service disruptions and backlogs have occurred. Widespread roll-out of COVID-19 vaccinations and addressing services backlogs will be required to get health outcome improvements back on track.
3) The new health component of the Provincial Equitable Share formula has provided an important update to the formula and improved equity, benefiting poorer provinces such as Eastern Cape and Limpopo. Progress in its implementation should be monitored.
1. Department of Health. National Health Insurance policy towards universal healthcare. Government Gazette 2017; 627: 30 June 2017.
2. National Department of Health. National Health Insurance in South Africa – Policy Paper. Pretoria: National Department of Health, 2011.
3. Blecher MS, Daven J, Harrison S, et al. National Health Insurance: Vision, Challenges and Solutions. In: Moeti T, Paradath A, editors. South African Health Review 2019. Durban: Health Systems Trust; 2019. Available at: http:// www.hst.org.za/publications/Pages/SAHR2019
4. Minister of Health. National Health Insurance Bill, 2019. Government Gazette; 209: B11.
5. Department of Health. White Paper on the transformation of the health system in South Africa. Governmet Gazette, Pretoria: 1997.
6. Blecher MS, Pillay A, Patcharanarunamol W, et al. Health financing lessons from Thailand for South Africa on the path towards universal health coverage. South African Medical Journal. 2016;106(6):533–6.
7. Ramjee S. Support for National Health Insurance and Infrastructure investment. National Treasury. Government Technical Advisory Service; Pretoria: 2018.
8. Moosa S. Support to the implementation of NHI capitation reforms contract model National Treasury, GTAC, Pretoria: 2018.
9. Minister of Health. National Health Insurance Bill, 2019. Government Gazette; 209: B11.
10. Office of Health Standards Compliance. Annual Inspection Report, 2018/19. Pretoria: OHSC, 2019. Available at: https://ohsc.org.za/wp-content/uploads/ Annual-Inspection-Report-_2018-19_Report_02-Mar-20-1.pdf
11. Sparkes SP, Bump JB, Özçelik EA, Kutzin J, Reich MR. Political economy analysis for health financing reform. Health Systems & Reform. 2019 Jul 3;5(3):183–94.
12. Croke K, Mohd Yusoff MB, Abdullah Z, Mohd Hanafiah AN, Mokhtaruddin K, Ramli ES, Borhan NF, Almodovar-Diaz Y, Atun R, Virk AK. The political economy of health financing reform in Malaysia. Health Policy and Planning. 2019 Dec 1;34(10):732–9.
13. Matcoso MP, Hunter JR, Brijlal V. Embedding quality at the core of universal health coverage in South Africa. Lancet Glob Health. 2018;6(11). Available: https:// www.thelancet.com/journals/langlo/article/PIIS2214-109X(18)30323-1/ fulltext
14. World Health Organization. The world health report 2008: Primary health care now more than ever. 2008. Geneva, Switzerland: World Health Organization. Available: http://www.who.int/whr/2008/whr08_ en.pdf.
15. Wong ST, Browne AJ, Varcoe C, et al. Development of health equity indicators in primary health care organizations using a modified Delphi. PLoS One. 2014;9(12). Available at: https://www.ncbi.nlm.nih.gov/pmc/articles/PMC4257722/pdf/ pone.0114563.pdf
16. Joint United Nations Programme on HIV/AIDS. Fast-track ending the AIDS epidemic by 2030. [Internet] Available: https://www.unaids.org/sites/default/ files/media_asset/JC2686_WAD2014report_en.pdf
17. World Health Organization. Spending targets for health: no magic number. 2016. [Internet] Available: https://www.who.int/health_financing/documents/ no-magic-number/en/
18. World Health Organization. The Abuja Declaration: ten years on. [Internet] Available: https://www.who.int/healthsystems/publications/abuja_report_ aug_2011.pdf?ua=1
19. Koch SF, Setshegetso N. Catastrophic health expenditures arising from out-of-pocket payments: Evidence from South African income and expenditure surveys. PloS One. 2020 Aug 11;15(8):e0237217.
20. Mutyambizi C, Pavlova M, Hongoro C, et al. Incidence, socio-economic inequalities and determinants of catastrophic health expenditure and impoverishment for diabetes care in South Africa: a study at two public hospitals in Tshwane. Int J Equity Health. 2019;18:73.
21. Serje J, Bertram MY, Brindley C, Lauer JA. Global health worker salary estimates: an econometric analysis of global earnings data. Cost Effectiveness and Resource Allocation. 2018 Dec;16(1):1–9.
22. Hernandez-Peña P, Poullier JP, Van Mosseveld CJM, et al. Health worker remuneration in WHO Member States. Bulletin of the World Health Organization 2013;91:808–815.
23. The Global Fund. The Africa Scorecard on Domestic Financing for Health. 2017. [internet] Available: https://scorecard.africa/
24. World Health Organization (WHO). Health Systems Financing: The Path to Universal Coverage. World Health Report 2010, WHO, Geneva. 2010. [Internet] Available: https://www.who.int/whr/2010/en/
25. The Global Fund. The Africa Scorecard on Domestic Financing for Health. 2017. [internet] Available: https://scorecard.africa/
26. McIntyre D, Brijlal V, Nkosi, M. Chapter 6: Health systems financing. In: Matsoso MP, Fryatt RJ, Andrews G (eds). The South Africa health reforms 2009–2014: Moving towards universal coverage. Cape Town: Juta and Company; 2015.
27. National Treasury. Estimates of Provincial Revenue and Expenditure. [Internet] Available: http://www.treasury.gov.za/documents/provincial%20budget/ default.aspx
28. Massyn N, Day C, Ndlovu N, Padayachee T. District Health Barometer 2019/20 datafile. Durban: Health Systems Trust; 2020. Available: https://www.hst.org.za/ publications/Pages/DHB2019-20.aspx
29. National Department of Health. National Health Insurance White Paper. Pretoria: NDoH; 2017.
30. Ramjee S, Vieyra T, Abraham M, Kaplan J, Taylor R. National Health Insurance and South Africa’s Private Sector. In: Padarath A, English R, editors. South African Health Review 2013/14. Durban: Health Systems Trust; 2014. Available: http:// www.hst.org.za/publications/south-african-health-review-2013/14
31. McIntyre D. How can we best achieve a universal health system? A public conversation. In. Moeti T, Padarath A, editors. South African Health Review 2019 Durban: Health Systems Trust; 2019. Available: http://www.hst.org.za/ publications/Pages/SAHR2019
32. Nkonki L, Bhengu N, Ramokgopa M, Fonn S. The Health Market Inquir y and its potential contribution to improving health systems functioning in South Africa. In: Moeti T, Padarath A, editors. South African Health Review 2019. Durban: Health Systems Trust; 2019. Available at: http://www.hst.org.za/publications/ Pages/SAHR2019
33. Solanki GC, Wilkinson T, Cornell JE, Besada D, Morar RL. The Competition Commission Health Market Inquiry Report: An overview and key imperatives. South African Medical Journal. 2020 Feb 1;110(2):88–91.
34. StatsSA. Gross domestic product: Fourth quarter 2020. Pretoria: StatsSA, 2021. Available at: http://www.statssa.gov.za/publications/P0441/P04414th Quarter2020.pdf
35. National Treasury. Budget Review 2021. Pretoria: National Treasury, 2021. Available at: http://www.treasury.gov.za/documents/national%20budget/2021/ review/FullBR.pdf
36. National Treasury. Budget Review 2021. National Treasury, Pretoria: 2021. www.treasury.gov.za
37. Blecher MS, Daven J, et al. COVID-19 Lives and Livelihoods. Annual Health Review 2021. Heath Systems Trust; Durban: in press.