PROPOSED RENOVATIONS

ROSEHILL GARDENS The new owner can take advantage of the value add opportunity and remodel these apartments with granite countertops, stainless appliances, new cabinets, modern light fixtures, and a bathroom vanity providing an estimated $276 monthly premium on rents, capturing a 44% ROI on unit upgrades. ITEM 2 BEDROOM Granite Countertop $1,500 Stainless Appliance Package $1,850 New Kitchen Cabinets $2,000 Modern Light Fixtures $1,150 Bathroom Vanity $1,000 Total $7,500 $7.5K/UNIT $276/MONTH 44% AVG RENO COST AVG RENT INCREASE ROI

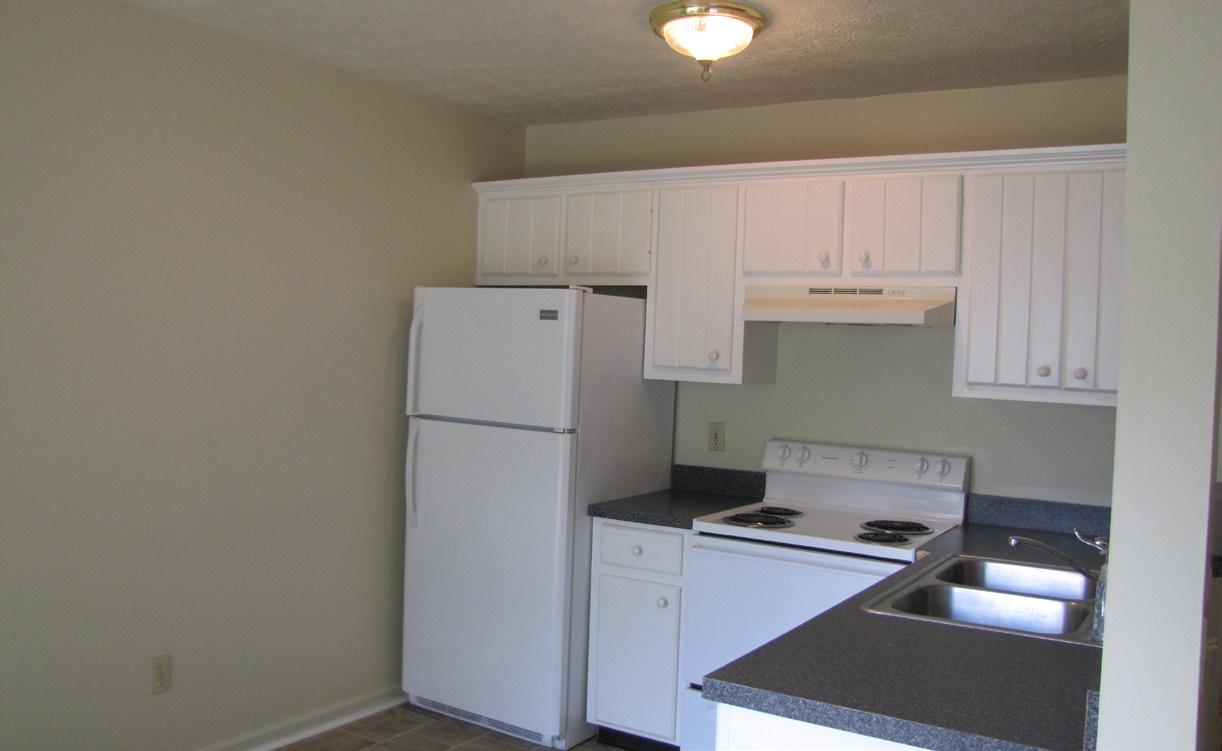
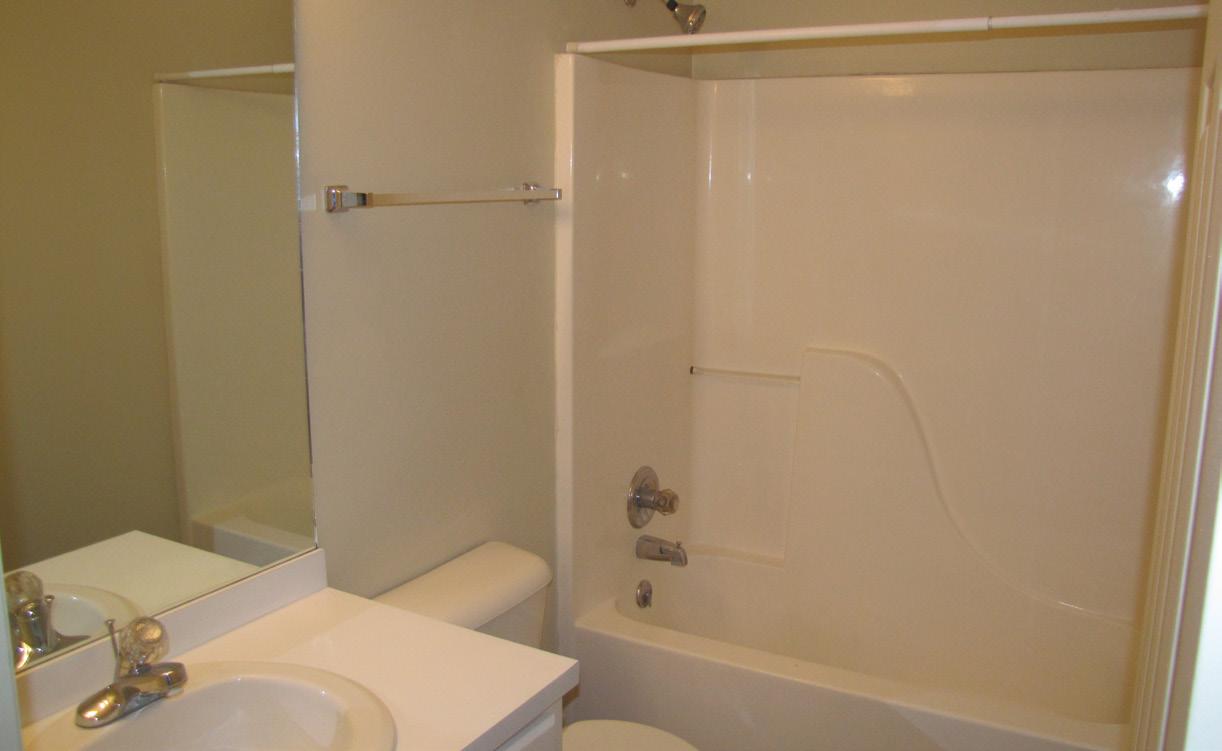


2 3 1 4 3 5 5 5 5 1 2 3 3 4 3 PROPOSED RENOVATIONS GRANITE COUNTERTOPSBATHROOM VANITY MODERN LIGHT FIXTURES1 2 3 NEW KITCHEN CABINETS4 STAINLESS STEEL APPLIANCES5

02SECTION LOCAL COMPETITORS

COMPETITORS

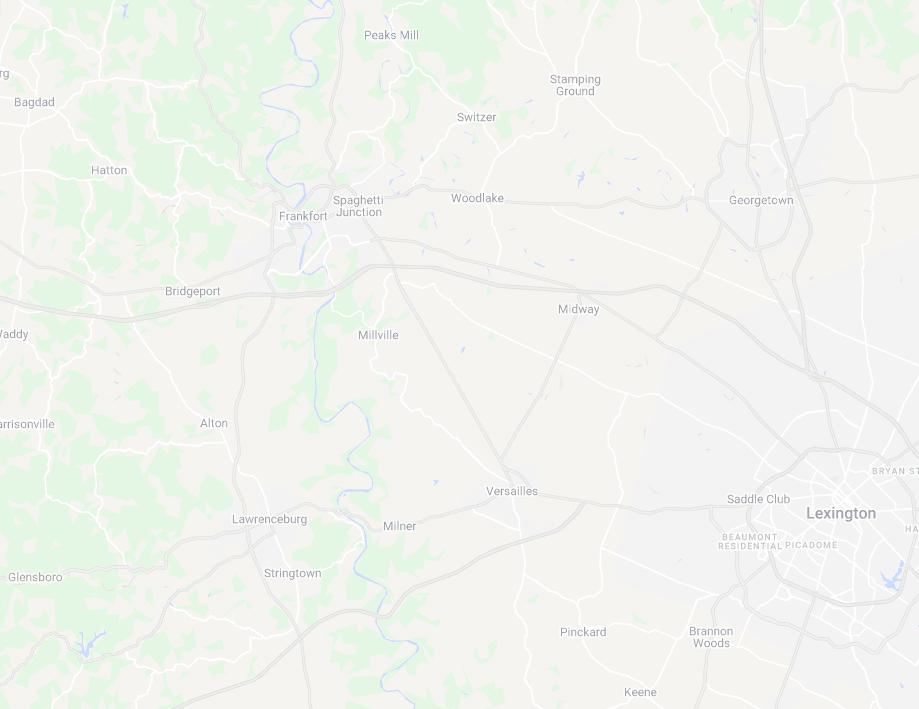
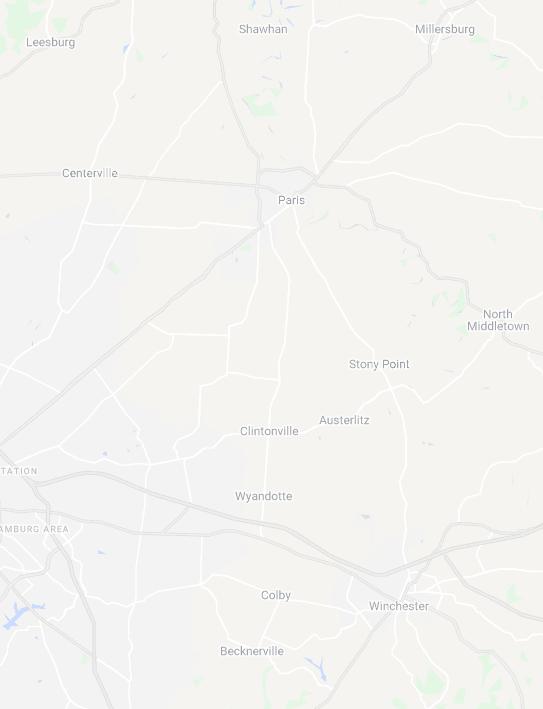
* 1 541 BEECH STREET 2 WOOLDRIDGE APARTMENTS 3 HAVERFORD PATH 4 3121 DALY PLACE RENT COMPARABLES 2 4 1 3 ROSEHILL TOWNHOMES
Three Bedroom Townhome Rents
Sorted by Net Rent
Haverford Place 2001 3x2 $1,690.00 $0 $1,690 $1.23
Wooldridge Apartments* 2013 3x3 $1,542.00 $0 $1,542 $1.17

Bridgewater Townhomes* 2017 3x2.5 $1,529.00 $0 $1,529 $1.13
Rabbit Run Apartments 1998 3x3 $1,475.00 $0 $1,475 $0.74
541 Beech St 2007 3X2.5 $1,414.00 $0 $1,414 $0.95
3121 Daly Pl 2010 3x2.5 $1,406.00 $0 $1,406 $1.00
Rosehill Townhomes Pro Forma 1995 3x2 $1,373.00 $0 $1,400 $1.04
The Pines 1996 3x2 $1,347.00 $0 $1,347 $0.67
Waveland Townhomes 2009 3x2.5 $1,301.00 $15 $1,286 $0.87
Sandersville Townhomes 2012 3x2.5 $1,252.00 $15 $1,237 $0.84
Baybrook Townhouses 2006 3x2.5 $1,025.00 $0 $1,025 $0.85
Rosehill Townhomes Average Effective 1995 3x2 $939.00 $0 $1,006 $0.75
Averages $1,366 $15 $1,363 $0.94
Property Built Unit Type Market Utility Adjustment/Month Rent Rent/SF
Year
Rent
Net
Net


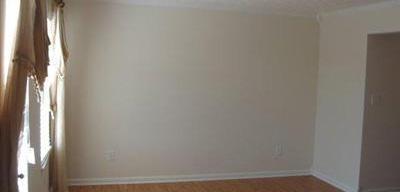
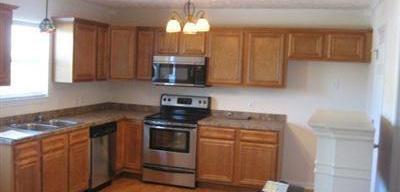

541 BEECH STREET LOCAL COMPETITORS 541 BEECH STREET VERSAILLES, KY PROPERTY SUMMARY Year Built 2007 Units 33 Occupancy 100% Common Amenities: n/a Unit Features: Air Conditioning Kitchen Carpet Oven Heating Refrigerator UNIT MIX & RENT SCHEDULE UNIT TYPE RENT SF RENT PER SF 3x2 $1,414 1,496 $0.95


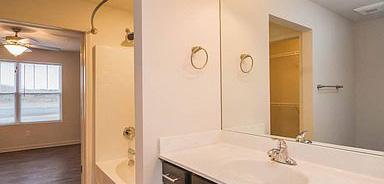

WOOLDRIDGE APARTMENTS LOCAL COMPETITORS 224 CHENEY ROAD, VERSAILLES, KY PROPERTY SUMMARY Year Built 2013 Units 156 Occupancy 98% Common Amenities: 24 Hour Access Walking/Biking Trails Property Manager on Site Unit Features: Air Conditioning Refrigerator Hardwood Floors Washer/Dryer UNIT MIX & RENT SCHEDULE UNIT TYPE RENT SF RENT PER SF 3x3 $1,542 1,317 $1.17


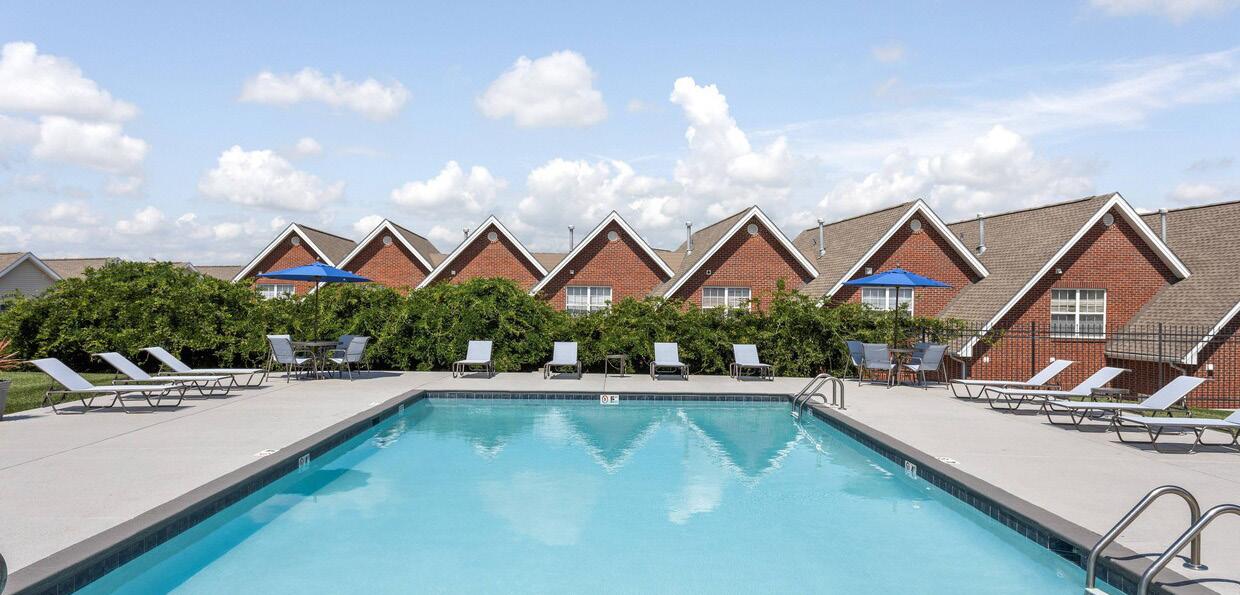

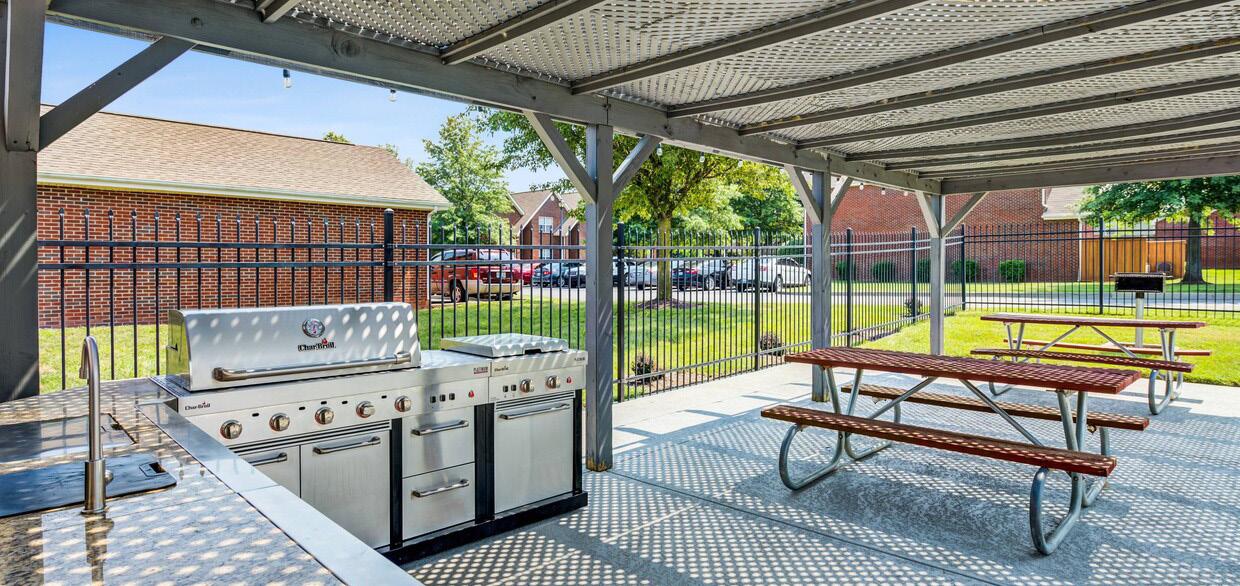
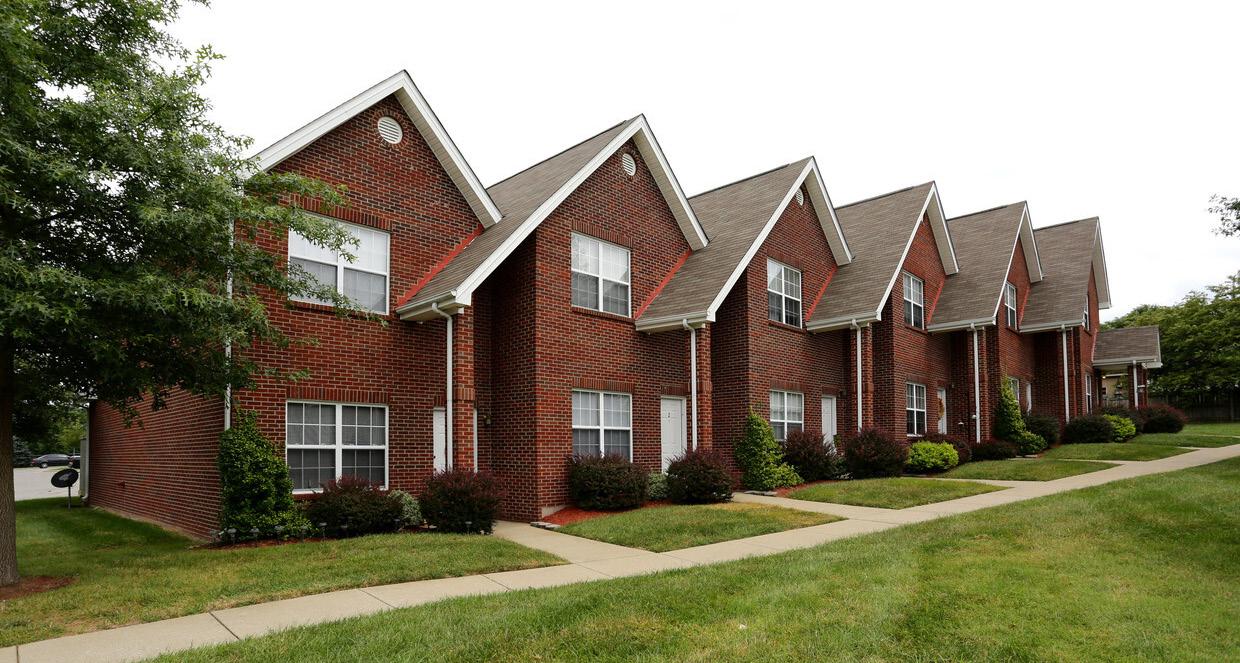
HAVERFORD PLACE LOCAL COMPETITORS 101 HAVERFORD PATH, GEORGETOWN, KY PROPERTY SUMMARY Year Built 2001/2018 Units 160 Occupancy 100% Common Amenities: Business Center Maintenance on site Clubhouse Package Service Fitness Center Playground Furnished Units Available Laundry Facilities Unit Features: Walk-In Closets Dishwasher Cable Ready Microwave Vinyl Floorin Washer/Dryer Hookup Ceiling Fans Disposal UNIT MIX & RENT SCHEDULE UNIT TYPE RENT SF RENT PER SF 3x2 $1,414 1,496 $0.95



3121 DALY PLACE LOCAL COMPETITORS 3121 DALY PLACE, LEXINGTON, KY PROPERTY SUMMARY Year Built 2010 Units 5 Occupancy 100% Common Amenities: Unit Features: In Unit Washer & Dryer Air Conditioning Dishwasher Refrigerator Gargage UNIT MIX & RENT SCHEDULE UNIT TYPE RENT SF RENT PER SF 3x2.5 $1,406 1,406 $1.00


CONDO CONVERSION * 5 1 2 4 3 ROSEHILL TOWNHOMES 197 BERRY AVE 381 CHRUCH STREET 211 BERRY AVE 185 SPRING RUN ST 227A BLACKHAWK CIR 1 2 3 4 ROSEHILL TOWNHOMES 5 * Opportunity for new ownership to convert townhome units into parceled condos and sell-off individually. Condo sales in Ver sailles average $185,000 over the past 24 months.
UNIX MIX BREAKDOWN
3BR/2BA

AVERAGE EFFECTIVE MARKET PROJECTED UNIT TYPE NO. OF UNITS TENTABLE SF TOTAL SF RENT/UNIT RENT/SF TOTAL RENT POTENTIAL RENT/UNIT RENT/SF TOTAL RENT POTENTIAL RENT/UNIT RENT/SF TOTAL RENT POTENTIAL RENT INCREASE % RENT INCREASE THREE BEDROOM
12 Units 1,250 SF 15,000 SF $883.33 $0.71 SF $10,600 $950.00 $0.76 SF $11,400 $1,300.00 $1.04 SF $15,600 $113 16.10% 3BR/2BA - With Garage 34 Units 1,350 SF 45,900 SF $959.09 $0.71 SF $32,609 $1,150.00 $0.85 SF $39,100 $1,400.00 $1.04 SF $47,600 $113 16.10% Totals / Wtd. Averages 46 Units 1,324 SF 60,900 SF $939.33 $0.71 SF $43,209 $1,097.83 $0.83 SF $50,500 $1,373.91 $1.04 SF $63,200 $113 16.10%
ROSEHILL TOWNHOMES - FINANCIALS
GROSS
%
%
All $606,000 RR 13,174 $758,400 16,487
Gain (Loss) to ($85,200) 14.06% (1,852) ($53,088) 7.00% (1,154)
GROSS RR 11,322
Other
Pet $3,000 T3 0.58% 65 $3,090 0.44% 67
Late Fee $2,500 T3 0.48% 54 $2,575 0.37% 56
Utility $1,740 T3 0.33% 38 $1,792 0.25% 39
Application $1,560 T3 0.30% 34 $1,607 0.23% 35
Total Other $8,800 1.69% 191 $9,064 1.29% 197
GROSS $529,600 11,513 $714,376 15,530
Physical Vacancy ($14,427) T3 2.77% (314) ($35,266) 5.00% (767)

Bad Debt $0 0.00% 0 ($7,053) 1.00% (153)
EFFECTIVE $515,173 83.17% 11,199 $672,057 87.00% 14,610
NON-CONTROLLABLE
Real of Unit of Unit
2020 $28,088 Auditor 5.45% 611 $28,088 4.18% 611
Adjustment for Sale $0 0.00% 0 $51,703 7.69% 1,124
Total Real Estate Taxes $28,088 5.45% 611 $79,791 11.87% 1,735 $13,800 Note 5 2.68% 300 $13,800 2.05% 300 $3,690 T12 0.72% 80 $3,764 0.56% 82 $1,041 T12 0.20% 23 $1,061 0.16% 23
Total $4,730 0.92% 103 $4,825 0.72% 105
Total $46,618 9.05% 1,013 $98,416 14.64% 2,139 $0 0.00% 0 $1,610 0.24% 35 $26,467 T12 5.14% 575 $9,200 1.37% 200 $0 0.00% $1,610 0.24% 35 $26,467 5.14% 575 $12,420 1.85% 270 $49,538 T12 9.62% 1,077 $25,300 3.76% 550
CURRENT (R ent Roll / T12 Income; T12 Expenses) YEAR 1 (S tabilized LTL, Occupancy, and Other Income; Normalized Expenses)
POTENTIAL RENT
of GPR Per Unit
of GPR Per Unit
Units at Market Rent
Lease
SCHEDULED RENT $520,800
$705,312 15,333
Income
Fee-Non Refundable
Reimbursement Fee
Fee Income
Income
POTENTIAL INCOME
GROSS INCOME
Estate Taxes %
EGI Per
%
EGI Per
Taxes Paid
Insurance
Utilities Electric
Water & Sewage
Utilities
Non-Controllable
CONTROLLABLE Contract Services Snow Removal
Landscaping/Grounds
Pest Control
0
Total Contract Services
Repairs & Maintenance
Marketing & Promotion $0 0.00% 0 $3,450 0.51% 75 On-Site Payroll $19,823 T12 3.85% 431 $39,100 5.82% 850 Payroll Taxes & Benefits $0 0.00% 0 $3,450 0.51% 75 General & Administrative $14,563 T12 2.83% 317 $6,900 1.03% 150 Management Fee $27,600 T12 5.36% 600 $33,603 5.00% 730 Replacement & Reserves $11,730 Note 4 2.28% 255 $11,965 1.78% 260 Total Controllable $149,721 29.06% 3,255 $136,187 20.26% 2,961 TOTAL EXPENSES $196,340 38.11% 4,268 $234,603 34.91% 5,100 NET OPERATING INCOME $318,833 61.89% 6,931 $437,454 65.09% 9,510 INCOME EXPENSE INCOME & EXPENSES ROSEHILL TOWNHOMESFINANCIALS
UNDERWRITING NOTES
% of
% of
$781,152 16,982 $804,587 17,491 ($15,623) 2.00% (340) ($16,092) 2.00% (350) $765,529 16,642 $788,495 17,141
$3,183 0.42% 69 $3,278 0.42% 71 $2,652 0.35% 58 $2,732 0.35% 59 $1,846 0.24% 40 $1,901 0.24% 41 $1,655 0.22% 36 $1,705 0.22% 37 $9,336 1.22% 203 $9,616 1.22% 209 $774,865 16,845 $798,111 17,350 ($38,276) 5.00% (832) ($39,425) 5.00% (857) ($7,655) 1.00% (166) ($7,885) 1.00% (171) $728,933 92.00% 15,846 $750,801 92.00% 16,322
% of
% of
$28,088 3.85% 611 $28,088 3.85% 611 $51,703 7.09% 1,124 $51,703 7.09% 1,124 $79,791 10.95% 1,735 $79,791 10.95% 1,735 $14,076 1.93% 306 $14,358 1.97% 312
$3,839 0.53% 83 $3,916 0.54% 85 $1,083 0.15% 24 $1,104 0.15% 24 $4,922 0.68% 107 $5,020 0.69% 109 $98,788 13.55% 2,148 $99,168 13.60% 2,156
# NOTE
1 Rent Roll Date: March 2021
2 T12 Date Range: February 2020 - January 2021
3 Taxes: information from Hamilton County Auditor
4 Replacement & Reserves: added based on market norm of $255 per unit per year
5 Gross Potential Rent: assumes a normal growth of 3% starting in year 2
6 Loss to Lease: assumes a normal growth of 2% starting in year 2

7 Physical Vacancy: set at 5% which is the norm for this market
8 Bad Debt: set at 2% which is the norm for this property type and market
$1,642 0.23% 36 $1,675 0.23% 36 $9,384 1.29% 204 $9,572 1.31% 208 $1,642 0.23% 36 $1,675 0.23% 36 $12,668 1.74% 275 $12,922 1.77% 281 $25,806 3.54% 561 $26,322 3.61% 572 $3,519 0.48% 77 $3,589 0.49% 78 $39,882 5.47% 867 $40,680 5.58% 884 $3,519 0.48% 77 $3,589 0.49% 78 $7,038 0.97% 153 $7,179 0.98% 156 $36,447 5.00% 792 $37,540 5.00% 792 $12,204 1.67% 265 $12,448 1.71% 271 $141,083 19.35% 3,067 $144,269 19.64% 3,113 $239,871 32.91% 5,215 $243,437 33.40% 5,292 $489,062 67.09% 10,632 $507,364 69.60% 11,030
YEAR 2 YEAR 3
GPR Per Unit
GPR Per Unit
EGI Per Unit
EGI Per Unit
INCOME
GROSS POTENTIAL RENT
All Units at Market Rent $606,000 $758,400 $781,152 $804,587 $828,724 $853,586 $879,193 $905,569 $932,736 $960,718 $989,540
Gain (Loss) to Lease ($85,200) ($53,088) ($15,623) ($16,092) ($16,574) ($17,072) ($17,584) ($18,111) ($18,655) ($19,214) ($19,791)

GROSS SCHEDULED RENT $520,800 $705,312 $765,529 $788,495 $812,150 $836,514 $861,610 $887,458 $914,082 $941,504 $969,749
Total Other Income $8,800 $9,064 $9,336 $9,616 $9,808 $10,004 $10,205 $10,409 $10,617 $10,829 $11,046
GROSS POTENTIAL INCOME $529,600 $714,376 $774,865 $798,111 $821,958 $846,519 $871,814 $897,867 $924,698 $952,333 $980,795
Physical Vacancy ($14,427) ($35,266) ($38,276) ($39,425) ($40,607) ($41,826) ($43,080) ($44,373) ($45,704) ($47,075) ($48,487)
Bad Debt $0 ($7,053) ($7,655) ($7,885) ($8,121) ($8,365) ($8,616) ($8,875) ($9,141) ($9,415) ($9,697)
EFFECTIVE GROSS INCOME $515,173 $672,057 $728,933 $750,801 $773,229 $796,328 $820,118 $844,619 $869,854 $895,843 $922,610
EXPENSES
Real Estate Taxes $28,088 $79,791 $79,791 $79,791 $81,387 $83,014 $84,675 $86,368 $88,095 $89,857 $91,655
Insurance $13,800 $13,800 $14,076 $14,358 $14,645 $14,938 $15,236 $15,541 $15,852 $16,169 $16,492
Utilities $4,730 $4,825 $4,922 $5,020 $5,120 $5,223 $5,327 $5,434 $5,542 $5,653 $5,766
Contract Services $26,467 $12,420 $12,668 $12,922 $13,180 $13,444 $13,713 $13,987 $14,267 $14,552 $14,843
Repairs & Maintenance $49,538 $25,300 $25,806 $26,322 $26,849 $27,386 $27,933 $28,492 $29,062 $29,643 $30,236
Marketing & Promotion $0 $3,450 $3,519 $3,589 $3,661 $3,734 $3,809 $3,885 $3,963 $4,042 $4,123
On-Site Payroll $19,823 $39,100 $39,882 $40,680 $41,493 $42,323 $43,170 $44,033 $44,914 $45,812 $46,728
Payroll Taxes & Benefits $0 $3,450 $3,519 $3,589 $3,661 $3,734 $3,809 $3,885 $3,963 $4,042 $4,123
General & Administrative $14,563 $6,900 $7,038 $7,179 $7,322 $7,469 $7,618 $7,771 $7,926 $8,084 $8,246
Management Fee $27,600 $33,603 $36,447 $37,540 $38,661 $39,816 $41,006 $42,231 $43,493 $44,792 $46,130
Replacement & Reserves $11,730 $11,965 $12,204 $12,448 $12,697 $12,951 $13,210 $13,474 $13,744 $14,018 $14,299
TOTAL EXPENSES $196,340 $234,603 $239,871 $243,437 $248,677 $254,032 $259,506 $265,101 $270,820 $276,666 $282,642
NET OPERATING INCOME $318,833 $437,454 $489,062 $507,364 $524,552 $542,296 $560,612 $579,518 $599,034 $619,177 $639,968
CASH FLOW ROSEHILL TOWNHOMESFINANCIALS CURRENT YEAR 1 YE DEC-2022 YEAR 2 YE DEC-2023 YEAR 3 YE NOV-2024 YEAR 4 YE NOV-2025 YEAR 5 YE NOV-2026 YEAR 6 YE NOV-2027 YEAR 7 YE NOV-2028 YEAR 8 YE NOV-2029 YEAR 9 YE NOV-2030 YEAR 10 YE NOV-2031
INCOME EXPENSE
Income
Gross Potential Rent 25.15% 3.00% 3.00% 3.00% 3.00% 3.00% 3.00% 3.00% 3.00% 3.00%
(Loss) / Gain to Lease* 7.00% 2.00% 2.00% 2.00% 2.00% 2.00% 2.00% 2.00% 2.00% 2.00%
Other Income 3.00% 3.00% 3.00% 3.00% 3.00% 3.00% 3.00% 3.00% 3.00% 3.00%
Expenses
Expenses 2.00% 2.00% 2.00% 2.00% 2.00% 2.00% 2.00% 2.00% 2.00% Management Fee** 5.00% 5.00% 5.00% 5.00% 5.00% 5.00% 5.00% 5.00% 5.00% 5.00%
Physical Vacancy 5.00% 5.00% 5.00% 5.00% 5.00% 5.00% 5.00% 5.00% 5.00% 5.00% Non-Revenue Units 0.00% 0.00% 0.00% 0.00% 0.00% 0.00% 0.00% 0.00% 0.00% 0.00% Bad Debt 1.00% 1.00% 1.00% 1.00% 1.00% 1.00% 1.00% 1.00% 1.00% 1.00% Concessions Allowance 0.00% 0.00% 0.00% 0.00% 0.00% 0.00% 0.00% 0.00% 0.00% 0.00%
Total Economic Loss 6.00% 6.00% 6.00% 6.00% 6.00% 6.00% 6.00% 6.00% 6.00% 6.00%
*Calculated as a percentage of Gross Potential Rent | **Calculated as a percentage of Effective Gross Income
 CASH FLOW PROJECTION GROWTH RATE ASSUMPTIONS
YR 1 YR 2 YR 3 YR 4 YR 5 YR 6 YR 7 YR 8 YR 9 YR 10
CASH FLOW PROJECTION GROWTH RATE ASSUMPTIONS YR 1 YR 2 YR 3 YR 4 YR 5 YR 6 YR 7 YR 8 YR 9 YR 10
CASH FLOW PROJECTION GROWTH RATE ASSUMPTIONS
YR 1 YR 2 YR 3 YR 4 YR 5 YR 6 YR 7 YR 8 YR 9 YR 10
CASH FLOW PROJECTION GROWTH RATE ASSUMPTIONS YR 1 YR 2 YR 3 YR 4 YR 5 YR 6 YR 7 YR 8 YR 9 YR 10

04SECTION LOCAL MARKET

MARKET
