PRIME ON THE HILL PROPOSAL


Jordan Dickman
First Vice President Investments
Cincinnati Office
D. 513.878.7735
jordan.dickman@marcusmillichap.com
Nick Andrews
First Vice President Investments
Cincinnati Office
D. 513.878.7741

nicholas.andrews@marcusmillichap.com
Austin Sum
Senior Associate

Cincinnati Office

D. 513.878.7747
austin.sum@marcusmillichap.com
“OUR COMMITMENT IS TO HELP OUR CLIENTS CREATE


AND PRESERVE WEALTH BY PROVIDING THEM WITH
THE BEST REAL ESTATE INVESTMENT SALES, FINANCING, RESEARCH AND ADVISORY SERVICES AVAILABLE.”
04 26 36 42 52 62


THIS IS A BROKER PRICE OPINION OR COMPARATIVE MARKET ANALYSIS OF VALUE AND SHOULD NOT BE CONSIDERED AN APPRAISAL. This information has been secured from sources we believe to be reliable, but we make no representations or warranties, express or implied, as to the accuracy of the information. References to square footage or age are approximate. Buyer must verify the information and bears all risk for any inaccuracies.
Marcus & Millichap is not affiliated with, sponsored by, or endorsed by any commercial tenant or lessee identified in this marketing package. The presence of any corporation’s logo or name is not intended to indicate or imply affiliation with, or sponsorship or endorsement by, said corporation of Marcus & Millichap, its affiliates or subsidiaries, or any agent, product, service, or commercial listing of Marcus & Millichap, and is solely included for the purpose of providing tenant lessee information about this listing to prospective customers.


JORDAN DICKMAN
FIRST VICE PRESIDENTS DIRECTOR, NMHG
NICK ANDREWS
FIRST VICE PRESIDENTS DIRECTOR, NMHG
LIZ POPP
MIDWEST OPERATIONS MANAGER
JOSH CARUANA
VICE PRESIDENT
REGIONAL MANAGER
INDIANAPOLIS | CINCINNATI | LOUISVILLE | ST LOUIS | KANSAS CITY
AUSTIN SUM
SENIOR INVESTMENT ASSOCIATE
BRIAN JOHNSTON
INVESTMENT ASSOCIATE
AUSTIN Hall
INVESTMENT ASSOCIATE
ALDEN SIMMS
INVESTMENT ASSOCIATE
SAM PETROSINO
VALUATION & RESEARCH
SKYLER WILSON
CLIENT RELATIONS MANAGER
JOHN SEBREE
SENIOR VICE PRESIDENT
NATIONAL DIRECTOR
NATIONAL MULTI HOUSING GROUP
MICHAEL GLASS
SENIOR VICE PRESIDENT
MIDWEST DIVISION MANAGER
NATIONAL DIRECTOR, MANUFACTURED HOME COMMUNITIES GROUP
BRITTANY CAMPBELL-KOCH
DIRECTOR OF OPERATIONS
ALEX PAPA
MARKETING COORDINATOR
Value of recently closed
$84.4 billion
transactions in most recent year


Marcus & Millichap is the premier commercial real estate investment services firm in the United States. Founded in 1971 on a unique model that matches each property with the largest pool of pre-qualified investors, we leverage nearly five decades’ worth of experience and relationships to handle all of your commercial real estate needs. Our team of more than 2,000 professionals in the U.S. and Canada focuses exclusively on real estate investment sales, financing, research, and advisory services.
FOUNDED IN 1971 ON A UNIQUE METHODOLOGY
LARGEST POOL OF PRE-QUALIFIED INVESTORS IN THE INDUSTRY
MOVES CAPITAL ACROSS OUR NETWORK OF INVESTMENT PROFESSIONALS
MORE THAN 2,000 INVESTMENT PROFESSIONALS IN THE U.S. & CANADA
ACCESS TO THE INDUSTRY’S

MATCHING BUYERS & SELLERS
RESULTING IN THE MOST EFFICIENT PROCESS OF LOCALLY, REGIONALLY & NATIONALLY.
WITH AN EXCLUSIVE FOCUS ON REAL ESTATE INVESTMENT SALES, FINANCING, RESEARCH, AND ADVISORY SERVICES
LARGEST POOL OF PRIVATE & INSTITUTIONAL INVESTORS
Marcus & Millichap is the premier commercial real estate investment services firm in the United States. Founded in 1971 with a unique model that matches each property with the largest pool of pre-qualified investors, we leverage nearly five decades of experience and relationships to handle all your commercial real estate needs. Our team of more than 2,000 professionals in the United States and Canada focuses exclusively on real estate investment sales, financing, research and advisory services.
13,255 Transactions


In most recent year
6.74 Transactions closed Every Business Hour MOVING CAPITAL. MAXIMIZING VALUE.
We execute more tax-deferred exchanges than any other firm in the United States (32% of total transactions), and our market share is a direct benefit to clients. Over the years, we have developed the skills and expertise to maximize value and meet sensitive timelines required in a 1031 Exchange. With billions of dollars of commercial real estate exclusively listed with us at any time, motivated exchange buyers seek out Marcus & Millichap for quality investment opportunities. Through our industry-leading inventory, we deliver the best of both worlds – we maximize the value of your asset through our unparalleled marketing. We then help identify appropriate upleg options to execute a successful tax deferral acquisition.


The success of Marcus & Millichap is based on our collaborative culture of information sharing across our network of more than 2,000 investment professionals, which maximizes value for each of our clients.
Working with a unique platform that is antithetical to the concept of “pocket listings,” our investment professionals share all listings with the entire Marcus & Millichap team. Each professional specializes in a property type and has a database of local properties and owners, which is leveraged in every client assignment. Because each local agent specializes in a single product type in a specific geographic region, our clients have exposure across the U.S. and Canada with every investment..
Our foundation of information sharing maximizes pricing for our clients and gives us the largest inventory of any firm in the industry.
THE SIZE AND ACCESSIBILITY OF OUR INVENTORY ENABLES YOU TO SELL YOUR PROPERTY AND QUICKLY MOVE INTO ANOTHER PROFITABLE INVESTMENT.

2,000+ $84.4B
VALUE OF RECENTLY CLOSED TRANSACTIONS IN MOST RECENT YEAR


INBOUND / OUTBOUND
$2.1B - MW. OUTBOUND
$3.8B - MW. INBOUND
$9.2BB - W. OUTBOUND
$1.6B - W. INBOUND
$3.1B - S. OUTBOUND
$7.8B - S. INBOUND
$1.8B - TX/OK OUTBOUND

$6.4B - TX/OK INBOUND
$6.4B - NE. OUTBOUND
$1.4B - NE. INBOUND
$3.3B - MOUNTAIN OUTBOUND
$5.0B - MOUNTAIN INBOUND

The Marcus & Millichap GLOBE Capital Group provides the opportunity to expose your property to more foreign buyers with the guided expertise of our senior investment specialists. Our firm is comprised of 80+ offices throughout the US and Canada, and we provide investors with exclusive investment opportunities, financing capabilities, research, and advisory services.
With more inventory than any other firm, buyers seek Marcus & Millichap to fulfill their investment acquisition needs.
Our structured marketing process, coupled with the industry’s largest sales force, creates a competitive bidding environment for your listing
We maintain active relationships with the industry’s largest pool of 1031 exchange buyers, the most coveted buyers in the market.
This is why clients choose Marcus & Millichap over local, regional, or other national firms


Marcus & Millichap’s National Multi Housing Group (NMHG) provides the industry’s most dynamic and effective marketplace for the acquisition and disposition of apartment properties. With multifamily specialists in offices throughout the U.S. and Canada, NMHG is the industry leader in apartment transactions, having successfully executed on our clients’ behalf more than $106 billion of sales volume in the past five years.

Whether you’re looking to buy, sell, refinance, or hold, Marcus & Millichap leverages real-time market research to assess local and national trends, with specialized focus on individual property types. Backed by the collaborative culture of industry experts, your local investment professional will walk you through each phase of your investment strategy.
• Is holding my asset the most profitable choice in this market?
• How can I best take advantage of the capital markets to maximize my returns?
• Based on my investment risk tolerance and objectives, what opportunities should I consider?
• Is now the right time to sell?
• How can I leverage the capital markets to maximize my results?
• How do I optimize my position via a disposition?

• What alternatives and associated

• When is the right time to buy?
• What investment opportunities are available for my consideration?
• What are the risks in the current market?
• What are my financing options?
• How will an acquisition impact my portfolio’s returns?
• Strategic “hold” analysis

• Refinance and capitalization options
• Quarterly investment return analysis
• Ongoing market and submarket research
• Ongoing product-specific research

• Value and market positioning analysis
• Disposition buyer financing
• New acquisition financing
• 1031 exchange investment alternatives analysis

• Pre-acquisition analysis
• Financial investment analysis
• Market and submarket research
• Product-specific research

MMCC—our fully integrated, dedicated financing arm—is committed to providing superior capital market expertise, precisely managed execution, and unparalleled access to capital sources, providing the most competitive rates and terms.
We leverage our prominent capital market relationships with commercial banks, life insurance companies, CMBS, private and public debt/equity funds, Fannie Mae, Freddie Mac, and HUD to provide our clients with the greatest range of financing options.

Our dedicated, knowledgeable experts understand the challenges of financing and work tirelessly to resolve all potential issues for the benefit of our clients.
Optimum financing solutions to enhance value
Enhanced control through MMCC’s ability to qualify investor finance contingencies
Enhanced control through quickly identifying potential debt/equity sources, processing, and closing buyer’s finance alternatives
CLOSED 1,943 DEBT AND EQUITY FINANCINGS IN MOST RECENT YEAR
NATIONAL PLATFORM OPERATING WITHIN THE FIRM’S BROKERAGE OFFICES

$7.67 BILLION TOTAL NATIONAL VOLUME IN MOST RECENT YEAR
Enhanced control through MMCC’s ability to monitor investor/due diligence and underwriting to ensure timely, predictable closings

ACCESS TO MORE CAPITAL SOURCES THAN ANY OTHER FIRM IN THE INDUSTRY


Our cutting-edge market research helps us advise our clients of existing asset performance and future opportunities.


To successfully execute a marketing campaign, it is critical to understand the likely buyer profiles that will be attracted to the asset, in addition to their respective approval process, corporate structure and underwriting methodology.


Whether it be a private investor, pension fund advisor, sponsored capital group, family office, or a discretionary fund manager, every investment group has an approval process/corporate structure that dictates their ability to process with a transaction. We pride ourselves on maintaining vast and deep relationships with each of the buyer profiles that are active in the market place today coupled with a thorough under standing of their required investor returns and standards of underwriting.

Pension funds, advisors, banks, REITs, and life insurance companies
Syndicates, developers, merchant builders, general partnerships, and professional investors

Foreign investors seeking domestic opportunities and technology enablers that direct foreign demand
1031


Investors seeking acquisition opportunities for capital gains tax deferral

Opportunistic investors seeking diversification in other real estate property types
Private, individual investors who account for the majority of transactions in the marketplace
days
ProActive In-Person Meetings
Direct Phone Calls & Emails
Strategic Property
E-Campaigns
Distribution of offering Materials
On-site Property Tours

Weekly Seller Updates
Offering Procurement
Field Initial Offers
Best & Final Offering Round
Conduct Buyer Interviews
Select Buyer
Negotiate Contract
Days

COMMERCIAL REAL ESTATE

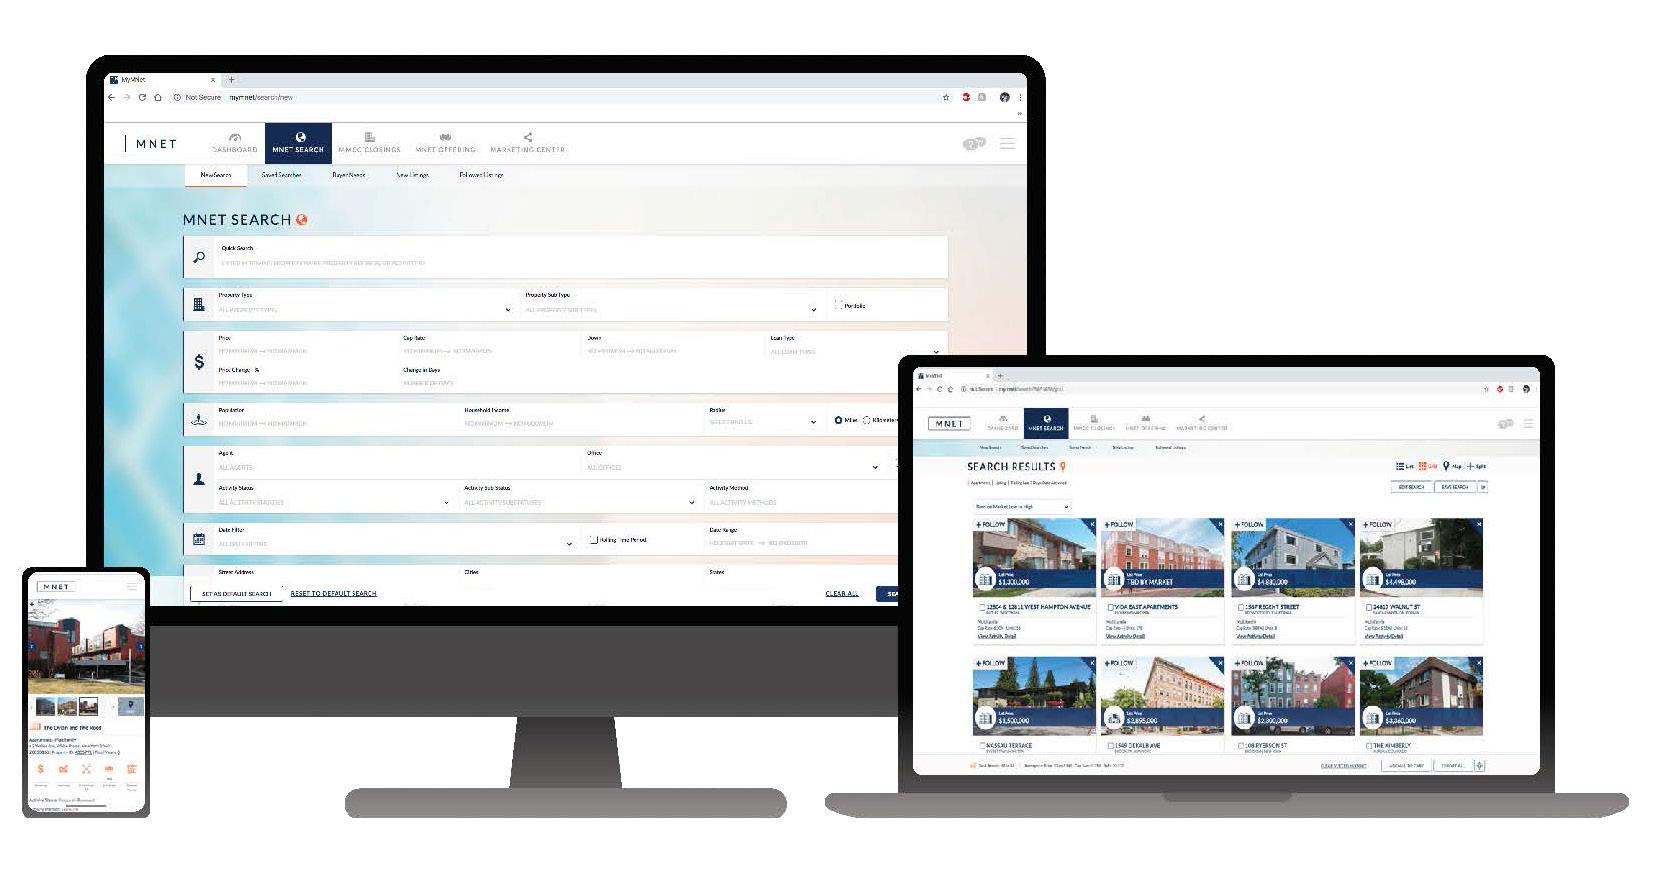
OUR PROPRIETARY TECHNOLOGY PLATFORM, MNET, IS A GAME-CHANGER. NO OTHER FIRM OFFERS ANYTHING LIKE IT OR THE POWERFUL PROPERTY SEARCH TOOLS AND AUTOMATED PROPERTY MATCHING CAPABILITIES IT FEATURES.
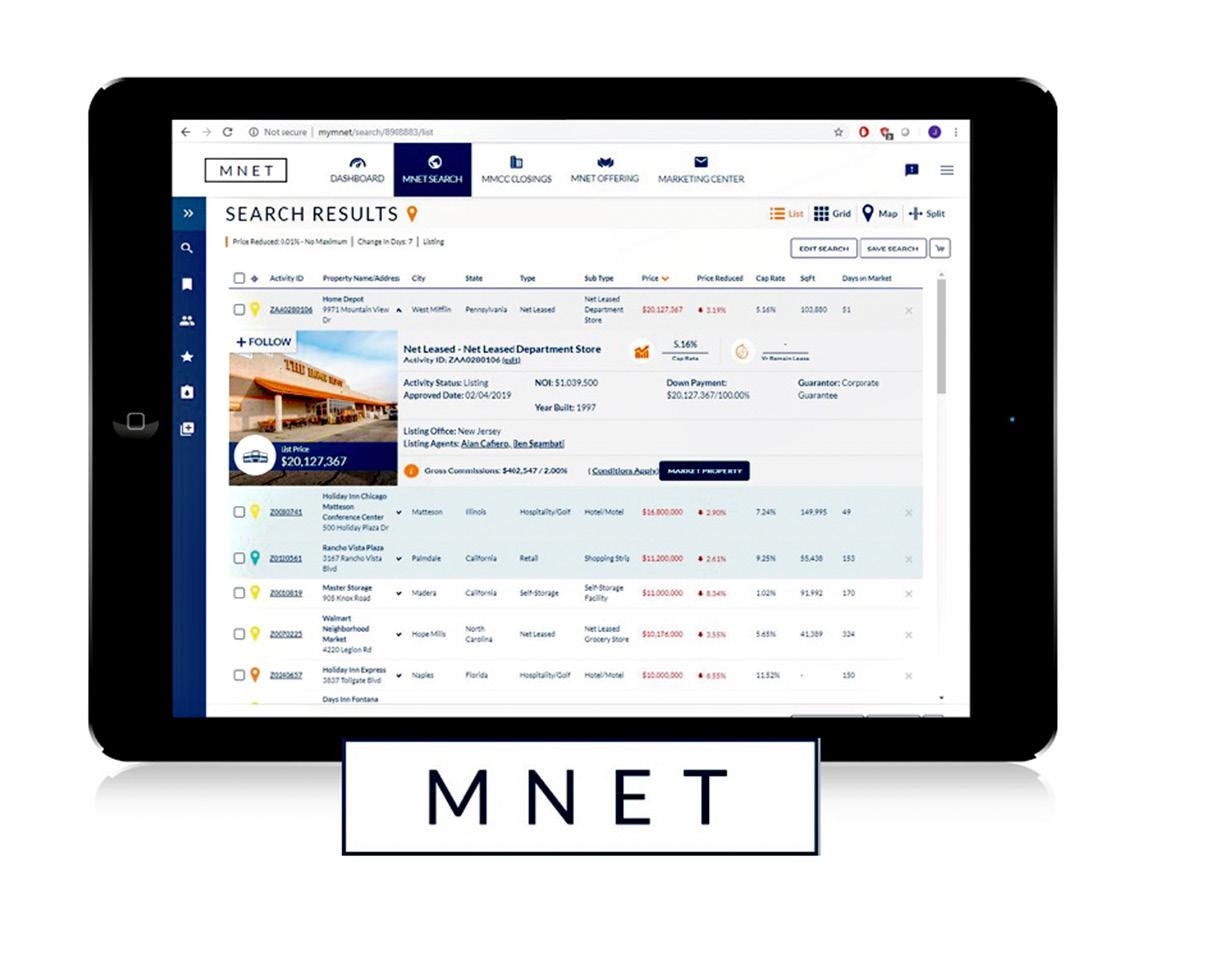
ADVANCE SEARCH CAPABILITIES
$18B +
OF CURRENT INVENTORY
1.2M
SEARCHES ANNUALLY
3,500 +
EXCLUSIVE LISTINGS

Commercial Real Estate Exchange, Inc. (CREXI) is the commercial real estate industry’s fastest-growing marketplace, advanced technology and data platform dedicated to sup porting the CRE industry and its stakeholders. Crexi enables commercial real estate pro fessionals to quickly streamline, manage, grow their businesses, and ultimately close deals faster. Since launching in 2015, Crexi has quickly become the most active market place in the industry. With millions of users, the platform has helped buyers, tenants and brokers transact and lease on over 500,000 commercial listings totaling more than $1 trillion in property value.

Real Capital Markets (RCM) is the GLOBE marketplace for buying and selling CRE. RCM increases the speed, exposure, and security of CRE sales through its streamlined online platform. Solu tions include integrated property marketing, trans action management, and business intelligence tools to unify broker-level and firm-level data and work flows.


The main advantage of digital marketing is that a targeted audience can be reached in a cost-effective and measurable way. Over the course of the past several years, our team has managed to collect over twenty thousand emails of potential investors, in a variety of states across the US. This database allows us to tailor future investment opportunity to each investor, and their desired goal. Not only does this database allow us to personalize emails, but it also allows us to measure the results of our out reach.
EMAILS SENT THIS CURRENT MONTH
EMAIL OPENS OVER 60K IN OUR MAILING LIST OVER 20K
INDUSTRY AVERAGE
OPEN RATE: 29.97%
CLICK RATE: .75%
ADG OPEN RATE
34%
ADG CLICK RATE
1.5% OVER 1.2K CLICK THROUGH
“Email has an ability many channels don’t: creating valuable personal touches - at scale.”
Social media helps us engage with our potential clients and find out what is being said about our business. We also use social media for advertising, attracting clients, get client feedback, build better customer loyalty, increase our market reach, develop our brand etc. Social media is a great tool to use in our industry, especially for building new relationships and keeping up with the market.

ADG IS ON
6


OVER 1K NEW RELATIONSHIPS MADE
MONTHLY IMPRESSIONS ON ISSUU
OVER 1.2K
OVER 3K IMPRESSIONS ON LINKEDIN
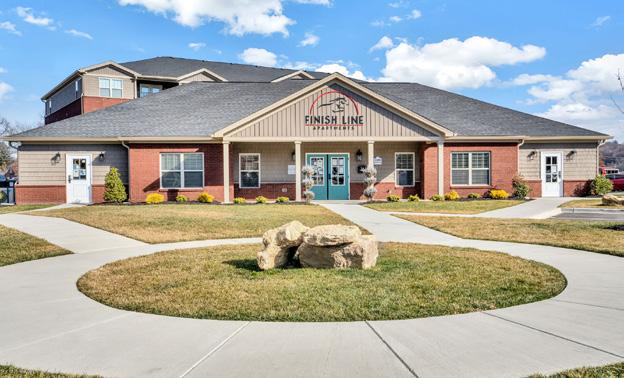
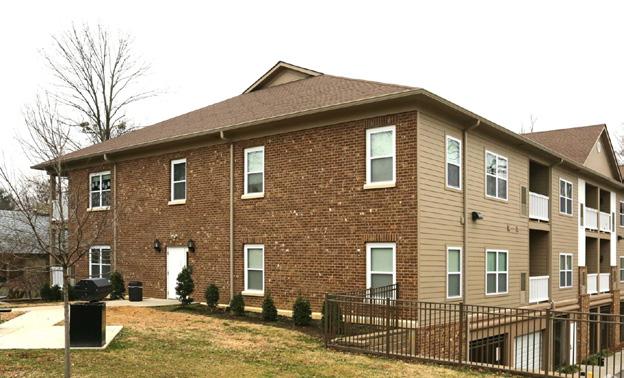
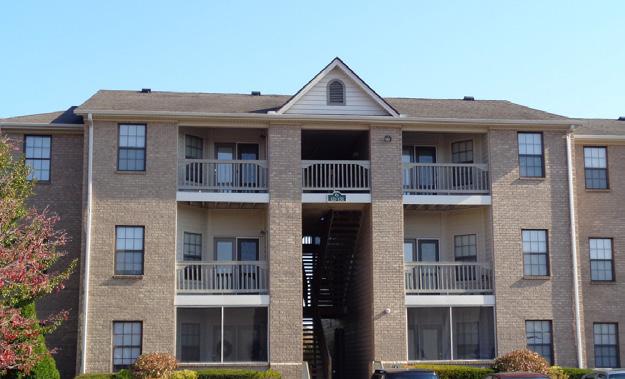
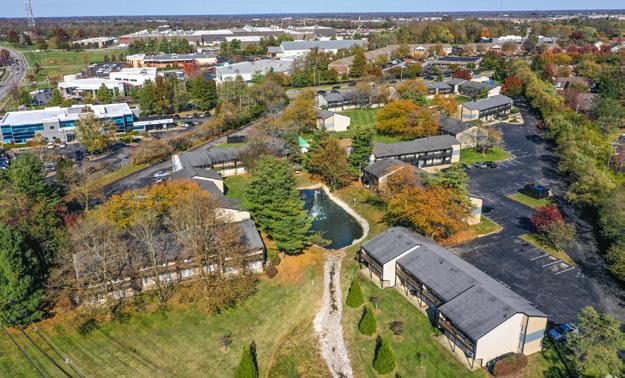
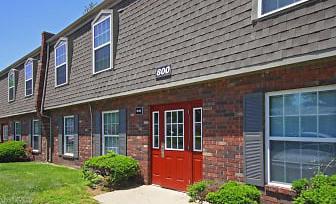
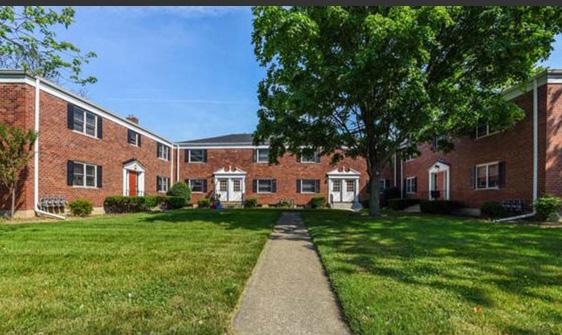
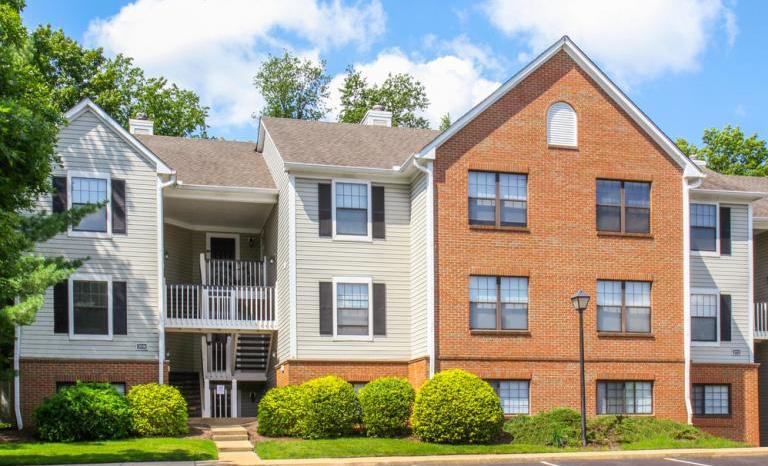
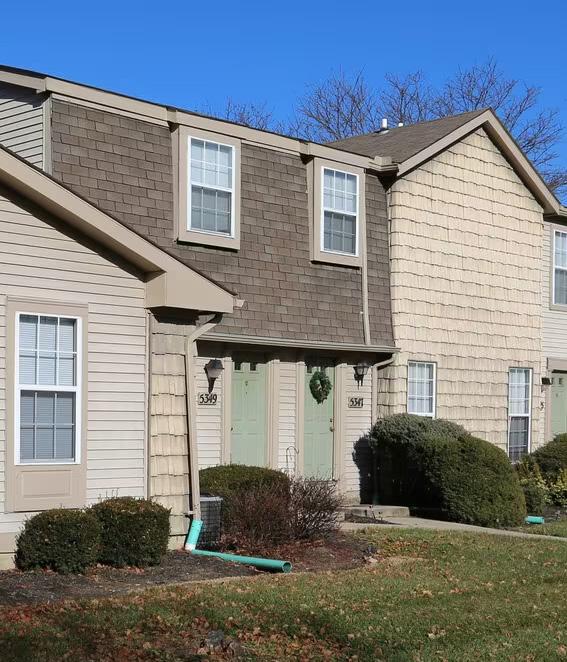
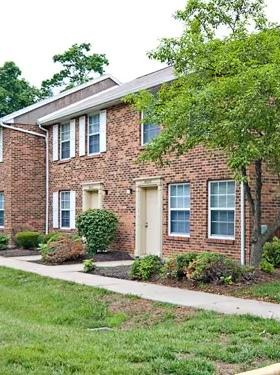
Property Address: 1735 Mars Hill Drive
City, State, Zip: Dayton, Ohio, 45449
County: Montgomery
Year Built: 1992
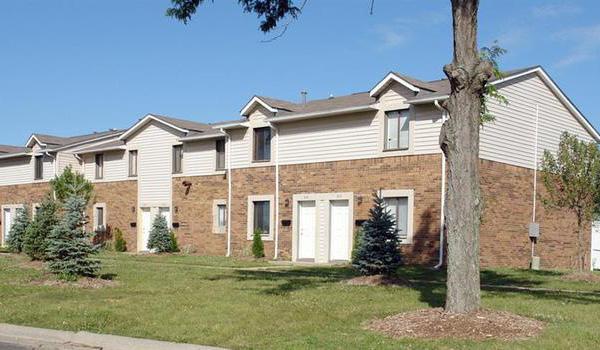
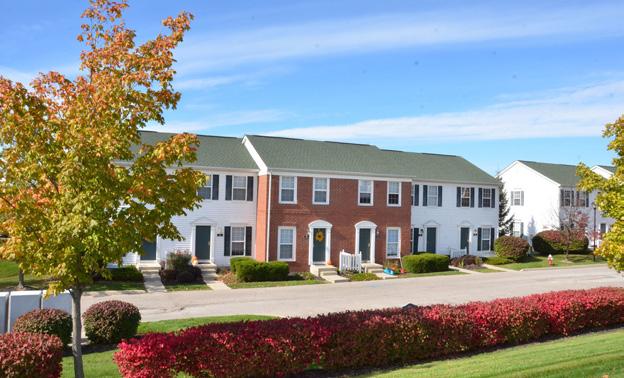
Number Of Units: 100
Avg Unit Size: 980
Rentable Sqft: 98,000

Number of Parcels: 2
Lot Size (Acres): 8.25
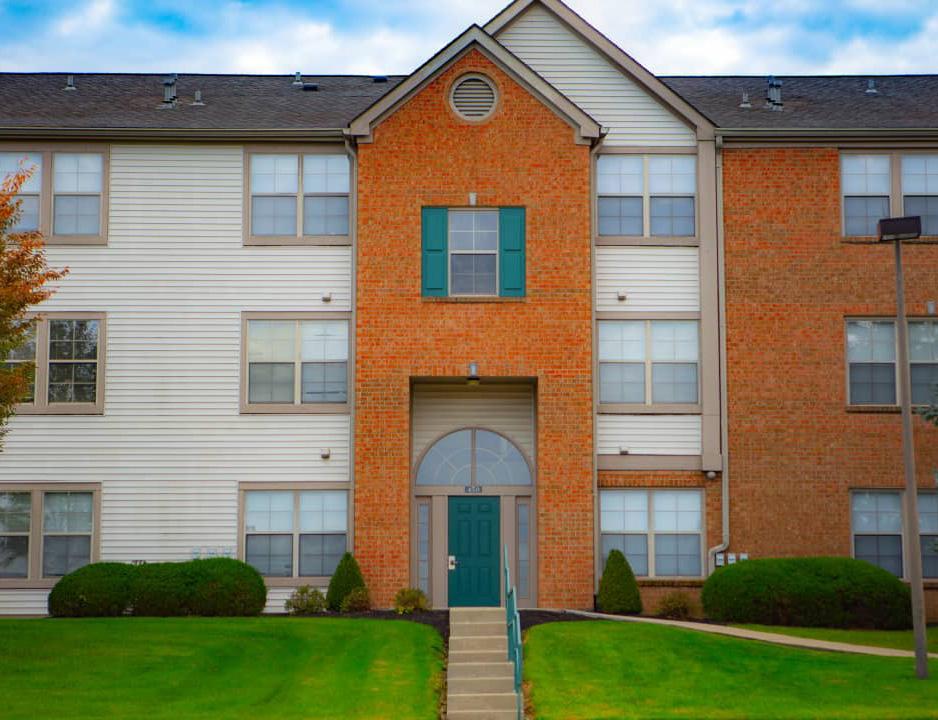
# of Buildings: 6
# of Stories: 3
Parkign: Surface Lot
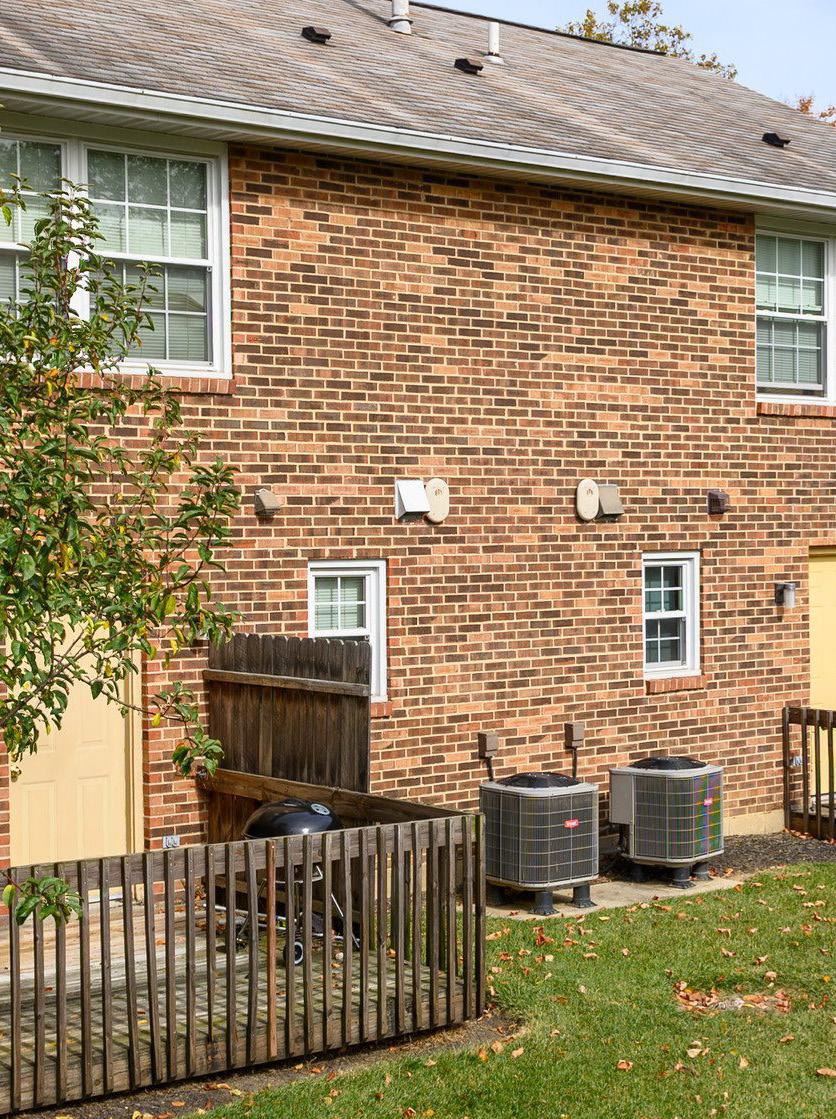
HVAC: Central
Parking Surface: Blacktop
Wiring: Copper
CONSTRUCTION:
Foundation: Concrete
Framing: Wood
Roofs: Pitched Shingle
Exterior of Building: Brick | Aluminum Siding
utilities
Electric: Resident Paid
Gas: Resident Paid
Water: Resident Paid
Sewer: Resident Paid
Trash: Property Paid


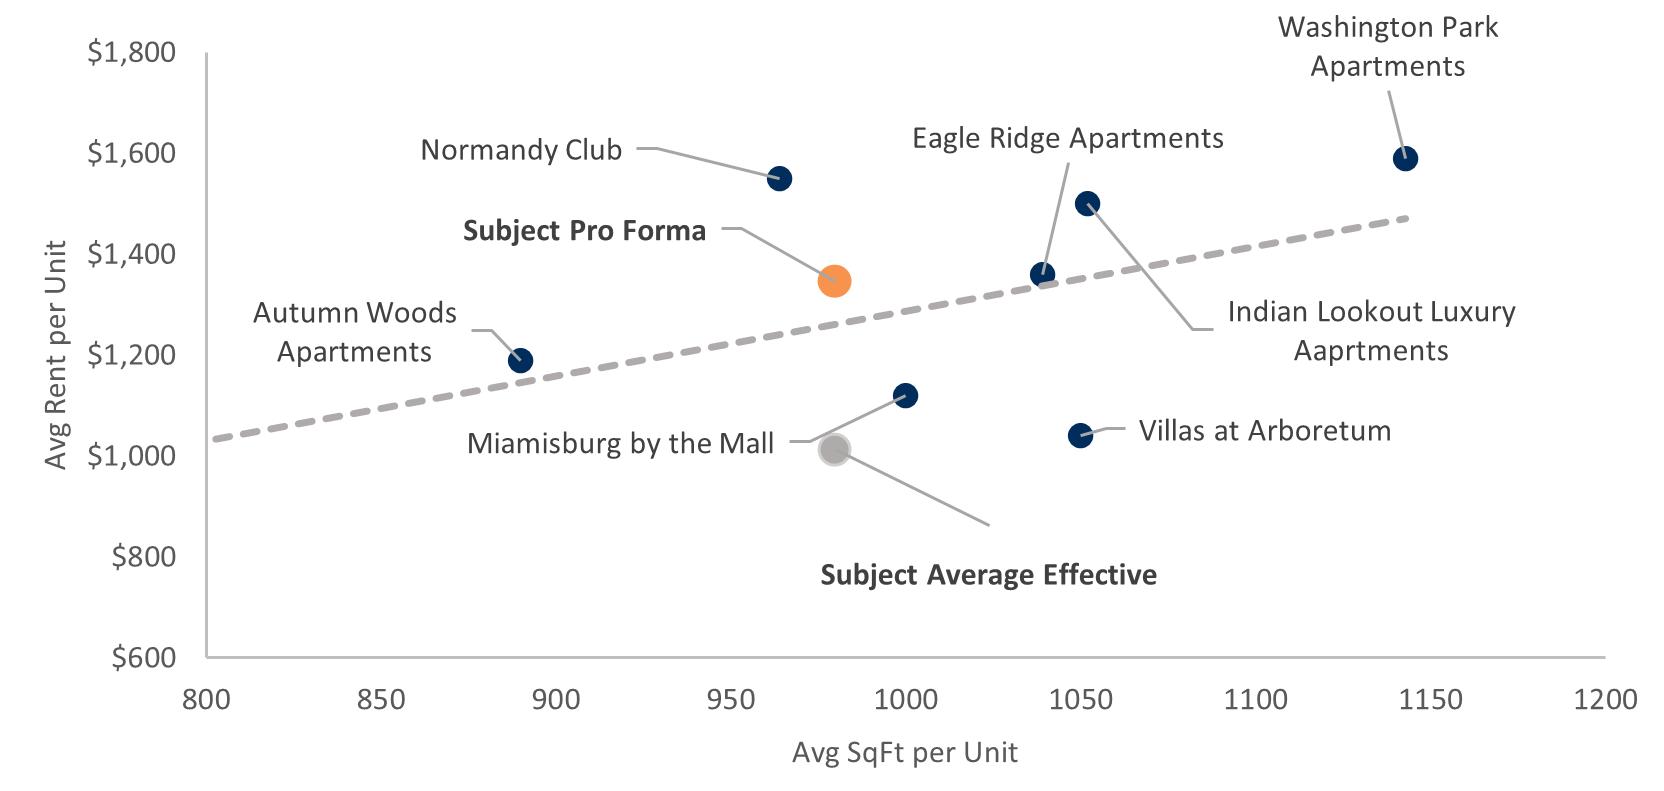
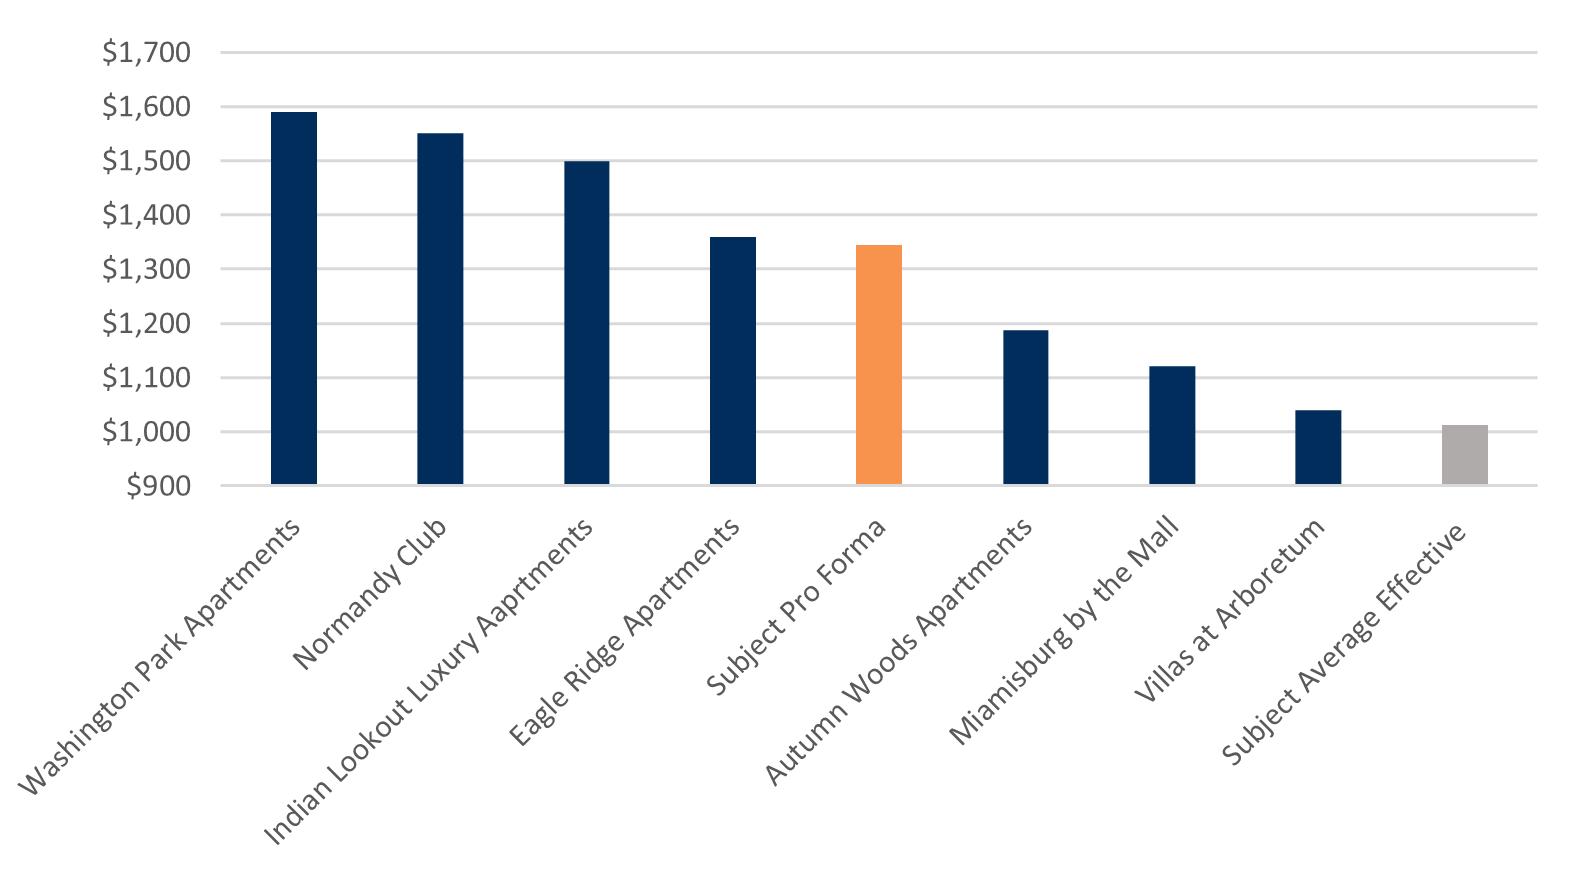
• Eagle Ridge Apartments two bedroom rent increased by 26.7% from Janauary 2023 to July 2023.
• Indian Lookout Luxury Apartments two bedroom rent increased by 3.9% from Janauary 2023 to July 2023.
• Villas at Arboretum two bedroom rent increased by 5.9% from January 2023 to July 2023
• Normandy Club two bedroom rent increased by 11.1% from January 2023 to July 2023.
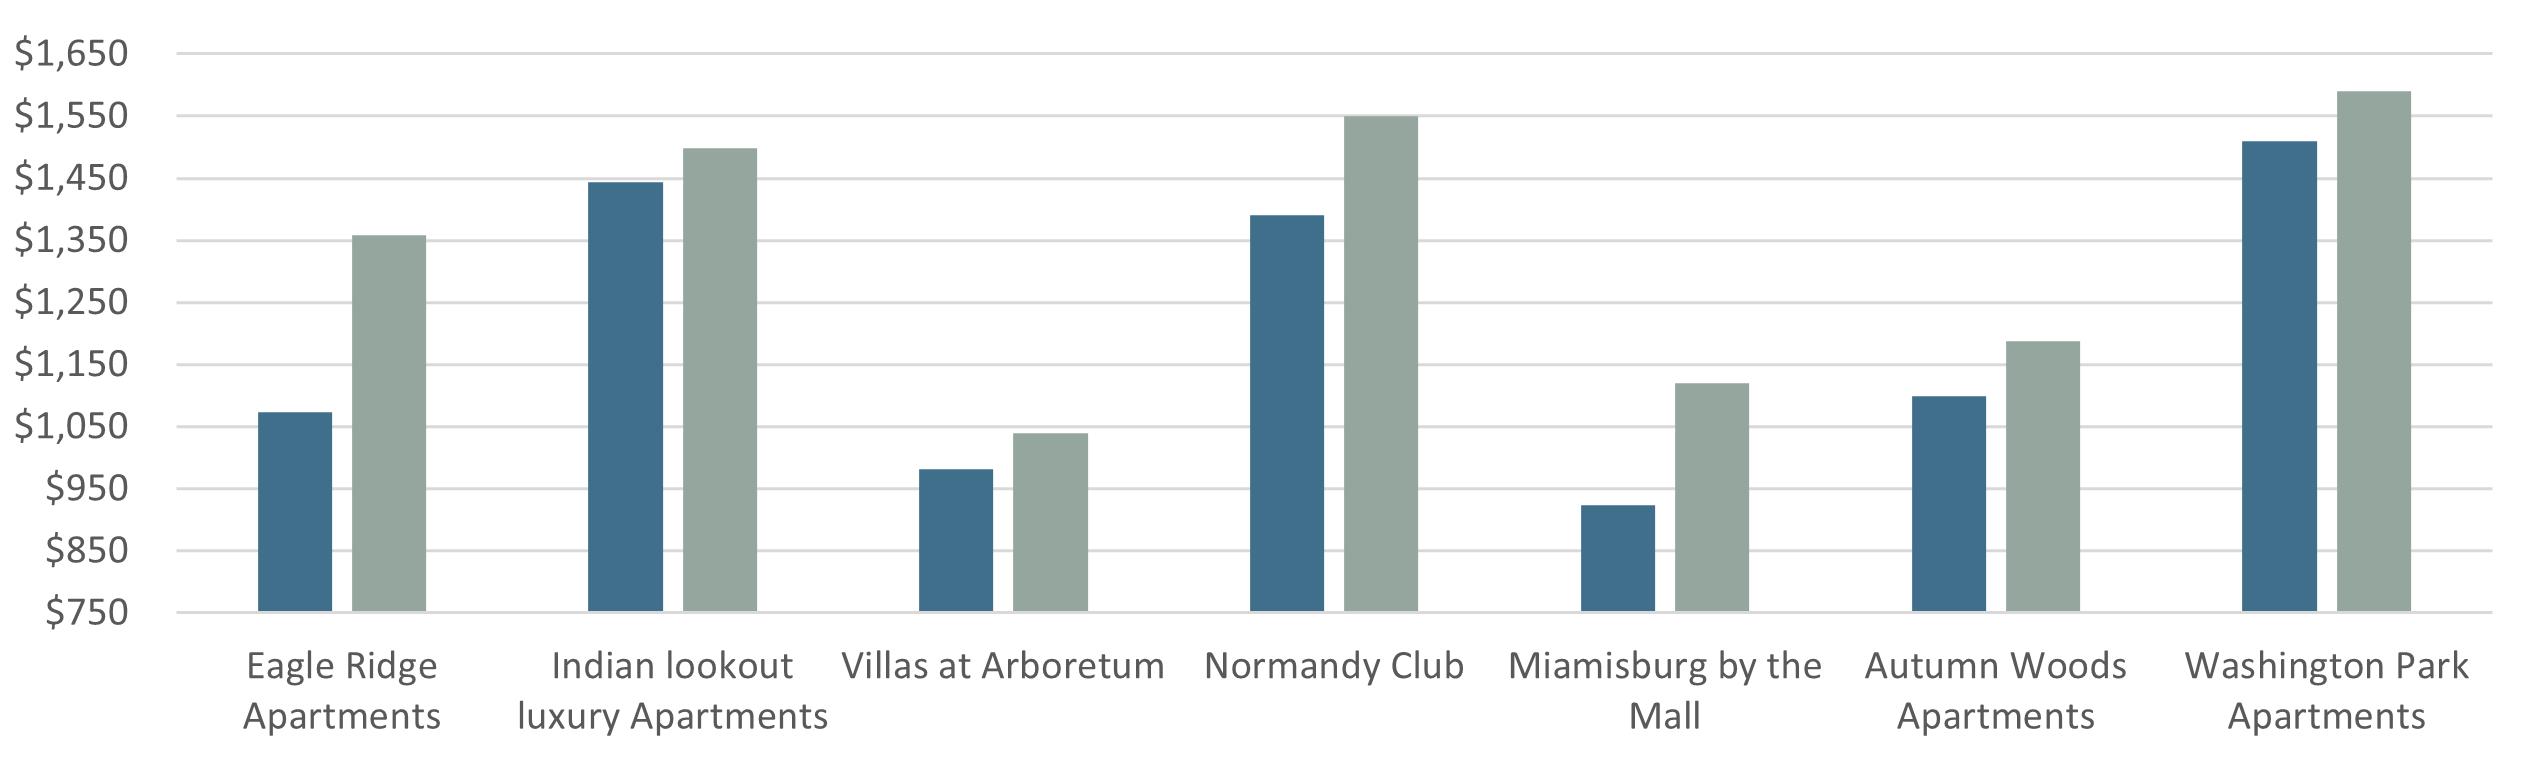
• Miamisburg by the Mall two bedroom apartment rent increased by 21.3% from January 2023 to July 2023.
• Autumn Woods Apartments two bedroom rent increased by 8.1% from January 2023 to July 2023.
• Washington Park Apartments two bedroom rent increased by 5.3% from January 2023 to July 2023.
Apartment Interior Amenities


Washer/Dryer Available In One Beds
Washer/Dryer Hookups Available
Fireplaces Available In Two Beds
High Speed Internet Access
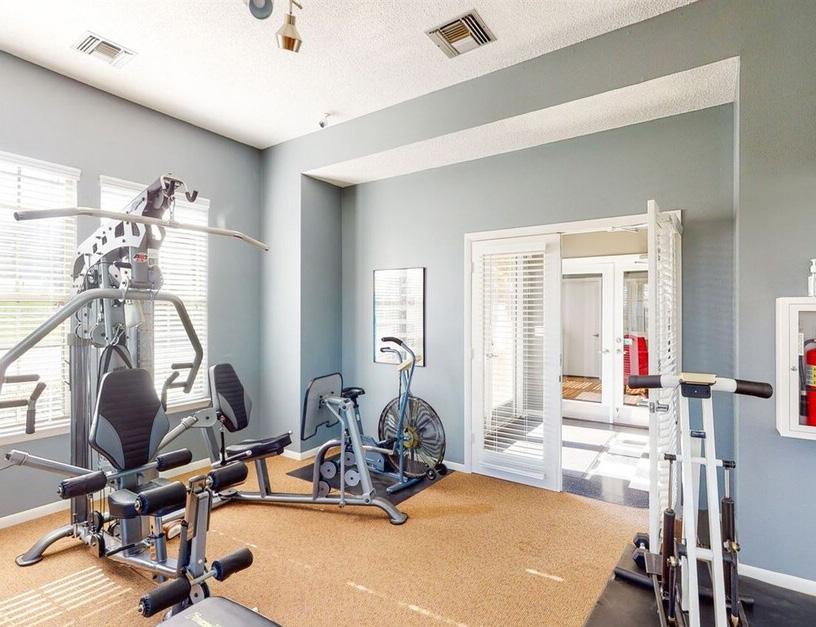
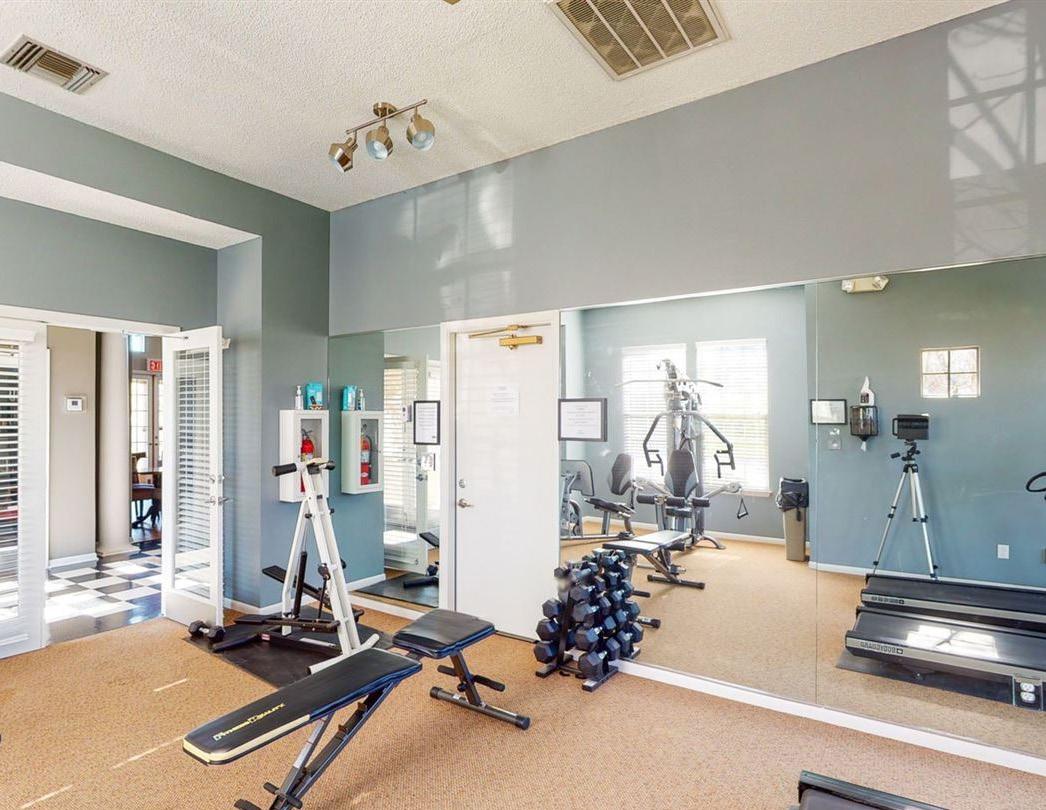
Common Area Amenities
Fitness Center

Clubhouse
Tennis Court

Swimming Pool
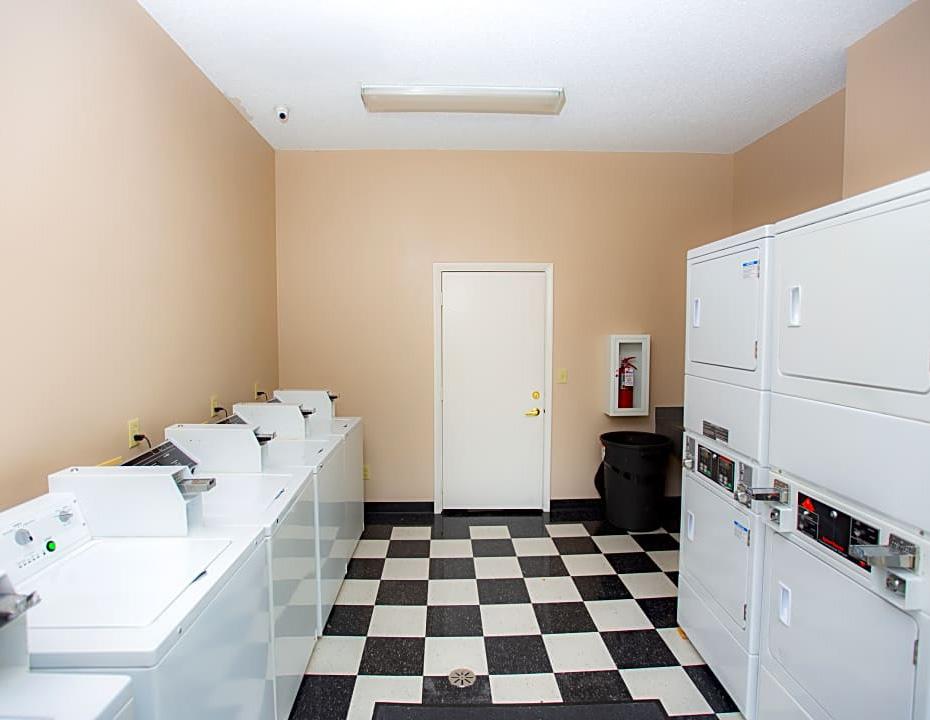
Laundry Facilities


Fireplaces Available In One


Select

# NOTE
1 Replacement Reserve added based on Market Norm
2 Long Term Cable Contract in Place

the asset without a specific price allows us to customize our sales approach to each investor’s specific rehab costs, cost of debt and minimum return


Since the arrival of the first settlers on April 1, 1796, Dayton has always been a place for pioneering vision and change. They have hosted many firsts as the patent capital of the U.S. and provided the world with a staggering number of life-changing innovations and technological advancements. Today they’re still setting trends and promoting growth. In the research labs of Wright-Patterson Air Force Base, the University of Dayton, Wright State University, and many of the top businesses, the innovative spirit of Dayton continues to produce cutting-edge technology and dynamic solutions
to today’s biggest issues.

With the crossroads of Interstate 70 and 75, the railroad capacity, and the international airport, Dayton provides one of the most accessible cities in the nation. In fact, Dayton’s location puts it within one day’s drive of 60% of the U.S. population. The superior transportation makes us among the most competitive mid-sized cities for logistics.


Prior to the pandemic, Dayton’s real gross metropolitan product grew at an average annual rate of 1.6% from 2015 to 2019. During that same five-year period, job growth av eraged 1.0% annually, with roughly 3,900 jobs added on av erage each year. In 2020, COVID-19 mitigation measures and limited business activity caused the local economy to contract as much as 9.6% year-over-year in 2nd quarter. In 2022, the metros inflation-adjusted economic output con tracted 0.8%. At the same time, the metro recorded a net gain of 2,900 jobs, expanding the employment base 0.8%.
As such, Dayton’s unemployment rate in November 2022 declined 0.4 points year-over-year to 3.2%, below the na tional average of 3.4%. During the past year, job gains in Dayton were most pronounced in the Leisure/Hospitality Services sector followed by Government and Profession al/Business Services. Due to job losses stemming from the pandemic, Dayton’s current employment base now sits roughly 5,100 jobs or about 1% below the pre-pandemic level in February 2020.


Population: 743,000
Median age: 33.5
In 4th quarter 2022, same-store effective asking rents for new leases were up 8.4% year-over-year. That annual rent performance was well above the market’s five-year average of 4.8% and a new high for the market. s. In 4th quarter 2022, annual effective rent change was fairly even across the board, registering at 8.3% in Class A units, 8.2% in Class B units and 8.7% in Class C units. Among submarkets, the strongest annual rent change performances over the past year were in Northwest Dayton, North Dayton/Miami County and Greene County. The weakest performance was in South Montgomery County. In the coming year, same-store effective asking rent change in Dayton is expected to slow from the current level. As of 4th quarter 2022, effective asking rental rates in Dayton averaged $1,077 per month, or $1.182 per square foot.
Msa median hhi: $54,457
1 - Year growth: 5.89%
Msa median home value: $69,400

1 - Year growth: 3.89%
Average occupancy: 96.2%
Rent growth: 8.4%
New apartment completions in Dayton were modest recently, as 412 units delivered in 2022. Completions over the past year expanded the local inventory base 0.7%. In the past year, supply was greatest in Central Dayton/Kettering and Greene County.
At the end of 2022, there were 886 units under construction with 661 of those units scheduled to complete in the next four quarters. Scheduled deliveries in the coming year are expected to be limited to Central Dayton/Kettering and North Dayton/Miami County.
- Over the past year, occupancy lost 1.8 points, with the 4th quarter 2022 rate landing at 96.2%.
- Looking at product classes in Dayton, 4th quarter 2022 occupancy registered at 95.3%. In Class A units, 96.5% in Class B units and 96.7% in Class C units.

- Among submarkets, 4th quarter 2022 occupancy was strongest in Greene County and Central Dayton/Kettering.
- The weakest reading was in Northwest Dayton.
Located in Dayton, Wright-Patterson Air Force Base (WPAFB) is one of the most diverse, largest, and organizationally complex bases in the Air Force. Not only is WPAFB the largest single-site employer in the entire state of Ohio, but it is also a center of innovation for the Air Force. It was selected as the “preferred location” for the F-35 Lightning II Hybrid Product Support Intergrator organization, which supports the entire F-35 enterprise. This would bring a minimum of 400 new jobs to the base. The potential impact to the region cannot only be measured in jobs alone, neighboring communities would benefit through the result of more growth for contractors and businesses. Wright-Patterson Air Force Base employs 27,500 military, civilian, and contract employees and has an annual economic impact of $4.3 billion.


“Wright Patterson AFB is the crown jewel of the state of Ohio, and our department will continue to do everything we can to accelerate the growth of the WPAFB and attract more jobs to the region.”
Eric Henry, Greene County’s Economic Development Coordinator

Carillon Historical Park showcases Dayton’s rich heritage of creativity, invention, and milestones in innovation that changed the nation and the world! The park houses the John W. Berry, Sr. Wright Brothers National Museum featuring the original 1905 Wright Flyer III, an impressive collection of NCR cash registers, the Carousel of Dayton Innovation, Gem City Letterpress and so much more.
The museum is housed in the original Packard dealership building built for Dayton in 1917. Approximately 50 Packard automobiles dating 1903-58 are displayed. Other exhibits include Packard marine and aircraft engines, items from the Detroit Packard factory.


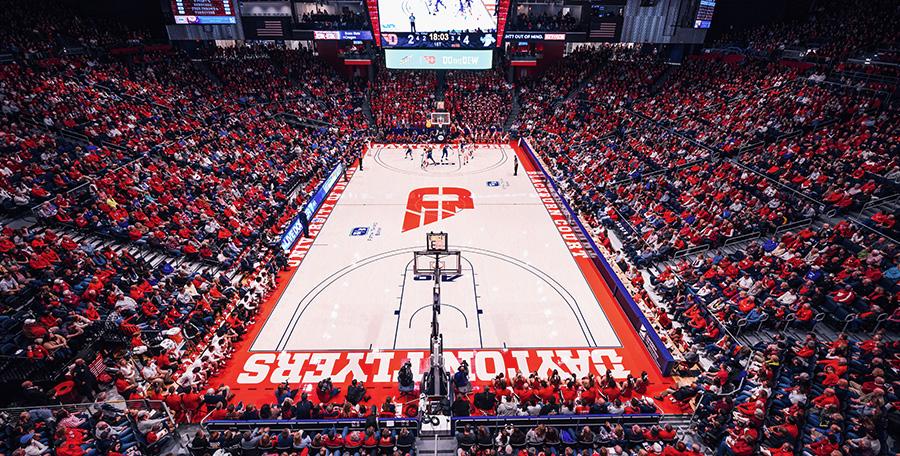
Founded in 1850, the University of dayton (UD) spans a massive 373-acres with state-of-the-art facilities in the downtown area. It boasts 38 academic, athletic, administrative, and research buildings, five resident halls, 18 student apartment complexes, and 473 houses (347 being owned by UD). In 2019, there were a total of 8,483 undergrad students enrolled. 85% of students live on-campus or in student neighborhoods. UD offers more than 80 undergraduate programs and 50 graduate and doctoral programs. UD has 17 Division I sports temas, 37 club sports, and 12 intramural sports. Since 2001, the NCAA tournament has had an impact of more than $70 million on dayton’s economy and UD Arena has hosted more Division I Basketball Championship gams than any other venue in the US.


Located in the Dayton area, Wright State University is a national public research university. WSU offers 140 undergraduate programs and 136 graduate programs. Wright State has 20 percent more affordable in-state tuition than the national average. WSU adds $1.5 billion into the region’s economy annually and supports more than 20,000 jobs through its spending on operations and research and throuigh spending of students, alumni, and visitors. With a student body population of more than 13,000, there is only a 3,000 on-campus student housing capacity. WSU’s Nutter Center is southwest Ohio’s premier sports and entertainment facility. With a capacity of 11,200, it has also been recognized nationally as a top venue of its size.