RICHWOOD NORTH ESTATES OFFERING MEMORANDUM

CONTENTS
LEAD AGENTS
Jordan Dickman
First Vice President Investments
Cincinnati Office
D. 513.878.7735
jordan.dickman@marcusmillichap.com
Nick Andrews
First Vice President Investments
Cincinnati Office
D. 513.878.7741

nicholas.andrews@marcusmillichap.com
Austin Sum
Senior Associate

Cincinnati Office

D. 513.878.7747
austin.sum@marcusmillichap.com
“OUR COMMITMENT IS TO HELP OUR CLIENTS CREATE


AND PRESERVE WEALTH BY PROVIDING THEM WITH
THE BEST REAL ESTATE INVESTMENT SALES, FINANCING, RESEARCH AND ADVISORY SERVICES AVAILABLE.”
NON-ENDORSEMENT & DISCLAIMER NOTICE
CONFIDENTIALITY DISCLAIMER

THIS IS A BROKER PRICE OPINION OR COMPARATIVE MARKET ANALYSIS OF VALUE AND SHOULD NOT BE CONSIDERED AN APPRAISAL. This information has been secured from sources we believe to be reliable, but we make no representations or warranties, express or implied, as to the accuracy of the information. References to square footage or age are approximate. Buyer must verify the information and bears all risk for any inaccuracies.

NON-ENDORSEMENT NOTICE
Marcus & Millichap is not affiliated with, sponsored by, or endorsed by any commercial tenant or lessee identified in this marketing package. The presence of any corporation’s logo or name is not intended to indicate or imply affiliation with, or sponsorship or endorsement by, said corporation of Marcus & Millichap, its affiliates or subsidiaries, or any agent, product, service, or commercial listing of Marcus & Millichap, and is solely included for the purpose of providing tenant lessee information about this listing to prospective customers.
01 - THE INVESTMENT 02 - LOCAL competitors 03 - FINANCIALS SECTIONS
06 22 34
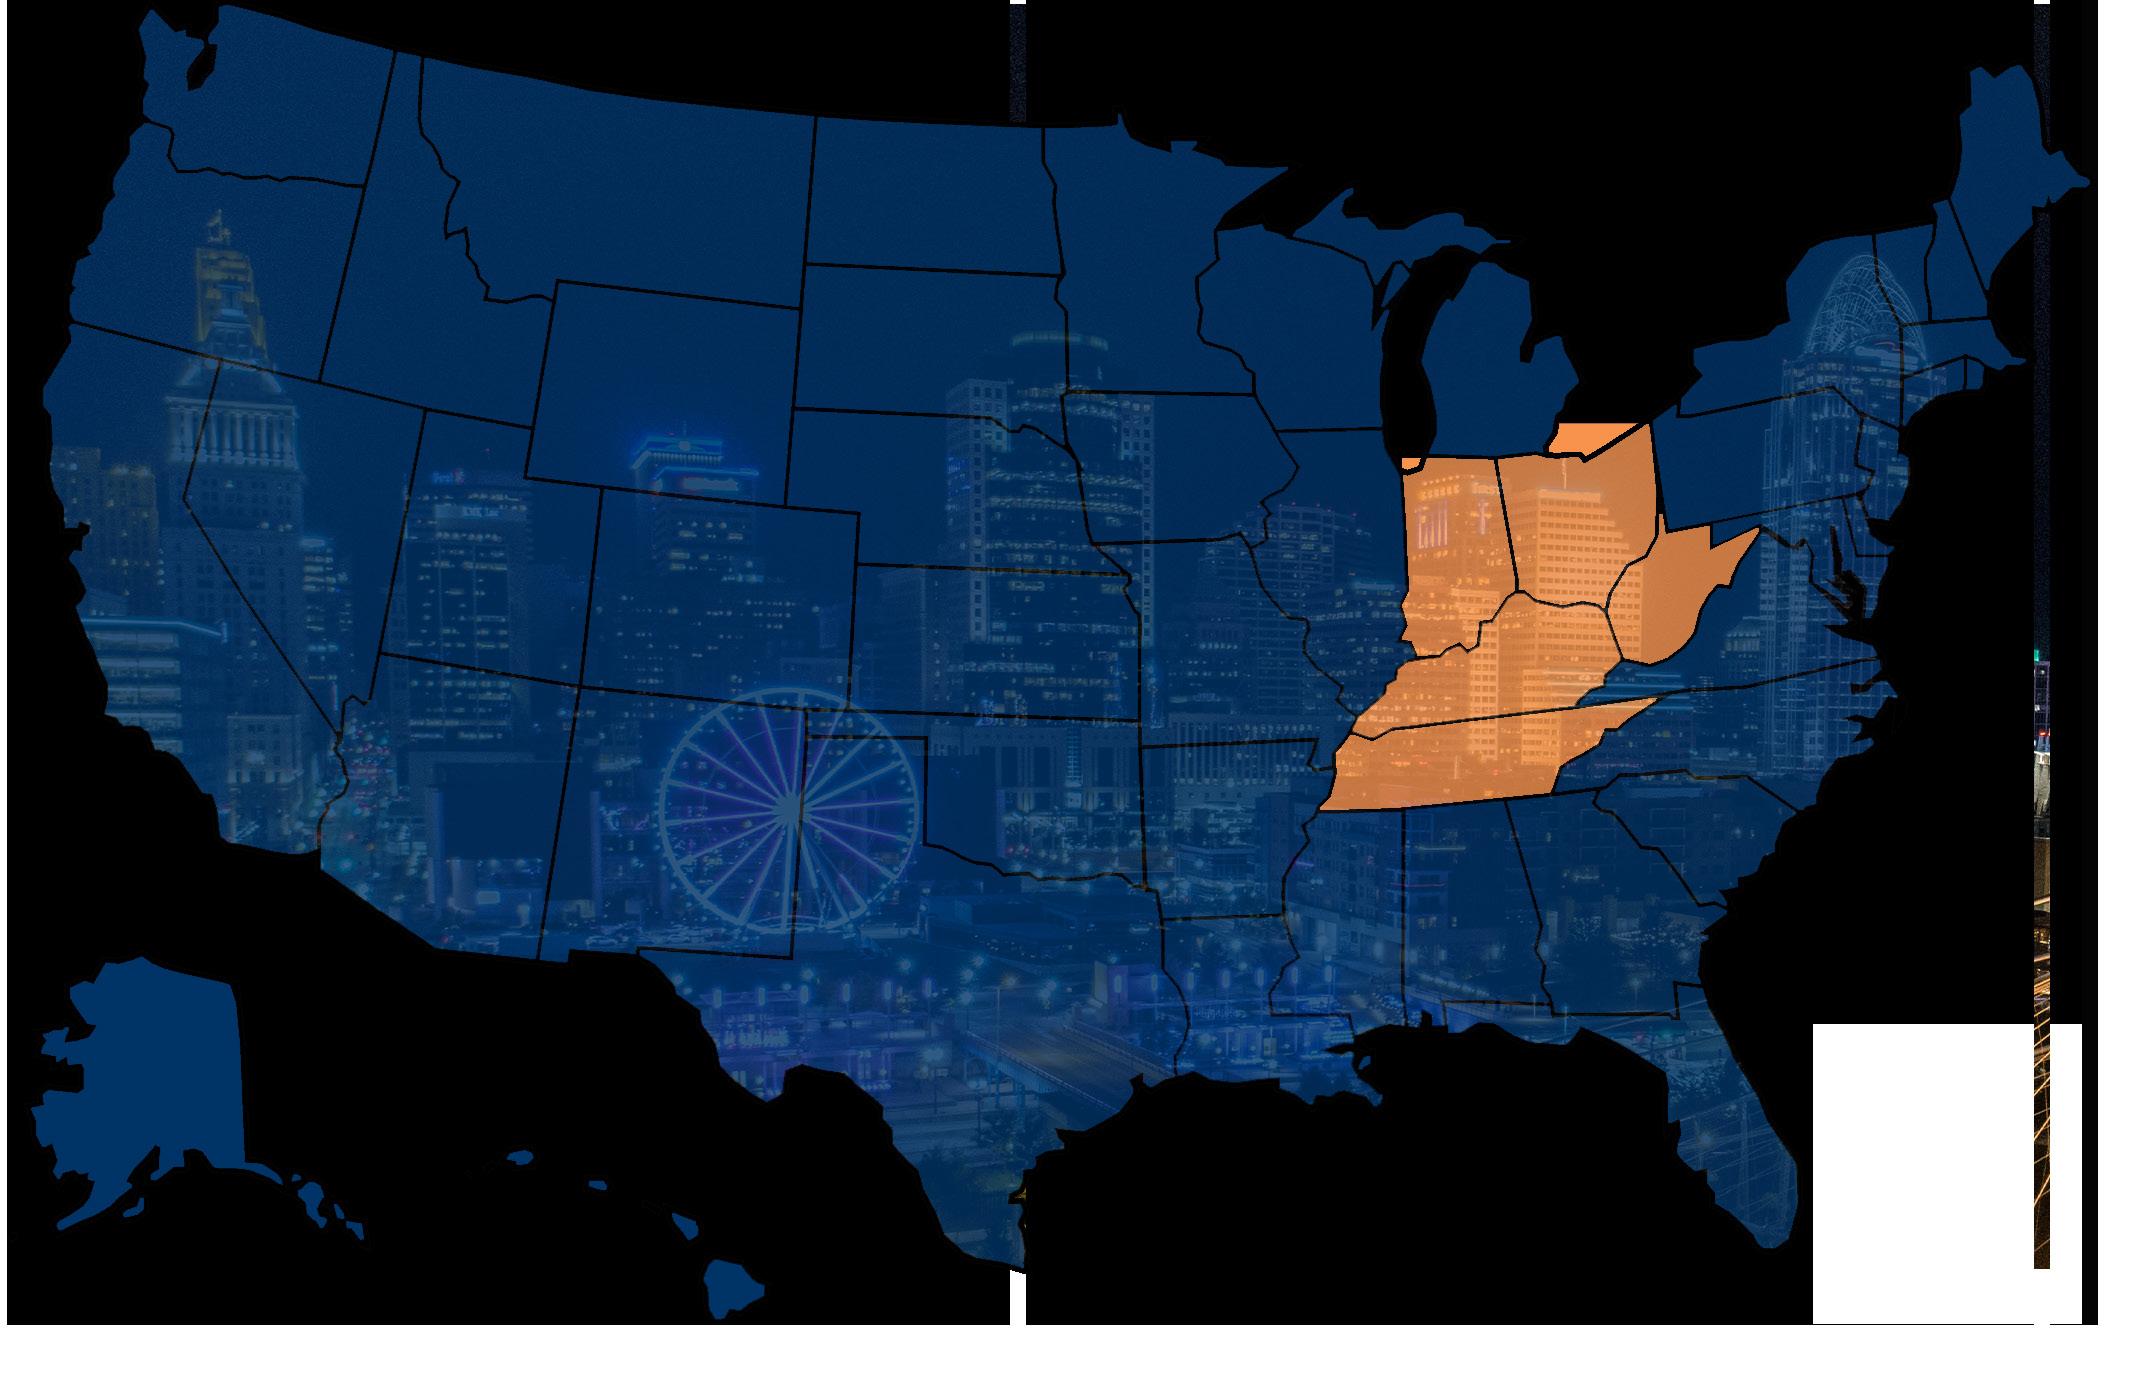

CALABASAS, CALIFORNIA | HQ 2,500 | EMPLOYEES 80+ | OFFICES
UNRIVALED SUCCESS IN THE MIDWEST
YOUR TEAM
JORDAN DICKMAN
FIRST VICE PRESIDENTS DIRECTOR, NMHG
NICK ANDREWS
FIRST VICE PRESIDENTS DIRECTOR, NMHG
AUSTIN SUM
SENIOR INVESTMENT ASSOCIATE
BRIAN JOHNSTON
INVESTMENT ASSOCIATE
AUSTIN Hall
INVESTMENT ASSOCIATE
ALDEN SIMMS
INVESTMENT ASSOCIATE
BROKER SUPPORT
SAM PETROSINO
VALUATION & RESEARCH
CORPORATE SUPPORT
LIZ POPP
MIDWEST OPERATIONS MANAGER
JOSH CARUANA
VICE PRESIDENT
REGIONAL MANAGER
INDIANAPOLIS | CINCINNATI | LOUISVILLE | ST LOUIS | KANSAS CITY
JOHN SEBREE
SENIOR VICE PRESIDENT
NATIONAL DIRECTOR
NATIONAL MULTI HOUSING GROUP
MICHAEL GLASS
SENIOR VICE PRESIDENT
MIDWEST DIVISION MANAGER
NATIONAL DIRECTOR, MANUFACTURED HOME COMMUNITIES GROUP
SKylER WILSON
CLIENT RELATIONS MANAGER
BRITTANY CAMPBELL-KOCH
DIRECTOR OF OPERATIONS
ALEX PAPA
MARKETING COORDINATOR
THE INVESTMENT
01

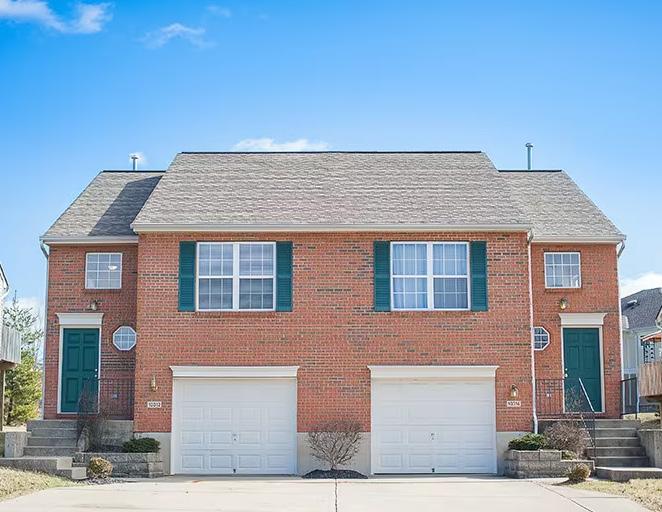
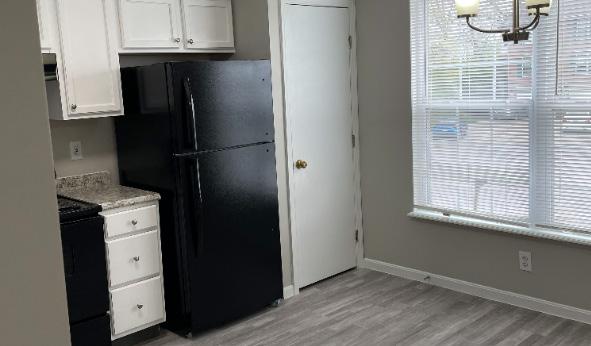
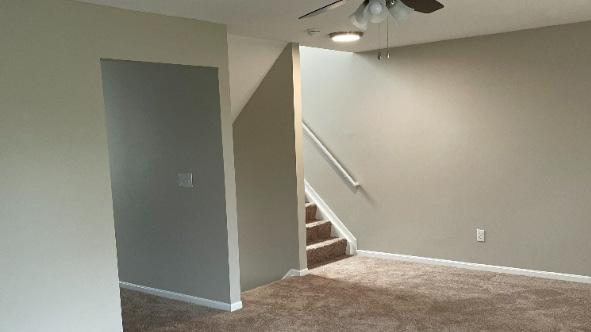
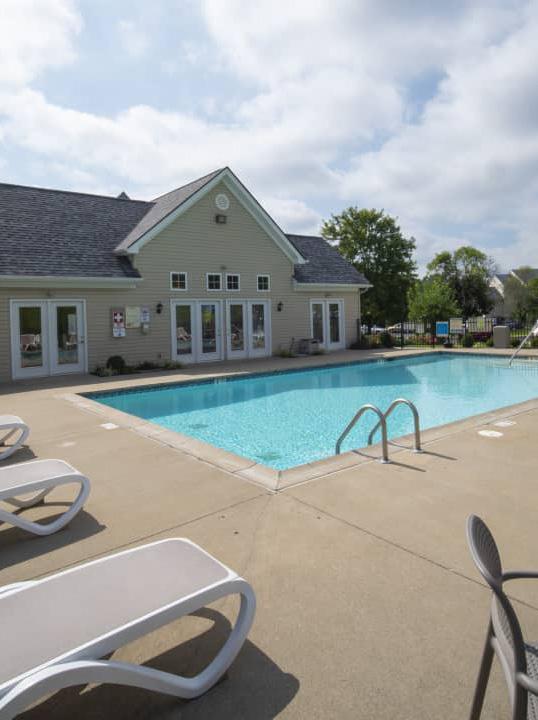
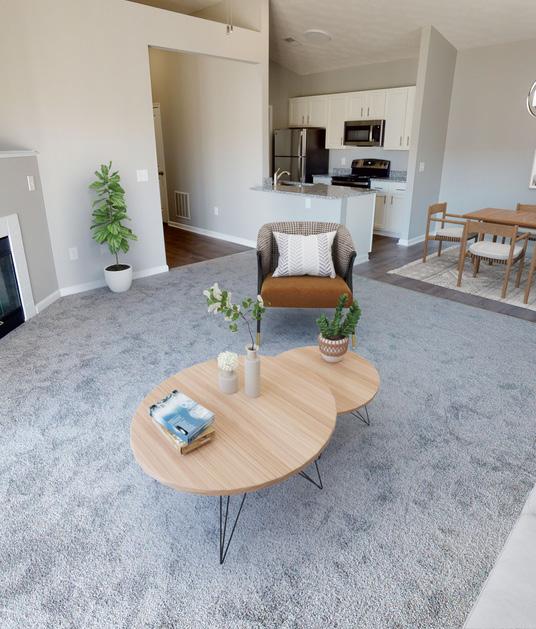
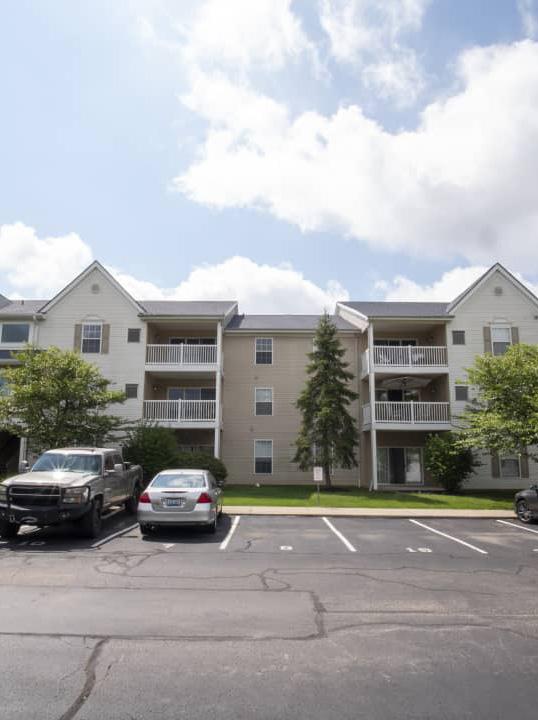
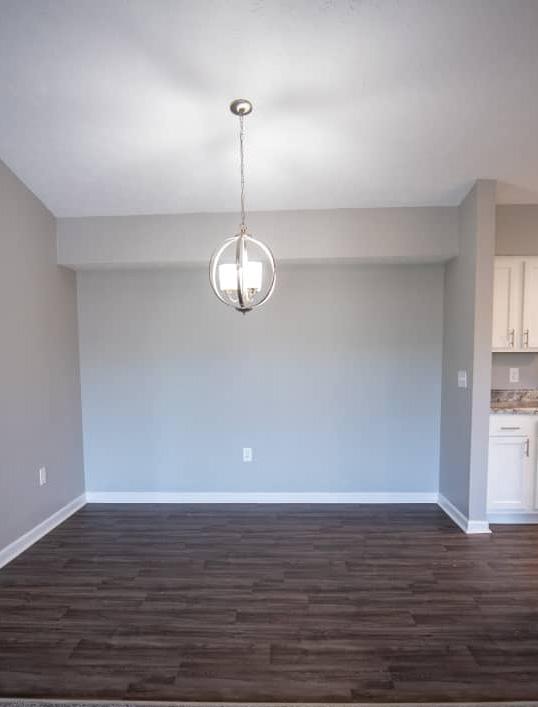
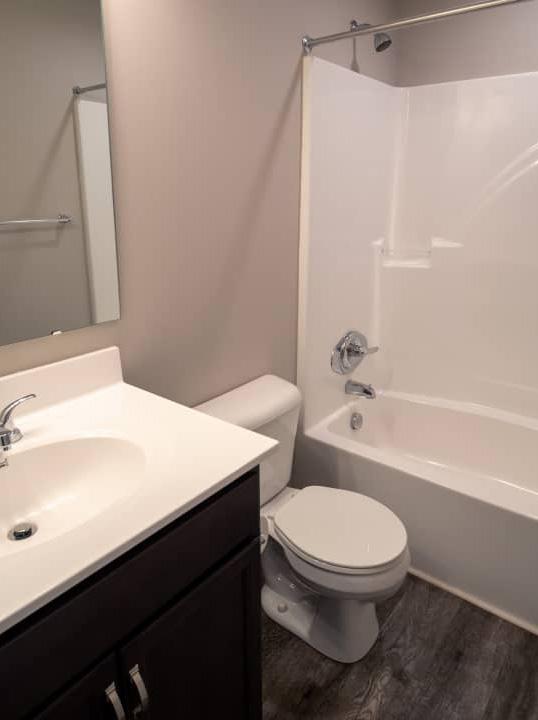
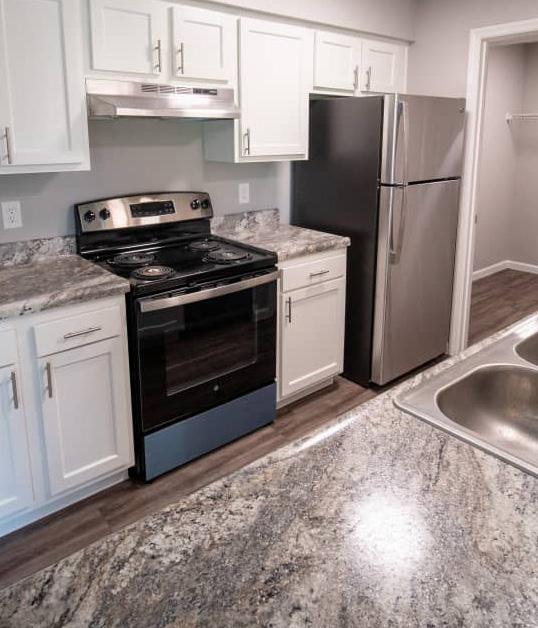
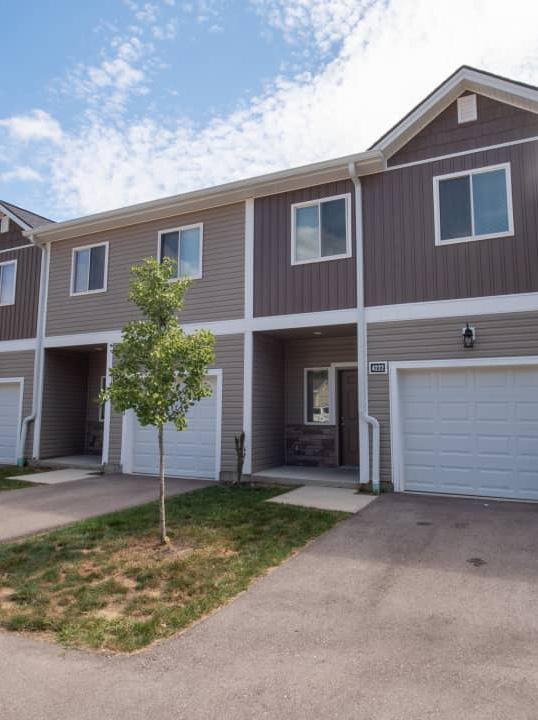
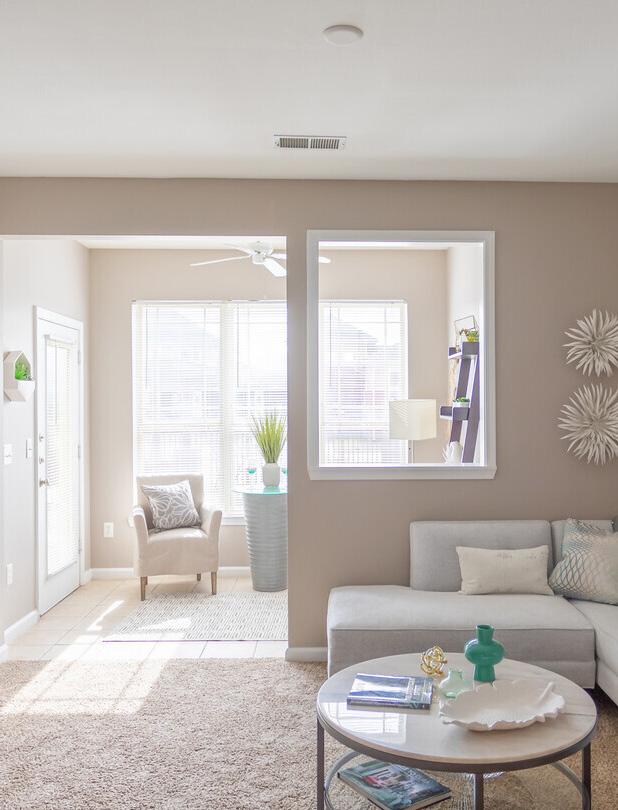
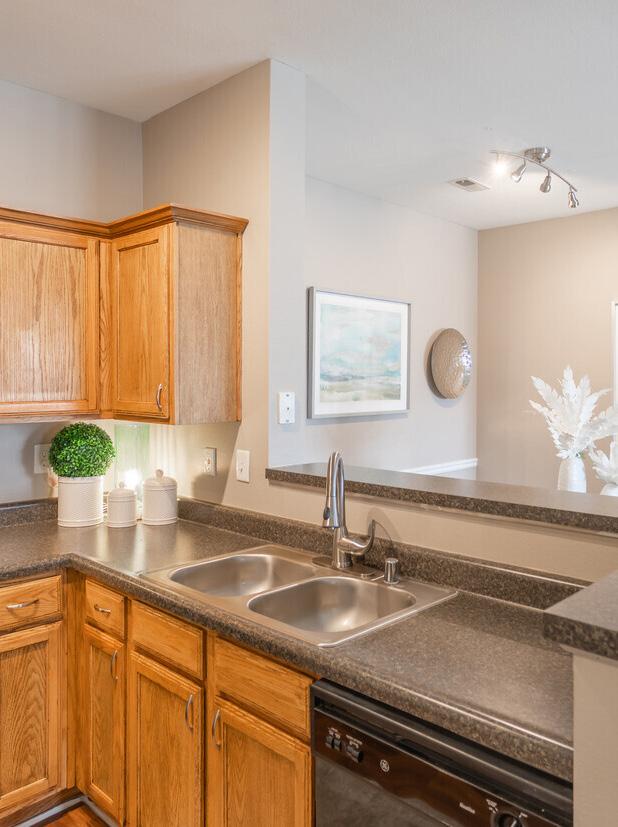
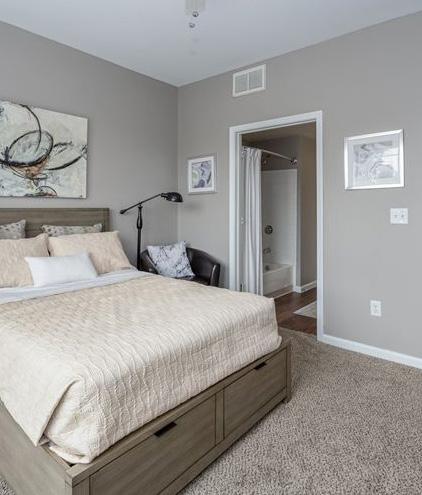
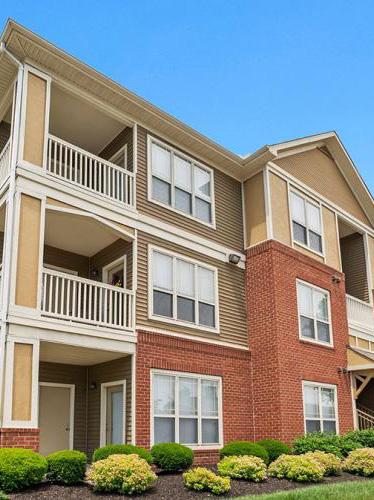
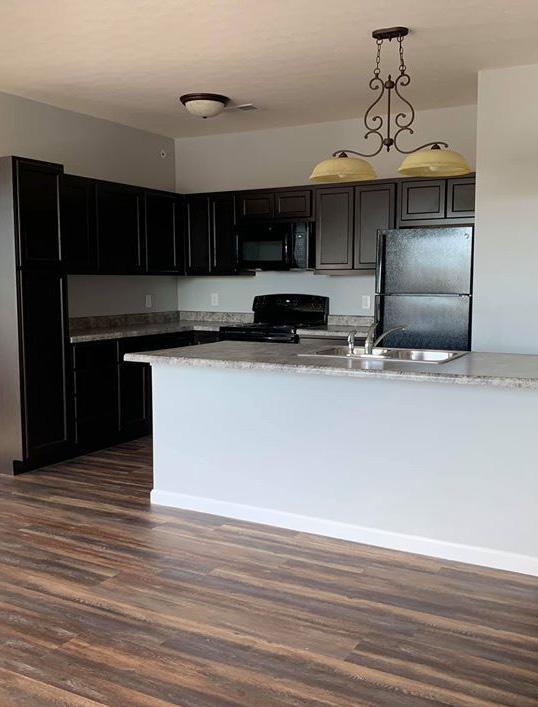
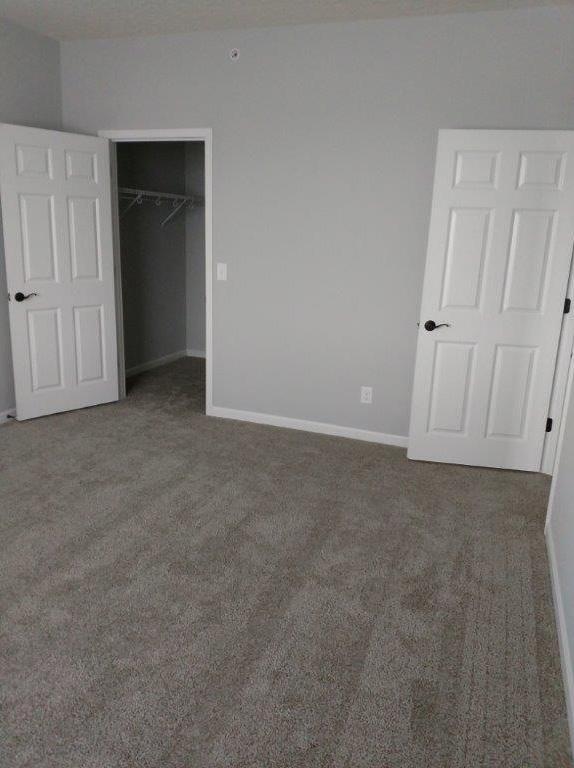
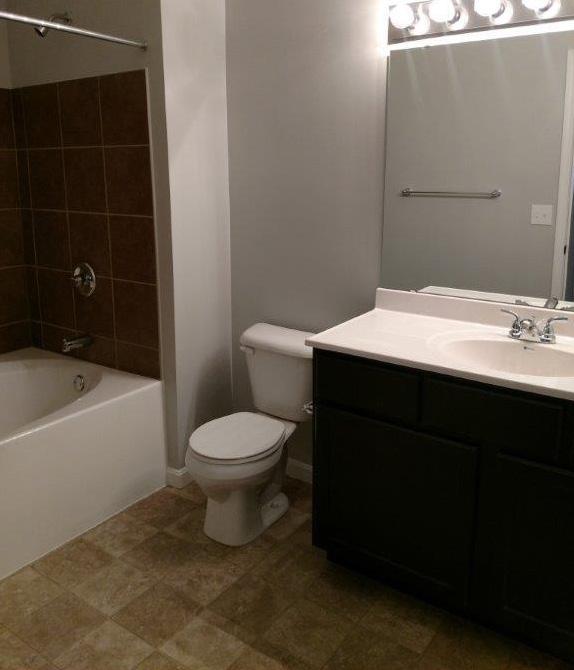
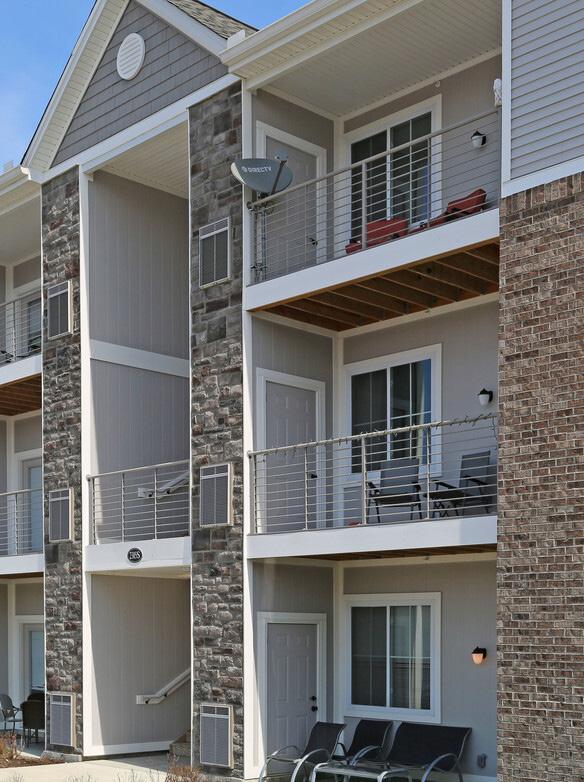
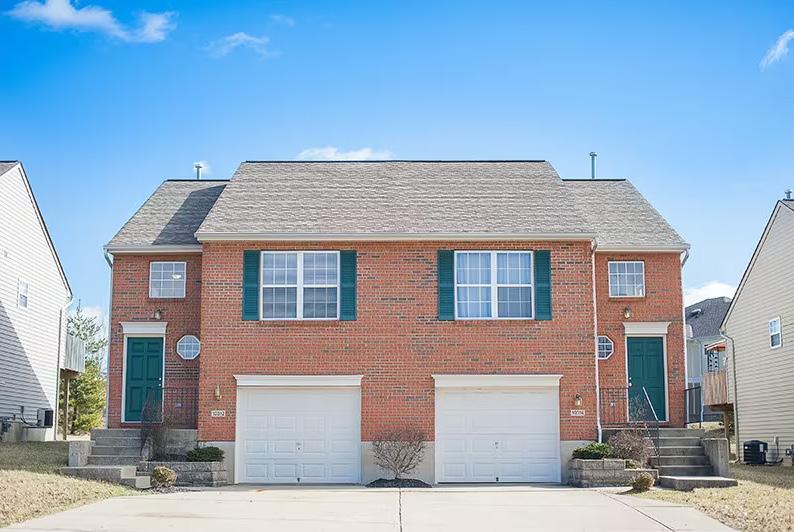
RICHWOOD NORTH ESTATES
PROPERTY SNAPSHOT
Property Address: 71 Deer Haven Ct
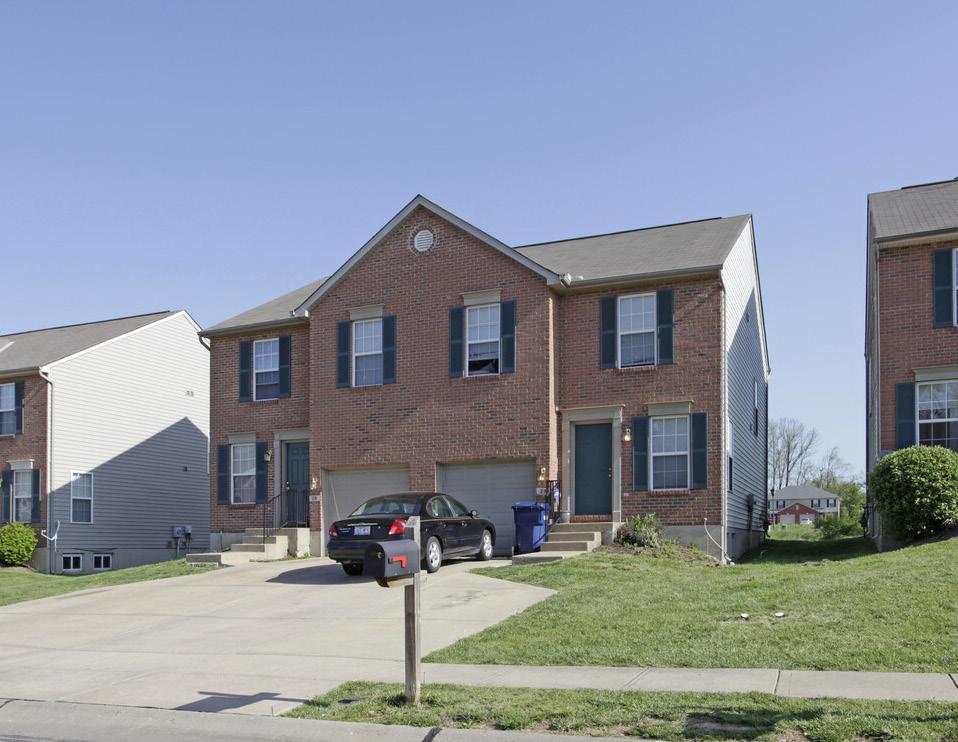
City, State, Zip: Richwood, Kentucky 41094
Submarket: Florance - East/Erlanger
County: Boone County
Year Built: 2005
Number Of Units: 81
HISTORICAL

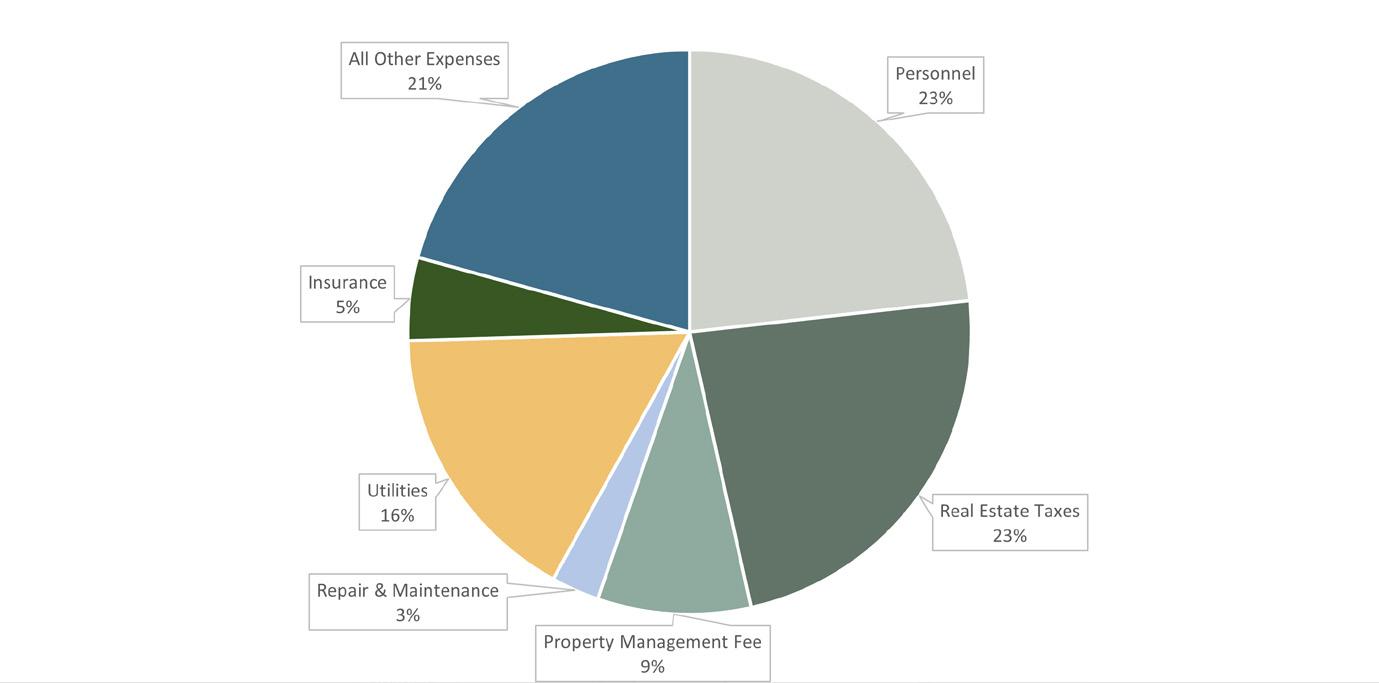
OPERATING PERFORMANCE T12 T1 Base Rental Revenue $1,140,572 $1,237,576 Other Income $160,745 $170,492 Effective Gross Revenue $1,301,317 $1,408,068 Real Estate Taxes $145,442 $145,422 All Other Expenses $624,715 $624,715 Operating Expenses $770,157 $770,137 Net Operating Income $531,160 $637,931 Operating Expense Ratio 59.2% 54.7% PARCEL LOCATIONS

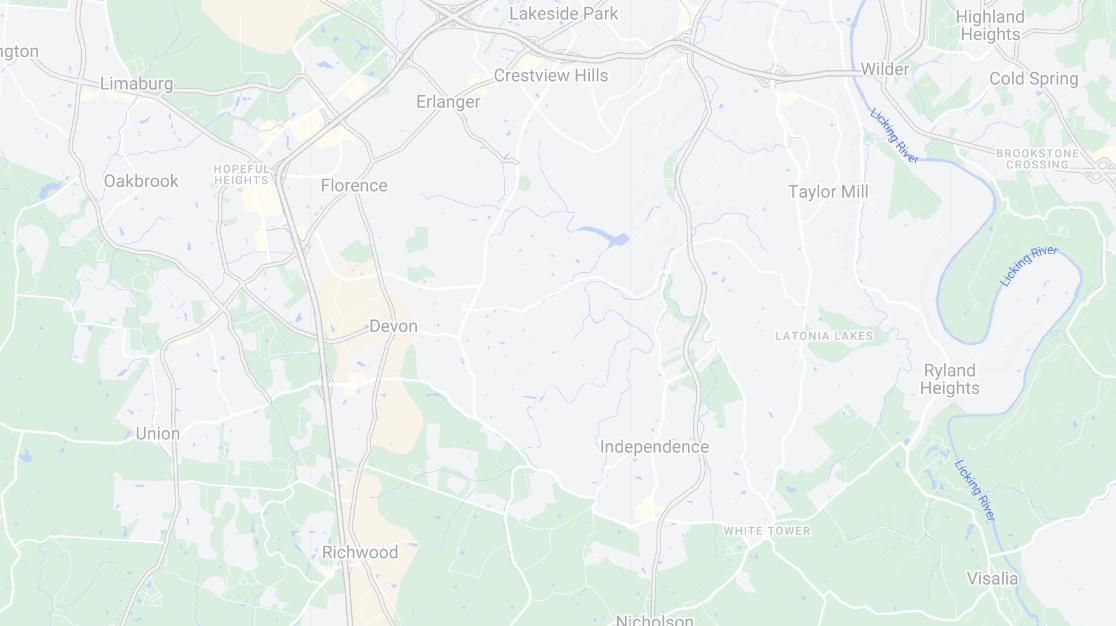
RICHWOOD NORTH ESTATES
INVESTMENT HIGHLIGHTS
The Richwood North Estates are uniquely position in the market with its rents drafting garden style comps in the market. The ability to acquire a large amount of highly sought after townhome units all at once provides a hard-to-find economy of scale in the local market for the product type. Along with scale, Richwood North provides the capacity to undergo a strategic renovation plan to catapult it’s rents closer to some of its direct competitors in the surrounding submarkets of Richwood and Florene, all of which outpace Royal cove by North of $500.
PROVEN RENT GROWTH
Richwood North Estates is positioned on the Northern side of the Richwood submarket which has been one of Cincinnati’s year over year top performers. Rent Growth broke 13% in a year over year comparison with May of 2022 and occupancies are north of 97%. Richwood is always one of the top tier markets when it comes to rental fundamentals and a lack of new townhome style inventory will continue to keep the asset strong.
HARD TO FIND | HIGH DEMAND ASSET
With 75% of Cincinnati’s multifamily supply 1980’s construction or older, Richwood North Estates offers an investor to own a very limited supply asset. Not only is there an opportunity to own an asset in limited supply, but there have also been no newer construction sales over 50 units in the Richwood Market in the last 5 years. Barrier to entry into this market is one of the highest in the city due to its fundamental strengths and limited supply.
THE MARKET
Like many Midwest markets, Cincinnati evaded the worst effects of the pandemic relative to other areas of the country. Spurred by healthy job gains and moderate population growth, the Cincinnati apartment market continues to attract new residents, investors, and developers. Apartment demand reached 3,785 units in 2022, one of Cincinnati’s better performances in the last 30 years. This strong apartment demand boosted occupancy to its highest recorded level at 98.1% in the 4th quarter of 2022. Such strong demand allowed operators to push rental rates with an all-time high annual rental growth rate of 8.4% in 2022.
DEAL SUMMARY

118,950 81 1,469
RENTABLE SQUARE FEET TOTAL UNITS AVG SF
#3 Bedroom

% Leased
RICHWOOD NORTH ESTATES
*
COMPETITOR LOCATIONS
COMPETITORS 1 BROOKESIDE PARK APTS 2 KENTON RESERVE 3 TRELLISES APARTMENTS 4 AFFINITY OF UNION RENT COMPARABLES 1 3 4
LOCAL
RICHWOOD NORTH ESTATES
2
rent sort THREE bedroom
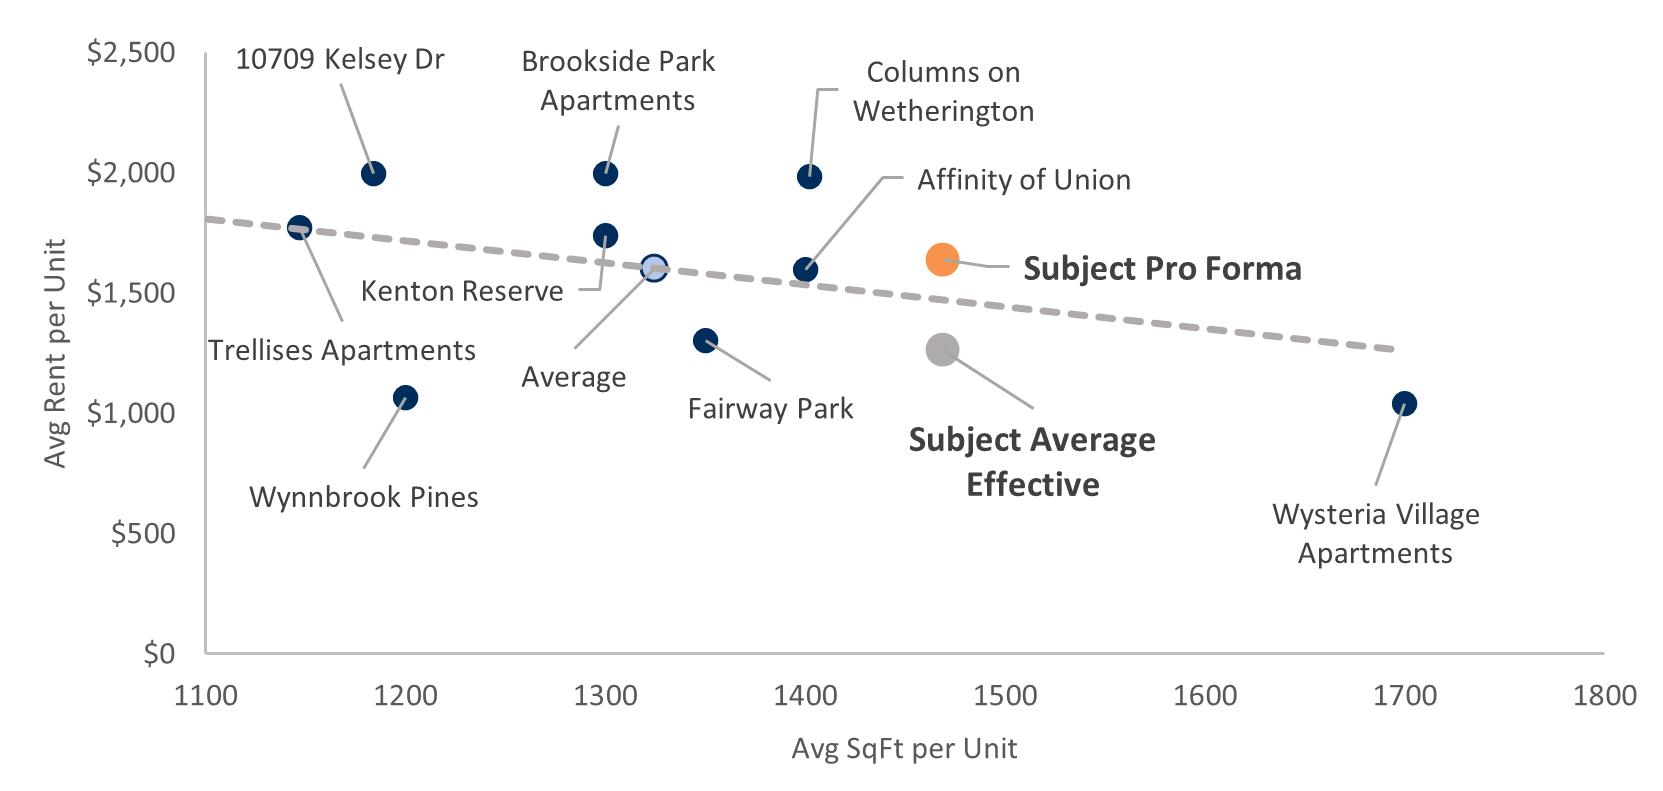
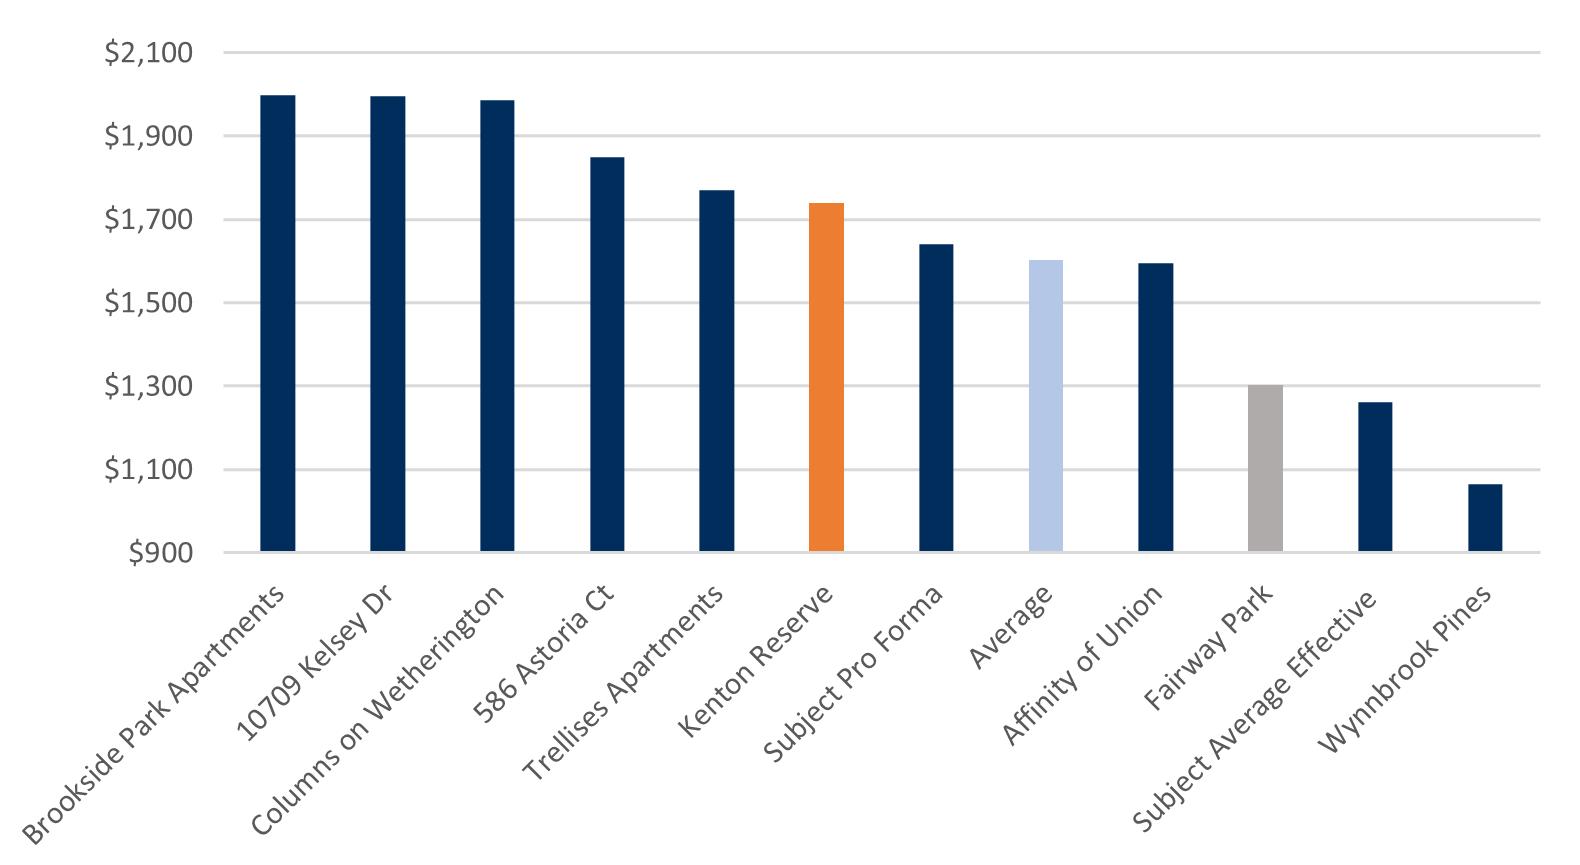
Property Year Built # Units Avg SF Avg Rent Avg Rent/SF Brookside Park Apartments 2003 98 1300 $1,997 $1.54 10709 Kelsey Dr 2006 1 1184 $1,995 $1.68 Columns on Wetherington 2002 192 1402 $1,985 $1.42 586 Astoria Ct 2005 1 976 $1,850 $1.90 Trellises Apartments 2002 317 1147 $1,770 $1.54 Kenton Reserve 1990 108 1300 $1,738 $1.34 Subject Pro Forma 2005 81 1469 $1,640 $1.12 Average 2004 126 1325 $1,603 $1.18 Affinity of Union 2020 294 1400 $1,595 $1.14 Fairway Park 1989/2013 120 1350 $1,303 $0.97 Subject Average Effective 2005 81 1469 $1,261 $0.86 Wynnbrook Pines 1991 96 1200 $1,064 $0.89
Three Bedroom
LOCAL COMPETITORS

BROOKSIDE PARK APTS
UNITS 88 YEAR BUILT 2003 OCCUPANCY 99.1% UNIT MIX UNITS SQFT RENT RENT/SF Two Bedroom 74 1100 $1,400 $1.27 Three Bedroom 14 1300 $1,997 $1.54 Apartment Interior Amenities Electric Fireplace Walk-In Closets Hollywood Lighting Private Patio or Balcony Separate Laundry Room Common Amenities Clubroom Fitness Center Nature Trail 2-16 Quiet Creek DR
LOCAL COMPETITORS
KENTON RESERVE
Units 108 Year Built 1990 Occupancy 96.3% UNIT MIX UNITS SQFT RENT RENT/SF Two Bedroom 84 1100 $1,329 $1.21 Three Bedroom 24 1300 $1,738 $1.34 Apartment Interior Amenities Private Balcony/Patio Walk-In Closets Common Amenities Fitness Center Clubhouse Swimming Pool Laundry Facility 9552 Apple Valley Dr
LOCAL COMPETITORS
TRELLISES APARTMENT
UNITS 317 YEAR BUILT 2002 OCCUPANCY 98.0% UNIT MIX UNITS SQFT RENT RENT/SF One Bedroom 16 617 $1,267 $2.05 Two Bedroom 141 1103 $1,454 $1.32 Three Bedroom 52 1147 $1,770 $1.69 Apartment Interior Amenities Washer & Dryer Hookup High Speed Internet Common Amenities Fitness Center Swimming Pool Basketball Court Coffee Bar Game Room Clubhouse Utilities Responsibility Resident Pays Electricity Resident Pays Sewer Resident Pays Trash Removal Resident Pays Water 996 Trellises Dr
LOCAL COMPETITORS
AFFINITY OF UNION
Apartment
Washer
Wood
Patio/Balcony
High
Clubhouse
Swimmming Pool
Laundry
Units 294 Year Built 2020 Occupancy 98.0% UNIT MIX UNITS SQFT RENT RENT/SF One Bedroom 60 900 $1,778 $1.98 Two Bedroom 180 1200 $1,350 $1.13 Three Bedroom 54 1400 $1,595 $1.55
Interior Amenities
& Dryer Hookup
Flooring
Ceilings
Common Amenities
Fitness Center
Utilities Responsibility Resident Pays Electricity Resident Pays Sewer Resident Pays Trash Removal Resident Pays Water 3000 Affinity Fields
Facilities
FINANCIALS
02
RICHWOOD NORTH ESTATES - FINANCIALS

UNIT MIX SUMMARY
AVERAGE EFFECTIVE MARKET PROJECTED UNIT TYPE NO. OF UNITS RENTABLE SF TOTAL SF RENT/UNIT RENT/SF TOTAL RENT POTENTIAL RENT/UNIT RENT/SF TOTAL RENT POTENTIAL RENT/UNIT RENT/SF TOTAL RENT POTENTIAL SUMMARY Three Bedroom 81 Units 1,469 SF 118,950 SF $1,261.11 $0.86 $102,150 $1,518.52 $1.03 SF $123,000 $1,690.74 $1.15 SF $136,950 Totals / Wtd. Averages 81 Units 1,469 SF 118,950 SF $1,261.11 $0.86 SF $102,150 $1,518.52 $1.03 SF $123,000 $1,690.74 $1.15 SF $136,950
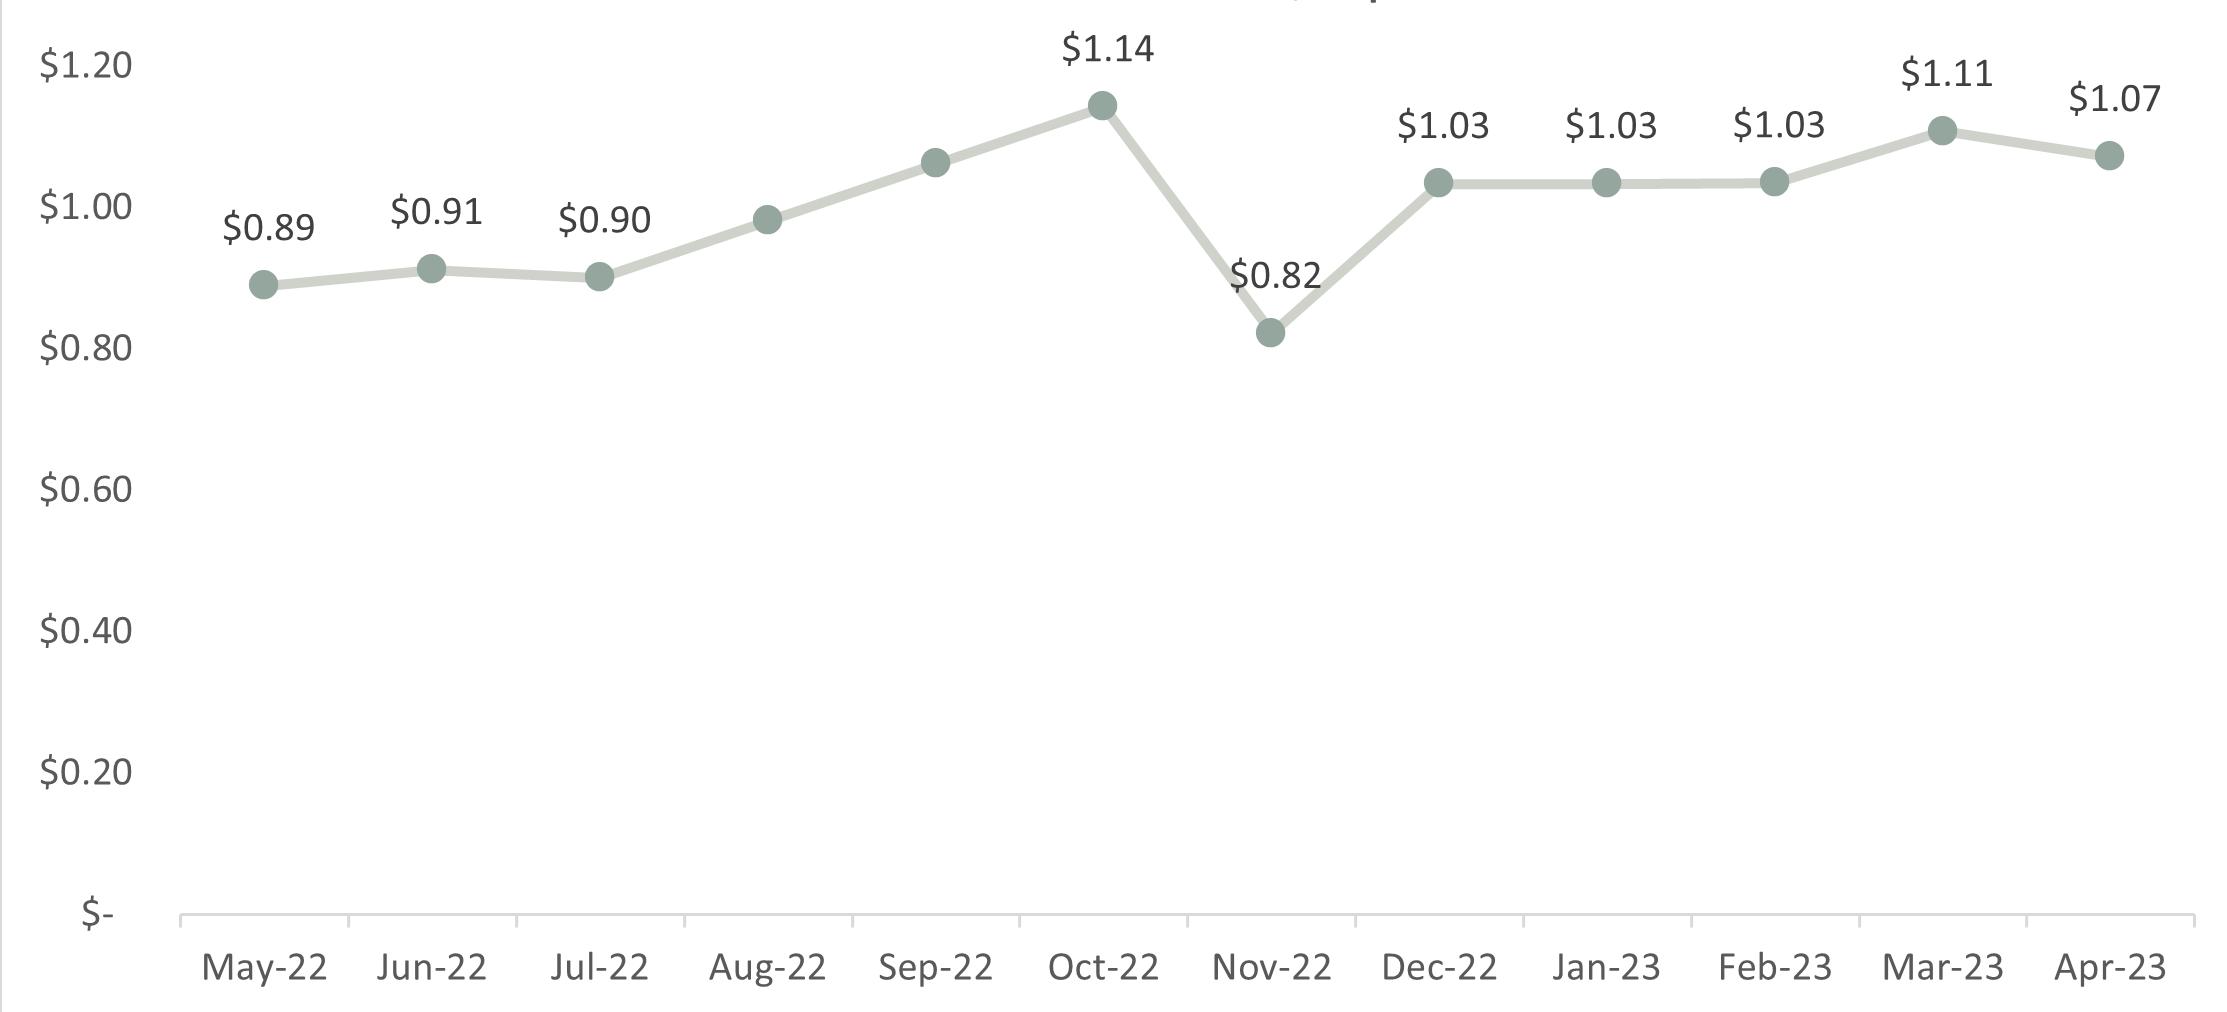
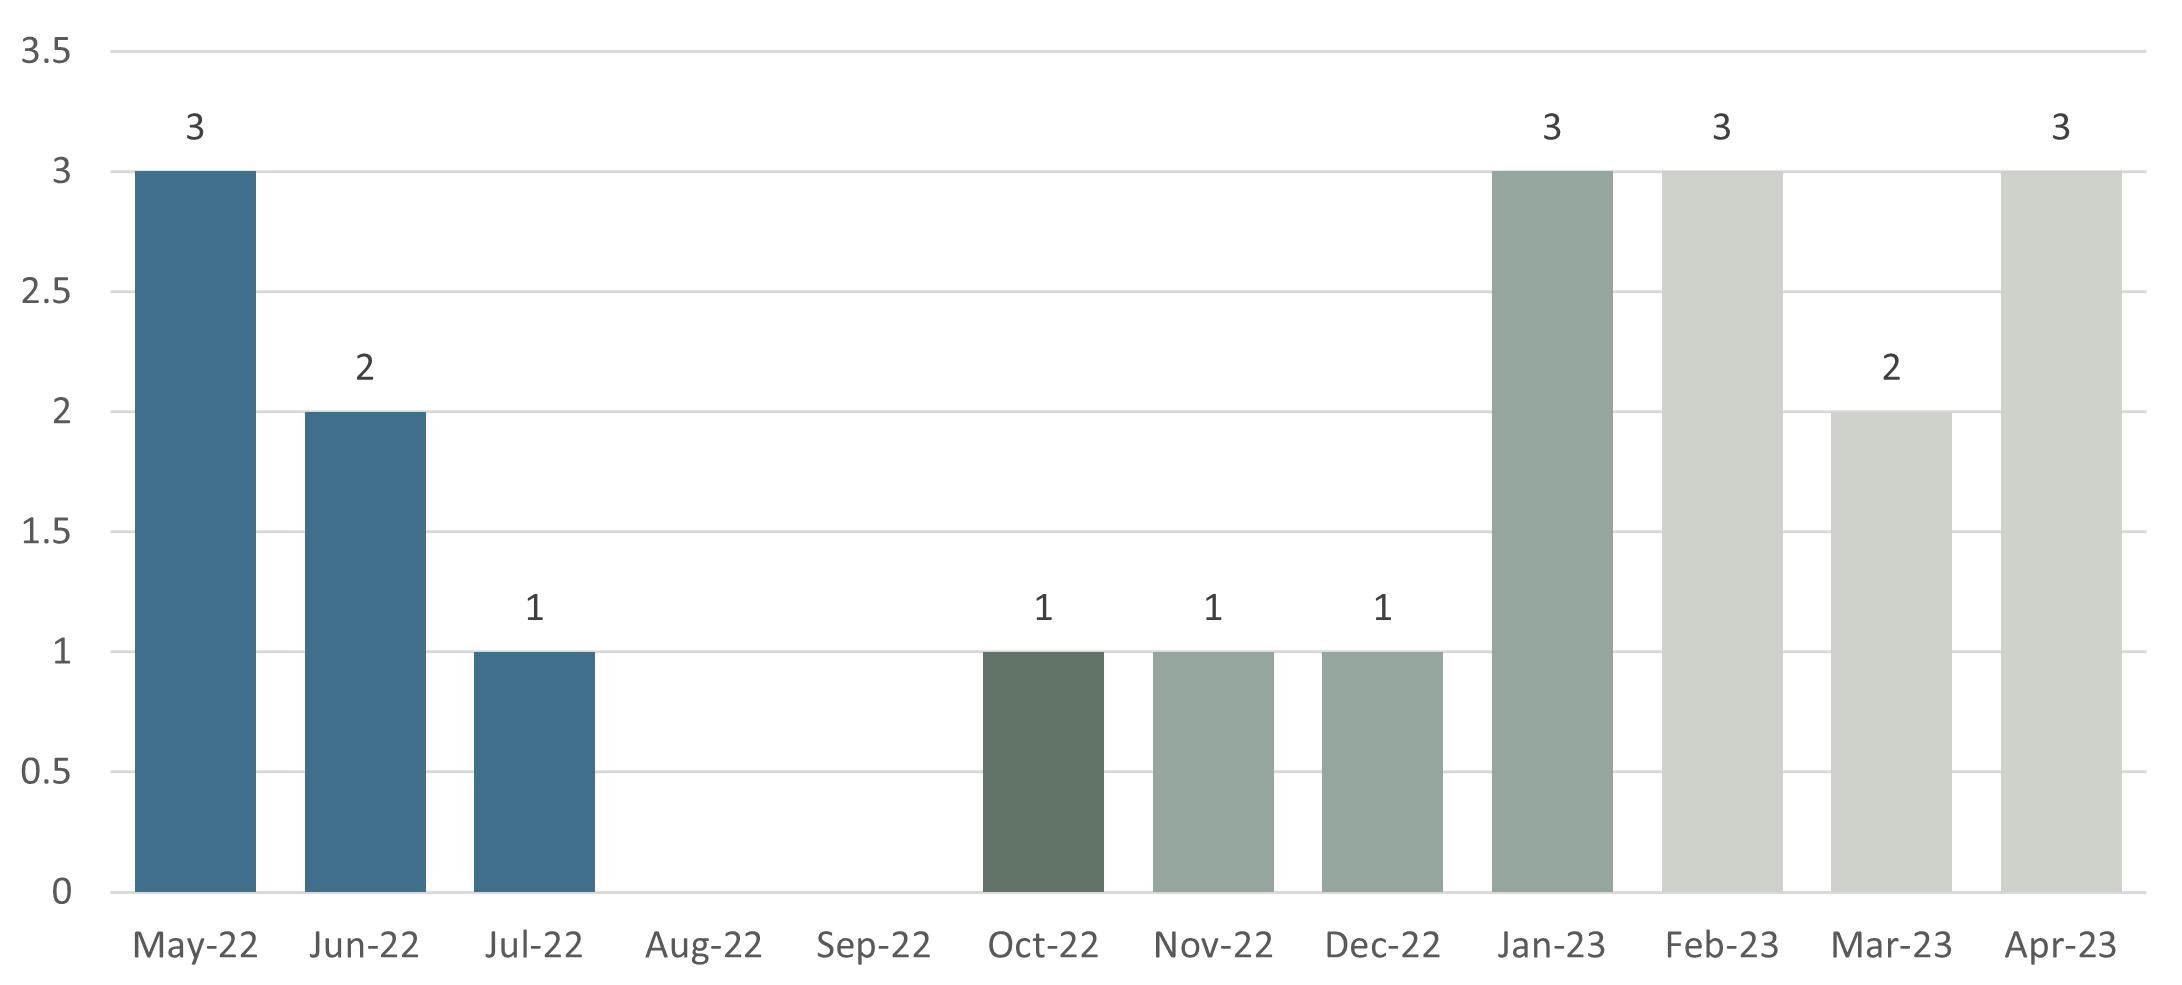
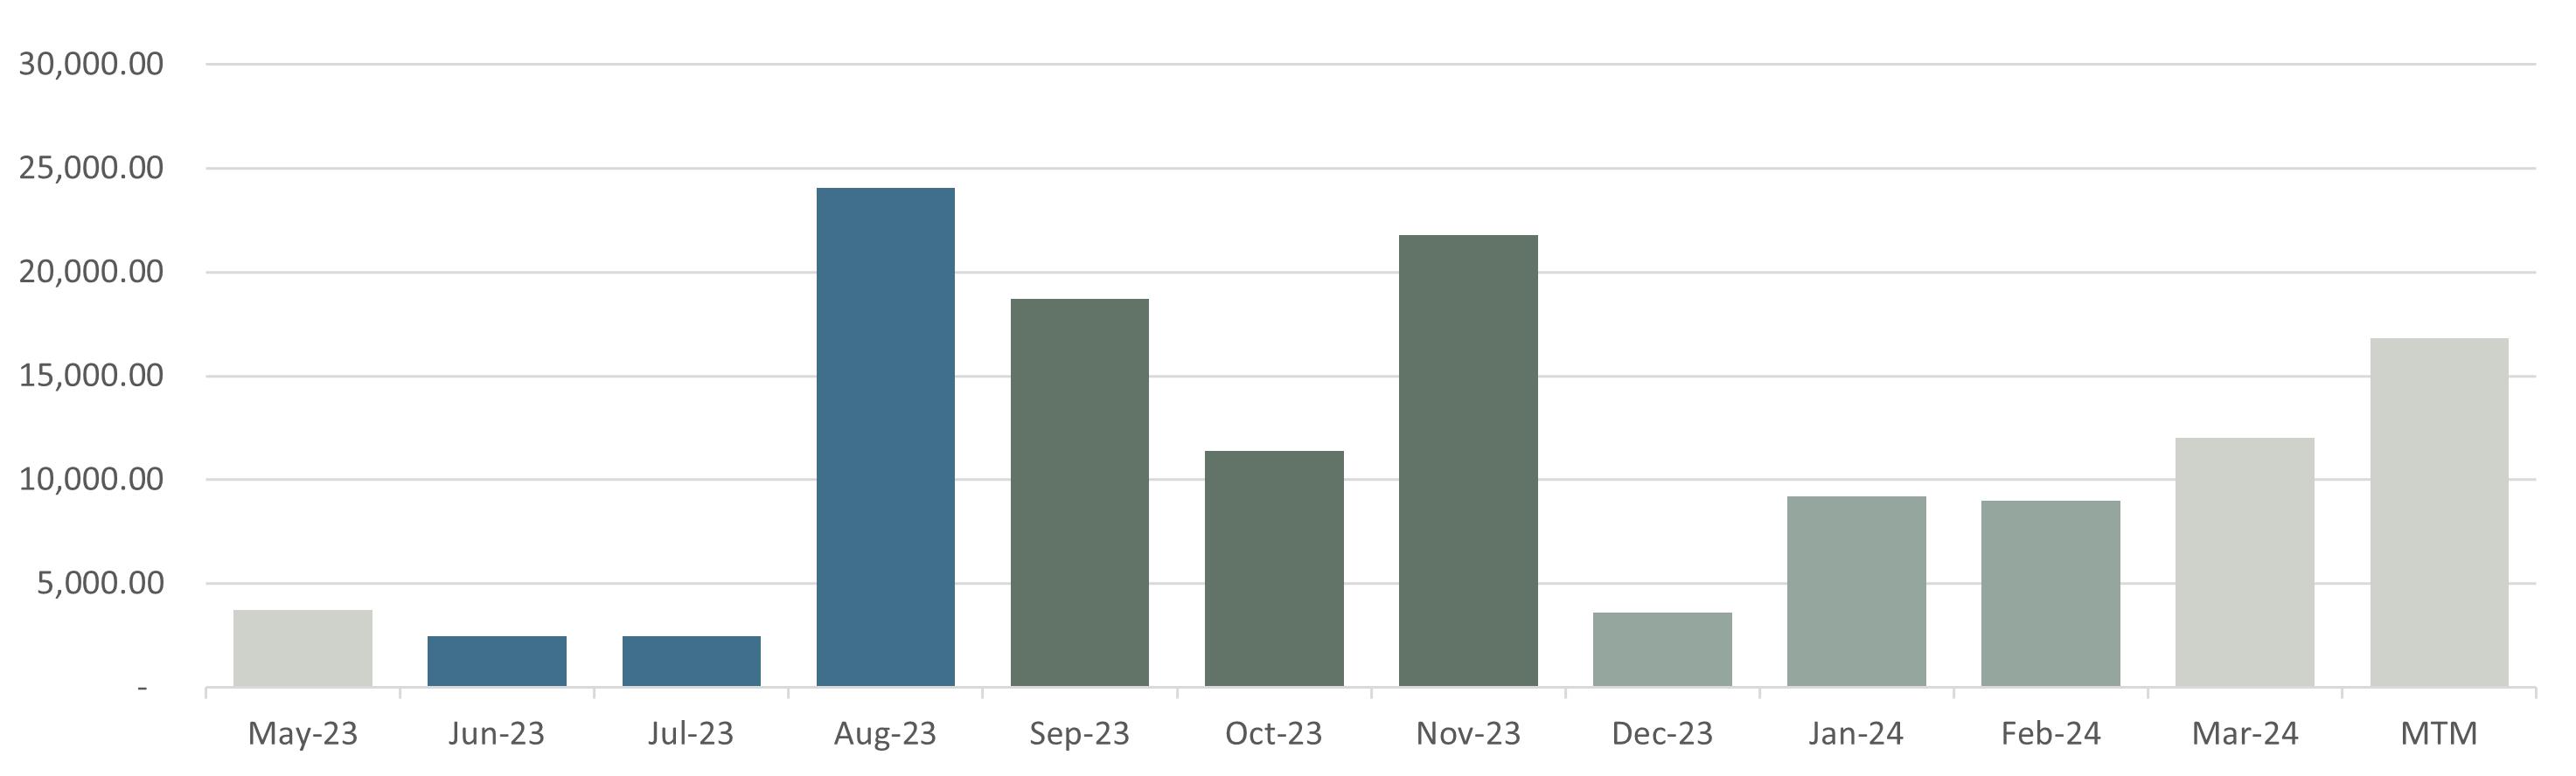
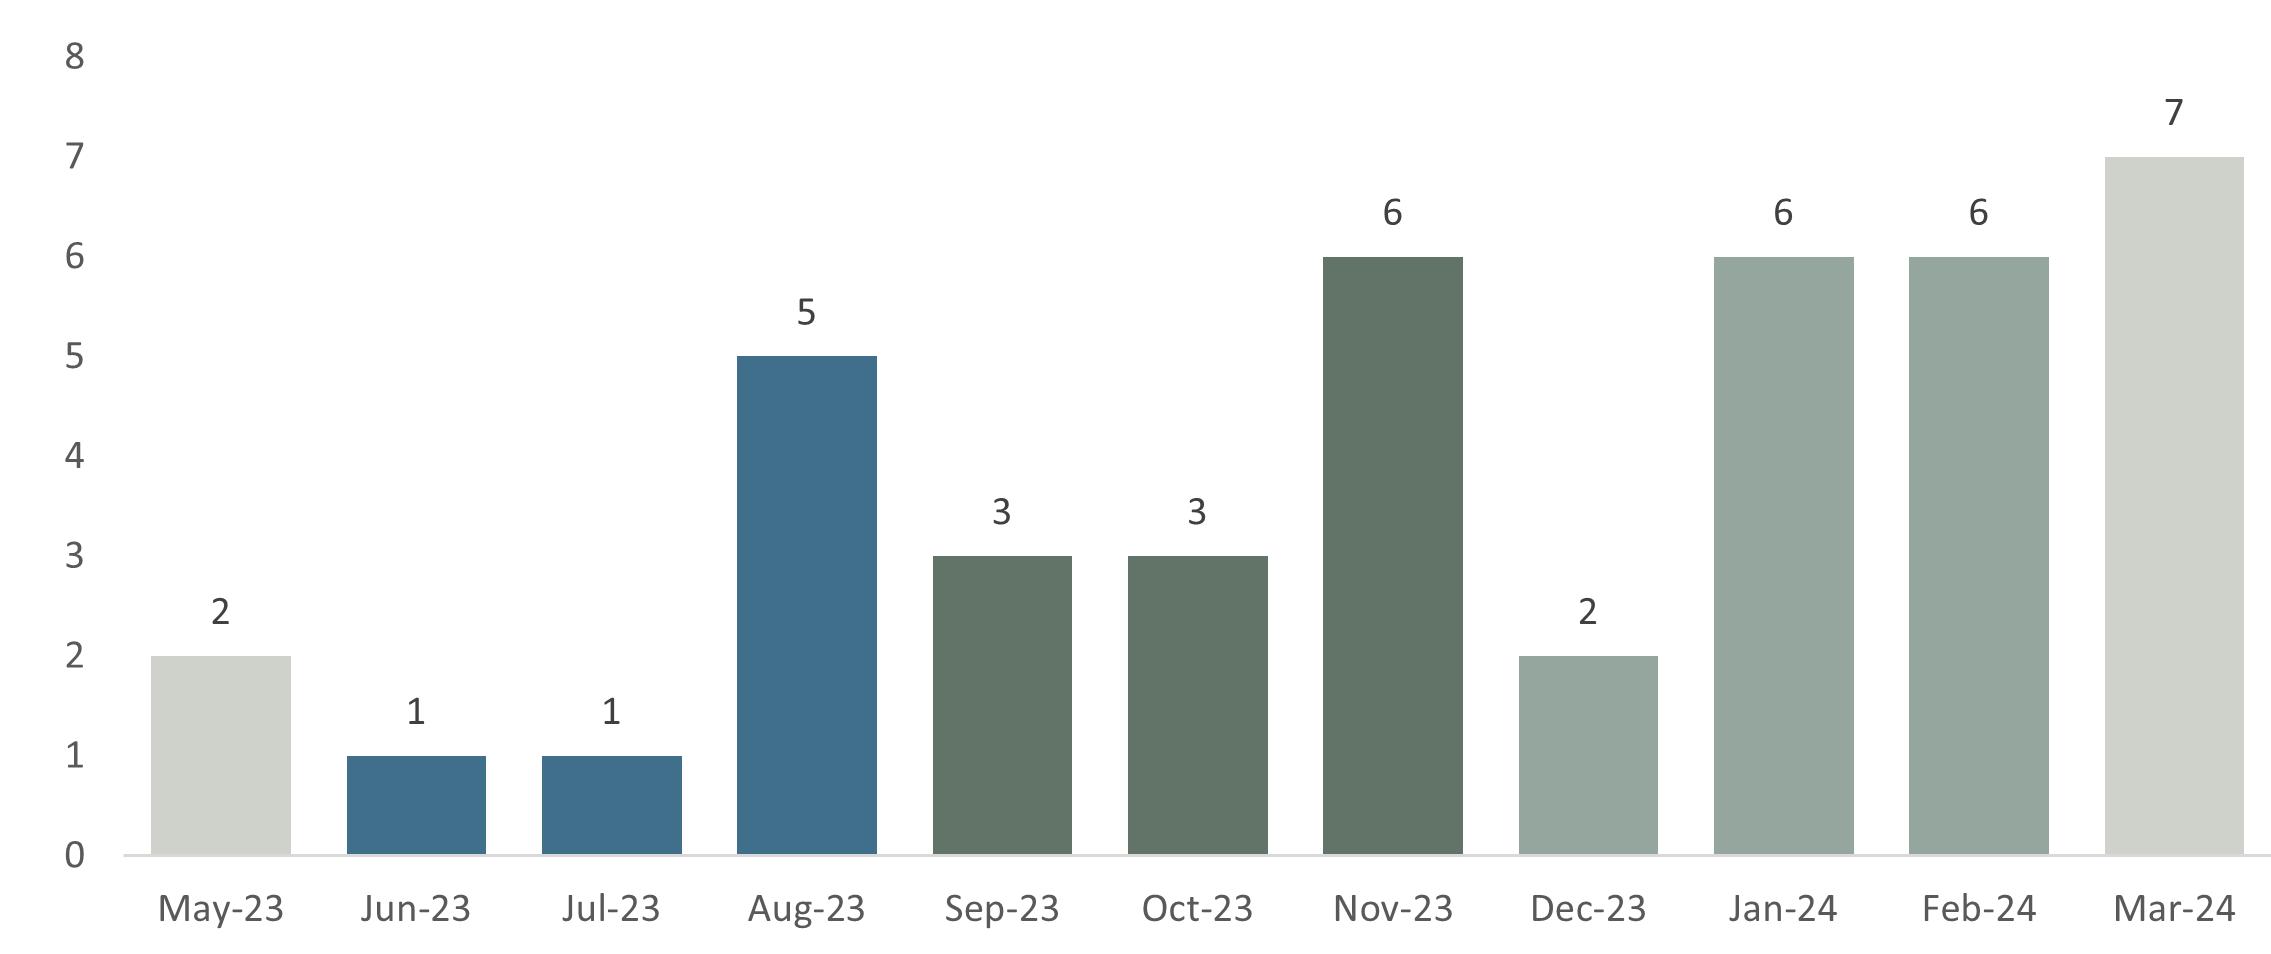
NEW LEASES PRICE/SQFT MAY 22 - APR 23 MAY 22 - APR 23
LEASING TRENDS
RICHWOOD NORTH ESTATES - FINANCIALS
UNIT MIX BREAKDOWN
AVERAGE EFFECTIVE MARKET PROJECTED UNIT TYPE NO. OF UNITS RENTABLE SF TOTAL SF RENT/UNIT RENT/SF TOTAL RENT POTENTIAL RENT/UNIT RENT/SF TOTAL RENT POTENTIAL RENT/UNIT RENT/SF TOTAL RENT POTENTIAL Three Bedroom 3BR/2BA 36 Units 1,400 SF 50,400 SF $1,235.56 $0.88 SF $44,480 $1,450.00 $1.04 SF $52,200 $1,650.00 $1.18 SF $59,400 3BR/2.5BA - TH 24 Units 1,500 SF 36,000 SF $1,264.41 $0.84 SF $30,346 $1,550.00 $1.03 SF $37,200 $1,700.00 $1.13 SF $40,800 3BR/2.5BA - TH 21 Units 1,550 SF 32,550 SF $1,301.15 $0.84 SF $27,324 $1,600.00 $1.03 SF $33,600 $1,750.00 $1.13 SF $36,750 Totals / Wtd. Averages 81 Units 1,469 SF 118,950 SF $1,261.11 $0.86 SF $102,150 $1,518.52 $1.03 SF $123,000 $1,690.74 $1.15 SF $136,950
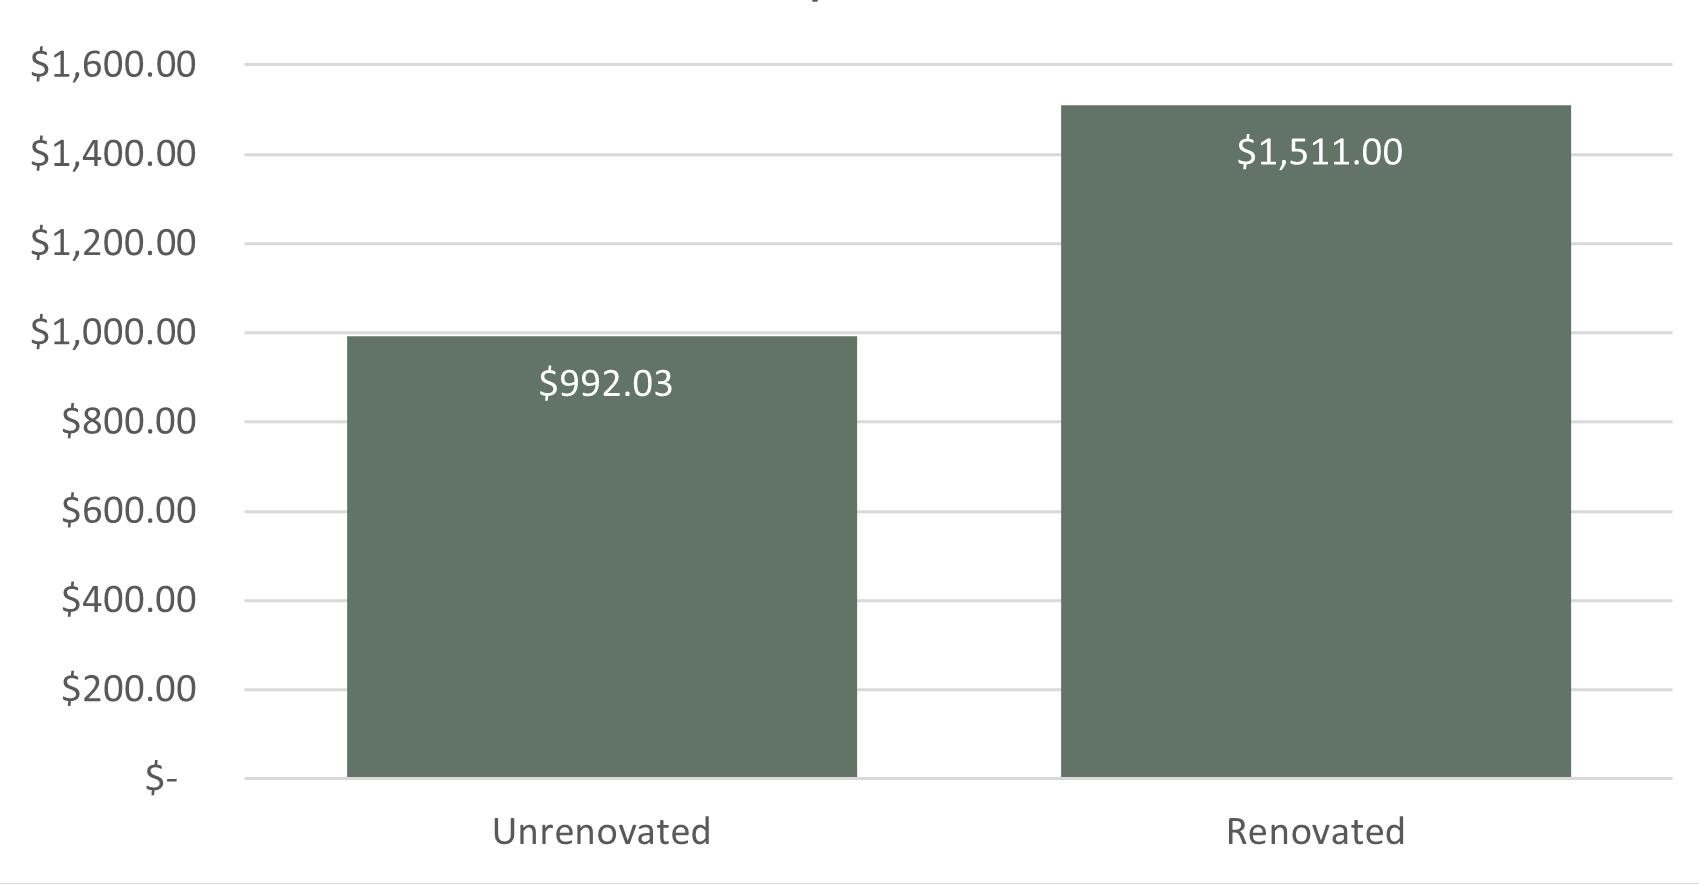
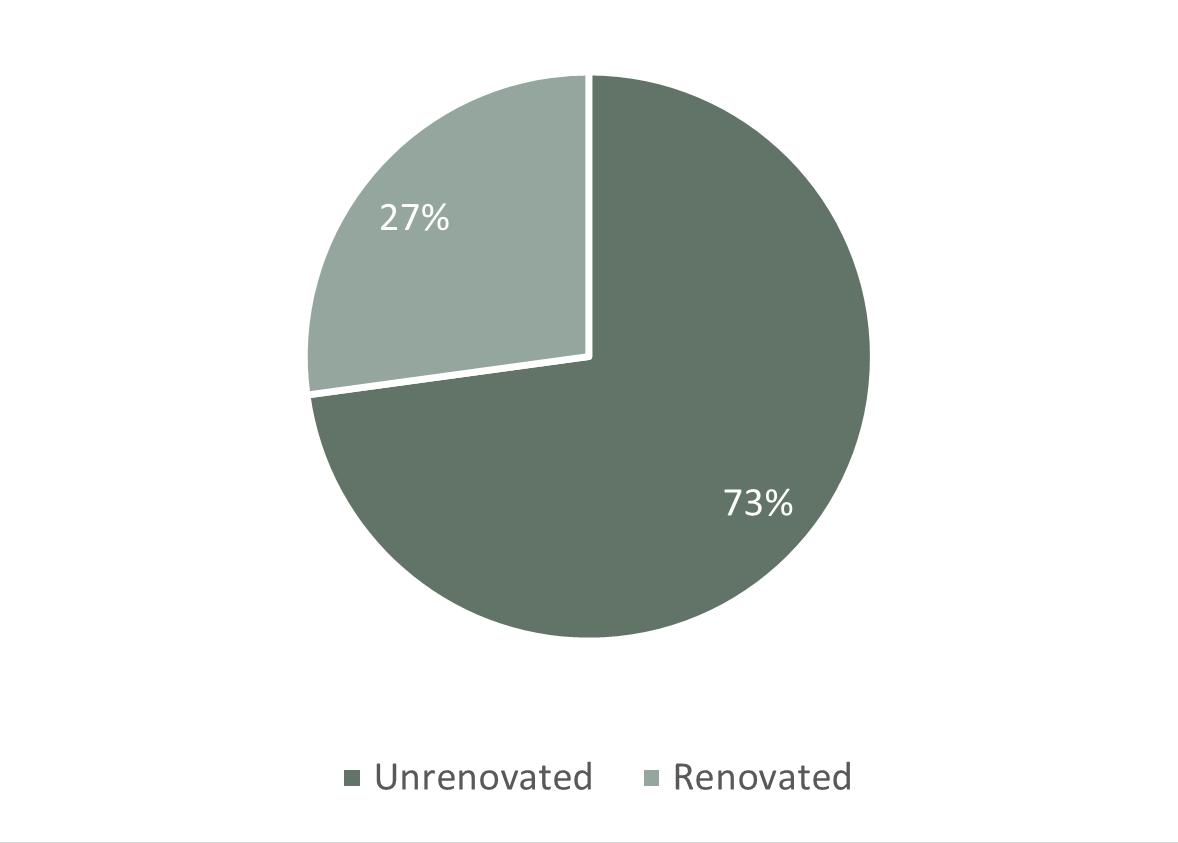
RENOVATION STATUS
EFFECTIVE RENT BY RENOVATION STATUS

MONTHLY RENTS
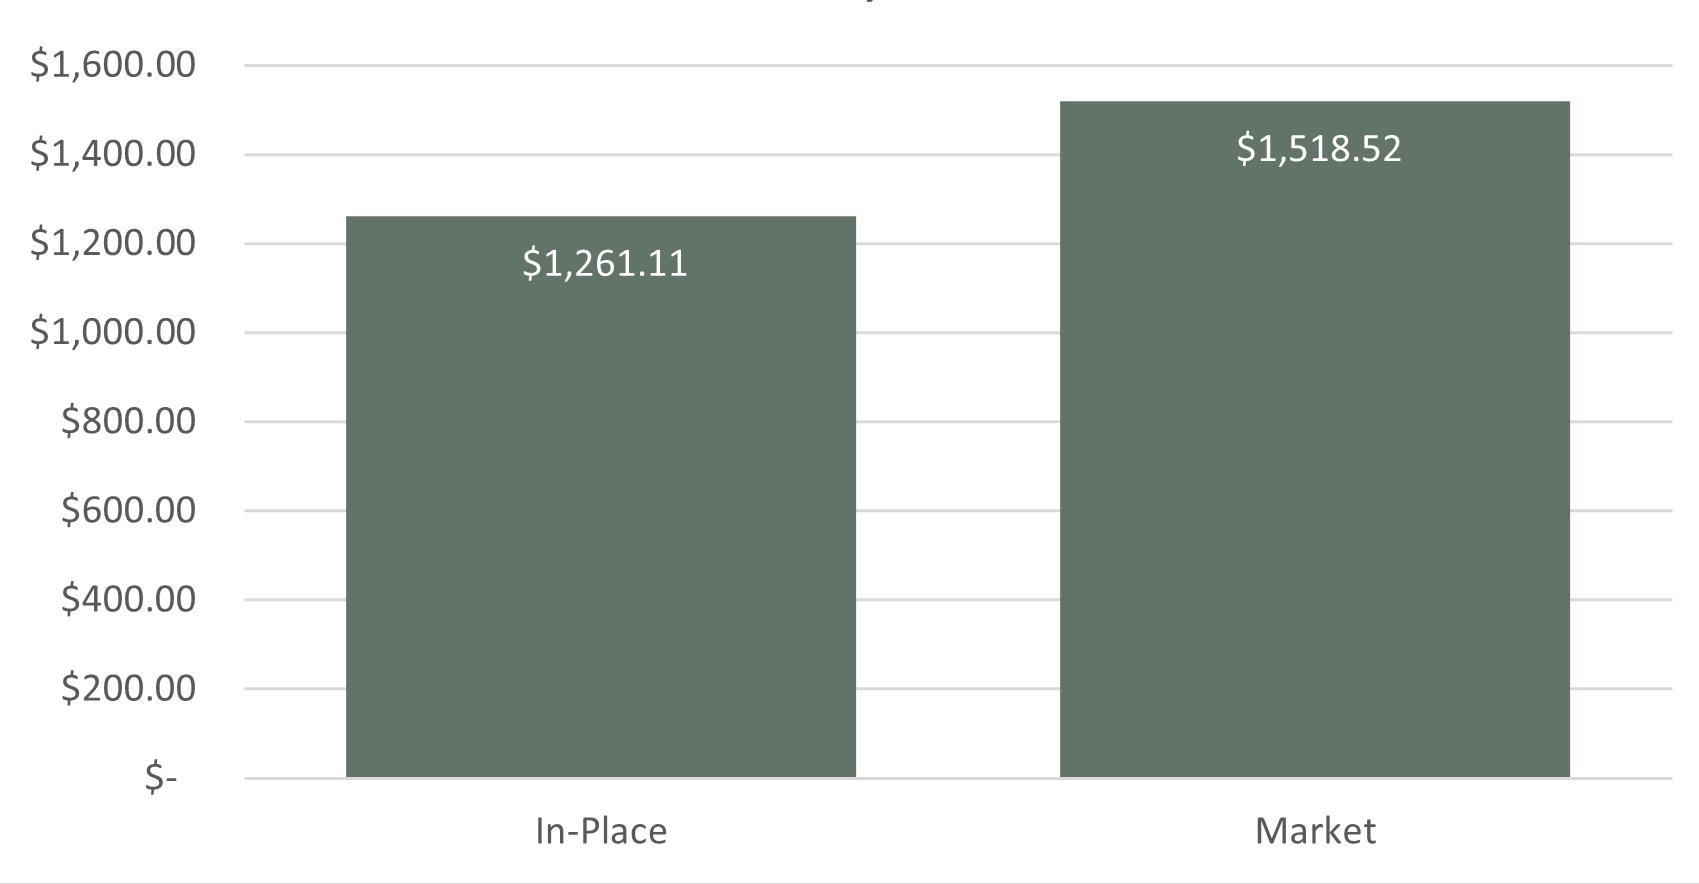
LEASE TYPES

RICHWOOD NORTH ESTATES -
LOss TO LEASE BURN OFF
LOSS TO LEASE BURN-OFF
LEASE EXPIRATION SCHEDULE
INCOME GROSS POTENTIAL RENT T1 3 Month 4 Month 5 Month 6 Month 9 Month 12 Month All Units at Market Rent $1,435,200 $1,435,200 $1,435,200 $1,435,200 $1,435,200 $1,435,200 $1,435,200 Gain (Loss) to Lease $(197,624) $(188,984) $(164,924) $(146,204) $(134,804) $(100,244) $(62,444) GROSS SCHEDULED RENT $1,237,576 $1,246,216 $1,270,276 $1,288,996 $1,300,396 $1,334,956 $1,372,756 OTHER INCOME Water Income $57,983 $57,983 $57,983 $57,983 $57,983 $57,983 $57,983 Cable TV Income $53,877 $53,877 $53,877 $53,877 $53,877 $53,877 $53,877 Late Charges $19,575 $19,575 $19,575 $19,575 $19,575 $19,575 $19,575 Legal Fees - Eviction $8,356 $8,356 $8,356 $8,356 $8,356 $8,356 $8,356 Month to Month Fees $6,982 $6,982 $6,982 $6,982 $6,982 $6,982 $6,982 Damage Fees $6,517 $6,517 $6,517 $6,517 $6,517 $6,517 $6,517 Pet Rent $5,927 $5,927 $5,927 $5,927 $5,927 $5,927 $5,927 Administrative Fee $5,850 $5,850 $5,850 $5,850 $5,850 $5,850 $5,850 Application Fees $3,530 $3,530 $3,530 $3,530 $3,530 $3,530 $3,530 NSF Fees $1,588 $1,588 $1,588 $1,588 $1,588 $1,588 $1,588 Lease Termination Fee $1,579 $1,579 $1,579 $1,579 $1,579 $1,579 $1,579 Trash Income $1,035 $1,035 $1,035 $1,035 $1,035 $1,035 $1,035 Pet Fee - Non-Refundable $700 $700 $700 $700 $700 $700 $700 Security Deposit Forfeits $500 $500 $500 $500 $500 $500 $500 Utilities $192 $192 $192 $192 $192 $192 $192 TOTAL OTHER INCOME $174,191 $174,191 $174,191 $174,191 $174,191 $174,191 $174,191 GROSS POTENTIAL INCOME $1,411,767 $1,420,407 $1,444,467 $1,463,187 $1,474,587 $1,509,147 $1,546,947 Physical Vacancy $(25,392) $(49,849) $(50,811) $(51,560) $(52,016) $(53,398) $(54,910) Bad Debt $(15,469) $(12,462) $(12,703) $(12,890) $(13,004) $(13,350) $(13,728) EFFECTIVE GROSS INCOME $1,370,905 $1,358,096 $1,380,954 $1,398,739 $1,409,570 $1,442,403 $1,478,314
CURRENT RENT ROLL: AS OF APRIL 30, 2023 INCOME AND EXPENSES: SEPTEMBER 2022 - APRIL 2023
-
RICHWOOD NORTH ESTATES
FINANCIALS
YEAR 1 GROSS POTENTIAL RENT % of GPR Per Unit % of GPR Per Unit All Units at Market Rent $1,522,276 T3 18,794 $1,643,400 20,289 Gain (Loss) to Lease ($327,504) T3 21.51% (4,043) ($246,510) 15.00% (3,043) GROSS SCHEDULED RENT $1,194,772 14,750 $1,396,890 17,246 Other Income Late Fees $13,409 T3 1.12% 166 $13,812 0.99% 171 Renters Insurance Collected $7,141 T3 0.60% 88 $7,355 0.53% 91 Application Fee Income $4,200 T3 0.35% 52 $4,326 0.31% 53 Admin Fee Income $4,200 T3 0.35% 52 $4,326 0.31% 53 One Time Pet Fee $2,400 T3 0.20% 30 $2,472 0.18% 31 Prepaid $2,062 T3 0.17% 25 $2,123 0.15% 26 Pet Charges $1,699 T3 0.14% 21 $1,750 0.13% 22 Damages Billed $1,200 T3 0.10% 15 $1,236 0.09% 15 Maintenance Fee Income $1,185 T3 0.10% 15 $1,221 0.09% 15 Total Other Income $38,898 3.26% 480 $40,065 2.87% 495 GROSS POTENTIAL INCOME $1,233,670 15,230 $1,436,955 17,740 Physical Vacancy ($147,203) T3 12.32% (1,817) ($69,845) 5.00% (862) Bad Debt ($30,368) T3 2.54% (375) ($27,938) 2.00% (345) Concessions Allowance ($105) T3 0.01% (1) $0 0.00% 0 EFFECTIVE GROSS INCOME $1,055,994 63.61% 13,037 $1,339,173 78.00% 16,533 NON-CONTROLLABLE Real Estate Taxes % of EGI Per Unit % of EGI 2022 Taxes Paid $94,361 Auditor 8.94% 1,165 $94,361 7.05% 1,165 Total Real Estate Taxes $94,361 8.94% 1,165 $94,361 7.05% 1,165 Insurance $31,873 T8 3.02% 393 $32,400 2.42% 400 Utilities Electric Vacant $6,449 T8 0.61% 80 $6,578 0.49% 81 Water & Sewage $3,685 T8 0.35% 45 $3,758 0.28% 46 Trash Removal $8,462 T8 0.80% 104 $8,631 0.64% 107 Common Building Utilites $231 T8 0.02% 3 $236 0.02% 3 Total Utilities $18,827 1.78% 232 $19,204 1.43% 237 Total Non-Controllable $145,061 13.74% 1,791 $145,965 10.90% 1,802 CONTROLLABLE Contract Services Snow Removal $0 0.00% 0 $2,835 0.21% 35 Landscaping/Grounds $3,527 T8 0.33% 44 $16,200 1.21% 200 Pest Control $1,749 T8 0.17% 22 $2,835 0.21% 35 Total Contract Services $5,276 0.50% 65 $21,870 1.63% 270 Repairs & Maintenance $6,456 T8 0.61% 80 $48,600 3.63% 600 Marketing & Promotion $4,571 T8 0.43% 56 $4,050 0.30% 50 On-Site Payroll $74,156 T8 7.02% 916 $72,900 5.44% 900 Payroll Taxes & Benefits $0 0.00% 0 $8,100 0.60% 100 General & Administrative $17,700 T8 1.68% 219 $12,150 0.91% 150 Management Fee $29,356 T8 2.78% 362 $53,567 4.00% 661 Telephone & Cable $450 T8 0.04% 6 $486 0.04% 6 Replacement & Reserves $20,655 Note 1 1.96% 255 $21,068 1.57% 260 Total Controllable $158,619 15.02% 1,958 $242,791 18.13% 2,997 TOTAL EXPENSES $303,681 28.76% 3,749 $388,756 29.03% 4,799 NET OPERATING INCOME $752,313 71.24% 9,288 $950,417 70.97% 11,734 EXPENSE INCOME
INCOME & EXPENSES
1 Replacement & Reserves: added based on market norm of $255 per unit per year
OPERATING EXPENSES
UNDERWRITING NOTES # NOTE
YEAR 2 YEAR 3 % of GPR Per Unit % of GPR Per Unit $1,692,702 20,898 $1,743,483 21,524 ($84,635) 5.00% (1,045) ($34,870) 2.00% (430) $1,608,067 19,853 $1,708,613 21,094 $14,226 0.88% 176 $14,653 0.86% 181 $7,576 0.47% 94 $7,803 0.46% 96 $4,456 0.28% 55 $4,589 0.27% 57 $4,456 0.28% 55 $4,589 0.27% 57 $2,546 0.16% 31 $2,623 0.15% 32 $2,187 0.14% 27 $2,253 0.13% 28 $1,802 0.11% 22 $1,856 0.11% 23 $1,273 0.08% 16 $1,311 0.08% 16 $1,258 0.08% 16 $1,295 0.08% 16 $41,267 2.57% 509 $42,505 2.49% 525 $1,649,334 20,362 $1,751,118 21,619 ($80,403) 5.00% (993) ($85,431) 5.00% (1,055) ($32,161) 2.00% (397) ($34,172) 2.00% (422) $0 0.00% 0 $0 0.00% 0 $1,536,769 88.00% 18,972 $1,631,515 91.00% 20,142 % of EGI Per Unit % of EGI Per Unit $94,361 6.14% 1,165 $94,361 6.14% 1,165 $94,361 6.14% 1,165 $94,361 6.14% 1,165 $33,048 2.15% 408 $33,709 2.19% 416 $6,710 0.44% 83 $6,844 0.45% 84 $3,833 0.25% 47 $3,910 0.25% 48 $8,804 0.57% 109 $8,980 0.58% 111 $241 0.02% 3 $246 0.02% 3 $19,588 1.27% 242 $19,979 1.30% 247 $146,997 9.57% 1,815 $148,049 9.63% 1,828 $2,892 0.19% 36 $2,950 0.19% 36 $16,524 1.08% 204 $16,854 1.10% 208 $2,892 0.19% 36 $2,950 0.19% 36 $22,307 1.45% 275 $22,754 1.48% 281 $49,572 3.23% 612 $50,563 3.29% 624 $4,131 0.27% 51 $4,214 0.27% 52 $74,358 4.84% 918 $75,845 4.94% 936 $8,262 0.54% 102 $8,427 0.55% 104 $12,393 0.81% 153 $12,641 0.82% 156 $61,471 4.00% 759 $65,261 4.00% 759 $496 0.03% 6 $506 0.03% 6 $21,489 1.40% 265 $21,919 1.43% 271 $254,479 16.56% 3,142 $262,129 16.81% 3,189 $401,476 26.12% 4,956 $410,179 26.69% 5,064 $1,135,293 73.88% 14,016 $1,221,336 79.47% 15,078
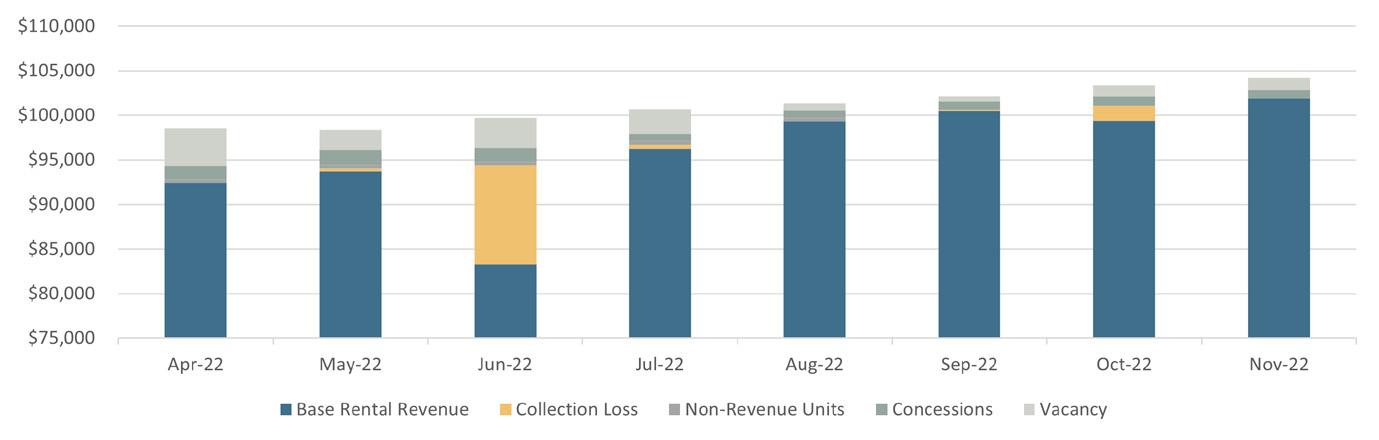
GROSS POTENTIAL RENT
CASH FLOW
CURRENT YR 1 YR 2 YR 3 YR 4 YR 5 YR 6 YR 7 YR 8 YR 9 YR 10 YE MAY-2024 YE MAY-2025 YE MAY-2026 YE MAY-2027 YE MAY-2028 YE MAY-2029 YE MAY-2030 YE MAY-2031 YE MAY-2032 YE MAY-2033 GROSS POTENTIAL RENT All Units at Market Rent $1,522,276 $1,643,400 $1,692,702 $1,743,483 $1,795,788 $1,849,661 $1,905,151 $1,962,306 $2,021,175 $2,081,810 $2,144,264 Gain (Loss) to Lease ($327,504) ($246,510) ($84,635) ($34,870) ($35,916) ($36,993) ($38,103) ($39,246) ($40,423) ($41,636) ($42,885) GROSS SCHEDULED RENT $1,194,772 $1,396,890 $1,608,067 $1,708,613 $1,759,872 $1,812,668 $1,867,048 $1,923,059 $1,980,751 $2,040,174 $2,101,379 Total Other Income $38,898 $40,065 $41,267 $42,505 $43,355 $44,222 $45,106 $46,009 $46,929 $47,867 $48,825 GROSS POTENTIAL INCOME $1,233,670 $1,436,955 $1,649,334 $1,751,118 $1,803,227 $1,856,890 $1,912,154 $1,969,068 $2,027,680 $2,088,041 $2,150,204 Physical Vacancy ($147,203) ($69,845) ($80,403) ($85,431) ($87,994) ($90,633) ($93,352) ($96,153) ($99,038) ($102,009) ($105,069) Bad Debt ($30,368) ($27,938) ($32,161) ($34,172) ($35,197) ($36,253) ($37,341) ($38,461) ($39,615) ($40,803) ($42,028) EFFECTIVE GROSS INCOME $1,055,994 $1,339,173 $1,536,769 $1,631,515 $1,680,036 $1,730,003 $1,781,461 $1,834,454 $1,889,027 $1,945,229 $2,003,107 Real Estate Taxes $94,361 $94,361 $94,361 $94,361 $96,248 $98,173 $100,137 $102,139 $104,182 $106,266 $108,391 Insurance $31,873 $32,400 $33,048 $33,709 $34,383 $35,071 $35,772 $36,488 $37,217 $37,962 $38,721 Utilities $18,827 $19,204 $19,588 $19,979 $20,379 $20,787 $21,202 $21,626 $22,059 $22,500 $22,950 Contract Services $5,276 $21,870 $22,307 $22,754 $23,209 $23,673 $24,146 $24,629 $25,122 $25,624 $26,137 Repairs & Maintenance $6,456 $48,600 $49,572 $50,563 $51,575 $52,606 $53,658 $54,731 $55,826 $56,943 $58,081 Marketing & Promotion $4,571 $4,050 $4,131 $4,214 $4,298 $4,384 $4,472 $4,561 $4,652 $4,745 $4,840 Payroll/Labor $74,156 $72,900 $74,358 $75,845 $77,362 $78,909 $80,487 $82,097 $83,739 $85,414 $87,122 Payroll Taxes & Benefits $0 $8,100 $8,262 $8,427 $8,596 $8,768 $8,943 $9,122 $9,304 $9,490 $9,680 General & Administrative $17,700 $12,150 $12,393 $12,641 $12,894 $13,152 $13,415 $13,683 $13,957 $14,236 $14,520 Management Fee $29,356 $53,567 $61,471 $65,261 $67,201 $69,200 $71,258 $73,378 $75,561 $77,809 $80,124 Telephone & Cable $450 $486 $496 $506 $516 $526 $537 $547 $558 $569 $581 Replacement & Reserves $20,655 $21,068 $21,489 $21,919 $22,358 $22,805 $23,261 $23,726 $24,201 $24,685 $25,178 TOTAL EXPENSES $303,681 $388,756 $401,476 $410,179 $419,018 $428,053 $437,288 $446,729 $456,379 $466,243 $476,327 NET OPERATING INCOME $752,313 $950,417 $1,135,293 $1,221,336 $1,261,018 $1,301,950 $1,344,173 $1,387,725 $1,432,649 $1,478,986 $1,526,780 INCOME EXPENSE RICHWOOD
NORTH ESTATESFINANCIALS
*Calculated as a percentage of Gross Potential Rent | **Calculated as a percentage of Effective Gross Income
CASH FLOW PROJECTION GROWTH RATE ASSUMPTIONS YR 1 YR 2 YR 3 YR 4 YR 5 YR 6 YR 7 YR 8 YR 9 Income Gross Potential Rent 7.96% 3.00% 3.00% 3.00% 3.00% 3.00% 3.00% 3.00% 3.00% (Loss) / Gain to Lease* 15.00% 5.00% 2.00% 2.00% 2.00% 2.00% 2.00% 2.00% 2.00% Other Income 3.00% 3.00% 3.00% 3.00% 3.00% 3.00% 3.00% 3.00% 3.00% Expenses Expenses 2.00% 2.00% 2.00% 2.00% 2.00% 2.00% 2.00% 2.00% Management Fee** 4.00% 4.00% 4.00% 4.00% 4.00% 4.00% 4.00% 4.00% 4.00% CASH FLOW PROJECTION GROWTH RATE ASSUMPTIONS YR 1 YR 2 YR 3 YR 4 YR 5 YR 6 YR 7 YR 8 YR 9 Physical Vacancy 5.00% 5.00% 5.00% 5.00% 5.00% 5.00% 5.00% 5.00% 5.00% Non-Revenue Units 0.00% 0.00% 0.00% 0.00% 0.00% 0.00% 0.00% 0.00% 0.00% Bad Debt 2.00% 2.00% 2.00% 2.00% 2.00% 2.00% 2.00% 2.00% 2.00% Concessions Allowance 0.00% 0.00% 0.00% 0.00% 0.00% 0.00% 0.00% 0.00% 0.00% Total Economic Loss 7.00% 7.00% 7.00% 7.00% 7.00% 7.00% 7.00% 7.00% 7.00%
LOCAL MARKET
03
LOCAL DEVELOPMENTS
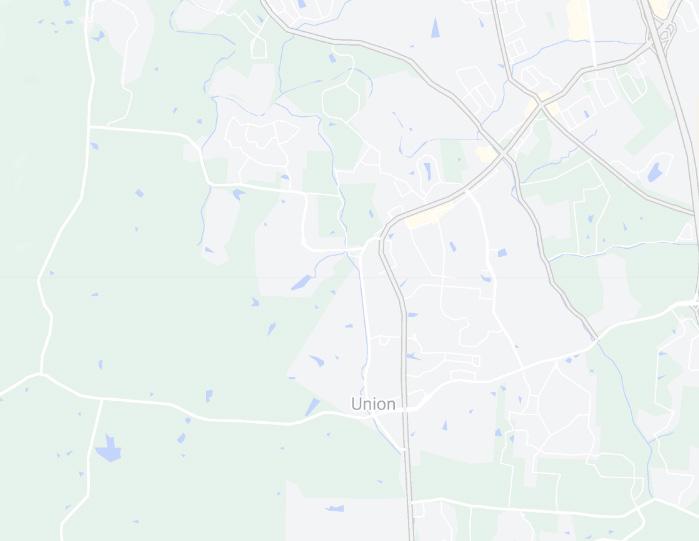
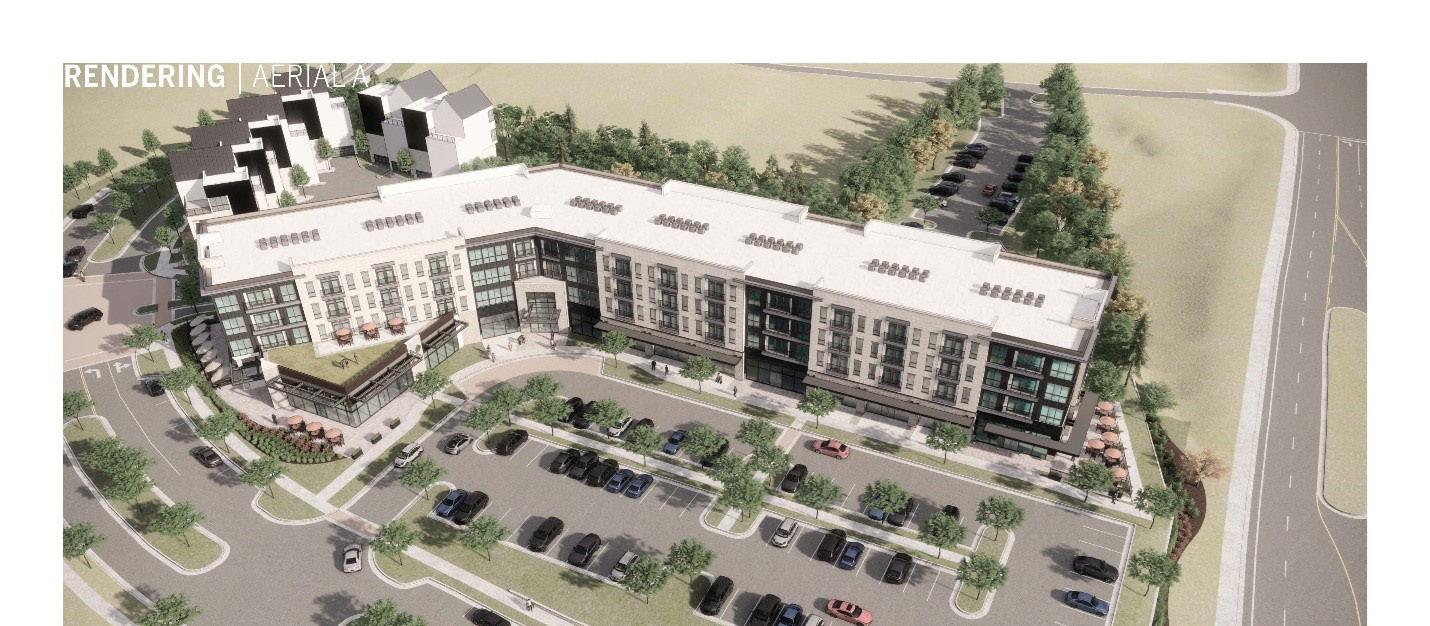
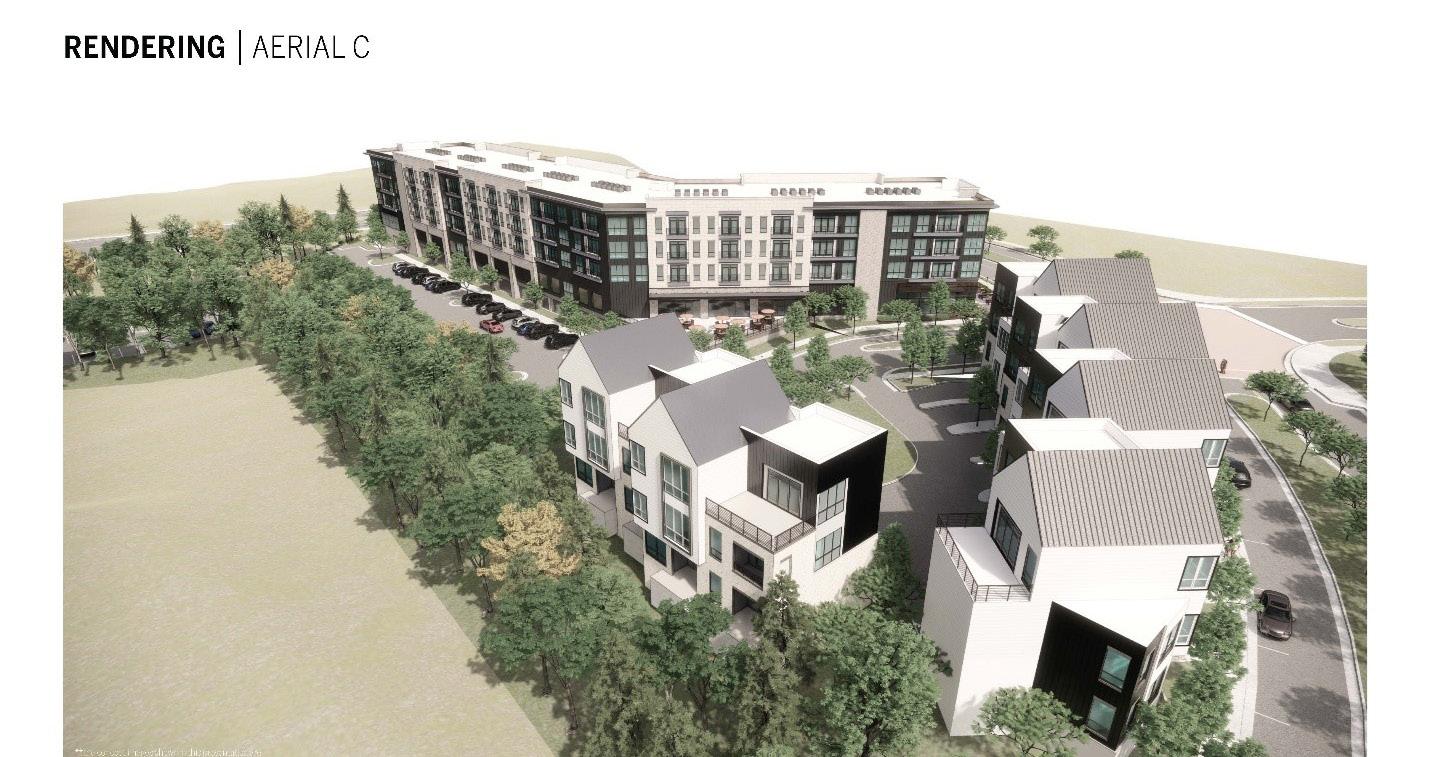
UNION PROMENADE (UNION, KY)
• The city of Union, Kentucky, has approved zoning for a 61.8 acre development to create a walkable residential and commercial district, according to our media partners at the Enquirer.
• Cincinnati Children’s Hospital Medical Center announced Monday it plans to build a new $10 million medical building in Northern Kentucky. Children’s plans to construct a medical building housing both primary and specialty care services at Union Promenade, which would be the first facility of its kind in Northern Kentucky.
• Union Mayor Larry Solomon said his city was a “bedroom community” just a few years ago. Now, it has become Boone County’s fastest-growing city, with a 39% increase in population compared to 2010. (Article from 2022)
• There will be 50 single-family homes, 300 multi-family apartments and 13 outlet buildings for retail and restaurants.
61.8 ACRE DEVELOPMENT
RICHWOOD NORTH ESTATES
CINCINNATI CHILDRENS $10M MEDICAL BUILDING
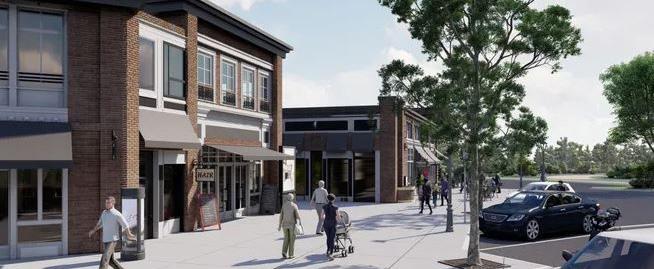
GRAMMAS CENTER ( UNION, KY)
• Driving further south on U.S. 42, the Grammas Center is primed for development. Renderings show more than 31,000 sq. ft. of retail space, along with 176 apartments. It is scheduled to be completed in 2024.
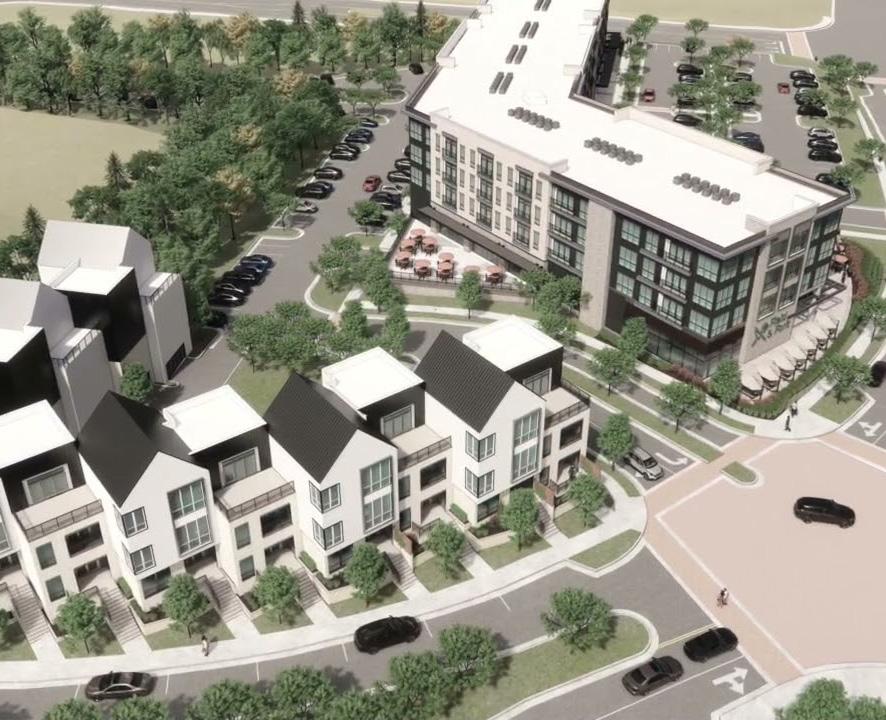
• Named for the family that has owned the property for more than 15 years, the center is a $50 million project to build retail space and 12 four-story condos.
176 UNITS 31,000SF RETAIL SPACE 2024 COMPLETED DATE
RICHWOOD NORTH ESTATES
LOCAL DEVELOPMENTS
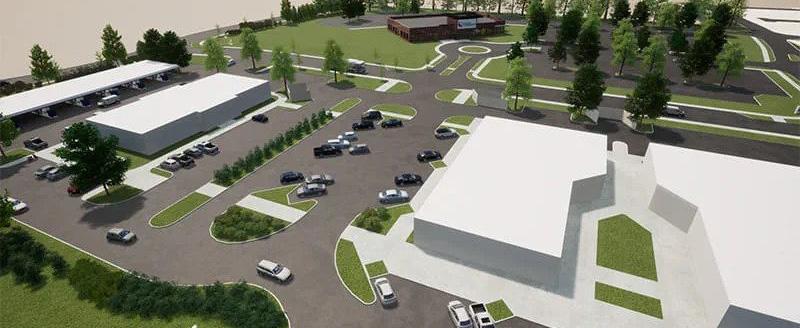
DOWNS OF NICHOLSON (INDEPENDENCE, KY)
35 ACRES 64 PATIO
• Located at the northeastern intersection of Taylor Mill Road and Madison Pike and is roughly 35 acres.
HOMES
• The completed development will sport 64 patio homes, seven short-term rental cabins, a farmer’s market, a convenience store, a combined brewery and restaurant as well as an event center.
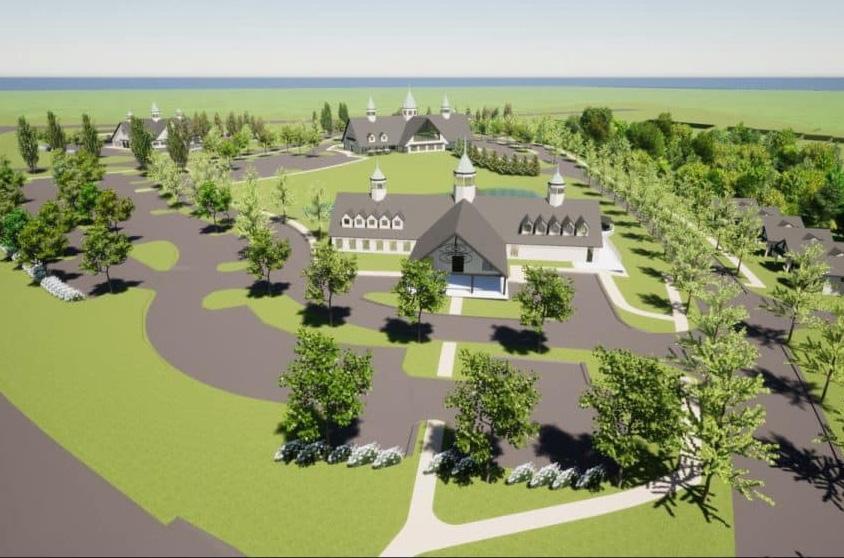
• The first was to add an event center, suitable for weddings and such, and with the center, there will be 7 guest cottages so that bridal parties and guests can stay overnight.
• The project is expected to be a total investment of $22 million.
INDUSTRIAL PARK (INDEPENDENCE, KY)
• A whole lot of dirt is already in the process of being moved to make way for a 108-acre master-planned industrial park. It’s located on the newly constructed four-lane KY 536 in Independence.
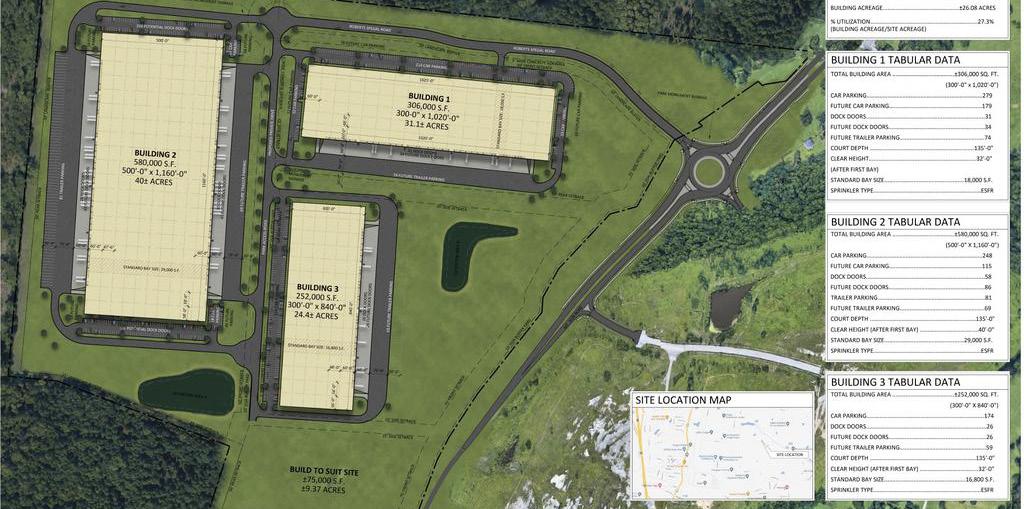
• Three new large warehouses are being built in Independence.
• The new industrial park aims to bring new jobs, fuel economic growth.
• It’s part of a wave of new major developments in Northern Kentucky.
• The park is in proximity to Cincinnati/Northern Kentucky International Airport, where Amazon just opened its new air hub
RICHWOOD NORTH ESTATES
OTHER DEVELOPMENTS
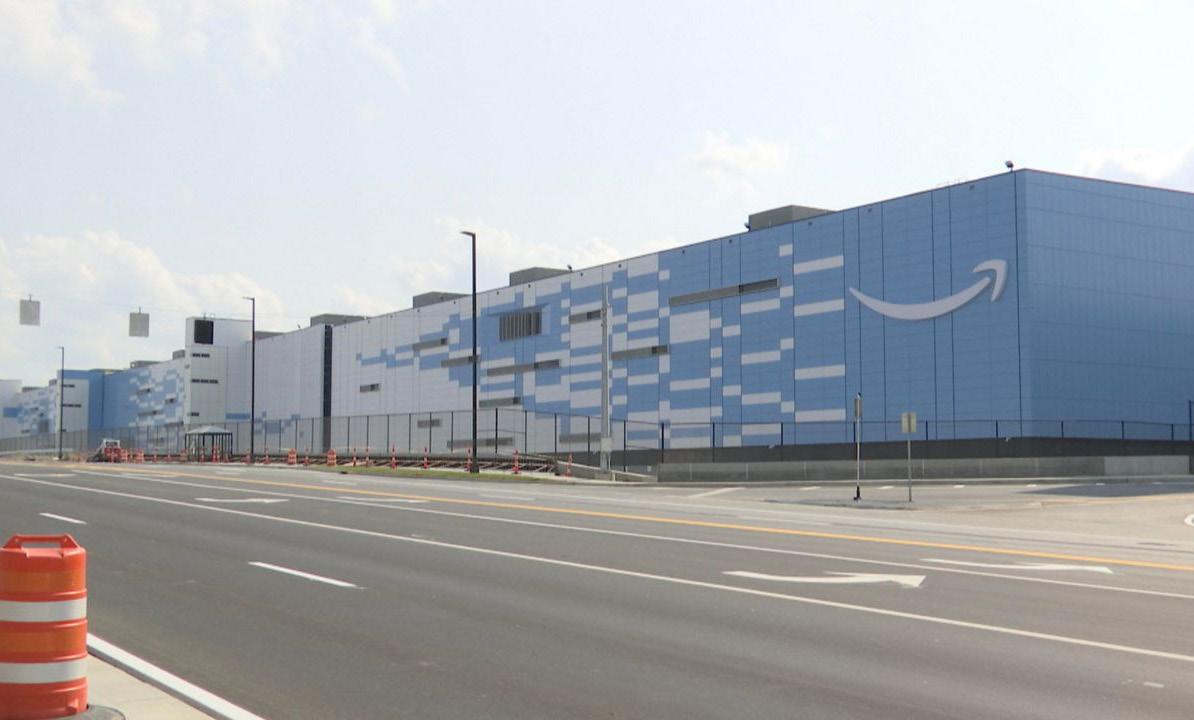
AMAZON AIR HUB (HEBRON, 2011)
• Amazon on Wednesday opened its $1.5 billion air hub in northern Kentucky, which will help accelerate its push for faster delivery and greater control over its logistics network.
• The hub spans a campus of over 600 acres. It includes a ramp for aircraft parking, a multilevel parking structure and seven buildings. Amazon also included an 800,000-square-foot robotic sort center, where packages are sorted by zip code and consolidated into trucks before delivery.
• Amazon officially opened applications Wednesday for 2,000 full-time jobs at its Amazon Air hub at Cincinnati-Northern Kentucky International Airport.
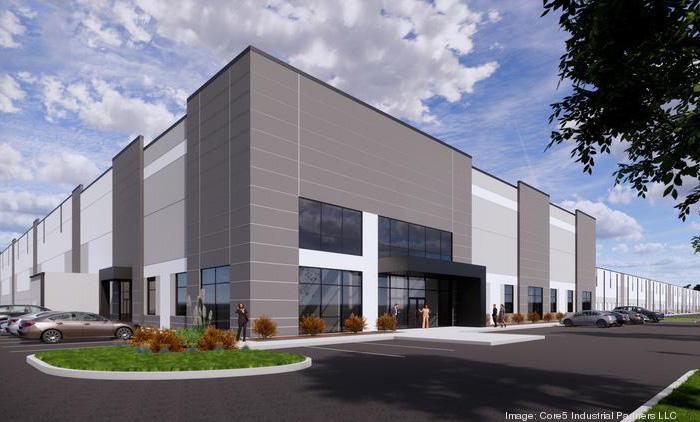
SPEC5 INDUSTRIAL DEVELOPMENT (RICHWOOD, 2022)
• Atlanta-based Core5 Industrial Partners has broken ground on C5 75 Logistics Center South, an 886,480-square-foot project which will be located off Ky. 338 and Interstate 75 in Richwood. Core5 expects to deliver in the first half of 2023.
RICHWOOD RD INTERCHANGE
IMPROVEMENTS
• Replace the existing interchange at Richwood Rd. (KY 338) and I-71/75 with a double crossover diamond (DCD) interchange. This innovative solution has been proven to result in significant reductions to both crashes and delays by eliminating left turns made against oncoming traffic.
• Replace the current intersection at Richwood Rd. and Dixie Highway (US 25) with a newer and safer traffic pattern, known as a single point urban interchange (SPUI). This will allow for freer movement of traffic along Richwood Rd., which will pass under Dixie Highway. Dixie Highway traffic will move continuously via a bridge over Richwood Rd.
• Construct a roundabout at the intersection of Richwood Rd. and Triple Crown Blvd.
RICHWOOD RD INTERCHANGE IMPROVEMENTS

 amazon air hub
spec5 industrial
amazon air hub
spec5 industrial