

ALGEBRA 2 WITH PROBABILITY
SOUTH CAROLINA
ISBN: 979-8-89353-914-1
Math Nation AGA was originally developed by Illustrative Mathematics®, and is copyright 2019 by Illustrative Mathematics. It is licensed under Creative Commons Attribution 4.0 International License (CCBY 4.0).
The online curriculum resource platform offered at "mathnation.com", including the videos and practice questions, as well as custom curriculum adaptations, are additions to the original Illustrative Mathematics content is copyright 2024 by Accelerate Learning, Inc.
The trademark "Math Nation" is owned by Accelerate Learning, Inc. All other trademarks and product names referred to in the Math Nation AGA curriculum are the property of their respective owners and used solely for educational purposes. Unless otherwise stated, Math Nation has no relationship with any of the companies or brands mentioned in the curriculum and does not endorse or have a preference for any of those companies or brands.
This curriculum includes public domain images or openly licensed images that are copyright by their respective owners. Openly licensed images remain under the terms of their respective licenses. See the image attribution section for more information.
ManuscriptCopy
ManuscriptCopy
ManuscriptCopy
ManuscriptCopy
Unit 6: Exponential Functions and Sequences
ManuscriptCopy
Unit 6, Lesson 1: Revisiting Sequences
Warm-Up: Completing Sequences
Fill in the missing numbers in each sequence.
1. 1, 2, 4, 7, _____, _____, 22
2. 75, 65, 55, 45, _____, _____, 15
3. 64, 32, 16, 8, _____, _____,1
Guided Activity: Revisiting Sequences
1. Consider the arithmetic sequence 1 3 , 4 3 , −3, 14 3 ,... to complete the following.
a. The first term, ��1, is_____
b. The common difference, ��, is _____.
c. Write the equation for the ��th term, ����, such that ���� = ��1 + (�� 1) ��.
d. Use the equation to find the 15th term, ��15, of the sequence.
e. Which term in the sequence has the value ���� = −163?
There are 2 methods for writing formulas for the ��th term of an arithmetic sequence.
Arithmetic Sequences
Explicit Formula
Recursive Formula
���� = ��1 + (�� 1)��, where ��1 is the first term and �� is the common difference
��1 = first term, and
���� = ����−1 + ��, for �� ≥ 2, where �� is the common difference
2. In some cases, based on the context the sequence is modeling, the first term in an arithmetic sequence is denoted as ��0.
a. If the first term of an arithmetic sequence is ��0, what is the value of �� for the first term?
b. If the first term of an arithmetic sequence is ��0, how would the second term in the sequence be represented?
c. What is the value of �� for the second term?
3. Hanson begins a new job at Millennium Shack. His boss starts employees at a minimum wage of $7.25 per hour. The boss believes in rewarding employees for good performance. If employees arrive on time for each shift and receive no customer complaints, the boss guarantees them a $0.10 hourly pay increase each quarter.
a. What is Hanson’s starting hourly rate the first day of work?
b. Assume Hanson did a great job during his first quarter of employment. He received a $0.10 hourly pay increase. What is his new hourly rate?
c. Assume Hanson did a great job in his entire first year of employment and received a pay increase in each quarter. Use an arithmetic sequence to represent his hourly rate for the first year.
d. Should ��0 or ��1 represent the first term?
e. Write the explicit rule to represent Hanson’s hourly rate after �� quarters.
f. Write the recursive rule to represent Hanson’s hourly rate after �� quarters.
ManuscriptCopy
g. Explain how the explicit formula for an arithmetic sequence is different if ��0 is the first term instead of ��1.
h. Explain how the recursive formula for an arithmetic sequence is different if ��0 is the first term instead of ��1.
There are 2 methods for writing formulas for a geometric sequence.
Geometric Sequences
Explicit Formula
���� = ��1 · ��(��−1), where ��1 is the first term and �� is the common ratio
Recursive Formula ��1 = first term, and ���� = ����−1 ·�� for ��≥ 2, where �� is the common ratio
Similar to arithmetic sequences, there are some cases where the first term in a geometric sequence is denoted as ��0.
4. In a geometric sequence, neither the first term nor the common ratio can be 0. Discuss with your partner why this is the case.
5. Consider a geometric sequence where the first term, ��0, is −4 and the common ratio, ��, is −3.
a. What are the values of ��1 and ��2?
b. Write the recursive rule for this sequence.
c. Write the explicit rule for this sequence.
d. Find the value of ��10.
6. Work with your partner to complete the Venn diagram comparing arithmetic and geometric sequences.
Arithmetic Sequences Geometric Sequences
Sequences also can be represented using function notation. Consider the different representations of the same sequence in the table.
7. Discuss the similarities and differences between each notation with your partner.
8. Write an expression to represent ��(20).
Collaborative Activity: Arithmetic and Geometric Sequences
1. Consider an arithmetic sequence where ��10 = 17, ��18 = 30, and the first term of the sequence is ��1.
a. Find the common difference.
b. Find the first term of the sequence.
c. Write the recursive rule for the sequence.
d. Write the explicit rule for the sequence.
2. Marius and Sensa are trying to find the 9th term of the geometric sequence, − 5, 10, − 20,... Their work is shown.
Determine whose work is correct or if neither one is correct. Justify your answer.
Marius’s Work
Sensa’s Work
Lesson Summary
A list of numbers with a recognizable pattern is called a sequence. Each number in the sequence is called a term.
A sequence is a list of numbers, possibly going on forever, such as all the odd positive integers arranged in order:1, 3, 5, 7, . . .
A term (of a sequence) is one of the numbers in a sequence.
This lesson reviewed 2 types of sequences you learned about in Algebra 1.
Sequences that increase or decrease by the same constant amount are called arithmetic sequences.
An arithmetic sequence is a sequence of numbers in which each consecutive pair of numbers has a common difference, ��.
Since the difference between 2 consecutive terms is the same value, arithmetic sequences can be modeled using an explicit formula of ���� = ��1 + ��(�� 1) to determine the value of the ��th term in the sequence, where ��1 is the first term in the sequence
For example, the sequence −2, 1, 4, 7, 10, . . . has a first term ��1 = 2 and a common difference, �� = 3. To determine the ��th term of the sequence, the explicit formula for this sequence is ���� = 2 + 3(�� 1). So the 10th term in the sequence would be 25 because ��10 = −2 + 3(10 1) = 25.
Sequences that change by multiplying each pair of consecutive terms by a common factor in the sequence are called geometric sequences.
A geometric sequence is a sequence of numbers in which each consecutive pair of numbers has a common ratio, ��.
Because the change between 2 consecutive terms is the same multiple, geometric sequences can be modeled using an explicit formula of ���� = ��1 ⋅ ����−1 to determine the value of the ��th term in the sequence, where ��1 is the first term in the sequence and �� is the common ratio. For example, the sequence 20, 10, 5, 5 2 , 5 4 , ... has a first term ��1 =20
and a common ratio of �� = 1 2 . To determine the ��th term of the sequence, the explicit formula for this sequence is ���� = 20 ⋅ �1 2 ���−1. So the 10th term in the sequence would be 5 128 because ��10 = 20 ⋅ �1 2 �10−1 = 5 128 .

Practice Problems
1. Giovanna decides to go for a 30-minute walk every day this week and plans to increase her daily walk time by 6 minutes each week.
a. Represent Giovanna’s weekly walking goals with an explicit or recursive rule.
b. How long will her daily walk be after 8 weeks?
2. A theater has 50 seats in the first row, 58 seats in the second row, 66 seats in the third row, and so on in the same increasing pattern.
a. Represent the number of seats in each row of the theater with an explicit or recursive rule.
b. How many seats are in row 20 of the theater?
3. A geometric sequence includes the terms ��4 = −1.56 and ��5 = 0.312.
a. What is the common ratio, ��?
ManuscriptCopy
b. What is the term, ��0?
c. Write the recursive rule for the sequence.
d. Write the explicit rule for the sequence.
Review Problems
4. Which value is closest to 10 1 2 ?
A. −5
B. 1 5
C. 1 3
D. 3
5. Which is a solution to the equation 6 �� + 5 = 10?
D. The equation has no solutions.
A. −19
B. 19
C. 21
ManuscriptCopy
Unit 6, Lesson 2: Growing and Shrinking
Warm-Up: Bank Accounts
A bank account has a balance of $120 on January 1. Describe a situation in which the account balance for each month (February 1, March 1, . . . ) forms the following sequences. Write the first three terms of each sequence.
1. an arithmetic sequence
2. a geometric sequence
Exploration Activity: Shrinking a Passport Photo
The distance from Elena’s chin to the top of her head is 150 millimeters (mm) in an image. For a U.S. passport photo, this measurement needs to be between 25 mm and 35 mm.
1. Find the height of the image after it has been scaled by 80% the following number of times. Explain or show your reasoning.
a. 3 times
b. 6 times


2. How many times would the image need to be scaled by 80% for the image to be less than 35 mm?
3. How many times would the image need to be scaled by 80% to be less than 25 mm?
ManuscriptCopy
Collaborative Activity: Pond in a Park
On May 12, a fast-growing species of algae is accidentally introduced to a pond in an urban park. The area of the pond that the algae covers doubles each day. If not controlled, the algae will cover the entire surface of the pond, depriving the fish in the pond of oxygen. At the rate it is growing, this will happen on May 24.
1. On which day is the pond halfway covered?
2. On May 18, Clare visits the park. A park caretaker mentions to her that the pond will be completely covered in less than a week. Clare thinks that the caretaker must be mistaken. Why might she find the caretaker’s claim hard to believe?
3. What fraction of the area of the pond was covered by the algae initially, on May 12? Explain or show your reasoning.
ManuscriptCopy
Lesson Summary
Sometimes quantities change by the same factor at regular intervals.
For example, a bacteria population might be 10,000 on the first day of measurement and then double each day after that point. This means that 1 day after the initial measurement, the population would be 20,000; 2 days after the measurement, it would be 40,000; and 3 days after, it would be 80,000.
The relationship can be modeled by an exponential function because the population changes by the same factor for each passing day.
An exponential function is a function with a constant percent rate of change.
The table represents the context If �� is the number of days since the bacteria population was first measured, then the population on day �� is 10,000 ⋅ 2��. The population is also a geometric sequence because each term is found by multiplying the previous term by 2.
Practice Problems
1. Select all sequences that could be geometric.
ManuscriptCopy
□ 1 2 , 2, 8, 32, . . .
□ 1,000, 200, 40, 8, . . .
□ 999, 899, 799, 699, . . .
2. A blogger had 400 subscribers to her blog in January. The number of subscribers has grown by a factor of 1.5 every month since then. Write a sequence to represent the number of subscribers in the 3 months that followed.
3. Tyler says that the sequence 1, 1, 1, . . . of repeating 1s is not exponential because it does not change. Do you agree with Tyler? Explain your reasoning.
4. A square picture with side length 30 centimeters (cm) is scaled by 60% on a photocopier. The copy is then scaled by 60% again.
a. What is the side length of the second copy of the picture?
ManuscriptCopy
b. What is the side length of the picture after it has been successively scaled by 60% 4 times? Show your reasoning.
Review Problems
5. A geometric sequence �� starts 5, 15, . . . Explain how you would calculate the value of the 50th term.
6. Select all the expressions equivalent to 94.
ManuscriptCopy
Unit 6, Lesson 3: Representations of Growth and Decay
Warm-Up: One-Fourth at a Time
Priya borrowed $160 from her grandmother. Each month, she pays off one-fourth of the remaining balance that she owes.
1. What amount will Priya pay her grandmother in the third month?
ManuscriptCopy
2. Discuss with a partner why the expression 160 ⋅ �3 4 �3 represents the balance Priya owes her grandmother at the end of the third month
Collaborative Activity: Climbing Cost
The tuition at a college was $30,000 in 2012, $31,200 in 2013, and $32,448 in 2014. The tuition has been increasing by the same percentage since the year 2000.
1. The equation ��(��) = 30,000 (1.04)�� represents the cost of tuition, in dollars, as a function of ��, the number of years since 2012. Explain what the 30,000 and 1.04 tell us about this situation
2. What is the percent increase in tuition from year to year?
3. What does c(3) mean in this situation? Find its value and show your reasoning.
4.
a. Write an expression to represent the cost of tuition in 2007.
ManuscriptCopy
b. How much did tuition cost that year?
Guided Activity: Two Vans and Their Values
A small business bought a van for $40,000 in 2008. The van depreciates by 15% every year after its purchase.
1. Which graph correctly represents the value of the van as a function of years since its purchase? Be prepared to explain why each of the other graphs could not represent the function.


ManuscriptCopy
Graph A
Graph B
Graph C
Graph D
2. Find the value of the van 8 years after its purchase. Show your reasoning.
3. In the same year (2008), the business bought a second van that cost $10,000 less than the first van and depreciates at 10% per year. Would the second van be worth more or less than the first van 8 years after the purchase? Explain or show your reasoning.
4. On the same coordinate plane as the graph you chose in the first question, sketch a graph that shows the value of the second van, in dollars, as a function of years since its purchase.
ManuscriptCopy
Lesson Summary
There are a variety of ways to represent an exponential function. Suppose the population of a city was 20,000 in 1990 and that it increased by 10% each year. A table of values and a graph of the situation are shown.

The table of values can be used to determine that the population increased by a factor of 1.1 each year. The graph can also be used to show how the population was changing over the years. Although the graph looks almost linear, it has a slight upward curve since the population is increasing by a factor of 1.1 and not a constant value each year.
An equation is another useful representation. In this case, if �� is the number of years since 1990, then the population is a function �� of �� where ��(��) = 20,000 ⋅ (1.1)�� . Notice the 20,000 in the expression represents the population in 1990, and 1.1 represents the growth factor due to the 10% annual increase each year.
In an exponential function, the output is multiplied by the same factor every time the input increases by one. This multiplier is called the growth factor.
The equation can be used to calculate the population predicted by the model in 1985 Since 1985 is 5 years before 1990, use the input of −5 to get ��(−5) = 20,000 ⋅ (1.1)−5, which is about 12,418 people.
Throughout this unit, you will examine many exponential functions. All 4 representations (descriptions, tables, graphs, and equations) will be useful for identifying different information about the function and the context the exponential function models.
ManuscriptCopy
Practice Problems
1. In 1990, the value of a home is $170,000. Since then, its value has increased 5% per year.
a. What is the approximate value of the home in the year 1993?
b. Write an equation, in function notation, to represent the value of the home as a function of time in years since 1990, ��.
c. Will the value of the home be more than $500,000 in 2020 (assuming that the trend continues)? Show your reasoning.
2. The graph shows a wolf population which has been growing exponentially.
a. What was the population when it was first measured?
b. By what factor did the population grow in the first year?
ManuscriptCopy

c. Write an equation relating the wolf population, ��, and the number of years since it was measured, ��.
3. Here is the graph of an exponential function ��.
Find an equation defining ��. Explain your reasoning.

4. The equation ��(��) = 24,500 ⋅ (0.88)�� represents the value of a car, in dollars, �� years after it was purchased.
a. What do the numbers 24,500 and 0.88 mean?
b. What does ��(9) represent?
c. Sketch a graph that represents the function �� and shows ��(0), ��(1), and ��(2).
ManuscriptCopy
Review Problems
5. A bacteria population has been doubling each day for the last 5 days. It is currently 100,000. What was the bacterial population 5 days ago? Explain how you know.
6. Select all expressions that are equivalent to 27 1 3
ManuscriptCopy
Unit 6, Lesson 4: Understanding Rational Inputs
Warm-Up: Keeping Equations True
1. Select all solutions to �� · �� = 5. Be prepared to explain your reasoning.
2.
Exploration Activity: Florida in the 1800’s
In 1840, the population of Florida was about 54,500. Between 1840 and 1860, the population grew exponentially, increasing by about 60% each decade.
1. Find the population of Florida in 1850 and in 1860 according to this model.
2. The population is a function �� of the number of decades �� after 1840. Write an equation for ��.
3.
a. Explain what ��(0.5) means in this situation.
b. Graph your function using graphing technology and estimate the value of ��(0.5).
c. Explain why we can find the value of ��(0.5) by multiplying 54,500 by 1.6. Find that value.
4. Based on the model, what was the population of Florida in 1858? Show your reasoning.
Collaborative Activity: Disappearing Medicine
The amount of a medicine in the bloodstream of a patient decreases roughly exponentially. Here is a graph representing ��, an exponential function that models the medicine in the body of a patient, �� hours after an injection is given.

1. Use the graph to estimate �� � 1 3 � and explain what it tells us in this situation.
ManuscriptCopy
2. After one hour, 0.75 milligrams (mg) of medicine remains in the bloodstream. Find an equation that defines ��.
Lesson Summary
Some exponential functions can have inputs that are any numbers on the number line, not just integers.
Suppose the area of a pond covered by algae, ��, in square meters (sq. m), is modeled by �� = 200 ⋅ � 1 2 ���, where �� is the number of weeks since a treatment was applied to the pond. How could this equation be used to determine the area covered by the algae after 1 day?
• Since �� = 1 represents 1 week in this context and each week has 7 days, �� = 1 7 can be used to represent 1 day in the equation. So after 1 day, the algae covers 200� 1 2 �1 7 sq m, or approximately 181 sq m
• Using a calculator, it can be determined that the expression � 1 2 �1 7 is equivalent to 7 1 2 , which is approximately 0.906. This means that after 1 day, 91% of the algae from the previous day remains
This information can also be seen on a graph of the function representing the area of the algae. The point at (1, 100) marks the area covered by the algae after 1 week. Point �� marks the covered area after 1 7 of a week, or 1 day.

The graph can be used to estimate the vertical coordinate of the function, ��, for any value of ��, or the number of weeks since the treatment was applied. In this case, when �� = 1 7 , the graph shows that �� is close to 180. Since the original area was 200 sq. m, the percentage of the pond covered with algae after 1 day using the graph is approximately 180 200 ≈ 0.9 or 90%.
Practice Problems
1. Select all solutions to �� ⋅ �� ⋅ �� = 729.
729
729 3
729 3
1 3 729
729 1 3
3 729
2. In a pond, the area that is covered by algae doubles each week. When the algae was first spotted, the area it covered was about 12.5 sq. m.
a. Find the area, in sq. m, covered by algae 10 days after it was spotted. Show your reasoning.
b. Explain why we can find the area covered by algae 1 day after it was spotted by multiplying 12.5 by 7 2
ManuscriptCopy
3. The function ��, defined by ��(ℎ) = 300 ⋅ � 3 4 �ℎ , represents the amount of a medicine, in mg, in a patient’s body. ℎ represents the number of hours after the medicine is administered
a. What does ��(0.5) represent in this situation?
b. This graph represents the function ��. Use the graph to estimate ��(0.5).
c. Suppose the medicine is administered at noon. Use the graph to estimate the amount of medicine in the body at 4:30 p.m. on the same day.

4. The area covered by a lake is 11 square kilometers (sq. km). It is decreasing exponentially at a rate of 2 percent each year and can be modeled by ��(��) = 11 ⋅ (0.98)��
a. By what factor does the area decrease in 10 years?
b. By what factor does the area decrease each month?
ManuscriptCopy
Review Problems
5. The third and fourth numbers in an exponential sequence are 100 and 500. What are the first and second numbers in this sequence?
6. The population of a city in thousands is modeled by the function ��(��) = 250 ⋅ (1.01)�� where �� is the number of years after 1950. Which of the following are predicted by the model? Select all that apply
□ The population in 1950 was 250.
□ The population in 1950 was 250,000.
□ The population grows by 1 percent each year.
□ The population in 1951 was 275,000.
□ The population grows exponentially.
ManuscriptCopy
ManuscriptCopy
Unit 6, Lesson 5: Representing Functions at Rational Inputs
Warm-Up: Math Talk: Unknown Exponents
Solve each equation mentally.
Guided Activity: Population of Nigeria
In 1990, Nigeria had a population of about 95.3 million. By 2000, there were about 122.4 million people, an increase of about 28.4%. During that decade, the population can be reasonably modeled by an exponential function.
1. Express the population of Nigeria, ��(��), in millions of people, �� decades since 1990.

2. Write an expression to represent the population of Nigeria in 1996.
3. A student said, “ The population of Nigeria grew at a rate of 2.84% every year.”
a. Explain or show why the student’s statement is incorrect.
b. Find the correct annual growth rate. Explain or show your reasoning.
ManuscriptCopy
Collaborative Activity: Got Caffeine?
In healthy adults, caffeine has an average half-life of about 6 hours (hr.). Let’s suppose a healthy man consumes a cup of coffee that contains 100 milligrams (mg) of caffeine at noon.
1. Each of the following expressions describes the amount of caffeine in the man’s body some number of hours after consumption. How many hours after consumption?
a. 100 ⋅ �1 2 �1
b. 100 �1 2 �3
c. 100 �1 2 �1 6
d. 100 ⋅ �1 2
a. Write a function �� to represent the amount of caffeine left in the body, ℎ hr. after it enters the bloodstream.
b. The function �� represents the amount of caffeine left in the body after �� 6-hr. periods. Explain why ��(6)= ��(1).
Lesson Summary
Imagine a medicine has a half-life of 3 hr., which means that after 3 hr., exactly half the original dosage of the medicine remains in the bloodstream. If a patient takes 200 mg of the medicine, then the amount of medicine in their body, in mg, can be modeled by the function ��(��) = 200 ⋅ �1 2 ���. In this model, �� represents a unit of time.
• Notice that the 200 represents the initial dose the patient was administered The number 1 2 indicates that for every 1 unit of time, the amount of medicine remaining in the bloodstream is cut in half.
• Because the half-life is 3 hr., this means that �� must measure time in groups of 3 hr.
To find the amount of medicine left in the patient’s body each hour after taking it, determine how much of the time group represents 1 hour.
• Since �� = 1 represents a 3-hr block, 1 3 �� can be used to represent 1 hr
• Since the amount of medicine decays exponentially, it decays by the same factor in each of the time intervals. In other words, if �� is the decay factor for each hr., then ��⋅��⋅�� = 1 2 or ��3 = 1 2 This means that over each hr., the amount of medicine must decay by a factor of 3 1 2 , which can also be written as �1 2 �1 3 .
Therefore, if h is time in hr. since the patient was administered the medicine, the amount of medicine, in mg, ��, in the person’s body can be expressed as ��(ℎ) = 200 ⋅ �3 1 2 �ℎ or ��(ℎ)= 200⋅ �1 2 �ℎ 3
ManuscriptCopy
Practice Problems
1. A bacteria population is tripling every hour. By what factor does the population change in 1 2 hr.? Select all that apply.
2. A medication has a half-life of 4 hr. after it enters the bloodstream. A nurse administers a dose of 225 mg to a patient at noon.
a. Write an expression to represent the amount of medication, in mg, in the patient’s body at:
i. 1 p.m. on the same day
ii. 7 p.m. on the same day
ManuscriptCopy
b. The expression 225 ⋅ �1 2 �5 2 represents the amount of medicine in the body some time after it is administered What is that time?
3. The value of a truck decreases exponentially since its purchase. The two points on the graph shows the truck’s initial value and its value a decade afterward.
a. Express the car’s value, in dollars, as a function of time ��, in decades, since purchase.

b. Write an expression to represent the car’s value 4 years after purchase.
c. By what factor is the value of the car changing each year? Show your reasoning.
4. Decide if each statement is true or false.
a. 50 1 2 = 25
b. 30 is a solution to ��2 = 30.
c. 243 1 3 is equivalent to 3 243.
d. 20 is a solution to ��4 = 20.
ManuscriptCopy
Unit 6, Lesson 6: Writing Equations for Exponential Functions
Warm-Up: All Equivalent?
1. Discuss with a partner why the following expressions are equivalent.
2. What is another expression equivalent to these?
ManuscriptCopy
Collaborative Activity: Info Gap: Two Points
Your teacher will give you either a problem card or a data card. Do not show or read your card to your partner.
If your teacher gives you the data card:
1. Silently read the information on your card.
2. Ask your partner “What specific information do you need?” and wait for your partner to ask for information. Only give information that is on your card. (Do not figure out anything for your partner.)
3. Before telling your partner the information, ask “Why do you need to know (that piece of information)?”
4. Read the problem card, and solve the problem independently.
5. Share the data card, and discuss your reasoning.
If your teacher gives you the problem card:
ManuscriptCopy
1. Silently read your card and think about what information you need to answer the question.
2. Ask your partner for the specific information that you need.
3. Explain to your partner how you are using the information to solve the problem.
4. When you have enough information, share the problem card with your partner, and solve the problem independently.
5. Read the data card, and discuss your reasoning.
Pause here so your teacher can review your work. Ask your teacher for a new set of cards and repeat the activity, trading roles with your partner.
Guided Activity: Bacteria Growth Expressions
A bacteria population starts at 1,000 and doubles every 10 hours.
1. Explain why the expressions 1,000 ⋅ �2 2 10�ℎ and 1,000 ⋅ 2 h 10 both represent the bacteria population after ℎ hours
ManuscriptCopy
2. By what factor does the bacteria population grow each hour? Explain how you know.
Lesson Summary
Equations are helpful for communicating how quantities are changing. Equations can be created from verbal descriptions, tables of values, or graphs.
Sometimes, the information on how a quantity is changing is given in a graph instead of in words. To find an equation for an exponential function, use 2 points on its graph, similar to writing equations of linear functions given graphs.
For example, write a function �� of the form ��(��) = �� ⋅ ���� whose graph contains (0, 64) and (0.5, 38.4) as shown.
• Since the point (0, 64) is on the graph of ��, the value of the function at �� = 0 is 64. This means that ��(0) = �� ⋅ ��0 = �� = 64, so the value of �� is 64.
• Using the second given point, (0.5, 38.4), ��(0.5) = 38.4. This means that 64 ⋅ ��0.5 = 38.4. To determine the exact value of ��, solve the equation using properties of exponents.
�� 0.5 = 38.4 ��0.5 = 38.4 64 ��0.5 = 0.6 (��0.5)2 = (0.6)2 �� = 0.36 The equation of �� is ��(��) = 64 ⋅ (0.36)��

Practice Problems
1. A population of 1,500 insects grows exponentially by a factor of 3 every week. Select all equations that represent or approximate the population, ��, as a function of time in days, ��, since the population was 1,500.
□ ��(��) = 1,500 ⋅ 3��
□ ��(��) = 1,500 ⋅ 3 t 7
□ ��(��) = 1,500 ⋅ 37��
□ ��(��) = 1,500 ⋅ �3 1 7 ���
2. The tuition at a public university was $21,000 in 2008. Between 2008 and 2010, the tuition had increased by 15%. Since then, it has continued to grow exponentially.
Select all statements that describe the growth in tuition cost.
□ The tuition cost can be defined by the function ��(��) = 21,000 ⋅ (1.15) y 2 , where �� represents years since 2008.
□ The tuition cost increased 7.5% each year.
□ The tuition cost increased about 7.2% each year.
□ The tuition cost roughly doubles in 10 years.
□ The tuition cost can be approximated by the function ��(��) = 21,000 ⋅ 2��, where �� represents decades since 2008.
3. Here is a graph that represents ��(��) = �� ⋅ ���� Find the values of �� and ��. Show your reasoning.

4. The number of fish in a lake is growing exponentially. The table shows the values, in thousands, after different numbers of years since the population was first measured.
a. By what factor does the population grow every two years? Use this information to fill out the table for 4 years and 6 years.
b. By what factor does the population grow every year? Explain how you know, and use this information to complete the table.
Review Problem
5. The value of a home increases by 7% each year. Explain why the value of the home doubles approximately once each decade.
6. Here is the graph of an exponential function ��.
The coordinates of �� are �1 4 , 3�. The coordinates of �� are �1 2 , 4.5�. If the ��-coordinate of �� is 7 4 , what is its ��-coordinate? Explain how you know
ManuscriptCopy

Unit 6, Lesson 7: Interpreting and Using Exponential Functions
Warm-Up: Halving and Doubling
1. A colony of microbes doubles in population every 6 hours. Explain why we could say that the population grows by a factor of 6 2 every hour.
2. A bacteria population decreases by a factor of 1 2 every 4 hours. Explain why we could also say that the population decays by a factor of 4 1 2 every hour.
ManuscriptCopy
Collaborative Activity: Radiocarbon Dating
Carbon-14 is used to find the age of certain artifacts and fossils. It has a half-life of 5,730 years, so if an object has carbon-14, it loses half of it every 5,730 years.
1. At a certain point in time, a fossil had 3 picograms (a trillionth of a gram) of carbon-14. Complete the table with the missing mass of carbon-14 and years.
Number of Years after Fossil Had 3 Picograms of Carbon-14
2. A scientist uses the expression (2.5) ⋅ �1 2 � t 5,730 to model the number of picograms of carbon-14 remaining in a different fossil �� years after 20,000 BCE.
a. What do the 2.5, 1 2 , and 5,730 mean in this situation?
ManuscriptCopy
b. Would more or less than 0.1 picogram of carbon-14 remain in this fossil today? Explain how you know.
Exploration Activity: Old Manuscripts
The half-life of carbon-14 is about 5,730 years.
1. Pythagoras lived between 600 BCE and 500 BCE. Explain why the age of a papyrus from the time of Pythagoras is about half of a carbon-14 half-life.
ManuscriptCopy
2. Someone claims they have a papyrus scroll written by Pythagoras. Testing shows the scroll has 85% of its original amount of carbon-14 remaining. Explain why the scroll is likely a fake.
Lesson Summary
Some substances change over time through a process called radioactive decay, and their rate of decay can be measured or estimated.
For example, suppose a scientist finds 4 nanograms (ng) of sodium-22 in a sample of an artifact (One nanogram is 1 billionth, or 10−9, of a gram.) Approximately every 3 years, half of the sodium-22 decays. This change in the amount of sodium-22 in a sample is shown in the table
of Years after First Being Measured
The radioactive decay of sodium-22 can also be represented by an equation where the number of ng of sodium-22 remaining after �� years in a sample can be modeled by the function ��(��) = 4 ⋅ �1 2 � t 3 .
The 4 represents the number of ng in the sample when it was first measured, and the 1 2 and 3 show that the amount of sodium-22 is cut in half every 3 years because when �� is increased by 3, the exponent is increased by 1.
How much of the sodium-22 remains in a sample after 1 year?
• Use the equation to substitute �� = 1 3 . ��(1) = 4 ⋅
approximately 3.2 ng.
About how many years after the first measurement will there be about 0.015 ng of sodium-22?
ManuscriptCopy
• One way to find out is by extending the table and multiplying the mass of sodium-22 by 1 2 each time, which would be �1 2 �6 ≈ 0.0156 ng. For sodium-22, 5 half-lives mean 15 years, so 24 years after the initial measurement, the amount of sodium-22 will be about 0.015 ng.
Archaeologists and scientists use exponential functions to help estimate the ages of ancient things.
Practice Problems
1. The half-life of carbon-14 is about 5,730 years. A fossil had 6 picograms of carbon-14 at one point in time. (A picogram is a trillionth of a gram or 1 × 10-12 grams.) Which expression describes the amount of carbon-14, in picograms, �� years after it was measured to be 6 picograms? A. 6
2. The half-life of carbon-14 is about 5,730 years. A tree fossil was estimated to have about 4.2 picograms of carbon-14 when it died. (A picogram is a trillionth of a gram.) The fossil now has about 0.5 picogram of carbon-14. About how many years ago did the tree die? Show your reasoning.
3. Nickel-63 is a radioactive substance with a half-life of about 100 years. An artifact had 9.8 milligrams (mg) of nickel-63 when it was first measured. Write an equation to represent the mass of nickel-63, in mg, as a function of:
a. ��, time in years
b. ��, time in days
4. The function �� is exponential. Its graph contains the points (0, 5) and (1.5, 10).
a. Find ��(3). Explain your reasoning.
b. Use the value of ��(3) to find ��(1). Explain your reasoning.
5.
c. What is an equation that defines ��?
Unit 6, Lesson 8: The Number e
Warm-Up: Matching Situations and Equations
Match each equation to a situation it represents. Be prepared to explain how you know. Not all equations have a match.
= 400 ⋅ (0.5)0.1�� ��(��) = 400 ⋅ (2)10��
= 400 ⋅ (1.25)0.1�� ��(��) = 400 ⋅ (2)0.1��
400⋅ (0.75)0.1��
1. A scientist begins an experiment with 400 bacteria in a petri dish. The population doubles every 10 hours (hr.). The function gives the number of bacteria �� hr. since the experiment began.
2. A patient takes 400 milligrams (mg) of a medicine. The amount of medicine in her bloodstream decreases by 25% every 10 hr. The function gives the amount of medicine left in her bloodstream after �� hr. of taking the medicine.
3. The half-life of a radioactive element is 10 years. There are 400 grams (g) of the element in a sample when it is first studied. The function gives the amount of the element remaining �� years later.
4. In a lake, the population of a species of fish is 400. The population is expected to grow by 25% in the next decade. The function gives the number of fish in the lake �� years after it was 400.
Exploration Activity: Notice and Wonder: Moldy Growth
A spot of mold is found on a basement wall. Its area is about 10 square centimeters (sq. cm). Here are three representations of a function that models how the mold is growing.
What do you notice? What do you wonder?
ManuscriptCopy

Guided Activity: Understanding Outputs of for Very Large or Small Values
1. Here are some functions. For each function, describe, in words, the outputs for very tiny, positive values of �� and for very large values of ��.
ManuscriptCopy
2. Remember that �� ≈ 2.718. What does the function �� have to do with the number ��?
3. What do you notice about the relationship between ℎ and �� for very small, positive values of ��?
Lesson Summary
The number �� is an important constant in mathematics, just like the constant ��, which is important in geometry. The number is named after the 18th-century mathematician Leonhard Euler and is sometimes called Euler’s number, ��.
The number (mathematical constant) is an irrational number with an infinite decimal expansion that starts... , which is used in finance and science as the base for an exponential function.
The value of �� is approximately 2.718. Just like ��, the number �� is irrational, so it can’t be represented as a ratio of integers, and its decimal representation never repeats or terminates.
The number �� has many useful properties, and it arises in situations involving exponential growth or decay, so �� often appears in exponential functions. In upcoming lessons, you will work with functions that are expressed using ��.
ManuscriptCopy
Practice Problems
1. Put the following expressions in order from least to greatest.
2. Here are graphs of three functions: ��(��) = 2�� , ��(��) = ����, and ℎ(��)= 3��.
Which graph corresponds to each function? Explain how you know.

3. Which of the statements are true about the function �� given by ��(��) = 100 ⋅ ��−��? Select all that apply.
□ The ��-intercept of the graph of �� is at (0, 100).
□ The values of �� increase when �� increases.
□ The value of �� when �� = 1 is a little less than 40.
□ The value of �� when ��= 5 is less than 1.
□ The value of �� is never 0.
4. Suppose you have $1 to put in an interest-bearing account for 1 year and are offered different options for interest rates and compounding frequencies (how often interest is calculated), as shown in the table. The highest interest rate is 100%, calculated once a year. The lower the interest rate, the more often it gets calculated.
a. Complete the table with expressions that represent the amount you will have after one year, and then evaluate each expression to find its value in dollars (round to 5 decimal places).
b. Predict whether the account value will be greater than $3 if there is an option for a 0.0001% interest rate calculated 1 million times a year. Check your prediction.
c. What do you notice about the values of the account as the interest rate gets smaller and the frequency of compounding gets larger?
ManuscriptCopy
5. The function �� is given by ��(��) = (1 + ��) 1 �� . How do the values of �� behave for small positive and large positive values of ��?
Review Problem
6. Since 1992, the value of homes in a neighborhood has doubled every 16 years. The value of one home in the neighborhood was $136,500 in 1992.
a. What is the value of this home, in dollars, in the year 2000? Explain your reasoning.
b. Write an equation that represents the growth in housing value as a function of time in �� years since 1992.
c. Write an equation that represents the growth in housing value as a function of time in �� decades since 1992.
ManuscriptCopy
d. Use one of your equations to find the value of the home, in dollars, 1.5 decades after 1992.
ManuscriptCopy
Unit 6, Lesson 9: Exponential Functions with Base e
Warm-Up: e on a Calculator
The other day, you learned that �� is a mathematical constant whose value is approximately 2.718. When working on problems that involve ��, we often rely on calculators to estimate values.
1. Find the �� button on your calculator Experiment with it to understand how it works (For example, see how the value of 2�� or ��2 can be calculated.)
2. Evaluate each expression. Make sure your calculator gives the indicated value. If it doesn’t, check in with your partner to compare how you entered the expression.
a. 10 ⋅ ��(1.1) should give approximately 30.04166
b. 5 ⋅ ��(1.1)(7) should give approximately 11,041.73996
c. �� 9 23 + 7 should give approximately 8.47891
Exploration Activity: Same Situation, Different Equations
The population of a colony of insects is 9 thousand when it was first being studied. Here are two functions that could be used to model the growth of the colony �� months after the study began.
1. Use technology to find the population of the colony at different times after the beginning of the study and complete the table.
2. What do you notice about the populations in the two models?
ManuscriptCopy
3. Here are pairs of equations representing the populations, in thousands, of four other insect colonies in a research lab. The initial population of each colony is 10 thousand and they are growing exponentially. �� is time, in months, since the study began.
Colony 1
��(��) = 10 ⋅ (1.05)��
��(��) = 10 ⋅ ��0.05��
Colony 3
��(��) = 10 ⋅ (1.01)��
��(��) = 10 ⋅ ��(0.01��)
Colony 2
��(��) = 10 ⋅ (1.03)��
��(��) = 10 ⋅ ��(0.03��)
Colony 4
��(��) = 10 ⋅ (1.005)��
��(��) = 10 ⋅ ��(0.005��)
a. Graph each pair of functions on the same coordinate plane. Adjust the graphing window to the following boundaries to start: 0 < ��< 50 and 0 < ��< 80.
b. What do you notice about the graph of the equation written using �� and the counterpart written without ��? Make a couple of observations.
ManuscriptCopy
Guided Activity: e in Exponential Models
Exponential models that use �� often use the format shown in this example.

Here are some situations in which a percent change is considered to be happening continuously. For each function, identify the missing information and the missing growth rate (expressed as a percentage).
1. At time �� = 0, measured in hours, a scientist puts 50 bacteria into a gel on a dish. The bacteria are growing and the population is expected to show exponential growth.
• function: ��(��) = 50 ⋅ ��(0.25��)
• continuous growth rate per hour:
2. In 1964, the population of the United States was growing at a rate of 1.4% annually. That year, the population was approximately 192 million. The model predicts the population, in millions, �� years after 1964.
• function: ��(��) = ________ ⋅ ��______��
• continuous growth rate per year: 1.4%
ManuscriptCopy
3. In 1955, the world population was about 2.5 billion and growing. The model predicts the population, in billions, �� years after 1955.
• function: ��(��) = ________ ⋅ ��(0.0168��)
• continuous growth rate per year:
Collaborative Activity: Graphing Exponential Functions with Base e
1. Use graphing technology to graph the function defined by ��(��) = 50 ⋅ ��(0.25��). Adjust the graphing window as needed to answer these questions:
a. The function �� models the population of bacteria in �� hours after it was initially measured. About how many bacteria were in the dish 10 hours after the scientist put the initial 50 bacteria in the dish?
b. About how many hours did it take for the number of bacteria in the dish to double? Explain or show your reasoning.
ManuscriptCopy
2. Use graphing technology to graph the function defined by ��(��) = 192 ⋅ ��(0.014��). Adjust the graphing window as needed to answer these questions:
a. The equation models the population, in millions, in the U.S. �� years after 1964. What does the model predict for the population of the U.S. in 1974?
b. In which year does the model predict the population will reach 300 million?
Lesson Summary
Suppose 24 square feet (sq. ft.) of a pond is covered with algae, and the area is growing at a rate of 8% each day.
We learned earlier that the area, in sq. ft., can be modeled with a function such as ��(��) = 24⋅ (1 + 0.08)�� or ��(��) = 24 ⋅ (1.08)��, where �� is the number of days since the area was 24 sq ft This model assumes that the growth rate of 0.08 happens once each day
In this lesson, different types of exponential functions were explored, using the base ��. For the algae growth, this might look like ��(��) = 24 ⋅ ��(0.08��). This model is different because the 8% growth is not just applied at the end of each day. It is successively divided up and applied at every moment. Because the growth is applied at every moment, or “continuously,” the functions �� and �� are not the same, but the smaller the growth rate, the closer the graphs of the functions are to each other.
ManuscriptCopy
Many functions that express real-life exponential growth or decay are expressed in a form that uses ��. For the algae model ��, 0.08 is called the continuous growth rate, and ��0.08 is the growth factor for 1 day.
In an exponential function, the growth rate is the fraction or percentage of the output that gets added every time the input is increased by one.
In general, when an exponential function is expressed in the form �� ⋅ ������, assume the growth rate (or decay rate), ��, is being applied continuously, and ���� is the growth (or decay) factor. When �� is small, ������ is close to (1 + ��)��.
Practice Problems
1. The population of a town is growing exponentially and can be modeled by the equation ��(��) = 42 ⋅ ��(0.015��). The population is measured in thousands, and time is measured in years since 1950.
a. What was the population of the town in 1950?
b. What is the approximate percent increase in the population each year?
c. According to this model, approximately what was the population in 1960?
ManuscriptCopy
2. The revenue of a technology company, in thousands of dollars, can be modeled with an exponential function whose starting value is $395,000 where time �� is measured in years after 2010.
Which function predicts exactly 1.2% of annual growth: ��(��) = 395 ⋅ ��(0.012��) or ��(��) = 395 ⋅ (1.012)��? Explain your reasoning.
ManuscriptCopy
3. How are the functions �� and �� given by ��(��) = (1.05) �� and ��(��) = ��0.05�� similar? How are they different?
4. The population of a country is growing exponentially, doubling every 50 years. What is the annual growth rate? Explain or show your reasoning.
5. Select all true statements about the number ��.
□ �� is a rational number.
□ �� is approximately 2.718.
□ �� is an irrational number.
□ �� is between �� and 2 on the number line.
□ �� is exactly 2.718.
ManuscriptCopy
ManuscriptCopy
Unit 6, Lesson 10: Graphing Exponential Functions
Warm-Up: Finding Solutions
Find or estimate the value of each variable mentally.
Collaborative
Activity: Transformations of Exponential Functions
1. The graphs of ��(��) = 2�� and ��(��) = 2��− 3 are shown.
a. Work with your partner to describe how to move the graph of ��(��) so that it coincides with the graph of ��(��).
b. The table of values for ��(��) and ��(��) is shown.
ManuscriptCopy
Discuss with your partner the connections between the ��-values in the table of values and the description of shifting the graph of ��(��) so that it coincides with the graph of ��(��). y x 0
2. The graphs of ��(��) = 2�� and ℎ(��)= 2�� − 3 are shown
a. Work with your partner to describe how to move the graph of ��(��) so that it coincides with the graph of ℎ(��).
b. The table of values for ��(��) and ℎ(��) is shown.
Complete the statements.
The graph of ℎ(��)= 2�� − 3 is a { horizontal shift { vertical shift of the graph of ��(��) = 2�� . For the graph of ��(��) = 2�� to coincide with the graph of ℎ(��) = 2�� 3, ��(��) is shifted
ManuscriptCopy
{ up { down { to the left { to the right 3 units. The shift can be seen in the table of values, with 3 being { added to { subtracted from the { ��-values { ��-values of ��(��) for each corresponding { ��-values { ��-values in the table for ℎ(��).
3. Consider the function ��(��) = − 2��− 1 + 3.
a. Describe the transformations applied to the parent function ��(��) = 2�� to graph ��(��).
b. Use the table of values for ��(��) to complete the table of values for ��(��).
c. Graph ��(��) on the coordinate plane.
ManuscriptCopy
d. Complete the table of key features for ��(��).
Key Features of ��(��) = −����- 1 + ��
Domain
Range
Left end behavior As ��→_____, ��→_____.
Increasing interval(s)
Decreasing interval(s)
Right end behavior As ��→_____, ��→_____.
e. What is the equation of the asymptote for the function ��(��)?
Guided Activity: Interpreting Key Features of an Exponential Function in a Real-World Context
The percentage of people unemployed in Florida is modeled by the function ��(��) = 9.9��−0.119��, where ��(��) is the unemployment rate �� months after July 2020.
1. Graph the function that models the situation.
2. Complete the table to identify key features of the function in terms of the context. In the third row, describe any constraints on the key feature related to the context.
Key
Key Feature in Context
As the ��-values increase, the ��-values. . .
{ increase. { decrease.
Description for Constraint(s) in Context
3. Compare your key features with 2 other classmates’ key features. Listen to their reasons for each constraint, and write a summary. You are the only person who should write in the first column of the table. Have each person initial next to your summary of their reason, verifying your summary is accurate.
My Summary of the Reason for the Constraints in ContextInitials
Domain constraint:
Range constraint:
Domain constraint:
ManuscriptCopy
Range constraint:
4. Interpret the point (0, 9.9) in terms of the context.
5. Use the graph of ��(��) to identify the key features listed in the table.
Key Features
��-intercept(s)
��-intercept
Left end behavior As ��→_____, ��→_____.
Increasing interval(s)
Decreasing interval(s)
Right end behavior As ��→_____, ��→_____.
6. Interpret the meaning of the following statement in context: As �� increases, ��(��) decreases.
7. Use the graph to estimate the percentage of unemployed Floridians in December 2020.
ManuscriptCopy
8. According to the model, approximately when is the unemployment rate expected to drop below 4%?
Lesson Summary
An exponential function can be of any form where a numerical base is raised to a variable. Some exponential functions, such as ��(��) = 2�� and ��(��) = 3�� , were studied in previous courses. To graph exponential functions, use the parent function in the form ��(��) = ���� to identify any transformations that may be applied to the new function such as ��(��) = ������− ℎ + ��, where �� is a vertical stretch or compression, ℎ is a horizontal shift of the function, and �� is a vertical shift of the function.
When assessing key features of an exponential function, pay attention to the horizontal asymptote. All exponential functions include a horizontal asymptote, which impacts their end behavior. The end behavior plays a significant role in functions that model real-world scenarios. For example, when a car’s value is depreciating at an exponential rate, it is reasonable to assume that the value will decrease to a value close to zero, but in this context, it is important to understand that the value of the car will not be 0 because ��= 0 would be an asymptote.
ManuscriptCopy
Practice Problems
1. Graph the function ��(��) = −3�� + 1.
2. Write the equation of the horizontal asymptote for the function ��(��) = 2��− 1 + 1.
ManuscriptCopy
3. Jerome opened a savings account that compounded interest monthly. After 10 years, Jerome withdrew the full balance and closed the account The function ��(��) = 55,000 (1.00217)12�� can be used to determine the account balance �� years after his initial deposit.
a. Graph ��(��).
ManuscriptCopy
b. Determine the domain of ��(��) in the context. Explain any constraints on the domain.
c. Which key feature can be used to determine the initial amount Jerome deposited? Interpret the key feature in context.
d. Which key feature can be used to determine the minimum and maximum account balance over the 10 years the account was open? Interpret the key feature in context.
Review Problems
4. One account doubles every 2 years. A second account triples every 3 years. Assuming the accounts start with the same amount of money, which account is growing more rapidly?
ManuscriptCopy
5. The area covered by an invasive tropical plant triples every year. By what factor does the area covered by the plant increase every month?
ManuscriptCopy
Unit 6, Lesson 11: Unknown Exponents
Warm-Up: A Bunch of Unknowns
Solve each equation. Be prepared to explain your reasoning.
ManuscriptCopy
1. �� 3 = 12
2. 3��2 = 12 3. ��3 = 12 4. 3 �� = 12
5. 3�� = 12
6. 3 �� = 12
Exploration Activity: A Tessellated Trapezoid
Here is a pattern showing a trapezoid being successively decomposed into four similar trapezoids at each step.

1. If �� is the step number, how many of the smallest trapezoids are there when �� is 4? What about when �� is 10?
2. At a certain step, there are 262,144 smallest trapezoids.
a. Write an equation to represent the relationship between �� and the number of trapezoids in that step.
b. Explain to a partner how you might find the value of that step number.
Guided Activity: Successive Splitting
In a lab, a colony of 100 bacteria is placed on a petri dish. The population triples every hour (hr.).
1. How would you estimate or find the population of bacteria in:
a. 4 hr.?

b. 90 minutes (min.)?
c. 1 2 hr.?
2. How would you estimate or find the number of hr. it would take the population to grow to:
a. 1,000 bacteria?
ManuscriptCopy
b. double the initial population?
Collaborative Activity: Missing Values
the tables.
Be prepared to explain how you found the missing values.
Lesson Summary
Sometimes in an exponential equation, the value of an exponential expression is given, but the value of the exponent is unknown.
For example, suppose the population of a town was 1 thousand people. Since then, the population has doubled every decade and is currently at 32 thousand. How many decades have passed for the population to reach 32 thousand?
If �� is the number of decades since the population was 1 thousand, then 1⋅ 2��, or just 2��, represents the population, in thousands, of the town after �� decades. To answer the question, determine the exponent when 2�� = 32. Since 2 5 = 32, �� = 5, and so it has been 5 decades since the population of the town was 1 thousand people
To determine when the town had a population of 250 people, assume that the doubling of the population started before the population was measured to be 1 thousand people
Write the equation 2�� = 0.25 or 2�� = 1 4 . Since 2−2 = 1 4 , the exponent �� has a value of −2. According to the model, the population was 250 two decades before it was 1,000 people.
The unknown exponents may not always be as straightforward to calculate. For example, it is harder to tell the value of �� in the equations 2�� = 805 or 2�� = 4.5. You will learn more ways to find unknown exponents in upcoming lessons and in future courses.
Practice Problems
1. A pattern of dots grows exponentially. The table shows the number of dots at each step of the pattern.
Step Number 0123
Number of Dots
a. Write an equation to represent the relationship between the step number, ��, and the number of dots, ��.
b. At one step, there are 9,765,625 dots in the pattern. At what step number will that happen? Explain how you know.
2. A bacteria population is modeled by the equation ��(ℎ) = 10,000 ⋅ 2ℎ, where h is the number of hr since the population was measured
About how long will it take for the population to reach 100,000? Explain your reasoning.
ManuscriptCopy
3. Complete the table.
1,0001,000,000,000
Review Problems
4. How would you describe the output of this graph for:
a. inputs from 0 to 1
b. inputs from 3 to 4
5. The half-life of carbon-14 is about 5,730 years.
a. Complete the table, which shows the amount of carbon-14 remaining in a plant fossil at the different times since the plant died.
b. About how many years will it be until there is 0.1 picogram of carbon-14 remaining in the fossil? Explain how you know.
ManuscriptCopy

YearsPicograms 0 3 5,730 2 ∙ 5,730 3 ∙ 5,730 4 ∙ 5,730
Unit 6, Lesson 12: Solving Exponential Equations
Warm-Up: Exponential Expressions
1. Without a calculator, show that all of the following expressions are equivalent.
2. Write another expression equivalent to the expressions in problem 1.
ManuscriptCopy
Collaborative Activity: Solving Exponential Equations
1. The graph of �� = ���� is shown on the coordinate grid
a. Draw the line ��= 1.5 on the coordinate grid.
b. Determine the point of intersection on the graph.
c. Use graphing technology to find the solution to ���� = 1.5.
ManuscriptCopy
d. Does the solution found using graphing technology match the solution found on the graph in part B?
e. Discuss with your partner why, in this case, graphing technology would provide a more precise solution.
2. The graph of ��(��) = 2��+3 is shown on the coordinate plane.
a. Use the graph to solve the equation 2��+3 = 4.
b. Graph the function ��= 3�� + 8 on the coordinate plane.
c. Use the graph to solve the equation 2��+3 = 3��+ 8.
d. Use graphing technology to find the solution to 2��+3 = 3��+ 8.
ManuscriptCopy
e. Discuss with your partner whether graphing technology would provide a more precise solution in this case. Summarize your discussion.
Guided Activity: Solving Exponential Equations
1. The braking distance of a vehicle is the total distance traveled from the time when the brakes are applied until the time it comes to a complete stop. The relationship between the speed of a motorcycle and its braking distance, in feet (ft.), can be modeled by the function ��(��) = 1.70 (1.10)��, where �� is speed in miles per hour (mph).
a. Graph ��(��).
b. Graph ��= 32.5 on the same coordinate plane as ��(��).
c. Use the graph to solve 32.5 = 1.70(1.10)��. Interpret the solution in terms of the context
d. Explain how to use the graph of ��(��) to determine the fastest a motorcycle can travel while keeping the braking distance under 10 ft.
e. If a motorcycle’s braking distance was 50 ft., how fast was it traveling?
2. The revenues of 2 companies can be modeled with exponential functions �� and ��. The graphs of the 2 functions are shown, where the revenue is in thousands of dollars and time, ��, is measured in years. The ��-coordinate of the intersection is 215.7.
Select all the statements that correctly describe what the 2 graphs reveal about the revenues.
□ The intersection of the graphs is when the revenues of the 2 companies grow by the same factor.
□ The intersection is when the 2 companies have the same revenue.
□ At the intersection, ��(��) > ��(��).
□ At the intersection, ��(��) = 215.7 and ��(��) = 215.7.
□ Both expressions that define �� and �� need to be known to find the value of �� at the intersection.
ManuscriptCopy
□ At least one of the expressions that define �� and �� needs to be known to calculate the value of �� at the intersection.
3. Lianna is entering a fishing contest with her dad, Hamish. They have one day to try to catch the heaviest Atlantic Ocean rockfish Without a scale on the boat, Lianna and her dad use the function ��(��) = 3.05 (1.17)�� to estimate the weight, ��, of a fish, in grams (g), using the length of the fish in centimeters (cm), ��.
a. Last year’s winner weighed in at 542 g. Estimate the length of the smallest fish that would beat this weight to the nearest cm using the function.
b. This year’s winning Atlantic Ocean rockfish weighed 627 g. The largest fish Lianna and Hamish caught was 32.2 cm. Using the function, estimate how much longer this year’s winning fish was than Lianna and Hamish’s longest fish?
c. Is it reasonable in the context for the domain and range to extend to infinity? Explain.
4. A population of cicadas is modeled by the function ��(��) = 250 ⋅ ��(0.5��), where �� is the number of weeks since the population was first measured.
a. How many weeks does it take for the cicada population to double?
b. Solve 100,000 = 250 ⋅ ��(0.5��), and interpret the solution
Lesson Summary
There are several strategies to solve exponential equations.
• When solving an exponential equation with like bases, set the exponents equal to each other to determine the exact solution.
For example, 100.2�� = 1000. The expression on the right of the equal sign can be rewritten as 103. Because the bases of the exponential expressions on both sides of the equal sign are the same, the equation can be rewritten as 100.2�� = 103, so 0.2�� = 3 and �� = 15.
• When solving an exponential equation with unlike bases, graph the 2 functions ��(��) and ��(��) that make up the equation ��(��) = ��(��). Use the graph to estimate the point of intersection, which results in solution to the equation.
For example, to solve the equation 5 ⋅ 10�� = 12, graph the functions ��(��) = 5 ⋅ 10�� and ��(��) = 12. The graphs of ��(��) and ��(��) are shown Since the intersection of the 2 functions is not an integer ��-value, the solution can be approximated using the provided graph or determined using graphing technology. The approximate solution of the equation 5 ⋅ 10�� = 12 is �� ≈ 0.38.
Additional methods for solving exponential equations will be introduced in future math courses.
ManuscriptCopy
Practice Problems
1. According to the International Basketball Federation (FIBA), a basketball is to be inflated to an air pressure such that when it is dropped onto the playing floor from a height of approximately 1,800 millimeters (mm) measured to the bottom of the ball, it will rebound to a height of approximately 1,300 mm measured to the top of the ball.
The height of a basketball, in mm, after any number of bounces, ��, can be modeled by the function h(��) = 1800 � 13 17 ���.
a. Complete the statement.
At ____________ bounces, the rebound height of the ball drops below 200 mm.
b. Explain the constraints on the domain and range.
2. The growth of population A, in square millimeters (sq mm), can be modeled by ��(ℎ)= 10��0.5ℎ, where h is the number of hours since the experiment began. The growth of population B can be modeled by ��(ℎ)= 8��0.4ℎ.
a. Is there a time when the growth of the 2 populations will be equal? Explain.
ManuscriptCopy
b. When does the growth of population A and the growth of population B reach the value 1,000?
3. Atmospheric pressure �� in pounds per square inch (psi) is represented by the equation �� = 14.7��−0.21��, where �� is the number of miles above sea level
To the nearest foot, how high is the peak of a mountain with an atmospheric pressure of 8.369 psi?
Review Problems
4. A geometric sequence �� starts 5, 15, . . .. Explain how you would calculate the value of the 50th term.
5. The first two terms of an exponential sequence are 18 and 6. What are the next 3 terms of this sequence?
ManuscriptCopy
ManuscriptCopy
Unit 6, Lesson 13: The Sum of a Sequence
Warm-Up: Math Talk: Adding Terms
Evaluate mentally.
ManuscriptCopy
Collaborative Activity: Paper Trail
1. Tyler has a piece of paper and is sharing it with Elena, Clare, and Andre. He cuts the paper to create four equal pieces, and then hands one piece each to the others and keeps one for himself. What fraction of the original piece of paper does each person have?
2. Tyler then takes his remaining paper and does it again. He cuts the paper to create four equal pieces, and then hands one piece each to the others and keeps one for himself. What fraction of the original piece of paper does each person have now?
3. Tyler then takes his remaining paper and does it again. What fraction of the original piece of paper does each person have now? What happens after more steps of the same process?
Guided Activity: A Threefold Design
Here is a geometric shape built in steps.
• Step 0 is an equilateral triangle.

• To go from Step 0 to Step 1, take every edge of Step 0 and replace its middle third with an outward-facing equilateral triangle.
ManuscriptCopy

• To go from Step 1 to Step 2, take every edge of Step 1 and replace its middle third with an outward-facing equilateral triangle.
• This process can continue to create any step of the design.
1. Find an equation to represent function ��, where ��(��) is the number of sides in Step ��. What is ��(2)?
2. Consider a different function ��, where ��(��) is the number of new triangles added when drawing Step ��. Let ��(0)= 1. How many new triangles are there in Steps 1, 2, and 3? Explain how you know.
3. What is the total number of triangles used in building Step 3?
Lesson Summary
The sum of a sequence is the sum of its terms, also called a series.
For example, suppose Londyn earns an allowance in which each day the amount she earns is doubled from the previous day such that she earns $1 on the first day, $2 on the second day, $4 on the third day, and so on for 7 days. How much money will Londyn have after a week, or 7 days? After determining each term of the sequence, the sum of the first 7 terms will help answer the question.
1 + 2 + 4 + 8 + 16 + 32 + 64 = $127
For the 7 days of allowance, Londyn earned $127. In upcoming lessons, you will learn strategies to determine the sums of sequences in more efficient ways.
Practice Problems
1. Find the sum of each sequence.
2. Priya is walking down a long hallway. She walks halfway and stops. Then, she walks half of the remaining distance and stops again. She continues to stop every time she goes half of the remaining distance.
a. What fraction of the length of the hallway will Priya have covered after she starts and stops two times?
b. What fraction of the length of the hallway will Priya have covered after she starts and stops four times?
c. Will Priya ever reach the end of the hallway, repeatedly starting and stopping at half the remaining distance? Explain your thinking.
Review Problems
3. A geometric sequence h starts with 10, 5, . . . Explain how you would calculate the value of the 100th term.
ManuscriptCopy
4. An unfolded piece of paper is 0.05 millimeter (mm) thick.
a. Complete the table with the thickness of the piece of paper ��(��) after it is folded in half �� times.
b. Define �� for the ��th term
c. What is a reasonable domain for the function ��? Explain how you know.
5. An arithmetic sequence �� starts 84, 77, . . .
a. Define �� recursively.
b. Define �� for the ��th term.
6. Here is a pattern of growing rectangles.
a. Describe how the rectangle grows from Step 0 to Step 2.
b. Write an equation for sequence ��, so that ��(��) is the number of squares in Step ��.

c. Is �� a geometric sequence, an arithmetic sequence, or neither? Explain how you know.
Unit 6, Lesson 14: Sum of Arithmetic Sequences
Warm-Up: Adding Up Sequences
1. What is the sum of the first 100 whole numbers?
2. Which method(s) did you use to determine the sum?
3. What did you notice as you worked through finding the sum?
ManuscriptCopy
Guided Activity: Sum of Arithmetic Sequences
For an infinite sequence, ��1, ��2, ��3, . . . , ����, the ellipsis (. . .) represents a sequence that does not have an end term. In such a sequence, the following statements are true.
• The sum of the first �� terms is represented by ����
. + ���� and is called partial sum.
• The sum of all the terms in the sequence, ��1 + ��2 + ��3 + . . . + ���� + . . . is called an infinite series, or just series
1. Consider the sequence with an explicit formula ���� = 3�� − 1.
a. Complete the table for the value of each term, ����, and the sum of the first �� terms, ����
b. Use the table to write a conjecture on how to use �� and ���� to determine ����
c. Compare the conjecture you wrote with your partner, and adjust your reasoning as needed.
2. Consider an arithmetic sequence with a first term of ��1 and a common difference of ��. Complete the blank spaces in the work column to derive the formula for the sum of the first terms in any arithmetic sequence.
Description Work
The ��th term for any arithmetic sequence can be found using the explicit formula.
Rewrite each term in the sequence in terms of ��1 and ��.
Write the sum of the first �� terms, ����, as an expression in terms of ��1 and ��.
The sum of the first �� terms in the sequence can also be written as starting from the ��th term and subtracting the common difference.
Add the 2 sum equations created.
Solve the new equation for ����, and rewrite it in simplest form.
First term: ��1
Second term: ��1 + ��
Third term:
Fourth term: ___________________
3. Use the formula to verify that the ��5 derived in the table in problem 1 is correct.
Collaborative Activity: Arithmetic Series
Determine the indicated sum for each arithmetic sequence.
1. Determine ��8 for an arithmetic sequence with an explicit formula ���� = 14 − 1 2 ��.
2. Determine ��10 for an arithmetic sequence with ��4 = 46 and ��8 = −2.
3. Determine ��15 for the sequence 2.1, 2.3, 2.5, 2.7, . . .
4. Determine ��100 for the sequence where ��1 = −4 and ��100 = 24.
ManuscriptCopy
Lesson Summary
An arithmetic sequence is a sequence where the difference between 2 consecutive terms is constant. A series is a sum of terms in a sequence. The sum of the first �� terms of an arithmetic sequence, ����, can be determined using the formula ���� = �� ��1 + ���� 2 , where ��1 is the first term in the arithmetic sequence.
For example, the sequence 5, 4, 3, . . . is an arithmetic sequence with a common difference, �� = −1, and a first term, ��1 = 5. To determine the sum of the first 10 terms in the arithmetic sequence, determine the value of ��10 In this sequence, ��10 = −4.
Therefore, the sum of the first 10 terms in the sequence can be determined by the formula ��10 = 10(5 + (−4)) 2 = 5.
Practice Problems
1. Determine ��21 for the sequence 5, 9, 13, 17, . . .
ManuscriptCopy
2. Determine the sum of the first 9 terms in an arithmetic sequence with an explicit formula of ���� = −3�� + 1.
3. Which expression represents the sum of the first 6 terms in the sequence shown?
19, 16, 13, 10, 7, 4
A. ��6 = 19−42 6
B. ��6 = 2(19 + 4) 6
C. ��6 = 6(19 − 4)
D. ��6 = 1 2 �6 ⋅ (19 + 4)�
Review Problems
4. Match each sequence with one of the recursive definitions. Note that only the part of the definition showing the relationship between the current term and the previous term is given so as not to give away the solutions. One of the sequences matches two recursive definitions.
A. ��(��) = ��(�� − 1) − 4 1. 7, 3, − 1, − 5
(��) =
ManuscriptCopy
��(��) = 1 ⋅ ��(�� − 1)
5. Select all equations for which − 64 is a solution.
□ �� = 8
□ �� = − 8
□ 3 �� = 4
□ 3 �� = − 4
□ �� = 8 □ − �� = 8
ManuscriptCopy
ManuscriptCopy
Unit 6, Lesson 15: Sum of Geometric Sequences
Warm-Up: Notice and Wonder: A Snowflake’s Return
What do you notice? What do you wonder?
IterationTotal Number of Triangles


ManuscriptCopy
Guided Activity: A Geometric Addition Formula
Recall that the ��th term of a geometric sequence with an initial value of ��1 and a common ratio of �� is ��1(����− 1).
For a Koch Snowflake, it turns out that the number of triangles added on at each iteration can be determined by having ��1 = 3 and �� = 4. The sum, ��, of the first �� terms in this geometric sequence indicates how many total triangles make up the ��th iteration of the snowflake. ��=3+ 3(4)+ 3(42) + . . . + 3(4��− 1)
More generally, the sum of the first �� terms of any geometric sequence can be expressed as ���� = ��1 + ��1(��) + ��1(��2) + . . . + ��1(����− 1), or ���� = ��1(1 + �� + ��2 + . . . + ����− 1).
The sum of terms in a geometric sequence is also called a geometric series.
1. What would happen if each side of this equation is multiplied by (1 − ��)? Hint: (��− 1)(��3 + ��2 + ��+ 1)= ��4 − 1.
2. Rewrite the new equation in the form of ���� =.
3. Use this new formula to calculate how many triangles after the original are in the first 5, 10, and 15 iterations of the Koch Snowflake.
Collaborative Activity: The Sum of Antibiotics
Han is prescribed a course of antibiotics for an infection. He is told to take a 150 milligrams (mg) dose of the antibiotic regularly every 12 hours (hr.) for 15 days. Han is curious about the antibiotic and learns that at the end of the 12 hr., only 5% of the dose is still in his body.
1. How much of the antibiotic is in the body right after the first, second, and third doses?
ManuscriptCopy
2. When will the total amount of the antibiotic in Han be highest over the course of the 15 day treatment? Explain your reasoning.
Collaborative Activity: Back to Funding the Future
Let’s say you open a savings account with an interest rate of 5% per year compounded annually and that you plan on contributing the same amount to it at the start of every year.
1. Predict how much you need to put into the account at the start of each year to have over $100,000 in it when you turn 70
2. Calculate how much the account would have after the deposit at the start of the 50th year if the amount invested each year were:
a. $100
b. $500
c. $1,000
ManuscriptCopy
d. $2,000
3. Say you decide to invest $1,000 into the account at the start of each year at the same interest rate. How many years until the account reaches $100,000? How does the amount you invest into the account compare to the amount of interest earned by the account?
Lesson Summary
Imagine a chessboard where 1 grain of rice is placed on the first square, 2 on the second, 4 on the third, and so on. How many grains of rice are on the 64-square chessboard? Trying to add 64 numbers is difficult and time-consuming. Instead, consider using sequences and the sum of terms in the sequence. The grains on the chessboard increase in a geometric sequence, 1, 2, 4, . . . , where the explicit formula for the sequence is ���� = 2��− 1 with ��1 = 1 and common ratio �� = 2.
• The sum of first �� terms in a geometric sequence can be determined by ����
• Based on the formula, there will be a total of ��64 = 1� 264 − 1 2 − 1 � or 18,446,744,073,709,551,615 grains of rice on the 64 chessboard squares.
Consider another example where Janelle invests $200 at the start of each year into an account that averages 3% interest compounded annually at the end of the year. How many years until the account has more than $10,000?
At the end of year 1, the amount in Janelle’s account is $206. At the end of year 2, the amount in the account is $418.18 since 200(1.03)2 + 200(1.03) = 418.18. At the start of year 30, for example, the original $200 has been compounded 29 times, but the last $200 deposited has been compounded 0 times. Figuring out how much is in the account 30 years after the first deposit means finding the sum of the geometric sequence 200(1.03)29 + 200(1.03)28 + . . . + 200(1.03) + 200.
The sum of a geometric sequence, also called a geometric series, can help determine the total amount in Janelle’s account after 30 years.
• Use the formula for the sum of a geometric sequence, ���� = ��1� 1 − ���� 1 − �� �, to determine the total amount of money in the account, where ��1 = 200 and �� = 1.03.
• After �� years, the total savings in Janelle’s account is ���� = 200�1 − 1.03�� 1 − 1.03 �. Evaluating the formula when �� = 30 results in $9515.08. When �� = 31, the amount in Janelle’s account is $10,301. This means it will take 31 years for Janelle’s account to have more than $10,000.
Practice Problems
1. The formula for the sum �� of the first �� terms in a geometric sequence is given by ���� = ��1� 1 − ���� 1 − �� �, where ��1 is the initial value and �� is the common ratio. If a sequence has ��1 = 10 and ��= 0.25,
a. What are the first 4 terms of the sequence?
b. What is the sum of the first 17 terms of the sequence?
2. Find the sum of the first 20 terms of each sequence.
a. 1, 2 3 , 4 9 , 8 27 , 16 81 , . . .
b. 3, 6 3 , 12 9 , 24 27 , 48 81 , . . .
c. 4, 2, 1, 1 2 , 1 4 , . . .
3. Diego wonders how much money he could save over 25 years if he puts $150 a year into an account with 4% interest per year compounded annually. He calculates the following, but thinks he must have something wrong, since he ended up with a very small amount of money:
What did Diego forget in his calculation? How much should his total amount be? Explain or show your reasoning.
ManuscriptCopy
Review Problem
4. Select all polynomials that have (��+ 1) as a factor. □ ��(��) = ��3 + 2��2 − 5��− 6 □ ��(��) = ��3 − 7��+ 6 □ ℎ(��)= ��3 − 2��2 − 5��+ 6
��(��) = ��3 − 7��− 6
��(��) = ��2 − 1
ManuscriptCopy
ManuscriptCopy
Unit 7: Piecewise Functions and Absolute Value
ManuscriptCopy
Unit 7, Lesson 1: Introducing Piecewise Functions
Warm -Up: Frozen Yogurt
A self-serve frozen yogurt store sells servings up to 12 ounces (oz.). It charges $0.50 per oz. for a serving between 0 and 8 oz., and $4 for any serving greater than 8 oz. and up to 12 oz.
Choose the graph that represents the price as a function of the weight of a serving of yogurt. Be prepared to explain how you know.

Exploration Activity: Composing Shapes
The relationship between the postage rate and the weight of a letter can be defined by a piecewise function.
The graph shows the 2018 postage rates for using regular service to mail a letter.
1. What is the price of a letter that has the following weight?
a. 1 oz.
b. 1.1 oz.
c. 0.9 oz.

2. A letter costs $0.92 to mail. How much did the letter weigh?
ManuscriptCopy
3. Kiran and Mai wrote some rules to represent the postage function, but each of them made some errors.
��(��) = 0.50, 0 ≤ ��≤ 1 0.71, 1 ≤ ��≤ 2 0.92, 2 ≤ ��≤ 3 1.13, 3 ≤ ��≤ 3.5 ��(��) = 0.50, 0 < ��< 1 0.71, 1 < ��< 2 0.92, 2 < ��< 3 1.13, 3 < ��< 3.5
Identify the error in each person’s work and write a corrected set of rules.
Guided Activity: Bike Sharing
Function C represents the dollar cost of renting a bike from a bike-sharing service for t minutes (min.). Here are the rules describing the function. ��(��) = 2.50, 0 < ��≤ 30 5.00, 30 <��≤ 60 7.50, 60 < ��≤ 90 10.00, 90 < ��≤ 120 12.50, 120 < ��≤ 150 15.00, 150 < ��≤ 720
1. Complete the table with the costs for the given lengths of rental.
ManuscriptCopy
Sketch a graph of the function for all values of t that are at least 0 min. and at most 240 min.

2. Describe in words the pricing rules for renting a bike from this bike-sharing service.
3. Determine the domain and range of this function.
Collaborative Activity: Piecing It Together
Your teacher will give your group strips of paper with parts of a graph of a function. Gridlines are 1 unit apart. Arrange the strips of paper to create a graph for each of the following functions. ��(��) = −5, − 10 < ��< 5 ��,−5≤�� < 0 1, 0 ≤ ��< 3 ��− 2, 3≤�� < 8 6, 8 ≤ ��< 10 5.5, − 10 < ��≤− 8 ��(��) = 4, − 8 < ��≤− 3 − ��,−3<�� ≤ 2 − 3.5, 2 < ��≤ 5 �� 5,5<�� ≤ 10 � �
To accurately represent each function, be sure to include a scale on each axis and add open and closed circles on the graph where appropriate.
Lesson Summary
A piecewise function has different descriptions or rules for different parts of its domain.
ManuscriptCopy
A piecewise function is a function defined by multiple sub functions, each of which applies to a certain interval of the main function’s domain.
For example, Function f represents the train fare, in dollars, for a child who is t years old based on the following rules.
• Free for children younger than 5
• $5 for children who are at least 5 but younger than 11
• $7 for children who are at least 11 but younger than 16
The different prices for different ages show that Function f is a piecewise function.
The graph of a piecewise function is often composed of pieces, or segments, of other functions. The pieces could be connected or disconnected. When disconnected, the graph appears to have breaks or steps.
A graph of Function f is shown.
It is important to consider the value of the function at the points where the rule changes, or where the graph “breaks.” For instance, when a child is exactly 5 years old, is the ride free, or does it cost $5?
On the graph, 1 segment ends at (5,0) and another segment starts at (5,5), but the function cannot have both 0 and 5 as outputs when the input is 5.

Based on the fare rules, the ride is free only if the child is younger than 5, which means f(5) = 0 is false. On the graph, the point (5,0) is marked with an open circle to indicate that it is not included in the first segment that represents ages qualifying for a free ride.
Since f(5) = 5 is true, the point (5,5) has a solid circle to indicate that it is included in the middle segment that represents ages qualifying for $5 fare. The same reasoning applies when deciding how f(11) and f(16) should be shown on the graph.
• f(11) = 7 is true because 11-year-olds ride for $7. The point (11,7) is a solid circle.
• f(16) = 7 is false because a 16-year-old no longer qualifies for a child’s fare. The point (16,7) is an open circle.
The fare rules can be expressed with function notation, ��(��) = 0, 0 < ��< 5 5, 5 ≤ ��< 11 7, 11 ≤ ��< 16
Practice Problems
1. A parking garage charges $5 for the first hour (hr.), $10 for up to two hr., and $12 for the entire day. Let G be the dollar cost of parking for t hr.
a. Complete the table.
b. Sketch a graph of G for 0 ≤ t ≤ 12.

c. Is G a function of t? Explain your reasoning.
d. Is t a function of G? Explain your reasoning.
e.
2. Is this a graph of a function? Explain your reasoning.
ManuscriptCopy

3. Use the graph of function g to answer these questions.
a. What are the values of ��(1) , ��(−12) , and ��(15) ?
��(1) =
��(−12) =
��(15) =
b. For what ��-values does ��(��) = −6?

c. Complete the rule for ��(��) so that the graph represents it. ��(��) = −10, 15 ≤ ��< −10 , −10 ≤��< −8 −6, ≤ ��< −1 , −1 ≤ ��< 1 4, ≤ ��< 8, 10 ≤ ��≤ 15
Review Problems
4. The formula for the sum �� of the first �� terms in a geometric sequence is given by ��= ��1 − ���� 1 − �� �, where � is the initial value and �� is the common ratio.
A drug is prescribed for a patient to take 120 milligrams (mg) every 12 hr. for 8 days. After 12 hr., 6% of this drug is still in the body. How much of the drug is in the body after the last dose?
ManuscriptCopy
5. This graph represents Andre’s distance from his bicycle as he walks in a park.

a. For which intervals of time is the value of the function decreasing?
b. For which intervals is it increasing?
c. Describe what Andre is doing during the time when the value of the function is increasing.
6. Here is a graph of �� = 3��.
What is the approximate value of �� satisfying 3��= 10,000? Explain how you know.

ManuscriptCopy
Unit 7, Lesson 2: Piecewise Functions and Their Key Features
Warm-Up: Would You Rather?
1. Which would you rather do?
Drive 3.7 miles to a gas station to fill up for $2.83/gallon or Drive 3.1 miles to a gas station to fill up for $2.90/gallon
2. Justify your choice mathematically.
Collaborative Activity: Exploring Absolute Value as a Piecewise Function
Absolute value functions are composed of 2 linear “pieces” that join at a vertex. The 2 linear pieces of the graph of �� = |��| are similar to the graphs of �� = �� and �� = −��. Each linear piece of �� = |��| is only a portion of the lines �� = �� and �� = −��.
1. Work with your partner to determine the part of the domain for �� = �� and �� = −�� where each line coincides with �� = |��|.
Equation Domain
2. Discuss with your partner why �� = 0 could be included in either part of the domain. Summarize your discussion.
Guided Activity: Piecewise Functions and Their Key Features
Because an absolute value function can be defined by 2 sub-functions which each apply to a certain interval of the domain of an absolute value function, an absolute value function can be written as a piecewise function.
A piecewise function is written using a set bracket. ��(��) = −2�� + 1, �� < 3 3 4 ��− 5, �� ≥ 3
In the example function, there are 2 pieces. The first piece is the line �� = −2�� + 1 for the domain −∞ < ��< 3. The second piece is the line �� = 3 4 ��− 5 for the domain 3 ≤ ��< ∞.
The graph of ��(��) is shown.
1. Complete the piecewise function that represents �� = |��|.
=
2. The graph of �� = |�� + 2| + 5 is shown. Write �� = �� + 2 + 5 as a piecewise function.
3. Consider the function.
= ��− 3, �� ≤ 1
+ 4, �� > 1
a. Complete the table of values for the piecewise function.
Piece
Table of Values
b. Graph the function ��(��)
c. Explain how to determine which �� -value for �� = 1 is included in the function ��(��).
d. Complete the statements.
Endpoint(s) of Sub-Functions
Description of the Graph
Included The endpoint is represented by a(n) ___________ circle.
Excluded The endpoint is represented by a(n) ___________ circle.
4. Consider the function.
a. Complete the table of values for the piecewise function.
b. Graph the function ��(��).
c. On which interval is the function ��(��) decreasing? Write your answer using an inequality.
d. Determine the solution to ��(��) = 1.
e. Mark the point that represents ��(��) = 1 on the graph.
One specific type of piecewise function is a step function. A step function includes all constant pieces.
5. The graph shows an example of a step function.

a. Discuss with your partner why the name step function is appropriate. Summarize your discussion.
b. Over which interval of the function does �� = 2?
c. What is the value of �� when �� = −1?
ManuscriptCopy
Lesson Summary
Piecewise functions are comprised of sub-functions with a restricted domain such that each ��-value is mapped to only 1 y-value. Piecewise functions are defined using a notation with a single left bracket, {, and a set of functions that exist on a defined interval of the domain.
For example, the function ��(��)
is actually made up of 3 functions that exist in different intervals of the domain. To graph the function, first identify the boundaries for each piece of ��(��) by determining the left and right endpoints of the domain and identifying it as included or excluded from the piece.
Note that some pieces may only have 1 boundary point and approach ∞ or −∞ for their other side end behavior. The end behavior of piecewise functions will be explored in further detail in the next
To determine increasing, decreasing, or constant intervals of linear pieces in a piecewise function, evaluate the slope of each piece. In this example, ��(��) is decreasing over the interval (−∞, 1), constant over the interval (1 4), and increasing over the interval (4, ∞).
Use the information determined about the boundary points to graph the function ��(��), as shown. Notice
x
that each piece of ��(��) is its own graph that does not extend over the entire (−∞, ∞) but, rather, the domain defined in the piecewise function. If all the pieces were graphed simultaneously over (−∞, ∞), ��(��) would no longer be a function because the same ��-value would correspond to multiple �� -values.
Practice Problems
1. Use the function ��(��) =
a. Complete the table of values.
to complete the following.
b. Graph ��(��) .
c. Determine the solution to ��(��) = 5.
d. What is the value of ��(5)?
2. The piecewise function ��(��) is defined as ��(��) =
a. Complete the table of values for ��(��).
b. Complete the table by identifying the increasing, decreasing, and constant interval(s) for ��(��).
Key Feature Description
Increasing interval(s)
Constant interval(s)
ManuscriptCopy
Decreasing interval(s)
Review Problems
3. The graph represents the cost of a medical treatment, in dollars, as a function of time, ��, in decades since 1978. Find the cost of the treatment, in dollars, when �� = 1. Show your reasoning.

4. Find the solution(s) to each equation. a. ��2 + 6 = 55
ManuscriptCopy
Unit 7, Lesson 3: Piecewise Functions with Nonlinear Pieces
Warm-Up: Notice and Wonder: Same and Different
What do you notice? What do you wonder?
ManuscriptCopy

Guided Activity: Piecewise Functions with Nonlinear Pieces
1. The piecewise function �� is defined ��(��) = −2��− 3, �� ≤ −2 1 4
a. Complete the table by identifying the domain and the endpoint(s) of each piece. For each endpoint, identify whether it is included or excluded from the domain.
�� = −2�� − 3
Included Excluded Not applicable Included Excluded Not applicable �� = 1 4 ��2 − 4
Included Excluded Not applicable Included Excluded Not applicable �� = − 3 4 �� + 7
Included Excluded Not applicable Included Excluded Not applicable
b. Graph the function ��(��).
c. Complete the table of key features for ��(��).
Key Features
��-intercept(s)
��-intercept
Domain
Range
Increasing interval(s)
Decreasing interval(s)
Positive interval(s)
Negative interval(s) Left
2. Consider
a. Complete the table of values for the piecewise function.
b. Graph the function ��(��).
c. On which intervals is the function ��(��) decreasing? Write your answer using interval notation.
d. Determine the solution to ��(��) = −1.
e. How many solutions are there to ��(��) = − 1 2 ?
Collaborative Activity: Four-Piece Piecewise Function
1. Use the function ���� =
a. Graph ��(��).
to complete the following.
b. Complete the table of key features for ��(��).
Key Features
intercept(s)
intercept
Domain
Range
Increasing interval(s)
Decreasing interval(s)
Positive interval(s)
Negative interval(s)
c. Determine the value of ��(−4).
d. How many solutions are there to ��(��)= 2?
Collaborative Activity: Gallery Walk
The 4 functions shown are used to create different piecewise functions.
• ��(��)= 2
• ��(��)= 2�� + 5
• ℎ(��) = −(��+ 1)2 + 3
• ��(��)= 2�� − 3
The graph of each piecewise function is shown at each station of the gallery walk. Use the functions ��, ��, ℎ, and �� to write the piecewise function represented by each graph. Include the proper domain restriction for each piece.
ManuscriptCopy
Station M ��(��)=
Station D ��(��)=
Station T ��(��)=
Station V ��(��)= �
Lesson Summary
Piecewise functions can include pieces of any function type. In this lesson, some of the functions you learned in previous units such as cubic, cube root, square root, exponential, and quadratic functions are revisited. Use your prior knowledge of how each function type is graphed, including understanding transformations from parent functions, to graph each piece.
Key features of piecewise functions can be identified similarly to other functions. Note that to identify the end behavior of functions with linear or nonlinear pieces, only focus on the pieces that approach either − ∞ or ∞ based on their domain.
ManuscriptCopy
Practice Problems
1. Graph ��(��) =
2. Complete the table of key features of ��(��) from problem 1.
Key Features
Increasing interval(s)
Decreasing interval(s)
Domain Positive interval(s)
Range
3. Use the function ��(��) =
a. Determine the solution to ��(��)=
the
b. How many solutions are there to ��(��)= − 1 2 ?
Review Problems
4. The graph models Priya’s heart rate before, during, and after a run.
a. What was Priya’s approximate heart rate before and after the run?

b. About how high did Priya’s heart rate get during the run?
ManuscriptCopy
c. Sketch what the graph would look like if Priya went for the run three hours later.
ManuscriptCopy
Unit 7, Lesson 4: Using Piecewise Functions to Model Real-World Situations
Warm-Up: Evaluating a Piecewise Function
1. Use the function ��(��) = � ��2 , 3��−2, 2 . 3��, to determine each value. a. ��(0)
ManuscriptCopy
Guided Activity: Piecewise Functions in the Real World
1. During a severe storm, the rain accumulated at a rate of 1 inch (in.) per hour (hr.) for the first 2 hr., 2 in. per hr. for the next 6 hr., and 1 in. per hr. for the last hr. of the storm.
a. A piecewise function can be used to represent the total amount of rain accumulated during the 9-hr. storm. Complete the piecewise function shown by defining the domain of each piece, where �� is the length of the storm, in hr.
��(��) = � ��, 2��−2, �� . 6,
b. Graph ��(��) to model the rain accumulation during the storm.
c. What is the total amount of rain that accumulated during the storm?
ManuscriptCopy
2. The graph shown models a children’s roller coaster’s height above the ground, ��, in feet (ft.), �� seconds (sec.) after the ride starts.
ManuscriptCopy
a. Complete the table by selecting the increasing, decreasing, and constant intervals of ��(��) .
x
□ (0, 4)
□ (4, 8)
□ (8, 12)
□ (12, 22)
□ (22, 27)
□ (27, 30)
□ (30, 34)
□ (0, 4)
□ (4, 8)
□ (8, 12)
□ (12, 22)
□ (22, 27)
□ (27, 30)
□ (30, 34)
□ (0, 4)
□ (4, 8)
□ (8, 12)
□ (12, 22)
□ (22, 27)
□ (27, 30)
□ (30, 34)
d. Identify and interpret the relative maximum and minimum values of ��(��) .
e. Identify and interpret the domain of ��(��) .
f. Identify and interpret the range of ��(��) .
ManuscriptCopy
g. ��(��) is a piecewise function. The equations of 4 pieces of the function are shown. Match each piece to the interval of the domain represented by the equation.
Equation of Piece Interval
�� = −5(�� – 12) 2 + 80
30 ≤ ��≤ 34 (labeled K)
�� = −5�� + 153 27 ≤ ��< 30 (labeled H)
�� = 5(2) �� 9 ≤ ��< 12 (labeled D) �� = 3 0 ≤ ��< 4 (labeled A)
Collaborative Activity: Using Piecewise Functions in Context
1. A construction company rents a tractor for a construction project. The rental company charges $300 for the first day and $200 for each additional day or any portion of a day.
a. A piecewise function is used to represent the cost of a tractor rental over 4 days. Complete the piecewise function by defining the domain of each piece, where �� is the number of days of the tractor rental.
��(��) =
300, 300 + 200, 300 + 3(200) , 300 + 3(200) ,
b. Graph ��(��) to model the cost of renting the tractor over 4 days.
ManuscriptCopy
c. Taylor believes the equation �� = 300+ 200(�� − 1) can be used to represent the cost of renting the tractor for �� days. Explain whether this is an appropriate model for this situation.
2. The amount of money in Juan’s bank account over the past year is shown by the graph of ��(��) , where �� is the number of months since January 1st of the year.
a. Explain what is happening in Juan’s bank account between March and July.
b. Write the interval of each piece of the function (��) .
Equation of Piece
= 250
= 2��+ 4 + 186
= 133�� + 412 �� = −164(�� − 5) (��− 11)
c. When does Juan have the most and least amount of money in his account?
d. Interpret the range of ��(��) . y x
ManuscriptCopy
Lesson Summary
Piecewise functions are often used to model real-world phenomena made up of different functions during different periods of time. For example, a technology company observes the battery usage of a cell phone during a 12-hr. period. The function �� models the percentage of battery power of a cell phone after �� hr. of use.
��(��) = �
−3�� + 101, 0 ≤ ��< 3
−2��+ 80, 3 ≤ ��< 8
� 1 4 ���− 11 , 8 ≤ ��< 10
20��− 196, 10≤�� ≤ 12
x
Part of the reason for using piecewise functions to model real-world scenarios is to be able to use the context of the situation to interpret and make sense of the features of the function. In this scenario, the maximum value is 100, which means that the phone was fully charged at 100% when the observation began. The battery power decreased at an exponential rate between 0 and 3 hr., after which the battery decreased linearly at a constant rate. It seems that at hour 8, the phone was used extensively, and the battery dropped to 4% by hour 10. At that point, it looks like the phone began getting recharged at a constant rate until hour 12.
Practice Problems
1. When a person with diabetes takes long-acting insulin, the insulin reaches its peak effect on the blood sugar level in about 3 hr. This effect remains constant for 5 hr. and then declines until the next injection. The function (��) represents the blood sugar level for a person �� hours after an injection of long-acting insulin.
��(��) = �
40��+ 100, 0 ≤ �� <3
220, 3 ≤ ��< 8
−80��+ 860, 8 ≤ �� < 10
60, 10 ≤ �� ≤ 12
a. Graph the function.
b. What does ��(��) = 220 represent in this context?
2. The function ��(��) =
40��+ 100, 0 ≤ �� <3 220, 3 ≤ ��< 8
−80��+ 860, 8 ≤ �� < 10 60, 10 ≤ �� ≤ 12
models the blood sugar level of a
person with diabetes �� hr. after an insulin injection was administered. If a person administers an insulin injection at 9 a.m., determine the blood sugar level at each of the following times.
a. 10 a.m.
b. 12 p.m.
c. 6 p.m.
d. 9 p.m.
Review Problems
3. A piecewise function is shown.
a. Graph (��) .
b. Identify the increasing and decreasing intervals of (��) .
c. Identify the domain and range of (��) .
4. Factor ��(��4 − 16) .
ManuscriptCopy
ManuscriptCopy
Unit 7, Lesson 5: Solving One-Variable Absolute Value Inequalities
Warm-Up: Solving Inequalities
1. Solve each inequality.
a. 3�� + 4 > 2�� −3
b. 5 ≤ 2�� + 1 ≤ 1 2 c. 4 (3 − �� ) ≤ 2�� + 9
2. Which of the inequalities include �� = 0 as a solution?
Guided Activity: Solving Absolute Value Inequalities
1. Noora solved the absolute value inequality |�� 1 4 | ≥ 1 0. Her work is shown.
1
2
a. What do you notice about the original inequality, |�� 1 4 | ≥ 1 0, and the 2 inequalities in step 1?
b. How is step 1 similar to solving |�� 1 4 | = 1 0?
c. How is step 1 different from solving |�� 1 4 | = 1 0?
d. Graph the solution set determined in step 2 on the number line. -4-202468101214161820222426
2. Eva solved the absolute value inequality |3�� 1 | < 1 5. Her work is shown.
a. Discuss with your partner whether �� = 0 is a solution to the inequality |3�� 1 | < 1 5.
b. Graph the solution set for |3�� 1 | < 1 5 on the number line.
c. Write the solution set for |3�� 1 | < 1 5 as a compound inequality.
3. Hassan considered the absolute value inequality |�� 2| ≤ −7 and stated that it has no solution.
a. Explain why there is no solution to Hassan’s inequality.
b. Graph the solution set for |�� 2| ≥ −7 on the number line. -15-13 -11 -9-7-5-3-113579 11
4. Consider the inequality 1 2 |�� 5| + 3≤ 0.
a. Solve the absolute value inequality.
b. Graph the solution set on the number line. -15-13 -11 -9-7-5-3-113579 11 1315 -14-12-10-8-6-4-2 0 2468101214
5. Audrey solved an absolute value inequality with the steps shown. Original Inequality |�� 2| ≤ 0
Step 1 �� −2 = 0
Step 2 �� −2 = 0 + 2 + 2 �� = 2
a. Why did Audrey switch the symbol from an inequality to an equal sign when moving from the original problem to step 1?
b. What would the answer be if the original problem was |�� 2|< 0 instead of |�� 2| ≤ 0?
ManuscriptCopy
6. Complete each statement for any algebraic expression �� where ��> 0.
a. Inequalities in the form |��| < ��
have no solution. are equivalent to �� < �� < ��. are equivalent to �� < −�� or �� > ��. have a solution set of all real numbers.
b. Inequalities in the form |��| > ��
c. Inequalities in the form |��| < −��
have no solution. are equivalent to �� < �� < ��. are equivalent to �� < −�� or �� > ��. have a solution set of all real numbers.
d. Inequalities in the form |��| > −��
have no solution. are equivalent to �� < �� < ��. are equivalent to �� < −�� or �� > ��. have a solution set of all real numbers.
have no solution. are equivalent to �� < �� < ��. are equivalent to �� < −�� or �� > ��. have a solution set of all real numbers.
7. Discuss with your partner whether the statements also apply to |��|≤ ��, |��| ≥ ��, |��|≤ −��, and |��| ≥ −��.
ManuscriptCopy
Collaborative Activity: Solving Absolute Value Inequalities
1. Mason’s work for solving −2|�� + 7| + 1 0 ≤ 6 is shown.
+ 7| + 1 0≤ 6
Mason and his partner, Arya, both checked Mason’s work. Mason used �� = −6 since it is included in his solution set. Arya used �� = 0 because it is not included in his solution set.
a. Discuss with your partner why Mason’s and Arya’s checks show that Mason’s solution is incorrect.
b. Find Mason’s error, and correct it.
2. With your partner, draw a line to connect each inequality in the left column with its corresponding solution in the right column.
Lesson Summary
An absolute value inequality represents the distance that a specific expression can be from 0. For example, |�� | < 3 means that the value of �� must be less than 3 units away from 0, which means any value between −3 and 3, exclusive, will make the inequality true. When working with an absolute value inequality such as |�� | ≥ 5, consider what it means in terms of distance from 0. Interpreting this inequality means �� can be any value that is greater than or equal to 5 units from 0. Therefore, the solution to the inequality |�� | ≥ 5 will be �� ≤ −5 or �� ≥ 5. This solution can also be written in interval notation, (−∞, −5] ∪ [5, ∞) , or set notation, {�� |�� ≤ −5 ∪ �� ≥ 5}.
When absolute value inequalities are more complex, they are solved in a similar manner, where the inequality is split into 2 inequalities and each is solved independently of the other. The solution of the absolute value inequality is the combination of solutions of the 2 parts. For example, the solution and description of steps used to solve the inequality 2|�� + 6| < 8 are shown.
Description
Work
Given inequality 2|�� + 6| < 8
Isolate the absolute value expression to 1 side of the inequality. |�� + 6| < 4
Rewrite the absolute value inequality using positive and negative parts. ��
Solve each inequality for �� .
Identify the solution set of the original absolute value inequality using both parts of the solution. 1 0 < �� < −2 (−1 0, −2) {�� |−1 0 < �� < −2}
The solution set in this example is expressed in 3 different ways, inequality, interval, and set notations.
Practice Problems
1. Solve |5�� 3| > 1 2. Graph the solution on the number line.
-8-7-6-5-4-3-2-1012345678
Solve −3|�� + 4 | ≤ −9. Graph the solution on the number line.
-8-7-6-5-4-3-2-1012345678
3. Solve 2 < 4 − |3�� + 2|. Graph the solution on the number line.
ManuscriptCopy
-8-7-6-5-4-3-2-1012345678
2.
4. Find the exact solution(s) to each of these equations, or explain why there is no solution.
5. Write a rational equation that cannot have a solution at �� = 2.
6. For each equation below, find the value(s) of �� that make it true.
ManuscriptCopy
Unit 7, Lesson 6: Solving Absolute Value Inequalities for Real-World Contexts
Warm-Up: Price of Paints
Olivia is planning on painting her bedroom. She estimates that she will need between 2 and 3 gallons (gal.) of paint to cover all the walls in her bedroom. The table shows the price per gal. for the different types of paint Olivia is comparing.
Write a compound inequality to represent how much money, ��, Olivia should budget for this project.
ManuscriptCopy
Exploration Activity: Absolute Value Inequalities in a Real- World Context
Members of the school cross-country team are preparing to run a 5k race, which is about 3.1 miles (mi.). The average time for the team is 22.35 minutes (min.). The fastest and slowest times varied from the average by 3.61 min.
1. Based on the given information, what is a completion time, in min., for the team that is not likely?
2. Discuss with your partner if it is possible that a member of the team had a time of 26 min. Summarize your discussion.
3. Work with your partner to show on the number line all the possible times members of the team took to complete the 5k. The average time of 22.35 is already shown on the number line.
The times shaded show the distances away from the average time that are possible.
ManuscriptCopy
In the context of the cross-country team, the distance is not measured from 0. Rather, it is measured from the average time of 22.35 min. If �� is the distance away from the average time, then |�� 22.35| can represent the distance on a number line that �� is from 22.35 min.
4. Complete the table to determine if the given ��-value is within the range of 3.61 min. from the average.
5. Solve the inequality |�� 22.35| ≤ 3.61.
6. Graph the solution set on the number line.
7. Compare the graph of the solution set of |�� 22.35| ≤ 3.61 to the graph from problem 3. Summarize your observations.
Guided Activity: Solving Absolute Value Inequalities in a Real-World Context
1. Imogene made a personal goal of saving $96 per month. Each month, she has been averaging within $8.65 of her goal. The inequality |�� – 96| ≤ 8.65 is used to represent the amount of her monthly savings, ��.
2. Solve the inequality, and write the answer using set notation.
a. Interpret the solution of the inequality in context.
3. The width of a license plate should be 6 inches (in.). The manufacturing tolerance is within 0.07 in. The inequality |�� – 6| ≤ 0.07 is used to model the acceptable width, �� , of a license plate.
4. Solve the inequality, and write the answer using interval notation.
a. Interpret the solution of the inequality in context.
Lesson Summary
Solving absolute value inequalities results in a range of acceptable values that are considered solutions. Often, real-world contexts involve limits or constraints such as the maximum weight of suitcases when flying, the maximum amount of data used in a cell phone plan, or the minimum amount of active ingredient in a medication. Often, in manufacturing or pharmacology scenarios, there is a range of acceptable outcomes that are created using an absolute value inequality.
For example, in a poll for an upcoming election, 38% of likely voters said they planned to vote for candidate A. This poll has a margin of error of ±3%. The inequality |�� – 38| ≤ 3 can be used to determine the range of voters that are likely to vote for candidate A. Using the inequality, it can be said that between 35% and 41% of likely voters plan to vote for candidate A based on this poll.
Practice Problems
1. Zahara is practicing for band tryouts. To prepare to do her best, she spends an average of 56 min. each day playing her flute. Each of her daily practice times is within 14 min. of her average. The inequality |�� – 56| ≤ 14 represents the number of minutes, �� , Zahara practices.
a. Solve the inequality. Write the solution as a compound inequality.
b. Graph the solution on the number line. 40424446485052545658606264667072
2. Camden enjoys surfing. During the winter, he caught several waves with an average height of 8.1 feet (ft.). All the waves he surfed were within 3.3 ft. of his average. The inequality |ℎ 8.1| ≤ 3.3 can be used to model the height of the waves Camden surfed. Solve the inequality, and interpret the solution in context.
3. Jax loves to play soccer. He plays on his high school team and averages 1.2 points per game. His highest and lowest scoring games were within 0.45 points of his average. The inequality |�� − 12| ≤ 0.45 can be used to determine the range of Jax’s points per game, �� .
4. Solve the inequality, and write the answer using set notation.
a. Graph the solution on the number line.
Review Problems
5. The graph shows the number of milligrams (mg) of a chemical in the body �� days after it was first measured.
a. Explain what the point (1, 2.5) means in this situation.

b. Mark the point that represents the amount of medicine left in the body after 8 hours.
6. Find each missing exponent. a.
ManuscriptCopy
ManuscriptCopy
Unit 7, Lesson 7: Solving Two-Variable Absolute Value Inequalities
Warm-Up: Cryptogram
A cryptogram is a type of puzzle that consists of some encrypted text. Each letter represents a different value.
1. Solve the cryptogram using the digits 1 through 9.
2. What was your strategy for solving?
ManuscriptCopy
Collaborative Activity: Solving Two-Variable Absolute Value Inequalities
The graph of �� = |2��| − 5 is shown in red.
The graph of �� ≥ |2��| − 5 is shown in blue.
1. Discuss with your partner the similarities and differences between the 2 graphs. Summarize your discussion in the table.
ManuscriptCopy
The graph of �� > |2��| − 5 is shown in green.
2. Discuss with your partner the difference(s) between the green and blue graphs. Summarize your discussion.
The graph of �� ≤ |2��| − 5 is shown in purple.
3. Consider the shading of the blue, green, and purple graphs.
a. Explain why the shading is above the graph of the absolute value function on the blue and green graphs.
ManuscriptCopy
b. Explain why the shading is below the graph of the absolute value function on the purple graph.
4. For each inequality given in the table, determine whether the point (0, 0) is included in the solution set. Then, graph the solution set of the inequality.
5. Discuss with your partner any patterns you notice between the symbol used in the absolute value inequality and the shading of the solution in the graph.
Guided Activity: Graphing the Solution Set of a Two-Variable Absolute Value Inequality
1. Consider the absolute value inequality �� ≥ 5 2 |��− 2| + 5.
a. Find the ��-intercepts of �� = 5 2 |��− 2| + 5.
b. Determine the vertex of �� = 5 2 |��− 2| + 5.
c. Identify the �� -intercept of �� = 5 2 |��− 2| + 5.
d. Complete the statements. The graph of �� ≥ 5 2 |��− 2| + 5 will have a forming a V shape because points on the graph of the related absolute value equation are the solution set. The area the related equation should be shaded to represent additional coordinates included in the solution set. solid line dashed line included in excluded from above below
2. Graph

Graph
ManuscriptCopy

4. Graph �� > 1 3 |��|+ 1.

ManuscriptCopy
5. Identify 2 coordinate points that are in the solution set for both �� < |−�� − 1| + 2 and �� > 1 3 |��|+ 1.
Lesson Summary
Similar to quadratic and polynomial inequalities studied previously in the course, two-variable absolute value inequalities are solved using a graph.
For example, ��(��)= 4|��+ 2| 2 is an absolute value function with zeros at �� = −1.25 and �� = −2.75. From this form, additional key features can be determined to graph ��(��), such as the �� -intercept or the vertex of the graph. The graph of ��(��) is shown.
To graph the inequality �� ≥ 4|�� + 2| − 2 means to determine all the coordinate points that, when substituted into the inequality, will make the statement true.
• Since the comparison symbol is ≥ , the graph will be solid (not dashed) to indicate that points along the line are included in the solution set of the inequality.
• Select a point, either above or below the graph, such as (0, 0), to substitute into the inequality to check whether the point creates a true statement. In this case, 0 ≥ 4|0 + 2| − 2 is not true. Therefore, the solution set does not include (0, 0).
A similar analysis can be made with the inequality �� < 4|�� + 2| − 2.
• Since the comparison symbol is < , the graph will be dashed to indicate that points along the line are not included in the solution set of the inequality.
• The solution set will be shaded below the graph because using the same point to verify, 0 < 4|0 + 2| −2 is true.
The graphs of �� ≥ 4|�� + 2| − 2 and �� < 4|�� + 2| − 2 are shown.
Practice Problems
Graph �� > −2|�� − 1| + 3.
ManuscriptCopy

1.

Review Problems
3. A rectangular playground space is to be fenced in using the wall of a daycare building for one side and 200 meters (m) of fencing for the other three sides. The area ��(��) in square meters (sq. m) of the playground space is a function of the length �� in m of each of the sides perpendicular to the wall of the daycare building.
a. What is the area of the playground when �� = 50?
b. Write an expression for ��(��).
ManuscriptCopy
c. What is a reasonable domain for �� in this context?
4. Find the exact solution(s) to each of these equations, or explain why there is no solution.
a. ��� + 2 3 = 4
b. ���3 + 5 = 4
c. ��� 1 3 − 14 = −4
ManuscriptCopy
ManuscriptCopy
ManuscriptCopy
ManuscriptCopy
Unit 8, Lesson 1: Moving in Circles
Warm-Up: Which One Doesn’t Belong: Reading Clocks
Which one doesn’t belong?
ManuscriptCopy

Exploration Activity: Around and Around
A ladybug lands on the end of a clock’s second hand when the hand is pointing straight up. The second hand is 1 foot (ft.) long and when it rotates and points directly to the right, the ladybug is 10 ft. above the ground.
1. How far above the ground is the ladybug after 0, 30, 45, and 60 seconds (sec.) have passed?
Pause here for a class discussion.
2. Estimate how far above the ground the ladybug is after 10, 20, and 40 sec. Be prepared to explain your reasoning.
3. If the ladybug stays on the second hand, describe how its distance from the ground will change over the next minute. What about the minute after that?
4. At exactly 3:15, the ladybug flies from the second hand to the minute hand, which is 9 inches (in.) long.
a. How far off the ground is the ladybug now?
b. At what time will the ladybug be at that height again if it stays on the minute hand? Be prepared to explain your reasoning.
ManuscriptCopy
Guided Activity: Where Is the Point?
1. What is the radius of the circle?

2. If �� has a ��-coordinate of − 4, what is the ��-coordinate?

3. If �� has a ��-coordinate of 4, what is the ��-coordinate?

ManuscriptCopy
4. A circle centered at (0, 0) has a radius of 10. Point �� on the circle has an ��-coordinate of 6. What is the ��-coordinate of point ��? Explain or show your reasoning.
Lesson Summary
Consider the height of the end of a second hand on a clock over a full minute (min.). It starts pointing up, then it rotates to point down, and finally it rotates until it is pointing straight up again. This motion repeats once every min.

Imagine the clock is centered at (0, 0) on a coordinate plane. Then, the movement of the end of the second hand can be modeled by the (��,��) coordinates on the plane. Over 1 min., the ��-coordinate starts at its highest value (when the hand is pointing up), decreases to its lowest value (when the hand is pointing down), and then returns to its highest value. This happens once every min. that passes.
In this course, you have explored many types of functions, such as rational and exponential, but none of them are characterized by output values that repeat over and over again. This means a new function is needed to model these real-world phenomena. A function whose values repeat at regular intervals is called a periodic function, and the length of the interval over which a periodic function repeats is called the period.
Multiple types of periodic functions will be studied in this unit.
ManuscriptCopy
Practice Problems
1. Here is a clock face. For each time given, name the number the second hand points at.
a. 15 sec. after 1:00.
b. 30 sec. after 1:00.

c. 1 min. after 1:00.
d. 5 min. after 1:00.
2. At 12:15, the end of the minute hand of a clock is 8 ft. above the ground. At 12:30, it is 6.5 ft. off the ground.
a. How long is the minute hand of the clock? Explain how you know.
b. How high is the clock above the ground?
ManuscriptCopy
3. The point (6, 8) on a circle centered at (0, 0) is shown. What is the radius of the circle?

4. The point (3, 4) is on a circle centered at (0, 0). Which of these points lie on the circle? Select all that apply.
□ ( − 3, − 4)
□ (4, 3)
□ (0, 5)
□ (0, 0)
□ ( − 5, 0)
ManuscriptCopy
Review Problems
5. Match each polynomial function with its end behavior as ��→∞ and as ��→− ∞. (Note: some of the answer choices are not used, and some answer choices may be used more than once.)
Polynomial Function
End Behavior
a. ��(��) = 6�� ��−6 ��→ 6
b. ��(��) = 3�� ��−6 ��→ 3
c. ℎ(��)= 3�� 18 ��−6 ��→ 0
d. ��(��) = �� 6 3��2−16��+12 ��→ 1 3
e. ��(��) = (�� 6) (��−6) (��+5) (��−4) ��→ ∞
6. Find the solution(s) to each equation.
��2 − 6�� + 8 = 0
b. ��2 − 6�� + 9 = 0
ManuscriptCopy
a.
ManuscriptCopy
Unit 8, Lesson 2: Revisiting Right Triangles
Warm-Up: Notice and Wonder: A Right Triangle
What do you notice? What do you wonder?
ManuscriptCopy

Collaborative Activity: Recalling Right Triangle Trigonometry
1. Find cos(��), sin(��), and tan(��) for ∆������.

2. Sketch a ∆������ where sin(��) = cos(��) and �� is a right angle. What is the value of tan(��) for this triangle? Explain how you know.
ManuscriptCopy
3. If the coordinates of point �� are (9, 12), what is the value of cos(��), sin(��), and tan(��) for ∆������ ? Explain or show your reasoning.

Guided Activity: Shrinking Triangles
1. What are cos(��), sin(��), and tan(��)? Explain how you know.

2. Here is a triangle similar to ∆������.

a. What is the scale factor from ∆������ to ∆��′��′��′? Explain how you know.
b. What are cos(��′), sin(��′), and tan(��′)?
ManuscriptCopy
3. Here is another triangle similar to ∆������.
a. Label the ∆��″��″��″.
b. What is the scale factor from ∆������ to ∆��″��″��″?
c. What are the coordinates of ��″? Explain how you know.

d. What are cos(��″), sin(��″), and tan(��″)?
ManuscriptCopy
Lesson Summary
In a previous course, you studied the ratios of side lengths in right triangles.
Right triangle ������ is shown.
• In this triangle, the cosine of ∠�� is the ratio of the length of the side adjacent to ∠�� to the length of the hypotenuse. That is, cos(��) = 4 5 .
• The sine of ∠�� is the ratio of the length of the side opposite ∠�� to the length of the hypotenuse. That is, sin(��) = 3 5 .
• The tangent of ∠�� is the ratio of the length of the side opposite ∠�� to the length of the side adjacent to ∠��. That is, tan(��) = 3 4 .

Now consider ∆��′��′��′, which is similar to ∆������ with a hypotenuse of length 1 unit. Triangle ��′��′��′ is shown on a coordinate grid.
Since the 2 triangles are similar, ∠�� and ∠��′ are congruent. So how do the values of cosine, sine, and tangent of these angles compare to the angles in ∆������?
• Since all 3 values are ratios of side lengths, cos(��) = cos(��′), sin(��) = sin(��′), and tan(��) = tan(��′).
• Notice that the coordinates of ��′ are �4 5 , 3 5 � because ��′��′ has length 4 5 and segment ��′��′ has length 3 5 . In other words, the coordinates of ��′ are (cos(��′),sin(��′)).
Practice Problems
1. Which of the following is true?
A. sin(��) = 6 10
B. cos(��) = 6 10
C. sin(��) = 6 10
D. cos(��) = 8 10

2. Here is ∆������.
a. Express the length of ���� using sine or cosine.
b. Express the length of ���� using sine or cosine.
3. Triangle ������ is similar to ∆������.
ManuscriptCopy


a. What is the length of ����? What is the length of ����? Explain how you know.
b. Explain why the length of ���� is cos(��) and the length of ���� is sin(��).
4. Here is a triangle.
Find cos(��), sin(��), and tan(��). Explain your reasoning.
5. Sketch and label a right ∆������ with tan(��) = 2.
Review Problem
ManuscriptCopy


6. The point (1, 4) lies on a circle with center (0, 0). Name at least one point in each quadrant that lies on the circle.
ManuscriptCopy
Unit 8, Lesson 3: The Unit Circle – Part 1
Warm-Up: Finding Coordinates of Points on the Unit Circle
1. The ��-coordinate of a point on the unit circle is 3 5 . What does this tell you about where the point might lie on the unit circle? Find any possible ��-coordinates of the point and plot them on the unit circle.
2. The ��-coordinate of a point on the unit circle is − 0.4. What does this tell you about where the point might lie on the unit circle? Find any possible ��-coordinates of the point and plot them on the unit circle.
ManuscriptCopy
Exploration Activity: Which Point?
All points are 1 unit from the origin.

Choose one of the points. Be prepared to describe its location using only words.
Collaborative Activity: Measuring Circles
1. Your teacher will give you a circular object.
a. About how many radii does it take to go halfway around the circle?
b. About how many radii does it take to go all the way around the circle?
c. Compare your answers to the previous two questions with your partners.
ManuscriptCopy
2. What is the exact number of radii that fit around the circumference of the circle? Explain how you know.
3. Why doesn’t the number of radii that fit around the circumference of a circle depend on the radius of the circle? Explain how you know.
Guided Activity: Around a Bike Wheel
A bicycle wheel has a 1 foot (ft.) radius. The wheel rolls to the left (counterclockwise).
1. What is the circumference of this wheel?
2. Mark the point �� where �� will be after the wheel has rolled 1 ft. to the left. Be prepared to explain your reasoning.

3. Mark the point �� where �� will be after the wheel has rolled 3 ft. to the left. What angle, in radians, does �� rotate through to get to ��? Explain your reasoning.
4. Where will point �� be after the bike has traveled �� ft. to the left? What about 10�� ft.? 100�� ft.? Mark these points on the circle. Explain your reasoning.
5. After traveling some distance to the left, the point �� is at the lowest location in its rotation. How far might the bike have traveled? Explain your reasoning.
ManuscriptCopy
Lesson Summary
One way to define a circle centered at (0, 0) is by the equation ��2 + ��2 = ��2, where �� is the radius of the circle. For a unit circle, ��= 1, so the equation for the unit circle with the center at the origin must be ��2 + ��2 = 1.
The circle in the coordinate plane with radius of 1 and center at the origin is called a unit circle.
Points on the unit circle have several interesting properties, such as having matching points on opposite sides of the axes because of symmetry. Another feature of points on a unit circle is that they can be defined solely by an angle of rotation that can be measured in degrees or radians.
The radian measure of an angle whose vertex is at the center of a circle is the ratio between the length of the arc defined by the angle and the radius of the circle.
Radians are a natural tool to use to measure the distance traveled on a circle. For example, consider a bicycle that has wheels with a radius of 1 ft. When the bike starts to move to the left, rotating the wheel counterclockwise, think about what happens to point ��.
• The point �� will return to its starting location when the wheel has rotated through an angle of 2�� radians.
• During this rotation, the bike will move a length equal to the circumference of the wheel, which is 2�� ft.
• In general, the angle of rotation of the wheel with radius 1 ft., in radians, is the same as the number of ft. this bike has traveled.
ManuscriptCopy

So, what happens when a wheel doesn’t have a radius of 1 unit? Because all circles are similar, the same strategy can be applied but scaled up or down to match the size of the wheel. This concept will be explored in upcoming lessons.
Thinking about the wheel as a unit circle, as shown in this image, the arc length of the circle from �� to �� has length equal to 1 unit, the radius of the unit circle. Because of this, ∠������ is said to measure 1 radian. If continuing to measure using radian lengths around the circle, it takes a little more than 6 to measure the entire circumference. This makes sense because the ratio of the circumference to the diameter for a circle is ��, so the circumference is 2�� times the radius, or about 6.3 radii.

• Angle ������ has a measure of �� radians because its arc is 1 2 of a full circle (counterclockwise) or 1 2 of 2��.
• Angle ������ is three-quarters of a full circle (counterclockwise), which is 3�� 2 radians.
Practice Problems
1. �� is a circle with radius ��. Which of the following is true? Select all that apply.
□ The diameter of �� is 2��.
□ The circumference of �� is ����.
□ The circumference of �� is 2����.
□ One quarter of the circle has length ���� 4 .
□ One quarter of the circle has length ���� 2 .
ManuscriptCopy
2. The table shows an angle measure in radians and the amount of rotation about a circle corresponding to the angle. For example, 2�� radians corresponds to 1 full rotation. Complete the table.
3. A wheel has a radius of 1 ft. After the wheel has traveled a certain distance in the counterclockwise direction, the point �� has returned to its original position. How many feet could the wheel have traveled? Select all that apply.
4. Here are some points labeled on the unit circle.
a. What is the measure in radians of ∠������?
ManuscriptCopy
b. Angle ������ is halfway between 0 radians and ∠������. What is the measure in radians of ∠������?


c. Label point �� on the circle so that the measure of ∠������ is 3�� 4 .
d. Label point �� on the circle so that the measure of ∠������ is 3�� 2 .
5.
a. Mark the points on the unit circle with ��-coordinate 4 5
b. What are the ��-coordinates of those points? Explain how you know.

Review Problems
6. The point (8, 15) lies on a circle centered at (0, 0). Where does the circle intersect the ��-axis? Where does the circle intersect the ��-axis? Explain how you know.
7. Triangles ������ and ������ are similar. Explain why tan(��)= tan(��).
ManuscriptCopy

ManuscriptCopy
Unit 8, Lesson 4: The Unit Circle – Part 2
Warm-Up: Notice and Wonder: Around the Unit Circle
What do you notice? What do you wonder?
ManuscriptCopy

Guided Activity: Angles Everywhere
Here is a circle of radius 1 with some radii drawn.

ManuscriptCopy
1. Draw and label angles, with the positive ��-axis as the starting ray for each angle, measuring �� 12, �� 6 , �� 4 , . . . , 2�� in the counterclockwise direction. Four of these angles, one in each quadrant, have been drawn for you. There should be a total of 24 angles labeled when you are finished, including those that line up with the axes. Be prepared to share any strategies you used to make the angles.
2. Label the points, where the rays meet the unit circle, for which you know the exact coordinate values.
| Unit 8
Collaborative Activity: Angle Coordinates Galore
Your teacher will assign you a section of the unit circle.
1. Find and label the coordinates of the points assigned to you where the angles intersect the circle.
2. Compare and share your values with your group.
3. What relationships or patterns do you notice in the coordinates? Be prepared to share what you notice with the class.
Lesson Summary
Given any point in a quadrant on the unit circle and its associated angle, like �� shown here, some statements can be made about other points that must also be on the unit circle.
ManuscriptCopy

For example, if the coordinates of �� are (−0.87, 0.5) and �� is 5�� 6 radians, then there is a point �� in quadrant I with coordinates (0.87, 0.5). Since �� is �� 6 radians from a half circle, the angle associated with point �� must be �� 6 radians. Similarly, there is a point �� at (−0.87, −0.5) with an angle �� 6 radians greater than a half circle. This means point �� is at angle 7�� 6 radians since �� + �� 6 = 7�� 6 . Using the same symmetry strategy, there must also be a point at (0.87, −0.5) with an angle of 11�� 6 radians.
Upcoming lessons will explore how to find the coordinates of point �� using its angle �� and familiar facts about right triangles.
Practice Problems
1. Angle ������ measures �� 3 radians, and the coordinates of �� are about (0.5, 0.87).
a. The measure of ∠������ is 2�� 3 radians. What are the approximate coordinates of ��? Explain how you know.

b. The measure of ∠������ is 5�� 3 radians. What are the approximate coordinates of ��? Explain how you know.
2. Give an angle of rotation centered at the origin that sends point �� to a location whose (��, ��) coordinates satisfy the given conditions.
a. �� > 0 and �� < 0
b. �� < 0 and �� > 0
c. �� < 0 and �� < 0
3. Lin calculates 0.972 + 0.262 and finds that it is 1.0085.
a. Explain why (0.97, 0.26) is not on the unit circle.
ManuscriptCopy

b. Is (0.97, 0.26) a good estimate for the coordinates of a point on the unit circle? Explain how you know.
4. The ��-coordinate of a point �� on the unit circle is 0. If point �� is the result of rotating the point (1, 0) by �� radians counterclockwise about the origin, what angle could �� represent? Select all that apply.
2��
Review Problems
5. Here is ∆������. ���� is shorter than ����. Which statements are true? Select all that apply.
□ sin(��) > 1
□ tan(��) < 1
□ cos(��) < 1
□ sin(��) < ������(��)
□ cos(��) < ������(��)
□ tan(��) < ������(��)

6. Angle ������ measures one radian. The radius of the circle is 1 unit.
a. What is the length of arc ����?

b. Explain why the length of arc ���� is less than 1 6 of the full circle.
7. Label these points on the unit circle:
a. �� is the image of �� after a 11�� 6 rotation with center ��.
b. �� is the image of �� after a 3�� 2 rotation with center ��.
c. �� is the image of �� after a 2�� 3 rotation with center ��.
d. �� is the image of �� after a �� 3 rotation with center ��.

ManuscriptCopy
Unit 8, Lesson 5: The Pythagorean Identity
Warm-Up: Circle Equations
Here is a circle centered at (0, 0) with a radius of 1 unit.
What are the exact coordinates of �� if �� is rotated counterclockwise �� 3 radians from the point (1, 0)? Explain or show your reasoning.

Exploration Activity: Cosine, Sine, and the Unit Circle
What are the exact coordinates of point �� if it is rotated 2�� 3 radians counterclockwise from the point (1, 0)? Explain or show your reasoning.
ManuscriptCopy

Guided Activity: A New Identity
1. Is the point � −0.5, sin � 4�� 3 �� on the unit circle? Explain or show your reasoning.
2. Is the point � −0.5, sin � 5�� 6 �� on the unit circle? Explain or show your reasoning.
3. Suppose that sin(��) = −0.5 and that �� is in quadrant 4. What is the exact value of cos(��) ? Explain or show your reasoning.
ManuscriptCopy
Lesson Summary
A point �� on the unit circle with coordinates (��,��) is shown.

Using the Pythagorean theorem, ��2 + ��2 = 1. This is also true based on the equation for a circle with radius 1 unit, ��2 + ��2 = 12. The equation of the circle is true for the point (��, ��) because it is on the unit circle.
Another way to write the coordinates of �� is using the ∠��, which gives the location of �� on the unit circle relative to the point (1, 0). Thinking of �� this way, its coordinates are (cos(��) , sin(��) ) . Since �� = cos(��) and �� = sin(��) , substituting these expressions into the Pythagorean theorem shows that cos2(��) + sin2(��) = 1 is also true.
What if �� were a different angle and �� wasn’t in quadrant 1?
No matter the quadrant, the coordinates of any point on the unit circle given by an angle �� are (cos(��) , sin(��) ) . In fact, the definitions of cos(��) and sin(��) are the ��- and ��- coordinates of the point on the unit circle �� radians counterclockwise from (1, 0). Up until today, the angles used for cosine and sine to find side lengths of right triangles were limited to angles between 0 and �� 2 radians. This resulted in positive sine and cosine ratios.
This revised definition of cosine and sine means that cos2(��) + sin2(��) = 1 is true for all values of �� defined on the unit circle and is known as the Pythagorean identity.
The identity sin2(x) + cos2(x) = 1 relating the sine and cosine of a number is called the Pythagorean identity because it follows from the Pythagorean theorem.
Practice Problems
1. The pictures show points on a unit circle labeled ��, ��, ��, and ��. Which point is �cos
?

ManuscriptCopy
2. For which angles is the cosine positive? Select all that apply.
□ 0 radians
□ 5�� 12 radians
□ 5�� 6 radians
□ 3�� 4 radians
□ 5�� 3 radians
3. Mark two angles on the unit circle whose measure �� satisfies sin(��) = −0.4. How do you know your angles are correct?

a. For which angle measures, ��, between 0 and 2�� radians is cos(��) = 0? Label the corresponding points on the unit circle.
b. What are the values of sin(��) for these angle measures?
ManuscriptCopy

4.
5. Angle ������ measures �� 4 radians, and the coordinates of �� are about (0.71, 0.71) .
a. The measure of ∠������ is 3�� 4 radians. What are the approximate coordinates of ��? Explain how you know.

b. The measure of ∠������ is 7�� 4 radians. What are the approximate coordinates of ��? Explain how you know.
6.
a. In which quadrant is the value of the ��-coordinate of a point on the unit circle always greater than the ��-coordinate? Explain how you know.
b. Name 3 angles in this quadrant.
7. Lin is comparing the graph of two functions �� and ��. The function �� is given by ��(��) = ��(��− 2) . Lin thinks the graph of �� will be the same as the graph of ��, translated to the left by 2. Do you agree with Lin? Explain your reasoning.
Unit 8, Lesson 6: Finding Unknown Coordinates on a Circle
Warm-Up: Math Talk: Which Quadrant?
For an angle �� in the quadrant indicated, use mental estimation to identify the values of cos(��), sin(��), and tan(��) as either positive or negative.
Quadrant I
Quadrant II
Quadrant III
Quadrant IV
ManuscriptCopy
Collaborative Activity: Around the Circle
The table shows combinations of values of sine and cosine of different angles, ��, and the quadrant of ��.
1. Complete the table by identifying the missing equation for each row.
2. Explain why 1 of the angles, ��, is not in any quadrant.
ManuscriptCopy
Collaborative Activity: Clock Coordinates
Here is a clock face.

1. The length of the minute hand on a clock is 5 inches (in.) and the center of the clock is at (0, 0) on a coordinate plane. Determine the coordinates of the end of the minute hand at the following times. Explain or show your reasoning.
a. 45 minutes (min.) after the hour (hr.)
b. 10 min. after the hr.
c. 40 min. after the hr.
2. The minute hand on another clock, also centered at (0, 0), has a length of 15 in. Determine the coordinates of the end of the minute hand at the following times. Explain or show your reasoning.
a. 45 min. after the hr.
ManuscriptCopy
b. 10 min. after the hr.
c. 40 min. after the hr.
3. At a certain time, the end of the minute hand of a third clock centered at (0, 0) has coordinates approximately (7.5, 7.5). How long is the minute hand of the clock if each grid square is 1 in. by 1 in.? Explain or show your reasoning.
Exploration Activity: Around a Ferris Wheel
These activities require the use of an applet, so please make your way over to the digital platform to find the link.
The center of a Ferris wheel is 40 feet (ft.) off the ground, and the radius of the Ferris wheel is 30 ft. Point �� is shown at 0 radians.
1. Calculate how high off the ground point �� is as the Ferris wheel rotates counterclockwise starting from 0 radians.
a. �� 12 radians
ManuscriptCopy
b. �� 2 radians

c. 5�� 6 radians
2. As you go around on the Ferris wheel, at which position(s) would you be 6 0 ft. off the ground? Explain your reasoning.
You may use this applet if you choose.

ManuscriptCopy
Lesson Summary
Sine is helpful for finding heights of things moving in a circular motion. The minute hand on the Elizabeth Tower, a famous clock in London whose bell is nicknamed Big Ben, extends 11.5 ft. to the edge of the 23 ft. diameter clock face. The center of the clock is 18 0 ft. above the ground.

At 12:00, the height of the end of the minute hand above the ground is 191.5 ft. (18 0 + 11.5), and at 12:30, it is 16 8 .5 ft. high (18 0 11.5). At 12:15 and 12:45, the end of the minute hand is 18 0 ft. high.
How can the height of the minute hand above the ground be determined at other times? Imagine a unit circle centered on the clock.
At 12:10, the minute hand makes a �� 6 radian angle together with the ray through the 3 on the clock. Using the unit circle, sin� �� 6 � = 0.5. For a clock that has a radius of 1, the height of the end of the minute hand above the middle of the circle would be 0.5 ft. But this clock has a radius of 11.5, so the end of the minute hand is 5.75 ft. above the center of the clock since 5.75 = 0.5⋅11.5. Taken together with the center of the clock being 18 0 ft. off the ground, the end of the minute hand is 18 5.75 ft. above ground.
ManuscriptCopy

At what time would the end of the minute hand be 174.25 ft. above the ground? Since 174.25 = 18 0 5.75, this means that the tip of the minute hand is 5.75 ft. below the center of the clock, and this is 5.75 11.5 , or 1 2 , times its length. Using the unit circle again, the 2 angles where sin(��)= 1 2 are 7�� 6 and 11�� 6 . This means the end of the minute hand is 174.25 ft. off the ground at 40 and 20 min. after the hr.
Practice Problems
1. Which statements are true? Select all that apply.
□ sin(��)>0 for an angle �� in quadrant 2
□ cos(��)>0 for an angle �� in quadrant 2
□ tan(��)>0 for an angle �� in quadrant 2
□ sin(��)>0 for an angle �� in quadrant 3
□ cos(��)>0 for an angle �� in quadrant 3
□ tan(��)>0 for an angle �� in quadrant 3
2. The center of a clock is at (0, 0) in a coordinate system, and the minute hand is 10 in. long. Find the approximate coordinates of the tip of the minute hand at:
a. 12:05 p.m.
b. 12:45 p.m.
c. 12:55 p.m.
3. The center of a Ferris wheel is 100 ft. off the ground and its radius is 8 5 ft. The point �� is at the 0 radian position, �� is rotated 7�� 12 radians from ��, and �� is rotated 5�� 4 radians from ��.
For each point ��, ��, and ��, find how high the position on the Ferris wheel is off the ground. Write an expression using the sine or cosine function and estimate the value.

4. A Ferris wheel has a radius of 50 ft., and its center is 6 0 ft. off the ground. How many points on the Ferris wheel are:
a. 30 ft. off the ground?
b. 110 ft. off the ground?
c. 5 ft. off the ground?
Review Problems
5. A wheel has a radius of 1 ft. The center of the wheel is point ��.
a. Indicate where the point �� will be after the wheel rotates counterclockwise around its center 1 ft. Label this point ��.
b. What is the measure of ∠������ in radians?
c. Indicate where the point �� will be after the wheel rotates counterclockwise around its center 3�� 2 ft. Label this point ��.
d. What is the measure of ∠������ in radians?

6. Angle �� corresponds to a point (��, ��) on the unit circle in quadrant 1.
a. Which quadrant does ��+ �� lie in?
b. In terms of �� and ��, what are the coordinates of ��+ ��?
Unit 8, Lesson 7: Rising and Falling
Warm-Up: Notice and Wonder: A Bouncing Curve
What do you notice? What do you wonder?
ManuscriptCopy

Exploration Activity: What
Is Happening?
Here are some relationships that produce graphs that have a repetitive nature. For each situation, describe the dependent and independent variables. How does the dependent variable change? What might cause this change?
1. This is the graph of the distance of a race car from the starting line as it goes around a track.
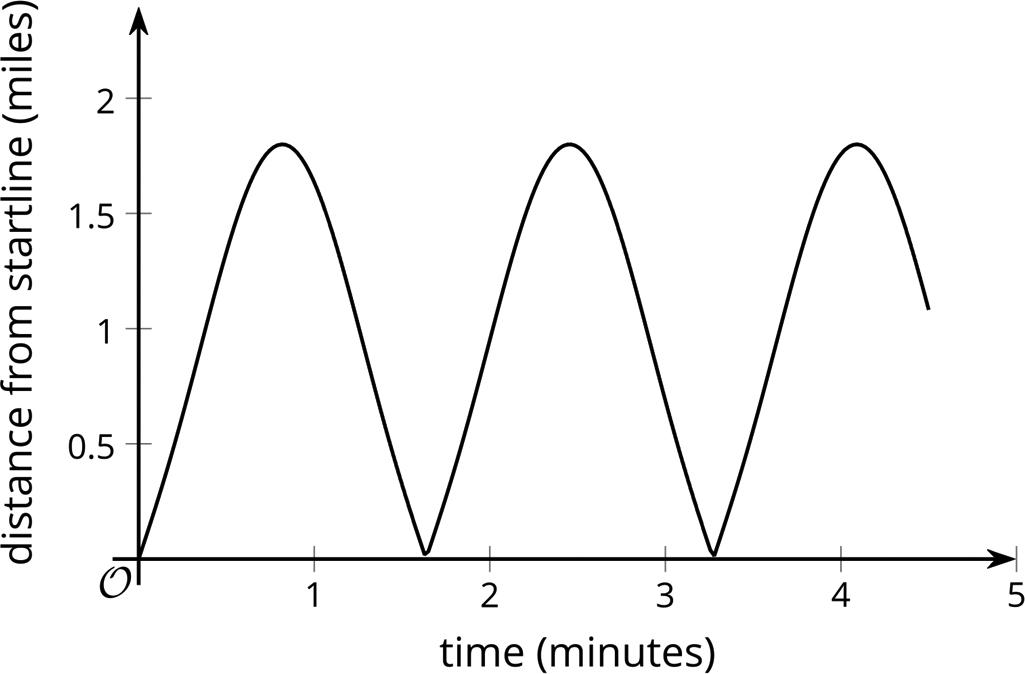
2. This is the graph of the temperature in a city in Australia over 21 days.
3. This is the graph of two populations over time.
ManuscriptCopy


Collaborative Activity: Card Sort: Graphs of Functions
Your teacher will give you a set of cards that show graphs.
1. Sort the cards into categories of your choosing. Be prepared to describe your categories.
Pause for a whole-class discussion.
ManuscriptCopy
2. Sort the cards into new categories in a different way. Be prepared to describe your new categories.
Lesson Summary
A variety of real-world phenomena go through cycles.
• The Sun (and the Moon) rise and fall regularly each day.
• The seasons repeat regularly every year.
• Tides come in and go out at regular intervals.
Some of these of events are measurable, and functions can be created to model and study their patterns.
For example, imagine there is a spot of paint on a bike tire that has a 26-inch (in.) diameter. The height of the spot above the ground as the bike moves can be observed to create a table of values and a graph. The table and graph show the relationship between the distance the bike has traveled and the height of the spot above the ground, in inches.

ManuscriptCopy
Some observations about the situation can be made using the graph. For example, the height of the paint spot will never be less than 0 or greater than 26 in. above the ground. This makes sense for the situation because the tire will not go belowground, and it can only reach 26 in. above the ground, the wheel’s diameter. The height of the paint spot will go up and down in a repeating pattern as the tire rotates.
This type of relationship is called periodic function because it represents something that happens over a certain interval and then repeats.
A periodic function is a function whose values repeat at regular intervals.
Every periodic function repeats the same pattern each period.
A period is the length of an interval at which a periodic function repeats.
ManuscriptCopy
Practice Problems
1. A fan blade spins counterclockwise once per second.
Which of these graphs best depicts the height, ℎ, of �� after �� seconds (sec.)? The fan blades are 1 foot (ft.) long and the height is measured in feet from the center of the fan blades.


2. Which situations are modeled accurately by a periodic function? Select all that apply.
□ the distance from the Earth to the Sun as a function of time
□ the vertical height of a point on a rotating wheel as a function of time
ManuscriptCopy
□ the area of a sheet of paper as a function of the number of times it is folded in half
□ the number of centimeters in �� inches
□ the height of a swinging pendulum as a function of time
□ the height of a ball tossed in the air as a function of time
3. Here is the graph of a function for some values of ��.

a. Can you extend the graph to the whole plane so that the function �� is periodic? Explain your reasoning.
b. Can you extend the graph to the whole plane so that the function �� is not periodic? Explain your reasoning.
ManuscriptCopy
a. Can a nonconstant linear function be periodic? Explain your reasoning.
b. Can a quadratic function be periodic? Explain your reasoning.
Review Problems
5. The measure of angle �� is between 0 and 2�� radians. Which statements must be true of sin(��) and cos(��)? Select all that apply.
□ cos2(��) + sin2(��) = 1
□ If sin(��) = 0, then cos(��) = 1 .
□ If sin(��) = 1 , then cos(��) = 0.
□ cos(��) + sin(��)= 1
□ The point (cos(��),sin(��)) lies on the unit circle.
6. The center of a clock is the origin (0, 0) in a coordinate system. The hour hand is 4 units long. What are the coordinates of the end of the hour hand at:
a. 3:00
b. 8:00
ManuscriptCopy
c. 11:00
Unit 8, Lesson 8: Exploring the Cosine Function
Warm-Up: An Angle and a Circle
Suppose there is a point �� on the unit circle at (1, 0).

1. Describe how the ��-coordinate of �� changes as it rotates once counterclockwise around the circle.
2. Describe how the ��-coordinate of �� changes as it rotates once counterclockwise around the circle.
Exploration Activity: Do the Wave
This activity requires the use of an applet, so please make your way over to the digital platform to find the link.
Use the class display, the table from a previous lesson, or the applet to estimate the value of �� = cos(��), where �� is the measure of an angle in radians.
1. Use technology to plot the values of �� = cos(��), where �� is the measure of an angle in radians.

2. Explain why any angle measure between 0 and 2�� produces a point on the graph.
3. Could this graph represent a function? Explain your reasoning.
ManuscriptCopy
Guided Activity: Exploring the Graph of a Cosine Function
Unit circle �� is shown, where ��∠������ = �� 6 and ��∠������ = �� 3 .
1. Determine the ��-coordinate of each point. Round to the nearest thousandth, if necessary. Point ��-coordinate
2. Discuss with your partner how the ��-coordinates in the first quadrant can be used to determine the ��-coordinates of central angles that are multiples of �� 6 and extend counterclockwise from point ��. Summarize your discussion.
3. Complete the table.
4. What do you notice about the ��-coordinates?
5. The grid shown has the horizontal axis labeled as angle measure, in radians, and the vertical axis as the ��-coordinate. Use the coordinate plane to plot the values in the table.
6. Discuss with your partner if the domain of angle measure is restricted to angle measures between 0 and 2��. Summarize your discussion.
ManuscriptCopy
7. Use a calculator set to radian mode to complete the table for the equation �� = cos(��). Round to the nearest thousandth, if necessary.
8. Use the coordinate plane shown to plot �� = cos(��) using the values in the table.
ManuscriptCopy
Collaborative Activity: Evaluating the Cosine Function
1. Function (��) is defined as (��) = cos(��). Evaluate each of the following. Round to the nearest thousandth, if necessary.
2. Determine the ��-value, between 0 and 2�� radians, that will make each statement true.
a. ��(��)= 1
b. ��(��)= − 1 2
c. ��(��)≈0.8660
ManuscriptCopy
Lesson Summary
The unit circle can be used to determine the value of cos(��) for any angle measure �� between 0 and 2�� radians. For an angle ��, starting at the positive ��-axis, there is a point �� where the terminal ray of the angle intersects the unit circle. The coordinates of that point are (cos(��)), sin(��)).

The horizontal location is defined by the ��-coordinate, which is cos(��). The graph �� = cos(��) is shown.
When �� = 0, �� = 1 because the coordinates of the point at 0 radians on the unit circle are (1, 0). The graph then decreases to − 1 (the smallest ��-value on the unit circle) before increasing back to 1. This periodic function repeats the same pattern over the next interval [2��, 4��], and each subsequent interval.

Practice Problems
1. Angle ��, measured in radians, satisfies cos(��) = 0. What could the value of �� be? Select all that apply. o 0 o �� 4 o �� 2 o �� o 3�� 4
2. The graphs of 2 functions are shown.
Which graph represents �� = cos(��)? Explain how you know.
ManuscriptCopy

3. Use the function ��(��)= cos(��) to determine ��� 5�� 4 �. Round to the nearest thousandth, if necessary.
4. Use the function ��(��)= cos(��) to determine the value of �� when ��(��)= − 1 2 .
Review Problems
5. The minute hand on a clock is 1.5 feet (ft.) long. The end of the minute hand is 6 ft. above the ground at one time each hour. How many ft. above the ground could the center of the clock be? Select all that apply.
o 4.5
o 5 o 6 o 7 o 7.5
6. Here is a graph of the water level height, ℎ, in ft., relative to a fixed mark, measured at a beach over several days, ��.

a. Explain why the water level is a function of time.
b. Describe how the water level varies each day.
ManuscriptCopy
c. What does it mean in this context for the water level to be a periodic function of time?
ManuscriptCopy
Unit 8, Lesson 9: Exploring the Sine Function
Warm-Up: All the Way Around
A unit circle is shown with point �� marked at (1, 0). For each angle of rotation listed, mark the point on the unit circle. Be prepared to explain your reasoning.
ManuscriptCopy

Exploration Activity: Do The Wave, Again
These activities require the use of an applet, so please make your way over to the digital platform to find the link.
Use the class display, the table from a previous lesson, or the applet to estimate the value of �� = sin(��), where �� is the measure of an angle in radians.
1. Use technology to plot the values of �� = sin(��), where �� is the measure of an angle in radians.

2. Explain why any angle measure between 0 and 2�� produces a point on the graph.
3. Could this graph represent a function? Explain your reasoning.
ManuscriptCopy
Collaborative Activity: Exploring the Graph of a Sine Function
Unit circle �� is shown, where ��∠������ = �� 6 and ��∠������ = �� 3 .
1. Determine the �� -coordinate of each point. Round to the nearest thousandth, if necessary.
2. Discuss with your partner how the �� -coordinates in the first quadrant can be used to determine the �� -coordinates of central angles that are multiples of �� 6 and that extend counterclockwise from point ��. Summarize your discussion.
3. Complete the table.
4. What do you notice about the �� -coordinates?
5. The grid shown has the horizontal axis labeled as angle measure, in radians, and the vertical axis as the �� -coordinate. Use the coordinate plane to plot the values in the table.
6. Discuss with your partner if the domain of angle measure is restricted to angle measures between 0 and 2��. Summarize your discussion.
ManuscriptCopy
7. Use a calculator set to radian mode to complete the table for the equation �� = sin(��).
8. Use the coordinate plane shown to plot �� = sin(��) using the values in the table.
ManuscriptCopy
Guided Activity: Graphs of Sine and Cosine Functions
1. The graphs of ��(��)= cos(��) and ��(��)= sin(��) are shown.
a. Discuss with your partner how to determine which is the cosine function and which is the sine function. Summarize your discussion.
b. Reference the unit circle to explain why the cosine and sine functions have similar graphs.
ManuscriptCopy
2. Use functions ��(��)= cos(��) and ℎ(��) = sin(��) to determine each of the following. Round to the nearest thousandth, if necessary.
a. ℎ(��) = 1
b. ��(��)= 1 2
3. Use the graphs of �� and ℎ to determine when ��(��)= ℎ(��). Explain your reasoning.
4. Explain why the maximum and minimum values are the same for the graphs of �� (��) and ℎ(��).
ManuscriptCopy
Lesson Summary
The unit circle can be used to determine the value of sin(��) for any angle measure �� between 0 and 2�� radians. For an angle ��, starting at the positive ��-axis, there is a point �� where the terminal ray of the angle intersects the unit circle. The coordinates of that point are (cos(��), sin(��)).
The vertical location is defined by the �� -coordinate, which is sin(��). The graph �� = sin(��) is shown.
Using the graph, when �� = 0, �� = 0 because the �� -coordinate of the point at 0 radians on the unit circle is (0, 0). The graph then increases to 1 (the largest �� - value on the unit circle) before decreasing to − 1 after passing through 0 when the angle measure is ��. The sine graph returns back to 0 for the angle 2��.


The functions �� = cos(��) and �� = sin(��) are both periodic functions, meaning their values repeat at regular intervals. Since the period of cosine and sine is 2��, the values of these functions repeat by a multiple of 2�� any time the input changes. The periodic functions �� = sin(��) and �� = cos(��) each repeat the same wave pattern as they do on the interval [0, 2��] over the next interval [2��,4��] and previous interval [−2��, 0]. These patterns continue infinitely in both directions.
Practice Problems
1. Which statement is not true for the function �� given by �� = sin(��), for values of �� between 0 and 2��?
A. The outputs of the function range from − 1 to 1.
B. sin�� = 1 only when �� = �� 2
C. sin�� = 0 only when �� = 0
D. sin�� > 0 for 0 < ��< ��
2. The graphs of 2 functions are shown.

Which graph represents �� = sin(��)? Explain how you know.
3. Which statements are true for both functions �� = cos(��) and �� = sin(��)? Select all that apply.
□ The function is periodic.
□ The maximum value is 1.
□ The maximum value occurs at �� = 0.
□ The period of the function is 2��.
□ The function has a value of about 0.71 when �� = �� 4 .
□ The function has a value of about 0.71 when �� = 3�� 4 .
ManuscriptCopy
Review Problem
4. Do (7, 1) and ( − 5, 5) lie on the same circle centered at (0, 0)s? Explain how you know.
ManuscriptCopy
Unit 8, Lesson 10: Amplitude and Midline
Warm-Up: Comparing Parabolas
Match each equation to its graph. Be prepared to explain how you know which graph belongs with each equation.

Exploration Activity: Blowing in the Wind
Suppose a windmill has a radius of 1 meter (m) and the center of the windmill is (0, 0) on a coordinate grid.
1. The function ℎ(��) = sin �� can be used to model the relationship between the height, ℎ, of point �� and the angle of rotation, ��. Explain why the sine function is used to model this scenario.
2. Describe how the function and its graph would change if each of the following changes were applied.
a. The windmill blade has length 3 m.

b. The windmill blade has length 0.5 m.
3. Graphs of 3 functions, A, B, and C, are shown on the coordinate plane. Identify the graph that represents each windmill.
a. Windmill blade has length 1 m.
b. Windmill blade has length 3 m.
c. Windmill blade has length 0.5 m.
Guided Activity: Up, Up, and Away
A windmill has radius 1 m and its center is 8 m off the ground. The point �� starts at the tip of a blade in the position farthest to the right and rotates counterclockwise.
1. Bria wrote the function �� = 8 cos(��) to model the relationship between the height, ℎ, of point ��, in m, and the angle of rotation, ��. Bria made errors in her function. Explain what errors Bria made, and correct the equation.
2. The function to model the height of point �� as it rotates counterclockwise on the windmill is shown. How does it compare to the graph where the center of the windmill is at (0, 0)?
3. What would the graph look like if the center of the windmill were 11 m off the ground? Explain how you know.
Lesson Summary
Suppose a bike wheel has a radius of 1 foot (ft.). The height, ℎ, of point �� on the wheel as it spins in a counterclockwise direction can be modeled using the function ℎ(��) = sin (��) + 1, where �� is the angle of rotation of the wheel. As the wheel spins in a counterclockwise direction, the point first reaches a maximum height of 2 ft. when it is at the top of the wheel and then a minimum height of 0 ft. when point �� is at the bottom.

The graph of the height of �� looks just like the graph of the sine function, but the graph is shifted up by 1 unit.
The horizontal line ℎ = 1, shown as the dashed line on the graph, is called the midline.
The midline is the value halfway between the maximum and minimum values of a period function.
Up to this point, the midline of all the functions analyzed in this unit has been �� = 0.
Consider another bike with a wheel that has a radius of 11 inches (in.). How would that affect the height, ℎ, in inches, of point �� over time? This wheel can be modeled by the sine function ℎ(��) = 11 sin (��) + 11, where �� is the angle of rotation of the wheel. The graph of this function has the same shape as the sine function, but its midline is at ℎ = 11, and the amplitude of the new function, shown here with a dashed vertical line, is different.
ManuscriptCopy


The amplitude is the maximum distance of the values of period function above or below the midline.
For the graph shown, the midline has an equation of ℎ = 11, the maximum value is 22, and the minimum value is 0. This means the amplitude of the function modeling the height of point �� on the wheel is 11.
Practice Problems
1. For each trigonometric function, indicate the amplitude and midline.
a. �� = 2sin (��)
b. �� = cos(��) − 5
c. �� = 1.4sin (��) + 3.5
2. Here is a graph of the equation �� = 2sin (��) − 3.
a. Indicate the midline on the graph.
b. Use the graph to find the amplitude of this sine equation.
ManuscriptCopy

3. Select all trigonometric functions with an amplitude of 3.
□ �� = 3sin (��) − 1
□ �� = sin (��) + 3
□
�� = 3cos(��) + 2
□ �� = cos(��) − 3
□ �� = 3sin (��)
□ �� = cos(�� − 3)
4. The center of a windmill is 20 ft. off the ground and the blades are 10 ft. long. Fill out the table showing the vertical position of �� after the windmill has rotated through the given angle.
Review Problems
ManuscriptCopy

5. The measure of angle ��, in radians, satisfies sin (��)<0. If �� is between 0 and 2�� what can you say about the measure of ��s?
Unit 8, Lesson 11: Digging Deeper into Trigonometric Functions
Warm-Up: Translated Parabolas
Match each equation with its graph. Be prepared to explain your reasoning.
ManuscriptCopy

Collaborative Activity: Windmills Everywhere
Here are three equations for three different windmills. Each equation describes the height, ℎ, in feet (ft.) above the ground, of a point at the tip of a blade of a different windmill. The point is at the far right when the angle �� takes the value 0. Describe each windmill and how it is spinning.
ManuscriptCopy
1. ℎ = 2.5sin(��)+ 10
2. ℎ = 4 5 sin(��)+3
3. ℎ = − 1.5sin(��)+5
Collaborative Activity: Graphs of Trigonometric Functions
1. The graph shows 3 different transformations of the sine function.
a. Which transformation has the same midline as (��) = sin(��)?
b. Which transformation has a different midline than (��) = sin(��)?
c. Which transformation has a different amplitude than (��) = sin(��)?
d. Which transformation is a horizontal shift of (��) = sin(��)?
e. Match the transformation to the graph. Function
2. Two periodic functions are shown, where �� is measured in radians.
ManuscriptCopy
a. Complete the statements.
�� = −3 cos (��).
The blue graph is
The orange graph is
�� = −2 cos (��).
�� = 2 cos (��).
�� = 3 cos (��).
�� = −3 cos (��).
�� = −2 cos (��).
�� = 2 cos (��).
�� = 3 cos (��).
b. What strategies were most helpful in determining the correct equation for each graph?
Lesson Summary
The graphs of cosine and sine functions can be translated vertically or horizontally, and the size or height of their graphs can also be modified similar to how other functions were transformed in previous units. The equation of a trigonometric function may include values that transform the parent function of �� = sin(��).
For example, consider the transformed function �� = 2 sin(��) + 3.
• The coefficient 2 stretches the graph vertically, doubling the amplitude of the sine graph. This means that the distance from the midline to the maximum or minimum value of the function is now 2 instead of 1.
• Adding 3 to the equation translates the midline up by 3 units to �� = 3.
ManuscriptCopy
The graph of �� = 2sin(��) + 3 is shown.

ManuscriptCopy
Similarly, the graph of �� = sin(��) can be translated to the left. For example, consider the graph of �� = sin ���+ �� 2 �. The graph of this function looks just like the graph of �� = sin(��) translated to the left by �� 2 . This translation also looks like �� = cos(��).

Practice Problems
1. These equations model the vertical position, in ft. above the ground, of a point at the end of a windmill blade. For each function, indicate the height of the windmill and the length of the windmill blades.
a. �� = 5sin(��) + 10
b. �� = 8sin(��) + 20
c. �� = 4sin(��) + 15
2. Here is a graph of a trigonometric function.
Which equation does the graph represent?
A. �� = 2sin(��)
B. �� = 2cos ���+ �� 4 �
C. �� = 2sin ���− �� 4 �
D. �� = 2cos ���− �� 4 �
ManuscriptCopy

3. The vertical position �� of a point at the tip of a windmill blade, in ft., is given by ν(��) = 11+ 2sin ���+ �� 2 � . Here �� is the angle of rotation.
a. How long is the windmill blade? Explain how you know.
b. What is the height of the windmill? Explain how you know.
c. Where is the point �� when �� = 0 ?
Review Problems
4. The function �� is given by ��(��)= ��2 .
a. Write an equation for the function �� whose graph is the graph of �� translated 3 units left and then reflected over the �� -axis.
b. Write an equation for the function ℎ whose graph is the graph of �� reflected over the �� -axis and then translated 3 units to the left.
c. Do �� and ℎ have the same graph? Explain your reasoning.
ManuscriptCopy
5. Match the trigonometric equations with their graphs.

Equation
�� = 3cos(��) − 2
�� = 2cos(��) − 3
�� = 3sin(��) − 2
�� = 2sin(��) − 3
ManuscriptCopy
Graph
Graph 1
Graph 2
Graph 3
Graph 4
ManuscriptCopy
Unit 8, Lesson 12: Features of Trigonometric Graphs
Warm-Up: Notice and Wonder: Musical Notes
Here are pictures of sound waves for two different musical notes.

What do you notice? What do you wonder?
ManuscriptCopy
Exploration Activity: Equations and Graphs
Match each equation with its graph. More than 1 equation can match the same graph.

1. �� = - cos(��)
2. �� = 2sin(��) − 3
3sin(��)
Collaborative Activity: Exploring Transformed Functions
1. Four functions are shown on the coordinate plane.
a. Match the transformation to the graph.
�� = 3cos(��)
�� = cos(�� − 2)
�� = 1sin(��)
�� = sin(��) − 2
b. Use each function’s key features to justify your choices in part A.
Guided Activity: Determining the Period of a Periodic Function
1. Complete the table of values for the expression sin(2��).
2. Plot the values and sketch a graph of the equation �� = sin(2��).

3. How does the graph of �� = sin(2��) compare to the graph of �� = sin(��)?
4. Predict how the graph of �� = cos(4��) would compare to the graph of �� = cos(��).
Lesson Summary
The amplitude and midline of a trigonometric function can be determined using the graph or from an equation.
For example, consider the function �� = 3 cos��� + �� 4 � + 2 and its graph.
• The function has a vertical translation up by 2. This means the horizontal line �� = 2 goes through the middle of the graph and is the midline of the function.
• The amplitude of the function is 3. This means the maximum value of this cosine function is 5, 3 more than the midline value, and the minimum value is − 1, 3 less than the midline value.
• The horizontal translation is �� 4 to the left, so instead of having, for example, a minimum at ��, the minimum of this function occurs at �� = 3�� 4 .

Another type of transformation is one that affects the period of the function, which is when a horizontal scale factor is applied to the parent function. For example, consider �� = cos(2��), where the variable �� is multiplied by a number. Here, 2 is the scale factor affecting ��.
• When �� = 0, 2�� = 0 so the graph of this cosine equation starts at (0, 1), just like the graph of �� = cos(��).
• When �� = ��, 2�� = 2��, so the graph of �� = cos(2��) goes through 1 full period between �� = 0 to �� = �� and 2 full periods in the same horizontal span it takes �� = cos(��) to complete 1 full period, as shown in their graphs.

Notice that the graph of �� = cos(2��) has the same general shape as the graph of �� = cos(��) (same midline and amplitude), but the waves are compressed together. A cosine function with a stretched wave would include a horizontal scale factor between 0 and 1. For example, the graph of �� = cos� �� 6 � has a period of 12��, which means that 1 full period is completed between �� = 0 and �� = 12��.
Practice Problems
1. Here is a graph of a trigonometric function. Which equation could define this function?

A. �� = 1.5sin(��) − 4
B. �� = 1.5cos(��) − 4
C. �� = 4sin(1.5��)
D. �� = 4cos(1.5��)
2. Select all the functions that have period ��.
3. The functions �� and �� are given by (��) = cos(��) and ��(��)= cos(5��). How are the graphs of �� and �� related?
Review Problems
4. A Ferris wheel has a radius of 95 feet (ft.) and its center is 105 ft. above the ground. Which statement is true about a point on the Ferris wheel as it goes around in a circle?
A. It is 85 ft. off the ground once in quadrant I and once in quadrant II.
B. It is 85 ft. off the ground once in quadrant II and once in quadrant III.
C. It is 85 ft. off the ground once in quadrant III and once in quadrant IV.
D. It is 85 ft. off the ground once in quadrant IV and once in quadrant I.
5. Here is a graph of �� = sin(��).
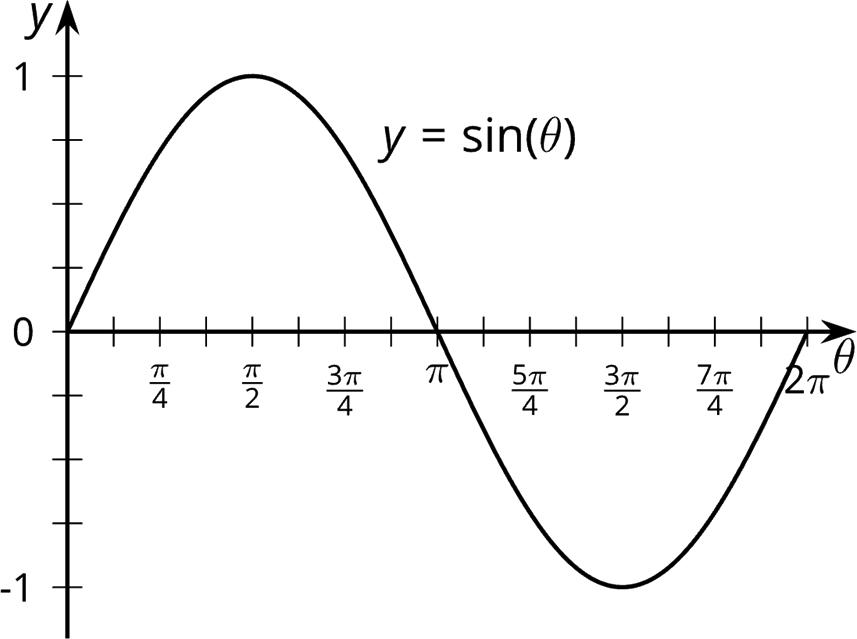
a. Plot the points on the graph where sin(��) = 1 2 .
b. For which angles �� does sin(��) = 1 2 ?
ManuscriptCopy
ManuscriptCopy
Unit 8, Lesson 13: Exploring Periods of Trigonometric Graphs
Warm-Up: Which One Doesn’t Belong: Graph Periods
Which one doesn’t belong?
ManuscriptCopy

Guided Activity: Any Period
1. For each graph of a trigonometric function, identify the period.
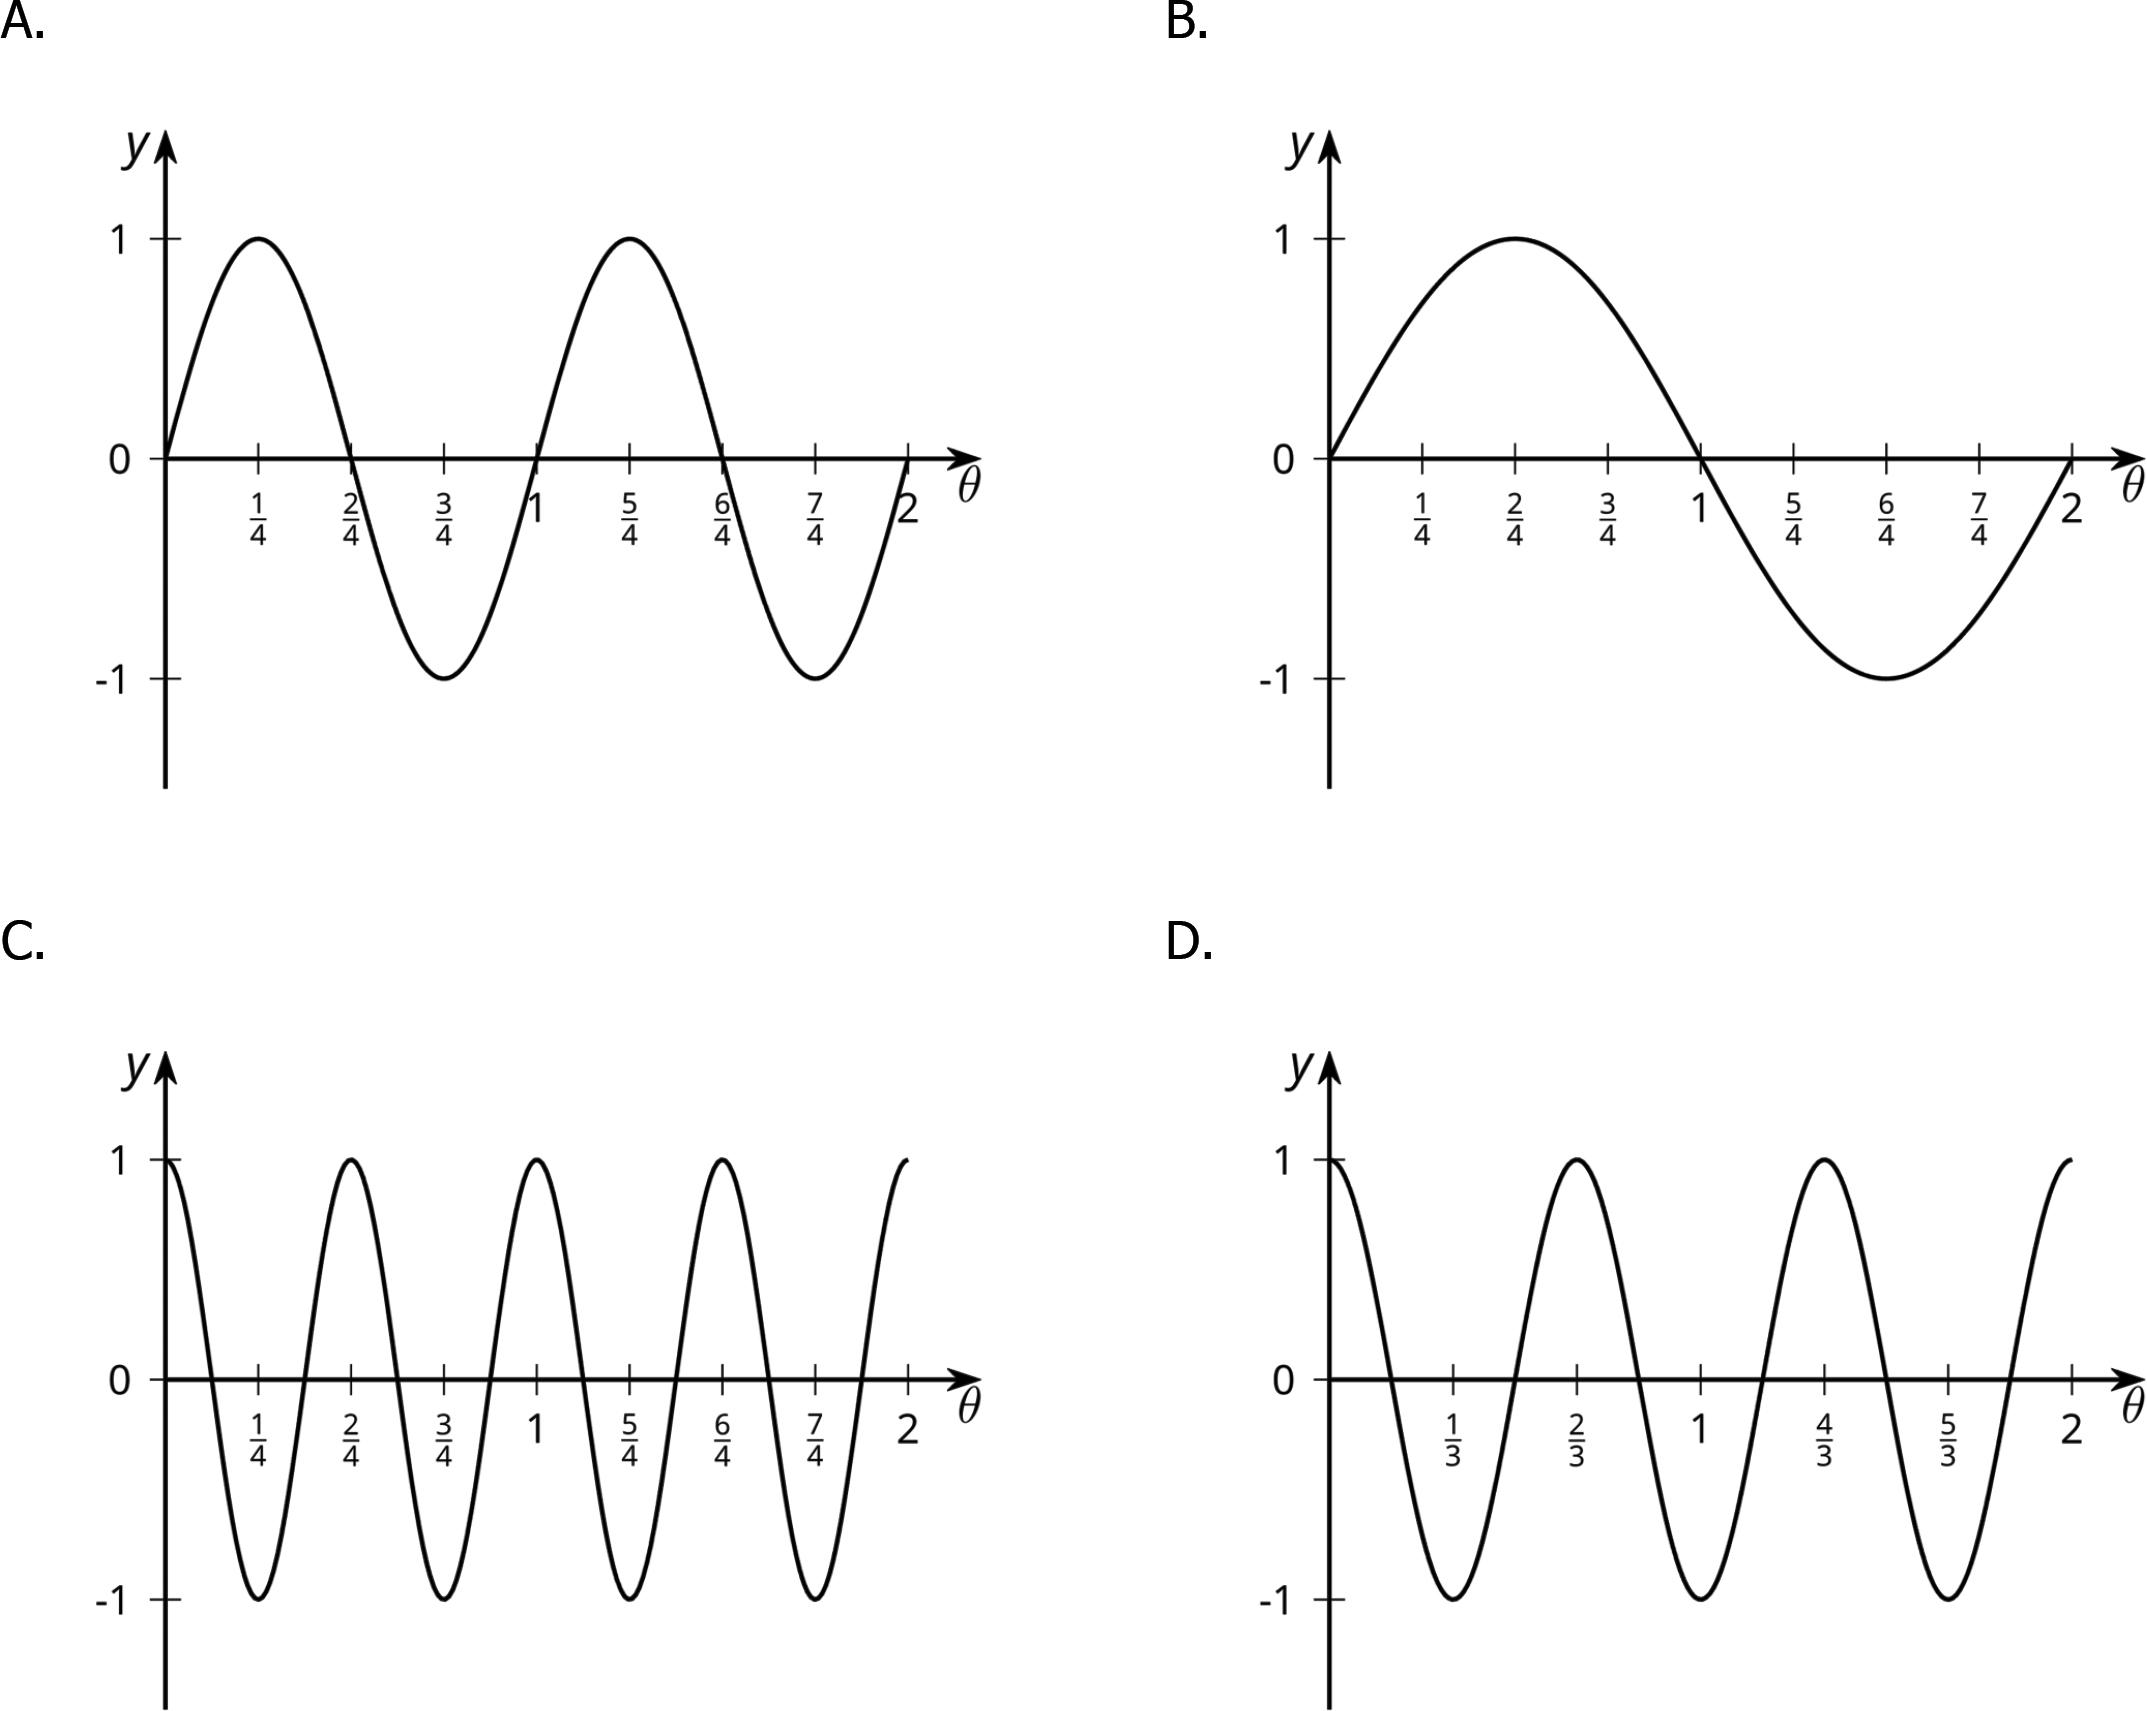
ManuscriptCopy
2. Here are some trigonometric functions. Find the period of each function.
FunctionPeriod
�� = cos(��) �� = cos(3��)
= sin(6��)
= sin(10��)
3. What is the period of the function �� = cos(����)? Explain your reasoning.
4. Identify a possible equation for a trigonometric function with this graph.

ManuscriptCopy
Collaborative Activity: Around the World’s Largest Ferris Wheel
The world’s tallest Ferris wheel is in Las Vegas. The height, ℎ, in feet (ft.) of 1 of the passenger seats on the Ferris wheel can be modeled by the function ��(��)= 275 + 260sin� 2���� 30 �, where time �� is measured in minutes (min.) after 8:00 a.m.
1. What is the diameter of the Ferris wheel? Explain how you know.
2. How long does it take the Ferris wheel to make a complete revolution? Explain how you know.
3. Give at least 3 different times when the passenger seat modeled by �� is at its lowest point. Explain how you know.
ManuscriptCopy
Lesson Summary
A point �� is shown on a wheel.
• Imagine the height, ℎ, of ��, in ft., relative to the center of the wheel after �� seconds (sec.) is given by the equation ℎ = sin(2����). When �� = 1, that is, after 1 sec., the wheel will be back where it started. It will return to its starting position every second.
• Suppose the equation ℎ = sin(4����) represents the height of ��. In this case, when �� = 1, the wheel has made 2 complete revolutions, so it makes 1 complete revolution in 0.5 sec. The graphs of these 2 functions are shown.


The midline for both functions is the ��-axis, and the amplitude is 1. The only difference between the 2 functions is the period, or how long it takes each function to complete 1 full revolution.
In a different situation, the wheel has a radius of 11 inches (in.), so the center of the wheel is 11 in. off the ground, and the wheel completes 2 revolutions per sec. The graph of this function is shown.
Notice that the midline is �� = 11 and the amplitude is 11. The equation defining this relationship is ℎ = 11sin(4����) + 11, where ℎ is the height, in inches, of the point on the wheel after �� sec.

Practice Problems
1. A wheel rotates three times per sec. in a counterclockwise direction. The center of the wheel does not move. What angle does the point �� rotate through in one sec.?
A. 2�� 3 radians
B. 2�� radians
C. 3�� radians
D. 6�� radians

2. A bicycle wheel is spinning in place. The vertical position of a point on the wheel, in inches, is described by the function ��(��) = 13.5 sin(5 ⋅ 2����)+ 20. Time, ��, is measured in sec.
a. What is the meaning of 13.5 in this context?
b. What is the meaning of 5 in this context?
c. What is the meaning of 20 in this context?
ManuscriptCopy
3. Each expression describes the vertical position, in ft. off the ground, of a carriage on a Ferris wheel after �� min. Which function describes the largest Ferris wheel?
A. 100sin� 2���� 20 � + 110
B. 100sin� 2���� 30 � + 110
C. 200sin� 2���� 30 � + 210
D. 25 0sin� 2���� 20 � + 260
4. Which trigonometric function has period 5 ?
A. ��(��)= sin�
B. ��(��)= sin(5 ��)
C. ��(��)= sin� 5 2�� ���
D. ��(��)= sin� 5 2�� ���
5. What is the period of the function �� given by ��(��)= cos(4����)? Explain how you know.
6. The function �� is given by ��(��)= 6 + 5 cos(��+ �� 2 ). Which of the following are true of ��? Select all that apply.
□ The amplitude of �� is 6.
□ The function �� takes its maximum value when �� = 0.
□ The midline of �� is �� = 6.
□ The graph of �� is the same as the graph of ��(��)= 6 + 5 cos(��) translated to the right by �� 2 .
□ The graph of �� is the same as the graph of ��(��)= 6 + 5 cos(��) translated to the left by �� 2 .
ManuscriptCopy
ManuscriptCopy
ManuscriptCopy
Unit 9, Lesson 1: Introducing Matrices
Warm-Up: Number Puzzle
1. Which number should replace the question mark? 12 × 12 = 9 23 × 23 = 16 34 × 34 = ?
Guided Activity: Introduction to Matrices
One way to organize data is using a matrix, which is a rectangular arrangement of numbers or variables.
1. Consider matrix �� = 2 −1 0 4
a. Complete the statements.
The matrix �� has rows and columns, which means �� has dimensions Matrix �� is a matrix because { the number of rows and columns are the same. { the number of rows and columns are different. { 1 { 2 { 4 { 1 { 2 { 4 { 2 × 2. { 4 × 1. { 1 × 4. { square { rectangular
Each entry in matrix �� can be described as ������, where �� is the entry’s row and �� is the entry’s column.
b. Identify the value of each entry described.
2. Matrices �� =
a. What is the size of matrices �� , �� , and �� ?
b. What is the value of ��22?
c. What is the value of ��12?
d. What is the value of ��21?
2. To raise money for new uniforms, a local high school football team hosted a spirit sale. They sold T-shirts and hats during the JV and varsity games and at the school store. The team purchased each item wholesale. The wholesale prices they paid were $6.00 per T-shirt and $4.00 per hat. They sold the T-shirts for $15.00 each and the hats for $10.00 each.
In the first month of school, they sold 50 T-shirts and 15 hats at the school store. During the same time, 40 T-shirts and 10 hats were sold at the JV football games, and 60 T-shirts and 30 hats were sold at the varsity football games.
a. Complete the statement.
The team made _______ in profit per T-shirt sold and _______ in profit per hat sold.
b. Write and label matrix �� to represent how many of each item they sold and how much of a profit they made on each item.
c. Write and label matrix �� to represent how many of each item sold at the school store and at the football games.
d. Write and label matrix �� to represent the total profit made from each item sold at the school store and at the football games.
ManuscriptCopy
Collaborative Activity: Writing Matrices to Model Real-World Scenarios
1. A survey was conducted in an English class and a math class to determine which type of ice cream was most popular. In the English class, 15 students preferred vanilla, and 8 students preferred chocolate. In the math class, 11 students preferred vanilla, and 14 students preferred chocolate.
Write and label matrix �� to represent this data, and identify its size.
2. The given table represents the cost of 2 different lunches that are sold at an elementary school and how many of each lunch were sold on a single day.
a. How much money did the cafeteria collect selling both lunches?
b. Write and label matrix �� to represent the cost per each lunch and the number of each lunch sold on a single day.
Lunch 1
c. Write and label matrix �� to represent the cost per each lunch and the total amount collected for selling each lunch on a single day.
d. Write and label matrix �� to represent the number of lunches sold and the total amount collected for selling each lunch on a single day.
Lesson Summary
Data presented in multiple categories can be summarized as a matrix. A matrix is a rectangular array of numbers or variables.
Matrices (plural of matrix) are enclosed in [ ] or ( ) and are usually named by a capital letter like �� , �� , �� , and so on. The size (or dimensions) of a matrix is described as ����, where �� is the number of rows and �� is the number of columns.
• A row in a matrix is a set of numbers that are aligned horizontally.
• A column in a matrix is a set of numbers that are aligned vertically.
The values in the matrix are called its elements, or entries. Each entry can be described as ������, where �� is the entry’s row and �� is the entry’s column as shown.
ManuscriptCopy
In this course, you will explore matrices with size 2× 2. However, in future courses, additional work will be done with different sizes of matrices and the scenarios they may represent.
Practice Problems
1. The marching band, dance team, and theater department at Northport High School need new equipment and uniforms for next school year. The marching band estimates that they need $800 worth of new equipment and $1,200 for new uniforms. The dance team estimates that they need $500 worth of new equipment and $900 for new uniforms. The theater department estimates that they need $400 worth of new equipment and $1,050 for new uniforms.
a. Write and label matrix �� to represent the data for the marching band and dance team.
b. Write and label matrix �� to represent the data for the dance team and theater department.
2. Identify the value of each entry in matrix �� = 1 2 −1 0.3 4
.
ManuscriptCopy
3. Evaluate each of the following. a. tan �5�� 2 � b. sin �3�� 2 � c. cos �7�� 2 �
4. Which of the following is true for angle ��? Select all that apply. □ sin(��) <
ManuscriptCopy

ManuscriptCopy
Unit 9, Lesson 2: Scalar Multiplication with Matrices
Warm-Up: Entries in Matrices
Four matrices are shown.
ManuscriptCopy
1. Complete the table by selecting which matrices have the given value of the entry.
Guided Activity: Scalar Multiplication with Matrices
When multiplying a polynomial expression by a factor, the distributive property is applied such that the factor is multiplied by each term of the polynomial expression. The same property can be applied when multiplying a matrix by a factor. This is called a scalar multiplication.
1. Consider the matrix �� = 1 4 −2
a. Fill in the blanks to determine 3�� .
b. Determine 2�� .
c. Determine 1 2 �� .
2. Complete the statements.
Given the matrix �� = �� ��
�, the expression ���� represents a scalar multiplication where each element is { divided { multiplied { increased { decreased by ��. The resulting matrix is
ManuscriptCopy
3. Use scalar multiplication to determine the values of �� and �� in each of the equations.
ManuscriptCopy
Collaborative Activity: Modeling Real-World Scenarios Using Matrices
1. A local summer camp is comparing enrollments in their field trips from last summer and this summer. Last summer, 24 girls and 18 boys went on a field trip to the beach, and 16 girls and 25 boys went on a field trip to a water park.
a. Write and label matrix �� to represent the number of boys and girls that attended different field trips last summer.
b. This summer, the summer camp is expecting a 30% increase in field trip attendance. Write and label matrix �� to represent the expected enrollment for field trips this summer.
c. Approximately how many boys are expected to participate in field trips this summer?
d. Approximately how many girls and boys are expected to attend the water park field trip this summer?
Lesson Summary
Scalar multiplication, multiplying a matrix by a number, follows a similar process to multiplying a polynomial or numerical expression by a number. Like distributing a number to each term in a polynomial expression, the scalar is multiplied by each entry in a matrix. For example,
each entry is
ManuscriptCopy
by the scalar 5 2 , as shown.
Practice Problems
1. A local high school needs to increase its inventory of student desks and chairs in 2 of their classrooms. They estimate that 20% more equipment is needed. The current inventory for the items is shown in the table.
a. Write and label matrix �� to represent the current number of desks and chairs in the 2 classrooms.
b. Write and label matrix �� to represent the number of desks and chairs needed for the 2 classrooms.
c. Approximately how many additional desks and chairs does the school need to order?
2. Matrices
a. Find 1 2 �� .
b. Find 3�� .
c. Find 10�� .
Review Problems
3. A �� 2 radian rotation takes a point �� on the unit circle to a point ��. Which other radian rotation also takes point �� to point ��?
4. A windmill blade spins in a counterclockwise direction, making 1 full revolution every 5 seconds (sec.).
Which statements are true? Select all that apply.

□After 15 sec., the point �� will be in its starting position.
□After 1 5 of a sec., the point �� will be in its starting position.
ManuscriptCopy
□In 1 sec., the point �� travels through an angle of �� 5 .
□The position of �� repeats every 5 sec.
□The position of �� repeats every 10 sec.
A. 3�� 2
B. 4�� 2
C. 5�� 2
D. 7�� 2
Unit 9, Lesson 3: Adding Matrices
Warm-Up: What Can Happen to Integers?
What do you notice? What do you wonder?
• 7 ∙ 9 = 63
• 7 + 9 = 16
• 7 − 9 = −2
• 7 9 = 0.777 . . .
ManuscriptCopy
Exploration Activity: Exploring Addition of Matrices
Matrix ��, matrix ��, and their sum are shown.
1. With your partner, discuss the process for how the sum of the 2 given matrices, �� and ��, was determined. Summarize your discussion.
2. Determine 2��+ ��.
3. Determine ��+ 2��.
4. Complete the statements.
transitive
associative
a. Matrix addition is because ��+�� = �� + ��.
distributive
commutative
transitive
associative
b. Matrix addition is because (��+ ��) + �� =��+ (��+ ��) .
distributive
commutative
Collaborative Activity: Adding Matrices
Matrices ��, ��, ��, and �� are shown.
ManuscriptCopy
1.
2.
Lesson Summary
Matrices of the same size have the same number of rows and columns. Matrices of the same size can be added together by adding the corresponding entries in each matrix. Elements, or entries, are corresponding when they are in the same location in different matrices. For example, ��12 in matrix �� corresponds to ��12 in matrix ��.
For example, −3
includes the addition of 2 matrices and a scalar multiplication. The steps in the process of performing the operations are described and shown in the table.
Distribute the scalar to the second matrix.
Add corresponding elements in the 2 matrices.
Determine the sum of each element.
Because addition is commutative for matrices, the sum ��+ �� will have the same result as ��+ ��. Similarly to operations with numerical and algebraic expressions, multiplication is applied before addition.
ManuscriptCopy
1. Find
Practice Problems
2. Find
3. Find
Review Problems
4. Find
ManuscriptCopy
5. The sine of an angle �� in the second quadrant is 0.6. What is cos(��) ? Explain your reasoning.
ManuscriptCopy
Unit 9, Lesson 4: Subtracting Matrices
Warm-Up: Equivalent Polynomial Expressions
Rewrite each polynomial expression in standard form. Show your work.
1. 3�� + 2(�� 2 − 2) −5��
2. 5(2�� 2 − 4�� + 7) + 6��
3. (2�� + 6)− (5�� − 4)
Exploration Activity: More Operations with Matrices
Matrices �� and �� are shown.
1. Determine
2. Determine
3. Discuss with your partner how the expressions − �� + �� and ��− �� are similar.
4. Use the matrices ��
5. Complete the statements.
to complete the statements.
Collaborative Activity: Subtracting Matrices
Matrices ��, ��, ��, and �� are shown.
ManuscriptCopy
1. Find ��− ��.
2. Find ��− (��+ ��).
3. Find ��− 2��.
4. Find −2(��− 3��).
Lesson Summary
Matrix subtraction is similar to subtracting numerical and algebraic expressions in which like terms, or corresponding entries, are subtracted. Examples of subtracting different types of expressions are shown in the table.
Numerical Expression
Algebraic Expression
Notice that in matrix subtraction, only corresponding entries are combined. Because subtraction is neither commutative nor associative, subtracting matrix ��− �� will not result in the same difference as matrix ��− ��.
1. Find
Practice Problems
ManuscriptCopy
Review Problem
ManuscriptCopy
a. 4�� + ��
ManuscriptCopy
Unit 9, Lesson 5: Operations with Matrices
Warm-Up: Notice and Wonder
1. Four equations are shown.
5 ⋅ 11 = 55 5 + 11 = 16 5 − 11 = −6 5 ÷ 11 = 0.45
a. What do you notice?
b. What is 1 thing you wonder about the equations or operations?
ManuscriptCopy
Guided Activity: Using Matrices to Solve Real-World Problems
The board of trustees at a local university recently announced a 6% increase in tuition rates per credit hour. The current rates per credit hour are shown in the table for both undergraduate and graduate students who are residents and those who are nonresidents.
1. Write and label a matrix, ��, to represent the current rates per credit hour.
2. Write a different matrix, ��, to represent the new tuition rates per credit hour after the 6% increase in tuition.
3. Use the matrices from problems 1 and 2 to write an expression that represents the tuition cost for students who completed 60 credit hours before the tuition increase and those who completed 60 credit hours after the tuition increase.
4. How much does an undergraduate resident student pay for their tuition if their first 60 credits were at the original rate and the last 60 credits were at the increased rate?
ManuscriptCopy
Collaborative Activity: Determining Unknown Entries in Matrices
Matrices �� and �� are shown.
1. Find 3��− 4��.
2. Determine the values of �� and �� where 2��−�� = 13
3. Determine
4. Given 3��− 4�� + 6��= 13 22 10 4 �
, determine the entries in ��.
ManuscriptCopy
5. Discuss with your partner the strategies you used to determine unknown entries in equations with matrices.
Lesson Summary
Many properties of operations of real numbers also apply to matrices. For any samesize matrices ��, ��, and ��, the following properties are true.
Property Example
Commutative property of matrix addition �� +�� = �� + ��
Associative property of matrix addition (��+ ��) +
Distributive property ��(�� + ��) = ���� + ����
To determine unknown entries in a matrix, set the corresponding entries equal to each other.
For example, determine the entries in matrix ��
Combine corresponding entries to make 1 matrix on the left side of the equation.
Set each entry equal to the corresponding entry on the other side of the equation.
Solve for each unknown entry. ��11
Write the resulting entries as matrix ��
ManuscriptCopy
Practice Problems
1. Determine the values of ��, ��, and ��. 3
2. Given −2
ManuscriptCopy
, determine the entries in matrix ��.
3. Graph ��(��) = 3�� ��2 − 2��

4. Which of the statements describes the end behavior of ��(��) = (��− 3) (�� + 2) ��(�� + 2) ?
As �� → −∞, �� → ∞ and as �� → ∞, ��→ −∞.
As �� → −∞, �� → −2 and as �� → ∞, �� → −2. D. As �� → −∞, �� → 1 and as �� → ∞, ��→ 1.
ManuscriptCopy
A.
C.
ManuscriptCopy
Unit 10: Probability
ManuscriptCopy
Unit 10, Lesson 1: Sample Spaces
Warm-Up: Constraints
When rolling two standard number cubes, one of the possible outcomes is 1 and 1.
1. What are the other possible outcomes?
2. How many outcomes are in the sample space?
ManuscriptCopy
Exploration Activity: Revisiting Sample Space
Each of the spinners is spun once.

• Diego makes a list of the possible outcomes: ALW, ALX, ALY, ALZ, AMW, AMX, AMY, AMZ, ANW, ANX, ANY, ANZ, BLW, BLX, BLY, BLZ, BMW, BMX, BMY, BMZ, BNW, BNX, BNY, BNZ
• Tyler makes a table for the first two spinners.
• Then he uses the outcomes from the table to include the third spinner.
ManuscriptCopy
• Lin creates a tree to keep track of the outcomes.

1. How many outcomes are in the sample space for this experiment?
2. One of the outcomes from Diego’s list is BLX. Where does this show up in Tyler’s method? Where is it in Lin’s method?
3. When spinning all three spinners, what is the probability that:
a. they point to the letters ANY. Explain your reasoning.
ManuscriptCopy
b. they point to the letters AMW, ANZ, or BNW? Explain your reasoning.
4. If a fourth spinner that has 2 equal sections labeled S and T is added, how would each of the methods need to adjust?
Collaborative Activity: Subsets of a Sample Space
Consider the sample space S = {1, 2, 3, 4, 5, 6, 7, 8, 9, 10}.
1. How many outcomes are in ��?
Now, consider the following events of the sample space.
�� = even numbers
�� = numbers less than 5
2. List the outcomes for events �� and �� in the table shown.
3. Which outcomes are in �� and �� ?
ManuscriptCopy
The set of outcomes in events �� and �� is called the intersection of �� and �� and can be written as �� ∩�� .
Event A
Event B
4. Which outcomes are in �� or �� ?
The set of outcomes in �� or �� is called the union of �� and �� and can be written as �� ∪�� .
5. Which outcomes are not in �� ?
The set of outcomes not in �� are called the complement of �� and can be written as ~�� .
6. Discuss with your partner what ~(�� ∪�� ) means. Summarize your discussion.
7. How many outcomes are in ~(�� ∪�� )?
8. A 3rd event is defined as �� = numbers divisible by 4. What are the possible outcomes for event �� ?
ManuscriptCopy
9. Determine the outcomes for each event shown in the table.
Guided Activity: Outcomes in Sample Spaces
1. Consider the sample space �� = {12, 13, 14, 15, 16, 17, 18, 19, 20, 21} and events �� , �� , and �� of the sample space.
�� = multiples of 3
a. Complete the table.
ManuscriptCopy
= odd numbers
= multiples of 5
15, 21
14, 16, 18, 20
b. For each event described, shade in the appropriate section of the provided Venn diagram, and identify 1 possible outcome in the event.


a. What is unique about all the values in the highlighted section of the Venn diagram?


ManuscriptCopy

2. A standard deck of 52 playing cards is shown. Half of the cards are red (hearts and diamonds), half are black (spades and clubs), and 12 are “face” cards (jacks, queens, and kings). Aces have a value of 1.

Consider the events �� and �� , where �� = the set of red cards and �� = the set of even-numbered cards.
a. Complete the two-way frequency table shown for the events described.
b. A 3rd event is defined as �� = the set of cards with values less than 5. How many outcomes are in the intersection of events �� , �� , and �� ?
c. How many outcomes are in the event ~(�� ∩�� )?
ManuscriptCopy
Lesson Summary
This lesson revisited important probability concepts explored in prior courses.
Probability represents the proportion of the time an event will occur when repeating an experiment many times.
An event is a set of possible outcomes resulting from an experiment. In general, an event is any subset of a sample space.
For complex experiments, the sample space can get very large very quickly, so it is helpful to have some methods for keeping track of the outcomes in the sample space in an organized manner.
In a probability model for a random process, the sample space is a list of the individual outcomes that are to be considered.
An outcome of a chance experiment is one of the things that can happen when you do the experiment.
In some cases, it makes sense to list all the outcomes in the sample space.
For example, when flipping 3 coins, the 8 outcomes in the sample space are HHH, HHT, HTH, THH, HTT, THT, TTH, TTT, where H represents heads and T represents tails.
When sample spaces include more outcomes, it can become difficult to make sure all the outcomes are represented in a list and none are repeated, so other methods may be helpful.
Another option to create sample spaces may be to use tables. When a complex experiment is broken down into parts, tables can be used to identify the outcomes of 2 events happening simultaneously. For example, when flipping 3 coins, first determine the outcomes for flipping just 2 coins. The possible outcomes from flipping 2 coins are represented by the 4 options in the middle of the first table: HH, HT, TH, and TT.
ManuscriptCopy
These outcomes can then be combined with the third coin flip in another table. Notice that the outcomes inside the table are HHH, HHT, HTH, HTT, THH, THT, TTH, and TTT as was determined in the previous list.
Another way to keep track of the outcomes and build a sample space for an experiment is to draw a tree diagram. Each column in the tree diagram represents another part of the experiment with branches connecting each possible result from one part of the experiment to the possible results for the next part. By following the branches from left to right, each path represents an outcome for the sample space. The tree diagram for flipping 3 coins would appear as shown.
The path shown with the dashed line represents the HTH outcome. By following the other paths, the other 7 outcomes can be identified.
Practice Problems
1. Shania is spinning a spinner with 4 equal sections numbered 1 through 4 as shown. Dex is flipping a fair coin with faces of heads and tails.
a. How many outcomes do you expect there to be in the sample space of 1 spin of the spinner and 1 toss of the coin?
ManuscriptCopy
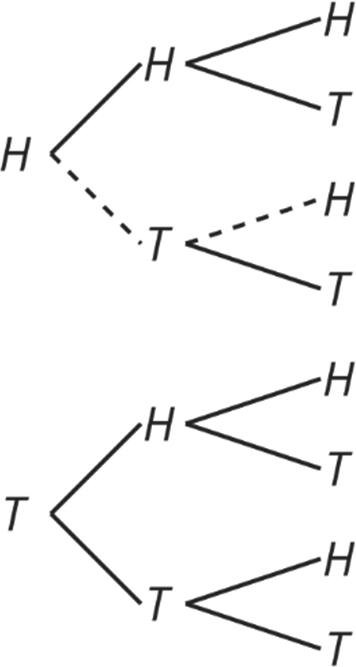

b. Create a sample space for all the possible outcomes of 1 spin of the spinner and 1 toss of the coin.
c. Consider event �� , where Shania spins an odd number and Dex flips heads on the coin. List the outcomes from the sample space in part B that represent event �� .
d. How many outcomes are there in ~�� ?
ManuscriptCopy
2. A researcher is analyzing a possible association between gender and a person’s preference for cats or dogs. Nine people were surveyed. The results of the study are summarized in the table shown.
Name
GenderPrefers Cats or Dogs
Ashley Female Cats
Brian Male Dogs
Chelsea Female Dogs
Darnell Male Dogs
Jose Male Dogs
Karen Female Cats
Rachelle Female Cats
Shawn Male Cats
Uwe Female Dogs
Two people are randomly chosen from those surveyed. Consider event �� , where both people chosen are female and event �� , where 1 person who prefers cats and 1 person who prefers dogs are chosen.
Select all the pairs of people that are in the intersection of events �� and �� .
□ Karen and Ashley
□ Karen and Uwe
□ Brian and Shawn
□ Ashley and Shawn
□ Darnell and Jose
□ Chelsea and Rachelle
3. Tyler decides which type of pizza to order. The choices for crust are thin crust or regular crust. The choices for one topping are pepperoni, mushrooms, olives, sausage, or green peppers. Tyler has trouble deciding because there are so many possibilities. He selects the type of crust and one topping at random. How many outcomes are in the sample space?
ManuscriptCopy
A. 2
B. 5
C. 7
D. 10
4. The formula for the sum, ��, of the first �� terms in a geometric sequence is given by �� = ��� 1 − ���� 1 − �� �, where �� is the initial value and �� is the common ratio.
A medicine is prescribed for a patient to take 700 milligrams (mg) every 12 hours (hr.) for 5 days. After 12 hr., 4% of the medicine is still in the body. How much of the medicine is in the body after the last dose?
5. A car begins its drive in heavy traffic and then continues on the highway without traffic. The average cost, in dollars, of the gas this car uses per mile (mi.) for driving �� mi. is ��(��)= 0.65 + 0.15�� �� . What does the right end behavior of the function tell you about the situation?
ManuscriptCopy
Unit 10, Lesson 2: Two-Way Frequency Tables
Warm-Up: Notice and Wonder: Dog City

This two-way table summarizes data from a survey of 200 people who reported their home environment (urban or rural) and pet preference (dog or cat).
What do you notice? What do you wonder?
ManuscriptCopy
Exploration Activity: Rolling into Tables
Decide which person will be partner A and which will be partner B.
The result of partner A’s roll is represented by the values on the left side of the table. The result of partner B’s roll is represented by the values on the top of the table.
Use the number generator to roll and record the result. For example, if partner A rolls a 3 and partner B rolls a 5, then record 3, 5. Repeat this process until your teacher tells you to stop.
This activity requires the use of an applet, so please make your way over to the digital platform to find the link.

ManuscriptCopy
Use the table to summarize the results. For example, if 6, 6 appears on your list a total of five times, write a 5 in the bottom right cell of the table.
1. Do the values in the table match your expectation? Explain your reasoning.
2. Based on the table, how many times did partner A roll a 5?
3. How many times did you both roll the same number?
4. What percentage of the rolls resulted in the same number from both partners?
ManuscriptCopy
5. What percentage of the rolls resulted in partner A rolling a 3 and partner B rolling a 6?
6. Based on the table, estimate the probability that partner A will roll a 2 and partner B will roll a 4. Explain your reasoning.
Guided Activity: Traveling Methods
1. A company has an office in Austin, Texas, and an office in Copenhagen, Denmark. The company wants to know how employees get to work, so they take a survey of all the employees and summarize the results in a table.
a. If an employee is selected at random, what is the probability that they work in Austin and drive a car to work?
b. If an employee is selected at random, what is the probability that they work in Copenhagen and ride a bike to work?
ManuscriptCopy
c. If an employee is selected at random, what is the probability that they take public transit to work?
d. If an employee from Copenhagen is selected at random, what is the probability that they ride a bike to work?
e. If an employee who takes public transit to work is selected at random, what is the probability they work in Austin?
f. How are the last 2 questions different from the first 3?
2. A school district is interested in how students get to school, so they survey their high school students to see how they get to school and separate the numbers by grade level. The results of the survey are summarized in the table.
a. If a high school student is selected at random, what is the probability they are in grade 9 and ride the bus to school?
ManuscriptCopy
b. If a high school student is selected at random, what is the probability that they are in grade 12?
c. If a high school student is selected at random, what is the probability that they take a car to school?
d. If a grade 10 student is selected at random, what is the probability that they ride a bus to school?
e. If a grade 12 student is selected at random, what is the probability that they ride a bus to school?
f. If a student who rides the bus to school is selected at random, what is the probability that they are in grade 9?
Lesson Summary
Two-way frequency tables provide a useful structure for organizing data.
A two-way table is a way of organizing data from two categorical variables in order to investigate the association between them.
When several responses have been collected about 2 categorical variables, the data can be organized into a two-way frequency table. The table can be used to calculate relative frequencies, which can be interpreted as probabilities.
For example, 243 participants in a survey responded to questions about their favorite season and whether they like wearing pants or shorts better. The results are summarized in the two-way frequency table shown.
ManuscriptCopy
A two-way table can be turned into a two-way relative frequency table by dividing each of the values in the two-way frequency table by the total number of participants or observations.
A relative frequency table is a version of a two-way table in which the value in each cell is divided by the total number of responses in a row or a column.
The two-way relative frequency table for the previous data set is shown. This table can be used to determine different probabilities. Two examples are described.
• If a person is randomly selected from among these 243 participants, the probability that the chosen person’s favorite season is spring and that they like shorts better than pants is 0.08
• There were 63 people who listed spring as their favorite season (43 + 20), so the probability that a randomly selected person from this group likes spring best is approximately 63 243 ≈0.26.
Practice Problems
1. The table shows the results from a survey that asked 100 adults if they had a high school diploma and if their annual income was more than $30,000.
A person who took the survey is selected at random.
a. What is the probability that the person has a high school diploma and makes $30,000 or less?
b. What is the probability that the person has no high school diploma and earns more than $30,000?
ManuscriptCopy
2. The table shows data from a science fair experiment that studied the number of eggs that hatched at three different temperatures.
a. What percentage of the eggs hatched?
b. What percentage of the eggs that were at the cool temperature hatched?
c. What percentage of the eggs were not at room temperature?
ManuscriptCopy
d. What percentage of the eggs were at the warm temperature and did not hatch?
3. The table shows information from a survey about the resting heart rate, in beats per minute (bpm), for 50 people living at altitudes above and below 10,000 feet (ft.)
a. Create a two-way table relative frequency table for the survey.
ManuscriptCopy
b. What is the probability that a person surveyed, selected at random, has a heart rate above 80 bpm or lives above 10,000 ft.?
c. What is the probability that a person surveyed, selected at random, has a heart rate above 80 bpm and lives above 10,000 ft.?
Review Problems
4. List all the possible outcomes for spinning the spinner and rolling a fair number cube.

5. Select all of the words for which the probability of selecting the letter A at random is 1 4 .
AREA
ACID
ManuscriptCopy
ManuscriptCopy
Unit 10, Lesson 3: The Addition Rule
Warm-Up: Hats Off, Sneakers On
The table displays information about people at a neighborhood park.
1. Andre says the number of people wearing sneakers or wearing a hat is 21 because there are a total of 10 people wearing a hat and a total of 11 people wearing sneakers. Is Andre correct? Explain your reasoning.
2. What is the probability that a person selected at random from those in the park is wearing sneakers or wearing a hat?
ManuscriptCopy
Exploration Activity: State Names
Zora has a way to find the probability of a random outcome being in event A or in event B. She says, “We use the probability of the outcome being in event A and then add the probability of the outcome being in event B. Now, some outcomes have been counted twice, so we have to subtract the probability of the outcome being in both events so that those outcomes are only counted once.”
Zora’s method can be rewritten as ��(A ∪ B) = ��(A ) + ��(B) − ��(A ∩ B) .
1. The table of data summarizes information about the 50 states in the United States from a census in the year 2000. A state is chosen at random from the list of 50. Let event A = the state name begins with A through M and event B = the population of the state is less than 4 million.
• Alaska is 1 of the 11 states in the top left cell of the table.
• California is 1 of the 15 states in the top right cell of the table.
• Nebraska is 1 of the 13 states in the bottom left cell of the table.
• South Carolina is 1 of the 11 states in the bottom right cell of the table.
ManuscriptCopy
For each event, write which of the 4 states listed here is an outcome in that event.
2. Find each probability when a state is chosen at random.
ManuscriptCopy
a. A ∪ B
b. A
c. B
d. A ∩ B
a. ��(A ∪ B)
b. ��(A )
c. ��(B)
d. ��(A ∩ B)
3. Does Zora’s formula work for these events? Show your reasoning.
4. Seniors at a high school are allowed to go off campus for lunch if they have a grade of A in all their classes or perfect attendance. An assistant principal in charge of academics knows that the probability of a randomly selected senior having A’s in all their classes is 0.1. An assistant principal in charge of attendance knows that the probability of a randomly selected senior having perfect attendance is 0.16. The cafeteria staff know that the probability of a randomly selected senior being allowed to go off campus for lunch is 0.18. Use Zora’s formula to find the probability that a randomly selected senior has all A’s and perfect attendance.
Guided Activity: Understanding the Addition Rule
1. A polyhedron with 12 faces is rolled, where each face is numbered from 1 to 12. Consider event �� = rolling an even number and event �� = rolling a number greater than 8.
Use events �� and �� to determine each probability.
��(��) =
ManuscriptCopy
��(��∩ ��) =
c. ��(��) + ��(��) =
d. What is the probability of rolling a number that is even or greater than 8? Write and solve a probability expression for the statement.
2. Explain why the probability of the intersection of the events is subtracted from the sum of the probabilities of the 2 events to find the probability of the union of the events.
3. A local high school in Spartanburg, South Carolina, has 700 students enrolled in 9th grade. Information about enrollment of 9th graders in advanced math and English classes at the school is shown.
• 150 students are enrolled in an advanced math class
• 350 students are enrolled in an advanced English class
• 100 students are enrolled in both an advanced math class and an advanced English class
a. How many students are enrolled in an advanced math class or an advanced English class?
ManuscriptCopy
b. What is the probability that a randomly selected 9th grade student at the school is enrolled in either an advanced math or an advanced English class?
c. Express your answer to part B using the addition rule.
Collaborative Activity: Determining Probabilities Using Venn Diagrams
Students at a large high school can take elective classes during their freshman year. The 3 most popular electives are music, art, and theater. The number of students taking each of the elective classes is shown in the Venn diagram.
1. Explain what 44 represents in this situation.
ManuscriptCopy
2. Select all events that are mutually exclusive.
□ Music and art
□ Theater and art
□ Music and theater
□ Theater and not music
□ Not art and not theater
3. Determine each probability.
a. ��(music) = b. ��(art) =
c. ��(music ∩ art) = d. ��(art ∪ theater) =
e. ��(music ∪ theater) = f. ��(~art ∪ ~theater) =
ManuscriptCopy
Lesson Summary
The addition rule is used to compute probabilities of compound events.
The addition rule states that given events and , the probability of either �� or �� is given by ��(��∪ ��) = ��(��) + ��(��) − ��(�� ∩ ��)
For example, the student council sold 100 shirts that are either gray or blue and in sizes medium and large. The details of the sales are summarized in the two-way table.
A student who bought a shirt is chosen at random. One way to find the probability that this student bought a shirt that is blue or medium is to begin with the probabilities for shirts sold in that color and size. The probability that the student bought a blue shirt is 0.70 because 70 out of the 100 shirts sold were blue. The probability that the student bought a medium shirt is 0.35 because 35 out of the 100 shirts sold were medium.
To find the probability of a blue shirt or a medium shirt being purchased, a common misconception is to add these probabilities together to find 0.70 + 0.35 = 1.05. This value doesn’t make sense because it is saying the probability of purchasing a blue or a medium shirt is greater than 1.
The problem is that the 15 students who bought shirts that are both medium in size and blue are counted twice in this calculation. Since ��(medium) = 20 + 15 100 and ��(blue) = 15 + 55 100 , both include the same 15 100 students. To fix this double counting, subtract the probability that the chosen student is in both categories so that these students are only counted once in the probability calculation.
The addition rule then shows that the probability the student bought a medium shirt or a blue shirt is 0.90.
��(medium ∪ blue) = ��(medium) + ��(blue) − ��(medium ∩ blue) ��(medium ∪ blue) = 0.35+ 0.70 0.15 = 0.90
ManuscriptCopy
The events of a student purchasing a medium and blue shirt are not disjoint because a shirt can be selected that is both medium and blue. However, a student purchasing a medium and a large shirt are disjoint, or mutually exclusive, events because they cannot both happen at the same time.
The probability of a student buying a medium or large shirt is certain, which can be demonstrated by applying the addition rule.
��(medium ∪ large) = ��(medium) + ��(large) − ��(medium ∩ large)
��(medium ∪ large) = 0.35+ 0.65 = 1
Practice Problems
1. The table displays the number and type of tickets bought for a play that was performed in both the afternoon and evening.
Show how to apply the addition rule for the events “a child ticket is bought for a play” and “the play is performed in the afternoon.”
2. A biologist studies two different invasive species, purple loosestrife and the common reed, at sites in both wetland and coastal habitats. Purple loosestrife is present in 35% of the sites. Common reed is present in 55% of the sites. Both purple loosestrife and common reed are present in 23% of the sites. What percentage of the sites have purple loosestrife or common reed present?
A. 12%
ManuscriptCopy
B. 22%
C. 67%
D. 90%
3. Thirty teachers and students participate in a student-faculty basketball game as a fundraiser. They are surveyed after the game by the sports medicine class to find out how many of them stretched before the game. The results of the survey are shown in the table.
One of the sports medicine students, Han, wants to know the probability that one of the participants in the game selected at random is younger than 18 years old or stretched before the game. To figure this out, he adds the three values in the first row of the table (5, 9, and 4) to the two values listed under the heading “younger than 18 years old” (5 and 10). He then divides that answer by 30 and obtains a probability of 33 30 . Han realizes that 33 30 is greater than 1 and determines that he must have made a mistake.
a. What is Han’s mistake? Explain your reasoning.
b. How does the addition rule account for this kind of mistake?
ManuscriptCopy
4. A student picks a random letter from the word ”dog” and a random letter from the word ”barks.”
a. How many outcomes are in the sample space?
b. What is the probability that an “o” is chosen?
c. What is the probability that a “k” is chosen?
d. What is the probability that a “o” and a “k” are chosen?
5. The table shows information from a survey about the resting heart rate, in beats per minute (bpm), for 200 total college students. Some are in the marching band, and some are not in the marching band.
a. What is the probability that a person surveyed, selected at random, has a heart rate above 80 bpm or is in the marching band?
ManuscriptCopy
b. What is the probability that a person surveyed, selected at random, has a heart rate below 80 bpm and is not in the marching band?
ManuscriptCopy
Unit 10, Lesson 4: Independent Events
Warm-Up: Drawing Crayons
A bag contains 1 crayon of each color: red, orange, yellow, green, blue, pink, maroon, and purple.
1. A person chooses a crayon at random out of the bag, uses it for a bit, and then puts it back in the bag. A second person comes to get a crayon chosen at random out of the bag. What is the probability the second person gets the yellow crayon?
ManuscriptCopy

2. A person chooses a crayon at random out of the bag and walks off to use it. A second person comes to get a crayon chosen at random out of the bag. What is the probability the second person gets the yellow crayon?
Exploration Activity: Choosing Doors
1. On a game show, a contestant is presented with 3 doors. One of the doors hides a prize and the other two doors have nothing behind them.
• The contestant chooses one of the doors by number.
• The host, knowing where the prize is, reveals one of the empty doors that the contestant did not choose.
• The host then offers the contestant a chance to stay with the door they originally chose or to switch to the remaining door.
• The final chosen door is opened to reveal whether the contestant has won the prize.
Choose one partner to play the role of the host and the other to be the contestant. The host should think of a number: 1, 2, or 3 to represent the prize door. Play the game keeping track of whether the contestant stayed with their original door or switched and whether the contestant won or lost.
Switch roles so that the other person is the host and play again. Continue playing the game until the teacher tells you to stop. Use the table to record your results.
a. Based on your table, if a contestant decides they will choose to stay with their original choice, what is the probability they will win the game?
ManuscriptCopy
b. Based on your table, if a contestant decides they will choose to switch their choice, what is the probability they will win the game?
c. Are the two probabilities the same?
2. In another version of the game, the host forgets which door hides the prize. The game is played in a similar way, but sometimes the host reveals the prize and the game immediately ends with the player losing, since it does not matter whether the contestant stays or switches.
Choose one partner to play the role of the host and the other to be the contestant. The contestant should choose a number: 1, 2, or 3. The host should choose one of the other two numbers. The contestant can choose to stay with their original number or switch to the last number.
After following these steps, roll the number cube to see which door contains the prize:
• Rolling 1 or 4 means the prize was behind door 1.
• Rolling 2 or 5 means the prize was behind door 2.
• Rolling 3 or 6 means the prize was behind door 3.
Play the game keeping track of whether the contestant stayed with their original door or switched and whether the contestant won or lost.
Switch roles so that the other person is the host and play again. Continue playing the game until the teacher tells you to stop. Use the table to record your results.
ManuscriptCopy
a. Based on your table, if a contestant decides they will choose to stay with their original choice, what is the probability they will win the game?
b. Based on your table, if a contestant decides they will choose to switch with their original choice, what is the probability they will win the game?
c. Are the two probabilities the same?
Guided Activity: Independent Events
1. Consider tossing a fair coin.
a. On the 1st toss, what is the probability of the coin landing on heads?
b. On the 2nd toss, what is the probability of the coin landing on heads?
ManuscriptCopy
c. If the 1st toss results in heads, what is the probability of landing on heads on the 2nd toss?
d. Are the coin toss events independent?
2. Consider dealing a hand from a deck of 52 cards.
a. What is the probability an ace is drawn as the 1st card?
b. What is the probability an ace is drawn as the 2nd card if the 1st card is not put back in the deck?
c. Explain whether drawing aces as the 1st and 2nd cards in this scenario are independent events.
ManuscriptCopy
3. Identify the events in the table as independent or dependent.
Events
Flipping a coin, and then flipping it again
Choosing a black 7 from a deck of cards, not returning it to the deck, and then choosing another black 7
Driving above the speed limit and receiving a speeding ticket on a specific part of the highway
A couple’s 1st child having red hair and their 2nd child having red hair
Independent or Dependent?
Independent Dependent
Independent Dependent
Independent Dependent
Independent Dependent
4. A survey at a high school found that 15% of the students take chorus, 60% play video games, and 9% of the students take chorus and play video games. Are the events taking chorus and playing video games independent? Show your work or explain your reasoning.
ManuscriptCopy
5. Bailey is working at a local clothing store. Based on past sales, the probability that the next item purchased will be a dress is 0.20 and the probability that the next item purchased will be something red is 0.30. If the probability that the next item purchased will be a red dress is 0.10, are buying a red item and buying a dress independent? Show your work or explain your reasoning.
Lesson Summary
When considering probabilities for compound events, it is useful to know whether the events are independent or dependent.
Independent events are two events from the same experiment for which the probability of one event is not affected by whether the other event occurs or not.
Dependent events are two events from the same experiment for which the probability of one event depends on whether the other event happens.
For example, a bag contains 3 green blocks and 2 blue blocks, as shown. Two blocks will be randomly chosen from the bag.
Consider 2 experiments:

• A block is chosen from the bag, the color is noted, and the block is then returned to the bag before a second block is chosen. The event, “the second block is green” is independent of the event, “the first block is blue.” Since the draw is done with replacement, the probability of choosing green on the second draw is not affected by the first draw.
• A block is chosen from the bag, set aside, and then another block is selected. Since the draw is done without replacement, the same 2 events, “the second block is green” and “the first block is blue,” are dependent.
In the second scenario, if a blue block is randomly chosen on the first draw, then the bag will contain 3 green blocks and 1 blue block, as shown, so ��(green) = 3 4 .
If a green block is randomly chosen on the first draw, then the bag will contain 2 green blocks and 2 blue blocks, so ��(green) = 1 2 .
Since the probability of getting a green block on the second draw changes depending on whether the event of drawing a blue block on the first draw occurs, the 2 events are dependent. Independence can also be verified using probabilities.
If 2 events are independent, then ��(��∩��) = ��(��) ∙��(��) .

In some cases, it is difficult to know whether events are independent without collecting data. For example, a basketball player shoots 2 free throws. Does the probability of making the second shot depend on the outcome of the first shot? In this case, data would need to be collected about how often the player makes the second shot overall and how often the player makes the second shot after making the first so that you could compare the estimated probabilities.
Practice Problems
1. Each of the letters A through J are printed on tiles that are placed in a hat. Andre selects a tile at random and then replaces it. Clare then selects a tile at random.
a. What is the probability that Andre selects a tile labeled B?
b. What is the probability that Clare selects a tile labeled B?
c. What is the probability that both Andre and Clare select a tile labeled B?
d. Are the events of Andre selecting a tile and Clare selecting a tile dependent or independent? Explain your reasoning.
ManuscriptCopy
2. Identify the events in the table as independent or dependent.
Events
A fruit bowl contains 23 green grapes and 16 purple grapes. What is the probability that a green grape is selected randomly and eaten and then a purple grape is selected?
Given a standard deck of 52 cards, what is the probability of choosing a red card, putting it back in the deck, and then drawing a club?
A standard 6-sided number cube is rolled. What is the probability of rolling an even number on the first roll and then rolling a 5 on the second roll?
3. Two spinners are shown.
Spinner A is spun, and then spinner B is spun.
a. Are these events independent?
Independent or Dependent?
Independent Dependent
Independent Dependent
Independent Dependent
b. What is the probability of spinning a 2 on spinner A and a 3 on spinner B?
ManuscriptCopy
4. John hits 83% of pitches when he bats for his baseball team. Suppose John is up to bat twice in a game. What is the probability that John hits the first pitch when he is at bat both times?
5. The table displays the number and type of tickets bought for a baseball tournament held on a Saturday and Sunday.
Child TicketAdult Ticket
Saturday 27 41
Sunday 14 29
The addition rule states that given events �� and ��, (A ∪ B) = ��(A) + ��(B) − ��(A∩ B) . Show how to apply the addition rule for the events “a child ticket is bought for a baseball tournament” and “the day of the tournament is Sunday.”
ManuscriptCopy
Unit 10, Lesson 5: Conditional Probability
Warm-Up: She Made Some Tarts
1. Noah will select 1 card at random from a standard deck of cards. Find the probabilities. Explain or show your reasoning.
a. ��(the card is a queen)

b. ��(the card is a heart)
c. ��(the card is a queen and heart)
ManuscriptCopy
2. Elena pulls out only the hearts from the deck and sets the rest of the cards aside. She shuffles the hearts and draws one card. What is the probability she gets a queen?
Exploration Activity: Under One Condition
Kelcy is exploring different probabilities of a card drawn from a standard deck of cards. Let event �� represent that the card drawn is a queen, and let event �� represent that the card drawn is a heart. Kelcy notices that the probabilities from the Warm-Up can be arranged into at least 2 equations.
Kelcy wonders if it is always true that ��(�� and ��) = ��(�� | ��) ⋅ ��(��) for events �� and ��. He wants to check additional examples for drawing a card from a deck.
1. If event �� is “the card is black” and event �� is “the card is a king,” then does the equation hold? Explain or show your reasoning.
2. If event �� is “the card is a face card” and event �� is “the card is a spade,” then does the equation hold? Explain or show your reasoning.
Collaborative Activity: Coin and Cube
A coin is flipped, and then a standard number cube is rolled. Let �� represent the event “the coin lands showing heads” and �� represent “the standard number cube lands showing 4.”
1. Are events �� and �� independent or dependent? Explain your reasoning.

2. Find the probabilities.
ManuscriptCopy
Attribution: US Nickel, by Lordnikon. Public Domain. Wikimedia Commons. Source.
a. ��(�� )
b. ��(��)
c. ��(�� | ��)
d. ��(��| �� )
3. Describe the meaning of the events “not A” and “not B” in this situation, and then find the probabilities.
a. ��(�� | ~��)
b. ��(��| ~�� )
4. Are any of the probabilities the same? Is there a relationship between those situations? Explain your reasoning.
Lesson Summary
This lesson explored conditional probability.
A conditional probability is the probability that one event occurs under the condition that another event occurs.
Consider the events of removing 2 marbles from a jar that contains 3 green marbles, 2 blue marbles, 1 white marble, and 1 black marble. To determine the probability that the second marble removed is green given that the first marble removed was green uses conditional probability.
ManuscriptCopy
The notation for this probability is ��(green second | green first) , where the vertical line can be read as “under the condition that the next event occurs” or “given that the next event occurs.” When determining conditional probability, assume that the given condition is true, and determine the probability of the remaining event. In this example, ��(green second | green first) = 2 6 since the condition that the first marble drawn was green is assumed to have happened, so the second draw only has 2 possible green marbles left to draw out of 6 marbles still in the jar.
To find the probability of 2 events happening together, the multiplication rule of probability �� (A∩B) = ��(A| B) ⋅ ��(B) can be used. For example, to find the probability that 2 green marbles are drawn from the jar, the multiplication rule could be used rather than writing out the entire sample space and finding the probability from that.
Since the probability of getting green on the first draw is 3 7 and the conditional probability was determined previously, the probability that both events occur can be found using the multiplication rule.
��(green second and green first) = ��(green second | green first) ⋅��(green first)
��(green second and green first) = 2 6 ⋅ 3 7
This expression means that the probability of getting green marbles in both draws is 1 7 since 2 6 ⋅ 3 7 = 6 42 = 1 7 .
In cases where events �� and �� are independent, ��(�� | ��) = ��(�� ) since the probability does not change whether or not �� occurs. In these cases, the multiplication rule becomes ��(�� ∩��) = ��(�� ) ⋅ ��(��) . For example, when flipping a coin and rolling a standard number cube, the events “landing on tails for the coin” and “getting 5 for the number cube” are independent. That means the probability of both events occurring can be determined using the multiplication rule ��(tails and 5) = 1 2 1 6 = 1 12 .
Practice Problems
1. Jada rolls one standard number cube, and then she rolls another standard number cube.
a. What is the probability that she rolls a 5 on both number cubes?
b. What is the probability that the second roll is a 5 under the condition that the first roll is a 6?
c. What is the probability that the second roll is a 5 under the condition that the first roll is a 5?
d. What is the probability that the second roll is not a 5?
e. What is the probability that the first roll is a 5 and the second roll is not a 5?
ManuscriptCopy
2. There are four slices of pizza left to choose from. Each slice of pizza has one topping. Three of the slices have sausage as a topping and the fourth slice has pepperoni as a topping. Kiran randomly selects one slice then Mai randomly selects one slice. What is the probability that Mai selects a slice of pepperoni pizza under the condition that Kiran selects a slice of sausage pizza?
3. Han’s soccer team plays a soccer game in the morning. Lin’s soccer team plays a soccer game in the afternoon against a different team than Han’s soccer team played in the morning. Let �� represent the event “Han’s soccer team wins the morning game” and �� represent the event “Lin’s soccer team wins the afternoon game.”
a. Describe the meaning of ��(��| �� ) .
b. Do you think �� and �� are independent events? Explain your reasoning.
c. If the events are independent, how are ��(��| �� ) and ��(��) related?
Review Problems
4. Each of the letters A through F are written on slips of paper and placed in a hat. Priya selects a slip of paper at random and then replaces it. Noah then selects a slip of paper at random.
a. What is the probability that Priya selects a slip of paper labeled A?
b. What is the probability that Noah selects a slip of paper labeled A?
c. What is the probability that both Priya and Noah select a paper labeled A?
ManuscriptCopy
d. Are the events of Priya selecting a paper and Noah selecting a paper dependent or independent? Explain your reasoning.
5. The Wildcats have won approximately 80% of their 20 basketball games this season. The Wildcats won 5 of the 8 games they played when Elena started the game. Are the events “the Wildcats win the game” and “the Wildcats win the game when Elena started the game” dependent or independent events? Explain your reasoning.
6. In a genetics experiment on plants, 17% of the plants exhibit trait A and 22% of the plants exhibit trait B. 36% of the plants exhibit trait A or trait B. What percentage of the plants exhibit both trait A and trait B?
7. 70 students were asked two survey questions:
□ Do you play a school sport?
□ Are you a member of the school choir?
Their responses are summarized in the Venn diagram.
a. How many students play a school sport?

b. How many students play a school sport or are a member of the school choir?
c. How many students play a school sport and are a member of the school choir?
d. How many students are not a member of the school choir?
ManuscriptCopy
e. Name two ways to determine how many students play a sport.
Unit 10, Lesson 6: Using Tables for Conditional Probability
Warm-Up: Fractions in Fractions
Evaluate each expression mentally.
Collaborative Activity: Conditional Probability in Two-Way Tables
1. One hundred people who frequently get migraine headaches were selected to participate in a study of a new medicine to prevent the headaches. Some of the participants received the new medicine, and others were not given any medicine. The participants were monitored for a week to record if they had any headaches during the week. The two-way frequency table summarizes the results from the study.
Let event �� represent the participant taking the new medicine. Let event �� represent the participant having a headache.
a. What is P(��)?
b. What is P(~��)?
ManuscriptCopy
c. Complete the statements.
There were _________ participants who took the new medicine. Of these participants, _________ participants did not get a headache. So, P(~��|��) = = _________, which means that _________ % of the participants did not get a headache after taking the new medicine.

d. What is ��(��|~��)?
e. Is ��(~��|��)= ��(��|~��)?
ManuscriptCopy
f. Are the events of a participant taking the new medicine and the participant not getting a headache independent? Explain your reasoning.
Guided Activity: A Possible Cure
A pharmaceutical company is testing a new medicine for a disease using 115 test subjects. Some of the test subjects are given the new medicine and others are given a placebo. The results of their tests are summarized in the table.
1. Divide the value in each cell by the total number of test subjects to find each probability to 2 decimal places. Some of the values have been filled in.
2. If one of these test subjects is selected at random, find each probability.
a. ��(symptoms persist)
b. ��(given medicine ∩ symptoms persist)
ManuscriptCopy
c. ��(given placebo ∪ symptoms persist)
3. From the original table, divide each cell by the total for the row to find the probabilities with row conditions. Some of the values have been filled in.
4. Determine the probability of each event.
a. ��(symptoms persist | given medicine)
b. ��(no more symptoms | given placebo)
5. Kelvin didn’t read the instructions for the previous problem well and used the table he created on the first problem to divide each cell by the probability total for each row. For example, in the top left cell he calculated 0.27÷0.5.
a. Complete the table using Kelvin’s method.
b. What do you notice about this table?
ManuscriptCopy
6. From the original table, divide each cell by the total for the column to find the probabilities with column conditions. Some of the values have filled in.
7. Determine the probability of each event.
a. ��(given medicine | symptoms persist)
b. ��(given placebo | no more symptoms)
8. Are the events “symptoms persist” and “given medicine” independent events? Explain or show your reasoning.
9. Based on your work, does being given this medicine have an impact on whether symptoms persist or not?
ManuscriptCopy
Lesson Summary
Organizing data in two-way tables is a useful way to see information and compute probabilities.
For example, the data collected from all students in grades 11 and 12 and their intentions of going to prom are shown in the two-way table.
Many probabilities can be found using the two-way table. If a student is randomly selected from this group of students:
• ��(grade 12 ∩ going to prom) = 81 242 since there are 81 students who are both in 12th grade and going to prom out of all 243 students in the group who could be selected.
• ��(grade 12 )= 116 242 since there are 116 grade 12 students out of the entire group.
• ��(going to prom) = 124 242 since there are 124 students going to prom out of the entire group.
• ��(grade 12 ∪ going to prom)= 159 242 since there are 159 students in grade 12 or going to prom (43 from grade 11 going to prom, 81 from grade 12 going to prom, and 35 from grade 12not going to prom).
• ��(going to prom| grade 12 ) = 81 116 represents the probability that the chosen student is going to prom under the condition that they are in grade 12. The group being considered is different for this probability since the condition is that they are in grade 12. Therefore, 81 students are going to prom out of 116 students in the group.
ManuscriptCopy
• ��(grade 11| going to prom)= 43 124 represents the probability that the chosen student is in grade 11 under the condition that they are going to prom. The probability that this student is in grade 11 when just considering the group going to prom is 43 124 .
The last 2 probabilities are conditional probabilities and can also be found using ��(�� | ��)= ��(�� ∩ ��) ��(��) . For example, substituting values into ��(going to prom| grade 12 ) results in ��(going to prom∩ grade 12 ) ��(grade 12 ) = 81
The data in a two-way frequency table can also be represented using relative frequencies, where the entries represent the joint and marginal relative frequencies of the whole sample.
Joint relative frequency is the ratio of the joint frequency to the total number of data points.
The total frequency for 1 category of a categorical variable, which is the total frequency for any row or column in a two-way frequency table, is called a marginal frequency. When using two-way frequency tables, it is sometimes easier to determine conditional probability using the conditional relative frequency.
A conditional relative frequency is the ratio of a joint relative frequency to a marginal relative frequency. Equivalently, the ratio of a joint frequency and a marginal frequency.
ManuscriptCopy
These displays are often useful to construct when looking to compare specific entries or categories to each other as they relate to the entire data set. The two-way relative frequency table for the previous example is shown.
Going to Prom Not Going to Prom Total
ManuscriptCopy
Conditional probabilities from two-way tables can also be used to determine whether 2 events are independent. Recall that 2 events are independent if the probability of 1 event is not affected by the other event occurring. Thus, 2 events are independent if ��(�� | ��)= ��(��) and ��(�� | ��)= ��(��).
Practice Problems
1. A tour company makes trips to see dolphins in the morning and in the afternoon. The two-way table summarizes whether or not customers saw dolphins on a total of 40 different trips.
a. If a trip is selected at random, what is the probability that customers did not see dolphins on that trip?
b. If a trip is selected at random, what is the probability that customers did not see dolphins under the condition that the trip was in the morning?
c. Are the events of seeing dolphins and the time of the trip (morning or afternoon) dependent or independent events? Explain your reasoning.
ManuscriptCopy
2. A student surveys 30 people as part of a project for a statistics class. Here are the survey questions.
• Are you left-handed or right-handed?
• Are you left-eye dominant or right-eye dominant?
The results of the survey are summarized in the two-way table.
What is the probability that a person from the survey chosen at random is righthanded under the condition that they are right-eye dominant?
Review Problem
3. Priya flips a fair coin and then rolls a standard number cube. What is the probability that she rolled a 3 under the condition that she flipped heads?
ManuscriptCopy
ManuscriptCopy
Unit 10, Lesson 7: The Multiplication Rule
Warm-Up: Conditional Probability
A survey was sent to 10th- and 11th-grade students at a large high school to determine the most common method of transportation to school. The results of the survey are shown in the two-way table.
1. Determine ��(car).
2. Determine ��(car|11th grade). Round to the nearest tenth of a percent.
ManuscriptCopy
3. Use the answers to problems 1 and 2 to explain whether the events car and 11th grade are independent or dependent.
Exploration
Activity: The Multiplication Rule
1. Complete the statements.
a. Two events are increases dependent if the outcome of one event does not affect the outcome of the other event.
b. If 2 events are independent, then ��(��|��) = ___________.
2. Rewrite the formula for conditional probability, ��(�� | ��) = ��(�� ∩ ��) ��(��) , using the equality from problem 1b.
3. Isolate �� (��∩��) in the equation you created in problem 2.
4. Complete the statement.
��(��∩��) = _________________ is the multiplication rule for independent events.
5. Suppose a bag contains 8 white marbles, 4 green marbles, and 3 blue marbles. Two marbles are pulled at random.
a. How many outcomes are possible for pulling 1 marble out of the bag?
b. Find the probability that both marbles are green if the marble is replaced after being chosen.
ManuscriptCopy
c. Find the probability that 1 marble is blue and 1 is white if the marbles are not replaced after being chosen.
6. Consider a standard deck of 52 cards.
a. What is the probability that a red card will be drawn 5 times? Assume the card that is drawn is placed back in the deck, and the deck is shuffled before each draw.
b. What is the probability that a red card will be drawn 5 times? Assume the card that is drawn is not placed back in the deck.
Collaborative Activity: Uniform Probability
Suppose 2 fair colored coins are being flipped at the same time. Coin 1 has sides colored red and blue, and coin 2 has sides colored green and yellow.
1. If the coins are flipped once, complete the table with the outcomes in the sample space and the probability for each outcome. Use R, B, G, and Y to represent the sides of the coins.
Outcomes
Probability
The table is known as a probability model. If the probability of each outcome is the same, the probability model is called a uniform probability model. If the probabilities are different, it is called a nonuniform probability model
2. Explain whether the probability model for flipping the 2 coins is uniform or nonuniform.
ManuscriptCopy
3. If the 2 coins are flipped twice, are the events independent or dependent?
4. If the 2 coins are flipped twice, determine the probability of getting RG both times.
Brad was rolling 2 fair number cubes and was interested in whether the probability distribution for the sum was uniform or nonuniform.
5. Complete the table by determining the sum of 2 number cubes.
6. Use the table to determine the probability of the 2 number cubes rolling the indicated sum.
ManuscriptCopy
a. ��(3)=
b. ��(7)=
c. ��(12)=
7. Explain whether the probability model for the sum of the number cubes is uniform or nonuniform.
8. If the 2 numbered cubes are rolled twice, determine the probability that the sum will be 12 both times.
Guided Activity: The Multiplication Rule
1. Based on a 1992 study by the US Department of Agriculture, it was found that 70% of commercially grown strawberry samples and 45% of commercially grown tomato samples contained traces of agricultural poisons (insecticides, herbicides, fungicides). Prior to this study, there was little oversight on pesticides used on fruits and vegetables in the United States.
a. What is the probability that a randomly selected strawberry and randomly selected tomato from the study contained traces of agricultural poisons?
b. What is the probability that neither the randomly selected strawberry nor the randomly selected tomato from the study contained traces of agricultural poisons?
c. Are the events of selecting a random strawberry and a random tomato independent?
2. Consider rolling a six-sided number cube and then drawing a card from a standard deck of playing cards.
a. What is the probability of rolling a 1, and then drawing a red ace?
b. What is the probability of not rolling a 5, and then drawing a jack?
c. What is the probability of rolling a number greater than 4, and then drawing a face card?
Lesson Summary
Compound events are 2 or more events occurring together. The multiplication rule is used to find the probability of compound events �� and ��.
• If 2 events, �� and ��, are independent, then ��(��∩��) = ��(��) ∙ ��(��).
• If 2 events, �� and ��, are dependent, then ��(��∩��) = ��(��) ∙ ��(��|��) and ��(��∩��) = ��(��) ∙ ��(��|��).
Suppose a bag contains 3 grape candies, 4 cherry candies, 1 apple candy, and 2 watermelon candies. Giada randomly selects a candy from the bag, looks at it, replaces it in the bag, and then randomly selects another candy. Because the 2 events are independent, the probability that Giada gets a cherry candy and then a grape candy is ��(ch erry∩grape) = ��(ch erry)∙ ��(grape) = 4 10 ∙ 3 10 .
Hassan takes the bag from Giada and chooses 2 candies also. However, Hassan is hungry, and he eats the first candy before selecting the second candy from the bag. In this case, the events are dependent. ��(ch erry∩grape) = ��(ch erry)∙ ��(grape|ch erry) = 4 10 ∙ 3 9
A probability model shows the outcomes of a chance experiment and the probability for each outcome. For example, the probability model of flipping 2 fair coins is shown.
Outcomes HH HT TH TT
Since the probabilities of each outcome are the same, this is known as a uniform probability model. If the 2 coins are flipped together twice, the probability of getting 2 heads both times can be found using the multiplication rule, ��(����∩����)
Practice Problems
1. A cup that contains candy-coated chocolate candies has 3 red candies, 2 blue candies, and 5 brown candies. One candy is chosen, recorded, and then replaced.
a. Find the probability that 3 blue candies are selected.
b. Find the probability that the candies selected include 1 red, 1 blue, and 1 brown candy.
ManuscriptCopy
c. A student was recording the candies being selected and got hungry. Find the probability that the student will select, in order, 2 red, 3 brown, and 1 blue candy if the student eats each piece of candy after selecting it.
2. Box 1 has 2 red marbles and 1 blue marble. Box 2 has 3 blue marbles and 1 red marble. A coin is tossed. If it is heads, then a marble is selected from Box 1. If it is tails, then a marble is selected from Box 2.
a. Find the probability of getting tails and pulling a red marble.
b. Find the probability of getting heads and pulling a blue marble.
3. A red number cube and a blue number cube are rolled together. Both number cubes have faces labeled 1 to 6.
a. Write all outcomes in the sample space for the numbers on the 2 cubes for 1 roll.
b. Explain whether this is a uniform or nonuniform probability model.
c. If the 2 cubes are rolled together 3 times, find
Review Problem
6
.
ManuscriptCopy
4. The table shows the preferences of 40 students surveyed about the design of a new T-shirt for students who are graduating this year.
What is the probability that a student surveyed, selected at random, preferred a pink T-shirt with long sleeves?
Unit 10, Lesson 8: Using Probability to Determine Whether Events Are Independent
Warm-Up: Which One Doesn’t Belong: Events
A coin is flipped, and a standard number cube is rolled. Which one doesn’t belong?
Set 1
Event A1: the coin landing heads up
Event B1: rolling a 3 or 5
Set 3
Event A3: rolling a prime number
Event B3: rolling an even number
ManuscriptCopy
Set 2
Event A2: rolling a 3 or 5
Event B2: rolling an odd number
Set 4
Event A4: the coin landing heads up
Event B4: the coin landing tails up
Exploration Activity: Overtime Wins
Does a hockey team perform differently in games that go into overtime (or shootout) compared to games that don’t? The table shows data about the team over 5 years.
Let �� represent the event “the hockey team wins a game” and B represent “the game goes to overtime or shootout.”
1. Use the data to estimate the probabilities. Explain or show your reasoning.
ManuscriptCopy
a. ��(��)
b. ��(B)
c. ��(�� ∩ B)
d. ��(�� | B)
2. We have seen two ways to check for independence using probability. Use your estimates to check whether each might be true.
3. Based on these results, do you think the events are independent?
ManuscriptCopy
a. ��(�� | B) = ��(��)
b. ��(�� ∩ B) = ��(��) ⋅ ��(B)
Collaborative Activity: Genetic Testing
A suspected cause of a disease is a variation in a certain gene. A study gathers at-risk people at random and tests them for the disease as well as for the genetic variation.
Has the Disease Does Not Have the Disease
A person from the study is selected at random. Let �� represent the event “has the disease” and B represent “has the genetic variation.”
1. Use the table to find the probabilities. Show your reasoning.
ManuscriptCopy
2. Based on these probabilities, are the events independent? Explain your reasoning.
a. ��(��)
b. ��(B)
c. ��(�� ∩ B)
d. ��(�� | B)
3. A company that tests for this genetic variation has determined that someone has the variation and wants to inform the person that they may be at risk of developing this disease when they get older. Based on this study, what percentage chance of getting the disease should the company report as an estimate to the person? Explain your reasoning.
Guided Activity: Lie Detector Test
A company that makes lie detector tests was interested in the effectiveness of the test. They used a random sample of 1,000 people, some of whom were lying and some of whom were telling the truth. All 1,000 participants were given a lie detector test, and the researcher recorded whether they passed or failed. The results of the test are shown in the tree diagram.
1. Use the tree diagram to determine the number of outcomes for each event.
a. Lying b.
ManuscriptCopy
2. Use the tree diagram to determine the probability of each event.
a. ��(Lying)
b. ��(Fail)
c. ��(Lying∩ Fail)
d. ��(Pass)
e. ��(Pass |Telling the Truth)
3. Does ��(Lying∩Fail)= ��(Lying) ∙ ��(Fail)?
4. Explain whether the events lying and failing the lie detector test are independent.
5. Does ��(Pass|Telling the Truth)= ��(Pass)?
6. Explain whether the events passing the lie detector test and telling the truth are independent.
ManuscriptCopy
7. What conclusion can the company make about the effectiveness of the lie detector test? Explain your reasoning.
Lesson Summary
Determining whether 2 events are independent is sometimes intuitive based on the context and information given. In some cases, it is necessary to analyze probabilities to determine whether 2 events are dependent or independent.
• One way to recognize independence between 2 events is by understanding the experiment well enough to verify whether the occurrence of event �� affects the probability of event ��.
For example, when flipping a coin and rolling a standard number cube, the events “a coin landing heads up” and “rolling a 4 on a number cube” are independent because the coin landing heads up does not change the probability of rolling a 4 on a number cube.
• A second way to verify the independence of 2 events is to use conditional probability, where events �� and �� are independent if ��(�� | ��)= ��(��).
For example, consider the events “gets a hit on the second time to bat in a game” and “struck out in the first at bat in a game” for a baseball player. Using the data from the season for the player’s second at bat, ��(hit on second at bat)= 0.324 and for the player’s second at bat after a strikeout, ��(hit on second at bat| strike out on first at bat) = 0.324.
Since ��(hit on second at bat| strike out on first at bat)= ��(hit on second at bat), the events are independent.
• Another way to determine independence is to use the multiplication rule, where events �� and �� are independent if ��(A ∩ B)= ��(��)⋅ ��(��).
ManuscriptCopy
For example, consider the events “making the first free throw shot” and “making the second free throw shot” for a basketball player shooting 2 free throws after a foul. Using the data for the 2 shots for the player throughout the year, ��(make the first shot) = 0.72, ��(make the second shot)= 0.72, and ��(make the first shot∩ make the second shot) = 0.52. Since 0.72⋅ 0.72≈0.52, the events are independent.
Practice Problems
1. The two-way table shows the number of games played by a team divided into categories based on whether the team warmed up or not as well as whether they made more shots than they missed during the game.
One of these games is selected at random. For each question, Event �� is “game played when warmed up” and Event �� is “more shots made than missed.” Use the data to estimate the probabilities.
��(��)
��(��)
��(�� ∩ ��)
d. ��(�� | ��)
e. Use (��| ��) = ��(��) and ��(�� ∩ ��)= ��(��) ⋅ ��(��) to determine if the two events are dependent or independent. Show or explain your reasoning.
ManuscriptCopy
a.
b.
c.
2. The two-way table shows the number of counties in northwestern Iowa where the average corn yield was more than 200 bushels per acre for the years 2016 and 2017.
a. What does the value 3 represent in the table?
b. What is the probability that a county in northwestern Iowa selected at random had an average corn yield of more than 200 bushels per acre under the condition that it is 2016?
c. A historical record is selected from among these 24 about corn yield in northwestern Iowa counties. Let �� represent the event that the record shows more than 200 bushels. Let �� represent the event that the record is from 2016. Are events �� and �� dependent or independent? Explain your reasoning.
3. The two-way table summarizes whether or not a cross-country team had practice when it was raining and when it was not raining at the end of the school day.
a. When it was raining at the end of the school day, what is the probability that cross-country practice was held?
b. When it was not raining at the end of the school day, what is the probability that cross-country practice was held?
c. Are the events of “holding cross-country practice” and “raining at the end of the school day” dependent or independent events? Explain your reasoning.
4. Diego randomly selects a card from a standard deck of cards. He places it on his desk and then Clare randomly selects a card from the remaining cards in the same deck.
a. What is the probability that Diego selects a card that has hearts on it?
b. What is the probability that Clare selects a card that has hearts on it?
c. What is the probability that Diego selects a card that has hearts on it and that Clare selects a card that has hearts on it?
d. Are the events of Diego and Clare randomly selecting a card dependent or independent? Explain your reasoning.
5. A spinner is divided into 8 equal sections. 2 of them are bronze, 1 of them is silver, and 5 of them are gold.
a. What is the probability that it lands on bronze?
b. What is the probability that it lands on silver or gold?
c. What is the probability that it lands on platinum?
ManuscriptCopy
Unit 10, Lesson 9: Combinations and Permutations
Warm-Up: Bedtime Stories
Stevie has five books on a shelf, Goodnight Moon, The Very Hungry Caterpillar, Where the Wild Things Are, The Cat in the Hat, and Madeline. He is going to randomly choose 2 of the books to read to his son at bedtime.
1. Determine the sample space.
2. How many outcomes are in the sample space?
ManuscriptCopy
Exploration Activity: Permutations and Combinations
There are 4 runners on the cross-country running team at a high school in Williamsburg, South Carolina, who are in the running for the state championship. The roster of the runners is shown.
1. In a practice run, the coach is trying to create groups of 2 runners to run as a team.
a. List all the possible ways 2 runners can be selected in a team.
Members of the Cross-Country Team
b. How many outcomes are in the sample space of groups of 2 runners?
2. At a local cross-country meet, the 4 runners are competing individually. The 2 fastest runners place in 1st and 2nd place.
a. List all the possible ways the runners can place in 1st and 2nd place.
b. How many outcomes are in the sample space of runners placing in 1st and 2nd place?
3. Discuss with your partner why the values of problems 1 and 2 are different. Summarize your discussion.
ManuscriptCopy
Amari
Ember
Navaeh
Xavier
Collaborative Activity: Permutations and Combinations
Refer to the Lesson Summary for definitions of combination and permutation.
1. Identify whether each situation is a combination or permutation.
Situation
Picking a president, vice president, and secretary from 10 members of a club
Arranging 5 textbooks on a bookshelf
Selecting 3 flavors of ice cream for a sundae
Putting 3 digits from 0 to 9into a lock to open it
Arrangement
Combination Permutation
Combination Permutation
Combination Permutation
Combination Permutation
2. There are 7 girls and 4 boys in a school play. Three students will be randomly selected to get measured for their costumes. Determine the number of outcomes in the sample space.
3. Every student at a local high school is assigned a four-digit code, such as 3794, to access their locker. In each code, no digit is repeated. How many outcomes are in the sample space for locker codes?
ManuscriptCopy
4. Seven pieces of paper with the numbers 1 to 7 are placed in a hat. After mixing the slips of paper, 3 slips are picked without being put back into the hat.
a. Discuss with your partner the difference between 7��3 and 7��3. Summarize your discussion.
b. Calculate 7��3 and 7��3.
Guided Activity: Frozen Vegetables
A family has 10 different packages of frozen vegetables in their freezer: asparagus, broccoli, carrots, cauliflower, corn, green beans, lima beans, peas, sweet potatoes, and zucchini.
The family wants to randomly select 2 packages of vegetables from the freezer to have as side dishes with dinner.
1. Explain whether the situation is a combination or a permutation.
2. Determine the number of outcomes in the sample space.
ManuscriptCopy
The family decides that 1 of the chosen packages of vegetables will be used for an appetizer and 1 will be used for a side with dinner.
3. Explain whether the situation is a combination or a permutation.
4. Determine the number of outcomes in the sample space.
5. What is the probability that the family will choose corn for an appetizer and peas for a side dish?
Lesson Summary
To determine the number of possible outcomes from a chance experiment, several strategies can be used.
• Make a list of all possible ways the events can occur using a sample space or a list.
• Draw a tree diagram with frequencies to represent possible outcomes.
• Draw a Venn diagram with the number of possible outcomes of each event.
ManuscriptCopy
• Make a table with outcomes for each event as columns and rows with the combined outcomes in the middle of the table.
• Use combinations or permutations, depending on the given scenario.
For example, if the club at a school has 20 members and the sponsor of the club wants to randomly select 3 members to be on a fundraising committee, the sample space can be determined using combinations. A combination is a method of grouping where the order of selection doesn’t matter.
• To calculate the number of combinations, use �� �� �� = ��! ��!(��−��)!, where �� is the total number of possible choices and �� is the number of items being chosen. The operation ��! is known as a factorial, where ��! = ��×(�� – 1)×(�� – 2)× . . . 2×1. For example, 5! = 5×4×3×2×1.
When the club sponsor is randomly selecting 3 members out of 20 for the committee, to determine the number of outcomes in the sample space, use 20��3 = 20! 3!(20 – 3)! = 20! 3!17! = 20∙19∙18 6 = 1,140. Thus, there are 1,140 possible 3-person committees that the sponsor can choose.
• If the sponsor decides that when he randomly selects the 3 students, 1 student should be the president, 1 should be vice president, and 1 should be secretary, the situation now would represent a permutation because the order of selection matters.
To calculate the number of permutations, use �� �� �� = ��! (��− ��)! , where �� is the total number of possible choices and �� is the number of items being chosen. When the sponsor is selecting a president, vice president, and secretary, to determine the number of outcomes in the sample space, use 20��3 = 20! (20– 3)! = 20! 17! = 20 ∙ 19 ∙ 18 = 6,840. Thus, there are 6,840 ways the sponsor can choose a president, vice president, and secretary.
Notice the sample space using permutations is significantly larger than combinations because a different order creates a different outcome. Suppose 3 students, Albert, Blue, and Charlie, are selected in both scenarios described. If the 3 students are selected for the committee, they represent 1 possible combination. If the 3 students are selected for the positions, then Albert, Blue, and Charlie would represent a different scenario from Blue, Charlie, and Albert or Charlie, Blue, and Albert. In fact, for the 1 combination of Albert, Blue, and Charlie, there are 6 permutations using the same 3 students.
Practice Problems
1. A magazine editor has selected 14 photographs to feature on their social media post, including 1 of Mary Jo and 1 of Latrell. The photos are placed in random order online. There is room for 2 photos to feature at the top of the post.
a. How many different possible ways are there to select 2 feature photos?
b. What is the probability that Mary Jo and Latrell’s photos will be selected as feature photos?
2. To play the lottery, players select 5 numbers from 1 to 69. As long as the player has all 5 numbers, then they win the grand prize.
a. Explain if playing the lottery is a permutation or combination.
b. What is the probability of a player winning the grand prize with all 5 winning numbers?
3. Rajesh has 30 different songs in his playlist. He set the playlist to randomly select 3 songs to play at the beginning of the party.
a. How many outcomes are in the sample space if Rajesh doesn’t care about the order of the 3 songs?
b. How many outcomes are in the sample space if first 3 need to be played in the order requested by the host?
ManuscriptCopy
4. Han randomly selects a card from a standard deck of cards. He places it on his desk and then Jada randomly selects a card from the remaining cards in the same deck.
a. What is the probability that Han selects a card that has diamonds on it?
b. What is the probability that Jada selects a card that has diamonds on it?
c. What is the probability that Han selects a card that has diamonds on it and that Jada selects a card that has diamonds on it?
d. Are the events of Han and Jada randomly selecting a card dependent or independent? Explain your reasoning.
ManuscriptCopy
5. An agriculturist takes 50 samples of soil and measures the levels of two nutrients, nitrogen and phosphorus. In 46% of the samples the nitrogen levels are low and in 28% of the samples the phosphorus levels are low. In 10% of the samples both the nitrogen and the phosphorus levels are low. What percentage of the samples have nitrogen levels or phosphorus levels that are low?
Unit 10, Lesson 10: Probabilities in Games
Warm-Up: Rock, Paper, Scissors
There is a classic game called “Rock, Paper, Scissors.” Two people play by counting to 3 together, and then making a hand gesture to resemble paper (hand flat, palm down), rock (fist), or scissors (two fingers extended).
• When paper and rock are shown, paper wins the round.
• When paper and scissors are shown, scissors wins the round.
• When rock and scissors are shown, rock wins the round.
• When both players show the same thing, the round is a tie.
Find a partner and play the game with them 10 times in a row. Record the number of times you have played the game, the name of your opponent, what each person shows in each round, and who is the winner. Find another partner and play another 10 times in a row.
1. Is the event “win the round” dependent on another event? Explain your reasoning.
2. Choose an event that you think might influence the probability of winning, and then analyze the data using probability to determine whether the event you chose to study is independent of winning. Provide evidence to support your claim.
ManuscriptCopy
Collaborative Activity: Guess Which Card
Your teacher will give you 3 index cards.
• Leave one card blank.
• Use a ruler to draw lines connecting opposite corners to make an X on one side of the second card.
• Use a ruler to draw lines connecting opposite corners to make an X on both sides of the third card.
• Put all three cards in the bag.
One partner will remove a card from the bag and place it on the desk immediately so that only one side of the card can be seen. The goal is to guess correctly which card is on the desk: the blank card, the card with an X only on one side, or the card with an X on both sides.
1. Noah is playing the game and is looking at a card that shows an X. He says, “I have a fifty-fifty chance of correctly guessing which card it is.” Do you agree with Noah? Explain your reasoning.
Play the game many times with your partner, taking turns for who takes a card out of the bag. Record whether the side that shows has an X or is blank, which card you guess, and which card it actually is when you check. Continue to play until your teacher tells you to move on.
ManuscriptCopy
2. Use the results from your games to estimate ��(the card had an X on both sides |the side showing had an X on it). Explain or show your reasoning.
3. Since all the outcomes are known, find the actual probability ��(the card had an X on both sides | the side showing had an X on it). Explain or show your reasoning.
Lesson Summary
The study of probability includes two types of probability: theoretical probability and experimental probability.
Theoretical probability is a number between 0 and 1 representing the likelihood of an event in a theoretical model based on a sample space.
Experimental probability is the ratio of the number of times an event occurs to the total number of trials or times the activity is performed.
The probability model uses theoretical probability to anticipate the probability of possible outcomes. For example, the theoretical probability of tossing heads up on a fair coin is 1 2 . Consider an experiment where the coin is tossed 10 times. Based on the theoretical probability, it would be expected that the coin lands on heads 5 of the times, or 1 2 of the tosses. However, it would not be unusual for the coin to land on heads 7 times or even 3 times. The probability observed in an experiment, in this example 7 10 or 3 10 , may be close to the theoretical probability. However, when there are few recorded observations, or outcomes, there may be a difference between the theoretical and experimental probability.
If the same experiment was conducted 500 or 1,000 times, it would be very likely that 1 2 of the observed outcomes would be heads and 1 2 would be tails. This concept, called the law of large numbers, will be explored in future courses.
ManuscriptCopy
Practice Problems
1. The two-way table shows the number of eggs laid by 10 Rhode Island red chickens and 10 leghorn chickens in July and August.
A chicken is selected at random. For each question, Event �� is “egg laid by a Rhode Island red chicken” and Event �� is “egg laid in July.” Use the data to estimate the probabilities.
a. ��(��)
b. ��(��)
c. ��(�� ∩ ��)
d. ��(�� | ��)
e. Use (��| ��) = ��(��) and ��(�� ∩ ��)= ��(��) ⋅ ��(��) to determine if the two events are dependent or independent. Show or explain your reasoning.
ManuscriptCopy
2. Clare finds an article in the online student newspaper that says, “There are more students in the 9th grade this year than last year and there are more students in the 12th grade who are graduating this year than last year.” Are the events “the number of students in the 9th grade” and “the number of 12th graders who are graduating” dependent or independent events? Explain your reasoning.
3. The two-way table summarizes whether or not a softball team had practice when it was raining and when it was not raining at the start of the day.
a. When it was raining at the start of the day, what is the probability that softball practice was held?
b. When it was not raining at the start of the day, what is the probability that softball practice was held?
c. Are the events of “holding softball practice” and “raining at the start of the day” dependent or independent events? Explain your reasoning.
4. Mai rolls a standard number cube and then flips a fair coin. What is the probability that Mai flips heads under the condition that she rolls a 5?
5. A total of 40 elementary, middle, and high school students participate in a fun run as a fundraiser. They are surveyed after the fun run to find out how many of them completed the fun run without walking. The results of the survey are shown in the table.
Mai wants to know the probability that one of the participants in the fun run selected at random is an elementary school student or did not walk during the fun run. To figure this out, she adds the three values in the second row of the table (4, 14, and 11) to the two values listed under the heading “elementary school” (8 and 4). She then divides that answer by 40 and obtains a probability of 41 40 . Mai realizes that 41 40 is greater than 1 and determines that she must have made a mistake.
a. What is Mai’s mistake? Explain your reasoning.
b. How does the addition rule account for this kind of mistake?