

GEOMETRY WITH STATISTICS
SOUTH CAROLINA
ISBN: 979-8-89353-912-7
Math Nation AGA was originally developed by Illustrative Mathematics®, and is copyright 2019 by Illustrative Mathematics. It is licensed under Creative Commons Attribution 4.0 International License (CCBY 4.0).
The online curriculum resource platform offered at "mathnation.com", including the videos and practice questions, as well as custom curriculum adaptations, are additions to the original Illustrative Mathematics content is copyright 2024 by Accelerate Learning, Inc.
The trademark "Math Nation" is owned by Accelerate Learning, Inc. All other trademarks and product names referred to in the Math Nation AGA curriculum are the property of their respective owners and used solely for educational purposes. Unless otherwise stated, Math Nation has no relationship with any of the companies or brands mentioned in the curriculum and does not endorse or have a preference for any of those companies or brands.
This curriculum includes public domain images or openly licensed images that are copyright by their respective owners. Openly licensed images remain under the terms of their respective licenses. See the image attribution section for more information.
ManuscriptCopy
ManuscriptCopy
ManuscriptCopy
ManuscriptCopy
Unit 6: Relationships in Triangles and Quadrilater
ManuscriptCopy
Unit 6, Lesson 1: Centroid of a Triangle
Warm-Up: Notice and Wonder
Salt is poured onto a triangle until it piles up. As the salt piles up, the pile reaches a maximum height. As the salt reaches a maximum height, new grains of salt fall off whichever side of the triangle is closest.
1. What do you wonder about the salt pile?
2. What do you notice about the point where the salt reaches a maximum height?
ManuscriptCopy

Collaborative Activity: Exploring the Centroid of a Triangle
1. All polygons have a balancing point. The diagrams show the balancing point of a triangle.
a. What do you notice?

b. Discuss with your partner how you think the balance point was found. Summarize your discussion.

A point of concurrency is a point where 3 or more lines intersect.
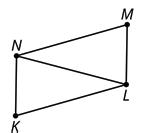
Triangle ������ is shown, where point �� is a point of concurrency, and ����, ����, and ���� are medians of ∆������.
2. Discuss with your partner how to find the midpoints of the triangle’s sides using tracing paper. Summarize your discussion.

3. Triangle ������ is shown.

a. Use the steps to locate the centroid of ∆������.
Step 1: Trace ∆������ on tracing paper.
Step 2: Fold ���� to find its midpoint. Label it as point ��.
Step 3: Draw the median from point �� to the opposite vertex, ∠������.
Step 4: Fold ���� to find its midpoint. Label it as point ��.
Step 5: Draw the median from point �� to the opposite vertex, ∠������.
Step 6: Fold ���� to find its midpoint. Label it as point ��.
Step 7: Draw the median from point �� to the opposite vertex, ∠������.
Step 8: Draw point ��, the point of concurrency where medians ����, ����, and ���� intersect.
b. What do you notice about the location of point �� in ∆������?
ManuscriptCopy
4. Triangle ������ is shown, with medians ����, ����, and ����. Point �� is the midpoint of ����, point �� is the midpoint of ����, and point �� is the midpoint of ����.

a. Copy the first segment given in the table using tracing paper. Use the copy to determine the relationship that the first segment and the point have with the second segment. Complete the table. First
b. Write a conjecture about the distance a centroid is from the vertex and the distance a centroid is from the midpoint of the opposite side.
ManuscriptCopy

Guided Activity: Solving Problems Involving the Centroid of a Triangle
1. Triangle ������ is shown, where point �� is the centroid of the triangle, ���� = 11.3, ���� = 20.55, and ���� = 15.2.

a. Find each measure.
b. If ���� = 6�� + 3 and ���� = 10�� − 7, what is the length of ����?
ManuscriptCopy
2. Triangle ������ is shown, where point �� is the centroid of the triangle.
���� = 5�� − 9, ���� = 3�� + 7, ���� = 12�� − 9,
���� = 1.75��, ���� = 4�� + 2, and ���� = �� + 9.
a. Find the value of each variable.

b. Find each measure.
Lesson Summary
Triangles have a balancing point called the centroid. The centroid of a triangle is the intersection of the 3 medians of the triangle.
A median of a triangle is a line segment from a vertex of a triangle to the midpoint of the opposite side.
Triangle ������ is shown, with medians ����, ����, and ����. Point �� is the centroid.

The length from a vertex to the centroid is twice the length from the centroid to the midpoint of the opposite side, which yields a ratio of 2 ∶ 1.
In ∆������, the relationship between vertex �� and the centroid �� can be expressed as either ���� = 2(����) or 1 2 (����) = ����. These relationships can be used to find the lengths of medians of triangles.
ManuscriptCopy

Practice Problems
1. Triangle ������ is shown, where point �� is the centroid of the triangle.
���� = 1 2 �� − 4, ���� = 4.4, ���� = �� + 6, ���� = 2�� − 31, and ���� = 1 3 �� + 5.
a. What is the value of ��?

b. What is the value of ��?
c. Find each measure.
d. If ���� = 4�� − 10 and ���� = 2�� + 1, what is the length of ����?
2. Point �� is the centroid of ∆������, as shown. ���� = 6.2, ���� = �� + 6.5, ���� = 3�� + 7, ���� = 3�� − 7, and ���� = 3�� + 7.
a. Find the values of �� and ��.
=

b. Find each measure.
Review Problems
3. What is the length of side ����?

4. A triangle has sides with lengths 5, 12, and 13.
a. Verify this is a Pythagorean triple.
b. Approximate the acute angles in this triangle.
ManuscriptCopy
Unit 6, Lesson 2: Triangle Midsegment Theorem
Warm-Up: Would You Rather?
1. Would you rather use a coupon worth . . . $20 off your entire purchase? or 25% off your entire purchase?
2. Explain your choice.
ManuscriptCopy
Exploration Activity: Exploring Triangle Midsegment Theorem
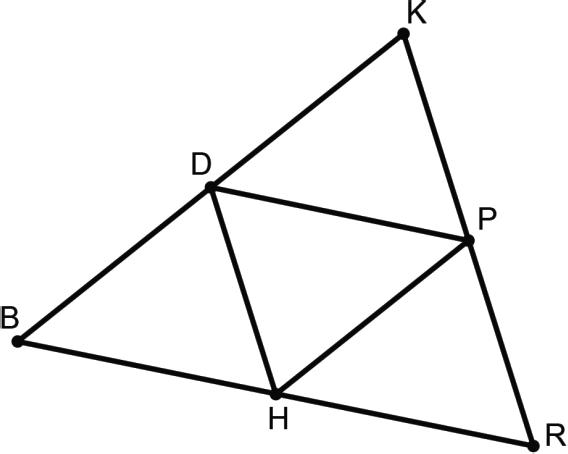
Triangle ������ and ∆������ are shown, where ���� ∥ ����.
1. Discuss with your partner what can be concluded from the given information. Justify your conclusions.

2. Given: ∆������ with ���� ∥ ����
Prove: ∆������ ~ ∆������
Complete the flowchart proof.
ManuscriptCopy

3. What other information about triangles ������ and ������ can be determined from knowing that ∆������ ~ ∆������?
4. Complete the table using the information ���� = 5, ���� = 6, ���� = 3, and ���� = 8.8.
5. What do you notice about the location of ����?
6. What do you notice about the lengths of ���� and ����?
ManuscriptCopy
Guided Activity: Solving Problems Using Triangle Midsegment Theorem
1. Triangle ������ is shown, where ���� is the midsegment. ���� = � 1 2 �� + 4�, ���� = (11�� − 2), ���� = (2�� + 5), ���� = (8�� − 2),
a. Find the value of ��.
b. Find the value of ��.
c. Find the value of ��.
d. What is the perimeter of ∆������?

2. Triangle ������ is shown, where ��, ��, and �� are the midpoints of each side, and the perimeter of ∆������ is 23.5. ���� = 17��, ���� = (6�� + 5), and ���� = (20�� − 3).
a. What is the value of ��?
b. Find each measure.
c. Triangle ������ and ∆������ are shown.
ManuscriptCopy
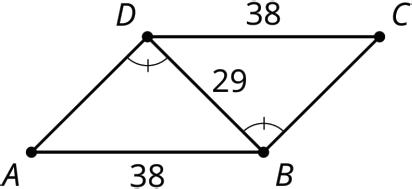
Complete the paragraph proof.
Given: ���� = ���� and ���� = ����
Prove: ���� ∥ ����

Since ���� = ���� and ���� = ����, point �� is the of ����, and point �� is the of ���� by .
Therefore, ���� is the of ∆������ by definition and ���� ∥ ���� by the .
Collaborative Activity: Triangle Midsegment Theorem
Eevee is building a swing set. She created ∆������, as shown, to represent the frame of the swing set, where ���� is the midsegment of ∆������.
���� = (6�� − 2) feet (ft.), ���� = (2�� + 0.2) ft., ���� = (10��) ft., and ���� = (6�� − 0.75) ft.
1. Determine the values of �� and ��.

2. Find each measure.
Lesson Summary
The triangle midsegment theorem can be used to find the side lengths of triangles. The triangle midsegment theorem states that the midsegment of a triangle joins the midpoints of 2 sides of the triangle such that its length is half the length of the third side of the triangle, and it is parallel to the third side of the triangle.
Triangle ������ is shown.
If ���� is the midsegment of ∆������, then the following statements are true.
• Point �� is the midpoint of ����.
• Point �� is the midpoint of ����.
• ���� ∥ ����
• ���� = 2(����)
• 1 2 (����) = ����

Practice Problems
1. Triangle ������ is shown, where ��, ��, and �� are midpoints. ���� = (5��), ���� = � 1 3 �� + 11�, ���� = (6�� − 5), ���� = (2�� − 2), ���� = (8�� + 8), and ���� = (3�� − 4).
a. Find the value of each variable.

b. Find each measure.
2. Triangle ������ is shown, where �� is the midpoint of ���� and �� is the midpoint of ����. ���� = 3�� + 2, and ���� = 4�� − 4.5.
a. Determine the value of ��.
b. What are the lengths of ���� and ����?
Review Problems

3. Approximate the angles that have the following quotients.
a. adjacent leg ÷ hypotenuse = 0.966
b. opposite leg ÷ hypotenuse = 0.469
c. adjacent leg ÷ hypotenuse = 0.309
d. opposite leg ÷ adjacent leg = 1.036
4. Select all the true equations.
□ sin(27°) = �� 15
□ cos(63°) = �� 15
□ tan(27°) = �� ��
□ sin(63°) = �� 15
□ tan(63°) = �� ��

Unit 6, Lesson 3: Solving Problems Using Triangle Relationships
Warm-Up: Objects May Appear Closer Than They Are
Since Earth’s orbit is an ellipse, Earth is slightly closer to the Sun in January. The picture shows 2 photos taken by the SOHO (Solar and Heliospheric Observatory) satellite. The left side shows the Sun on January 4, 2009, and the right side shows the Sun on July 4, 2009.
A scientist measured the 2 images of the Sun. She found that the diameter of the Sun in the image from January was 72 millimeters (mm) and 69 mm in the image from July.
ManuscriptCopy

1. By what percentage did the diameter of the Sun change between January and July?
Collaborative
1. For each problem, record your work and answer in the table.
Lesson Summary
Properties of triangles can be used to solve problems involving angle measures or side lengths of triangles. When solving a problem involving triangles, determine which property could be used based on the given information.
Some properties of triangles you have explored in this course or prior courses are listed.
• The Triangle Sum Theorem states that the sum of the interior angles of a triangle is 180°.
• The Exterior Angle Theorem states that the measure of an exterior angle of a triangle is equal to the sum of the measures of the 2 nonadjacent interior angles.
• The Triangle Inequality Theorem states that the sum of the lengths of any 2 sides of a triangle is greater than the length of the third side.
• In a triangle, the length from the vertex to the centroid is twice the length from the centroid to the midpoint of the opposite side, which yields a ratio of 2 ∶ 1.
• The Triangle Midsegment Theorem states that the midsegment of a triangle joins the midpoints of 2 sides of a triangle such that its length is half the length of the third side of the triangle, and it is parallel to the third side of the triangle.
Practice Problems
1. Triangle ������ is shown, where �� is the centroid, ���� = 3.5�� + 0.5, and ���� = 9.5�� − 4.
a. What is the value of ��?
ManuscriptCopy
b. What are the measures of ���� and ����?

2. Triangle ������ is shown, where ���� = 4�� + 1.3, ���� = 6�� − 1.4, and ���� = 14�� − 5.8.
Edwardo was determining the value of ��, but he made an error. His work is shown.
Edwardo’s Work
6�� − 1.4 = 4�� + 1.3 2�� = 1.7 �� = 0.85
a. Describe and correct the error Edwardo made.

b. What is the length of ����?
3. A new park is being built on a piece of land represented by ∆������, as shown. The city planner wants to place a fountain at the center of the park, represented by point ��. The medians of ∆������ (��̅��, ��̅��, and ����) represent the sidewalks leading to the fountain, where ���� = 26 yards (yd.), ���� = 40 yd., and ���� = 30 yd.
a. What is the length of ����?
ManuscriptCopy
b. What is the length of ����?
c. What is the length of ����?

Review Problems
4. Diego states that diagonal ���� bisects ∠������ and ∠������. Is he correct? Explain your reasoning.

5. Match the ratio of side lengths to its corresponding angle measure.
A. adjacent leg ÷ hypotenuse = 0.139 1. 14°
B. opposite leg ÷ adjacent leg = 0.249 2. 28°
C. opposite leg ÷ hypotenuse = 0.469 3. 47°
D. adjacent leg ÷ hypotenuse = 0.682 4. 58°
E. opposite leg ÷ hypotenuse = 0.848 5. 82°
Unit 6, Lesson 4: Congruent Quadrilaterals
Warm-Up: Fast Food Prices
A table of menu prices is shown.
1. What do you notice about the prices of the burgers with cheese?
2. What do you notice about ordering chips versus fries?
Exploration Activity: Congruence in Quadrilaterals
1. Quadrilaterals �������� and �������� are shown.
a. Copy �������� onto tracing paper. Place the tracing paper so that �������� is on top of ��������.
b. Discuss with your partner what you notice about the side lengths and angle measures of �������� and ��������.

c. What can you conclude about �������� and ��������?
d. Identify the transformation(s) that will map �������� onto ��������.
e. Discuss with your partner how to determine if the transformations that were used to map �������� onto �������� are rigid motions.
f. Complete the statement.
Quadrilaterals �������� and �������� are congruent similar because there exists a sequence of rigid motions that maps �������� onto ��������.
2. Quadrilaterals �������� and �������� are shown.

a. What rigid motions will map �������� onto ��������?
b. Complete the statement. �������� is congruent similar to �������� because there exist(s) 1 2 3 rigid motion(s) that map(s) �������� onto ��������.
c. Complete each congruence statement.
ManuscriptCopy
Guided Activity: Congruence in Quadrilaterals
1. Quadrilaterals �������� and �������� are shown on the coordinate plane.

a. Describe a sequence of rigid motions that can be applied to map �������� onto ��������.
b. Discuss with your partner what can be concluded from the rigid motions.
c. Ask a classmate for 2 conclusions they made. Record their conclusions, and summarize their reasons. You are the only person who should write in the first 2 columns of the table. Have your classmate initial next to your summary to indicate that your summary is correct.
Conclusion
My Summary of Their Reason
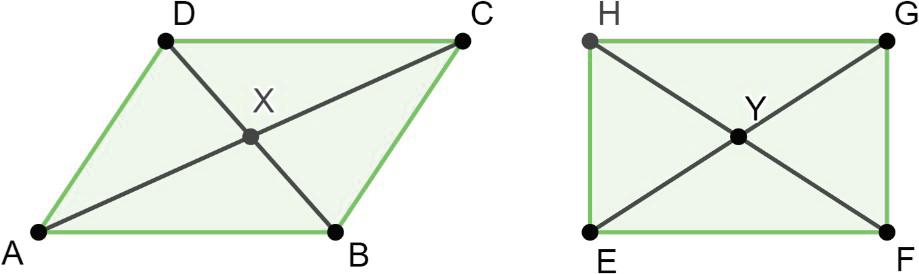
2. Quadrilaterals �������� and �������� are shown on the coordinate plane.

a. Explain how you could use tracing paper to determine �������� ≅ ��������.
b. Write a sequence of transformations that will map �������� onto ��������.
c. Show each step in the sequence of transformation on the coordinate plane.
ManuscriptCopy
• Draw ��′��′��′��′, the result of the first transformation.
• Map the vertices of �������� to ��′��′��′��′.
• Map the vertices of ��′��′��′��′ to ��������.
d. Complete the statements.
The outcome of mapping the transformations of �������� to ��′��′��′��′ and then of ��′��′��′��′ to shows that ��′ coincides with ��, ��, ��, ��, ��′ coincides with ��, ��, ��, ��, ��′ coincides with ��, ��, ��, ��, and ��′ coincides with ��. ��. ��. ��. Because
the definition of congruence similarity in terms of rigid motions preserves distance and angle measure, �������� is congruent similar to .
Collaborative Activity: Corresponding Parts in the Real World
Oscar and Aarna worked together to create a prototype obstacle for a drone obstacle course. They used grid paper to create their design as shown.
To be sure the design met regulations for the competition, they used the equations to input the design into a computer program. They discovered that some of their work disappeared, so they used the given equations, knowing that �������� ≅ ��������.
The perimeter of �������� is 293 centimeters (cm). Angle ������ is a right angle.
ManuscriptCopy

is the length of ����? Include units.
1. What is the value of ��?
2. What is the length of ����? Include units.
3. What
4. What is the value of ��?
5. What is ��∠������, in degrees?
6. What is ��∠������, in degrees?
Lesson Summary
If a quadrilateral can be mapped to another quadrilateral using only rigid transformations, all the corresponding parts of the 2 quadrilaterals are congruent. This understanding can then be applied to find the measurements of corresponding parts of congruent quadrilaterals. Congruent quadrilaterals have congruent corresponding side lengths and congruent corresponding angle measures.
ManuscriptCopy
To find the measurements of angle measures or side lengths of 2 congruent quadrilaterals, set up equations where the values or expressions of the corresponding parts are set equal to each other. Solve for the variables. Remember to substitute the value of the variable into the expression, if needed, to find the length of an unknown side or the measure of an unknown angle.
Practice Problems
1. Congruent quadrilaterals �������� and �������� are shown.

Some measurements of the angles in quadrilaterals �������� and �������� are given.
��∠������ = 90°, ��∠������ = 60°, ��∠������ + ��∠������ = 210°, ��∠������ = (2�� − 4)°,
= (�� + 25)°
a. Determine each measure.
��∠������ =
��∠������ =
Some measurements of the sides of quadrilaterals �������� and �������� are given. ���� = 5��, ���� = 4�� − 0.5, ���� = 6��, and ���� = �� + 1.
b. Determine the value of �� if the perimeter of quadrilateral �������� is 24.5.
c. What is the length of ����?
2. Quadrilateral �������� is shown. �������� ≅ �������� and ∆������ ≅ ∆������. The perimeter of �������� is 40.5.
a. Use the given measurements to find the value of ��. ���� = 2�� − 2, ���� = 3 2 �� − 1, ���� = 2�� + 5, ���� = 2�� − 2

b. Find the length of ����.
Review Problem
3. Select all quadrilaterals that have 180° rotational symmetry.
□ trapezoid
□ isosceles trapezoid
□ parallelogram
□ rhombus
□ rectangle
□ square
Unit 6, Lesson 5: Proving Properties of Parallelograms
Warm-Up: Parallel Lines and Four-Sided Figures
1. On a piece of tracing paper, draw a set of parallel lines. Overlap your tracing paper with a partner’s parallel lines to create an enclosed figure. Each partner should trace the enclosed shape onto a new piece of tracing paper.
a. Classify the enclosed shape.
b. Justify your classification.
c. Ask 2 classmates how they classified the figure they created. Record their classification and write your summary of their justification. You are the only person who should write in the first 2 columns of the table. Have the other person initial next to your summary, stating that your summary is correct.
Collaborative Activity: Properties of Parallelograms
1. Using a ruler, measure the pairs of opposite sides in each parallelogram that you and your partner created.
a. What do you notice?
b. Make a conjecture about the measures of opposite sides of a parallelogram.
2. Using a ruler, draw the diagonals of 1 of the parallelograms.
a. Determine the lengths of each diagonal.
b. Mark the point where the 2 diagonals intersect.
c. What do you notice about the point of intersection and its relationship to each diagonal?
d. Repeat the same steps to draw and measure the diagonals in your second parallelogram.
e. Make a conjecture about the diagonals of a parallelogram.
3. Using a protractor, measure the pairs of opposite interior angles of your parallelograms.
a. What do you notice?
b. Make a conjecture about the measures of opposite angles of a parallelogram.
c. Make a conjecture about the measures of consecutive angles of a parallelogram.
d. Make a conjecture about the sum of the interior angles of a parallelogram.
4. Based on your conjectures, select all the statements about a parallelogram that are true.
□ A parallelogram has only 1 set of opposite parallel sides.
□ A parallelogram has 2 sets of opposite parallel sides.
□ A parallelogram has only 1 set of opposite congruent sides.
□ A parallelogram has 2 sets of opposite congruent sides.
□ Consecutive angles of a parallelogram are congruent.
□ Consecutive angles of a parallelogram are supplementary.
ManuscriptCopy
□ Opposite angles of a parallelogram are congruent.
□ Opposite angles of a parallelogram are supplementary.
□ Diagonals of a parallelogram bisect each other.
5. For each true statement in the previous question, create a corresponding parallelogram and mathematical statements. Start by writing the true statements from the previous question in the first column. Then, draw, name, and mark a diagram that demonstrates that statement. Finally, write mathematical statements that express the relationships shown in the figure. The first row has been completed as an example.
Statement
A parallelogram has 2 sets of opposite parallel sides.
Drawing

Mathematical Statements
ManuscriptCopy
6. The Venn diagram shows the properties of a parallelogram and another type of quadrilateral called a kite.

Discuss with your partner why a kite is not considered a parallelogram.
ManuscriptCopy
Guided Activity: Proofs with Parallelograms
1. Quadrilateral �������� is shown.
Given: �������� is a parallelogram.
Prove: ���� ≅ ���� and ���� ≅ ����
Complete the following two-column proof.
Statement

Reason
Given
4. ���� ≅ ����
4. Reflexive property of congruence 5. ∆������
5. ASA congruence
CPCTC
2. Quadrilateral �������� has diagonals ���� and ����, which intersect at point ��.
Given: �������� is a parallelogram with diagonals ���� and ���� intersecting at point ��.
Prove: ���� bisects ����. ���� bisects ����.
Complete the following two-column proof.

Given
ASA congruence 6. 6. CPCTC
7. ���� = ���� and ���� = ���� 7.
8.
8. Definition of a segment bisector
3. Complete the flowchart proof. Statements go inside the boxes, and reasons go below the boxes.
Given: �������� is a parallelogram.
Prove: ∠�� is supplementary to ∠��, ∠�� is supplementary to ∠��, ∠�� is supplementary to ∠��, and ∠�� is supplementary to ∠��

ManuscriptCopy

Lesson Summary
A quadrilateral containing 2 pairs of parallel sides is called a parallelogram. Additional properties of parallelograms are shown.
• Opposite sides of a parallelogram are congruent.
• Opposite angles of a parallelogram are congruent.
• Consecutive interior angles of a parallelogram are supplementary.
• Diagonals of a parallelogram bisect each other.
These properties can be used to find the measures of angles or the lengths of sides in a parallelogram. They can also be used to prove whether a given quadrilateral is a parallelogram.
Quadrilateral �������� is a parallelogram, as shown. The following statements are true about ��������
Practice Problems
1. Parallelogram �������� is shown.
Select all the true statements.
ManuscriptCopy


2. Quadrilateral �������� is shown.
Given: ���� ≅ ���� and ���� ≅ ����
Prove: �������� is a parallelogram.
Complete the proof.
Statement
and

Reason
Given
CPCTC
If 2 lines are intersected by a transversal so that alternate interior angles are congruent, then the lines are parallel.
CPCTC
If 2 lines are intersected by a transversal so that alternate interior angles are congruent, then the lines are parallel.
�������� is a parallelogram. Definition of parallelogram
Review Problem
3. Triangles ������ and ������ are shown, where ���� ⊥ ����, ���� ⊥ ����, and ���� ≅ ����. Determine if ∆������ ≅ ∆������.

Unit 6, Lesson 6: Using Properties of Parallelograms
Warm-Up: Estimation
1. A picture of a bowl with a cereal square is shown.
a. Estimate the number of cereal squares that will fit around the inner circumference of the bowl.

A picture of the bowl with a diameter of cereal squares is shown.
b. Use the diameter of cereal squares to find the circumference.

c. Compare your estimate from part A to the circumference you found in part B.
ManuscriptCopy
Collaborative Activity: Determining Parallelograms
Work with your partner to determine if each figure given is a parallelogram. Complete the statements that follow.
1. Quadrilateral �������� is shown, where ��∠�� = 113°, ��∠�� = 67°, and ��∠�� = 103°.
a. I can conclude . . .
b. I know this because . . .

2. Quadrilateral �������� is shown with sides ���� and ���� each measuring 15 cm and sides ���� and ���� each measuring 9 cm.
a. I can conclude . . .
b. I know this because . . .

3. In quadrilateral ��������, ��∠�� = 120° and ��∠�� = (20�� + 47)°. If �� = 1 2 , determine whether the figure is a parallelogram.
a. I can conclude . . .
b. I know this because . . .

4. Quadrilateral �������� is shown, with diagonals ���� and ���� intersecting at point ��.
Given that ���� = 4�� + 7, ���� = 3�� − 2, ���� = 4�� − 3, and ���� = 7�� − 1, find the values of �� and �� that make �������� a parallelogram. �� = �� =

Guided Activity: Is It a Parallelogram?
1. Use the figure shown to complete the table. If it was given that . . . . . . would �������� be a parallelogram? Reason

ManuscriptCopy
2. Rocio recently inherited a large quadrilateral field from her Uncle Asher. Quadrilateral ��������, with diagonals ���� and ���� intersecting at point ��, is shown. She wants to partition the field into 4 triangular sections to make gardens. As she was taking measurements, Rocio noticed that the field was shaped like a parallelogram. Rocio found the following measurements:
��∠������ = 23°, ��∠������ = 72°, ��∠������ = 49°, and ��∠������ = 23°. Her uncle says the field is not a parallelogram.
a. Who is correct?

b. How do you know?
Lesson Summary
Properties of parallelograms can be used to determine if a quadrilateral is a parallelogram. The properties of parallelograms are shown.
• Opposite sides are parallel.
• Opposite sides are congruent.
• Opposite angles are congruent.
• Consecutive interior angles are supplementary.
• Diagonals bisect each other.
If any of the properties are true for a quadrilateral, then the quadrilateral is a parallelogram. These properties can also be used to solve mathematical and real-world problems. Use the information given in a problem to determine which property can be used. If opposite sides or opposite angles are congruent, then set the expressions equal to each other. If the consecutive interior angles are supplementary, then add the angle measures together, and set the expression equal to 180. If the diagonals bisect each other, then set the halves of a diagonal equal to each other.
Practice Problems
1. Quadrilateral �������� is shown, where ���� = 3�� − 1, ���� = 2�� − 3, ���� = 11, and ���� = 8.
a. If �� = 4 and �� = 6, determine whether �������� is a parallelogram.

b. If �������� is not a parallelogram, what value(s) for �� and �� would make it a parallelogram?
2. Quadrilateral �������� is shown, where diagonals ���� and ���� intersect, such that ���� = −�� + 4, ���� = 1 3 �� + 5, ���� = 5�� − 6, and ���� = 11 + ��.
a. If �� = 3 and �� = −2, determine whether �������� is a parallelogram.

b. If �������� is not a parallelogram, what value(s) for �� and �� would make it a parallelogram?
3. Tariq and Agnes were discussing the different properties of parallelograms. Together, they drew and labeled quadrilateral ��������, where ��∠������ = (5�� − 2)°, ��∠������ = ��°, and ��∠������ = 118°. What must the values of �� and �� be for their figure to be a parallelogram?

Review Problems
4. Match the ratio of side lengths to its corresponding angle measure.
1. 14°
ManuscriptCopy
A. adjacent leg ÷ hypotenuse = 0.139
B. opposite leg ÷ adjacent leg = 0.249
28°
C. opposite leg ÷ hypotenuse = 0.469
47°
D. adjacent leg ÷ hypotenuse = 0.682
E. opposite leg ÷ hypotenuse = 0.848
5. Here is ∆������. Match the description of the rotation with the image of ∆������ under that rotation.

1

ManuscriptCopy
2

Image 3

Rotate 60° counterclockwise around ��. 1. Image 1
Rotate 60° clockwise around ��. 2. Image 2
Rotate 120° clockwise around ��. 3. Image 3
Rotate 60° clockwise around ��. 4. Image 4
Image 4

Image
Image
A.
B.
C.
D.
Unit 6, Lesson 7: Special Parallelograms
Warm-Up: Play with Quadrilaterals
This activity requires the use of an applet, so please make your way over to the digital platform to find the link.

1. Which figures (if any) are always rectangles? Which figures can be dragged to make a rectangle?
2. Which figures (if any) are always parallelograms? Which figures can be dragged to make a parallelogram?
Exploration Activity: What Is a Rectangle?
1. Rectangle �������� is shown on the coordinate grid.
a. List everything you know about this type of quadrilateral.

b. Compare your list with your partner’s. Add anything to your list that you may have missed.
c. With your partner, list 2 truths and 1 lie about this type of quadrilateral. Share your list with another group to see if they can spot the lie.
2. Parallelogram �������� is shown.
a. Use a ruler to draw ���� and ����.
b. These segments are called .

c. Measure the length of these segments, in centimeters, and write them in the table. Include units.
Segment Length
d. Make a conjecture about the lengths of the diagonals of a rectangle.
e. Label the intersection point of the diagonals as point ��.
f. Measure the following segments, in centimeters, and write their lengths in the table. Include units.
Segment Length
g. What do you notice?
h. Make a conjecture about what happens to the diagonals of a rectangle when they intersect.
Collaborative Activity: Comparing Parallelograms and Rectangles
1. Work with your partner to complete the table. For each statement, check the box(es) to indicate which figure(s) the property is always true for.
Property
Opposite sides are congruent.
Opposite sides are parallel.
Opposite angles are congruent.
Consecutive angles are supplementary.
Diagonals bisect each other.
Diagonals are congruent.
All interior angles are congruent.
Parallelogram Rectangle
2. Based on the table, discuss with your partner whether a rectangle could be classified as a parallelogram.
3. Parallelogram �������� is a rectangle. Complete the statements. It is given that �������� is a rectangle. By the definition of a rectangle ∠��, ∠��, ∠��, and ∠�� are all right angles, acute angles, obtuse angles, which means that ��∠�� =
ManuscriptCopy

= ��∠�� =
= 90°. 180°. Since ��∠��+, ��∠�� = 180°, we can show that ���� ∥ ����, ���� ∥ ����, and since ��∠�� + ��∠�� = 180°, we can show that ���� ∥ ���� ���� ∥ ���� by the converse of the alternate interior angles consecutive interior angles theorem. Therefore, �������� is a parallelogram kite by definition.
Guided Activity: More Special Parallelograms
1. Parallelogram �������� is a square with diagonals ���� and ����, which intersect at point ��.
a. Use a ruler and a protractor to complete the table with the appropriate measurements. Include units.

b. Circle all the words that describe the diagonals of a square. congruent bisecting perpendicular
c. List the properties that determine whether a parallelogram is a square.
ManuscriptCopy
2. Parallelogram �������� is a rhombus with diagonals ���� and ����, which intersect at point ��.
a. Use a ruler and a protractor to fill in the chart with the appropriate measurements. Include units.

b. Circle all the words that describe the diagonals of a rhombus. congruent bisecting perpendicular
c. List the properties that determine whether a parallelogram is a rhombus.
d. What are the differences between a square and a rhombus?
3. Use the numbered statements in the box to fill in the Venn diagram comparing the properties of a rectangle, a square, and a rhombus.
1. Opposite sides are congruent. 6. Consecutive angles are supplementary.
2. Opposite sides are parallel. 7. All sides are congruent.
ManuscriptCopy
3. All angles are congruent. 8. Diagonals are congruent.
4. Diagonals are perpendicular. 9. Diagonals bisect each other.
5. Opposite angles are congruent.


4. Explain how to show that a parallelogram is a rectangle but not a rhombus or a square.
5. Explain how to show that a parallelogram is a rhombus but not a square or a rectangle.
6. Explain how to show that a parallelogram is a square.
Lesson Summary
Some parallelograms can be classified as a rectangle, rhombus, and/or square.
A rectangle is a quadrilateral that contains 4 right angles. It may be oblong or square and is a member of the following shape classes: polygons, quadrilaterals, trapezoids, parallelograms. Squares form a subclass of rectangles.
A rhombus is a quadrilateral containing 4 equal-length sides. It’s a member of the following shape classes: polygons, quadrilaterals, trapezoids, parallelograms. Squares form a subclass of rhombi.
ManuscriptCopy
A square is a quadrilateral with 4 right angles and 4 equal-length sides. It’s a member of the following shape classes: polygons, quadrilaterals, trapezoids, parallelograms, rectangles, rhombi.
All these special parallelograms include all the properties of a parallelogram that were explored in a previous lesson in addition to special properties for each figure.
The characteristics of the parallelogram determine if it can be classified as a special parallelogram. Some characteristics overlap, but others are specific to the shape.
• In rectangles and squares, all angles are congruent, and the diagonals are congruent.
• In rhombuses and squares, the diagonals are perpendicular, and all sides are congruent.
• In rectangles, squares, and rhombuses, opposite sides are congruent opposite sides are parallel, opposite angles are congruent, consecutive angles are supplementary, and the diagonals bisect each other.
For example, if a parallelogram only has perpendicular diagonals, then the parallelogram is a rhombus. If a parallelogram only has congruent diagonals, then the parallelogram is a rectangle.
Practice Problems
1. Rhombus �������� is shown with diagonals ���� and ���� intersecting at point ��. ���� = 42, ���� = 9�� − 12, ���� = 5.1�� + 4.2, and ���� = 7.6�� − 8.3.
a. Find the value of ��. Show your work.
b. What is the length of ����? Show your work.

2. Lin is using the diagram to prove the statement, “If a parallelogram has one right angle, it is a rectangle.” Given that �������� is a parallelogram and ∠������ is right, which reasoning about angles will help her prove that ∠������ is also a right angle?
A. Corresponding angles are congruent when parallel lines are cut by a transversal.
B. Opposite angles in a parallelogram are congruent.
C. Vertical angles are congruent.
D. The base angles of an isosceles triangle are congruent.

3. Match each conjecture with the rephrased statement of proof connected to the diagram.

a. The diagonals of a parallelogram bisect each other.
b. In a parallelogram, opposite sides are congruent.
c. A quadrilateral with opposite sides congruent is a parallelogram.
d. If the diagonals of a quadrilateral bisect each other, then it is a parallelogram.
Review Problem
1. In quadrilateral �������� with ���� ≅ ���� and ���� ≅ ����, show �������� is a parallelogram.
2. In parallelogram ��������, show ����
and ���� ≅
.
3. In quadrilateral �������� with ���� ≅ ���� and ���� ≅ ����, show �������� is a parallelogram.
4. In parallelogram ��������, show ���� ≅ ���� and ���� ≅ ����.
4. Select all true statements based on the diagram.

Unit 6, Lesson 8: More Parallelogram Proofs
Warm-Up: Notice and Wonder: Diagonals
This activity requires the use of an applet, so please make your way over to the digital platform to find the link.
Here is parallelogram �������� and rectangle ��������. What do you notice? What do you wonder?
ManuscriptCopy
Collaborative Activity: The Diagonals of a Parallelogram
1. Parallelogram �������� is shown, where diagonals ���� and ���� intersect at point ��.
a. Discuss with your partner what you know about the diagonals of a parallelogram.
b. Complete the proof.
Given: �������� is a parallelogram.
Prove: ���� bisects ����, and ���� bisects ����.
Statement
�������� is a parallelogram.

ManuscriptCopy
Reason
Given
Opposite sides of a parallelogram are congruent.
Definition of congruence
Collaborative Activity: Work Backwards to Prove
Given: �������� is a parallelogram with ���� ∥ ���� and ���� ∥ ����. Diagonal ���� is congruent to diagonal ����.
Prove: �������� is a rectangle (angles ��, ��, ��, and �� are right angles).

With your partner, you will work backwards from the statement to the proof until you feel confident that you can prove that �������� is a rectangle using only the given information.
Start with this sentence: I would know �������� is a rectangle if I knew .
Then take turns saying this sentence: I would know [what my partner just said] if I knew .
Write down what you each say. If you get to a statement and get stuck, go back to an earlier statement and try to take a different path.
ManuscriptCopy
Lesson Summary
A quadrilateral is a parallelogram if and only if its diagonals bisect each other. The “if and only if” language means that both the statement and its converse must be true. The 2 statements that can be used to explore the relationship between quadrilaterals and parallelograms are shown.
• If a quadrilateral has diagonals that bisect each other, then it is a parallelogram.
• If a quadrilateral is a parallelogram, then its diagonals bisect each other.
For example, quadrilateral �������� is shown.
To prove the first statement, make the statement specific.
If quadrilateral �������� has diagonals ���� and ���� that intersect at �� so that ���� ≅ ���� and ���� ≅ ����, then ���� ∥ ���� and ���� ∥ ����. If opposite sides are parallel, then �������� is a parallelogram by the definition of a parallelogram.

Triangles ������ and ������ can be proven congruent using side-angle-side (SAS) triangle congruence conditions. That means that corresponding angles in the triangles are congruent, so ∠������ ≅ ∠������. Therefore, if 2 lines intersect so that alternate interior angles are congruent, then ���� ∥ ����. An argument could also be made to show that ∆������ ≅ ∆������ so that ∠������ and ∠������ are congruent, which means that if 2 lines intersect so that alternate interior angles are congruent, then ���� ∥ ����. Therefore, by definition of parallelogram, �������� is a parallelogram.
Use quadrilateral �������� to prove the second statement.
First, make the statement specific.
If parallelogram �������� has ���� ∥ ����, ���� ∥ ����, and diagonals ���� and ���� that intersect at ��, then try to prove that �� is the midpoint of ���� and ����.
ManuscriptCopy

A transformation proof can also be used. Rotate parallelogram �������� by 180° using the midpoint of diagonal ���� as the center of the rotation. Then, show that the midpoint of diagonal ���� is also the midpoint of diagonal ����. That point must be �� because it is the only point on both ���� and ����. Therefore, �� must be the midpoint of both diagonals, meaning the diagonals bisect each other.
It has been proven that any quadrilateral with diagonals that bisect each other is a parallelogram and that every parallelogram has diagonals that bisect each other. Therefore, a quadrilateral is a parallelogram if and only if its diagonals bisect each other.
Practice Problems
1. Conjecture: A quadrilateral with one pair of sides both congruent and parallel is a parallelogram.
a. Draw a diagram of the situation.
b. Mark the given information.
c. Restate the conjecture as a specific statement using the diagram.
2. In quadrilateral ��������, ���� ≅ ���� and ���� ∥ ����. Show that �������� is a parallelogram.

3. What value of �� makes this equation true? sin(30°) = cos(��)
A. −30°
B. 30°
C. 60°
D. 180°
4. Here are 2 polygons.

Select all sequences of translations, rotations, and reflections below that would take polygon �� to polygon ��.
□ Reflect over ���� and then translate by directed line segment ����.
□ Translate by directed line segment ����, then reflect over ���� .
□ Rotate 60° clockwise around point �� and then translate by directed line segment ����.
ManuscriptCopy
□ Translate so that �� is taken to ��. Then rotate 120° clockwise around point ��.
□ Translate so that �� is taken to ��. Then reflect over line ����.
Unit 6, Lesson 9: Solving Real-World Problems with Parallelograms
Warm-Up: True or . . . Sometimes True? Parallelograms
Given that �������� is a parallelogram.
1. What must be true?
2. What could possibly be true?
3. What definitely can’t be true?
Collaborative Activity: Word Problem Gallery Walk
1. Work through the word problems with your partner. Show your work and write your answers in the space provided.
6 �������� a parallelogram. 7
The dimensions of �������� are .
Lesson Summary
Parallelograms are seen all around the world. The properties of parallelograms can be applied to real-world situations to find measures of angles and sides. When solving problems, use the given information to identify which property of parallelograms can be used, and then set up the equation.
Each property can be used to determine the type of parallelogram. The hierarchy of some quadrilaterals is shown.

For example, suppose a quadrilateral has 2 pairs of opposite parallel sides, and the diagonals are perpendicular bisectors.
• Since the quadrilateral has 2 pairs of opposite parallel sides, this quadrilateral is a parallelogram.
• Additionally, because the diagonals are perpendicular bisectors, the parallelogram can be classified more specifically as a rhombus.
ManuscriptCopy
• Since there is no information about the angles of the quadrilateral, it cannot be determined whether the quadrilateral is a square or a rectangle.
Practice Problems
1. I am a four-sided figure with 2 pairs of opposite parallel sides. At least 1 of my angles has a measure of 90° and both of my diagonals measure 12 inches (in.). Select all shapes that match this description.
□ Square
□ Rhombus
□ Rectangle
□ Quadrilateral
□ Parallelogram
2. In your own words, write a description of a parallelogram that is also a square.
3. If a given quadrilateral is a parallelogram, what additional information would be needed to show that the parallelogram is a rectangle?
4. If a given quadrilateral is a parallelogram, what additional information would be needed to show that the parallelogram is a rhombus?
5. Oliver’s carpentry company has been hired to build a fence around a vegetable garden. The gate must be a perfect rectangle. The gate Oliver built is shown, where quadrilateral �������� outlines the gate.
Oliver wants to be absolutely sure that the gate is a rectangle. Describe 2 different ways that Oliver can use his tape measure to ensure the gate is a true rectangle.

Review Problem
6. A triangle has sides with lengths 7, 24, and 25.
a. Verify this is a Pythagorean triple.
b. Approximate the acute angles in this triangle.
ManuscriptCopy
ManuscriptCopy
Unit 7: Area, Surface Area, and Volume
ManuscriptCopy
Unit 7, Lesson 1: Revisiting Relationships in Circles
Warm-Up: Manufacturing Engineer
Joenel Johnson, a senior manufacturing engineer, says that 1 of his job responsibilities is to interpret the design engineers’ drawings and explain them, in layman’s terms (common language), to the technicians he works with.
ManuscriptCopy
1. Describe a time when you had to work to interpret a math problem or had to explain it to a partner. What did you do to ensure that you or your partner understood the problem?
Collaborative Activity: Circumference of a Circle
Each region on a circle between 2 radii can be called a sector. The length of the portion of the circumference along each sector is referred to as an arc length.
For each colored sector shown on circle ��, the arc length is the same length as diameter ����.


1. If the 3 colored sectors were shown on the same circle, would the arcs encompass the circle’s circumference? Discuss with your partner.
2. If the length of the diameter is the same as each arc length shown, then about how many diameters would encompass the circle’s circumference?
Circle �� is shown with diameter ����.
3. Draw the 3 colored sectors and their arcs together.
4. Compare your drawing with your partner’s. Revise, if necessary.

Circle �� is shown with all 3 sectors, diameter ����, a line segment that is the same length as the diameter, and a line segment that is the same length as the circumference.

5. Discuss with your partner how to use the diagram to illustrate the formula �� = ����. Use the diagram to show your thinking, and, if necessary, explain your thinking.
6. On the line segment representing the circumference of circle ��, sketch each of the 3 sectors’ arc lengths to show how their combined length relates to the formula, �� = ����.
7. Complete the statements to describe the relationship shown in the series of screenshots of circle ��.
The perimeter circumference circle is equal to the length of the radius diameter times ��.
ManuscriptCopy
The value of �� is approximately . The screenshots show that the length of the radius diameter is the same as the length of slightly more than 2 3 4 radii. diameters.
Collaborative Activity: Area of a Circle
The circle shown is divided into sectors, which have been used to compose a new figure. Step 1 shows a circle that has been divided into 64 equal sectors. Step 2 shows dividing the sectors in half. Step 3 shows fitting the sectors together to compose a new figure. Step 4 shows the resulting figure.


1. How many sectors make up the base of the composed shape in step 4?
2. Discuss with your partner what is the best description of the shape in step 4.
3. In step 4, trace over the base of the composed shape. Then, trace over a corresponding part of the original circle in step 1.
ManuscriptCopy
4. In step 4, trace over the height of the shape. Then, draw over a corresponding part of the original circle in step 1.
Step 1
Step 2
Step 3
Step 4
5. Complete the statements.
The formula for the area of a rectangle is �� = ��ℎ. �� = 2����. The dimension of the circle that corresponds to the height of the rectangle in step 4 is the radius. the diameter. the circumference. half the circumference.
The dimension of the circle that corresponds to the base of the rectangle in step 4 is the radius. the diameter. the circumference. half the circumference.
6. In step 4, there is a part of the rectangle that does not contain any part of the circle. Select the number of equal sectors that would better complete the rectangle. Choose all that apply.
□ 4
□ 8
□ 12
□ 40
□ 63
□ 65
□ 100
□ 10,000
7. Complete the statements. As the number of equal sectors increases, decreases, the area of the rectangle would decreases, become a better approximation of the area of the circle.
8. Given the formula �� = 2����, work with your partner to find the measure of half the distance around a circle.

�� = 2���� Formula for the circumference of a circle is given.
2���� �� = Divide both sides of the equation by 2.
1 2 �� = Equation for half the circumference is now in simplified form.
9. Given the formula for the area of a rectangle, substitute the corresponding parts of a circle to discover the area of a circle.
�� = ��ℎ Formula for the area of a rectangle is given.
�� = ( )( )
ManuscriptCopy
Substitute the parts of a circle that correspond with the base and height of a rectangle.
�� = Multiply.
Lesson Summary
Recall the parts of a circle from 7th grade, including the radius, diameter, and circumference.
A radius is a line segment extending from the center of a circle to a point on the circle.
A diameter is a line segment from any point on the circle passing through the center to another point on the circle.
The circumference is the distance around a circle.
There is a proportional relationship between the diameter and circumference of any circle. The circumference of any circle is equal to the length of the diameter times ��. The formula for the circumference, ��, of a circle is �� = ���� or �� = 2����, where �� is the diameter and �� is the radius.
The area of a circle is not proportional to the diameter (or the radius).
The area of a circle is �� = ����2, where �� is the radius.
If �� is a circle’s circumference and �� is its radius, then �� = 2����. The area of a circle can be found by taking the product of half the circumference and the radius.
If �� is the area of the circle, then �� = 1 2 (2����) ∙ ��, which can be rewritten as �� = ����2 .
Practice Problems
1. The radius of a circle is 8.75 inches (in.).
a. Find the circumference of the circle in inches. Leave the answer in terms of ��.
b. Find the area of the circle in square inches (sq. in.). Leave the answer in terms of ��.
2. Aniyah and Peter used different methods to find the area of a circle with a diameter of 31 feet (ft.). Their work is shown, rounded to the nearest hundredth of a square foot (sq. ft.).
a. Whose method is correct?
b. Explain the mistake that the other student made.
3. Select the statement that must be true.
A. Parallelograms have at least one right angle.
B. If a quadrilateral has opposite sides that are both congruent and parallel, then it is a parallelogram.
C. Parallelograms have congruent diagonals.
D. The height of a parallelogram is greater than the lengths of the sides.
ManuscriptCopy
4. Figure �������� is a parallelogram. Is ∆������ congruent to triangle ∆������? Show or explain your reasoning.
ManuscriptCopy
Unit 7, Lesson 2: Finding the Area of Two-Dimensional Figures
Warm-Up: Failure
In a famous Nike commercial, basketball legend Michael Jordan says, “I’ve failed over and over and over again in my life, and that is why I succeed.”
1. What is a skill, activity, or subject that you have failed at?
2. Explain Mr. Jordan’s quote in your own words.
3. How can you turn a failure into a success story?
Collaborative Activity: Finding Area
Work with your partner to complete the following.
1. Complete the table.
2. How is the area of a triangle related to the area of a rectangle?
Area Formula
Figure
Rectangle Triangle
3. Parallelogram BNXT is shown on the coordinate grid.
Tyrese could not remember how to find the area of a parallelogram, so he divided the parallelogram into 2 triangles and a rectangle.
Working with your partner, use Tyrese’s method to find the area of BNXT.

Shape Area
Triangle 1
Triangle 2
Rectangle
Total area of parallelogram
4. Sarianna rearranged the parallelogram to create a rectangle, as shown.
Use Sarianna’s rectangle to find the area of BNXT.
ManuscriptCopy

5. Quadrilateral MBLY is decomposed on the coordinate grid, as shown. Use the decomposition shown to find the area of MBLY.

6. FHRW is shown on the coordinate grid.
a. Divide the quadrilateral into 2 triangles and a rectangle. Then, find the area of each.
Shape Area
Triangle 1
Triangle 2
Rectangle
b. What is the area of FHRW?
ManuscriptCopy

c. What type of quadrilateral is FHRW?
7. Ava found a formula for the area of a trapezoid: A = 1 2 h(b1 + b2), where h is the height and b1 and b2 are the bases. Use the given formula to find the area of FHRW.
8. THRK is shown on the coordinate grid.
a. What type of quadrilateral is THRK?
b. Determine the area of THRK. Show your work, or explain your thinking.

c. Complete the table.
The area of a rhombus can be found using the formula A = 1 2 pq, where p and q are the lengths of the diagonals.
d. Use the formula to find the area of THRK.
Formulas are easily forgotten, so it is always helpful to be able to break a figure down into triangles and rectangles in order to find the area. The exception is finding the area of a circle or a part of a circle.
9. What is the formula for the area of a circle?
10. A school’s drama program is building a new semicircular stage. The longest distance across the stage is 30 feet (ft.). What is the area of the new stage? Round to the nearest thousandth.
Guided Activity: Using the Formulas

1. The radius of a circle is 7 ft. Find the area, in square feet (sq. ft.), of the circle. Leave the answer in terms of π.
2. The base of the parallelogram is 22 inches (in.). The area of the parallelogram is 132 square inches (sq. in.). Find the height of the parallelogram.
3. The diagonals of a rhombus are 40 centimeters (cm) and 18 cm. Find the area of the rhombus in square centimeters (sq. cm).
4. The figure shown is composed of a rhombus, a parallelogram, and a triangle.

Complete the table. Round to the nearest thousandth.
ManuscriptCopy
Area
Shape
Rhombus
Parallelogram
Triangle Composite area
Lesson Summary
This lesson revisited finding the area of closed two-dimensional figures.
The area is the measure, in square units, of the inside region of a closed two-dimensional figure.
Formulas can be used to find the areas of specific figures. Two-dimensional figures can also be decomposed into triangles, rectangles, and other figures to find the area.
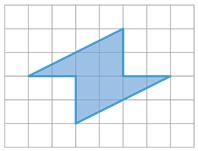
For example, to find the area of the polygon shown, it can be decomposed into 2 triangles.
Area of the top triangle: A = 1 2 (4)(2) = 4 square units (sq. units)
Area of the bottom triangle: A = 1 2 (4)(2) = 4 sq. units
Area of the polygon: 4 + 4 = 8 sq. units
Practice Problems
1. The design of a room is shown, where 1 unit = 5 ft.
Determine the area, in sq. ft., of the room. Round to the nearest hundredth.
ManuscriptCopy

2. The base of the parallelogram is 16 in. The height of the parallelogram is 13 in. Find the area of the parallelogram.
3. MHCR is shown on the coordinate grid.

Determine the area of MHCR. Show your work, or explain your thinking.
Review Problem
1. Figure KLMN is a parallelogram. Prove that triangle KNL is congruent to triangle MLN.
ManuscriptCopy
Unit 7, Lesson 3: Area of Regular Polygons

Warm-Up: Which One Doesn’t Belong?
Four different polygons are shown.
1. Which polygon doesn’t belong?
2. What characteristic did you use to make your decision?


Exploration Activity: Decomposing a Regular Polygon
Regular polygon HWRBXF is shown.
1. Discuss with your partner what information is necessary to determine the area of the polygon. Summarize your discussion.
ManuscriptCopy

2. Gregg and Dariq shared their ideas with their class.
Gregg’s Idea

I drew the diagonals to find the center of the polygon. This resulted in 6 congruent triangles.
Dariq’s Idea

I found the center of the polygon by using a compass to draw a circle that passes through the vertices. I then found the midpoint of one side and drew a right triangle.
a. Determine what additional information, if any, Gregg needs to determine the area of the polygon.
b. Determine what additional information, if any, Dariq needs to determine the area of the polygon.
ManuscriptCopy
Polygons HWRBXF and RXPSW are both regular polygons. The diagram shows the center of each polygon and the midpoint of one side.


3. In polygon HWRBXF, draw ∆XCB, and in polygon RXPSW, draw ∆SCP.
4. Complete the statements.
a. The area of ∆XCB is equal to 1 2 the length of XM XB times the
length of CM CX The area of polygon HWRBXF can be found by multiplying
the area of ∆XCB by
5 6 7 because polygon HWRBXF can be decomposed into 4 5 6 7
triangles that are congruent to ∆XCB.
b. The area of ∆SCP is equal to 1 2 the length of SM SP times the
length of CM CS The area of polygon RXPSW can be found by multiplying the area of ∆SCP by 4 5 6
because polygon RXPSW can be decomposed into
triangles that are congruent to ∆SCP.
ManuscriptCopy
c. The number of triangles in polygon HWRBXF is is not equal to the number of sides. The number of triangles in polygon RXPSW is is not equal to the number of sides.
Guided Activity: Area of a Regular Polygon
Regular polygon XWDYLRG is shown, where KH ⊥ XG
XK ≅ KG, XG = 6, and KH = 6.23.
1. Determine the area of ∆XHG.
2. Use the information to determine the area of polygon XWDYLRG.

3. Determine the value of the expression 1 2 · 7 · XG KH.
4. What do you notice about the value of 1 2 · 7 · XG · KH and the area of polygon XWDYLRG?
5. In the expression, 1 2 · 7 · XG · KH, what does the 7 represent?
6. What part of polygon XWDYLRG does 7 · XG represent?
The formula for finding the area of a regular polygon is A = 1 2 Pa, where P is the perimeter of the polygon and a is the apothem.
7. For polygon XWDYLRG, the expression 1 2 · 7 · XG · KH was used. Discuss with your partner which part of the expression 1 2 · 7 · XG · KH is the apothem.
8. Write a definition for apothem.
9. Compare your definition with a classmate’s. Record your classmate’s definition as they state it. You are the only person who should write in the first two columns of the table. Have your classmate initial next to their definition, indicating that your record of their definition is accurate.
Classmate
ManuscriptCopy
Definition of Apothem Initials
Write the class definition of apothem.
Collaborative Activity: Determining the Area of a Polygon
1. A game board is in the shape of regular pentagon, where each side measures 45 centimeters (cm) and the length of the apothem is 61.937 cm. Determine the area of the game board. Round your answer to the nearest thousandth.
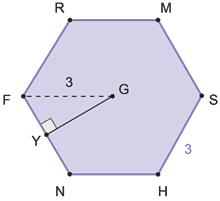
2. Polygon FTYCBWHG is shown, where point X is the center of the polygon, TX = 65.325, and WB = 25.
a. Draw an apothem from point X to TY. Label the point where the apothem meets TY as R.
b. Determine the length of TR.

c. Determine the length of XR. Round to the nearest thousandth.
d. Determine the area of polygon FTYCBWHG. Round to the nearest tenth.
Lesson Summary
This lesson explored how to find the area of regular polygons.

A regular polygon is a polygon that is both equilateral (all sides congruent) and equiangular (all angles congruent).
One way to find the area of a regular polygon is to decompose the polygon into congruent triangles. Find the area of 1 of the congruent triangles, and then multiply the area by the number of congruent triangles that make up the figure.
Another way to find the area of a regular polygon is by using the formula A = 1 2 Pa, where P is the perimeter of the polygon and a is the apothem.
The apothem is a line segment that has an endpoint at the center of the polygon and the other endpoint at the midpoint of 1 side of the polygon. If the apothem is not given, the apothem can be found by using the Pythagorean theorem.
For example, regular polygon RMSHNF is shown, where SH = 3, FG = 3, and GY is an apothem of the polygon.
• Since the apothem bisects the side of the polygon, FY = 1.5.
• The Pythagorean theorem can be used to find the length of GY, as shown. (FY)2 + (GY)2 = (FG)2 (GY)2 = (FG)2 (FY)2 (GY)2 = (3)2 − (1.5)2 = 6.75 GY = √6.75
• The area of the polygon is A = 1 2 (3 × 6)(√6.75) ≈ 23.483 square (sq.) units.
Practice Problems
1. A tile is in the shape of a regular dodecagon (a 12-sided polygon). Each side of the tile measures 74.4 centimeters (cm), and the length of the apothem is 138.83 cm. Determine the area of the tile. Round your answer to the nearest thousandth.
2. Regular polygon YTRDKB is shown, where point W is the center of the polygon, WH is an apothem, BK = 157 millimeters (mm), and WY = 157 mm.
Determine the area of polygon YTRDKB. Round your answer to the nearest thousandth.

3. Rhea was finding the area of a regular nonagon (a 9-sided polygon), where each side has a length of 4.2 inches (in.) and the length of the apothem is 5.9 in. Her work is shown, but she made a mistake.
Describe and correct Rhea’s error.
4. In right triangle ABC, AC = 5 and BC = 12. A new triangle DEC is formed by connecting the midpoints of AC and BC.
a. What is the area of ∆ABC ?

b. What is the area of ∆DEC ?
c. Does the scale factor for the side lengths apply to the area as well?
5. A step has a height of 6 in. A ramp starts 5 ft. away from the base of the step, making a 5.7° angle with the ground. What can you say about the angle the ramp would make with the ground if the ramp starts closer to the step?
A. The angle would decrease.
B. The angle would increase.
C. The angle would stay the same.
D. We cannot determine anything about the angle.
ManuscriptCopy
ManuscriptCopy
Unit 7, Lesson 4: Slicing Solids
Warm-Up: Slice This
Imagine slicing a cylinder with a straight cut. The flat surface you sliced along is called a cross section. Try to sketch all the possible kinds of cross sections of a cylinder.
ManuscriptCopy
Exploration Activity: Slice That
This activity requires the use of an applet, so please make your way over to the digital platform to find the link.
The triangle is a cross section formed when the plane slices through the cube.

1. Sketch predictions of all the kinds of cross sections that could be created as the plane moves through the cube.
2. The 3 red points control the movement of the plane. Click on them to move them up and down or side to side. You will see one of these movement arrows appear. Sketch any new cross sections you find after slicing.
ManuscriptCopy


Collaborative Activity: Stack ‘Em Up
Each question shows several parallel cross-sectional slabs of the same threedimensional solid. Name each solid.


ManuscriptCopy
1. 2.
3.
Lesson Summary
Some vocabulary terms related to solid geometry from previous courses were revisited in this lesson.
• A sphere is the set of points in three-dimensional space the same distance from some center.
• A prism has 2 congruent faces that are called bases. The bases of a prism are connected by parallelograms.
• A cylinder is like a prism except the bases are circles.
• A pyramid has 1 base. The remaining faces are triangles that all meet at a single vertex, called an apex.
• A cone is like a pyramid except the base is a circle. This lesson explored the cross sections of solids.
The cross section of a three-dimensional figure is the figure formed by intersecting a solid with a plane.
A cross section is the intersection of a solid with a plane, or a two-dimensional figure that extends forever in all directions. For example, some cheese is sold in cylindrical blocks. If the cheese is set up as shown and sliced vertically, the result will be a rectangular slice. This rectangle is a cross section of the cylinder.
Three more examples of cross sections created by intersecting a plane and a cylinder are shown.

ManuscriptCopy


Suppose Chris is planning to serve a cylindrical cheese at a party. He may slice it into several pieces, like those shown. These pieces are thin cylinders. They are like cross sections, but they are three-dimensional. All the cuts were made parallel to each other. By looking at the slices, or by stacking all of them, the original shape of the cheese can be determined as a cylinder.

What if another cheese plate contained slices whose radii got bigger to a maximum size and then got smaller again? The cheese was probably in the shape of a sphere. A sphere has circular cross sections. The size of the circular cross sections increases as you get closer to the center of the sphere, and then decreases past the center.

Practice Problems
1. Select all figures for which there exists a direction such that all cross sections taken at that direction are congruent.
□ triangular pyramid
□ square pyramid
□ rectangular prism
□ cube
□ cone
□ cylinder
□ sphere
2. Name 2 figures for which a circle can be a cross section.
3. Imagine an upright cone with its base resting on your horizontal desk. Sketch the cross section formed by intersecting each plane with the cone.
a. vertical plane not passing through the cone’s topmost point
b. horizontal plane
c. diagonal plane
Review Problem
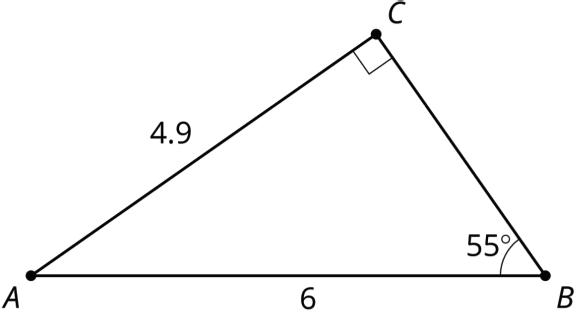
4. Right triangle ������ is shown.
Select all expressions which are equal to the length of side ����.
□ √4.92 + 62
□ √62 − 4.92
□ 4.9 sin(55°)
□ 4.9 sin(55°)
□ 4.9 tan(55°)
ManuscriptCopy
□ 4.9 tan(55°)
□ 6 cos(55°)
□ 6 cos(55°)
Unit 7, Lesson 5: Using Cross Sections to Solve Problems
Warm-Up: Dilating, Again
Dilate ∆������ using center �� and a scale factor of 2.

Look at your drawing. What do you notice? What do you wonder?
ManuscriptCopy
Exploration Activity: Pyramid Mobile
Your teacher will give you sheets of paper.
1. Each student in the group should take one sheet of paper and complete these steps:
a. Locate and mark the center of your sheet of paper by drawing diagonals or another method.
b. Each student should choose one scale factor from the table. On your paper, draw a dilation of the entire sheet of paper, using the center you marked as the center of dilation.
c. Measure the length and width of your dilated rectangle and calculate its area. Record the data in the table.
d. Cut out your dilated rectangle and make a small hole in the center.
�� = 0.25 �� = 0.5
�� = 0.75
�� = 1
2. Now the group as a whole should complete the remaining steps:
a. Cut 1 long piece of string (more than 30 centimeters) and 4 shorter pieces of string. Make 4 marks on the long piece of string an equal distance apart.
b. Thread the long piece of string through the hole in the largest rectangle. Tie a shorter piece of string beneath it where you made the first mark on the string. This will hold up the rectangle.
c. Thread the remaining pieces of paper onto the string from largest to smallest, tying a short piece of string beneath each one at the marks you made.
d. Hold up the end of the string to make your cross sections resemble a pyramid. As a group, you may have to steady the cross sections for the pyramid to clearly appear.
Collaborative Activity: Cross Sections in the Real World
1. The deli at the local grocery store offers 3 different types of cheeses to be sliced, as shown, where the dimensions are given in inches (in.).


a. Cross sections are used to represent each slice of cheese. Sketch and label each cross section.
b. Determine the area of each cross section.
The deli is ordering new parchment paper to be used to separate cheese slices. They want to order 1 size that works for all 3 types of cheese so none of the cheese slices touch.
c. Luciano thinks the new parchment paper can be 4.3 in. by 6 in. Explain why this size will not work.
Cheddar Cheese Pepper Jack Cheese Swiss Cheese
d. Determine a size of parchment paper that will work for the deli.
2. A sketch of a revolving door is shown, where the cylindrical door frame is 8.2 feet (ft.) tall and the diameter is 6.25 ft. There are 4 door wings created from 2 panels intersecting perpendicularly.
a. Draw a sketch of the cross sections that represent the panels of the door wings. Label the dimensions.

A glazier will use the cross sections to create the glass that will fit inside the frame of the door wings.
b. What is the maximum total area of glass used for the door wings?
ManuscriptCopy
Lesson Summary
Three-dimensional (3-D) figures have multiple cross sections intersecting the figure in different ways.
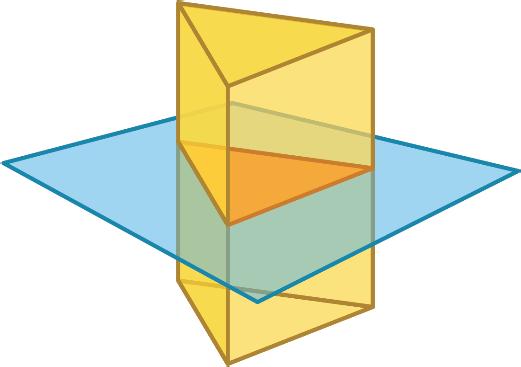
For example, 2 different cross sections of a triangular prism are shown. The cross section parallel to the base of the prism creates a triangle, and the cross section perpendicular to the base of the prism creates a rectangle.

• In 3-D figures like pyramids and cones, each cross section that is parallel to the base can be created by dilating the base by factor ��.
• In 3-D figures like prisms and cylinders, all the cross sections that are parallel to the base are congruent.
When finding the area or perimeter of a cross section, first determine the shape of the cross section. Then, identify the dimensions needed to find the area or perimeter. Consider sketching the cross sections with the dimensions, if needed.
ManuscriptCopy
Practice Problems
1. The Pyramid of Khufu in Giza, Egypt, was the world’s tallest free-standing structure for more than 3,500 years. Its original height was about 144 meters (m). Its base is approximately a square with a side length of 231 m.
The diagram shows a cross section created by dilating the base using the top of the pyramid as the center of dilation. The cross section is at a height of 96 m.

a. What scale factor was used to create the cross section?
b. What are the dimensions of the cross section?
2. A pentagonal prism is shown, with a cross section creating polygon ����������. ���� = ���� = ���� = ���� = ���� = 2 and ���� = 1.41.
a. Determine the perimeter of the cross section.
b. Determine the area of the cross section. Round to the nearest hundredth.

3. Technology required. A rope with a length of 4 m is tied from a stake in the ground to the top of a tent. It forms a 20° angle with the ground. How tall is the tent?
4. Technology required. What is the value of ��?
ManuscriptCopy

ManuscriptCopy
Unit 7, Lesson 6: Cylinder Volumes
Warm-Up: The Same but Different
Here are two solids.

1. What information would you need to calculate the volume of each solid?
ManuscriptCopy
2. What is the same and different about how you would find the volume of each solid?
Exploration Activity: Water Transfer
Here are two containers. All measurements are in centimeters.

1. Suppose the prism contains water that reaches a height of 1 centimeter (cm).
a. Draw a representation of this situation.
b. The water is poured from the prism into the cylinder. What is the height of the water in the cylinder? Explain your reasoning.
ManuscriptCopy
2. Suppose the prism contained water that reached a height of 3 cm instead of 1 cm. If the water were poured into the empty cylinder, what would the height of the water in the cylinder be?
Collaborative Activity: Rotating Two-Dimensional Figures
Suppose each two-dimensional figure is rotated around the vertical axis shown. Each small square in the grid represents 1 square centimeter (sq. cm).


For each solid:
1. Either sketch or describe in words the three-dimensional solid that would form.
2. Find the solid’s volume.
ManuscriptCopy
A. B
Lesson Summary
This lesson revisited the concept of volume.
Volume is the number of cubic units that fill a three-dimensional region without any gaps or overlaps.
Cylinder and prism volumes can be found by multiplying the area of the figure’s base by its height. The formula �� = ��ℎ, where �� is volume, �� is the area of the base, and ℎ is height, captures this concept. Consider the solid formed by rotating this rectangle around the horizontal axis shown. The result is a hollow cylinder of height 5 units with inner radius 1 unit and outer radius 4 units.


• To calculate the volume of the outer cylinder, start by finding the area of the circular base.
• The circle’s radius measures 4 units, so its area is 16�� square units (sq. units) because ��(4)2 = 16��.
• Multiply that by the cylinder’s height of 5 units to get 80�� cubic units (cu. units).
• For the inner cylinder, the area of the base is �� sq. units because ��(1)2 = ��.
• Therefore, the volume is 5�� cu. units.
ManuscriptCopy
• Now, subtract the volume of the inner, hollow part from the volume of the outer cylinder to get the volume of the solid. It is 75�� cu. units because 80�� − 5�� = 75��.
Practice Problems
1. Each small square represents 1 sq. cm.

a. Sketch and label the solid formed by rotating this two-dimensional figure around the horizontal axis shown.
b. What is the volume of this solid?
2. Find the volume of each solid.
a. a cylinder with radius 4 inches (in.) and height 3 in.
b. a cylinder with radius 3 in. and height 4 in.
c. a hexagonal prism whose base has area 30.5 sq. cm and whose height is 6.5 cm
d. a prism 5 feet (ft.) tall whose base is a right triangle with leg lengths 6 ft. and 7 ft.
3. Match each two-dimensional figure with the solid formed from rotating it using the bold axis shown.


ManuscriptCopy


A. Image 1
B. Image 2
C. Image 3
D. Image 4
4. Explain how you know lines �� and �� are parallel.

5. Match each trigonometric function to a ratio. You may use ratios more than once.

ManuscriptCopy
E. sin(��)
F. sin(��)
ManuscriptCopy
Unit 7, Lesson 7: Cross Sections and Volume
Warm-Up: Two Stacks of Coins
The images show the same number of coins arranged in different ways.
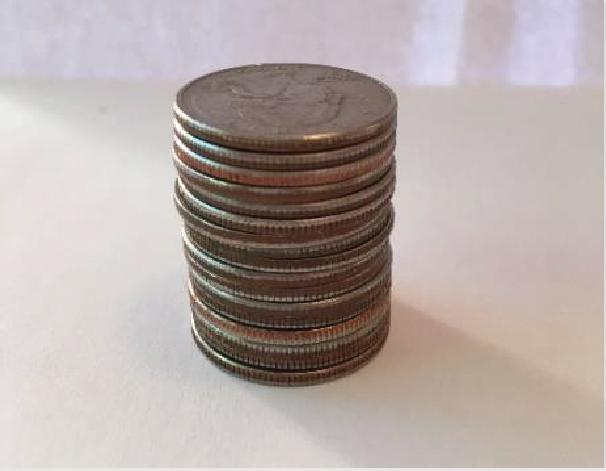

1. How are the two coin stacks different from each other?
2. Does either stack of coins resemble a geometric solid? If so, which stack and what solid?
3. How do the heights of the two stacks compare?
ManuscriptCopy
4. How do the volumes of the two stacks compare? Explain your reasoning.
Exploration Activity: Building Three-Dimensional Figures
Five different triangles are shown, where all measurements are in centimeters (cm).

Diagram
ManuscriptCopy


Diagram
1. Rectangle �������� is shown, where ���� = 4 cm and ���� = 10 cm.

Each triangle is stacked horizontally along the top of rectangle �������� to create a threedimensional (3-D) figure. Triangles ������, ������, and ������ are stacked so that ���� aligns with ����. Triangles ������ and ������ are stacked so that ���� aligns with ����.
a. Discuss with your partner how copies of 1 of the triangles would be stacked along the rectangle to create the 3-D figures described. Be prepared to explain or demonstrate your thinking.
b. Select the statements that are true.
□ The 3-D figures whose vertical cross sections have the same area are created using ∆������ and ∆������.
□ The 3-D figures whose vertical cross sections have the same area are created using ∆������ and ∆������.
□ The 3-D figure whose vertical cross section has an area of 10 square centimeters (sq. cm) is created using ∆������.
□ The 3-D figure whose vertical cross section has an area of 10 sq. cm is created using ∆������.
□ All the 3-D figures created will have a horizontal cross section with an area of 40 sq. cm.
c. Discuss with your partner how finding the area of 1 cross section can be used to find the volume of the 3-D figure. Summarize your discussion.
ManuscriptCopy
Exploration Activity: Rectangular Prism, Shifted
This activity requires the use of an applet, so please make your way over to the digital platform to find the link.
The applet shows two rectangular prisms. Each prism’s base has area �� square units, and the prisms are the same height. A plane intersects the two prisms parallel to their bases, creating cross sections.

1. Sketch the two cross sections. How do their shapes and areas compare to each other?
ManuscriptCopy
2. Use the applet to investigate the behavior of the prisms by sliding the “move base” and “change skew” sliders. Investigate the behavior of the cross sections by sliding the “move plane” slider. How do the shape and area of the cross sections change when you move the plane up or down?
3. How do the volumes of the two prisms compare? Explain your reasoning.
Collaborative Activity: Equal Volumes?
For each pair of solids, decide whether the volumes of the two solids are equal. Explain your reasoning. If you and your partner disagree, discuss each other’s approach until you reach agreement.

ManuscriptCopy


Lesson Summary
Suppose a stack of paper is in the shape of a rectangular prism. Then, suppose the paper got shifted so the prism slants to the side. The first is called a right prism because its sides are at right angles to its base. The second one, without right angles between the sides and the base, is called an oblique prism.
Prisms and cylinders are said to be oblique if when one base is translated to coincide with the other, the directed line segment that defines the translation is not perpendicular to the bases.
The volume of the prism doesn’t change when it is shifted because the amount of paper in the stack stays the same.


In fact, Cavalieri’s Principle can be used to explain this situation.
Cavalieri’s Principle states that if two solids are cut into cross sections by parallel planes, and the corresponding cross sections on each plane always have equal areas, then the two solids have the same volume.
In this image, all measurements are in cm. The oblique cylinder and the right prism have equal volumes because they have the same height and their cross sections at all heights have the same area of 6 square centimeters (sq. cm).
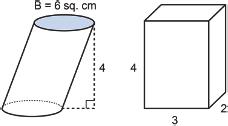
These 2 pyramids also have equal volumes. Their bases are congruent, and they have the same height. Shifting a solid from right to oblique doesn’t change its volume.

Practice Problems
1. This vase has a base of �� square inches (sq. in.) and a height of ℎ inches (in.). Which statement is true?
A. Its volume is less than ��ℎ cubic inches (cu. in.).
B. Its volume is equal to ��ℎ cu. in.
C. Its volume is greater than ��ℎ cu. in.
D. We cannot compare its volume to ��ℎ cu. in.

2. Noah is deciding which of 2 juice containers he should buy. One container is in the shape of a cylinder with radius 3.5 cm and height 12.5 cm. The second container is in the shape of a rectangular prism. The prism also has height 12.5 cm. Its length is 6.4 cm and its width is 4 cm.
Which juice container has the larger volume?
3. This zigzag crystal vase has a height of 10 in. The cross sections parallel to the base are always rectangles that are 6 in. wide by 3 in. long.
a. If we assume the crystal itself has no thickness, what would be the volume of the vase?

b. The crystal is actually half an inch thick on each of the sides and on the bottom. Approximately how much space is contained within the vase? Explain or show your reasoning.
4. List two solids for which the formula �� = ��ℎ applies and 2 for which �� = ��ℎ does not apply.
5. Each small square represents 1 sq. cm.
a. Sketch and label the solid formed by rotating this two-dimensional figure around the vertical axis shown.
b. What is the volume of this solid?
ManuscriptCopy

6. Name 2 figures for which all cross sections taken at a particular orientation are congruent.
ManuscriptCopy
Unit 7, Lesson 8: Finding Volume
Warm-Up: New Heights
Calculate the height of each solid. Round your answers to the nearest tenth if needed.

ManuscriptCopy

1.
2.
Guided Activity: Finding Volume
1. A cone and a cylinder are shown. Both have a base radius of 5 units and a height of 8 units.
Cone

Cylinder

a. Suppose the cone is filled with water. Discuss with your partner how many cones you think you would need to fill the cylinder with water. Write your estimate.
b. Given the volume of a cylinder is �� = ��ℎ, discuss with your partner how to rewrite the formula to find the volume of the cone.
c. The volume formula for a cone is �� =
2. A cone is shown with a diameter of 16 millimeters (mm), a height of 22 mm, and a slant height of 23.4 mm.
Determine the volume of the cone in terms of ��.

3. The rectangular pyramid and rectangular prism shown have congruent bases and the same height.

a. Suppose the rectangular pyramid is filled with water. Discuss with your partner how many rectangular pyramids you think you would need to fill the rectangular prism with water. Write your estimate.
b. Given the volume of a prism is �� = �� ∙ ℎ, discuss with your partner how to rewrite the formula to find the volume of the pyramid.
c. The volume formula for a regular pyramid is �� =
4. A pyramid is shown whose base is a rectangle with dimensions of 10 centimeters (cm) × 14 cm. The height of the pyramid is 17 cm. Determine the volume of the pyramid.
ManuscriptCopy

A sphere with center �� is shown, where ���� is a radius and ���� is a diameter. The circle that passes through the points �������� is known as the sphere’s great circle since it is the largest possible circle that can be made around the sphere.
The volume formula for a sphere is �� = 4 3 ����3 .

5. Find the volume of sphere ��, where ���� = 3, using �� ≈ 3.14. Round to the nearest hundredth.
6. Composite figures are made up of multiple individual figures. The composite figure shown is a cone on top of a cylinder.
Check all the statements that must be true about this composite.
□ The individual figures’ heights have the same measure.
□ The individual figures’ diameters have the same measure.
□ The individual figures’ radii have the same measure.
ManuscriptCopy
□ The individual figures’ bases have the same area.
□ The volume of this composite figure can be found using the formula �� = 2����2ℎ.


7. Discuss with your partner the statements that were false. Rewrite each false statement to make it true.
8. A composite figure is shown, where ���� = 3.2, ���� = 4.8, ���� = 10.7, and ���� = 11.1. ���� is the height of the pyramid. Find the volume of the composite figure.

Collaborative Activity: Finding Volume
1. Find the volume of a hemisphere that has a diameter of 9.4 inches (in.). Round to the nearest thousandth.
2. A composite figure consists of a hemisphere and a cone. The base of the cone and the great circle of the hemisphere have the same diameter. The radius of the hemisphere is 4 4 3 cm. The height of the cone is 9 1 12 cm. Find the volume of the composite figure using 22 7 for ��. Round to the nearest thousandth.
ManuscriptCopy
Lesson Summary
The table shows the list of formulas that can be used to find the volume, ��, of the given three-dimensional shape.
Three-Dimensional Shape
Prism
Volume Formula
�� = ��ℎ, where �� is the area of the base and ℎ is the height
Pyramid �� = 1 3 ��ℎ, where �� is the area of the base and ℎ is the height
Cylinder �� = 1 3 ����2ℎ, where �� is the radius and ℎ is the height
Cone �� = 1 3 ����2ℎ, where �� is the radius and ℎ is the height
Sphere �� = 4 3 ����3 , where �� is the radius
To find the volume of a composition of three-dimensional figures, first determine which three-dimensional figures make up the composition. Find the volume of each threedimensional figure, and then find the sum of all the three-dimensional figures that make up the composition of figures.
Practice Problems
1. Find the volume of a cylinder with a diameter of 18.3 millimeters (mm) and a height of 6.4 mm. Round to the nearest thousandth.
ManuscriptCopy
2. Find the volume of a pyramid whose height is 15.7 in. and whose base is a rectangle with dimensions of 7.6 in. × 12.4 in. Round to the nearest thousandth.
3. A prism has a height of 4 in. and a volume of 120 cubic inches (cu. in.). Select all figures that could be the base for this prism.
□ a 5 in. by 6 in. rectangle
□ a square with side length 5 in.
□ a circle with radius 5 in.
□ a star-shaped base with area 30 square inches (sq. in.)
□ a right triangle with legs 5 in. and 12 in.
4. This prism has a right triangle for a base. What is the volume of the prism?
ManuscriptCopy

Review Problems
5. This solid has curved sides. All cross sections parallel to the base are squares measuring 3 units on each side. The height from the base to the top is 10 units. What is the volume of this solid?

A. 30 cu. units
B. 60 cu. units
C. 90 cu. units
D. There is not enough information to determine the volume.
6. Select all statements that must be true.
□ The angle bisector of an isosceles triangle is also the perpendicular bisector.
□ The angle bisector of any angle divides the angle into 2 congruent parts.
□ The median of a triangle is also the perpendicular bisector.
□ The median of an isosceles triangles is also the angle bisector.
□ The median of a triangle is also the angle bisector.
ManuscriptCopy
Unit 7, Lesson 9: Volume in the Real World
Warm-Up: Matching Volume
Here is a pyramid.

Which, if either, of these solids has the same volume as the pyramid?

ManuscriptCopy

Collaborative Activity: Packing Peanuts
1. Josiah works for a sporting goods company in the shipping department. Josiah is trying to determine the best solution for packing a basketball with a diameter of 28.5 inches (in.).
a. What is the volume of the basketball?
b. What size box do you think would be the best fit?
c. Three of Josiah’s options for boxes are shown in the table. Find the volume of each box. Show your work in the space provided.
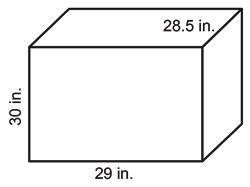

ManuscriptCopy
Rectangular

d. Discuss with your partner how to determine the amount of leftover space in the box after the basketball has been placed inside. Summarize your discussion.
e. After the basketball has been packaged, the leftover space in the box is filled with packing peanuts. If each packing peanut has a volume of 1 cubic centimeter (cu. cm), which box will use the least amount of packing peanuts?
ManuscriptCopy
Guided Activity: Volume in the Real World
1. Keon is building a raised garden bed that will have a width of 3.5 feet (ft.), a depth of 2 ft., and a length of 3 ft. Keon needs to fill the garden bed with soil. How much soil does he need to purchase?
2. Jasper wants to buy a new coffee mug, and he has narrowed it down to two options.
Option A Option B


a. What is the volume, rounded to the nearest thousandth, of option A? Include units.
b. What is the volume, rounded to the nearest thousandth, of option B? Include units.
3. Martha is packing clothes into containers. She wants each container to have a volume of 40 cubic inches (cu. in.).
a. Draw a sketch of a container that Martha could use.
b. Label your container with dimensions that will equal a volume of 40 cu. in.
c. With your partner, discuss similarities and differences between your sketches and dimensions. Summarize your discussion.
ManuscriptCopy
Lesson Summary
Volume is used in the real world when computing the amount of space that fills up a three-dimensional figure without any gaps.
For example, consider a company that makes 2 chew toys for dogs. One toy is in the shape of a cylinder with radius 9 cm and height 2.5 cm. The other looks like the cone in the image shown. The company wants to know which toy uses more material. The toys are solid and not hollow.
• To calculate the cylinder toy’s volume, use the expression Bh. The radius measures 9 cm, so the area of the base, B, is 81π square centimeters (sq. cm). The volume is 202.5π, or approximately 636 cu. cm because 81π ⋅ 2.5 = 202.5π.

• For the cone, the height is unknown. A right triangle is formed by the radius, which is 6 cm, and the height, h, with a hypotenuse of 16 cm. By the Pythagorean theorem, 62 + h2 = 162, so h = √220 cm.
Since this is a cone, use the expression 1 3 Bh. The area of the base, B, is 36π sq. cm. The volume is approximately 559 cu. cm because 1 3 ⋅ 36π ⋅ √220 ≈ 559.
The cylinder-shaped toy uses more material.
Practice Problems
1. Julian owns a moving company and has a truck that measures 15 "ft." × 7.5 "ft." ×7.5 "ft" . He charges customers by the number of boxes they need to put in the moving truck. If each box is a cube with a side length of 1.5 "ft." , how many boxes can fit in the truck?

2. A tennis ball canister with three tennis balls is shown. The diameter of the canister is 2.7 in., and the height is 8.1 in.
a. What is the volume of the canister?
b. What is the volume of 1 tennis ball?

c. How much air is left in the canister after the tennis balls have been placed inside?
3. A new convenience store is offering free samples of soda products. Flavors include pineapple, melon, cola, lemon, and strawberry. You can choose to have your sample served in either of the containers shown.
Gian, Yanessa, and Jack drew different conclusions about the drink containers. Their conclusions are shown.

The volumes are the same because the height of the cone is 4 times its radius, and both containers have the same radius.
Who is correct, and why?
The volume of the sphere is greater than the cone’s because 4 3 πr3 is greater than 1 3 πr2h.
The volume of the cone is greater than the sphere’s because the height of the cone is 4 times the radius of both containers.
Gian
Yanessa Jack
4. A toy company packages modeling clay in the shape of a rectangular prism with dimensions 6 in. by 1 in. by 1 2 in. They want to change the shape to a rectangular pyramid that uses the same amount of clay. Determine 2 sets of possible dimensions for the pyramid.
Review Problems
5. Select all expressions which give the measure of ∠A.

6. Two distinct lines, l and m, are each perpendicular to the same line n. Explain why l and m are parallel lines
ManuscriptCopy
Unit 7, Lesson 10: Surface Area of Three-Dimensional Figures
Warm-Up: Math Talk: Volume


Evaluate the volume of each solid mentally.

Exploration Activity: Using Nets to Find Surface Area
1. Work with your partner to determine a formula for the lateral area and the surface area of the figure you have been assigned. Complete the table.
ManuscriptCopy
Our figure was the .
Dimension of the Figure
Variable Used for the Dimension
Formula for the Lateral Area
Formula for the Surface Area
2. During the gallery walk, record the formulas that other partner pairs wrote for the figures assigned. Make any useful notes on each figure’s net.
Lateral area =
Surface area = Cube
Lateral area =
Surface area = Rectangular prism
Lateral area =
Surface area =


Figure Net Cylinder
Triangular prism
Lateral area =
ManuscriptCopy
Surface area = Square pyramid
Lateral area =
Surface area =


The height of a triangle that is a face of a pyramid is also known as the pyramid’s slant height, h s .
Rectangular pyramid
Lateral area =
Surface area =

The height of a triangle that is a face of a pyramid is also known as the pyramid’s slant height, h s .
Collaborative Activity: Summarizing Formulas
Refer to the surface area formula table in the Lesson Summary to answer the questions.
1. The formulas in the table may not match the formulas recorded during the gallery walk. Which figures have formulas that are different?
2. There are many ways to write formulas and to understand them. Discuss with your partner which formulas make more sense to you. Discuss how the formulas in the formula table can be used to help you remember how to find surface area. Summarize your discussion.
3. The chart does not have a formula for lateral area. For each of the figures, except for spheres, circle the part of the surface area formula that gives the lateral area.
ManuscriptCopy
Guided Activity: Lateral Area and Surface Area
1. A square pyramid has a slant height of 7 inches (in.), and the area of the base is 16 square inches (sq. in.). What is the surface area, in sq. in.?
2. The surface area of a sphere is 144�� feet (ft.). What is the radius of the sphere?
3. A cylinder has a height of 16 centimeters (cm) and a radius of 8 cm.
a. Find the lateral area in terms of ��.
b. Find the surface area in terms of ��.
ManuscriptCopy
4. A right triangular prism has base side lengths of 8 ft., 15 ft., and 17 ft., where the 17 ft. side is the hypotenuse of the triangle. The prism has a height of 7 ft. What is the surface area, in square feet (sq. ft.), of the triangular prism?
Collaborative Activity: Lateral Area and Surface Area
1. A pyramid has a height of 11.5 ft. and a square base with an area of 49 sq. ft. Find the lateral area, in sq. ft., of the pyramid.
2. A rectangular prism has a length of 12.5 in., a width of 8 in., and a height of 5 in. Determine the surface area, in sq. in., of the rectangular prism.
3. The radius of a sphere is 18.7 ft. Find the surface area of the sphere, in sq. ft. Round to nearest thousandth.
Lesson Summary
This lesson focused on finding the lateral area and surface area of three-dimensional (3-D) figures.
The surface area of a three-dimensional figure is the number of square units that cover the surface of the figure without any gaps or overlaps.
The lateral area of a 3-D figure is the area of the figure’s surface with any base(s) excluded.
A table of formulas is given.
Figure
Prism
Cylinder
Cone
Regular pyramid (a pyramid whose base is a regular polygon)
Sphere
Surface Area (SA)
SA = 2B + Ph
SA = 2B + Ch or
SA = 2B + Ph
SA = B + πrh s
SA = B + 1 2 Ph s
Variables
B = area of the base, P = perimeter, h = height
B = Warea of the base, C = circumference (or P = perimeter), h = height
B = area of the base, r = radius, h s = slant height
B = area of the base, P = perimeter, h s = slant height
SA = 4πr2 r = radius
When finding the surface area of a pyramid or a cone, remember the slant height is used instead of the height of the figure. For example, a square pyramid is shown with a height of 3 units and a base side length of 2 units. The slant height of the pyramid, 3.16 units, is the height of each triangular face.
SA = B + 1 2 Ph s = 22 + 1 2 (8)(3.16)
The surface area of the pyramid is 16.64 square units (sq. units), and the lateral area is 12.64 sq. units.

Practice Problems
1. Find the lateral area, in square meters (sq. m), of a cone that has a radius of 3 m and a slant height of 8.5 m. Round to the nearest thousandth.
2. A cylinder has a radius of 5 in. and a height of 3.75 in. Find the surface area, in sq. in., of the cylinder. Round to the nearest thousandth.
3. Johanne was finding the lateral area of a right triangular prism that has base side lengths of 7.5 in., 4.5 in., and 6 in. and has a height of 8.1 in. Johanne made a mistake in her work. Her work is shown.
Johanne’s Work
LA = 2 1 2 × 6 × 4.5
LA = 2(13.5)
LA = 27 sq. in.
Describe and fix Johanne’s mistake.
4. Find the volume of a pyramid whose base is a square with sides of length 4 units and which has a height of 10 units.
5. Angle S is 90 degrees and angle T is 45 degrees. Side ST is 3 feet. How long is side SU?
ManuscriptCopy
ManuscriptCopy
Unit 7, Lesson 11: Surface Area in the Real World
Warm-Up: The Faces of Geometry
Three solids are shown.


Draw all the surfaces of each solid.
ManuscriptCopy

1. 2. 3.
Collaborative Activity: The Best Package
Manuel is a graphic designer and works with various types of packaging. To ship his products, Manuel needs a container with a surface area of at least 550 square inches (sq. in.).
1. The 3 types of packaging the company has in stock are shown in the table. Find the surface area of each type of packaging.
Rectangular


2. Rank the packaging’s surface area from smallest to largest.
3. The prices for packaging are listed in the table. Based on the surface area, in square feet (sq. ft.), find the cost of each type of packaging.
$12.75 per 10 sq. ft.
$17.25 per 10 sq. ft.
$11.50 per 10 sq. ft.
4. If Manuel wants to use the cheapest packaging possible for his client, which packaging option should he choose?
Guided Activity: Properties of Equality and Congruence
Jeni owns a bakery and is making 2 cakes.
Cake A is in the shape of a rectangular prism that is 3 in. thick, 9 in. long, and 12 in. wide.
Cake B is in the shape of a cylinder with a diameter of 8 in. The cake is composed of 2 layers, each 3 in. tall.
1. When Jeni frosts the cake, she applies the frosting to all surfaces except for the bottom of the cake. She also frosts between the layers. Determine how much of each cake will be covered in frosting. Show your work.
2. Jeni then makes a two-layer cake, as shown, where the measurements are in inches. She will frost the whole cake except for the base of the bottom layer. She also adds frosting between the layers.
a. Determine the total surface area that Jeni needs to frost.

b. Jeni’s recipe for buttercream icing typically frosts a round cake that has an 8 in. diameter and is 1.5 in. tall. How many batches of frosting will Jeni need to frost her two-layer cake shown in part A?
Cake A
Cake B
Cake A
Cake B
Lesson Summary
This lesson focused on finding the surface area of three-dimensional figures in the real world. Context should be used to determine which parts of the figure are included in the surface area when solving a problem. For example, if a dresser is being painted, the back and bottom of the dresser may not be painted. So, when finding the surface area of the painted area of the dresser, the areas of the back and bottom will be excluded.
When finding the surface area of a composite figure, determine whether the area where the figures overlap is included based on the problem. If the area between the 2 figures is included, then be sure to only include that area once.
For example, the figure shown is composed of a cylinder and a cone.
Amir is building castle pieces out of wood, and the figure represents a tower he built. Amir wants to paint the tower and needs to determine how much paint is needed. Because Amir is painting the exterior of the figure, the overlapping base of the cone and cylinder will not be included in the surface area. The surface area of the figure consists of the lateral area of the cone, the lateral area of the cylinder, and the area of the base of the cylinder. SA = π(2)(4.47) + 2π(2)(3) + π(2)2 = 24.94π sq. units
ManuscriptCopy

Practice Problems
1. Lourdes’s garage is in the shape of a square pyramid. The garage is shown, with dimensions given in feet.
Lourdes is replacing the roof and installing shingles. In roofing terminology, a “square” is 100 sq. ft. The shingles come in bundles that each cover 1 3 of a square.
How many bundles should Lourdes buy to cover the roof?

2. An architect is designing an art gallery. She used computer software to create a rough sketch of her idea. Her sketch is shown with measurements in meters (m). She would like for the art gallery to be all glass.
To find out how much glass she should buy, she needs to find the area of all of the surfaces except for the floor. Determine the amount of glass, in square meters (sq. m), needed for the art gallery. Round to the nearest thousandth.
ManuscriptCopy

3. Find the volume of each solid.
a. a cylinder with radius 3 in. and height 2 in.
b. a hexagonal prism whose base has area 4.5 square centimeters (sq. cm) and whose height is 7 centimeters (cm)
c. a prism 5 ft. tall whose base is a right triangle with leg lengths 3 2 ft. and 9 ft.
4. EFGH is a parallelogram and ∠HEF is a right angle. Select all statements that must be true.

□ EFGH is a rectangle.
∆HEF ≅ ∆GFH □ ∆HEF ≅ ∆FGH
ED ≅ H�� ≅ DG ≅ DF
∆EDH ≅ ∆HDG
ManuscriptCopy
ManuscriptCopy
Unit 7, Lesson 12: Surface Area and Volume
Warm-Up: Maximize Area
The zoo wants to give the elephants as much space as possible in a rectangular enclosure meant for feeding. The zoo has 180 feet (ft.) of fencing. What should the dimensions of the rectangle be? Be prepared to share your reasoning. Three solids are shown.

Exploration Activity: Maximize in Three Dimensions
1. Find a set of dimensions for a rectangular prism with volume 60 cubic units (cu. units). Calculate the surface area of your prism. Add your data to the class chart.
2. A lithium ion battery contains a rectangular prism made of lithium. The energy in the battery is proportional to the surface area of this prism. Assume the lithium has a fixed volume of 60 cubic millimeters (cu. mm). Find the dimensions of a rectangular prism with this volume that maximizes its surface area. What is its surface area?
ManuscriptCopy
Guided Activity: Assume a Spherical Elephant
For a sphere with radius r, its volume is 4 3 πr3 and its surface area is 4πr2 .
1. Let’s model an elephant with a sphere that has a radius of 4.5 ft.
a. What is the volume of the elephant?
b. What is the surface area of the elephant?
2. Let’s model a snake with a cylinder of length 3 ft. and diameter 0.2 ft.
a. What is the volume of the snake?
b. What is the surface area of the snake?
3. Compute the surface area to volume ratio, or SA V , for each animal.
Collaborative Activity: Measuring Strength
Suppose a human is a sphere with a radius of 1 unit, an ant is a sphere with a radius of 1 200 unit, and an elephant is a sphere with a radius of 5 units.
1. The raw strength of a living creature is the cross-sectional area of its muscles. The cross section of each of our spherical beings is a circle of radius r, where r is the creature’s radius. Order the human, ant, and elephant by their raw strength from least to greatest. Show your reasoning.
2. Relative strength is given by the ratio of raw strength to volume. It measures how strong a creature is for its size. Create an expression for the relative strength of a spherical being with radius r. (Remember that the raw strength formula is πr2 and the volume formula for a sphere is 4 3 πr3.)
3. Order the human, the ant, and the elephant by their relative strength. Which is the strongest for its size?
Lesson Summary
Three prisms are shown, where each has a volume of 216 cubic centimeters (cu. cm). Which prism do you think has the largest surface area? Which do you think has the smallest surface area? 1 cm by 12 cm by 18 cm 9 cm by 8 cm by 3 cm


The surface area of the first prism is 492 square centimeters (sq. cm), the surface area of the second is 246 sq. cm, and the surface area of the third is 216 sq. cm. The cube, then, has the smallest surface area. In general, a cube is a rectangular prism with the least amount of surface area for its volume. The 1 × 12 × 18 cm prism has the greatest surface area of the 3. If you want a rectangular prism to have more surface area, the best design is to make it wide and long.
Shapes that are more compact, like a cube, have the least surface area for a given volume, but it turns out spheres do even better than cubes. A sphere with radius 3.72 cm, shown, has an approximate volume of 216 cu. cm like the previous prisms, but its approximate surface area is only 174 sq. cm.
ManuscriptCopy

Examples of maximizing or minimizing surface area can be seen in nature. For instance, a snake is cold-blooded, meaning that it gets its heat from the environment. Its long, narrow shape helps it soak up more heat from the sun. On the other hand, large mammals such as elephants and cows are warm-blooded, which means that they produce their own heat internally. Their shapes are more compact, closer to spheres, and this allows them to lose as little heat as possible through their skin.
Practice Problems
1. These solids all have the same volume. Which has the least surface area?
A


Solid A
B. Solid B
C. Solid C
D. Solid D
2. Rectangular prism A measures 3 inches (in.) by 4 in. by 8 in. Rectangular prism B measures 5 in. by 5 in. by 6 in.
a. Before doing any calculations, predict which prism has greater surface area to volume ratio.
b. Calculate the surface area, volume, and surface area to volume ratio for each prism.
ManuscriptCopy
Solid
Solid B
Solid C
Solid D
A.
3. Suppose you have 2 pieces of ice with the same volume but in different shapes. If one of the pieces has a greater surface area than the other, it will cool a beverage faster than the ice with less surface area.
a. Describe 2 different pieces of ice that have the same volume but have different surface areas.
b. Which piece of ice will cool a beverage faster?
Review Problems
4. Find the volume of each solid.
5. Diego states that diagonal WY bisects ∠ZWX and ∠ZYX. Is he correct? Explain your reasoning.
ManuscriptCopy

A. –30
B. 30
C. 60
D. 180
ManuscriptCopy
Unit 8, Lesson 1: Revisiting Equations of Lines
Warm-Up: Remembering Slope

The slope of the line in the image is 8 15 . Explain how you know this is true.
ManuscriptCopy
Exploration Activity: Building an Equation for a Line
Recall from 8th grade that equations representing linear relationships can be written in slope-intercept form.
• Slope-intercept form is �� = ���� + ��, where �� is the slope and �� is the ��-intercept.
• The slope, ��, is the ratio of the change in the vertical direction to the change in the horizontal direction between 2 points, often expressed as ∆��
1. The graph of a linear equation is shown on the coordinate plane.
a. Write an equation that shows the slope between the points (1, 3) and (��, ��) is 2.
b. Consider the equation �� − 3 = 2(�� − 1). How does it relate to the equation you wrote?
.

c. Rewrite the equation from part A in slope-intercept form.
2. Another linear equation can be represented by the equation ��−7 ��−5 = 1 2 .
a. What point do you know is on this line?
b. What is the slope of the line?
ManuscriptCopy
c. Rewrite the equation in slope-intercept form.
Collaborative Activity: Equations of Lines
1. Josiah and Claudia each wrote the equation of a line that passes through the point (−7, 5) with slope 3 in slope-intercept form. Their work is shown.
Work
Work ��−5
= 3
= 3
= 3(�� + 7)
5 = 3�� + 21
= 3�� + 26
= ���� + �� 5 = (3)(−7) + �� 5 = −21 + �� 26 = �� �� = 3�� + 26
a. Discuss with your partner the method Josiah used to write the equation of the line in slope-intercept form. Summarize his method.
b. Discuss with your partner the method Claudia used to write the equation of the line in slope-intercept form. Summarize her method.
c. Use each of their methods to write the equation of a line that passes through the point (6, 1) with slope 1 2 in slope-intercept form.
Josiah’s
Claudia’s
Josiah’s Work
Claudia’s Work
2. Write an equation of a line in slope-intercept form from each description.
a. The line passing through point (−2, 8) with slope 4 5
b. The line passing through point (0, 7) with slope − 7 3
c. The line passing through point � 1 2 , 0� with slope −1
d. The line in the image

3. Determine the slope and a point that each line passes through using the structure of each equation.
a. ��−5 ��+4 = 3 2
b. �� = 5�� − 2
c. �� = −2 ��� − 5 8 �
Lesson Summary
This lesson focuses on writing the equation of a line in slope intercept form, �� = ���� + ��, where �� is the slope of the line and �� is the ��-intercept of the line.
The slope is the ratio of the change in the vertical direction (��-direction) to the change in the horizontal direction (��-direction), often expressed as ∆�� ∆�� .
The ��-intercept is the value of �� at the point where a line or graph intersects the ��-axis. The value of �� is 0 at this point.
There are an infinite number of points, (��, ��), that satisfy the equation of a line.
The line shown on the coordinate plane can be defined as the set of points that includes the point (3, 4) and has a slope of 2. The given information can be used to write an equation of the line.
• One method is using slope, �� = ∆�� ∆�� , read, “Slope is the change in �� over the change in ��.” The points (3, 4) and (��, ��) can be used along with the slope to write the equation shown. This equation can then be rearranged into slope-intercept form.
�� − 4 �� − 3 = 2
�� − 4 = 2(�� − 3)
�� − 4 = 2�� − 6 �� = 2�� − 2

• Another method that can be used to write an equation of a line that passes through point (3, 4) with a slope of 2 is to substitute the (��, ��) values of the known point and the slope into slope-intercept form to find the value of ��. Then, use the values of �� and �� to write the equation.
�� = ���� + ��
4 = 2(3) + �� 4 = 6 + ��
−2 = �� �� = 2�� − 2
Notice that both methods result in the same equation in slope-intercept form.
Practice Problems
1. Select all of the equations that represent the graph shown.
□ 3�� − 2�� = 6
□ �� = 3 2 �� + 3
□ �� = 3 2 �� − 3
□ ��−3
□
��−4 = 3 2
��−6
��−2 = 3 2
2. A line with slope 3 2 passes through the point (1, 3).
a. Explain why (3, 6) is on this line.

b. Explain why (0, 0) is not on this line.
c. Is the point (13, 22) on this line? Explain why or why not.
3. Write an equation of the line that passes through (1, 3) and has a slope of 5 4 .
Review Problem
4. Reflect triangle ������ over the line �� = −6. Translate the image by the directed line segment from (0, 0) to (5, −1).

What are the coordinates of the vertices in the final image?
ManuscriptCopy
ManuscriptCopy
Unit 8, Lesson 2: Parallel Lines
Warm-Up: Translating Lines
1. Draw any nonvertical line in the plane. Draw 2 possible translations of the line.

2. Find the slope of your original line and the slopes of the images.
ManuscriptCopy
Exploration Activity: Priya’s Proof
Priya writes a proof saying:
Consider any 2 parallel lines. Assume they are not horizontal or vertical. Therefore, they must pass through the ��-axis as well as the ��-axis. This forms 2 right triangles with a second congruent angle. Call the angle ��. The tangent of �� is equal for both triangles. Therefore, the lines have the same slope.

1. How does Priya know the right triangles have a second congruent angle?
2. Show or explain what it means that the tangent of �� is equal for both triangles.
3. How does this prove the slopes of parallel lines are equal?
Collaborative Activity: Prove Your Parallelogram
1. Write the equation of a line parallel to �� = 2�� + 3, passing through (−4, 1).
2. Graph both lines described in the previous question.

3. Draw a parallelogram using the 2 lines you graphed and using (−4, 1) as one of the vertices.
4. Prove that your figure is a parallelogram.
ManuscriptCopy
Lesson Summary
The solid line has been translated in 2 different ways.
1. By the directed line segment from (2, 2) to (2, 4), producing the dashed line above
2. By the directed line segment from (2, 2) to (2, −2), producing the dotted line below
The 3 lines look parallel to each other, as expected. Translations of lines result in parallel lines.

What happens to the slopes of these lines? Drawing the slope triangles that go through the origin reveals the right triangles shown. Since 2 parallel lines are intersected by a transversal, the alternate interior angles are congruent. Therefore, the corresponding angles in the triangles are congruent. Triangles with congruent angles are similar, and similar slope triangles result in lines with the same slope. Using slope triangles through the origin, the slopes of the 3 lines are 5 10 , 3 6 , and 1 2 , which are all equivalent.

Similar reasoning can be used to show that any 2 parallel lines that aren’t vertical have the same slope and also that any 2 lines with the same slope are parallel.
What if you wanted to find the equation of a line parallel to these 3 lines that goes through the point (6, −1)?
ManuscriptCopy
• The line must have the same slope of 1 2 .
• The slope formula or the slope-intercept form can then be used with the given information to determine that the equation �� = − 1 2 �� + 2 satisfies the criteria.
Practice Problems
1. Select all of equations that are parallel to the line 2�� + 5�� = 8.
□ �� = 2 5 �� + 4
□ �� = − 2 5 �� + 4
□ �� − 2 �� + 1 = 5 2
□ �� − 2 �� + 1 = − 2 5
□ 10�� + 5�� = 40
2. Prove that �������� is not a parallelogram.

3. Write an equation of a line that passes through (−1, 2) and is parallel to a line with ��-intercept (3, 0) and ��-intercept (0, 1).
4. Write an equation of the line with slope 2 3 that goes through the point (−2, 5).
ManuscriptCopy
5. Leilani and Ivan each wrote an equation of a line with slope 1 3 that passes through the point (1, 2). Leilani’s equation is �� − 2 �� − 1 = 1 3 , and Ivan’s equation is �� = 1 3 �� + 5 3 . Do you agree with either of them? Explain or show your reasoning.
Unit 8, Lesson 3: Perpendicular Lines
Warm-Up: Revisiting Transformations
The image shows quadrilatera ��������.

Apply the transformation rule (��, ��) → (−��, ��) to quadrilateral ��������. What is the effect of the transformation rule?
ManuscriptCopy
Exploration Activity: Make a Conjecture
1. Complete the table with the slope of each segment from the warm-up.
ManuscriptCopy
2. The image in the warm-up is a 90° rotation of the original figure, so each line in the original figure is perpendicular to the corresponding line in the image. Use your slope calculations to make a conjecture about slopes of perpendicular lines.
Collaborative Activity: Prove It
Let’s prove our conjecture about slopes of perpendicular lines for the case where the lines pass through the origin.
1. Find the slope of a line passing through the point (��, ��) and the origin. Assume the line is not horizontal or vertical.
2. Suppose the line is rotated using the transformation rule (��, ��) → (−��, ��). Find the coordinates of the images of the points (��, ��) and the origin.
3. How does the original line relate to the image?
4. Find the slope of the image.
5. Compare your slopes. What did you just prove?
Lesson Summary
The diagram shows ∆������ and its image, ∆����′��′, under a 90° rotation counterclockwise using the origin as the center. Since the rotation was 90°, all line segments in the image are perpendicular to the corresponding segments in the original triangle. For example, ���� is horizontal, and ����′ is vertical.

Look at ���� and ����′, which, like the other pairs of segments, are perpendicular. The slope of ���� is 2 5 , and the slope of ����′ is 5 2 . Notice the relationship between the slopes. They are reciprocals of each other and have opposite signs.
If �� is a rational number that is not zero, then the reciprocal of �� is the number 1 �� .
The product of the slopes, 2 5 ⋅ �− 5 2 �, is −1. As long as perpendicular lines are not horizontal or vertical, their slopes will be opposite reciprocals with a product of −1.
This fact can be used to help write equations of lines. For example, try writing the equation of a line that passes through the point (24, −30) and is perpendicular to a line ℓ represented by �� = 3�� + 5.
• The slope of line ℓ is 3. The slope of any line perpendicular to line ℓ is the opposite reciprocal of 3, or 1 3 .
• Substitute the point (24, −30) and the slope 1 3 into the slope-intercept form to find the ��-intercept, �� = −22.
The equation of a line perpendicular to line ℓ that passes through the point (24, −30) is �� = − 1 3 �� − 22.
Practice Problems
1. Write an equation for a line that passes through the origin and is perpendicular to �� = 5�� − 2.
2. Match each line with a perpendicular line.
A. �� = 5�� + 2 1. the line through (2, 12) and (17, 9)
B. �� − 2.25 �� − 2 = −2 2. �� = − 1 2 �� + 5
C. the line through (−1, 5) and (1, 9) 3. 2�� − 4�� = 10
3. The rule (��, ��) → (��, −��) takes a line to a perpendicular line. Select all the rules that take a line to a perpendicular line.
□ (��, ��) → (2��, −��)
□ (��, ��) → (−��, −��)
□ (��, ��) → (−��, ��)
□ (��, ��) → (0.5��, −2��)
□ (��, ��) → (4��, −4��)
ManuscriptCopy
4.
a. Write an equation of the line with ��-intercept (3, 0) and ��-intercept (0, −4).
b. Write an equation of a line parallel to the line �� − 5 �� − 2 = 4 3 .
5. Lines ℓ and �� are parallel. Select all true statements.

□ Triangle ������ is similar to triangle ������.
□ Triangle ������ is congruent to triangle ������.
□ The slope of line ℓ is equal to the slope of line ��.
□ sin(��) = sin(��)
□ sin(��) = cos(��)
Unit 8, Lesson 4: Writing Equations of Lines from Given
Criteria
Warm-Up: Parallel and Perpendicular
The image shows line ��.

1. Write an equation for the line that is perpendicular to �� and whose ��-intercept is (0, 5). Graph this line.
2. Write an equation for the line that is parallel to �� and that passes through the point (3, 1). Graph this line.
Collaborative Activity: Info Gap
Your teacher will give you either a problem card or a data card. Do not show or read your card to your partner.

If your teacher gives you the data card:
1. Silently read the information on your card.
2. Ask your partner, “What specific information do you need?” and wait for your partner to ask for information. Only give information that is on your card. (Do not figure out anything for your partner!)
3. Before telling your partner the information, ask, “Why do you need to know (that piece of information)?”
4. Read the problem card, and solve the problem independently.
5. Share the data card, and discuss your reasoning.
ManuscriptCopy
If your teacher gives you the problem card:
1. Silently read your card and think about what information you need to answer the question.
2. Ask your partner for the specific information that you need.
3. Explain to your partner how you are using the information to solve the problem.
4. When you have enough information, share the problem card with your partner, and solve the problem independently.
5. Read the data card, and discuss your reasoning.
Pause here so your teacher can review your work. Ask your teacher for a new set of cards and repeat the activity, trading roles with your partner.
Collaborative Activity: Three Lines
1. Line ℓ is represented by the equation �� = 2 3 �� + 3. Write an equation of the line perpendicular to ℓ, passing through (−6, 4). Call this line ��.
2. Write an equation of the line perpendicular to ��, passing through (3, −2). Call this line ��.
ManuscriptCopy
3. What do you notice about lines ℓ and ��? Does this always happen? Show or explain your answer.
Lesson Summary
Knowledge of the relationships between parallel and perpendicular lines can be used to write equations of lines. Line ℓ is shown on the coordinate plane.

Suppose line �� is the image of line ℓ after it is rotated 90° using (−1, 5) as a center. What is an equation of line ��?
• The point (−1, 5) is on line ℓ. The center of rotation does not move when a figure is rotated, so (−1, 5) will also be on the image, line ��.
• Because line ℓ was rotated 90°, lines ℓ and �� are perpendicular. Their slopes must be opposite reciprocals. The slope of line ℓ is −3, so the slope of �� is 1 3 .
• Now, substitute the slope 1 3 and the point (−1, 5) into the slope-intercept form to find ��, the ��-intercept.
• Therefore, the equation of line ��
Note that it is not possible for a line to be parallel to line ℓ and pass through the point (−1, 5). In such a case, the lines would coincide rather than be parallel. For 2 lines to be parallel, they must have the same slope and different ��-intercepts. Any line parallel to line ℓ that passes through a point not on the graph of line ℓ can be determined by substituting the slope and the coordinates of the given point into slope-intercept form to find the value of ��.
Practice Problems
1. The graph of a line is shown on the coordinate plane. For each equation, determine whether the graph of the equation is parallel to the line shown, perpendicular to the line shown, or neither.
a. �� = 0.2��

b. �� = −2�� + 1
c. �� = 5�� − 3
d. (�� − 3) (�� − 4) = −5
e. (�� − 1) (�� − 3) = 2
f. 5�� + �� = 3
ManuscriptCopy
2. Main Street is parallel to Park Street. Park Street is parallel to Elm Street. Elm is perpendicular to Willow. How does Willow compare to Main?
3. The line which is the graph of �� = 2�� − 4 is transformed by the rule (��, ��) → (−��, −��). What is the slope of the image?
Review Problems
4. Select all equations whose graphs are lines perpendicular to the graph of 3�� + 2�� = 6.
□ 3�� − 2�� = 4
□ 2�� + 3�� = 6
□ 2�� − 3�� = 8
□ (��−4) (��−6) = 2 3
□ (��−2) (��−8) = − 3 2
□ �� = 2 3 ��
□ �� = 3 2 �� + 3
5. The graph of �� = −4�� + 2 is translated by the directed line segment ���� shown. What is the slope of the image?

6. Select all points on the line with a slope of 1 2 that goes through the point (4, −1).
□ (−2, 2)
□ (0, 2)
□ (4, −1)
□ (0, 1)
□ (−3, 8)
Unit 8, Lesson 5: Area in the Coordinate Plane
Warm-Up: Going the Distance

Andre says, “I know that I can find the distance between two points in the plane by drawing in a right triangle and using the Pythagorean theorem. But I’m not sure how to find the lengths of the legs of the triangle when I can’t just count the squares on the graph.”
Explain to Andre how he can find the lengths of the legs in the triangle in the image. Then, calculate the distance between points �� and ��.
Collaborative Activity: Finding Distance
Work with your partner to complete the following.
1. Find the length of ���� using the Pythagorean theorem. If necessary, round to the nearest thousandth.
ManuscriptCopy

2. Use the Pythagorean theorem to find the length of ����. If necessary, round to the nearest thousandth.

3. Explain how the Pythagorean theorem can be used to find the distance between 2 points.
4. Francesco is finding the distance between point �� and point ��. He wrote the equation shown to find the distance.
Francesco’s Equation
a. Discuss with your partner how Francesco’s equation relates to the Pythagorean theorem.
b. Find the distance between point �� and point ��. Round to the nearest thousandth.

Guided Activity: Area on the Coordinate Plane
1. Trapezoid �������� has vertices at ��(1, 9), ��(5, 9), ��(2, 5), and ��(−4, 5).
a. Graph ��������.
b. Complete the table.

c. Draw a diagonal line segment from point �� to point �� to make ∆������ and ∆������.
d. Find the area of ∆������ and ∆������.
Area of ∆������ = Area of ∆������ =
e. What is the area of ��������?
2. Rectangle �������� has vertices at ��(1, 4), ��(5, 8), ��(7, 6), and ��(3, 2).
a. Graph ��������.
b. Complete the table. Line Segment Length
c. What is the area of ��������?
ManuscriptCopy
3. Triangle ������ is shown, where point �� is the midpoint of ����, and the vertices are located at ��(−7, 4), ��(4, 2), and ��(9, −8).
a. Determine the coordinates of point ��.

b. Complete the table.
Line Segment Length
c. What is the area of ∆������?
ManuscriptCopy
Lesson Summary
Sometimes, when finding the area of a triangle or quadrilateral on a coordinate plane, the lengths of the figure are not easily seen or cannot be determined by looking at the grid. This lesson focused on finding the distance between 2 points to find the dimensions of a triangle or quadrilateral and then using those dimensions to determine the figure’s area.
The Pythagorean theorem, ��2 + ��2 = ��2, can be used to find the distance between any 2 points on the coordinate plane. Using the distance formula or finding the midpoint of a line segment on the coordinate plane are skills that may also be useful in finding area on the coordinate plane.
• The distance formula, derived from the Pythagorean theorem, can be used to find the distance, ��, between 2 points, (��1, ��1) and (��2, ��2).
The distance formula is ��
• The midpoint of a line segment can be found by finding the average of the ��-values and the average of the ��-values.
Once the length of the base, ��, and height, ℎ, of a figure have been found, use the related area formula to find the area of the figure.
• The area, ��, of a triangle is �� = 1 2 × �� × ℎ.
• The area of a rectangle or square is �� = �� × ℎ.
• The area of trapezoid is �� = 1 2 × ℎ × (��1 + ��2).
Practice Problems
1. Square �������� has vertices at ��(−3, 1), ��(−1, 4), ��(2, 2), and ��(0, −1).
a. Complete the table.

Line Segment Length
b. What is the area of ��������?
ManuscriptCopy
2. Triangle ������ is shown, where point �� is the midpoint of ����, and vertices are located at ��(−8, −5), ��(−7, 8), and �� (6, 7).
a. Determine the coordinates of point ��.
b. Complete the table.

Line Segment Length
c. What is the area of ∆������?
Review Problem
3. What is the shape of the cross section formed by intersecting a cube with a vertical plane that passes through opposite edges of the cube? Explain how you know.
Unit 8, Lesson 6: Lines in Triangles
Warm-Up: Altitudes
Triangle ������ is shown, where ���� is an altitude of ∆������.

An altitude in a triangle is a line segment from a vertex to the opposite side that is perpendicular to that side.
1. Explain how ���� demonstrates the definition of an altitude of a triangle.
2. What is another term for the altitude of a triangle?
ManuscriptCopy
Exploration Activity: Altitude Attributes
Triangle ������ is graphed.
1. Find the slope of each side of the triangle.
2. Find the slope of each altitude of the triangle.

3. Sketch the altitudes. Label the point of intersection ��.
4. Write equations for all 3 altitudes.
5. Use the equations to find the coordinates of �� and verify algebraically that the altitudes all intersect at ��.
ManuscriptCopy
Exploration Activity: Percolating on Perpendicular Bisectors
Triangle ������ is graphed.
1. Find the midpoint of each side of the triangle.
2. Sketch the perpendicular bisectors, using an index card to help draw 90° angles. Label the intersection point ��.
3. Write equations for all 3 perpendicular bisectors.
4. Use the equations to find the coordinates of �� and verify algebraically that the perpendicular bisectors all intersect at ��.
ManuscriptCopy
Collaborative Activity: Amazing Points
Consider triangle ������ from earlier activities.
1. Plot point ��, the intersection point of the altitudes.
2. Plot point ��, the intersection point of the perpendicular bisectors.
3. Find the point where the 3 medians of the triangle intersect. Plot this point and label it ��.
4. What seems to be true about points ��, ��, and ��? Prove that your observation is true.
Lesson Summary
The 3 medians of a triangle always intersect at 1 point. Coordinate geometry can be used to show that the altitudes of a triangle intersect at 1 point, too.
An altitude in a triangle is a line segment from a vertex to the opposite side that is perpendicular to that side.
The 3 altitudes of ∆������ are shown. They appear to intersect at the point (4, 6). Finding their equations can be used to prove that this is true.

• The slopes of sides ����, ����, and ���� are 0, − 2 3 , and 2, respectively.
• The altitude from �� is the vertical line �� = 4.
• The slope of the altitude from �� is 3 2 . Since this altitude goes through (0, 0), its equation is �� = 3 2 ��.
• The slope of the altitude from �� is − 1 2 . Following this slope over to the ��-axis shows that the ��-intercept is 8. Therefore, the equation for this altitude is �� = − 1 2 �� + 8.
• Substitution can then be used to verify that the point (4, 6) lies on all 3 altitudes by showing that the point satisfies the 3 equations. Each equation is true when �� = 4 and �� = 6.
Practice Problems
1. Triangle ������ is shown on the coordinate plane. Write the equation for all 3 altitudes of the triangle.

2. Triangle ������ is shown on the coordinate plane.
a. Find the midpoint of each side of ∆������.
b. Write the equation of each perpendicular bisector of ∆������.


3. Triangle ������ is shown on the coordinate plane. Determine the point where the altitudes of ∆������ intersect.

Review Problem
4. The graph of a line is shown on the coordinate plane. For each equation, determine whether the graph of the equation is parallel to the line shown, perpendicular to the line shown, or neither.
ManuscriptCopy

ManuscriptCopy
Unit 8, Lesson 7: Classifying Triangles
Warm-Up: Triangle Midpoints
Triangle ������ is graphed.

Find the midpoint of each side of this triangle.
ManuscriptCopy
Collaborative Activity: Classifying Triangles
1. Triangle ������ has vertices at ��(−8, 8), ��(−4, 2), and ��(−9, 3).
a. Graph ∆������ on the coordinate plane.

b. Complete the table. If necessary, round to the nearest thousandth.
Line Segment Length of Line Segment
c. What do you notice about the side lengths of ∆������?
d. Complete the statement.
∆������ is classified as a(n) equilateral isosceles scalene triangle because ∆������ has
equal side lengths.
2. Triangle ������ has vertices at ��(6, 5), ��(3, −1), and ��(10, −1).
a. Graph ∆������ on the coordinate plane.

b. Complete the table. If necessary, round to the nearest thousandth.
Line Segment Length of Line Segment
c. What do you notice about the side lengths of ∆������?
d. Complete the statement.
∆������ is classified as a(n) equilateral isosceles scalene triangle because ∆������ has no 2 3 equal side lengths.
3. Triangle ������ has vertices at ��(−3, 4), ��(2.2, 1), and ��(−3, −2).
a. Complete the table. If necessary, round to the nearest thousandth.
Line Segment Length of Line Segment
b. Complete the statement.
∆������ is classified as a(n) equilateral isosceles scalene triangle because ∆������ has no 2 3 equal side lengths.
4. Draw a scalene triangle with a vertex at (−3, 6) and with a base that is twice the length of its height
ManuscriptCopy

Lesson Summary
This lesson focused on classifying triangles by their side lengths.
• An equilateral triangle has 3 equal side lengths.
• An isosceles triangle has 2 equal side lengths.
• A scalene triangle has no equal side lengths.
The distance formula or the Pythagorean theorem can be used to find the side lengths of a triangle on a coordinate plane.
For example, ∆������ has vertices at ��(−3, −2), ��(−1, 1), and ��(2, −1). The table shows the lengths of the sides of ∆������ using the distance formula.
Line Segment
Length of Line Segment
���� = (−3 − (−1))2 + (−2 − 1)2 = 13
= (−1 − 2)2 + (1 − (−1))2 = 13
= (2 − (−3))2 + (−1 − (−2))2 = 26
Since 2 side lengths of ∆������ are equal, ∆������ is classified as an isosceles triangle.
Practice Problems
ManuscriptCopy
1. Triangle ������ has vertices at ��(−2, 3), ��(3, 1), and ��(0, −2). Determine if ∆������ is an equilateral, isosceles, or scalene triangle. Justify your answer mathematically.

2. Triangle ������ has vertices at ��(1, 6), ��(7, 6), and ��(4, 0).
a. Demonstrate mathematically that ∆������ is not an equilateral triangle.

b. What type of triangle is ∆������?
3. Draw an isosceles triangle with a base that is 3 units longer than the triangle’s height and with a vertex at (2, 5).
ManuscriptCopy

4. Match each coordinate rule to a description of its resulting transformation.
Description
a. Translate along the directed line segment from (0, 0) to (−3, 0).
b. Translate along the directed line segment from (0, 0) to (0, −3).
c. Translate along the directed line segment from (0, 0) to (3, 0).
d. Translate along the directed line segment from (0, 0) to (0, 3).
e. Translate along the directed line segment from (0, 0) to (3, 3).
f. Translate along the directed line segment from (0, 0) to (−3, −3).
g. Dilate using the origin as the center with a scale factor of 3.
5. A cone-shaped container is oriented with its circular base on the top and its apex at the bottom. It has a radius of 18 inches (in.) and a height of 6 in. The cone starts filling up with water. What fraction of the volume of the cone is filled when the water reaches a height of 2 in.?
ManuscriptCopy
Unit 8, Lesson 8: Centroids of Triangles
Warm-Up: Notice and Wonder
A human hamster wheel is shown.
1. What is the first question that comes to your mind?
2. What are 2 things you notice about the human hamster wheel?

ManuscriptCopy
Exploration Activity: Centroids of Triangles
1. Triangle ������ has vertices at ��(−7, 3), ��(2, 8), and ��(5, 1).

a. Complete the table by finding the midpoint of each line segment. Line Segment
b. Complete the steps to find the centroid of ∆������.
1 Graph the midpoint of ���� and label it point ��.
2 Using a straightedge, draw the median from point �� to the opposite vertex, ∠������.
3 Graph the midpoint of ���� and label it point ��.
4 Using a straightedge, draw the median from point �� to the opposite vertex, ∠������.
5 Graph the midpoint of ���� and label it point ��.
6 Using a straightedge, draw the median from point �� to the opposite vertex, ∠������.
7 Label the centroid of ∆������ as point ��.
c. What are the coordinates of the centroid of ∆������?
2. Part of a house’s facade—the face of the building—is shown on the coordinate grid. The facade is represented by ∆������, with vertices ��(−1, 2.5), ��(4.5, −3), and ��(−6.5, −3).
Work with your partner to estimate the location of the centroid of the triangular facade.
ManuscriptCopy

3. Use the centroids of ∆������ and ∆������ to complete the table.
Triangle Centroid
Average of the ��-coordinates of the Vertices
Average of the ��-coordinates of the Vertices
4. Work with your partner to make a conjecture about the relationships between the centroid and the averages of the ��- and ��-coordinates.
5. Ask 2 classmates for their conjectures. Record their conjectures, and write your summary of each conjecture. You are the only person who should write in the first 2 columns of the table. Have each person initial next to your summary, stating that your summary is correct.
Conjecture
My
Summary of Their Conjecture Initials
ManuscriptCopy
6. Review your conjecture with your partner. If necessary, make any changes.
Guided Activity: Centroids of Triangles
1. Triangle ������ has vertices at ��(0, −3), ��(8, 0), and ��(13, −7).

a. What is the average of the ��-coordinates?
b. What is the average of the ��-coordinates?
c. What are the coordinates of the centroid?
d. Verify the coordinates of the centroid by drawing the median of each side.
Lesson Summary
The centroid of a triangle is the intersection of the 3 medians of the triangle. Recall from Unit 6 that a median is a line segment from a vertex of a triangle to the midpoint of the opposite side.
On the coordinate plane, the ��-value of the centroid is the average of the ��-coordinates of the vertices of the triangle, and the ��-value of the centroid is the average of the ��-coordinates of the vertices of the triangle.
For example, ∆������ has vertices at ��(−5, 2), ��(1, 7), and ��(5, −1), as shown.
• The ��-value of the centroid for ∆������ is −5+1+5 3 = 1 3 .
• The ��-value of the centroid for ∆������ is 2+7+(−1) 3 = 8 3 .
• Therefore, the centroid is located at � 1 3 , 8 3 �.
Practice Problems
1. Triangle ������ has vertices at ��(5, 9), ��(9, 3), and ��(−5, 2).
What are the coordinates of the centroid of ∆������?

ManuscriptCopy

2. Triangle ������ has vertices at ��(−8, −3) and ��(3, −1) and a centroid at (−2, −4).
What are the coordinates of vertex ��?
3. Artemio is working to find the centroid of ∆������, with vertices at ��(−8, 5), ��(7, 8), and ��(−2, −3).
His work is shown.
a. Write a note to Artemio explaining his mistake.
b. What are the coordinates of the centroid of ∆������?
Review Problems
4. Technology required. A triangular prism has height 6 units. The base of the prism is shown in the image. What is the volume of the prism? Round your answer to the nearest tenth.

5. The triangle whose vertices are (2, 5), (3, 1), and (4, 2) is transformed by the rule (��, ��) → (�� − 2, �� + 4). Is the image similar or congruent to the original figure?
The image is congruent to the original triangle.
The image is similar but not congruent to the original triangle. The image is neither similar nor congruent to the original triangle.
ManuscriptCopy
Unit 8, Lesson 9: Classifying Quadrilaterals – Part 1
Warm-Up: Sports Data Statistician
1. Statisticians analyze numbers to look for trends. At a television network that produces sports news and entertainment, statisticians meet with the producers and anchors to expand their daily sports content with statistical data, painting a better picture for fans of what’s occurring in the world of sports.
Sports statisticians are responsible for:
• Inputting data into formulas to measure the distance of home runs
• Analyzing early-career athletes (prospects) based on statistics and projecting the probability of their future success
• Reviewing rundowns (second-by-second accounts of what will be going on TV) and compiling the statistics in each game
• Running scorecards to anchors during live games
a. List 2 skills someone might need to be a sports statistician.
ManuscriptCopy
b. Provide an example of how statistics can be used to provide a deeper understanding of something you watch on TV, listen to on the radio, listen to on a podcast, etc.
Exploration Activity: Classifying Quadrilaterals
1. �������� has vertices at ��(−6, 2), ��(−4, 5), ��(−1, 3), and ��(−3, 0).
a. Graph �������� on the coordinate plane.
b. Complete the table.

Line Segment Length
c. What do you notice about the side lengths of ��������?
d. Select all of the classifications that apply to ��������, based on your answers in part B.
□ Parallelogram □ Rectangle □ Rhombus □ Square
e. Complete the table.
f. What do you notice about the diagonal lengths of ��������?
g. Complete the statement.
ManuscriptCopy
Since �������� has does not have congruent diagonals and 2 side lengths all side lengths
are equal, �������� can be classified as a parallelogram. rectangle. rhombus. square.
Guided Activity: Classifying Quadrilaterals
1. �������� has vertices at ��(−2, −3), ��(3, −2), ��(5, −4), and ��(0, −5). Justify that �������� is a parallelogram but not a rectangle. Show your work.
2. Use the coordinate grid to complete the following.
a. Draw a quadrilateral for which the side lengths are all equal but the diagonals are not congruent.
b. Complete the statement.
This quadrilateral is classified as a .

c. Discuss with your partner how another classmate could use the coordinates of your quadrilateral to verify that your classification is correct. Summarize your discussion.
3. Ariyon was graphing square ��������, but she mixed up the vertices. She knows that point �� has coordinates (3, 5) and point �� has coordinates (7, 7). Her options for points �� and �� are shown.
a. Which coordinates are correct for points �� and ��? Justify your answer, or show your work.
Point �� Point �� (8, 3) (5, 1) (9, 3) (4, 1)
b. Which properties of a square did you use to determine the coordinates of points �� and ��?
ManuscriptCopy
Collaborative Activity: Quadrilaterals in the Real World
1. Francesco is using computer software to design the layout of a house. The base of the house creates �������� with coordinates ��(−4, 1), ��(4, 5), ��(6, 1), and ��(−2, −3).
a. Complete the table, and show your work. Leave answers in exact form.
Line Segment Length
b. Complete the table, and show your work. Leave answers in exact form.
Diagonal Line Segment
Length
c. Complete the statement.
�������� is classified as a because . . .
ManuscriptCopy
d. If 1 unit on the coordinate plane equals 5 feet (ft.), what are the dimensions of the base of the house? Round to the nearest thousandth.
Lesson Summary
This lesson focused on classifying quadrilaterals on the coordinate plane in both mathematical and real-world contexts. Properties of each quadrilateral can be used to classify quadrilaterals. The table shows some classifications and their properties.
Classification
Parallelogram
Rectangle
Property
Opposite sides are parallel and congruent.
Diagonals bisect each other.
Diagonals are congruent.
Rhombus Diagonals are perpendicular.
Square Diagonals are perpendicular and congruent.
When trying to classify a quadrilateral on the coordinate plane, there are multiple methods available for verifying properties of figures.
• The Pythagorean theorem or the distance formula can be used to determine if lengths are congruent.
• Find the slopes of side lengths or diagonals to determine whether they are parallel or perpendicular. If the slopes of the side lengths are the same, then they are parallel. When determining if diagonals are perpendicular, find the slope of each diagonal. If the slopes are opposite reciprocals, then the diagonals are perpendicular.
ManuscriptCopy
Practice Problems
1. �������� has vertices at ��(−3, 1), ��(−2, 4), ��(1, 3), and ��(0, 0).
a. Draw quadrilateral ��������.
b. Complete the statement.
�������� is classified as a because . . .
2. Draw a quadrilateral where the diagonals are congruent, opposite sides are parallel, and vertices are located at (−2, 0) and (1, 2). Then, complete the statement.
The quadrilateral is classified as a because . . .

3. Sara is mapping out a garden on a coordinate plane. She measured her yard and mapped out where she wants the vertices of the garden to be in relation to her house. The garden creates quadrilateral ��������, with coordinates ��(0, 2), ��(0, 5), ��(6, 5), and ��(6, 2).
a. Complete the table, and show your work. Leave answers in exact form.
Line Segment Length
b. Complete the statement.
�������� is classified as a because . . .
c. If 1 unit on the coordinate plane represents 3 ft., what is the area of Sara’s garden?
4. What is the length of the square’s side?

A. 3 units
B. 6 2 units
C. 6 2 units
D. 12 units
ManuscriptCopy
ManuscriptCopy
Unit 8, Lesson 10: Classifying Quadrilaterals – Part 2
Warm-Up: Would You Rather?
1. Would you rather . . . give up watching movies? or give up watching TV shows?
2. Explain your choice.
ManuscriptCopy
Collaborative Activity: Stations
Complete the table for each question card.
Question Work Answer
1 Slopes Properties Side Lengths
ManuscriptCopy
Quadrilateral
Diagonal Lengths
Side Lengths
Diagonal Lengths
Slope of ���� Using Each Point ��
Why is �������� not a square?
Lesson Summary
When classifying quadrilaterals on the coordinate plane, the length and slope of diagonals and sides can reveal what properties the quadrilateral has.
For example, quadrilateral �������� has vertices at ��(−8, −3), ��(−4, −2), ��(−5, −6), and ��(−9, −7). One approach to determining the type of quadrilateral is first finding the slopes of the diagonals. The slope of ���� is −1, and the slope of ���� is 1. This shows that the diagonals are perpendicular to each other, which means this quadrilateral can be classified a rhombus or square. For this quadrilateral to be a square, the diagonals must be congruent. The length of ���� is 3 2 units, and the length of ���� is 5 2 units. Therefore, the diagonals are not congruent, and this quadrilateral is classified as a rhombus.
Practice Problems
1. Jillian is determining which type of tile to place on her floor. She wants a tile in the shape of a parallelogram. The vertices of her tile options are shown.
Tile A
Tile B
(−11, 6.5), (−10, 3.5), (−6, 6.5), and (−7, 9.5) (3, 9.5), (7, 6), (9, 8.5), and (5, 11)
a. Which tile should Jillian pick if she wants a tile in the shape of a parallelogram?
b. List the properties of parallelograms that apply to your choice.
2. Aaron and Shreya classified �������� with vertices at ��(−3, 7), ��(−1, 7), ��(−3, 2), and ��(−5, 4). Their classifications are shown.
Aaron’s Classification
Quadrilateral �������� is a square or rectangle because the diagonals are congruent.
Shreya’s Classification
Quadrilateral �������� has congruent diagonals but cannot be classified as a parallelogram.
a. Whose classification do you agree with? Justify your answer using properties.
b. Write a note to the person whose classification is incorrect, explaining their mistake.
Review
Problems
3. Triangle ������ is congruent to ∆������. So, Lin knows that there is a sequence of rigid motions that takes ∆������ to ∆������.
Select all true statements after the transformations:

□ Angle �� coincides with angle ��.
□ Angle �� coincides with angle ��.
□ Angle �� coincides with angle ��.
□ Segment ���� coincides with segment ����.
□ Segment ���� coincides with segment ����.
ManuscriptCopy
Unit 8, Lesson 11: What Is the Figure?
Warm-Up: Midpoints
For the questions in this activity, use the coordinate grid if it is helpful to you.

1. What is the midpoint of the segment connecting (1, 2) and (5, 2)?
2. What is the midpoint of the segment connecting (5, 2) and (5, 10)?
3. What is the midpoint of the segment connecting (1, 2) and (5, 10)?
Collaborative Activity: Card Sort
Match each image, set of coordinates, classification, and property that represent the same polygon. Record your matches in the table by writing the letter or number of each card, and then show your justifications.
Match 1
Match 2
Image: Image: Image:
Match 3
Coordinates: Coordinates: Coordinates:
Classification: Classification: Classification:
Property: Property: Property:
Justification: Justification: Justification:
ManuscriptCopy
Match 4
Image: Image:
Coordinates:
Classification:
Property:
Justification:
Coordinates:
Classification:
Property:
Justification:
Match 5
Match 6
Image: Image:
Coordinates:
Classification:
Property:
Justification:
ManuscriptCopy
Coordinates:
Classification:
Property:
Justification:
Match 7
Lesson Summary
Properties of triangles and quadrilaterals can be used to classify a given shape. The table shows properties and classifications of triangles and quadrilaterals.
Classification
Properties
Equilateral triangle 3 congruent side lengths
Isosceles triangle 2 congruent side lengths
Scalene triangle No congruent side lengths
Parallelogram Opposite sides are parallel and congruent.
Rectangle Diagonals are congruent.
Square Diagonals are perpendicular and congruent.
Rhombus Diagonals are perpendicular.
When classifying a figure, identify the property that will be used in the verification. Then, find the lengths or slopes of the line segments needed to verify the property. For example, when verifying if a quadrilateral is a rhombus, determine if the diagonals are perpendicular by finding the slopes of the diagonals to determine whether they are opposite reciprocals.
ManuscriptCopy
Practice Problems
1. Select all the sets of ordered pairs that form squares.
□ (0, 2), (0, 5), (3, 5), and (3, 2)
□ (−2, 2), (0, 4), (2, 2), and (0, 0)
□ (−1, 1), (1, 3), (4, 3), and (2, 1)
□ (−1, −2), (0, 1), (2, 0), and (1, −3)
□ (−1, −1), (−2, 2), (1, 3), and (2, 0)
2. Quadrilateral �������� has vertices at ��(−2, 0), ��(1, 3), ��(3, 1), and ��(0, −2).
a. Graph quadrilateral ��������.

b. Complete the statement.
Quadrilateral �������� is a because . . .
3. Which set of ordered pairs could be the vertices of a scalene triangle?
A. (6, 4), (6, 6), and (4, 6)
B. (−2, 2), (−4, 2), and (−4, 5)
C. (8, −2), (12, −2), and (12, −6)
D. (4, 2), (6, 7), and (8, 2)
Review Problem
4. Select all true statements based on the diagram.
□ Angle ������ is congruent to angle ������.
□ Angle ������ is congruent to angle ������.
□ Segment ���� is congruent to segment ����.
□ Segment ���� is congruent to segment ����.
ManuscriptCopy
□ Line ���� is parallel to line ����.
□ Line ���� is parallel to line ����.
Unit 8, Lesson 12: Using Coordinate Geometry to Solve Real-World Problems
Warm-Up: Which One Doesn’t Belong: Coordinate Quadrilaterals
Which one doesn’t belong?


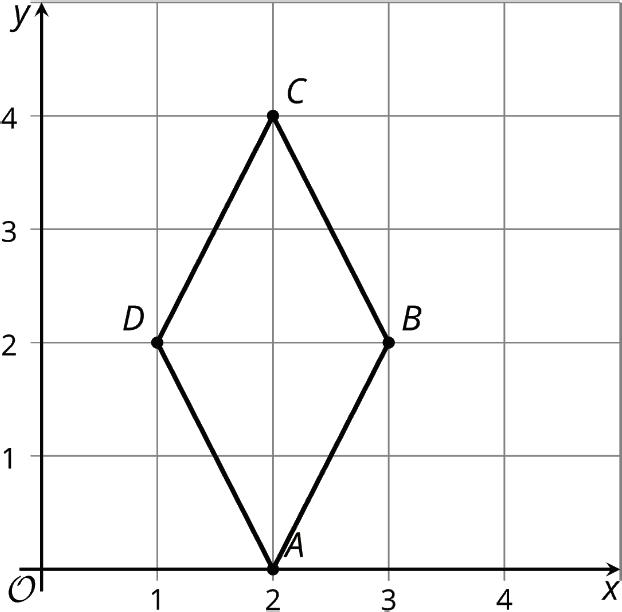

ManuscriptCopy
A. B.
C.
D.
Collaborative Activity: Coordinate Geometry in the Real World
1. Lana is designing the front of a doghouse. Her computer software generated coordinate points for her design, where each unit equals a foot (ft.). The roof has vertices at ��(7, 9), ��(11, 5), and ��(3, 5). The front wall has vertices at ��(11, 5), ��(11, 1), ��(3, 1), and ��(3, 5). The door entrance has vertices at ��(8, 1), ��(6, 1), ��(6, 4), and ��(8, 4).
a. What type of triangle is the roof, ∆������? Justify your answer.
b. What is the area of ∆������?

2. Clay tiles cost $8 per square foot (sq. ft.). How much will it cost Lana to put clay tiles on the given face of the doghouse’s roof?
a. What type of quadrilateral is the door, ��������? Justify your answer.
b. Lana is placing a frame around the door, ��������. How many feet of wood will she need? If necessary, round to the nearest thousandth.
c. What type of quadrilateral is the front wall, ��������? Justify your answer.
d. Lana is painting the front wall, ��������, excluding the door, ��������. What is the area of the front wall that Lana is painting?
3. Paint costs $0.55 per sq. ft. Excluding the door, how much will it cost to paint the front wall?
4. Justin is creating a layout for his garden in the shape of a quadrilateral, ��������, with vertices ��(2, 8), ��(11, 8), ��(11, 0), and ��(2, 0).
a. Classify ��������. Justify your answer.
Justin created 3 sections in the garden: ��������, ��������, and ∆������.
b. �������� has vertices at ��(3, 6), ��(6, 7), ��(7, 4), and ��(4, 3). Classify ��������. Justify your answer.
c. �������� has vertices at ��(6, 7), ��(9, 7), ��(11, 1), and ��(8, 1). Classify ��������. Justify your answer.
d. Triangle ������ has vertices at ��(4, 3), ��(7, 4), and ��(8, 1). Classify ∆������. Justify your answer.
The layout of the garden is shown.
5. If each square on the grid represents 1 sq. ft., how many feet of fencing will Justin need to go around ��������?
a. Complete the table. If necessary, round to the nearest thousandth.
Section
ManuscriptCopy

b. What is the total area of the 3 sections of the garden? If necessary, round to the nearest thousandth.
c. If a 40-pound (lb.) bag of soil covers 12 sq. ft., how many bags of soil will Justin need to cover the 3 sections of the garden?
6. Edwin started creating a new logo design for his company using the images shown.
To determine how to place the logo on the wall of the office, Edwin uploaded his design to a computer program and got the following approximate coordinates.
2)
6)
4)

11)
4)

The design is shown on the coordinate plane, where ���� is perpendicular to ����
a. Complete the table by finding the area of each triangle. Triangle Work
b. Explain how to use ∆������ and ∆������ to find the area of ��������.
c. What is the area of ��������? If necessary, round to the nearest thousandth.
d. What is the total area of Edwin’s design? If necessary, round to the nearest thousandth.
ManuscriptCopy
Lesson Summary
Quadrilaterals and triangles can be seen all around the world. This lesson focused on using the properties of quadrilaterals and triangles to solve real-world problems. When solving problems, use the given information to identify which property of quadrilaterals or triangles can be applied. Once the special quadrilateral and/or triangle has been identified, use the two-dimensional figure to answer questions in context.
Practice Problems
1. A city is building a new park. The park is split into 4 sections.
• The parking lot, quadrilateral ��������, with vertices ��(1, 4), ��(5, 5), ��(6, 1), and ��(2, 0)
• The skate park, ∆������, with vertices ��(1, 4), ��(5, 5), and ��(5, 10)
• The playground, ∆������, with vertices ��(5, 10), ��(13, 7), and ��(5, 5)
• The soccer field, quadrilateral ��������, with vertices ��(5, 5), ��(13, 7), ��(14, 3), and ��(6, 1)

a. Complete the table. If necessary, round to the nearest hundredth.
b. What is the area of entire park?
2. The theater department at school is building a set for the upcoming school play. Mr. Howell is mapping out the set to determine how much of each color paint he will need to buy. Each unit on the coordinate grid represents 1 ft.
a. Mr. Howell is painting the front walls, �������� and ��������, green, excluding �������� and ��������. Determine the area that will be painted green.

b. If green paint costs $0.23 per sq. ft., how much will Mr. Howell spend on green paint?
Review Problem
3. A quadrilateral has vertices �� = (0, 0), �� = (4, 6), �� = (0, 12), and �� = (−4, 6). Mai thinks the quadrilateral is a rhombus and Elena thinks the quadrilateral is a square. Do you agree with either of them? Show or explain your reasoning.
ManuscriptCopy
ManuscriptCopy
Unit 9, Lesson 1: Lines, Angles, and Curves
Warm-Up: Notice and Wonder
What do you notice? What do you wonder?


Exploration Activity: The Defining Moment

1. The images show some line segments that are chords and some segments that are not chords.
Chords

Write a definition of a chord.
ManuscriptCopy
Not Chords

2. The images show some highlighted objects that are arcs and some highlighted objects that are not arcs.
Arcs Not Arcs

Write a definition of an arc.

3. The images show some angles that are central angles and some that are not.
Central Angles
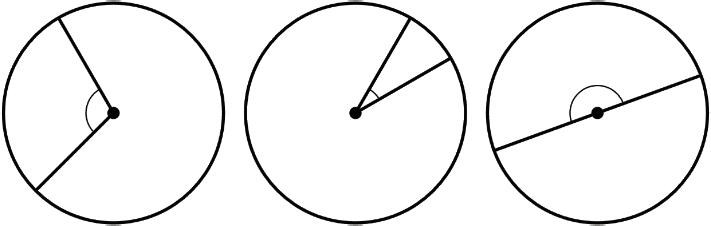
Write a definition of a central angle.
Not Central Angles

ManuscriptCopy
Collaborative Activity: Arcs, Chords, and Central Angles
The image shows a circle with 2 congruent chords.

1. Draw the central angles associated with the highlighted arcs from �� to �� and �� to ��.
2. How do the measures of the 2 central angles appear to compare?
Prove that this observation is true.
3. What does this tell you about the measures of the highlighted arcs from �� to �� and �� to ��? Explain your reasoning.
Lesson Summary
Diameters and radii are 2 familiar types of line segments that appear in circles. Some additional geometric objects associated with circles are chords, central angles, and arcs.
A chord of a circle is a line segment with both of its endpoints on the circle.
A central angle is an angle that has its vertex at the center of a circle with radii as its sides.
An arc is the part of a circle lying between two points on the circle.
Examples of each of these terms are shown in the table.
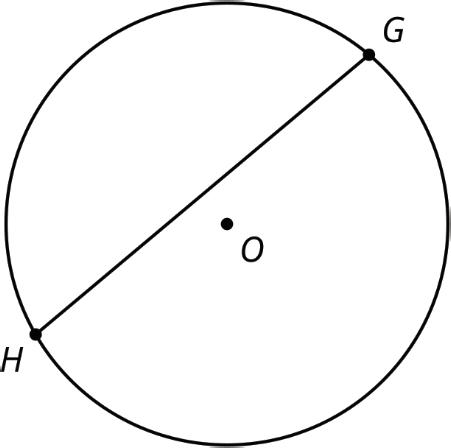


ManuscriptCopy
The arc ���� is notated as ����. The measure of an arc is defined as the measure of the central angle formed by the radii drawn to the endpoints of the arc. For example, in the image, the highlighted arc, ����, measures 45° because the central angle ������ measures 45°. Using the same reasoning, in the middle image, �� ���� = ��∠������.
Chord ����
Central Angle ������ Arc ����
Practice Problems
1. Find the values of ��, ��, and ��.
2. Give an example from the image of each kind of segment.
a. a diameter
b. a chord that is not a diameter
c. a radius


3. Identify whether each statement must be true, could possibly be true, or definitely can’t be true.
a. A diameter is a chord.
b. A radius is a chord.
ManuscriptCopy
c. A chord is a diameter.
d. A central angle measures 90°.
4. Write an equation of the altitude from vertex ��.

5. Triangle ������ has vertices at (5, 0), (1, 6), and (9, 3). What is the point of intersection of the triangle’s medians?
A. The medians do not intersect in a single point.
6. Consider the parallelogram with vertices at (0, 0), (8, 0), (4, 6), and (12, 6). Where do the diagonals of this parallelogram intersect?
ManuscriptCopy
B. (3, 3)
C. (5, 3)
D. (3, 4.5)
Unit 9, Lesson 2: Inscribed Angles
Warm-Up: Notice and Wonder: A New Angle
What do you notice? What do you wonder?

Exploration Activity: A Central Relationship
This activity requires the use of an applet, so please make your way over to the digital platform to find the link.
Use the applet to answer the questions. Do not show the angle measures until you are told to.
1. Name the central angle in this figure.
ManuscriptCopy
2. Name the inscribed angle in this figure.

3. Move point �� around the circle. As you move this point, what happens to the measure of ∠������? Show the angle measures to confirm.
4. Move points ��, ��, and �� to new positions. Record the measure of ∠������ and ∠������. Repeat this several times.
ManuscriptCopy
5. Make a conjecture about the relationship between an inscribed angle and the central angle that defines the same arc.
Guided Activity: Inscribed Angles
1. Circle �� is shown, where points ��, ��, and �� are on the circle. Angle ������ is inscribed inside circle ��, and �� ���� = 80°. Find the value of ��.

2. Points ��, ��, ��, and �� lie on circle ��. Angle ������ is inscribed in the circle. Find ��, given �� ������ = 192° and ��∠������ = (31�� + 3)°.
3. Boats use angle measures and arcs when sailing in treacherous waters. When a captain turns on the boat light, it forms inscribed angle ������. Use the information given for circle �� to find ��∠������.
ManuscriptCopy


4. Valentina and Craig are reviewing circles to identify inscribed angles.

Valentina identified circle C as having an inscribed angle. Craig identified both circle A and circle C as having inscribed angles. Do you agree with Valentina, Craig, or neither of them? Explain your reasoning.
Lesson Summary
Central angles such as ∠������ shown were discussed in the previous lesson. Another kind of angle in a circle is an inscribed angle.
An inscribed angle is an angle formed by two chords in a circle that share an endpoint.
In the image, ∠������ is an inscribed angle.
It looks as though the inscribed angle is smaller than the central angle that defines the same arc. In fact, the measure of an inscribed angle is always exactly half the measure of the associated central angle. For example, if the central angle ������ measures 50°, then the inscribed angle ������ must measure 25°, even if the location of point �� moves along the circumference (without going past �� or ��). This also means that all inscribed angles that intercept the same arc are congruent.
ManuscriptCopy

Practice Problems
1. Circle �� is shown, where ∠������ is a central angle, ∠������ is inscribed in the circle, and ��∠������ = 62°. Find ��∠������.

2. Circle �� has points ��, ��, and �� on the circle. Angle ������ is inscribed in circle ��, measuring 95°. Given �� ���� = 75°, find �� ����.

3. The measure of ∠������ is 56°. What is the measure of ∠������?
ManuscriptCopy
4. Explain the difference between central and inscribed angles.

5. What is the measure of the arc from �� to �� that does not pass through ��?
A. 160°
B. 140°
C. 100°
D. 90°
Review Problems
6. Find the values of ��, ��, and ��.


7. The rule (��, ��) → (��, − ��) takes a line to a perpendicular line. Select another rule that takes a line to a perpendicular line.
(��, ��) → (− ��, −��)
(��, ��) → (2��, 2��)
(��, ��) → (−4��, 4��)
(��, ��) → (0.25��, −4)
A.
B.
C.
D.
Unit 9, Lesson 3: Solving Problems Involving Intersecting Chords
Warm-Up: Would You Rather?
Would you rather . . .
deposit $5 in the bank and have it triple each week for 4 weeks? OR deposit $3 in the bank and have it quadruple each week for 4 weeks?
1. Which would you rather choose? Justify your reasoning using mathematics.
ManuscriptCopy
Collaborative Activity: Chords
Circle �� is shown. Points ��, ��, ��, and �� lie on the circle.
1. What similarities do you notice between ���� and ����?
2. What differences do you notice between ���� and ����?

3. Complete the statements.
Line segment ���� is a diameter a chord both a diameter and a chord of the circle.
Line segment ���� is a diameter a chord both a diameter and a chord of the circle.
ManuscriptCopy
Exploration Activity: Angles in Intersecting Chords
1. With your partner, complete the following using circle ��.
a. Draw and label 2 chords that intersect inside the circle, making sure the endpoints fall on the points provided. Do not draw the same chords as your partner, and avoid drawing diameters.

b. Choose 1 of the angles to measure and label. Then, complete the table.
c. Discuss the following with your partner.
• What do you notice about the values in the table?
• What do you think the relationship is between the angle measure and the 2 intercepted arcs?
d. Write a formula that generalizes your discovery from the discussion.
e. Complete the statement to summarize the relationship between intersecting chords.
The angle formed inside a circle by 2 intersecting chords is double equal to half the sum of the measures of the arcs intercepted by the angle and its vertical angle.
ManuscriptCopy
Guided Activity: Solving Problems Involving Angles in Intersecting Chords
1. Circle �� is shown. Chords ���� and ���� intersect at point ��. Find the value of �� for ∠������, given �� ���� = 71° and �� ���� = 129°.

2. A tree is cut down, leaving behind a circular tree stump. The top of the tree stump has 2 cracks that represent 2 chords, ���� and ����, intersecting at point �� in circle ��. If �� ������ = 175° and �� ���� = 39°, what is ��∠������?
3. Circle �� is shown, where chords ���� and ���� intersect at point ��. Find the value of ��, given �� ���� = 70°, �� ���� = 136°, and ��∠������ = (7�� + 19)°.
ManuscriptCopy


Lesson Summary
Intersecting chords create a unique relationship between the measures of the arcs intercepted by the angle and its vertical angle. The angles of intersecting chords theorem states that if 2 chords intersect, then the measure of the angle created is equal to half the sum of the measures of the arcs intercepted by the angle and its vertical angle.
For example, circle �� is shown, where chords ���� and ���� intersect at point ��, �� ���� = 51°, and �� ���� = 155°. To find the measure of ∠������, the equation shown can be used.
��∠������ = ������ + ������ 2 = 155 + 51 2 = 103
The measure of ∠������ is 103°.
Practice Problems
ManuscriptCopy

1. Circle �� is shown. Chords ���� and ���� intersect at point ��. Find the value of �� for ∠������ given �� ���� = 42° and �� ���� = 30°.

2. Circle �� is shown. Chords ���� and ���� intersect at point ��, �� ������ = 189°, �� ���� = 91°, and ��∠������ = (8�� + 4)°.
Wyatt found the value of ��, but he made an error. His work is shown.
Wyatt’s Work
��∠������ = �������� + ������
8�� + 4 = 189 + 91
8�� + 4 = 280
8�� = 276 �� = 34.5
Describe and fix Wyatt’s mistake.

3. Circle �� is shown. Chords ���� and ���� intersect at point ��. Find the value of �� given �� ���� = 81°, �� ���� = 148°, and ��∠������ = (5�� + 7)°.
ManuscriptCopy

4. Lines ℓ and �� are parallel. Select all true statements.

□ Triangle ������ is congruent to triangle ������.
□ The slope of line ℓ is equal to the slope of line ��.
□ Triangle ������ is similar to triangle ������.
□ sin(��) = sin(��)
□ cos(��) = sin(��)
5. Match each vocabulary term or phrase with a label from the diagram.

a. Chord that is not a diameter
ManuscriptCopy
b. Diameter
c. Radius
d. Central angle
Unit 9, Lesson 4: Solving Problems Involving Intersecting Secants
Warm-Up: Circles and Polygons
1. A square lattice with 3 circles is shown. The circles pass through exactly 2, 3, and 4 points on the lattice, respectively.
a. What do you notice about the circles?
b. Connect the points on each circle to create a polygon. Describe any pattern you notice.

c. What type of polygon would be inside a circle that passes through 5 points?
d. On the lattice, draw a circle that passes through exactly 5 points.
Exploration Activity: Angles Formed by Secants
A secant is a line or line segment that passes through 2 points on a circle. In the interior of the circle, a secant line segment forms a chord.
1. Angle ������ intersects circle ��, creating 2 intercepted arcs. Points ��, ��, ��, and �� are on the circle. ��∠������ = 38°, ��∠������ = 80°, and ��∠������ = 21°.

a. Complete the table.
b. Add and subtract the 2 arc measures.
c. Does either the sum or the difference of �� ���� and �� ���� relate to the measure of ∠������? If so, explain.
d. With your partner, write a formula that can be used to find the measure of an exterior angle of 2 secant lines.
Guided Activity: Solving Problems Involving Angles Formed by Secants
1. Circle �� has points ��, ��, ��, and �� on the circle. Secants ���� and ���� intersect at point �� outside the circle. �� ���� = 125°, �� ���� = 27°, and ��∠������ = ��°. What is the value of ��?

2. A satellite, point ��, sends signals ���� and ���� to Earth. Signal ���� hits tower �� before reaching tower ��. Similarly, signal ���� hits tower �� before reaching tower ��. Scientists are interested in finding the measure of the intercepted arcs created by the 2 signals. They know that ��∠�� = 30°, �� ���� = (12�� + 7)°, and �� ���� = (3�� + 1)°.
Find �� ���� and �� ����.
ManuscriptCopy

Lesson Summary
When 2 secants intersect outside a circle, an angle is formed. The exterior secant angle theorem can be used to determine the measure of the angle. The theorem states that the measure of an angle formed by 2 secants intersecting on the exterior of a circle is 1 2 the difference of the measures of the intercepted arcs.
For example, circle �� is shown, where points ��, ��, ��, and �� are on the circle. Secants ���� and ���� intersect at point �� outside the circle, �� ���� = 117°, and �� ���� = 72°.

The following equation can be used to find the measure of ∠������.
The measure of ∠������ is 22.5°.
ManuscriptCopy
Practice Problems
1. Circle �� has points ��, ��, ��, and �� on the circle, as shown. Secants ���� and ���� intersect at point �� outside the circle. �� ���� = 99° and ��∠������ = 27°.
Miguel determined the measure of ����, but he made an error. Miguel’s work is shown.
Miguel’s Work
�� ���� = 99 − 27 2 = 72 2 = 36 �� ���� = 36°
Describe and correct Miguel’s error.

2. Circle �� has points ��, ��, ��, and �� on the circle. Secants ���� and ���� intersect at point �� outside the circle. �� ���� = 92°, �� ���� = 22°, and ��∠������ = ��°. What is the value of ��?
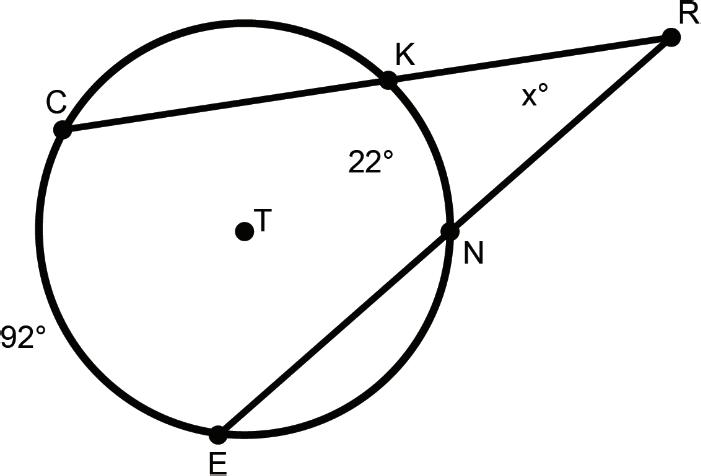
3. Circle �� has points ��, ��, ��, and �� on the circle. Secants ���� and ���� intersect at point �� outside the circle. �� ���� = (5�� + 10)°, �� ���� = (3�� + 4)°, and ��∠������ = 30°.
Find the measure of ����.

Review Problems
4. Triangle ������ has vertices at (−4, 0), (−2, 12), and (12, 0). What is the point of intersection of its medians?
5. Write 3 expressions that can be used to find ∠��.
ManuscriptCopy
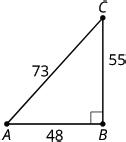
A. (4, 0)
B. (5, 6)
C. (2, 4)
D. (4, 2)
Unit 9, Lesson 5: Solving Problems with Tangents
Warm-Up: Swim to Shore
Line �� represents a straight part of the shoreline at a beach. Suppose you are in the ocean at point �� and you want to get to the shore as fast as possible. Assume there is no current. Segments ���� and ���� represent 2 possible paths.

Diego says, “No matter where we put point ��, the Pythagorean theorem tells us that segment ���� is shorter than segment ����. So, segment ���� represents the shortest path to shore.”
Do you agree with Diego? Explain your reasoning.
Exploration Activity: Intersecting Tangent Lines
1. Work with your partner to complete the following.
a. Without measuring, which dashed line represents the shortest distance from point �� to ����? Explain your answer.

b. Point �� is the center of a circle that intersects ����. In the table, describe your observations of each dashed segment in relation to the center of circle ��.
Segment
Relationship with the Center of Circle ��
ManuscriptCopy

c. Discuss with your partner the relationship ���� has with the center of circle ��.
Collaborative Activity: Angles Formed by Tangents and Secants
1. Circle �� with tangents ���� and ���� is shown. Use the diagram to complete the following.

a. Complete the table.
ManuscriptCopy
b. Use the values for the major and minor arcs of circle �� to determine a relationship between the arcs and the measure of the exterior angle formed by the 2 tangents. The relationship can be described using words or equations.
c. Ask 2 other partner pairs to share their relationships. Record each of their relationships and ask them to initial, verifying that you have written it correctly. If their description or equation is different than yours, discuss the differences, and determine if your description or equation needs to be revised.
Description or Equation
Initials Measure
d. Explain how to find the measure of an angle formed by 2 tangents drawn to a circle from a point outside that circle. Be sure to use the term “intercepted arc(s)” at least once in your description.
2. Circle �� shows ∠������ formed by the intersection of tangent ���� and secant ���� outside the circle at point ��. �� ���� = 164°, �� ���� = 74°, and ��∠������ = 45°.

a. Use the values for ���� and ���� of circle �� to determine the relationship between the arcs and the measure of the exterior angle formed by the tangent and the secant.
b. Discuss the relationship with your partner.
ManuscriptCopy
Lesson Summary
This lesson introduced lines and line segments that are tangent to circles.
A line or segment is tangent to a circle if the line or segment intersects the circle at exactly 1 point.
If a line is tangent to a circle, then it is perpendicular to a radius that ends at the point of tangency.
The formula for the measure of an external angle to a circle formed by 2 tangents, 2 secants, or 1 tangent and 1 secant is shown.
measure of angle formed = 1 2 (difference of intercepted arcs), where the difference of the intercepted arcs is larger arc − smaller arc.
Practice Problems
1. Circle �� has points �� and �� on the circle. Tangents ���� and ���� intersect at point �� outside the circle. �� ������ = 239.21°, �� ���� = ��°, and ��∠������ = 59.21°. Find the value of ��.
2. Circle �� has points ��, ��, and �� on the circle. Tangent ���� and secant ���� intersect at point �� outside the circle. �� ���� = 148°, �� ���� = 62°, and ��∠������ = ��°. What is ��∠������?
ManuscriptCopy


3. Circle �� has points ��, ��, ��, and �� on the circle. Tangent ���� and secant ���� intersect at point �� outside the circle. �� ������ = 218°, �� ���� = ��°, and ��∠������ = 60°.
Anders found the measure of ����, but he made an error. His work is shown.
Anders’s Work
��∠������ = ������ − ������
60 = 218 − ��
−158 = −�� �� = 158 �� ���� = 158°
Describe and correct Anders’s error.

Review Problem
4. The arc from �� to �� not passing through �� measures 50°. Select all the true statements.
□ Angle ������ measures 50°.
□ Angle ������ measures 25°.
□ Angle ������ measures 50°.
ManuscriptCopy
□ The arc from �� to �� not passing through �� measures 180°.
□ Angles ������ and ������ are congruent.
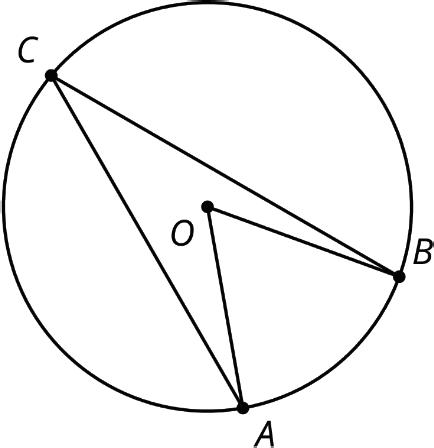
Unit
9, Lesson
6: Triangles and Quadrilaterals Inscribed in Circles
Warm-Up: Angles in Polygons
1. Complete each statement.
a. The sum of the interior angles of a triangle is .
b. The sum of the interior angles of a quadrilateral is .
Guided Activity: Solving Problems Involving Triangles Inscribed in Circles
1. Circle �� is shown. Points ��, ��, and �� are on circle �� and create ∆������. �� ���� = 162°, ��∠������ = 58°, and ��∠������ = (7�� − 17)°.
a. What is the ��∠������?
b. Find the value of ��.

c. What is the ��∠������?
2. Circle �� has points ��, ��, and �� on the circle and diameter ����. Triangle ������ is inscribed in circle ��. �� ���� = 102° and ��∠������ = (4�� − 10)°.
a. What is the ��∠������?
b. Find the value of ��.

3. Triangle ������ and ∆������ are inscribed in circle P, where ���� is the diameter of circle ��. �� ���� = (2�� − 6)°, �� ���� = (4�� − 6)°, and �� ���� = (3�� + 30)°.
Complete the table.
Angle Measures
Angle Measures

Exploration Activity: Inscribed Angles and Circumscribed Circles
1. The images show 3 quadrilaterals with circumscribed circles.


For each one, highlight the arc from �� to �� passing through ��. Then, find the measures of:
a. the arc you highlighted
b. the other arc from �� to ��
c. angle ������
ManuscriptCopy
Here is another quadrilateral with a circumscribed circle. What is the value of �� + ��? Explain or show your reasoning.

Collaborative Activity: Quadrilaterals Inscribed in Circles
1. Complete the statement.
If a quadrilateral is inscribed in a circle, adjacent opposite angles are congruent. complementary. supplementary.
2. Circle �� has quadrilateral �������� inscribed in the circle. �� ������ = 206° and ��∠������ = 84°.
a. What is the ��∠������?
b. What is the ��∠������?

3. Circle �� has quadrilateral �������� inscribed in the circle. ��∠������ = (2�� − 7)°, ��∠������ = (2�� + 3)°, and ��∠������ = (�� + 4)°.
a. Find the value of ��.
b. Find each angle measure.

Lesson Summary
In this lesson, the quadrilaterals and triangles explored were inscribed polygons in a circle.
An inscribed polygon in a circle is a polygon which has all of its vertices on a circle.
These polygons are circumscribed by circles.
A polygon is circumscribed by a circle if it fits inside the circle and every vertex of the polygon is on the circle.
Angle relationships in circles, such as central angles and inscribed angles, can be applied to inscribed polygons in a circle to solve problems. Use the given information in a problem to determine what is known about the inscribed polygon and what information you are solving for. Set up equations based on the relationships known from the given information.
Some useful facts to recall when solving such problems are listed.
• The sum of all the interior angles of a triangle is 180°.
• When a quadrilateral is inscribed in circle, opposite angles of the quadrilateral are supplementary.
• The measure of an angle inscribed in a circle is half the measure of the intercepted arc.
• The measure of a full circle is 360°, and a semi-circle is 180°.
ManuscriptCopy
Practice Problems
1. Circle �� has quadrilateral �������� inscribed in the circle. ��∠������ = (6�� + 32)°, ��∠������ = (6�� − 8)°, ��∠������ = 73°, and ��∠������ = (3�� − 1)°.
a. Find the value of ��.
b. What is the ��∠������?
c. Find the value of ��.

d. What is the ��∠������?
2. Circle �� has points ��, ��, and �� on the circle, and ∆������ is inscribed in circle ��. �� ���� = (9�� + 23)°, ��∠������ = 36°, and ��∠������ = (7�� − 21)°.
a. What is the value of ��?
ManuscriptCopy
b. What is the ��∠������?

3. Circle �� has points ��, ��, ��, and �� on the circle, and ∆������ is inscribed in circle ��. ��
= (7�� − 7)°, ��
= (23�� − 5)°, ��∠������ = (5�� − 23)°, and ��∠������ = (8�� + 29)°.
Complete the table.
Angle Measures Arc Measures
4. Circle �� has quadrilateral �������� inscribed in the circle. �� ���� = 71°, �� ���� = 61°, and ��∠������ = (12�� − 3)°.
a. Find the value of ��.
b. What is the ��∠������?
ManuscriptCopy

5. A quadrilateral has vertices �� = (0, 0), �� = (2, 4), �� = (0, 5), and �� = (−2, 1). Select the most precise classification for quadrilateral ��������.
A. quadrilateral
B. parallelogram
C. rectangle
D. square
6. A circle and line are drawn. How many intersection points are possible? Select all possible answers.
ManuscriptCopy
Unit 9, Lesson 7: Solving Problems with Lengths of Intersecting Chords
Warm-Up: Notice and Wonder
1. A picture of a bowling ball pyramid is shown.
a. What do you notice?
b. What do you wonder?

c. Write a question about the pyramid that a 5th grader could answer.
Exploration Activity: Chords
1. Circles ��, ��, and �� are shown. Each circle has a chord. Use tracing paper to copy the circles. Use the tracing paper copy to construct a perpendicular bisector for each chord by folding.
a. Write a conjecture about the perpendicular bisector of a chord of a circle.

b. Share your conjecture with your partner. Then, listen to your partner’s conjecture, and write a summary. Have your partner initial, stating that your summary is correct.
Summary of Partner’s Conjecture Partner’s Initials
c. Review your conjecture, and make revisions if needed.
2. Circle �� is shown, where ���� and ���� are radii of the circle. Line segments ���� and ���� are chords equidistant from center ��. Therefore, ���� ≅ ����.
a. Using your conjecture about perpendicular bisectors, complete each congruency statement.
b. Draw a line segment from point �� to point ��, and draw a line segment from point �� to point ��.
c. Justify why ���� and ���� are congruent.

d. Given that ���� ≅ ���� and ���� ≅ ����, what triangle congruence theorem justifies that ∆������ and ∆������ are congruent?
e. Since ∆������ ≅ ∆������, what must be true about ���� and ����?
f. What is true about chords ���� and ����?
ManuscriptCopy
3. Circle �� is shown, where points ��, ��, ��, and �� are on the circle. Chords ���� and ���� intersect at point ��.
Complete the table with your partner by recording observations, commonalities, and wonderings about the 2 chords.
Observations of the Blue Chord Measures

Observations of the Green Chord Measures
Commonalities between the Blue and Green Chords
What do you wonder about the relationship between the blue chord and the green chord?
Guided Activity: Chord Relationships
1. Circle �� is shown with chord ���� and secant ���� , where ���� bisects ���� and ���� is a diameter of the circle.
What information is known about circle ��, chord ����, and the angles formed by ���� and ����?

2. Circle �� is shown with chords ���� and ����, where ���� ≅ ����. Chords ���� and ���� are perpendicular to ����.
What information is known about circle ��, chords ���� and ����, and the angles formed by ���� ?
ManuscriptCopy

3. Circle �� is shown with chords ���� and ���� that intersect at point ��.
What information is known about circle ��, chords ���� and ����, and the angles formed?

Lesson Summary
This lesson is the first of many lessons that focus on solving problems involving the lengths of segments inside a circle. When 2 chords intersect inside a circle, a unique relationship is built between each point on the circle and the point where the chords intersect.
• If a diameter of a circle is perpendicular to a chord, then the diameter bisects the chord and its arc.
• If 2 chords are equidistant from the center of a circle, then the chords are congruent.
• When 2 chords intersect each other inside a circle, the products of their respective segment lengths are equal.
For example, in circle �� shown, chords ���� and ���� intersect at point ��. Therefore, ���� ∙ ���� = ���� ∙ ����.
ManuscriptCopy

Practice Problems
1. Circle �� is shown, with points ��, ��, ��, and �� on the circle. Chords ���� and ���� are equidistant from the center. Find the value of �� if ���� = 6�� − 7, ���� = 35, ���� = ����, and ��∠������ = ��∠������ = 90°.

2. When Doug’s pizza was delivered, he realized that it wasn’t cut evenly. The pizza, circle ��, is cut by chords ���� and ����.
Given that ���� = (5�� − 6) inches (in.), ���� = 2 in., ���� = 3 in., and ���� = 2�� in., what is the length of ����?

3. Circle �� is shown, where points ��, ��, ��, and �� are on the circle. The diameter, ����, is a perpendicular bisector of chord ����. If ���� = �� + 4 and ���� = 2�� + 1, what is the length of chord ����?

4. The measure of angle ������ is 56°.

a. What is the measure of ∠������?
b. What is the measure of the arc from �� to �� not passing through ��?
5. Which statement must be true?
A. A diameter is a chord.
B. A chord is a radius.
C. A chord is a diameter.
D. A central angle’s vertex is on the circle.
Unit 9, Lesson 8: Solving Problems with Lengths of 2 Secants
Warm-Up: Would You Rather?
1. Would you rather have . . . a cube of gold, 25 millimeters (mm) on each side? or
2 cubes of gold, one that’s 24 mm on each side and one that’s 1 mm on each side?

2. Explain your choice.
ManuscriptCopy
Exploration Activity: Intersecting Secant Lengths
1. Circle �� is shown with points ��, ��, ��, and �� on the circle. Secants ���� and ���� intersect at point �� outside the circle. ���� = 6, ���� = 9, ���� = 8, and ���� = 7.
a. Complete the table.
Product Work Answer
b. Discuss the following with your partner.
• What do you notice about your answers?
• What do you notice about the secant segments for the rows that have the same answer?
c. With your partner, use the diagram of circle �� to write a formula that can be used to find the lengths of intersecting secant segments.
ManuscriptCopy


Guided Activity: Solving Problems Involving Intersecting
Secant Lengths
1. Circle �� with secants ���� and ���� is shown. Line segments ���� and ���� intersect at point �� outside the circle. ���� = 5, ���� = 3, ���� = ��, and ���� = 4. Solve for ��.

2. Circle �� is shown, where points ��, ��, ��, and �� are on the circle. Secants ���� and ���� intersect at point �� outside the circle, such that ���� = 7, ���� = 9, ���� = 5��, and ���� = 4��. Determine the value of ��.

3. Sinks Grove, West Virginia, got its name from the community’s many sinkholes. A geologist mapped one of the circular sinkholes. His diagram is shown, where circle �� has secants ���� and ����. Points �� and �� are on circle ��, and point �� is outside the circle. ���� = (4�� + 4.25) meters (m), ���� = 12.75 m, ���� = (3�� + 5.5) m, and ���� = 14 m.
Find the distance from point �� to point ��, in meters.

Lesson Summary
This lesson focused on the relationships between the lengths of 2 secants intersecting outside of a circle. If 2 secants intersect outside a circle, then the product of the lengths of 1 secant segment and its external secant segment equals the product of the lengths of the other secant segment and its external secant segment.
Circle �� has points ��, ��, ��, and �� on the circle, where secants ���� and ���� intersect outside of circle ��. The equation shown can be used to find the lengths of the intersecting secants.
(����)(����) = (����)(����)
ManuscriptCopy
This equation can also be rewritten using the segment addition postulate since ���� = ���� + ���� and ���� = ���� + ����.
(����)(���� + ����) = (����)(���� + ����)

Practice Problems
1. Circle �� has points ��, ��, ��, and �� on the circle. Secants ���� and ���� intersect at point �� outside the circle. Point �� is on ����, and point �� is on ����. ���� = 10, ���� = 8, ���� = 2�� − 17, and ���� = 9. Solve for ��.
2. Circle �� is shown, where points ��, ��, ��, and �� are on the circle and point �� is outside the circle. ���� = 975 feet (ft.), ���� = 1425 ft., and ���� = 1250 ft. What is the length of ����, in feet?

3. Circle �� has points ��, ��, ��, and �� on the circle. Secants ���� and ���� intersect at point �� outside the circle. ���� = 4, ���� = �� − 1, ���� = 3, and ���� = 4�� − 7. Solve for ��.

4. Which statement must be true?
A. A diameter is a chord.
B. A chord is a radius.
C. A chord is a diameter.
D. A central angle’s vertex is on the circle.
5. Mai wrote a proof that triangle ������ is congruent to triangle ������. Mai’s proof is incomplete. How can Mai fix her proof?
We know side ���� is congruent to side ���� and angle �� is congruent to angle ��. By the angle-side-angle triangle congruence theorem, triangle ������ is congruent to triangle
ManuscriptCopy

Unit 9, Lesson 9: Solving Problems with Secant and Tangent Segments
Warm-Up: Conic Sections
Conic sections are the family of curves created when a plane slices through a cone. A circle is the best-known type of conic section. A diagram of 4 conic sections is shown.
According to Greek philosopher Proclus, conic sections were discovered around 350 BCE by Menaechmus, a member of Plato’s Academy. About 100 years later, Apollonius, a Greek geometer and astronomer, developed and published the theory of conic sections. His work earned him the title of the Great Geometer. You will study conic sections in future courses.

1. Use the diagram to explain why a cone sliced horizontally results in a circle.

Collaborative Activity: Lengths of Intersecting Secant and Tangent Segments
Work with your partner to complete the following.
1. Circle �� has points ��, ��, and �� on the circle. Secant ���� and tangent ���� intersect at point �� outside the circle. Given that ∆������ ∼ ∆������, ���� = 15, and ���� = 9.
a. Use the similiar triangles to write a proportional relationship that can be used to determine the length of ����.
ManuscriptCopy

b. Use the diagrams of circle �� to write a formula that can be used to find the segment lengths of the intersecting secant and tangent lines.


Guided Activity: Solving Problems Involving Intersecting Secant and Tangent Segments
1. Circle �� has points ��, ��, and �� on the circle. Secant ���� and tangent ���� intersect at point �� outside the circle. ���� = 4, and ���� = 3. What is the length of ����? Round to the nearest thousandth.
2. Circle �� is shown with points ��, ��, and �� on the circle. Secant ���� and tangent ���� intersect at point �� outside the circle. ���� = 3�� + 4, ���� = 9, and ���� = 15. What is the value of ��?

3. A drone flew over the Laguna Garzon Bridge in Uruguay and took pictures at 3 points on the bridge: point ��, point ��, and point ��. Tangent ���� and secant ���� intersect at point �� off the bridge. If ���� = 280 feet (ft.) and ���� = 160 ft., what is the length of ����?

Lesson Summary
This lesson focused on the relationships of the lengths of a secant and a tangent intersecting outside of a circle. If a secant and tangent segment are drawn to a circle from the same external point, then the square of the measure of the tangent segment is equal to the product of the measures of the secant segment and its external secant segment.
This relationship can be shown with circle ��, shown, where tangent ���� and secant ���� intersect at point �� outside the circle.
Equations representing the relationships between segments are shown.
(����)2 = (����)(����)
(����)2 = (���� + ����)(����)
Notice the part of the equation representing the secant, ����, can be substituted with ���� + ���� using the segment addition postulate.

Practice Problems
1. Circle �� is shown with points ��, ��, and �� on the circle. Secant ���� and tangent ���� intersect at point �� outside of the circle. ���� = 16, ���� = (7.5�� − 6.25), and ���� = 24.
a. Find the value of ��.
b. What is the length of ����?
2. A tour company flies tourists over the islet of Vila Franca do Campo in Portugal. The tour guide made a map to indicate when the talking points of the tour should be: point ��, point ��, point ��, and point ��. Tangent ���� and secant ���� intersect outside the circle at point ��. ���� = 320 meters (m) and ���� = 480 m.
Determine the distance from point �� to point ��.

ManuscriptCopy

3. Circle �� is shown with points ��, ��, and �� on the circle. Secant ���� and tangent ���� intersect at point �� outside the circle. ���� = 7�� − 6, ���� = 12, and ���� = 18. Find the value of ��.

Review Problems
4. Elena is writing notes about central angles in circles. Help her finish her notes by answering the questions.
a. Where is the vertex of a central angle located in relation to the circle?
b. What line segments related to circles are contained in the rays that form a central angle?
c. How does the measure of a central angle relate to the measure of the arc it is associated with?
5. Quadrilateral �������� is shown with the given angle measures. Select all true statements.
□ Angle �� measures 140°.
□ The measures of ∠�� and ∠�� must add to 180°.
□ Angle �� measures 55°.
□ Angle �� measures 55°.
□ Angle �� measures 40°.

Unit 9, Lesson 10: Solving Problems with Lengths of 2 Tangents
Warm-Up: Segment Relationships
1. Circle �� has points ��, ��, and �� on the circle. Secant ���� and tangent ���� intersect at point �� outside the circle. Given that ���� = 16 and ���� = 9, find the length of ����.
ManuscriptCopy

Collaborative Activity: Intersecting Tangent Lines
1. Circle �� is shown with tangents ���� and ���� and radii ���� and ����.

a. Draw a dotted line from point �� to point ��.
b. Discuss with your partner the relationships that can be determined, given that ���� and ���� are tangents and ���� and ���� are radii. Summarize your discussion.
c. Discuss with your partner why the hypotenuse-leg (HL) theorem can be used to show that ∆������ and ∆������ are congruent.
d. Since ∆������ ≅ ∆������, what is true about ���� and ����?
Guided Activity: Solving Problems Involving Intersecting Tangent
Lines
1. Circle �� has points �� and �� on the circle. Tangents ���� and ���� intersect at point �� outside the circle. If ���� = �� + 15 and ���� = 2�� − 5, find the length of ����.

ManuscriptCopy
2. Circle �� has points ��, ��, and �� on the circle. Circle �� has points ��, ��, and �� on the circle. Tangents ���� and ���� intersect outside the circle at point ��. Tangents ���� and ���� intersect outside the circle at point ��. If ���� = (7�� − 36), ���� = (5�� − 14), ���� = (8�� + 13), and ���� = ����, what is the value of ��?
3. The Eiffel Tower in Paris, France, stands at 324 meters (m) tall. The tower has 4 semicircular arches at its base. Circle �� represents one of the 4 arches at the base of the tower, where points �� and �� lie on the circle. If ���� = (17�� + 27) m and ���� = (20�� − 15) m, what is the length of ����, in meters?

Lesson Summary
Tangent segments to a circle from the same point are congruent. When solving for unknown variables or the lengths of tangent segments, set the lengths of the tangent segments equal.
For example, circle �� is shown, where tangents ���� and ���� intersect at point �� outside the circle. If ���� = 16�� + 10 and ���� = 24�� − 8, the value of �� can be found using an equation, as shown.
16�� + 10 = 24�� − 8
18 = 8��
�� = 2.25
To find the lengths of tangents ���� and ����, substitute the value of �� into the given expressions.
• ���� = 16(2.25) + 10 = 46
• ���� = 24(2.25) − 8 = 46
Practice Problems
1. Circle �� has points �� and �� on the circle. Tangents ���� and ���� intersect at point �� outside the circle. If ���� = 4�� − 19 and ���� = 15, find the value of ��.

2. Points �� and �� are on circle ��, and points �� and �� are on circle ��. Line segments ���� and ���� intersect at point ��. Line segment ���� is tangent to circle �� at point �� and tangent to circle �� at point ��. Line segment ���� is tangent to circle �� at point �� and tangent to circle �� at point ��. If ���� = 4�� − 8, ���� = 2�� + 1, ���� = 2�� − 1, and ���� = 5�� − 7, what is the value of ��?

3. Circle �� has points �� and �� on the circle. Circle �� has points �� and �� on the circle. Tangents ���� and ���� intersect outside the circles at point ��. ���� = 4�� − 7, ���� = 2�� + 5, ���� = 6�� − 4, and ���� = 2�� + 4.
a. What is the value of ��?
ManuscriptCopy
b. What is the value of ��?

c. What is the length of ����?
4. On a stationary bike, a belt guard is used to cover some of the bike’s inner mechanics. Circle �� is shown, where points �� and �� are on the circle. Tangents ���� and ���� intersect outside the circle at point ��.
If ���� = 15 and ���� = 4�� − 9, what is the value of ��?
Review Problems

5. Chords ���� and ���� intersect at point ��. List 3 pairs of angles that must be congruent.

6. The line represented by �� = −3�� − 21 is transformed by the rule (��, ��) → (− ��, − ��). What is the slope of the image?
Unit 9, Lesson 11: Arcs and Sectors
Warm-Up: Fractions of a Circle
Evaluate each problem mentally.
• Find the area of the shaded portion of the circle.

• Find the area of the shaded portion of the circle.

ManuscriptCopy
• Find the length of the highlighted portion of the circle’s circumference.
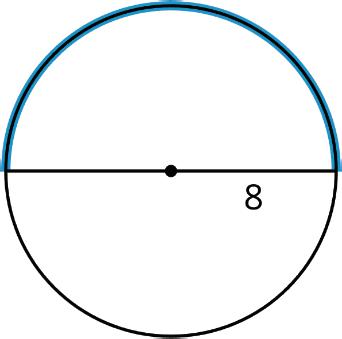
• Find the length of the highlighted portion of the circle’s circumference.

Exploration Activity: Sector Areas and Arc Length
A sector of a circle is the region enclosed by 2 radii.


For each circle, find the area of the shaded sector and the length of the arc that outlines the sector. All units are in centimeters (cm). Give your answers in terms of ��.
Area of Shaded Sector
Length of the Arc that Outlines Sector
ManuscriptCopy
Guided Activity: Build a Method
Mai says, “I know how to find the area of a sector or the length of an arc for central angles like 180° or 90°. But I don’t know how to do it for central angles that make up more complicated fractions of the circle.”
1. In the diagram, the sector’s central angle measures �� degrees and the circle’s radius is �� units. Use the diagram to tell Mai how to find the area of a sector and the length of an arc for any angle and radius measure.

2. This image shows a circle with radius and central angle measurements. Find the area of the shaded sector and the length of the arc defined by the sector.

Collaborative Activity: Pizza Palooza
Elena was researching offers for the upcoming Pizza Palooza festival. She wants to get a good deal on a single slice of pizza.
Your teacher will give you cards that show the deals offered by 4 vendors. Which vendor should Elena choose? Explain or show your reasoning.
Lesson Summary
This lesson explored sectors of a circle.
A sector is the region inside a circle lying between two radii of the circle.
To find the area of a sector, start by calculating the area of the whole circle. Divide the measure of the central angle of the sector by 360 to find the fraction of the circle represented by the sector. Then, multiply this fraction by the circle’s total area. A similar process can be used to find the length of the arc lying on the boundary of the sector.
For example, the circle in the image has a total area of 144�� square centimeters (sq. cm), and its circumference is 24�� cm. To find the area of the sector with a 225° central angle, divide 225 by 360 to get 5 8 or 0.625. Multiply this by 144�� to find that the area of the sector is 90�� sq. cm. The length of the arc defined by the sector is 15�� because 24�� ⋅ 5 8 = 15��.
Practice Problems
ManuscriptCopy

1. Suppose a circle is divided into congruent slices. Match each number of slices with the resulting central angle measure of each slice.
2. A circle of radius 12 units is divided into 8 congruent slices.
a. What is the area of each slice?
b. What is the arc length of each slice?
3. Diego says, “To find arc length, divide the measure of the central angle by 360. Then multiply that by the area of the circle.“ Do you agree with Diego? Show or explain your reasoning.
4. Which of these pizza slices gives the best value (the most pizza per dollar spent)?
A. a slice with a radius of 12 inches (in.), central angle of 30°, and a cost of $3 per slice
B. a slice with a radius of 8 in., central angle of 45°, and a cost of $2 per slice
C. a slice with a radius of 6 in., central angle of �� 3 radians, and a cost of $2 per slice
ManuscriptCopy
D. a slice with a radius of 6 in., central angle of �� 4 radians, and a cost of $1 per slice
Review Problems
5. In the diagram, the measure of the arc from �� to �� not passing through �� is 80° degrees. What is the measure of ∠������?
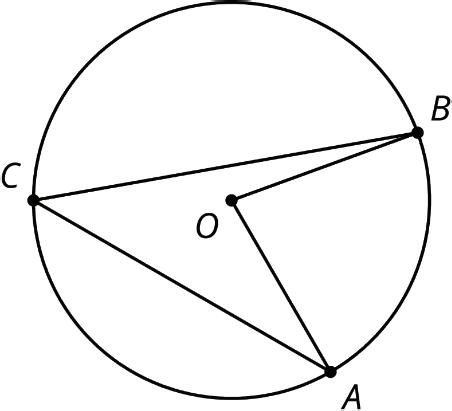
6. This solid has curved sides. All cross sections parallel to the base are squares measuring 3 units on each side. The height from the base to the top is 8 units. What is the volume of this solid?
ManuscriptCopy

7. How do the values of �� and �� compare? Explain your reasoning.

A. 20°
B. 40°
C. 80°
D. 160°
Unit 9, Lesson 12: Part to Whole
Warm-Up: What’s Your Angle?
A circle has radius 10 centimeters (cm). Suppose an arc on the circle has length �� cm. What is the measure of the central angle whose radii define the arc?
Exploration Activity: Enough Information?
The central angle of this shaded sector measures 45°, and the sector’s area is 32�� square inches (sq. in.).
Kiran says, “We can find the area of the whole circle, the arc length of the sector, and the circumference of the circle with this information.”
Priya says, “But how? We don’t know the circle’s radius!”
Do you agree with either of them? Explain or show your reasoning. Calculate as many of the values Kiran mentioned as possible.
ManuscriptCopy

Collaborative Activity: Info Gap: From Sector to Circle
Your teacher will give you either a problem card or a data card. Do not show or read your card to your partner.
If your teacher gives you the data card:
1. Silently read the information on your card.
2. Ask your partner, “What specific information do you need?” and wait for your partner to ask for information. Only give information that is on your card. (Do not figure out anything for your partner!)
3. Before telling your partner the information, ask, “Why do you need to know (that piece of information)?”
4. Read the problem card, and solve the problem independently.
5. Share the data card and discuss your reasoning.
If your teacher gives you the problem card:
1. Silently read your card and think about what information you need to answer the question.
2. Ask your partner for the specific information that you need.
3. Explain to your partner how you are using the information to solve the problem.
4. When you have enough information, share the problem card with your partner, and solve the problem independently.
5. Read the data card, and discuss your reasoning.
Pause here so your teacher can review your work. Ask your teacher for a new set of cards and repeat the activity, trading roles with your partner.
ManuscriptCopy
Lesson Summary
Information given about a sector or arc can be used to work backward to get information about the whole circle.
Suppose a circle has an arc with length 7�� units that is defined by a 90° central angle.
• This arc makes up 1 4 of the entire circumference of the circle because 360 ÷ 90 = 4, so multiply the arc’s length by 4 to find that the entire circumference measures 28�� units.
• The circumference of a circle can be calculated using the expression 2����, so the equation 2���� = 28�� can be used to determine ��. The value of �� must be 14 units.
For more difficult problems, write equations. Suppose a circle has a sector with area 135�� sq. units and a central angle of 216°.
• Let �� stand for the area of the whole circle. Dividing 216 by 360 gives the fraction of the circle represented by the sector. Multiply that fraction by ��, and set it equal to the area of the sector.
216 360 �� = 135��
• Solve the equation to find that the circle’s area is 225�� sq. units.
• This means that ����2 = 225��. The value of �� must be the positive number that squares to make 225, or 15 units.

Practice Problems
ManuscriptCopy
1. Jada cuts out a rectangular piece of paper that measures 5 inches (in.) by 4 in. Han cuts out a paper sector of a circle with radius 5 in. and calculates the arc length to be 2�� in. Whose paper is larger? Show your reasoning.
2. A circle has radius 10 cm. Suppose an arc on the circle has length 8�� cm. What is the measure of the central angle whose radii define the arc?
3. A circle has radius 6 units. For each arc length, find the area of a sector of this circle which defines that arc length.
a. 4�� units
b. 5�� units
c. 10 units
d. ℓ units
Review Problems
4. Select all the sectors which have an area of 3�� square units.
□ a sector with a radius of 6 units and a central angle of 30°
□ a sector with a radius of 6 units and a central angle of 45°
ManuscriptCopy
□ a sector with a radius of 3 units and a central angle of 60°
□ a sector with a radius of 3 units and a central angle of 120°
□ a sector with a radius of 3 units and a central angle of 180°
5. A circle has radius 4 units and a central angle measuring 45°. What is the length of the arc defined by the central angle?
6. Priya and Mai are trying to prove that if 2 chords are congruent, they are equidistant from the center of the circle. Priya draws this picture.

Mai adds the perpendicular segment from the center of the circle to each chord.

Priya says, “I think we should try to use triangles because that is how we proved things congruent before.” Mai says, “I think you’re right, but how? Should we draw in some radii?”
Help them complete the proof.
ManuscriptCopy
Unit 9, Lesson 13: Angles, Arcs, and Radii
Warm-Up: Comparing Progress
Han and Tyler are each completing the same set of tasks on an online homework site. Han is using his smartphone and Tyler is using his tablet computer. Their progress is indicated by the circular bars shown in the image. The shaded arc represents the tasks that have been completed. When the full circumference of the circle is shaded, they will be finished with all the tasks.
Tyler’s progress
Han’s progress


Tyler says, “The arc length on my progress bar measures 4.75 centimeters (cm). The arc length on Han’s progress bar measures 2.25 cm. So, I’ve completed more tasks than Han has.”
1. Do you agree with Tyler? Why or why not?
2. What information would you need to make a completely accurate comparison between the two students’ progress?
ManuscriptCopy
Exploration Activity: A Dilated Circle
The image shows 2 circles. The second circle is a dilation of the first circle using a scale factor of 3.


For each part of the dilated image, determine the factor by which it’s changed when compared to the corresponding part of the original circle.
1. the area of the sector
2. the central angle of the sector
3. the radius
4. the length of the arc defined by the sector
ManuscriptCopy
5. the ratio of the circle’s circumference to its diameter
Collaborative Activity: Card Sort: Angles, Arcs, and Radii
Your teacher will give you a set of cards. Sort the cards into categories of your choosing. Be prepared to explain the meaning of your categories. Then, sort the cards into categories in a different way. Be prepared to explain the meaning of your new categories.
Lesson Summary
If 2 different circles have the same central angle, then the length of the arc defined by the angle depends on the size of the circle. So, the relationship between the arc length and the circle’s radius can be used to determine some information about the size of the central angle.
For example, suppose circle A has radius 9 units and a central angle that defines an arc with length 3��. Circle B has radius 15 units and a central angle that defines an arc with length 5��. How do the 2 angles compare?
ManuscriptCopy

• For the angle in circle A, the ratio of the arc length to the radius is 3�� 9 , which can be rewritten as �� 3 . For the angle in circle B, the arc length to radius ratio is 5�� 15 , which can also be written as �� 3 . That seems to indicate that the angles are the same size.
• Circle A’s circumference is 18�� units. The arc length 3�� is 1 6 of 18��, so the angle measurement must be 1 6 of 360°, or 60°. Circle B’s circumference is 30�� units. The arc length 5�� is 1 6 of 30��, so this angle also measures 1 6 of 360°, or 60°. The 2 angles are indeed congruent.
Practice Problems
1. Tyler is confident that all circles are similar, but he cannot explain why this is true. Help Tyler explain why all circles are similar.
2. Circle B is a dilation of circle A.
circle A

circle B

a. What is the scale factor of dilation?
b. What is the length of the highlighted arc in circle A?
c. What is the length of the highlighted arc in circle B?
d. What is the ratio of the arc lengths?
ManuscriptCopy
e. How does the ratio of arc length compare to the scale factor?
3. Kiran cuts out a square piece of paper with side length 6 inches (in.). Mai cuts out a paper sector of a circle with radius 6 in. and calculates the arc length to be 4�� in. Whose paper is larger? Explain or show your reasoning.
4. A circle has radius 3 cm. Suppose an arc on the circle has length 4�� cm. What is the measure of the central angle whose radii define the arc?
5. A circle with a shaded sector is shown.
a. What is the area of the shaded sector?
b. What is the length of the arc that outlines this sector?

ManuscriptCopy
Unit 9, Lesson 14: Using Coordinates to Prove Relationships in Circles
Warm-Up: Perpendicular Lines
1. Which equation represents a line that is perpendicular to the line �� = − 1 3 �� + 3?
A. 3�� + �� = 4
B. �� − 3�� = 24
C. �� − 3�� = −4
D. �� + 3�� = 3
Collaborative Activity: Circles on the Coordinate Plane
1. Circle �� is shown, where point �� is on the circle and ���� is tangent to circle ��.
a. Use a straightedge to draw a line that passes through points �� and ��.
b. Discuss with your partner how the slope of tangent ���� and the slope of the radius ���� are related.
c. What property of circles explains this relationship?

d. Write the equation of ���� .
e. Write the equation of ���� .
ManuscriptCopy
f. Lines ���� and ���� intersect at point ��(7, −1). Use the equations of lines ���� and ���� to confirm this point.
2. Circle �� has its center at (−2, 1) and a tangent line with the equation �� = 2�� − 5.
a. Write the equation of the line that passes through the center of the circle perpendicular to the tangent line.
b. Find the point where the tangent line touches circle ��. Call this point ��.
c. What is the radius of circle ��?
d. Point ��(−4, 5) lies on circle ��. Prove that line �� = 1 2 �� + 7 is tangent to circle �� at point ��.
3. Circle �� is shown with secant lines ���� and ����, tangent line ����, and chord ����.

a. Complete the table.
Line Segment Length
b. Determine the length of ����.
ManuscriptCopy
Guided Activity: Points on a Circle
1. Circle �� has a center at (−4, 3) and a radius of 6.
a. Complete the table by finding the distance between each point and the center of circle ��. Points
Distance from Center
−2)
−1)
−3)
b. Discuss with your partner what you notice about the distances from the center and the radius of the circle.
Circle �� is shown on the coordinate plane.
c. Plot points ��, ��, and �� on the coordinate plane.
d. What do you notice about the locations of the points and their distances from the center?

e. Complete the statement.
When a point lies on the circle, the distance between the point and the center is less than greater than equal to the radius of the circle.
2. Circle �� has a center at (−6, −5) and a radius of 5 with points ��(−6, 0), ��(−3, −1), ��(−1, −5), and ��(−9, −9) on the circle.
a. What is the length of the diameter of circle ��?
b. Complete the table by finding the distance between the given points.
Points
��(−6, 0) and ��(−9, −9)
Work Distance
��(−3, −1) and ��(−9, −9)
��(−1, −5) and ��(−9, −9)
c. What do you notice about the distances between the points?
d. What can you conclude about points �� and ��?
ManuscriptCopy
3. Circle �� has a radius of 29 units and points ��(2, −2), ��(5, 1), and ��(12, −6) on the circle.
a. Determine which 2 points are the endpoints of a diameter of circle ��. Show your work.
b. Describe how to find the center of the circle using the 2 endpoints of the diameter.
c. What is the center of the circle?
ManuscriptCopy
Lesson Summary
The coordinate plane can be used to prove relationships in circles that have been explored throughout this unit, such as determining if a line is tangent to a circle through a given point or the location of points in relationship to a circle.
If a line is tangent to a circle, then it is perpendicular to a radius of the circle at the point of tangency.
Circle �� has a center at (2, 5) and a tangent line with the equation �� = − 1 3 �� + 9. The steps to find the point of tangency are shown.
Step
Work
Identify the slope of the line perpendicular to the tangent line. Slope perpendicular to tangent line is 3.
Write an equation of a line that is perpendicular to the tangent line and passes through the center. 5 = 3(2) + �� �� = −1 �� = 3�� − 1
Set the equations equal to each other to solve for the ��-value of the point of tangency.
Substitute the ��-value into either equation to find the ��-value of the point of tangency. �� = 3(3) − 1 �� = 8
The point of tangency is (3, 8).
To determine if a point lies on a circle, inside the circle, or outside the circle, find the distance between the given point and the center.
• If the distance between the given point and the center is equal to the radius, then the point lies on the circle.
• If the distance between the given point and the center is less than the radius, then the point lies inside the circle.
• If the distance between the given point and the center is greater than the radius, then the point lies outside the circle.
Practice Problems
1. Circle �� has its center at (9, −2) and a tangent line with equation 3�� + 2�� = 36.
At what point does the tangent line touch circle ?
2. Circle �� is shown with tangents ���� and ����. What is the length of ����?
3. Circle �� has a radius of 13 and a center at (8, 2).
Determine whether the following points lie inside, outside, or on circle ��.
Point
(5, −1)
(6, 5)
ManuscriptCopy
(12, 2)
(11, 0)
(9, 4)
Work

Location
Inside circle ��
Outside circle �� On circle ��
Inside circle ��
Outside circle �� On circle ��
Inside circle ��
Outside circle �� On circle ��
Inside circle ��
Outside circle �� On circle ��
Inside circle ��
Outside circle �� On circle ��
4. Chords ���� and ���� intersect at point ��. Select all pairs of angles that must be congruent.
□ angle ������ and angle ������
□ angle ������ and angle ������
□ angle ������ and angle ������
□ angle ������ and angle ������
□ angle ������ and angle ������
ManuscriptCopy

ManuscriptCopy
Unit 10, Lesson 1: Statistical Questions
Warm-Up: Which One Doesn’t Belong: Types of Data
Which one doesn’t belong?
Question A: How many potato chips are in this bag of chips?
Question B: What is the typical number of chips in a bag of chips?
Question C: What type of chips are these?
Question D: What type of chips do students in this class prefer?
Collaborative Activity: Representing Data about You and Your Classmates
Your teacher will assign you a set of 3 questions.
• Write another question of your own that will require data collected from the class to answer.
• For each of the 4 questions, write a survey question that will help you collect data from the class that can be analyzed to answer the question.
• Ask the 4 survey questions to 15 classmates and record their responses to collect data.
• After collecting the data return to your group.
1. What is the question of your own that will require data collected from the class to answer?
2. What are the 4 survey questions you will ask your classmates?
ManuscriptCopy
3. Summarize the data for each question in a sentence or two and share the results with your group.
4. With your group, decide what the responses for question number 1 have in common. Then do the same for questions numbered 2 and 3.
5. Does the question you wrote fit best with the questions from number 1, 2, or 3? Explain your reasoning.
ManuscriptCopy
Lesson Summary
Statistics is about using data to solve problems or make decisions. There are 2 types of data.
• Numerical data is expressed using numbers.
Numerical data, also called measurement or quantitative data, is data where the values are numbers, measurements, or quantities.
For example, to answer the question “How tall are the students in this class?” you would measure the height of each student, which would result in numerical data.
• Categorical data is expressed using characteristics.
Categorical data is a type of data which is divided into groups.
For example, to answer the question “What brand of phones do people use?” you would survey several people and their answers result in categorical data.
The question that you ask determines the type of data that you collect and whether there is variability expected in the data collected.
Variability means having different values.
In previous courses, you learned that there is variability in a data set if not all the values in the data set are the same. Statistical questions are used to gather such data.
A statistical question is a question that can be answered by collecting data. Often there will be variability in the data.
The examples shown are statistical questions because they are answered by collecting data that has variability expected.
• “What is the average class size at this school?” would produce numerical data with some variability.
• “What are the favorite colors of students in this class?” would produce categorical data with some variability.
In general, when gathering data in the study of statistics, non-statistical questions should be avoided.
A non-statistical question is a question which can be answered by a specific measurement or procedure where no variability is anticipated.
The examples shown are non-statistical questions because they are answered by collecting data that does not vary.
• “How many students are on the roster for this class?” would produce numerical data that does not vary. There is only 1 value in the data set, so there is no variability.
• “What color is this marker?” would produce categorical data that does not vary. There is only 1 value in the data set, so there is no variability.
Practice Problems
1. Write a survey question for which you would expect to collect numerical data.
2. Write a survey question for which you would expect to collect categorical data.
3. Select all the statistical questions.
□ What is the typical amount of rainfall for the month of June in the Galapagos Islands?
□ How much did it rain yesterday at the Mexico City International Airport?
□ Why do you like to listen to music?
□ How many songs does the class usually listen to each day?
□ How many songs did you listen to today?
□ What is the capital of Canada?
□ How long does it typically take for 2nd graders to walk a lap around the track?
4. Lin and her friends went out for ice cream after school. The following questions came up during their trip. Select all the questions that are statistical questions.
□ How far are we from the ice cream shop?
□ What is the most popular ice cream flavor this week?
□ What does a group of 4 people typically spend on ice cream at this shop?
□ Do kids usually prefer to get a cup or a cone?
□ How many toppings are there to choose from?
Review Problems
5. Complete the table. Each row represents a circle with a defined sector, where measurements are given in centimeters (cm) or square centimeters (sq. cm).
6. In the diagram, the measure of ∠������ is 25°. What is the measure of ∠������?

Unit 10, Lesson 2: Representing Data on a Scatter Plot
Warm-Up: Representing Data
Lin surveyed 30 students about the longest time they had ever run. Andre asked them about their favorite color. How could Lin and Andre represent their data sets? Would they represent them in the same way? Why or why not?
ManuscriptCopy
Guided Activity: Representing Bivariate Data
1. The US Centers for Disease Control and Prevention (CDC) is the nation’s health protection agency. Epidemiologists at the CDC study the spread and impact of diseases. The table shows the number of symptomatic cases of influenza, also called the flu, in millions, in the US since 2011.
a. What year does the number 6 represent?
b. Keanu and Francisca were discussing what they noticed about the values in the table.
I noticed the actual year was not used in the table. I think this makes sense because the flu may not have existed in 1700.
I noticed the information given in the table stated the information was from a study. I think the study did not start until 2011.
Discuss Keanu’s and Francisca’s ideas with your partner.
2. Discuss with your partner what you notice in the data. Summarize your discussion.
This data set is an example of bivariate data because 2 variables are being compared.
3. What are the 2 characteristics measured in the table?
Keanu Francisca
Bivariate numerical data can be represented in different ways. One way to represent the data is a scatter plot with a line of fit.
4. A scatter plot of the data on symptomatic cases of the flu in the US is shown. The line of fit, �� = 2.34�� + 19.1, is included on the scatter plot, where �� is the number of symptomatic cases of the flu in the US, in millions, and �� is the number of years since 2011.
a. Discuss with your partner which variable is the independent variable and which is the dependent variable in this context. Identify your choices.

Independent Variable Number of cases of the flu Years since 2011
Dependent Variable Number of cases of the flu Years since 2011
b. Complete the statement.
ManuscriptCopy
To create a scatter plot, the overall trends raw data values are used to plot points on the coordinate plane. A line is then fit to the data to be able to observe overall trends. raw data values. The scatter plot shown indicates there is not a a positive a negative linear relationship. The number of years since 2011 number of flu cases in the US has been increasing decreasing since 2011. with the number of flu cases.
Collaborative Activity: Representing Bivariate Data
1. A scatter plot comparing the weights, in kilograms (kg), and fuel efficiencies, in miles per gallon (mpg), of 18 cars is shown.
a. Complete the statement.

The graph shows that, in general, a car’s fuel efficiency increases decreases as the car’s weight increases.
b. A scatter plot representing the same bivariate data set, but using a different scale, is shown.
Explain how the change in scale could influence how the relationship between the 2 variables is interpreted.

Lesson Summary
This lesson focused on how bivariate data can be represented in scatter plots with a line of fit.
Bivariate data is data that measures 2 characteristics of a population.
A scatter plot is a graph in the coordinate plane representing a set of bivariate numerical data that is used to observe the relationship between 2 variables.
A line of fit is a line drawn on a scatter plot to estimate the relationship between 2 sets of data. A line of fit is also known as a trend line.
For example, the scatter plot shown displays the data of the weight, in pounds (lb.), and height, in inches (in.), for each dog from a group of 25 dogs.

ManuscriptCopy
As presented in the scatter plot, the height of the dog is the independent variable, and the weight of the dog is the dependent variable. Note that in some cases, depending on the relationship being investigated, the variables used on each axis are interchangeable. In this case, the researcher is investigating whether dog’s height impacts it’s weight. The line modeling the association between the data can be used to observe overall trends. The scatter plot shown indicates there is a positive linear relationship between the 2 variables. The graph shows that in general, as a dog’s height increases, the dog’s weight also increases.
Practice Problems
1. The relationship between the height, in inches, and weight, in lb., of 25 dachshunds, a breed of dogs, is represented on the scatter plots.
Scatter Plot A

Scatter Plot B

a. Explain which of the graphs is best to show the relationship between the weight and height of these dogs.
b. Describe the relationship between a dachshund’s height and its weight using the graph identified in part A.
2. The relationship between the age of a dachshund, in months, and its weight, in lb., is shown on the scatter plot.
Complete the statements.

The independent variable in this scenario is age weight and the dependent variable is age. weight. The scatter plot models does not model a linear trend between the variables because the data points appear do not appear to fall closely around a line.
Review Problems
3. Match each arc length and radius with the measure of the central angle that defines the arc.
ManuscriptCopy
4. What is the measure of angle ������?

5. Here is a list of questions. For each question, decide if the responses will produce numerical data or categorical data and give two possible responses.
a. What is your favorite breakfast food?
b. How did you get to school this morning?
c. How many different teachers do you have?
d. What is the last thing you ate or drank?
ManuscriptCopy
e. How many minutes did it take you to get ready this morning—from waking up to leaving for school?
Unit 10, Lesson 3: Describing Associations between Data
Warm-Up: Foot to Foot
A scatter plot showing the lengths and widths of 20 left feet is shown with a line modeling the relationship between foot length and width.
1. Draw a box around the point that represents the foot with a length closest to 29 centimeters (cm).
2. What is the approximate width of this foot?

3. What width does the model predict for a foot with length 29 cm?
Collaborative Activity: Scatter Plots and Patterns of Association
1. The two scatter plots show the same set of data summarizing the average gestation period, in days, and average longevity, in years, for a sample of 30 animals, as reported in The World Almanac and Book of Facts (McGeveran, 2006). A gestation period is the amount of time for which an animal is pregnant. Longevity refers to how long an animal lives. Each scatter plot shows a different line to model the relationship between gestation period and longevity.


Discuss with your partner which scatter plot shows a line better fit to model the relationship.
Line of Fit A
Line of Fit B
2. The scatter plot shows the relationship between the weight, in carats, and the price, in dollars, of 20 different diamonds.
The equation �� = 5,673�� − 1,354 models the relationship between a diamond’s weight and its price based on the data shown. This line of fit can be used to predict the price of a diamond from its weight.
a. Define the variables in this context.
• �� represents • �� represents

b. Use the model to predict the price of a diamond that weighs 1.5 carats.
ManuscriptCopy
c. Two of the diamonds from the original data set weighed 1.5 carats. The actual price of the two diamonds used to construct the scatter plot are shown in the table.
Discuss with your partner how the actual prices of these two diamonds compare to the predicted price of a diamond of that weight. Summarize your discussion.
The line fit to the data in a scatter plot is used to model the association between the variables. It can be used to make estimates or predictions, but the actual values may fall above or below the line.
d. Complete the statements to describe the patterns of association for the scatter plot.
The relationship between a diamond’s weight and price is linear. nonlinear.
As a diamond’s weight increases, decreases, the price increases, decreases,
so the trend is positive. negative.
The data points closely follow the line of best
fit, so the pattern of association is weak. strong.
3. Complete the table to describe the pattern of association for each scatter plot.
Scatter Plot A

Scatter Plot B

linear
Pattern of Association
Scatter Plot C
positive
strong
nonlinear
negative
moderate
neither
weak

linear
Pattern of Association
nonlinear
strong
Guided Activity: Interpreting a Linear Model Fit to Bivariate Data
1. The scatter plot shows the relationship between the house size, in square feet (sq. ft.), and the sale price, in dollars, of 16 houses sold in Ann Arbor, Michigan, in 2021.
The equation �� = 176.1�� − 23,791 can be used to model the relationship between size of a house, ��, and its sale price, ��, in Ann Arbor, Michigan, in 2021.
a. Determine the slope and ��-intercept of the model.

b. Discuss with your partner what you think the slope means in this context.
c. Complete the statement.
In this context, the slope means the house size sale price increases decreases
$176.10 per sq. ft. 176.1 sq. ft. per dollar for homes in Ann Arbor, Michigan, in 2021.
d. Trevor and Nadia both considered the meaning of the ��-intercept in this context. Each student’s thinking is shown in the table.
Trevor’s Thinking Nadia’s Thinking
“The ��-intercept means the sale price of a house with 0 sq. ft. would have been −$23,721 in Ann Arbor, Michigan, in 2021.”
“The meaning of the ��-intercept does not make sense in this context. Houses don’t have 0 sq. ft. and they don’t sell for negative amounts of money.”
Discuss Trevor’s and Nadia’s thinking with your partner.
Exploration Activity: Considering the Significance of an Experimental Result
When models are used to represent the relationship between bivariate data, the model represents the average, or trend. It is the expected or predicted relationship between the variables based on the data gathered.
1. What would you expect the relationship between the weight and height of a dog to be?
2. Write a statistical question that could be used to gather the data needed to investigate your prediction.
3. Gaston gathered the height and weight of 23 dogs to investigate his statistical question “What is the strength of the relationship between a dog’s weight and a dog’s height?” His data and a line modeling the relationship are shown on the scatter plot.

a. Gaston expected there to be a strong, positive, linear relationship between a dog’s weight and height. Explain whether the data Gaston gathered supports his prediction.
b. Gaston noticed that 1 point seemed out of place compared to the other points in the data he gathered. Approximate the point.
c. Interpret the point in context.
When analyzing data collected to answer an investigative question, it is important to compare experimental results to what is expected from the model created. That is, determine whether there is statistical significance in an experimental result. Statistical significance is a measure used to determine the likelihood that an experimental result that is different from the expectation is a random occurrence or whether other factors could be responsible for the result.
d. Discuss with your partner whether you think the dog represented by the point is the result of random occurrence or if there could be another factor responsible for the result.
Lesson Summary
This lesson focused on describing associations between data.
An association is a way to describe the form, direction, or strength of the relationship between the two variables in a bivariate data set. For numerical data, descriptions include linear or nonlinear; positive or negative; strong or weak.
When a linear function fits data well, there is a linear association between the variables. Associations can also be described as a positive association or a negative association.
A positive association is a relationship between two quantities where one tends to increase as the other increases. In a scatter plot, the data points tend to cluster around a line with a positive slope.
A negative association is a relationship between two quantities where one tends to decrease as the other increases. In a scatter plot, the data points tend to cluster around a line with a negative slope.
For example, the scatter plot shown displays the relationship between height and weight for 25 dogs with the line of fit also graphed.
Because the model fits the data well and because the slope of the line is positive, there is a positive linear association between dog height and dog weight.
What do you think the association between the weight of a car and its fuel efficiency is? A scatter plot and its line of fit are shown to represent data gathered about the relationship between these variables.
Because the slope of a line that fits the data well is negative, there is a negative linear association between the fuel efficiency and weight of a car.
ManuscriptCopy


Determining the statistical significance of unexpected results will be studied in greater detail in future courses.
Practice Problems
1. Complete the table by identifying the pattern of association for each scatter plot.
Scatter Plot 1 Pattern
Scatter Plot 2

ManuscriptCopy
Scatter Plot 3


2. A recent survey investigated the relationship between the number of traffic tickets a person received and the cost of the person’s car insurance. The scatter plot displays the relationship.
Describe the relationship between the variables.

3. Select all the words that describe the association between the variables represented on the scatter plot shown.
□ Linear
□ Strong
□ Neither
□ Positive
□ Moderate
□ Negative
□ Nonlinear
Review Problems

4. Here is a list of questions about the students and teachers at a school. Select all the questions that are statistical questions.
□ What is the most popular lunch choice?
□ What school do these students attend?
□ How many math teachers are in the school?
□ What is a common age for the teachers at the school?
□ About how many hours of sleep do students generally get on a school night?
□ How do students usually travel from home to school?
Unit 10, Lesson 4: Exploring Lines Fit to Data
Warm-Up: Which One Doesn’t Belong: Scatter Plots
Which one doesn’t belong?
ManuscriptCopy


Exploration Activity: The Agony of the Feet
A scatter plot that shows the lengths and widths of 20 different left feet is shown.

1. Estimate the lengths of the longest foot and the shortest foot.
2. Estimate the widths of the widest foot and the narrowest foot.
Here is the same scatter plot together with the graph of a model for the relationship between foot length and width.

3. Circle the data point that seems out of place when compared to the model. What length and width does that point represent?
ManuscriptCopy
4. Discuss with your partner whether you think this point is attributed to a random occurrence or whether other factors could possibly be responsible for the difference.
Exploration Activity: Good Fit, Bad Fit
The scatter plots both show the year and price for the same 17 used cars. However, each scatter plot shows a different model for the relationship between year and price.

1. Look at Diagram A.

a. For how many cars does the model in Diagram A make a good prediction of its price?
b. For how many cars does the model underestimate the price?
c. For how many cars does it overestimate the price?
2. Look at Diagram B.
a. For how many cars does the model in Diagram B make a good prediction of its price?
b. For how many cars does the model underestimate the price?
c. For how many cars does it overestimate the price?
3. For how many cars does the prediction made by the model in Diagram A differ by more than $3,000? What about the model in Diagram B?
4. Which model does a better job of predicting the price of a used car from its year?
Collaborative Activity: Practicing Fitting Lines
1. Is this line a good fit for the data? Explain your reasoning.

2. Draw a line that fits the data better.

3. Is this line a good fit for the data? Explain your reasoning.

4. Draw a line that fits the data better.
ManuscriptCopy

Lesson Summary
When data represented on a scatter plot appears to have a linear association, a line can be fit to the data to model the relationship between the quantities. When approximating a line fit to data, it should go through the data in such a way that there are points both above and below the line (some may be on the line) and that most of the data values appear to cluster around the line in the direction it shows.
The next lesson will explore how to use 2 representative points from the data to find an approximate line of fit.
Practice Problems
1.
a. Draw a line that you think is a good fit for this data. For this data, the inputs are the horizontal values, and the outputs are the vertical values.
b. Use your line of fit to estimate what you would expect the output value to be when the input is 10.

2. Here is a scatter plot that shows the most popular videos in a 10-year span.
a. Use the scatter plot to estimate the number of views for the most popular video in this 10- year span.
b. Estimate when the 4th most popular video was released.
ManuscriptCopy

3. A scatter plot representing the age of children, in years (yrs.), and their heights, in inches (in.) is shown. Brianna drew a line of best fit for the data, but she made an error. Her line is shown.
a. Explain why Brianna’s line is not a good fit for the data.

b. Draw a line that fits the data better.
Review Problem
ManuscriptCopy

4. Clare is trying to explain how to find the area of a sector of a circle. She says, “First, you find the area of the whole circle. Then, you divide by the radius.” Do you agree with Clare? Explain or show your reasoning.
ManuscriptCopy
Unit 10, Lesson 5: Fitting Lines to Data
Warm-Up: Speed vs. Step Length
A researcher found an association between a dog’s stride length and its speed: the longer a dog’s steps, the faster it goes. The predicted speed in meters per second, ��, as a function of step length in meters, ��, is shown.
ManuscriptCopy
What does the rate of change of the function tell you about the association between stride length and speed?
Exploration Activity: Animal Brains
Data was collected to answer the statistical question, “Is there an association between the weight of an animal’s body and the weight of the animal’s brain?” The table shows the body weight, in kilograms (kg), and brain weight, in grams (g), for 16 animals.
1. Use the data in the table to make a scatter plot. Are there any outliers?


2. Ignoring potential outliers, does there appear to be an association between body weight and brain weight? Describe the association in a sentence.
3. Using a piece of pasta and a straightedge, fit a line to your scatter plot, and estimate its slope. What does this slope mean in the context of brain and body weight?
ManuscriptCopy
Guided Activity: Approximating Lines of Fit Using Representative Points
1. For each scatter plot, use 2 representative points from the data to find an approximate line of fit. Then, complete the table by writing an approximate equation for the line of fit in slope-intercept form.


Two Representative Points
Slope between the Points
Equation of Line of Fit
Two Representative Points
Slope between the Points
Equation of Line of Fit
Scatter Plot A
Scatter Plot B
Scatter Plot C

Two Representative Points Slope between the Points
Equation of Line of Fit
While different lines of fit can be drawn, the goal is to determine the line of best fit that most closely models the relationship. Graphing technology or computer programs provide the most accurate line of best fit, which will be explored in future courses.
For now, the equations of the lines of best fit for each scatter plot are shown.
ManuscriptCopy
2. For each scatter plot, discuss with your partner how the equation of the line of fit you created compares to the line of best fit.
Lesson Summary
People often collect data to investigate possible associations between 2 numerical variables and use the connections that they find to predict more values of the variables. Data analysis usually follows these steps.
1. Collect data.
2. Organize and represent the data, and look for an association.
3. Identify any outliers, interpret their significance, and try to explain why these data points may be exceptions to the trend that describes the association.
4. Find a function that fits the data well.
There are many ways to find and write an equation of a line of fit. Some equations are an approximate line of fit, and others are considered the line of best fit. Graphing technologies such as graphing calculators and computer programs can be used to calculate the line of best fit from given data. This will be explored in future courses.
This lesson focused on finding an approximate line of fit by writing an equation in slope-intercept form using 2 representative points from the data.
• When writing the equation of the line of fit, sketch a line that best fits the data given.
• From that line, identify 2 points, and determine the slope between the 2 points.
• Then, substitute the slope, ��, and the coordinates of 1 of the points (��, ��) into slope-intercept form, �� = ���� + ��, to find the ��-intercept, ��.
• Use the slope and the ��-intercept to write an equation in slope-intercept form.
For example, an approximate line of fit for a set of data includes the points (2, 3) and (10, 5). The equation of the line can be found as shown.
Practice Problems
1. Different stores across the country sell a book for different prices. The table shows the price of the book in dollars and the number of books sold at that price.
a. Draw a scatter plot of this data. Label the axes.

b. Draw an approximate line of fit for the data.
ManuscriptCopy
c. If there is a relationship between the variables, explain what it is.
2. The scatter plot shows the number of pumpkins a farmer harvests during the fall based on the number of plants farmers planted.
Which equation could represent an approximate line of fit for the data shown?
A. �� = 9 5 + 4.4
B. �� = 3 4 �� + 4.2
C. �� = 3�� + 1.5
D. �� = �� + 5
3. A scatter plot with several data points is shown.
Write an equation for an approximate line of fit for the data using 2 representative points. Show your work.

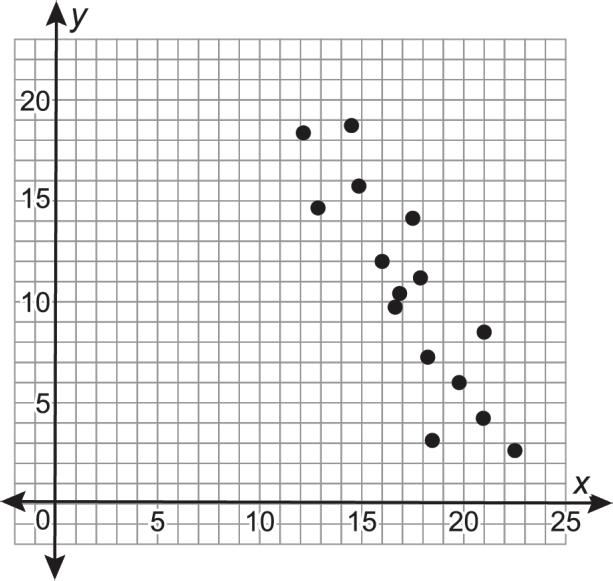
Review Problem
4. Line ���� is tangent to a circle with diameter ����. Explain why the measure of ∠������ must equal the measure of ∠������.

Unit 10, Lesson 6: Exploring Possible Reasons for Association
Warm-Up: Used Car Relationships
Describe the strength and sign of the relationship you expect for each pair of variables. Explain your reasoning.
1. Used car price and original sale price of the car
2. Used car price and number of cup holders in the car
3. Used car price and number of oil changes the car has had
4. Used car price and number of miles the car has been driven
ManuscriptCopy
Collaborative Activity: Cause or Effect?
Each of the scatter plots show a strong relationship. Write a sentence or two describing how you think the variables are related.
1. During the month of April, Elena keeps track of the number of inches of rain recorded for the day and the percentage of people who come to school with rain jackets.

2. A school book club has a list of 100 books for its members to read. They keep track of the number of pages in the books the members read from the list and the amount of time it took to read the book.

3. Number of tickets left for holiday parties at a venue and noise level at the party.

4. The height and score on a test of vocabulary for several children ages 6 to 13.

Guided Activity: Find Your Cause
Describe a pair of variables with each condition. Explain your reasoning.
1. Two variables with a causal relationship
2. The variables are strongly related, but a third factor might be the cause for the changes in the variables
3. The variables are only weakly related
ManuscriptCopy
Lesson Summary
Humans are wired to look for connections and then use those connections to learn about the world around them. One way to notice correlations is by looking for a pair of variables with a relationship. To learn about how the variables are related, 1 of the variables can be controlled to see if there are changes in the other variable.
One common mistake people tend to make using statistics is to think that all relationships between variables are causal. Scatter plots can only show there is a relationship between the 2 variables, but it cannot be assumed that it is a causal relationship.
A causal relationship is one in which a change in one of the variables causes a change in the other variable.
To determine if change in 1 of the variables causes a change in the other variable, the context must be better understood, and other possible reasons for the relationship must be ruled out.
For example, suppose there is a strong, positive relationship between hot chocolate sales and small marshmallow sales at a grocery store during the winter months. People buying hot chocolate may want to add small marshmallows to the drink. In such a case, an increase in the sales of hot chocolate is causing the marshmallow sales to increase. This is an example of the predictor causing the response.
However, there also might be a strong, positive relationship between the number of snowboard rentals and the sales of hot chocolate during the months of September through January. This does not mean that an increase in snowboard rentals causes people to purchase more hot chocolate. Nor does it mean that increased sales of hot chocolate cause people to rent snowboards more. More likely there is a third variable, such as colder weather, that might be causing both variables to increase at the same time. This is an example of a lurking variable.
Examples of some other possible reasons for an association between 2 variables are shown.
• A random occurrence: Over the years, the average yearly temperature in Florence, South Carolina, went up while VCR sales declined. The average yearly temperature in Florence is, therefore, negatively correlated to VCR sales. Yet, there is no cause and effect for this relationship; therefore, the association is likely due to random occurrence.
• Response causes predictor: Generally, people who get more exercise tend to sleep more at night. An analysis on a scatter plot might show that the number of hours of sleep a person gets per night correlates with higher amounts of exercise. However, the sleep is not causing the exercise. It is more likely that the increased exercise is causing the person to get more sleep, so the response is causing the predictor.
Practice Problems
1. Priya creates a scatter plot showing the relationship between the number of steps she takes and her heart rate. The data shows a strong positive association.
Explain whether there seems to be a causal relationship between the variables.
2. Kiran creates a scatter plot showing the relationship between the number of students attending drama club and the number of students attending poetry club each week. The data shows there is a weak negative association.
Explain whether there seems to be a causal relationship between the variables.
3. A news website shows a scatter plot with a negative relationship between the amount of sugar eaten and happiness levels. The headline reads, “Eating sugar causes happiness to decrease!”
a. What is wrong with this claim?
b. What is a better headline for this information?
4. Prove �������� is a parallelogram.
5. Which of the following are right triangles?
A. Triangle ������ with ���� = 6, ���� = 9, and ���� = 12
B. Triangle ������ with ���� = 8, ���� = 10, and ���� = 13
C. Triangle ������ with ���� = 9, ���� = 12, and ���� = 15
D. Triangle ������ with ���� = 10, ���� = 13, and ���� = 17

ManuscriptCopy
ManuscriptCopy
Unit 11, Lesson 1: Playing with Probability
Warm-Up: Taking Names
Your teacher will give your group a bag containing slips of paper with names on them. It is important not to open the bag to read the slips at any time. It is important to record your group’s data in writing.
Every time a student in the class is notably helpful, a teacher puts their name on a slip of paper and puts it into a bag. If the same student is helpful more than once, their name can be entered multiple times. At the end of the month, the teacher draws several names for prizes. Follow these steps to collect data about the names in the bag.
1. Shake the bag, and then draw out only 1 slip of paper.
2. Read the name you drew out loud so that everyone in the group can record the name.
3. Return the slip of paper to the bag and pass the bag to the next person in the group.
4. Repeat these steps until each person in the group has had a chance to draw at least 3 names.
ManuscriptCopy
Exploration Activity: Who Was Helpful?
Use the data your group collected in the Warm-Up to answer the questions.
1. Based on the data you collected, estimate the probability of drawing each of these names from your bag. Explain or show your reasoning.
ManuscriptCopy
a. Clare
b. Lin
c. Priya
d. Elena
e. Jada
f. Han
g. Andre
h. Diego
i. Noah
2. There are 15 slips of paper in the bag. What names do you think are written on the slips? Explain your reasoning.
3. If you were allowed to keep going around the group, drawing names and replacing them until you had 100 names drawn, how do you think that would affect your understanding of what is in the bag?
4. The next month, the bag contains 15 slips as well. Lin’s name is included 5 times, Clare’s name 4 times, Han’s name 3 times, Diego’s name 2 times, and Jada’s name 1 time. The teacher draws names one at a time, replacing them each time. What might the teacher’s list of names drawn look like if she draws 10 times? Is this the only list of names drawn that is possible? Explain your reasoning.
ManuscriptCopy
Collaborative Activity: Probability Words
Take turns with your partner coming up with words that have the probabilities given when selecting a letter at random from the word. Each person should try to come up with one word for each situation.
1. ��(vowel) = 1 3 . ��(consonant) = 2 3 .
��(vowel) = 2 3 . ��(consonant) = 1 3 .
��(vowel) = 0.5. ��(��) = 1 4 .
��(��) = 0.5. ��(vowel) = 0.25.
5. Think of a word and give your partner at least 2 clues about the word using probability of certain letters or types of letters.
2.
3.
4.
Guided Activity: Choosing Letters
Kiki randomly chooses a tile from a bag with 12 lettered tiles. The bag contains tiles that each have 1 letter of the alphabet from A through L on them.
1. Describe the sample space for the situation.
2. Determine each probability.
a. ��(vowel) =
b. ��(consonant) =
c. ��(C or D) =
A second bag contains lettered tiles with 1 of each letter of the alphabet from M through X on them. Kiki randomly chooses a tile from the second bag.
3. Determine each probability for the second bag.
a. ��(vowel) =
b. ��(a letter in the word ������) =
c. ��(X) =
4. Jeremiah is randomly choosing a tile from the first bag and then a tile from the second bag. Determine the probability he chooses a vowel from both bags.
Lesson Summary
Probabilities can be estimated by performing or simulating an experiment many times and collecting data about the number of times an outcome appears. This is known as an experimental probability.
An experimental probability is the ratio of the number of times an event occurs to the total number of trials or times the activity is performed.
For example, a radio show holds a contest in which callers are entered for a chance to win a ticket to a concert in town. The probability of each caller winning is estimated by considering previous similar contests and comparing the number of callers to the number of ticket winners. If a previous contest had 327 callers and 5 ticket winners, then the experimental probability of winning a ticket can be written as shown.
��(winning a ticket) = 5 327 or ��(winning a ticket) ≈ 0.015
This means that each caller has about a 1.5% chance of winning a ticket to the concert.
Probabilities can also be calculated by determining the number of outcomes in an event compared to all possible outcomes. This is known as a theoretical probability.
A theoretical probability is a number between 0 and 1 representing the likelihood of an event in a theoretical model based on a sample space. If all outcomes in the sample space are equally likely, the theoretical probability of an event is the ratio of the number of outcomes in the event to the number of outcomes in the sample space.
For example, the theoretical probability of rolling a 2 on a standard number cube is 1 6 because there are 6 equally likely outcomes in the sample space for each roll and the event “rolling a 2” is 1 of those outcomes. This can be written as shown.
��(rolling a 2) = 1 6
Practice Problems
1. Six papers are placed in a bag with names written on them. The names are: Lin, Mai, Mai, Noah, Priya, and Priya. If one name is chosen at random, what is the probability that it is Priya?
1 4
1 6
2 4
2 6
2. Select all of the words where the probability of selecting the letter E at random is 1 3 .
THE
BEST
SNEEZE
FREES
SPEECH
3. Design a situation where the probability of one event is 1 5 and another event is 1 10 . Explain your reasoning.
4. What is the probability of the spinner landing on the section labeled ��?

ManuscriptCopy
5. This spinner is spun 300 times. Estimate the number of times it would be expected to land on the section labeled ��.

Unit 11, Lesson 2: Exploring Geometric Probability
Warm-Up: Areas of Circles
The diagram shows 2 circles, each with center ��, where ���� = 2 and ���� = 2.

1. Determine the area of the inner circle with radius ����. Write the answer in terms of ��.
2. Determine the area of the outer circle with radius ����. Write the answer in terms of ��.
ManuscriptCopy
Exploration Activity: Dart Game
Sierra and Brian are playing darts using the figure shown from the Warm-Up.
Before Sierra throws the dart, Brian tells her to choose either the shaded region or the inner circle, and he will give her $2 if her dart lands in her chosen area. Before choosing, Sierra wants to determine the probability that the dart will land in each area of the figure.
1. Assuming the dart will land somewhere inside the figure, describe the sample space.
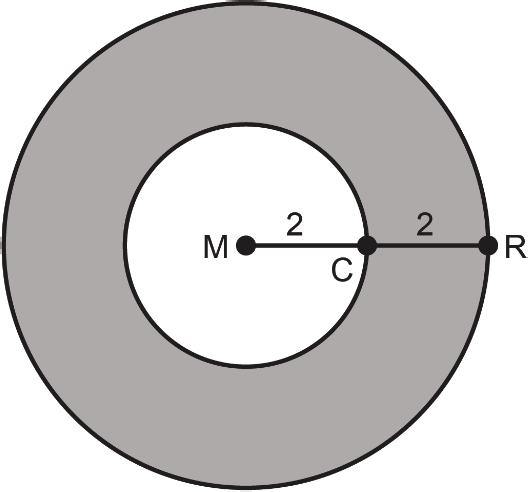
2. Determine the area for the shaded region. Show your work.
3. Discuss with your partner a method to determine the probability that Sierra’s dart will land in the shaded region. Summarize the discussion.
4. Complete the statement.
5. Explain which part of the figure Sierra should choose to increase her chances of winning $2.
Collaborative Activity: Geometric Probability with Quadrilaterals
Rectangle �������� is shown on the coordinate plane with quadrilaterals ��������, ��������, and �������� inside the rectangle.

1. Work with your partner to complete the table and classify each quadrilateral.
Figure Type of Quadrilateral
Square
Rectangle
Parallelogram
Square
Rectangle
Parallelogram
ManuscriptCopy
Square
Rectangle
Parallelogram
2. Determine the area of each figure.
a. �������� b. ��������
c. ��������
d. ��������
Pablo and Taylor are playing a game in which they wear a blindfold and then roll a marble inside rectangle ��������.
3. Determine the probability that the marble will stop in each location described. Write each answer as a percentage.
a. Inside ��������
b. Inside ��������
c. Inside ��������
ManuscriptCopy
d. Inside the rectangle �������� but outside quadrilaterals ��������, ��������, and ��������
Guided Activity: Geometric Probability with Surface Area
A cube with edges measuring 5 centimeters (cm) is shown. Triangle ������ and rectangle �������� are drawn on 1 face of the cube, where ���� is perpendicular to ����, ���� = 2 cm, ���� = 1 cm, and ���� = 3 cm.
As part of an experiment, the cube is rolled, and then a pencil is dropped, tip down, on the top face of the cube.
1. Determine the surface area of the cube.

2. Determine the probability that the pencil tip will land inside ����������.
3. Determine the probability that the pencil tip will land inside ∆������.
4. If the experiment were performed 50 times, how many times could the pencil tip be expected to land inside rectangle ��������?
Lesson Summary
Probability is used to determine the likelihood of an event occurring. Geometric probability is the probability of an event related to a geometric figure. For example, the figure shows rectangle �������� inside rectangle ��������, where ���� = 6, ���� = 3, ���� = 4, and ���� = 1.

A dart is thrown at the figure and will land somewhere inside rectangle ��������. To win the game, the dart must land inside ��������. Because the dart will land inside ��������, the sample space must include all the space inside the rectangle. The sample space of this event includes 2 possible outcomes: the dart landing inside �������� or the dart landing outside �������� but inside ��������.
To determine the probability of an event occurring, use ��(event) = number of outcomes in the event total possible outcomes .
• In this context, the area of �������� is used as the “number of outcomes in the event” because the event is defined as any point inside ��������.
• In this context, the total area of �������� is used as the “total possible outcomes” because the experiment dictates that the dart will land somewhere inside ��������.
Recall that probability can be expressed as a fraction, decimal, or percentage. The probability of the dart landing in �������� is shown in all these forms.
��(dart landing inside ��������) = 4 18 = 2 9 = 0. 2 ≈ 22.2%
ManuscriptCopy
Practice Problems
1. Iris is playing a game in which she wears a blindfold and uses a pen to mark a point inside a rectangular board as shown, where ���� = 8 inches (in.) and ���� = 12 in. A circle with center �� is drawn in the middle of the rectangle, where ���� = 3 in.
Iris wins the game if the point she draws is inside circle ��. Determine the probability that Iris’s point will be inside circle ��. Round the answer to the nearest tenth of a percent.

2. Bruce is playing a game in which he wears a blindfold and uses a pen to mark a point inside a rectangular board, as shown, where ���� = 8 in. and ���� = 12 in. A circle with center �� is drawn in the middle of the rectangle, where ���� = 3 in.
Bruce wins the game if the point he draws is outside of circle �� but still inside rectangle ��������. Determine the probability that Bruce’s point will be outside of circle �� but still inside rectangle ��������. Round the answer to the nearest tenth of a percent.
ManuscriptCopy

Review Problems
3. Mrs. Giunta gave her students a bag with red, blue, yellow, and green marbles. Each student chose a marble from the bag, recorded the color, placed it back into the bag, and then passed the bag to the next student. The data after the bag went around the classroom twice is shown in the table.
Use the data to find each experimental probability.
a. ��(red) =
b. ��(blue) =
c. ��(yellow) =
d. ��(green) = 4. Lettered tiles spelling the word GEOMETRY are placed in a box.
a. If 1 tile is randomly chosen from the box, determine the probability that an “E” will be selected.
b. If 1 tile is randomly chosen from the box, replaced, and then a tile is randomly chosen again, determine the probability that an “E” will be selected twice.
Unit 11, Lesson 3: Venn Diagrams
Warm-Up: Sample Space
For the sample space �� = integers from 1 to 20, inclusive, the events �� and �� are defined as shown.
�� = multiples of 3
�� = odd numbers
1. Determine the number of outcomes for each description.
a. The sample space, ��
b. Event ��
c. Event ��
ManuscriptCopy
Exploration Activity: Using Venn Diagrams to Represent Sample Spaces
The sample space from the Warm-Up, ��, includes all integers from 1 to 20, inclusive.
• Event ��: multiples of 3
• Event ��: odd integers
Use events �� and �� to identify the outcomes for each description.
1. In �� but not in ��
2. In �� but not in ��
3. In both �� and ��
4. In neither �� nor ��
A Venn diagram can be used to represent events as subsets of a sample space. The rectangle represents the entire sample space, and the circles represent events. A blank Venn diagram representing the sample space, ��, including the events �� and ��, is shown.

5. Describe the outcomes located in the overlapping section of the circles.
6. Describe the outcomes inside the rectangle but outside of the circles.
7. Complete the Venn diagram for all the outcomes in sample space ��.
ManuscriptCopy
Collaborative Activity: Using Venn Diagrams to Understand Sample Spaces
Mr. Finch surveyed his homeroom class about whether they are taking art or music as an elective. The Venn diagram shows the results of his survey.


1. Describe the sample space for this situation.
2. Determine the number of outcomes in the sample space.
3. Use the Venn diagram to determine the number of students in Mr. Finch’s class who are taking music.
4. Use the Venn diagram to determine which students are taking music but not art.
5. What do Noah, Liam, Olivia, and Isabella have in common?
6. Select all the students who are not taking art or music.
□ Fabian
□ Roman
□ Tessa
□ Xavier
□ Penelope
□ Elijah
ManuscriptCopy
Guided Activity: Interpreting Data Represented in Venn Diagrams
The owner of a concession stand recorded the number of items that were purchased from the stand at the last baseball game. His data is shown in the Venn diagram.

1. Describe the sample space.
2. Use the Venn diagram to determine the number of items purchased from the concession stand at the last baseball game. Explain your reasoning.
3. Use the Venn diagram to determine the number of hamburgers that were purchased at the concession stand at the last baseball game.
4. Using the Venn diagram, Zach incorrectly determined that 125 hot dogs were purchased at the concession stand at the last baseball game.
a. Explain why Zach is incorrect.
b. Determine the correct number of hot dogs purchased at the concession stand.
5. Explain the meaning of the number 45 in the Venn diagram.
ManuscriptCopy
Lesson Summary
The sample space for a random process is the list of all possible outcomes being considered, whereas an event is a subset of that sample space.
In a probability model for a random process, the sample space is a list of the individual outcomes that are to be considered.
A sample space and events can be represented in a Venn diagram, where the sample space is represented by a rectangle and the events are represented by circles.
For example, a Venn diagram is shown with events �� and ��. The sample space and events are defined as described.
• The sample space, ��, is integers from 5 to 20, inclusive.
• �� = numbers less than 11
• �� = multiples of 5
The sample space can also be described as the set shown.
�� = {5, 6, 7, 8, 9, 10, 11, 12, 13, 14, 15, 16, 17, 18, 19, 20}
The area where the circles overlap are the outcomes included in both events. In this example, these are the multiples of 5 that are less than 11.
ManuscriptCopy

The outcomes that are in neither event are placed inside the rectangle but outside of the circles. In this example, these are the numbers that are greater than or equal to 11 and are not multiples of 5.
This Venn diagram also shows there are 4 outcomes that are in �� but not �� and 2 outcomes that are in �� but not ��.
Practice Problems
1. Events �� and �� are defined from the sample space �� = integers between 1 and 25, inclusive.
�� = integers greater than or equal to 15
�� = multiples of 6
a. Determine the number of outcomes in the sample space.
b. Use the sample space �� and events �� and �� to complete the Venn diagram shown.
2. A bag of 265 beads is purchased at a craft store. The Venn diagram shows the color distribution of the beads.
Select all the statements that are true.
□ 134 beads are green.
□ 25 beads are blue and green.
□ 22 beads are blue and green.
□ 128 beads are blue but not green.
ManuscriptCopy

□ 106 beads are blue but not green.
□ 240 beads are either blue or green.
□ 22 beads are either blue or green.
3. Triangle ������ is the image of ∆������ after ∆������ is reflected across ����, as shown.
Select all the statements that must be true.

4. Two circles are shown, each with center ��, where ���� = 4 and ���� = 1.

Frankie is throwing darts at the circle. Determine the probability that a dart will land in the inner circle. Write your answer as a percentage.
ManuscriptCopy
Unit 11, Lesson 4: Unions, Intersections, and Complements
Warm-Up: Household Pets
The president of a homeowners’ association wanted to know how many households have pets. Each household with at least 1 pet responded to the survey identifying which type(s) of pet(s) they had with one of the responses shown.
• Dog(s) only
• Cat(s) only
• Dog(s) and cat(s)
• Other
The data is summarized in the Venn diagram.

1. Determine the number of households in the neighborhood that own pets.
2. Which category is represented by the number 13?
A. Number of households with dog(s) but not cat(s)
B. Number of households with cat(s) but not dog(s)
C. Number of households with cat(s) and dog(s)
D. Number of households with cat(s)
Exploration Activity: Unions, Intersections, and Complements
A survey asked 50 students about their vacation preferences. The results of the survey are summarized in the Venn diagram shown.
For 2 events �� and ��, outcomes that are in both events �� and �� are known as the intersection of �� and ��. In probability, this is written �� ∩ ��.
1. Determine the number of outcomes in amusement park ∩ camping, and interpret the meaning in the context.

Outcomes that are in events �� or �� or both are known as the union of �� and ��. In probability, this is written �� ∪ ��. These outcomes include all outcomes in ��, ��, and their intersection.
2. Determine the number of outcomes in amusement park ∪ camping, and interpret the meaning in the context.
Outcomes that are not in event �� are known as the complement of ��, which is written ~��.
3. Determine the number of outcomes in ~camping, and interpret the meaning in the context.
4. Let �� represent a randomly selected student that prefers to go to an amusement park. Let �� represent a randomly selected student that prefers to go camping.
Three Venn diagrams are shown. Complete the table by interpreting which outcomes the shaded part of each diagram represents in this context.
Diagram


Interpretation
ManuscriptCopy

Collaborative Activity: Applying Understanding of Unions, Intersections, and Complements
Mr. Marciano recorded the eye colors of the students in his biology class during a lesson on Punnett squares and found that 20 students had brown eyes, 5 students had blue eyes, and 3 students had eyes that were a color other than brown or blue.
1. How many students were in Mr. Marciano’s biology class?
2. Interpret the outcomes in the event brown ∩ blue in this situation.
Two events, �� and ��, are called disjoint, or mutually exclusive, if the events cannot occur at the same time.
3. Identify the mutually exclusive events in this situation.
4. Determine the number of outcomes in brown ∪ blue.
5. Determine the number of outcomes in ~(brown ∪ blue).
ManuscriptCopy
Guided Activity: Subsets of a Sample Space
For the sample space �� = {4, 5, 6, 7, 8, 9, 10, 11, 12, 13, 14, 15, 16, 17, 18, 19, 20}, events �� and �� are defined as described.
• �� = numbers between 8 and 12, inclusive
• �� = multiples of 4
A Venn diagram is shown to represent the outcomes.

1. Use the Venn diagram to complete the table by listing the outcomes for each subset of the sample space.
Subset
Outcomes
2. Explain whether events �� and �� are mutually exclusive.
Lesson Summary
Subsets of a sample space can be defined using 2 or more events.
• For 2 events, �� and ��, outcomes that are in both �� and �� are known as the intersection of �� and ��, which is written �� ∩ ��. In a Venn diagram, the intersection is the region where the circles representing �� and �� overlap, as shown in the shaded area.

For example, for the sample space �� = the numbers between 1 and 20, inclusive, events �� and �� are defined as shown.
�� = multiples of 2
�� = multiples of 3
The outcomes in �� ∩ �� are the numbers between 1 and 20 that are multiples of both 2 and 3, so the intersection includes 6, 12, and 18.
• Outcomes that are in �� or �� or both are called the union of �� and ��, which is written �� ∪ ��. In the example, �� ∪ �� represents the numbers that are multiples of 2 or 3 or both, so the union includes 2, 3, 4, 6, 8, 9, 10, 12, 14, 15, 16, 18, and 20.
• Outcomes that are not in �� are called the complement of ��, which is written ~��. In the example, ~�� represents the numbers that are not multiples of 2, and it includes 1, 3, 5, 7, 9, 11, 13, 15, 17, and 19.
ManuscriptCopy
Mutually exclusive events, also known as disjoint, are events that cannot happen simultaneously. If 2 events are mutually exclusive, then �� ∩ �� contain no outcomes. For example, for the sample space of all students at a high school, the events of randomly selecting a student who is a freshman and a sophomore are mutually exclusive because a student cannot be both a freshman and a sophomore at the same time. Conversely, the events “freshman” and “14-year-old” are not mutually exclusive because a student can be both a freshman and 14 years old. Mutually exclusive events can be represented in a Venn diagram using nonoverlapping circles, as shown.

Practice Problems
1. Complete the table by identifying the subset of the sample space represented by the shaded area in each Venn diagram.


Venn Diagram
2. The math classes for which incoming freshmen are registered at a local high school are shown in the Venn diagram.
a. How many students are included in Algebra 1 ∪ Geometry?
b. Explain what the number 80 in the Venn diagram represents in context.

c. Use the Venn diagram to explain whether the events of freshmen registered for Algebra 1 and Geometry are mutually exclusive.
Review Problems
3. An owner of a food truck is examining the popularity of some of his menu items. One day, he found that of the 230 customers who visited his truck, 120 ordered tacos, 95 ordered burritos, and 30 ordered both tacos and burritos. Complete the Venn diagram for the situation.

4. Determine if each set of side lengths are the lengths of a right triangle. Explain your reasoning.
a. 12, 14, and 18
ManuscriptCopy
b. 10, 24, and 26
Unit 11, Lesson 5: The Addition Rule
Warm-Up: Notice and Wonder

What do you notice? What do you wonder?

ManuscriptCopy

Collaborative Activity: Using Venn Diagrams to Determine Probability
The Venn diagram shown displays the data for the animals at a shelter.

A customer is planning to choose 1 animal to adopt from the shelter.
1. Complete the statement. The events of choosing a dog or choosing a cat are are not mutually exclusive because . . .
2. Describe the sample space, and determine the total number of outcomes.
3. Complete the table.
4. Determine the probability for each event.
a. ��(choosing dog)
b. ��(choosing cat)
ManuscriptCopy
5. Discuss with your partner how ��(choosing dog) and ��(choosing cat) can be used to find ��(dog ∪ cat ). Summarize your discussion.
Exploration Activity: Digging Deeper into Probabilities with Venn Diagrams
Riley has a bag with 25 tiles numbered 1 to 25. Ezra will randomly choose a tile from the bag. Events �� and �� are defined as shown.
• �� = numbers less than or equal to 12
• �� = multiples of 4
1. Complete the Venn diagram for the sample space.

2. Complete the statement.
Events A and B are are not mutually exclusive because . . .
ManuscriptCopy
3. Complete the table.
4. Riley and Ezra found ��(�� ∪ ��), but they got different answers. Their work is shown.
Riley’s Work
a. Whose answer do you agree with?
Ezra’s Work
c. Discuss with your partner why the other student’s method did not work. ManuscriptCopy
b. Consider each student’s work. Explain in your own words what the student whose answer you agree with did to determine ��(�� ∪ ��).
Guided Activity: Determining Probabilities of Events
Two of the most popular sessions at a history conference were on the history of aviation and the Industrial Revolution. Of the 500 people who attended the conference, 250 participants attended the history of aviation session, 200 participants attended the Industrial Revolution session, and 100 participants attended both sessions.
1. Use the information to complete the Venn diagram.

2. Complete the table with each of the probabilities of a randomly selected participant having attended the specified session(s).
3. Explain what the probability 450 500 represents in the context of this situation. Event
Probability
Revolution
∩ Industrial Revolution ~(aviation ∪ Industrial Revolution)
Lesson Summary
Venn diagrams can be used to determine the probabilities of events occurring.
The sample space of colored marbles in a box is shown using a Venn diagram.
The number of outcomes in the sample space is the total number of marbles in the box, found by adding the outcomes in the Venn diagram, 12 + 6 + 2 = 20. Because there are no marbles that are both blue and green, the events are mutually exclusive.

Suppose a marble is drawn from the box. The probability that the marble is either blue or green can be found by ��(blue ∪ green) = number outcomes in blue or green total outcomes in sample space .
��(blue ∪ green) = 18 20 = 90%
The addition rule can be used to find the probability of either �� or �� occurring.
The addition rule states that given events A and B, the probability of either A or B is given by ��(�� or ��) = ��(��) + ��(��) − ��(�� and ��).
For example, a local high school analyzed the electives of 400 freshmen.
• 176 freshmen are enrolled in physical education (PE).
• 238 freshmen are enrolled in chorus.
• 56 students are enrolled in both electives.
To determine the probability that a randomly selected freshmen will be enrolled in PE or chorus, the addition rule can be used.
��(PE ∪ chorus) = ��(PE) + ��(chorus) − ��(PE and chorus) = 176 400 +
ManuscriptCopy
The probability of randomly selecting a freshman that is in PE or chorus is 89.5%.
Notice when events of �� and �� are mutually exclusive, as in the first example, ��(�� and ��) = 0. Therefore, the addition rule for mutually exclusive events can be written as shown.
��(�� or ��) = ��(��) + ��(��) − 0 = ��(��) + ��(��)
Practice Problems
1. The number of customers who visited a sandwich shop and ordered the 2 most popular sandwiches is shown in the Venn diagram.

a. Find ��(veggie ∪ turkey).
b. Explain what the probability 15 150 represents in this context.
ManuscriptCopy
2. A survey sent to all the households in a neighborhood asks whether there are kids or pets in the household. The results of the survey are summarized in the Venn diagram shown.

a. Complete the table. Event
Probability
b. Explain what the probability 20 50 represents in this context.
ManuscriptCopy
Review Problems
3. Rectangle �������� is a scaled copy of rectangle ��������, where ���� = 25, ���� = 5, and ���� = 4, as shown.
a. Determine the scale factor of the dilation.
b. Find the length of ����.

4. Parallel lines ���� and ���� are intersected by transversal ���� as shown, where ��∠������ = 40°.
Find the measures of each angle.
ManuscriptCopy

Unit 11, Lesson 6: Independent and Dependent Events
Warm-Up: Marbles in a Bag
Asher is randomly selecting a marble from a bag containing 4 blue marbles, 7 green marbles, and 2 red marbles.
Find each probability.
ManuscriptCopy
1. ��(blue)
2. ��(green)
3. ��(red)
Exploration Activity: Drawing Marbles
Suppose Asher is drawing marbles from the same bag containing 4 blue marbles, 7 green marbles, and 2 red marbles from the Warm-Up, but this time, he draws 2 marbles. After drawing the first marble, Asher returns it to the bag before drawing the second marble. This is known as repeating an event with replacement.
Asher draws a red marble on his first draw and then returns it to the bag.
1. Complete the statements.
Before Asher makes his second draw, there are 12 13 14 marbles in the bag. There are 0 is 1 are 2 red marble(s) left in the bag, so the probability of drawing a red marble on the second draw is
Independent events are events for which the probability of one event is not affected by the occurrence of the other event. Dependent events are events for which the probability of one event affects the occurrence of the other event.
2. Explain whether drawing 2 red marbles with replacement are independent or dependent events.
Suppose that instead, Asher draws a red marble on the first draw and sets it aside before drawing the second marble.
3. Discuss with your partner how this will affect the total number of marbles in the bag and the total number of red marbles in the bag.
4. Determine the probability of drawing a red marble on the second draw in this scenario.
This is known as repeating an event without replacement. This means that after a marble is drawn, it is not placed back into the bag. The sample space of the second event will be different following an event without replacement.
5. Complete the statement.
When drawing 2 red marbles from the bag without replacement, the events are considered dependent independent events because the outcome of the first drawing
affects does not affect the probability of the outcome of the second drawing.
Collaborative Activity: Independent and Dependent Events
1. With your partner, complete the table by determining whether each pair of events are independent or dependent.
Events
ManuscriptCopy
Type of Events
Rolling 2 six-sided number cubes Dependent Independent
Parking a car illegally and getting a parking ticket Dependent Independent
Randomly choosing 2 cards from a standard deck of playing cards with replacement Dependent Independent
Winning money on 2 different lottery tickets Dependent Independent
Randomly choosing 2 marbles from a bag of marbles without replacement Dependent Independent
Guided Activity: Relating Probability to the Types of Events
Mrs. Morrison surveyed students in her English classes about the genres of books they recently read. The results of the survey are summarized in the Venn diagram.

1. Find the probability that a randomly selected student recently read a thriller. Round the answer to the nearest tenth of a percent.
2. Consider only the students in this survey who read science fiction. Find the probability that a randomly selected student who recently read science fiction also recently read a thriller. Round the answer to the nearest tenth of a percent.
3. Complete the statements.
The probability that a randomly selected student recently read a thriller is . The probability that a randomly selected student who has recently read science fiction has also recently read a thriller is . Because the 2 probabilities are are not equal, the events are dependent.
Lesson Summary
This lesson explored how to determine if events are independent or dependent.
Independent events are two events from the same experiment for which the probability of one event is not affected by whether the other event occurs or not.
Dependent events are two events from the same experiment for which the probability of one event depends on whether the other event happens.
Some events can be determined to be independent or dependent based on the context.
For example, suppose a teacher randomly selects craft sticks with students’ names on them from a cup to pick which students to call on in class. After the teacher draws a stick at random and calls on a student, the teacher can either place the stick back into the cup or leave out the sticks with the names that were called.
If the teacher places the selected stick back into the cup, then the events of selecting students’ names from the cup are independent because the probability of each stick being selected does not change. In probability, this is generally described as an experiment with replacement because the sticks are placed back into the sample space after the names are called.
If the teacher sets the stick aside after calling a student’s name, then the events of selecting students’ names from the cup are dependent because the probability of each subsequent stick being selected changes from the original probability. In probability, this is generally described as an experiment without replacement because the sticks that were called are removed, which means the sample space changes after each draw.
ManuscriptCopy
Practice Problems
1. For each pair of events, explain whether they are independent or dependent.
a. Randomly drawing a red marble from a box, putting it back in the box, and then randomly selecting another red marble
b. Practicing a song and remembering all the words to the song
c. Rolling a 10 twice on a fair 12-sided number cube
2. Keana is spinning the spinner shown.
a. Determine the number of outcomes in the sample space.
b. Find the probability that the spinner will land on green after 1 spin.

c. If Keana spins the spinner a second time, find the probability that the spinner will land on green the second time.
d. Explain whether the spinner landing on green twice are independent or dependent events.
3. A bag contains letter tiles with 1 tile for each letter in the alphabet from A to J. Samuel is randomly drawing 2 letters from the bag.
a. If Samuel draws a vowel, returns it to the bag, and then draws another vowel, explain whether drawing 2 vowels are independent or dependent events.
b. If Samuel draws a vowel, sets it aside, and then draws another vowel, explain whether drawing 2 vowels are independent or dependent events.
Review Problems
4. The radius of a circle is 6 centimeters (cm).
a. Determine the circumference of the circle. Leave the answer in terms of ��.
b. Determine the area of the circle. Leave the answer in terms of ��.
ManuscriptCopy
5. A quadrilateral has vertices �� = (0, 0), �� = (2, 4), �� = (0, 5), and �� = (−2, 1). Prove that �������� is a rectangle.
ManuscriptCopy
Unit 11, Lesson 7: The Multiplication Rule
Warm-Up: Spinning a Spinner
Julian is spinning the spinner shown.

1. If Julian spins the spinner twice, determine the number of possible outcomes.
2. Determine the probability that Julian will spin blue both times.
ManuscriptCopy
Exploration Activity: Probabilities of 2 Events
Tiana surveyed 100 students about the elective classes in which they enrolled this school year. The data for the survey is shown in the Venn diagram.

1. What is the probability that a randomly selected student from the study is enrolled in culinary class? Write the answer as a fraction in simplest form.
2. Consider a student who is enrolled in the theater elective.
a. Highlight the space that represents students who are enrolled in theater in the Venn diagram.
b. What is the probability that out of all the students enrolled in theater, a student is randomly selected who is also enrolled in the culinary class? Write the answer as a fraction in simplest form.
3. Based on your answers to problems 1 and 2, discuss with your partner whether you think a student being enrolled in theater and in culinary elective classes are independent events. Summarize your discussion.
ManuscriptCopy
4. Determine the probability of a student from the survey being chosen at random for each of the following events. Write each answer as a fraction in simplest form.
a. ��(theater)
b. ��(theater ∩ culinary)
c. ��(theater) ∙ ��(culinary)
5. Write a conjecture about ��(��
ManuscriptCopy
using your answers from problem 4.
6. Ask 2 classmates for their conjecture. Record their answers, and write your summary of each conjecture. You are the only person who should write in the first 2 columns of the table. Have each classmate initial next to your summary, stating that your summary is correct.
Collaborative Activity: Probabilities of Independent and Dependent Events
A bag contains 10 lettered tiles, each labeled with a letter of the alphabet from A to J. Valentina randomly selects a tile from the bag.
Valentina chooses a tile, records the letter, replaces the tile in the bag, and then chooses a second tile.
1. Explain whether Valentina randomly selecting the A tile and then selecting a B tile are independent events.
2. Complete the table by determining the probability of each event.
Event
Valentina chooses an A tile on her first draw.
Probability
Valentina chooses a B tile on her second draw.
Valentina chooses an A tile on her first draw and a B tile on her second draw.
Valentina is trying to spell the word BAG by randomly drawing 3 tiles with replacement.
3. Write an expression that can be used to find the probability that the first tile she draws will be a B tile, followed by an A tile, and finally a G tile.
4. Discuss with your partner how the probability of drawing a B, then an A, and finally a G would change if Valentina drew the tiles without replacement.
5. Determine the probability that Valentina will draw a B, then an A, and finally a G without replacement.
Guided Activity: Spinner and Coin
Brianna and Maria are playing a game in which Maria spins a spinner with 5 equal sections labeled 1 through 5 and flips a fair coin with 1 side colored purple and the other side colored orange.
1. Explain whether spinning the spinner and flipping the coin are independent events.
For Maria to win the game, the spinner must land on 1 and the coin must land on purple.
2. Complete the table by determining the probability of each event.
Event Probability
The spinner landing on 1
The coin landing on purple
The spinner landing on 1 and the coin landing on purple
After several attempts, Maria still has not won the game. Brianna decides to let Maria spin the spinner a second time if the first spin does not land on 1.
3. Write an expression that can be used to find the probability that Maria will not spin a 1 on the first spin, then spin a 1 on the second spine, and finally land the coin on purple.
4. Determine the probability that Maria will not spin a 1 on the first spine, then spin a 1 on the second spin, and finally land the coin on purple.
Maria and Brianna changed the game by requiring a player to flip 2 fair coins simultaneously with 1 side colored purple and the other side colored orange and then spin a spinner with 5 equal sections labeled 1 through 5.
5. Determine the probability that Maria will spin an even number and both coins will land on purple.
ManuscriptCopy
Lesson Summary
Compound events are 2 or more events occurring together, such as spinning a spinner twice or spinning a spinner and tossing a coin. When finding the probability of compound events composed of independent events, the multiplication rule of probability can be used.
The multiplication rule states that for independent events A and B, the probability of event A and event B occurring is ��(�� ∩ ��) = ��(��) ⋅ ��(��).
For example, suppose a bag contains 12 pieces of candy, with a variety of candy including at least 1 mini chocolate bar and 2 hard candies. Sasha reaches into the bag and randomly chooses a candy. She chooses the first piece of candy and finds that it is a mini chocolate bar. She returns it to the bag and chooses a second piece of candy, which is also a mini chocolate bar. At this point, it cannot be determined that the bag has more than 1 mini chocolate bar because Sasha returned her original selection back into the bag to choose again. When an experiment includes replacement, the probabilities from each event remain unchanged.
Because Sasha replaced the first candy, the events of randomly selecting 2 pieces of candy from her bag are independent, and there are 144 possible outcomes in the sample space. The probability of choosing the same mini chocolate bar twice is 1 144 . This probability could also be found by multiplying the probability of choosing the chocolate bar on the first draw by the probability of choosing the same chocolate bar on the second draw. Because the events are independent and the probability of each event is 1 12, the probability of getting the same chocolate bar twice is 1 12 ∙ 1 12 = 1 144 .
The probability of 2 dependent events occurring can also be found using multiplication. However, in such cases, the probability of the first event occurring is multiplied by the probability of the second event occurring, assuming the first event took place.
Consider a different version of the experiment, in which Sasha randomly drew the hard candy on the first draw, ate it, and then randomly drew a second piece of candy.
• The probability that she would get 2 hard candies would be the probability of hard candy on the first draw times the probability of hard candy on the second draw, assuming she ate the first one, or 2 12 ∙ 1 11 = 1 66 ∙
• In the same scenario, what would be the probability of Sasha drawing a mini chocolate bar, eating it, and then drawing another mini chocolate bar? The probability is 1 12 ∙ 0 11 = 0. Because the number of chocolate bars decreased from 1 to 0 in the bag and the number of total candies decreased from 12 to 11, the second fraction is 0 11 , which means that Sasha randomly drawing 2 mini chocolate bars is impossible. This makes sense in this situation because the bag of candies only included 1 mini chocolate bar.
Practice Problems
1. A cooler at a picnic contains 25 cans of soda. The table shows the type of soda and the quantity of the soda cans in the cooler.
The picnic guests reach into the cooler without looking and randomly choose their can of soda.
a. When Pierre sees the can he chose is orange soda, he puts it back in the cooler and randomly chooses another can. Determine the probability that Pierre randomly chose an orange soda and then chose a ginger ale.
b. The first time Olivia reaches into the cooler, she gets a grape soda. She keeps the soda and then randomly reaches into the cooler a second time. Determine the probability Olivia will select 2 grape sodas.
2. Alex is rolling a fair 12-sided number cube with faces labeled 1 through 12. He rolls the cube twice, hoping to roll a 12 both times.
a. Alex rolled a 12 on his first roll, and he believes his chances of rolling a 12 on the second roll have now increased. Explain whether Alex is correct in his thinking.
b. Determine the probability that Alex will roll a 12 on both rolls.
3. A quality control specialist at a toy company knows that the probability of a toy car coming off the assembly line defective is 2 100 and that the probability of a doll being defective is 1 20 . The defective status of each doll or toy car on the assembly line does not affect the defective status of the next doll or toy car.
What is the probability that the quality control specialist will randomly select a toy car that is defective and then select a doll that is defective?
Review Problem
4. Triangle ������ is shown, where point �� is the midpoint of ����, point �� is the midpoint of ����, ���� = 3�� + 7, and ���� = �� + 6.
a. Find the value of ��.

b. Find the length of ����.
c. Find the length of ����.