
Grade 8 SOUTH CAROLINA
ISBN: 979-8-893539-08-0
Math Nation 6-8 was originally developed by Illustrative Mathematics®, and is copyright 2019 by Illustrative Mathematics. It is licensed under Creative Commons Attribution 4.0 International License (CCBY 4.0).
The online curriculum resource platform offered at "mathnation.com", including the videos and practice questions are additions to the original Illustrative Mathematics content is copyright 2023 by Accelerate Learning, Inc.
The trademark "Math Nation" is owned by Accelerate Learning, Inc. All other trademarks and product names referred to in the Math Nation AGA curriculum are the property of their respective owners and used solely for educational purposes. Unless otherwise stated, Math Nation has no relationship with any of the companies or brands mentioned in the curriculum and does not endorse or have a preference for any of those companies or brands.
This curriculum includes public domain images or openly licensed images that are copyright by their respective owners. Openly licensed images remain under the terms of their respective licenses. See the image attribution section for more information.
00820231215
Unit 6, Lesson 1: Filling Containers
Warm-Up: Which One Doesn’t Belong: Solids
These are drawings of three-dimensional objects. Which one doesn’t belong? Explain your reasoning.

Exploration Activity: Height and Volume
Your teacher will give you a graduated cylinder, water, and some other supplies. Your group will use these supplies to investigate the height of water in the cylinder, in centimeters (cm), as a function of the water volume, in milliliters (mL).
1. Before you get started, make a prediction about the shape of the graph.
2. Fill the cylinder with different amounts of water and record the data in the table.
Volume (mL)
Height (cm)
3. Create a graph that shows the height of the water in the cylinder as a function of the water volume.

4. Choose a point on the graph and explain its meaning in the context of the situation.
Collaborative Activity: What Is the Shape?
1. The graph shows the height vs. volume function of an unknown container. What shape could this container have? Explain how you know and draw a possible container.

2. The graph shows the height vs. volume function of a different unknown container. What shape could this container have? Explain how you know and draw a possible container.

3. How are the two containers similar? How are they different?
Lesson Summary
When filling a shape like a cylinder with water, the dimensions of the cylinder can affect things like the changing height of the water. For example, consider cylinders D and E shown. The cylinders have the same height, but cylinder D has a radius of 3 cm, while cylinder E has a radius of 6 cm.

If water is poured into both cylinders at the same rate, the height of the water in cylinder D will increase faster than the height of the water in cylinder E due to cylinder D’s smaller radius. When comparing the graphs representing the height of the water in each cylinder as a function of the volume of the water, there would be 2 lines, and the slope of the line for cylinder D would be greater than the slope of the line for cylinder E.

Practice Problems
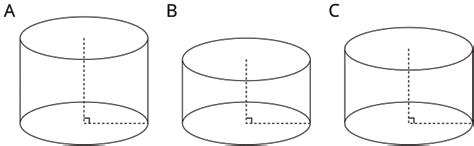
1. Cylinders A, B, and C have the same radius but different heights. Put the cylinders in order of their volume from least to greatest.
2. Two cylinders, �� and ��, each started with different amounts of water. The graph shows how the height of the water changed as the volume of water increased in each cylinder. Match the graphs of �� and �� to Cylinders P and Q. Explain your reasoning.


3. Which of the following graphs could represent the volume of water in a cylinder as a function of its height? Explain your reasoning.

4. Together, the areas of the rectangles sum to 30 square cm.

a. Write an equation showing the relationship between �� and ��.
b. Fill in the table with the missing values.
Unit 6, Lesson 2: How Much Will Fit?
Warm-Up: Two Containers
Your teacher will show you some containers. The small container holds 200 beans. Estimate how many beans the large jar holds.
Collaborative Activity: What’s Your Estimate?
Your teacher will show you some containers.
1. If the pasta box holds 8 cups (c.) of rice, how much rice would you need for the other rectangular prisms?
2. If the pumpkin can holds 15 fluid ounces (fl. oz.) of rice, how much do the other cylinders hold?
3. If the small cone holds 2 fl. oz. of rice, how much does the large cone hold?
4. If the golf ball were hollow, it would hold about 0.2 c. of water. If the baseball were hollow, how much would the sphere hold?
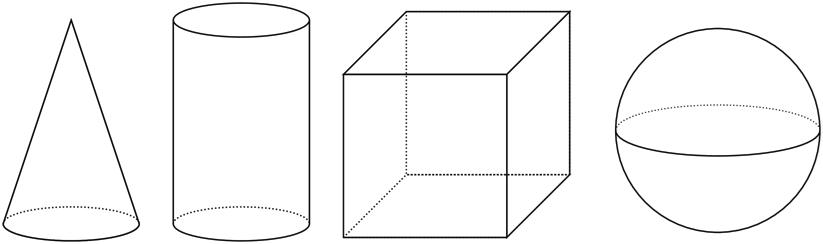
Exploration Activity: Do You Know These Figures?
1. What shapes are the faces of each type of object shown here? For example, all six faces of a cube are squares.

2. Which faces could be referred to as a “base” of the object?
3. Here is a method for quickly sketching a cylinder.
• Draw two ovals.
• Connect the edges.
• Which parts of your drawing would be hidden behind the cylinder? Make these parts dashed lines.

Practice sketching some cylinders. Sketch a few different sizes, including short, tall, narrow, wide, and sideways. Label the radius �� and height ℎ on each cylinder.
Lesson Summary
The volume of a three-dimensional figure, like a jar or a room, is the amount of space the shape encloses.
Volume is the number of cubic units that fill a three-dimensional region, without any gaps or overlaps.
For example, a room has a volume of 1,000 cubic feet (cu. ft.), or a pitcher can carry 5 gallons (gal.) of water. The volume of a jar could even be measured by the number of beans it holds, but a bean count is not really a measure of the volume in the same way that a cubic centimeter (cu. cm) is because there is space between the beans. The number of beans that fit in a jar does depend on the volume of the jar, though, so it could be used as an estimate when comparing the relative sizes of different containers.
A three-dimensional figure with flat faces is called a polyhedron.
A polyhedron is a closed, three-dimensional shape with flat sides. When we have more than one polyhedron, we call them polyhedra.
In earlier grades, you learned to determine the volumes of polyhedra such as rectangular and triangular prisms and pyramids. This lesson introduced three-dimensional figures with circular faces and curved surfaces: cones, cylinders, and spheres.
A cone is a three-dimensional figure with a circular base and an apex that is connected to the base by a collection of line segments that form a curved surface.
A cylinder is a figure containing two congruent, parallel, circular bases whose edges are connected by a curved surface.
A sphere is a three-dimensional figure with all points equidistant from a point called the center.
To help visualize three-dimensional shapes, dotted lines are used to represent parts of the figure that wouldn’t be visible if the object was solid.
Practice Problems
1.
a. Sketch a cube and label its side length 4 centimeters (cm). This will be Cube A.
b. Sketch a cube with sides that are twice as long as Cube A and label its side length. This will be Cube B.
c. Find the volumes of Cube A and Cube B.
2. Two paper drink cups are shaped like cones. The small cone can hold 6 ounces (oz.) of water. The large cone is 4 3 the height and 4 3 the diameter of the small cone. Which of these could be the amount of water the large cone holds?
A. 8 cm
B. 14 oz.
C. 4.5 oz.
D. 14 cm
3. The graph represents the volume of a cylinder with a height equal to its radius.
a. When the diameter is 2, what is the radius of the cylinder?
b. Express the volume of a cube of side length �� as an equation.
c. Make a table for volume of the cube at �� = 0 cm, �� = 1 cm, �� = 2 cm, and �� = 3 cm.

d. Which volume is greater: the volume of the cube when �� = 3 cm, or the volume of the cylinder when its diameter is 3 cm?
4. Select all the points that are on a line with slope 2 that also contains the point (2, −1).
□ (3, 1)
□ (1, 1)
□ (1, −3)
□ (4, 0)
□ (6, 7)
5. Several glass aquariums of various sizes are for sale at a pet shop. They are all shaped like rectangular prisms. A 15-gal. tank is 24 inches (in.) long, 12 in. wide, and 12 in. tall. Match the dimensions of the other tanks with the volume of water they can each hold.
A. Tank 1: 36 in. long, 18 in. wide, and 12 in. tall
B. Tank 2: 16 in. long, 8 in. wide, and 10 in. tall
C. Tank 3: 30 in. long, 12 in. wide, and 12 in. tall
D. Tank 4: 20 in. long, 10 in. wide, and 12 in. tall
1. 5 gal.
2. 10 gal.
3. 20 gal.
4. 30 gal.
Unit 6, Lesson 3: The Volume of a Cylinder
Warm-Up: A Circle’s Dimensions
A circle is shown. Points ��, ��, ��, and �� are drawn, as well as segments ���� and ����.
1. What is the area of the circle, in square units (sq. units)? Select all that apply. □ 4��
��8 □ 16��
��42
□ approximately 25
□ approximately 50

2. If the area of a circle is 49�� sq. units, what is its radius? Explain your reasoning.
Exploration Activity: Circular Volumes
What is the volume of each figure, in cubic units (cu. units)? Even if you aren’t sure, make a reasonable guess.

Figure A: A rectangular prism whose base has an area of 16 sq. units and whose height is 3 units.
2. Figure B: A cylinder whose base has an area of 16�� sq. units and whose height is 1 unit.
3. Figure C: A cylinder whose base has an area of 16�� sq. units and whose height is 3 units.
1.
Collaborative Activity: A Cylinder’s Dimensions
1. For cylinders A–D, sketch a radius and the height. Label the radius with an �� and the height with an ℎ.

2. Earlier you learned how to sketch a cylinder. Sketch cylinders for E and F and label each one’s radius and height.

Guided Activity: A Cylinder’s Volume
1. Here is a cylinder with height 4 units and diameter 10 units.
a. Shade the cylinder’s base.
b. What is the area of the cylinder’s base? Express your answer in terms of ��.

c. What is the volume of this cylinder? Express your answer in terms of ��.
2. A silo is a cylindrical container that is used on farms to hold large amounts of goods, such as grain. On a particular farm, a silo has a height of 18 feet (ft.) and diameter of 6 ft. Make a sketch of this silo and label its height and radius. How many cubic feet (cu. ft.) of grain can this silo hold? Use 3.14 as an approximation for ��.
Lesson Summary
The volume of a cylinder is determined similarily to the volume of a prism.
• The volume of a rectangular prism is the product of the area of its base and its height.
• The volume of a cylinder is the product of the area of its circular base and its height. The area of the base of any cylinder is ����2, where �� is the radius.
Recall that �� is the ratio between the circumference of any circle and its diameter. The value of �� is approximately 3.14. Any calculations involving �� can be approximated with a decimal rounded to a specific place value, or they can be expressed exactly, in terms of ��.
Just like a rectangular prism, the volume of a cylinder is the area of the base times the height. For example, consider the cylinder shown, whose radius is 2 centimeters (cm) and whose height is 5 cm.
The base of the cylinder has an area of 4�� square centimeters (sq. cm), since �� ⋅ 22 = 4��. Therefore, the volume is 20�� cubic centimeters (cu. cm), since 4�� ⋅ 5 = 20��. Using 3.14 as an approximation for ��, the volume of the cylinder is approximately 62.8 cu. cm.

In general, the base of a cylinder with radius �� units has area ����2 sq. units. If the height of a cylinder is ℎ units, then its volume, ��, in cu. units, is �� = ����2ℎ.
1.
Practice Problems
a. Sketch a cylinder.
b. Label its radius 3 and its height 10.
c. Shade in one of its bases.
2. At a farm, animals are fed bales of hay and buckets of grain. Each bale of hay is in the shape a rectangular prism. The base has side lengths 2 ft. and 3 ft., and the height is 5 ft. Each bucket of grain is a cylinder with a diameter of 3 ft. The height of the bucket is 5 ft., the same as the height of the bale.
a. Which is larger in area, the rectangular base of the bale or the circular base of the bucket? Explain how you know.
b. Which is larger in volume, the bale or the bucket? Explain how you know.
3. Three cylinders have a height of 8 cm. Cylinder 1 has a radius of 1 cm. Cylinder 2 has a radius of 2 cm. Cylinder 3 has a radius of 3 cm. Find the volume of each cylinder.
Review Problems
4. A one-quart (qt.) container of tomato soup is shaped like a rectangular prism. A soup bowl shaped like a hemisphere can hold 8 ounces (oz.) of liquid. How many bowls will the soup container fill? Recall that 1 qt. is equivalent to 32 fluid ounces (fl. oz).
5. Match each set of information about a circle with the area of that circle.
A. Circle A has a radius of 4 units.
B. Circle B has a radius of 10 units.
C. Circle C has a diameter of 16 units.
D. Circle D has a circumference of 4�� units.
1. 4�� sq.units
2. Approximately 314 sq. units
3. 64�� sq. units
4. 16�� sq. units
6. Two students join a puzzle solving club and get faster at finishing the puzzles as they get more practice. Student A improves their times faster than Student B.

a. Match the students to the Lines ℓ and ��.
b. Which student was faster at puzzle solving before practice?
Unit 6, Lesson 4: The Volume of a Cone
Warm-Up: Which Has a Larger Volume?
The cone and cylinder have the same height, and the radii of their bases are equal.
1. Which figure has a larger volume?
2. Do you think the volume of the smaller one is more or less than 1 2 the volume of the larger one? Explain your reasoning.

3. Sketch two different sized cones. The oval doesn’t have to be on the bottom. For each drawing, label the cone’s radius with �� and height with ℎ.
Here is a method for quickly sketching a cone:
• Draw an oval.
• Draw a point centered above the oval.
• Connect the edges of the oval to the point.
• Which parts of your drawing would be hidden behind the object? Make these parts dashed lines.

Guided Activity: From Cylinders to Cones
A cone and cylinder have the same height and their bases are congruent circles.
1. If the volume of the cylinder is 90 cubic centimeters (cu. cm), what is the volume of the cone?

2. If the volume of the cone is 120 cu. cm, what is the volume of the cylinder?
3. If the volume of the cylinder is �� = ����2ℎ, what is the volume of the cone? Either write an expression for the cone or explain the relationship in words.
Collaborative Activity: Calculate That Cone
1. Here is a cylinder and cone that have the same height and the same base area. What is the volume of each figure? Express your answers in terms of ��.
Cylinder:
Cone:

2. Here is a cone.
a. What is the area of the base? Express your answer in terms of ��.

b. What is the volume of the cone? Express your answer in terms of ��.
3. A cone-shaped popcorn cup has a radius of 5 centimeters (cm) and a height of 9 cm. How many cu. cm of popcorn can the cup hold? Use 3.14 as an approximation for ��, and give a numerical answer.
Lesson Summary
If a cone and a cylinder have the same base and the same height, then the volume of the cone is 1 3 of the volume of the cylinder. For example, the cylinder and cone shown here both have a base with radius 3 feet (ft.) and a height of 7 ft.
The cylinder has a volume of 63�� cubic feet (cu. ft.), since �� ⋅ 32 ⋅ 7 = 63��. The cone has a volume that is 1 3 of that, or 21�� cu. ft.

If the radius for both is �� and the height for both is ℎ, then the volume of the cylinder is ����2ℎ. That means that the volume, ��, of the cone is �� = 1 3 ����2ℎ.
Practice Problems
1. A cylinder and cone have the same height and radius. The height of each is 5 cm, and the radius is 2 cm. Calculate the volume of the cylinder and the cone.
Cylinder:
Cone:
2. The volume of this cone is 36�� cubic units.
What is the volume of a cylinder that has the same base area and the same height?

Review Problems
3. A cylinder has a diameter of 6 cm and a volume of 36�� cu. cm.
a. Sketch the cylinder.
b. Find its height and radius in cm.
c. Label your sketch with the cylinder’s height and radius.
4. Lin wants to get some custom T-shirts printed for her basketball team. Shirts cost $10 each if you order 10 or fewer shirts and $9 each if you order 11 or more shirts.
a. Make a graph that shows the total cost of buying shirts, for 0 through 15 shirts.
b. There are 10 people on the team. Do they save money if they buy an extra shirt? Explain your reasoning.
c. What is the slope of the graph between 0 and 10? What does it mean in the story?
d. What is the slope of the graph between 11 and 15? What does it mean in the story?
5. In the following graphs, the horizontal axis represents time and the vertical axis represents distance from school. Write a possible story for each graph.

Unit 6, Lesson 5: Estimating a Hemisphere
Warm-Up: Notice and Wonder: Two Shapes
Here are two shapes.

What do you notice? What do you wonder?
Exploration Activity: Hemispheres in Boxes
1. Mai has a dome paperweight that she can use as a magnifier. The paperweight is shaped like a hemisphere made of solid glass, so she wants to design a box to keep it in so it won’t get broken. Her paperweight has a radius of 3 centimeters (cm).
a. What should the dimensions of the inside of the box be so the box is as small as possible?

b. What is the volume of the box?
c. What is a reasonable estimate for the volume of the paperweight?
2. Tyler has a different box with side lengths that are twice as long as the sides of Mai’s box. Tyler’s box is just large enough to hold a different glass paperweight.
a. What is the volume of the new box?
b. What is a reasonable estimate for the volume of this glass paperweight?
c. How many times bigger do you think the volume of the paperweight in this box is than the volume of Mai’s paperweight? Explain your thinking.
Exploration Activity: Estimating Hemispheres
1. A hemisphere with radius 5 units fits snugly into a cylinder of the same radius and height.
a. Calculate the volume of the cylinder.
b. Estimate the volume of the hemisphere. Explain your reasoning.

2. A cone fits snugly inside a hemisphere, and they share a radius of 5.
a. What is the volume of the cone?
b. Estimate the volume of the hemisphere. Explain your reasoning.

3. Compare your estimate for the hemisphere with the cone inside to your estimate of the hemisphere inside the cylinder. How do they compare to the volumes of the cylinder and the cone?
Lesson Summary
The volume of a hemisphere can be estimated by comparing it to the volumes of other familiar shapes. For example, a hemisphere with a radius of 1 unit fits inside a cylinder with a radius of 1 unit and a height of 1 unit.
Since the hemisphere is inside the cylinder, it must have a smaller volume than the cylinder, which makes the cylinder’s volume a reasonable overestimate for the volume of the hemisphere.
The volume of this particular cylinder is about 3.14 cubic units (cu. units) since ��(1)2(1) = ��, so the volume of the hemisphere is less than 3.14 cu. units.
Using similar logic, a cone of radius 1 unit and height 1 unit fits inside of the hemisphere of radius 1 unit.
Since the cone is inside the hemisphere, the cone must have a smaller volume than the hemisphere, which makes the cone’s volume a reasonable underestimate for the volume of the hemisphere.
The volume of this particular cone is about 1.05 cu. units since 1 3 ��(1)2(1) = 1 3 �� ≈ 1.05, so the volume of the hemisphere is more than 1.05 cu. units.


Averaging the volumes of the cylinder and the cone, the volume of the hemisphere can be estimated to be about 2.10 cu. units since 3.14+1.05 2 ≈ 2.10. And since a hemisphere is half of a sphere, a sphere with a radius of 1 unit would be double this volume, or about 4.20 cu. units.
Practice Problems
1. A baseball fits snugly inside a transparent display cube. The length of an edge of the cube is 2.9 inches (in.). Is the baseball’s volume greater than, less than, or equal to 2.93 cubic inches (cu. in.)? Explain how you know.
2. A hemisphere fits snugly inside a cylinder with a radius of 6 cm. A cone fits snugly inside the same hemisphere.
a. What is the volume of the cylinder?
b. What is the volume of the cone?
c. Estimate the volume of the hemisphere by calculating the average of the volumes of the cylinder and cone.
a. Find the hemisphere’s diameter if its radius is 6 cm.
b. Find the hemisphere’s diameter if its radius is 1000 3 meters (m).
c. Find the hemisphere’s diameter if its radius is 9.008 feet (ft.).
d. Find the hemisphere’s radius if its diameter is 6 cm.
e. Find the hemisphere’s radius if its diameter is 1000 3 m.
f. Find the hemisphere’s radius if its diameter is 9.008 ft.
4. After almost running out of space on her phone, Elena checks with a couple of friends who have the same phone to see how many pictures they have on their phones and how much memory they take up. The results are shown in the table. Number of Photos 2,523 3,148 1,875 Memory Used in MB
a. Could this information be reasonably modeled with a linear function? Explain your reasoning.
b. Elena needs to delete photos to create 1,200 MB of space. Estimate the number of photos she should delete.
Unit 6, Lesson 6: The Volume of a Sphere
Warm-Up: Sketch a Sphere
Here is a method for quickly sketching a sphere.
• Draw a circle.
• Draw an oval in the middle whose edges touch the sphere.

1. Practice sketching some spheres. Sketch a few different sizes.
2. For each sketch, draw a radius and label it ��.
Exploration Activity: A Sphere in a Cylinder
Here are a cone, a sphere, and a cylinder that all have the same radii and heights. The radius of the cylinder is 5 units. When necessary, express all answers in terms of ��.

1. What is the height of the cylinder?
2. What is the volume of the cylinder?
3. What is the volume of the cone?
4. What is the volume of the sphere? Explain your reasoning.
Collaborative Activity: Spheres in Cylinders
Here are a cone, a sphere, and a cylinder that all have the same radii and heights. Let the radius of the cylinder be �� units. When necessary, express answers in terms of ��.

1. What is the height of the cylinder in terms of ��?
2. What is the volume of the cylinder in terms of ��?
3. What is the volume of the cone in terms of ��?
4. What is the volume of the sphere in terms of ��?
5. A volume of the cone is 1 3 the volume of a cylinder. The volume of the sphere is what fraction of the volume of the cylinder?
Lesson Summary
Consider a sphere with radius �� units that fits snugly inside a cylinder. The cylinder must then also have a radius of �� units and a height of 2�� units. The volume of the cylinder must be ����2ℎ = ����2 ⋅ (2��), which is equal to 2����3 cubic units (cu. units).
A cone with the same base and height as a cylinder has 1 3 of the volume. In this example, such a cone has a volume of 1 3 ⋅ ����2⋅ 2��, or 2 3 ����3 cu. units.

If the cone and sphere were filled with water and then that water was poured into the cylinder, the cylinder would be completely filled. That means the volume of the sphere and the volume of the cone add up to the volume of the cylinder. In other words, if �� is the volume of the sphere, then �� + 2 3 ����3 = 2����3. This leads to the formula for the volume of the sphere, �� = 4 3 ����3.
Practice Problems
1.
a. A cube’s volume is 512 cu. units. What is the length of its edge?
b. If a sphere fits snugly inside this cube, what is its volume?
c. What fraction of the cube is taken up by the sphere? What percentage is this? Explain or show your reasoning.
2. Sphere A has radius 2 centimeters (cm). Sphere B has radius 4 cm.
a. Calculate the volume of each sphere.
b. The radius of Sphere B is double that of Sphere A. How many times greater is the volume of B?
3. Match the description of each sphere to its correct volume.
A. Sphere A: radius of 4 cm
B. Sphere B: diameter of 6 cm
C. Sphere C: radius of 8 cm
D. Sphere D: radius of 6 cm
Review Problems
288�� cubic centimeters (cu. cm)
256 3 �� cu. cm
2048 3 �� cu. cm.
4. Three cones have a volume of 192�� cu. cm. Cone A has a radius of 2 cm. Cone B has a radius of 3 cm. Cone C has a radius of 4 cm. Find the height of each cone.
5. The graph represents the average price of regular gasoline in the United States in dollars as a function of the number of months after January 2014.

a. How many months after January 2014 was the price of gas the greatest?
b. Did the average price of gas ever get below $2?
c. Describe what happened to the average price of gas in 2014.
Unit 6, Lesson 7: Cylinders, Cones, and Spheres
Warm-Up: Sphere Arguments
Four students each calculated the volume of a sphere with a radius of 9 centimeters (cm) and they got four different answers.
• Han thinks it is 108 cubic centimeters (cu. cm).
• Jada got 108�� cu. cm.
• Tyler calculated 972 cu. cm.
• Mai says it is 972�� cu. cm.
Do you agree with any of them? Explain your reasoning.
Exploration Activity: Sphere’s Radius
The volume of this sphere with radius �� is �� = 288��. Therefore, 288�� = 3 4 ��3��
What is the value of �� for this sphere? Explain how you know.

Collaborative Activity: Info Gap: Unknown Dimensions
Your teacher will give you either a problem card or a data card. Do not show or read your card to your partner.
If your teacher gives you the problem card:
1. Silently read your card and think about what information you need to answer the question.
2. Ask your partner for the specific information that you need.
3. Explain how you are using the information to solve the problem.
4. Continue to ask questions until you have enough information to solve the problem.
5. Share the problem card and solve the problem independently.
6. Read the data card and discuss your reasoning.
If your teacher gives you the data card:
1. Silently read your card.
2. Ask your partner “What specific information do you need?” and wait for them to ask for information.
3. If your partner asks for information that is not on the card, do not do the calculations for them. Tell them you don’t have that information.
4. Before sharing the information, ask “Why do you need that information?” Listen to your partner’s reasoning and ask clarifying questions.
5. Read the problem card and solve the problem independently.
6. Share the data card and discuss your reasoning.
Pause here so your teacher can review your work. Ask your teacher for a new set of cards and repeat the activity, trading roles with your partner.
Collaborative Activity: The Right Fit
A cylinder with diameter 3 cm and height 8 cm is filled with water. Decide which figures described here, if any, could hold all of the water from the cylinder. Explain your reasoning.

Rectangular prism with a length of 3 cm, width of 4 cm, and height of 8 cm
1. Cone with a height of 8 cm and a radius of 3 cm
2. Cylinder with a diameter of 6 cm and height of 2 cm
3.
4. Sphere with a radius of 2 cm
Lesson Summary
The formula �� = 4 3 ����3 gives the volume of a sphere with radius ��. This formula can be used to find the volume of a sphere with a known radius. For example, if the radius of a sphere is 6 units, then the volume would be 4 3 ��(6)3 = 288��, or approximately 904 cubic units (cu. units).
This formula can also be used to find the radius of a sphere when the volume of the sphere is given. For example, if the volume of a sphere is 36�� cu. units, then the equation 36�� = 4 3 ����3 is true. This means that ��3 = 27, so the radius �� has to be 3 units in order for both sides of the equation to have the same value.
Many common objects, from water bottles to buildings to balloons, are similar in shape to rectangular prisms, cylinders, cones, and spheres, or even combinations of these shapes. Using the volume formulas for these shapes allows for the comparison of volumes of different types of objects, sometimes with surprising results.
For example, a cube-shaped box with side length 3 cm holds less than a sphere with radius 2 cm because the volume of the cube is 27 cu. cm (33 = 27), while the volume of the sphere is around 33.51 cu. cm � 4 3 �� ⋅ 23 ≈ 33.51�.
Practice Problems
1. A scoop of ice cream has a 3-inch (in.) radius. How tall should the ice cream cone of the same diameter be in order to contain all of the ice cream inside the cone?
2. Calculate the volume of the following shapes with the given information. For the first three questions, give each answer both in terms of �� and by using 3.14 to approximate ��. Make sure to include units.
a. Sphere with a diameter of 6 in.
b. Cylinder with a height of 6 in. and a diameter of 6 in.
c. Cone with a height of 6 in. and a radius of 3 in.
d. How are these three volumes related?
Review Problems
3. A coin-operated bouncy ball dispenser has a large glass sphere that holds many spherical balls. The large glass sphere has a radius of 9 in. Each bouncy ball has radius of 1 in. and sits inside the dispenser.
If there are 243 bouncy balls in the large glass sphere, what proportion of the large glass sphere’s volume is taken up by bouncy balls? Explain how you know.
4. A farmer has a water tank for cows in the shape of a cylinder with radius of 7 feet (ft.) and a height of 3 ft. The tank comes equipped with a sensor to alert the farmer to fill it up when the water falls to 20% capacity. What will the volume of the tank be when the sensor turns on?
Unit 6, Lesson 8: Solving Real-World Problems Involving Cylinders, Cones, and Spheres
Warm-Up: Missing Information?
A cylinder and sphere have the same height.
1. If the sphere has a volume of 36�� cubic units (cu. units), what is the height of the cylinder?
2. What is a possible volume for the cylinder? Be prepared to explain your reasoning.
Exploration Activity: Popcorn Deals
A movie theater offers two containers.
Which container is the better value?
Use 3.14 as an approximation for ��.

Guided Activity: Volume in the Real World
1. Marshall works for a company’s shipping department. Marshall is trying to determine the best container to use for 175�� cubic inches (cu. in.) of ice cream.
Find the volume, in terms of ��, of the 3 container options from which Marshall can choose. Round to the nearest thousandth.
2. A tennis ball canister with 3 tennis balls is shown. The diameter of the canister is 3 inches (in.), and the height is 8.1 in.
in.
a. What is the volume of the canister, using 3.14 for ��?
b. What is the volume of 1 tennis ball, using 3.14 for ��?
c. What is the volume of all 3 tennis balls?
d. What is the volume of the air left in the canister after the tennis balls have been placed inside?
Collaborative Activity: Volume in the Real World
1. A local snack shop is trying out new cups for the summer. The new cup options are shown.
Diego and Jasmine made different choices when selecting a cup to use. Their reasoning is shown.
Diego’s Reasoning
The volume of option B is greater because the height of the cup is taller than option A.
Jasmine’s Reasoning
The volume of option A is greater because the radius is longer, and the radius is squared when finding the volume.
a. Without finding the volume, explain whose reasoning you agree with.
b. What is the volume of option A, in terms of ��?
c. What is the volume of option B, in terms of ��?
d. Explain who is correct and why.
Lesson Summary
The formulas for the volume of a cylinder, cone, and sphere are always dependent on the radius of the figure. Cylinders and cones also use the measurement of height to determine the volume of the figure. The table shown summarizes the formulas for the volumes of these figures.
Formula
Cylinder �� = ����2ℎ, where �� is the radius of the base and ℎ is the height of the cylinder.
Cone �� = 1 3 ����2ℎ, where �� is the radius of the base and ℎ is the height of the cone.
Sphere �� = 4 3 ����3, where �� is the radius of the sphere.
These formulas can be used to determine the volume of a figure or to determine a missing dimension.
For example, imagine a cylinder that has a volume of 500�� cubic centimeters (cu. cm) and a radius of 5 cm, but the height is unknown. Using the formula for the volume of a cylinder, the equation 500�� = �� ⋅ 25 ⋅ ℎ can be written. When we look at the structure of the equation by dividing both sides of the equation by ��, we find that 500 = 25ℎ. That means that the height of the cylinder is 20 cm, since 500 ÷ 25 = 20.
In another example, consider a cone with a volume of 64�� cu. cm, a height of 3 cm, and an unknown radius ��. Using the volume formula, the equation 64�� = 1 3 ����2 ⋅ 3 must be true. When we solve the equation for ��, it can be determined that �� = 8 cm.
Practice Problems
1. An ice cream shop offers two ice cream cones. The waffle cone holds 12 ounces (oz.) and is 5 in. tall. The sugar cone also holds 12 oz. and is 8 in. tall. Which cone has a larger radius?
Figure
2. A new convenience store is offering free samples of soda products. Flavors include pineapple, melon, cola, lemon, and strawberry. You can choose to have your sample served in either of the containers shown.
Gian, Yanessa, and Jack drew different conclusions about the drink containers. Their conclusions are shown.
16 cm
Gian Yanessa Jack
The volumes are the same because the height of the cone is 4 times its radius, and both containers have the same radius.
Explain who is correct and why.
The volume of the sphere is greater than the volume of the cone because 4 3 ����3 is greater than 1 3 ����2ℎ.
4. A 6 oz. paper cup is shaped like a cone with a diameter of 4 in. How many oz. of water will a plastic cylindrical cup with a diameter of 4 in. hold if it is the same height as the paper cup? 4 cm 4 cm
The volume of the cone is greater than the volume of the sphere because the height of the cone is 4 times the radius of both containers.
3. A graduated cylinder that is 24 cm tall can hold 1 liter (L) of water. What is the radius of the cylinder? What is the height of the 500 milliliter (mL) mark? The 250 mL mark? Recall that 1 L is equal to 1000 mL and that 1 L is equal to 1,000 cu. cm.
Radius:
Height of 500 mL mark:
Height of 250 mL mark:
Unit 7, Lesson 1: Describing Data Distributions
Warm-Up: Stem-and-Leaf Plot
A stem-and-leaf plot shows the number of books checked out from a local library by its patrons in a day.
1. What is the mean number of books checked out from the library per day?
2. What is the median number of books checked out from the library per day?
3. What is the mode of the data set?
Guided Activity: Measures of Center and Variation
Measures of center and measures of variation are used to describe data sets.
1. Complete the statements with the terms provided.
interquartile range (IQR) mean median mean absolute deviation (MAD) range mode
a. The is the arithmetic average of a set of numbers. It is a measure of central tendency.
b. The is the middle of an ordered list of the values. If the list has an odd number of values, it is the middle value of that list. If the list has an even number of values, it is the average of the 2 middle values. It is a measure of central tendency.
c. A measure of variation in a set of numerical data, the is the distance between the first and third quartiles of the data set.
d. A measure of variation in a set of numerical data, the is the average distance that each data point is from the mean.
e. The is the difference between the highest data value and the lowest data value in a data set. It is a measure of variation.
f. The value found most often in a set of numbers is the .
2. Suppose an office tracks the number of phone calls received on business days, Monday through Friday, over the course of 2 weeks. The data collected is shown. 183 165 58 152 179 152 153 135 124 112
a. Discuss with your partner what you notice about the data set.
b. Complete the table by matching each measure of center or variation with its calculation for the office phone call data.
183 − 58 = 125 152 , 152
A histogram, a dot plot, and a box plot representing the data are shown.
c. Complete the table by identifying each type of display.
d. Complete the table by identifying which measures of center and variation can be determined from each display.
e. Complete the statement.
In the data set, appears to be an outlier.
Collaborative Activity: Determining, Describing, and Comparing Numerical Data Represented Graphically
Work with your partner to complete the following.
1. Twenty students timed how long it took each of them to solve a puzzle. Below is a list of their solution times, in minutes (min.), and a dot plot displaying the data.
a. Determine the mode of the data set. Then, draw an X below the number line to indicate the location of this value.
b. Determine the mean of the data set. Then, draw an arrow (↑) below the number line that points to this value.
c. Determine the median of the data set. Then, circle this value on the number line.
d. Discuss with your partner what you notice about the mean and the median of the data. Summarize your discussion.
e. Which of the following values could be the MAD of the data set?
f. Find the interquartile range (IQR) by first determining the values of quartile 1 (Q1) and quartile 3 (Q3).
Q1 Q3 IQR
g. Determine the range of the data set.
2. Imagine that the fastest time of 2 min. was removed from the data set.
a. Discuss with your partner what effect, if any, removing this value would have on the measures of center and variation.
b. Describe how the shape of the distribution would change if 2 were removed.
c. Complete the table by comparing the values of each measure before and after the 2 is removed.
d. Which measure(s) of center will be affected if the outlier is removed?
□ Mean
□ Mode
□ Median
e. Which measure(s) of variation will be affected if the outlier is removed?
□ IQR
□ MAD
□ Range
Lesson Summary
Measures of center, such as mean, median, and mode, are numerical values used to describe a typical value in a data set. Measures of variation or spread, such as range, mean absolute deviation (MAD), and interquartile range (IQR), are used to describe how “spread out” the data is.
A measure of center is a numerical value used to describe the overall clustering of data in a set, or the overall central value of a set of data. The three most common measures of central tendency are the mean, median, and mode.
A measure of variability is a numerical value that measures how much a data set varies from a central value.
Some measures of center and spread are more effected by outliers than others.
An outlier is a value that is much higher or much lower than the other values in a set of data.
Typically, median and IQR are less affected by extreme values than the mean, MAD, and range are. Mode is a unique measure that may not be in the center of the data but represents the most frequently occurring data value in the set. A data set can have no mode, 1 mode, or more than 1 mode.
Practice Problems
1. The data set shows the number of tickets a movie theater sold in 1 day for each movie that is playing at the theater.
a. One of the values in the data set is an outlier. Explain which value you think is the outlier.
b. Complete the statement.
Removing the outlier, , causes the mean to increase decrease remain the same and the MAD to increase decrease remain the same because it is much larger smaller than the other values in the data set.
2. A box plot representing the data set from question 1 is shown.
Describe how the shape of the distribution will change when the outlier is removed from the data set.
3. Parallel lines ���� and ���� with transversal ���� are shown, where ��∠������ = 115° and ��∠������ = (15�� + 25)°.
a. Find the value of ��.
b. Find ��∠������.
4. A cylinder and cone have the same height and radius. The height of each is 9 inches (in.), and the radius of each is 5 in.
a. Find the volume of the cylinder. Write the answer in terms of ��.
b. Find the volume of the cone. Write the answer in terms of ��.
Unit 7, Lesson 2: Exploring the Effect of Adding or Removing Data Points
Warm-Up: Airport Delays
The departure delays, in minutes (min.), for 15 randomly selected flights from a local airport are shown in the dot plot.
1. Circle the outlier in the data set.
2. Interpret the data point 15 in this context.
Exploration Activity: Enrolling Campers
A local summer camp has 14 campers enrolled in their swimming camp. The ages of the 14 campers are listed. 10, 8, 12, 10, 8, 10, 10, 9, 11, 11, 12, 9, 11, 9
1. Complete the table by determining the measures of center and spread for the data set.
2. Create a dot plot to represent the data.
3. An additional 13-year-old camper was later added to the roster. Without calculating, predict whether each measure of center and spread will increase, decrease, or stay the same.
4. For the measure(s) that you believe will change, explain your reasoning.
5. The two 8-year-old campers had to cancel their reservations for swimming camp.
a. How will the removal of these campers affect the mean and median age?
b. How will the removal of these campers affect the MAD and IQR of ages?
c. Compare the shape of the distribution of the original 14 campers and the shape after the 13-year-old is added and the two 8-year-olds are removed.
Collaborative Activity: Adding and Removing Data Points
1. The hourly pay rates for a team of workers at a local restaurant are shown.
{17.00, 10.50, 9.25, 11.00, 8.50, 9.60, 10.25, 8.75, 10.00}
a. Which measures of center and spread should be used to describe this data set?
b. Which value in the data set, when removed, would have the most impact on the measures of center and spread? Explain your reasoning.
2. Julius recorded the weights, in pounds (lb.), of 8 lions at a zoo.
{475, 338, 471, 438, 394, 513, 162, 409}
a. Based on the mean weight of his sample, Julius recommends that the lions’ amount of feed be increased. Explain to Julius why this may not be the best suggestion.
Upon further examination, Julius discovers that the lion with the recorded weight of 162 was actually weighed in kilograms (kg) rather than lb. like the rest of the weights. Julius adjusts the data set by removing 162 kg and replacing it with 357 lb.
b. How will this adjustment change the mean of the data set?
c. Describe how this adjustment will change the shape of the distribution.
3. Consider the data set represented by the box plot shown. 15 16 17 18 19 20 21 22 23 24 25
a. Select all the data values that will increase the range of the data set if added.
b. Select all the data values that will increase the mean of the data set if removed.
Lesson Summary
A statistical data set may get adjusted with new or updated data points. When a data point is added to or removed from a data set, the measures of center and spread are often impacted.
• The mean and MAD of a data set will most often be affected by the addition or removal of a data point.
• The median and IQR may or may not be affected, depending on where the data point falls in relation to the rest of the data.
Often, outliers play the biggest role in changing the values of the measures of center and spread in a data set.
• Since outliers are significantly different from the rest of the data, removing them from the calculations tends to bring the mean and median closer to each other and decrease the MAD.
• When outliers are removed, the shape of the distribution may also be affected.
Practice Problems
1. Athena is practicing for an upcoming golf tournament. The scores for her last 10 rounds were 84, 85, 92, 90, 98, 89, 95, 90, 87, and 90. To qualify for the golf tournament, her mean score over the past 10 rounds must be less than 90.
a. What is the current mean of Athena’s scores?
b. Athena realizes she recorded the 5th round incorrectly. Instead of 98, her score was 88. Explain what effect this change in score will have on the mean.
c. With her 5th-round score corrected, explain whether Athena will qualify for the tournament.
2. The length, in minutes (min.), of songs on a given album are shown.
{2.5, 1.5, 2.4, 1.8, 3.2, 2.7, 3, 3.2, 4}
The artist wants to add a 10th song to his album. The new song is 6 min. long. Explain how this song would affect the mean and MAD of the data.
3. The president of a homeowners association was interested in the number of pets owned by residents. The data is represented in the dot plot shown. 1
Number of Pets
a. Complete the table by calculating the measures of center and spread for the data.
b. The homeowner who owns 8 pets moves away, and no one else has purchased the house. Without calculating, predict whether each value will increase, decrease, or stay the same.
Review
4. Triangle ������ is transformed to create ∆������, as shown.
a. Describe a sequence of transformations that maps ∆������ onto ∆������.
b. Determine whether ∆������ and ∆������ are congruent. Explain your reasoning.
5. Solve the inequality 5�� − 2 ≤ 7.
Unit 7, Lesson 3: Comparing Groups
Warm-Up: Comparing Groups
What do you notice? What do you wonder?

Guided Activity: Comparing Team Heights
1. The heights, in inches (in.), of players on a local college’s gymnastics and volleyball teams (represented on the dot plots in the Warm-Up) are shown.
Gymnastics team’s heights (in.): 56, 59, 60, 62, 62, 63, 63, 63, 64, 64, 68, 69
Volleyball team’s heights (in.): 72, 75, 76, 76, 78, 79, 79, 80, 80, 81, 81, 81
How much taller is the volleyball team than the gymnastics team?
2. The heights of the players on the school’s tennis and bowling teams are shown.
Tennis team’s heights (in.): 63, 74, 68, 80, 79, 71, 67, 75, 77, 63, 81, 76, 63, 65
Bowling team’s heights (in.): 70, 61, 57, 63, 59, 73, 61,
a. Create a stem-and-leaf plot for each of the teams.
Tennis Team
Stem Leaf
Bowling Team Stem Leaf
,
,
,
,
,
, 61
b. Create a back-to-back stem-and-leaf plot for the heights of the players on the 2 teams.
Team
Bowling Team Leaf Stem Leaf
Tennis
c. Complete the statements.
The median height of the players on the tennis team is equal to less than greater than the median height of the players on the bowling team. The height of the tallest person on the bowling team is equal to less than greater than the height of the tallest person on the tennis team. The range of the heights of the players on the tennis team is equal to less than greater than the range of the heights of the players on the bowling team.
d. Discuss with your partner which display was more useful in comparing the 2 distributions. Summarize your discussion.
3. Isabella says the members of the tennis team are taller than the members of the bowling team. Oliver disagrees. Do you agree with either of them? Explain or show your reasoning.
Collaborative Activity: Track Length
Here are three dot plots that represent the lengths, in minutes (min.), of songs on different albums.
1. One of these data sets has a mean of 5.57 min. and another has a mean of 3.91 min.
a. Which dot plot shows each of these data sets?
b. Calculate the mean for the data set on the other dot plot.
2. One of these data sets has a mean absolute deviation (MAD) of 0.30 and another has a MAD of 0.44.
a. Which dot plot shows each of these data sets?
b. Calculate the MAD for the other data set.
3. Do you think the three groups are very different or not? Be prepared to explain your reasoning.
4. A fourth album has a mean length of 8 min. with a MAD of 1.2. Is this data set very different from each of the others?
Lesson Summary
Comparing 2 individuals is fairly straightforward. The question “Which dog is taller?” can be answered by measuring the heights of 2 dogs and comparing them directly. Comparing 2 groups can be more challenging. What does it mean for a basketball team to be generally taller than a soccer team?
To compare 2 groups, you can use the distribution of values for the groups. Most importantly, a measure of center, usually the mean or median, and its associated measure of variability, usually the MAD or interquartile range (IQR), can be used to determine differences between groups.
For example, if the average height of pugs in a dog show is 11 in. and the average height of beagles in the dog show is 15 in., it would seem that the beagles are generally taller. On the other hand, if the MAD of both distributions is 3 in., it would not be unreasonable to find a beagle that is 11 in. tall or a pug that is 14 in. tall. Therefore, the heights of the 2 dog breeds may not be very different from one another.
Practice Problems
1. Compare the weights of the backpacks for the students in these three classes.


2. A school’s art club holds bake sales on Fridays to raise money for art supplies. The number of cookies they sold each week in the fall and in the spring are shown.
a. Find the mean number of cookies sold in the fall and in the spring.
The MAD for the fall data is 2.8 cookies. The MAD for the spring data is 2.6 cookies.
b. Based on this data, explain whether you think that sales were generally higher in the spring than in the fall.
3. A professor played music during a test in one of his classes but did not play music while another one of his classes took the test. He was interested to see if there was a difference in the test scores of the two classes. The test scores are shown in the histograms.
a. Complete the statements.
The data in the histograms shows the center of the data for the students that had music during the test is greater than less than same as the center of the data for the
students that did not have music during the test. The IQR for the students that had music during the test is greater than less than same as the IQR for the students that did not have music during the test.
b. Using the answers in part A, explain the differences in the test scores of the two groups.
4. Four relations are shown in the table. Complete the table by deciding whether each relation is a function.
{(−5, −1); (−4, 0); (−3, 1); (−2, 2); (−1, 3)}
Function Not a function
Unit 7, Lesson 4: Comparing Graphical Representations
Warm-Up: Comparing Dot Plots
1. Clare recorded the amount of time a sample of students in the 6th, 8th, and 10th grades spent doing homework, in hours per week. She made a dot plot of the data for each grade and provided the following summary.
• Students in 6th grade tend to spend less time on homework than students in 8th and 10th grades.
• The homework times among the 10th grade students are more alike than the homework times among the 8th grade students.
Use Clare’s summary to match each dot plot to the correct grade (6th, 8th, or 10th).
Grade Level Dot Plot
Time Spent on Homework (hours per week)
Collaborative Activity: Station 1 – Comparing Data
Represented in Histograms and Dot Plots
1. The histograms show the height distributions, in inches (in.), of 50 male professional basketball players and 50 male professional baseball players.
Complete the statements.
a. The sample data in the histograms shows the center of the data for professional basketball players is less than greater than the center of the data for professional baseball players. Therefore, it can be concluded that professional basketball players are typically taller than shorter than professional baseball players.
b. The histograms show that in the samples, the MAD of heights of professional basketball players is less than greater than the MAD of the heights of professional baseball players. Therefore, we can conclude that professional basketball players have less more variability in their heights than professional baseball players.
One possible reason for this is . . .
2. Mr. Logan surveyed a sample of his junior and senior students about the time they spend studying math per day. He then created the dot plots to display the data for each group.
Time Juniors Spent Studying
Time Seniors Spent Studying
Complete the statements.
a. The value of the larger median study time for the 2 groups is .
b. The value of the larger mean study time for the 2 groups is .
c. In 1 or 2 sentences, describe the difference between the number of minutes Mr. Logan’s juniors and seniors study by comparing the distributions.
Collaborative Activity: Station 2 – Comparing Data Represented in Box Plots
1. The minutes (min.) it took for a sample of track team members at East High School and West High School to run a mile (mi.) are shown in the 2 box plots.
East High School
West High School Mile Time (minutes)
a. Using the box plots, determine and describe each of the features for West High in the table. The descriptions for East High School are completed in the table.
Feature East High School
Shape The shape of the data is asymmetrical.
West High School
Center The median mile time for the sample of East High School team members is 5 minutes (min.).
Variability
The IQR of the sample of East High School team members’ mile times is 1.25 minutes.
b. Based on the data, explain which team is more likely to win at a track meet.
c. Suppose a runner at a track meet runs a mile in 3 min. and 45 seconds (sec.). Explain which track team you would assume they were on, using information from the data displays.
d. Based on your conclusions and answers to parts A–C, use some of the terms from the word bank shown to write a 4 or 5 sentence summary comparing the population of track team members at East High School to the population of track team members at West High School.
mean median MAD IQR center variability upper quartile lower quartile sample population
Collaborative Activity: Station 3 – Comparing Stem-and-Leaf Plots and Box Plots
1. A sample of guitar prices at 2 different stores are shown in the back-to-back stem-and-leaf plot.
Zach wants to purchase a guitar and is trying to determine which store to purchase from. Using the data, he draws the following conclusion.
“Store B is better for more experienced guitar players because it typically sells more expensive guitars than store A. The mean price of store B’s guitars is $711.88, while the mean price of store A’s guitars is $526.67. Prices of guitars at store A tend to vary more, with a MAD of $189.33, compared to the prices of guitars at store B, which have a much smaller MAD.”
Do you agree or disagree with Zach’s conclusion? Explain your reasoning.
2. A sample of test scores is taken from Mr. Spellman’s morning math class. Another sample of test scores is taken from Mr. Spellman’s afternoon math class. The data is displayed in the box plots shown.
Compare the distribution of scores between students taking the math test in the morning versus in the afternoon. Use some of the terms from the word bank, and be sure to include both a measure of center and a measure of variability in your explanation.
Lesson Summary
Comparing data sets is a useful tool in real-world contexts such as when trying to determine which restaurant serves more expensive food, which car manufacturer produces cars with the best gas mileage, or which tree produces the most fruit during a season. Some data sets can be compared using their measure of center or measure of spread, while other data sets may be compared using the shape of the distribution. In some cases, several statistical descriptions may need to be used to compare 2 data sets.
In general, data is collected from representative samples that can be used to make inferences about a population.
A sample is a subset of a population.
A population (in data analysis) is the entire set of cases or individuals under consideration in a statistical analysis.
For example, the back-to-back stem-and-leaf plot shows the number of min. per day that a sample of 8th graders exercises and plays video games.
Using the back-to-back stem-and-leaf plot, it is possible to make multiple observations.
• The overall trend for the time that the sample of 8th graders spent playing video games is generally greater than the time they spent exercising.
• Since the data is given in the stem-andleaf plot, it’s also possible to determine the exact value of the means, medians, modes, IQRs, MADs, and ranges to compare the data sets.
• Using the shape of the data, it’s also possible to approximate the measures of center. Since the peak of the exercise leaf occurs in the stem of 2, while the peak in the play video games leaf occurs in the stem of 4, it is fair to say that the median number of min. that an 8th grader plays video games is greater than the number of min. they exercise.
• The mode for exercise is 15 min., while the mode for playing video games is 0 min.
When comparing data sets, any measure of center (mean, median, or mode) and any measure of variability (IQR, MAD, or range) can be used to summarize the data and the distribution it represents. The shape of the distributions can be described as symmetric, skewed, bimodal, or uniform. Take care to highlight any possible outliers, as those extreme values may have an impact on the measures of center or spread.
Practice Problems
1. A sample of wait times, in min., for drive- thrus at 2 fast food restaurants are shown in the box plots.
a. Using the box plots, determine and describe each of the features for the 2 restaurants in the table.
Feature
Shape
Restaurant A Restaurant B
The shape of the data is symmetrical.
Center
Variability
b. Maria is in a hurry and wants to get lunch from one of the restaurants. Based on the answers in part A, which restaurant should Maria go to?
2. Mrs. Menendez surveyed the students in 2 of her classes on how many books they read in a semester. The data is shown on the dot plots.
Class A Class B
Number of Books Read
Number of Books Read
a. Complete the table with the values for the measures of center and variation.
b. Use the answers in part A to describe the differences in the number of books read by the 2 classes.
Review Problem
3. A sphere has a radius of 3 centimeters (cm). Determine the volume of the sphere in terms of ��.
Unit 7, Lesson 5: Comparing Data Sets
Warm-Up: Notice and Wonder
The line plots represent the distribution of the tip amounts, in dollars, left at 2 different restaurants on the same night.
1. Complete each statement.
a. When looking at the data displays, 1 thing I notice is . . .
b. One thing I wonder is . . .
Guided Activity: Comparing Measures of Center and Variability
On a college entrance exam, the possible scores on the math section range from 0 to 50. The scores for 20 randomly selected female high school seniors are shown.
42, 40, 43, 41, 42, 40, 44, 46, 40, 43, 45, 42, 48, 46, 45, 43, 46, 47, 41, 44
The scores for 20 randomly selected male high school seniors are shown.
40, 38, 40, 43, 40, 43, 45, 41, 40, 41, 41, 39, 43, 41, 42, 41, 42, 41, 39, 40
1. Complete the table by calculating the measures of center and variability for each set of data.
Measure Female Students Male Students
Potential outliers
2. Complete the statements.
a. Female students tend to have lower higher scores on the math section of the college entrance exam, with a median score of _______, than males, who have a median score of _______. The median score of female students on the math section of the college entrance exam is less more than the median score of the male students taking the same exam by about _______ times the IQR of female students’ scores.
b. The mean score of male students on the math section of the college entrance exam is lower higher than the mean score of female students taking the same exam by about _______ times the MAD of male students’ scores.
c. Scores for male students tend to have less more variability, with an IQR of _______, than scores for female students, with an IQR of _______.
Collaborative Activity: Guess My Data Sets
Suppose an English teacher takes 5 random samples of students and records their most recent test scores. The data from each sample is shown.
• Data set A: {22, 0, 44, 40, 56, 32, 64, 44, 52, 60}
• Data set B: {60, 62, 62, 60, 64, 68, 64, 62, 68, 60}
• Data set C: {70, 82, 74, 76, 80, 72, 84, 70, 78, 82}
• Data set D: {72, 86, 100, 76, 92, 90, 100, 78, 98, 86}
• Data set E: {64, 36, 74, 82, 96, 80, 66, 78, 68, 0}
Without telling your partner, choose 2 of the data sets.
1. Write a paragraph comparing the 2 data sets you have chosen using measures of center and variability. Make sure to refer to the data sets as “Data set 1” and “Data set 2” in the paragraph you write.
2. Determine with your partner who is partner A and who is partner B. Write your names on the lines for each partner in the table.
3. Partner A should read their paragraph from problem 1 to partner B, and partner B will guess which 2 data sets were used. Then, partner B will explain their reasoning for their guess. Both partners will summarize the guess and reasoning in the first row of the table.
4. Then, switch roles so that partner B reads their paragraph while partner A makes a guess and explains their reasoning.
5. Reveal to your partner which data sets were used, and discuss any errors that may have led to incorrect conclusions.
Lesson Summary
When comparing statistical distributions, it’s important to start by identifying which measures of center and spread should be used to summarize the data set. Use the shapes of the distributions to determine which measures to use.
• In a symmetric distribution, the mean and the median are close to each other. In statistics, the mean and MAD are typically used to describe a symmetric distribution.
• In a skewed distribution or a distribution with outliers, the median and IQR are the preferred measures for describing the data.
• In a bimodal distribution, the mode may be used as the preferred measure of center, and the range may be used to describe the spread.
Two data sets can only be compared with the same measures of center and spread. For example, when comparing a data set with a symmetric distribution to a distribution skewed by an outlier, the median and IQR would be used for both, since the mean and MAD would be impacted by the outlier in the skewed distribution.
Comparisons of distributions can involve identifying which measure of center is larger or smaller, identifying which measure of variability is larger to help determine which distribution is more spread out, and/or identifying any outliers that may impact other statistical measures.
Practice Problems
1. Mollie wants to determine the best way to get to school. Over several weeks, she took turns riding in a car and riding her bike. She recorded the time, in minutes, it took her to get to school each time. The data she collected is shown.
• Car ride times: {19, 15, 12, 29, 17, 18, 22, 14}
• Bike ride times: {24, 27, 21, 32, 25, 26, 28, 23}
Mollie calculated the measures of center and spread for each transportation method. They are shown in the table.
a. Based on the data, make an argument for why Mollie should ride in a car to get to school.
b. Based on the data, make an argument for why Mollie should ride her bike to get to school.
2. A company is trying to determine which method of communication is best to tell their employees important information. They send text messages to 10 employees and emails to another 10 employees. They record how many minutes it takes for the employees to reply. The data collected is shown in the table.
a. Calculate the measures of center and variability.
b. Complete the statement.
The median number of minutes it takes for the employees to reply to emails is less more than the median number of minutes it takes for the employees to reply to texts by about _______ time(s) the IQR of employees who received the text. email.
c. Complete the statement.
The mean number of minutes it takes for the employees to reply to texts is less more than the mean number of minutes it takes for the employees to reply to emails by about _______ time(s) the MAD of employees who received the text. email.
3. A movie rating website has users rate a new movie on a scale of 0 to 100. The dot plot for a sample of 20 reviews is shown.

a. Explain which measure of center should be used to describe this data set.
b. Explain which measure of variability should be used to describe this data set.
Unit 7, Lesson 6: Comparing Populations Using Samples
Warm-Up: Same Mean? Same MAD?
Without calculating, tell whether each pair of data sets have the same mean and whether they have the same mean absolute deviation (MAD).
Exploration Activity: With a Heavy Load
Consider the question: Do 10th-grade students’ backpacks generally weigh more than 7th-grade students’ backpacks?
The back-to-back stem-and-leaf plot shows the weights, in pounds (lb.), of backpacks for a sample of students from 7th grade and a sample of students from 10th grade.
1. Explain whether any 7th-grade backpacks in this sample weighed more than a 10th-grade backpack.
2. The mean weight of this sample of 7th-grade backpacks is 6.3 lb. Explain whether you think the mean weight of all 7th-grade students’ backpacks is exactly 6.3 lb.
3. The mean weight of this sample of 10th-grade backpacks is 14.8 lb. Do you think there is a meaningful difference between the weight of all 7th-grade backpacks and the weight of all 10th-grade backpacks? Explain or show your reasoning.
Guided Activity: Steel from Different Regions
When anthropologists find steel artifacts, they can test the amount of carbon in the steel to learn about the people that made the artifacts. Two box plots are shown for the percentage of carbon in samples of steel that were found in 2 different regions.

1. For each scenario, compare the distribution of the amount of carbon in the steel artifacts.
a. Was there any steel found in region 1 that had more carbon than some of the steel found in region 2?
b. Was there any steel found in region 1 that had less carbon than some of the steel found in region 2?
2. Complete the statements.
Since the middle 50% of the data in the 2 box plots has some overlap, no overlap, it can
be said that there is a significant difference no significant difference in the percentage of carbon in steel artifacts found in the 2 regions.
3. Which sample has a distribution that is not approximately symmetric?
4. The summary statistics for the 2 regions are shown.
5. Compare the distributions of the 2 regions using measures of center and spread.
6. The anthropologists who conducted the study concluded that there was a meaningful difference between the samples of steel from these regions. Discuss with your partner whether you agree with the anthropologists’ conclusions. Summarize your discussion.
Lesson Summary
Two different populations can be compared using samples represented on graphs such as double box plots, back-to-back stem-and-leaf plots, double dot plots, and double histograms. The visual overlap between the 2 distributions can be used to determine if there is a meaningful, or significant, difference between the populations.
For example, is there a meaningful difference between the weights, in kilograms (kg), of pugs and beagles? The histograms of the weights for a sample of dogs of each of these breeds are shown.

The red triangles indicate the mean weight of each sample, 6.9 kg for the pugs and 10.1 kg for the beagles. The red lines show the weights that are within 1 mean absolute deviation (MAD) of the mean. The data values within 1 MAD of the mean are considered “typical” weights for the breed. These typical weights do not overlap, so there is a meaningful difference between the weights of pugs and beagles.
For another example, is there a significant difference between the weights of male pugs and female pugs? The box plots of the weights for a sample of male and female pugs are shown.

The box plots show that the medians are different but the weights between the first and third quartiles overlap. Based on these samples, there is not a significant difference between the weights of male pugs and female pugs.
Practice Problems
1. These two box plots show the distances of a standing jump, in inches, for a random sample of 10-year-olds and a random sample of 15-year-olds. Is there a meaningful difference in median distance for the two populations? Explain how you know.

2. The median income for a sample of people from Chicago is about $60,000 and the median income for a sample of people from Kansas City is about $46,000, but researchers have determined there is not a meaningful difference in the medians. Explain why the researchers might be correct.
3. A back-to-back stem-and-leaf plot is shown for 2 data sets.
Set A
Set B
Complete each statement.
a. The mean of data set A is equal to less than greater than data set B.
b. The median of data set A is equal to less than greater than data Set B.
c. The mode of data set A is equal to less than greater than data set B.
d. The range of data set A is equal to less than greater than data set B.
e. The IQR of data set A is equal to less than greater than data set B.
f. The MAD of data set A is equal to less than greater than data set B.
Unit 7, Lesson 7: Comparing Populations
Warm-Up: Features of Graphical Representations
Complete the table by identifying which display(s) is (are) easiest to use to find each statistical feature.
Mean Mode Range
Median
Mean Absolute Deviation (MAD)
Interquartile Range (IQR)
Shape of Distribution
Histogram Box Plot
Stem-andLeaf Plot Dot Plot
Collaborative Activity: Info Gap: Comparing Populations
Your teacher will give you either a problem card or a data card. Do not show or read your card to your partner.
If your teacher gives you the problem card:
1. Silently read your card and think about what information you need to be able to answer the question.
2. Ask your partner for the specific information that you need.
3. Explain how you are using the information to solve the problem. Continue to ask questions until you have enough information to solve the problem.
4. Share the problem card and solve the problem independently.
5. Read the data card and discuss your reasoning.
If your teacher gives you the data card:
1. Silently read your card.
2. Ask your partner “What specific information do you need?” and wait for them to ask for information. If your partner asks for information that is not on the card, do not do the calculations for them. Tell them you don’t have that information.
3. Before sharing the information, ask “Why do you need that information?” Listen to your partner’s reasoning and ask clarifying questions.
4. Read the problem card and solve the problem independently.
5. Share the data card and discuss your reasoning.
Pause here so your teacher can review your work. Ask your teacher for a new set of cards and repeat the activity, trading roles with your partner.
Collaborative Activity: Comparing to Known Characteristics
1. A college graduate is considering two different companies to apply to for a job. Acme Corp lists this sample of salaries on their website. $45,000 $55,000 $140,000
What typical salary would Summit Systems need to have to be meaningfully different from Acme Corp? Explain your reasoning.
2. A factory manager is wondering whether they should upgrade their equipment. The manager keeps track of how many faulty products are created each day for a week.
The new equipment guarantees an average of 4 or fewer faulty products per day. Is there a meaningful difference between the new and old equipment? Explain your reasoning.
Lesson Summary
When using samples to compare 2 populations, there are several factors to consider.
• Which characteristic of the populations makes sense to compare: the mean, the median, or a proportion?
• How variable is the data? If the data is very spread out, it can be more difficult to draw conclusions with certainty.
When trying to compare groups, it’s important to know the correct questions to ask so that the results can be interpreted correctly. A meaningful, or significant, difference between populations is dependent on how varied the data sets are and how close together or far apart the measures of center are.
Practice Problems
1. An agent at an advertising agency asks a random sample of people how many episodes of a TV show they watch each day. The results are shown in the dot plot.

The agency currently advertises on a different show but wants to change to this one as long as the typical number of episodes is not meaningfully less.
a. What measure of center and measure of variation would the agent need to find for their current show to determine if there is a meaningful difference? Explain your reasoning.
b. What are the values for these same characteristics for the data in the dot plot?
c. What numbers for these characteristics would be meaningfully different if the measure of variability for the current show is similar? Explain your reasoning.
2. Jada wants to know if there is a meaningful difference in the mean number of friends on social media for teens and adults. She looks at the friend count for the 10 most popular of her friends and the friend count for 10 of her parents’ friends. She then computes the mean and MAD of each sample and determines there is a meaningful difference.
Jada’s dad later tells her he thinks she has not come to the right conclusion. Jada checks her calculations, and everything is right. Do you agree with her dad? Explain your reasoning.
3. The mean weight for a sample of a certain kind of ring made from platinum is 8.21 grams (g). The mean weight for a sample of a certain kind of ring made from gold is 8.61 g. Is there a meaningful difference in the weights of the two types of rings? Explain your reasoning.
Review Problem
4. The lengths in feet of a random sample of 20 male and 20 female humpback whales were measured and used to create the box plot.

Estimate the median lengths of male and female humpback whales based on these samples.
Unit 7, Lesson 8: Exploring Double Line Graphs
Warm-Up: Describing the Center
1. Would you use the median or mean to describe the center of each data set? Explain your reasoning.
a. Heights of 50 basketball players

b. Ages of 30 people at a family dinner party

c. Backpack weights of sixth-grade students

d. How many books students read over summer break

Exploration Activity: Exploring Line Graphs
The 2023 average monthly temperatures, in degrees Fahrenheit (℉), for Bryce Canyon National Park (NP), Utah, and Everglades NP, Florida, are shown in the table.
2. Use the average monthly temperatures from 2023 for the 2 national parks to determine the measures of center and spread in the summary data table. Some measurements have been provided. Round to the nearest tenth, where needed.
3. Describe the similarities and differences between the temperatures at the 2 national parks.
4. Which national park would you expect to see more visitors during the year? Explain your reasoning.
Bryce Canyon NP Everglades NP
In some cases, it’s more important to view data with respect to time, such as months, rather than the overall trends for the complete data set.
5. The average monthly temperatures in Bryce Canyon NP are shown on the coordinate plane.
a. Connect each month’s average temperature to the next month’s to create a line graph.
b. On the same coordinate plane, plot the line graph to represent the average monthly temperature in Everglades NP.
c. Describe any trends in the data for Bryce Canyon NP that you can identify from the line graph.
d. Describe any trends in the data for Everglades NP in the line graph.
e. What information can be determined from the double line graph that was not easily found in the raw data or the summary data?
f. Based on the double line graph, complete the statements.
In the summer months, I expect to have more visitors because . . .
In the winter months, I expect to have more visitors because . . .
Collaborative Activity: Visitors to National Parks
The National Park Service monitors the number of visitors to national parks throughout the year.
1. The line graph shows the number of visitors, in thousands, that visited Everglades NP in 2023.
a. What trends are visible on the line graph?
b. Compare Everglades NP’s number of visitors with the park’s monthly temperatures from the Exploration Activity.
c. Which 2 months have the lowest number of visitors to Everglades NP?
2. The double line graph shows the number of visitors, in thousands, that visited Bryce Canyon NP and Everglades NP in 2023.
a. Discuss with your partner any trends that can be identified from the double line graph shown. Summarize your discussion.
b. Based on the double line graph of monthly visitors, complete the statements.
In the summer months, has more visitors.
In the winter months, has more visitors.
c. Explain whether temperature is a good measure to use in predicting the number of visitors to a national park.
Lesson Summary
A line graph can be a useful display when looking for trends in data over time. Realworld situations such as values of stocks throughout the day, precipitation over weeks or months, or the amount of daylight throughout the year may be best modeled using line graphs or double line graphs.
A line graph displays numerical data using connected line segments.
Double line graphs provide the opportunity to compare 2 different data sets over the same period of time and variable of interest. In double line graphs, the horizontal and vertical axes represent the same measurements with the same scale. Such restrictions on the axes allow for better comparisons that may not be visible when the data is presented in a table or on individual graphs.
Practice Problems
1. Big Bend NP in Texas includes the Chisos mountain range and parts of the Chihuahuan Desert, while Denali NP in Alaska includes Mount Denali, the highest mountain in North America. The double line graphs show the average temperatures at the parks, in ℉, and the number of visitors, in thousands, for each month in 2023.
a. Describe the similarities and differences between the average temperatures of the 2 parks.
b. Describe the similarities and differences between the number of visitors to the 2 parks.
c. Explain whether temperature is a good predictor of the number of visitors to the 2 national parks.
Review Problems
2. Determine whether each equation has no solution, infinitely many solutions, or exactly 1 solution.
a. 3(2�� + 1) = 6�� + 5
b. −4(�� − 5) = �� + 1
c. 1 2 (4�� − 8) = 2�� − 4
3. The height of a plant, ��, in centimeters (cm), �� months after it was planted can be modeled by a linear relationship. The slope is 10, and the ��-intercept is 3.
a. Explain the meaning of the slope in context.
b. Explain the meaning of the ��-intercept in context.
Unit 7, Lesson 9: Organizing Data
Warm-Up: Notice and Wonder: Messy Data
A table of data is shown. Each row shows 2 measurements of a triangle, in centimeters (cm).
1. What do you notice?
2. What do you wonder?
Exploration Activity: Seeing the Data
Here is the table of isosceles right triangle measurements from the Warm-Up and an empty table.
3. How can you organize the measurements from the first table so that any patterns are easier to see? Write the organized measurements in the empty table.
4. For each of the following lengths, estimate the perimeter of an isosceles right triangle whose short side has that length. Explain your reasoning for each triangle.
a. The length of the short side is 0.75 cm
b. The length of the short side is 5 cm
c. The length of the short side is 10 cm
Collaborative Activity: Tables and Their Scatter Plots
Here are four scatter plots. Your teacher will give you four tables of data.
• Match each table with one of the scatter plots.
• Use information from the tables to label the axes for each scatter plot.


Lesson Summary
Consider the data collected, in inches (in.), from pulling back a toy car and then letting it go forward. In the first table, the data may not seem to have an obvious pattern. The second table has the same data, but it shows that both values are increasing together.
Unorganized Table
Organized Table
A scatter plot can also be used to represent the two-variable data.
A scatter plot is a graph in the coordinate plane representing a set of bivariate numerical data that is used to observe the relationship between two variables.
The scatter plot makes the pattern clear enough to estimate how far the car will travel when it is pulled back 5 in. Patterns in data can sometimes become more obvious when reorganized in a table or when represented in a diagram such as a scatter plot. If a pattern is observed, it can sometimes be used to make predictions.

Practice Problems
1. The data on the number of cases of whooping cough from 1939 to 1955 is shown in a table. A blank table is also provided.
a. Use the blank table to create a new table that orders the data by year.
b. Circle the years in your table that had fewer than 100,000 cases of whooping cough.
c. Based on this data, would you expect 1956 to have closer to 50,000 cases or closer to 100,000 cases?
2. In volleyball statistics, a block is recorded when a player deflects the ball hit from the opposing team. Additionally, scorekeepers often keep track of the average number of blocks a player records in a game. Here is part of a table that records the number of blocks and blocks per game for each player in a women’s volleyball tournament. A scatter plot that goes with the table is also shown.
Label the axes of the scatter plot with the necessary information.


Review Problems
3. A cylinder has a radius of 4 cm and a height of 5 cm. What is the volume of the cylinder?
4. The graph of a relation is shown on the coordinate plane.
a. Identify the domain of the relation.
b. Identify the range of the relation. x y
Unit 7, Lesson 10: Plotting Data
Warm-Up: The Giant Panda
A giant panda lives in a zoo. What does the point on the graph tell you about the panda?

Exploration Activity: Gathering Data
Are older students always taller? Do taller students tend to have bigger hands? To investigate these questions, the class will gather data.
• A person’s arm span is the distance between the tips of their index fingers, when their arms are fully spread out.
• A person’s hand span is the distance from the tip of their thumb to the tip of their little finger, when their fingers are fully spread out.
1. Each partner should:
Measure the other partner’s height, arm span and hand span for their right hand to the nearest centimeter (cm).
Record the other partner’s measurements and age (in months) in the table.
2. One partner records the data from your table in a table of data for the entire class.
Exploration Activity: Scatter Plots
Work with your partner to create a scatter plot using the data collected in the previous activity.
1. Label the axes with the 2 variables of data collected.


2. Choose a color, and use it to plot a point on the coordinate plane that represents your own height and hand span. Then, in the same color, plot a second point that represents your partner’s height and hand span.
3. In a different color, plot the height and hand span of each student in your class, making a scatter plot of the heights and hand spans for the entire class.
4. Based on your scatter plot, complete the following.
a. Explain whether taller students in your class tend to have bigger hands.
b. Explain whether hand span is a linear function of height.
Guided Activity: Weight and Fuel Efficiency
The table and scatter plot show weights, in kilograms (kg), and fuel efficiencies, in miles per gallon (mpg), of 18 cars.


1. Which point in the scatter plot represents car L’s measurements?
2. What is the fuel efficiency of the car with the greatest weight?
3. What is the weight of the car with the greatest fuel efficiency?
4. Car S weighs 1,912 kg and gets 16 mpg. On the scatter plot, plot a point that represents car S’s measurements.
5. Cars N and O, shown in the scatter plot, are made by the same company. Compare their weights and fuel efficiencies. Does anything surprise you about these cars?
6. A different company makes cars F and G. Compare their weights and fuel efficiencies. Does anything surprise you about these cars?
Lesson Summary
Histograms show how measurements of a single attribute are distributed. For example, a veterinarian saw 25 dogs in her clinic one week. She measured the height and weight of each dog.
The 2 histograms show how the weights of the dogs and the heights of dogs are distributed.


While the histograms show the distribution of each measurement, they do not give any evidence of a connection between a dog’s height and its weight.
Scatter plots can be used to investigate possible connections between 2 attributes. In this same example, each plotted point corresponds to one of the 25 dogs, and its coordinates represent the height and weight of that dog, where each point is an ordered pair (height, weight). Examination of the scatter plot shows a connection between height and weight for the dogs at this veterinary clinic.

Scatter plots are used to represent bivariate data because they show 2 measurements for each individual from a sample.
Bivariate data measures two characteristics of a population.
For example, the tallest dogs in this data set are 27 in., and one of those tallest dogs weighs about 75 lb., while the other weighs about 110 lb. This shows that dog weight is not a function of dog height, because there are 2 different outputs for the same input in the data set. While weight isn’t a function of height, the scatter plot shows a general trend that taller dogs tend to weigh more than shorter dogs. There are exceptions. For example, there is a dog in the data set that is 18 in. tall and weighs over 50 lb., and there is another dog that is 21 in. tall but weighs less than 30 lb.
When data is collected by measuring attributes like height, weight, area, or volume, the data is classified as numerical data (or measurement data), and the measurement is called a numerical variable.
Numerical data, also called measurement or quantitative data, are data where the values are numbers, measurements, or quantities.
Upcoming lessons will explore how to identify and describe trends and possible associations in bivariate numerical data that has been collected.
Practice Problems
1. Select all the representations that are appropriate for comparing bite strength to weight for different carnivores.
□ Histogram
□ Scatter plot
□ Dot plot
□ Table
□ Box plot
2. The average number of free throw attempts and points earned per game by 14 basketball players are shown in the table.
a. Create a scatter plot of this data on the coordinate plane. Be sure to label the axes.


b. Circle the point that represents the data for Player E.
c. What does the point (2.1, 18.6) represent?
d. In that same tournament, Player O on another team averaged 14.3 points and 4.8 free throw attempts per game. Plot a point on the graph that shows this information.
3. A cylinder has a volume of 36�� cubic centimeters (cu. cm) and height ℎ. Complete this table for the volume of cylinders with the same radius, in cm, but different heights.
Unit 7, Lesson 11: Exploring Trends in Scatter Plots
Warm-Up: Predict This
A scatter plot is shown that represents the relationship between the weight, in kilograms (kg), and fuel efficiency, in miles per gallon (mpg), of 20 different types of cars.
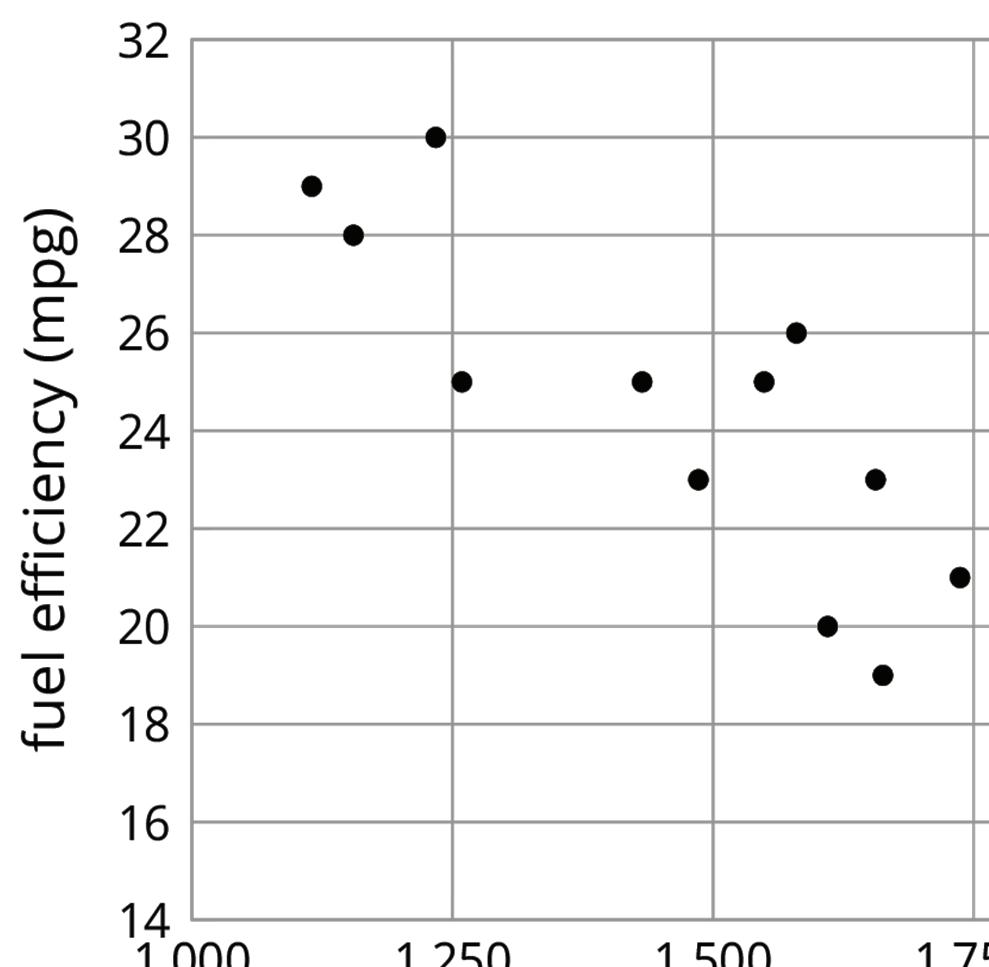


If a car weighs 1,750 kg, would you expect its fuel efficiency to be closer to 22 mpg or to 28 mpg? Explain your reasoning.
Guided Activity: Describing Associations in Scatter Plots
Four scatter plots are shown.
Scatter Plot A
Scatter Plot B
Scatter Plot C
Scatter Plot D
1. Using your knowledge of linear and nonlinear relationships, work with your partner to complete the table for the scatter plots shown.
2. Complete each statement.
a. The trend on scatter plot shows that as the age of a driver increases, the maximum distance, in feet (ft.), at which they can read a sign decreases. increases.
b. The trend on scatter plot shows that as the years have passed, the percentage of the US population that is overweight has decreased. increased.
Similar to the slope of lines, trends in bivariate numerical data are said to have a positive association if the ��- values increase as the ��-values increase. If the ��-values decrease as the ��-values increase, the data is said to have a negative association.
3. Work with your partner to complete the table for the scatter plots shown.
Scatter Plot(s) with a Positive Association
Scatter Plot(s) with a Negative Association
Scatter Plot(s) with No Association
Scatter plot A
Scatter plot B
Scatter plot A
Scatter plot B
Scatter plot A
Scatter plot B
Scatter plot C
Scatter plot D
Scatter plot C
Scatter plot D
Scatter plot C
Scatter plot D
If the points on the scatter plot closely follow a line or a curve, the association is described as strong. If the points on the scatter plot are more spread out, the association is described as weak.
4. Work with your partner to complete the table for the scatter plots shown.
Scatter Plot(s) with a Strong Association
Scatter Plot(s) with a Weak Association
Scatter plot A
Scatter plot B
Scatter plot A
Scatter plot B
Scatter plot C
Scatter plot D
Scatter plot C
Scatter plot D
Collaborative Activity: Describing Associations and Constructing Scatter Plots
The table shows the number of hits and home runs for professional baseball players on a specific team who had at least 45 hits in the 2019 Major League Baseball (MLB) regular season.
1. What range of data values needs to be represented along each axis to represent this data set?
Range of the Number of Hits
Range of the Number of Home Runs
2. Discuss with your partner which variable should be represented along each axis when constructing a scatter plot to represent this data.
3. Construct a scatter plot to represent the data by completing the following.
• Label the axes with the appropriate variables.
• Identify and label an appropriate scale for each axis on the grid.
• Plot a point for each pair of values in the data set.
4. Compare scatter plots with your partner. Discuss and resolve any differences, if necessary.
5. Work with your partner to describe the relationship between hits and home runs based on the data from the 2019 MLB regular season provided. Use at least 2 words from the word bank in your description.
decrease(s) increase(s) positive negative linear non-linear weak strong
Lesson Summary
Each point on a scatter plot represents a specific pair of values from the raw data. The ��- and ��-values are used to plot each data point on the coordinate plane. When all of the points in a data set are represented on a scatter plot, there are often trends, or patterns of association, that can be seen.
An association is a way to describe the form, direction, or strength of the relationship between the two variables in a bivariate data set. For numerical data, descriptions include linear or non-linear; positive or negative; strong or weak.
For associations that are linear, the term correlation is sometimes used interchangeably with association. In future courses, you’ll explore how to determine the value of a correlation to describe the strength of the relationship between 2 variables. In this course, the strength of an association is described as strong, weak, or no association. Patterns in a scatter plot that closely follow a line or curve are described as strong. When this trend becomes less clear, the association is described as weak. When no clear trend can be observed, there is no association between the variables.
Similar to the concepts explored when describing functions earlier in this course, associations can be described as positive or negative.
A positive association is a relationship between two quantities where one tends to increase as the other increases. In a scatter plot, the data points tend to cluster around a line with a positive slope.
A negative association is a relationship between two quantities where one tends to decrease as the other increases. In a scatter plot, the data points tend to cluster around a line with a negative slope.
Sometimes, a data point is far away from the other points or doesn’t fit a trend that all the other points follow. As with univariate data, these outliers also exist in bivariate data, as can be seen on some scatter plots.
Practice Problems
1. Three scatter plots are shown in the table. Determine if each scatter plot shows a positive association, negative association, or no association. Scatter Plot Association
2. Six scatter plots are shown in the table.
Scatter Plot A
Scatter Plot B
Scatter Plot C
Scatter Plot D


Scatter Plot E Scatter Plot F
Complete the table by selecting the scatter plot(s) that match(es) each description.
Strong Association
Weak Association
No Association
Scatter plot A
Scatter plot D
Scatter plot A
Scatter plot D
Scatter plot A
Scatter plot D
Scatter plot B
Scatter plot E
Scatter plot B
Scatter plot E
Scatter plot B
Scatter plot E
Scatter plot C
Scatter plot F
Scatter plot C
Scatter plot F
Scatter plot C
Scatter plot F
3. A car mechanic charges a flat rate of $100 and an additional $35 for each hour (hr.) of labor. How much would the mechanic charge to fix a car that requires 4 hr. of labor?
4. A scatter plot is shown that represents the ages of miniature Schnauzer puppies, in months, and their weights, in pounds (lb.), with one point labeled.
the meaning of the point (9, 15).
Unit 7, Lesson 12: Relating Associations in Data to Slope
Warm-Up: Estimating Slope
Estimate the slope of the line.


Exploration Activity: Describing Linear Associations
Three scatter plots are shown.
1. Complete the statements.
a. In scatter plot A, as mileage increases, tends to .
b. In scatter plot B, as increases, price tends to .
c. In scatter plot C, as increases, tends to .
Scatter Plot A


Scatter Plot B


Scatter Plot C


2. For each scatter plot shown, the line modeling the association between the variables is given, as well as the equation of the line.
a. What is the slope of the line in scatter plot D?
b. Interpret the slope of the line in scatter plot D in the context of the data.
c. What is the slope of the line in scatter plot E?
d. Interpret the slope of the line in scatter plot E in the context of the data.
e. What is the slope of the line in scatter plot F?
f. Interpret the slope of the line in scatter plot F in the context of the data.
Scatter Plot D �� = 5,520.619�� − 1,091.393


Scatter Plot E �� = −0.011�� + 40.604


Scatter Plot F �� = 0.59�� − 21.912


3. With your partner, discuss how the slope of the line modeling the relationship between the variables relates to the association of the variables. Summarize your discussion.
Collaborative Activity: Positive or Negative?
Five scatter plots labeled A–E are shown.


1. Which scatter plot(s) show evidence of a positive association between the variables?
2. Which scatter plot(s) show evidence of a negative association between the variables?
3. Which scatter plot(s) show no evidence of an association?
4. Suppose a line were used to model the association between the variables in each scatter plot. Complete the table by describing the slope of such a line for each scatter plot.
Lesson Summary
The scatter plot shows the relationship between the height, in inches (in.), and weight, in pounds (lb.), of 25 dogs at a veterinatry clinic. The scatter plot shows that taller dogs tend to weigh more than shorter dogs. Another way to say this is that weight tends to increase as height increases. When a scatter plot shows a positive association between 2 variables, an increase in one variable tends to mean an increase in the other.
This tendency can be quantified by using a line to model the relationship and then finding its slope. For example, the equation of the line modeling this relationship is �� = 4.27ℎ − 37, where ℎ is the height of the dog and �� is its predicted weight.
The slope of the line is 4.27, which means that for every 1 in. increase in a dog’s height, the dog’s weight tends to increase by 4.27 lb.


In the example of a car’s fuel efficiency, in miles per gallon (mpg), and the car’s weight, in kilograms (kg), the slope of the line shown to model the trend is −0.01.
The slope in this example means that for every 1 kg increase in the weight of the car, the fuel efficiency tends to decrease by 0.01 mpg. When a scatter plot shows a negative association between 2 variables, an increase in one variable tends to mean a decrease in the other.

Practice Problems
1. Which of these statements is true about the data in the scatter plot?
A. As �� increases, �� tends to increase.
B. As �� increases, �� tends to decrease.
C. As �� increases, �� tends to stay unchanged.
D. �� and �� are unrelated.
2. Here is a scatter plot that compares hits to at bats for players on a baseball team.
Describe the relationship between the number of at bats and the number of hits using the data in the scatter plot.


3. The linear model for some butterfly data is given by the equation �� = 0.238�� + 4.642, where �� is the wingspan of the butterfly in millimeters (mm), and �� is the length of the body of the butterfly in mm. Which statement best interprets the slope of the model?
A. For every 1 mm the wingspan increases, the body length of the butterfly increases 0.238 mm.
B. For every 1 mm the wingspan increases, the body length of the butterfly increases 4.642 mm.
C. For every 1 mm the body length of the butterfly increases, the wingspan increases 0.238 mm.
D. For every 1 mm the body length of the butterfly increases, the wingspan increases 4.642 mm.
Review Problem
4. Solve the equation 2(�� + 5) − 4 = �� + 7 for ��.


Unit 7, Lesson 13: Analyzing Scatter Plots
Warm-Up: Comparing Functions
Functions A and B are shown, each represented in a different way.
1. Explain which function has the larger ��-intercept.
2. Explain which function has the larger slope.
Collaborative Activity: Patterns of Association
1. Four scatter plots are shown.
a. Describe the direction of the linear association between the 2 variables in each scatter plot.
b. Explain which of the scatter plots does not belong based on the strength of the linear association between the 2 variables.
c. Discuss with your partner whether any of the scatter plots appear to have any outliers.
d. Explain which of the scatter plots appear to have a linear association.
Exploration Activity: Clustering
How are these scatter plots alike? How are they different?


Guided Activity: Patterns in Scatter Plots
1. Old Faithful geyser in Yellowstone National Park, Wyoming, is one of the most famous natural attractions in the park. The scatter plot shown represents the relationship between the geyser’s eruption time, in minutes, and wait time between eruptions, in minutes.
a. What do you notice or wonder about the data in the scatter plot?
b. Describe the association for the scatter plot between Old Faithful’s eruption times and wait times. Include any clusters and gaps in your description.
2. Two scatter plots are shown.
a. Select the words that describe the patterns of association for each scatter plot.
Patterns of Association of Scatter Plot N
Increasing Decreasing Outlier(s) Clusters
Gap(s) Positive association Negative association
b. Complete the statements.
Patterns of Association of Scatter Plot L
Increasing Decreasing Outlier(s) Clusters
Gap(s) Positive association Negative association
The data in Scatter Plot N includes an outlier, clusters and a gap, which means it may be useful to create another display without the outlier. separating the data into 2 plots.
The outlier clusters and gap in Scatter Plot L mean(s) that there is an extreme value a group of points that follows does not follow the pattern of the data.
Lesson Summary
Exploring data sets that have additional patterns such as clusters, gaps, or outliers can point to unique characteristics of a data set.
A group of data points that appear to follow a different pattern than the rest of the data is often described as a cluster.
A cluster is data that are in a close group on a scatter plot or univariate numerical data that have similar values.
When there are areas without data points, called gaps, clustering can also occur. Clusters can be identified when a group of data points is gathered closely around a specific value. For example, the scatter plot shows 2 clusters of data, which are circled in the image on the right.

Practice Problems
1. Literacy rate and population for the 12 countries with more than 100 million people are shown in the scatter plot. Circle any clusters in the data.


2. Here is a scatter plot.
Select all of the following that describe the association in the scatter plot.
□ Negative association
□ Positive association
□ Strong association
□ Weak association
□ No association
Review Problem


3. Here is a scatter plot of data for some of the tallest mountains on Earth.
The heights, in meters, and year of first recorded ascent is shown. Mount Everest is the tallest mountain in this set of data.
a. Estimate the height of Mount Everest.
b. Estimate the year of the first recorded ascent of Mount Everest.

Unit 7, Lesson 14: Digging Deeper into Relationships in Bivariate Data
Warm-Up: Notice and Wonder
1. What do you notice?
2. What do you wonder?


Collaborative Activity: Scatter Plot City
Your teacher will give you a set of cards. Each card shows a scatter plot.
1. Sort the cards into categories and describe each category.
2. Explain the reasoning behind your categories to your partner. Listen to your partner’s reasoning for their categories.
3. Sort the cards into two categories: positive associations and negative associations. Compare your sorting with your partner’s and discuss any disagreements.
4. Sort the cards into two categories: linear associations and non-linear associations. Compare your sorting with your partner’s and discuss any disagreements.
Guided Activity: Cause or Effect?
1. For each pair of variables, decide on the strength of the association between them and whether it is likely to be a causal relationship based on the context.
Variables
a. Number of snowplows owned by a city and jacket sales in the city Strong
b. Number of text messages sent by a person per day and number of shirts owned by the person
c. Price of a pizza and number of calories in the pizza
d. Amount of gas used on a road trip and number of miles driven on the trip
Causal Not causal
Causal Not causal
Causal Not causal
2. A news article shows a scatter plot with a negative relationship between the amount of sugar a person eats and their happiness level. The headline reads, “Eating Sugar Causes Happiness to Decrease!”
a. What is wrong with this claim?
b. What is a better headline for this information?
3. Describe a pair of variables with each condition. Explain your reasoning.
a. Two variables have a causal relationship.
b. The variables are strongly related, but a third factor might be the cause of the changes in the variables.
c. The variables are only weakly related.
Lesson Summary
People often collect data with 2 numerical variables to investigate possible associations between those variables and then use those associations to predict more values of the variables. Data analysis usually follows the steps below.
• Collect data.
• Organize and represent the data, and look for an association.
• Identify any outliers, and try to explain why these data points are exceptions to the trend that describes the association.
Many data sets show clear associations between the variables. However, not all relationships between 2 variables are causal. For example, one might expect to see a strong, positive association between the number of snowboard rentals and the sales of hot chocolate during the months of September through January in Colorado. This does not mean that an increase in snowboard rentals causes people to purchase more hot chocolate, nor does it mean that increased sales of hot chocolate cause people to rent more snowboards. More likely, there is a third variable, such as colder weather, that is causing both variables to increase at the same time.
A scatter plot can only show a relationship between 2 variables. To determine if the change in one variable causes the other to change, the context of the scenario must be examined. Even if a strong association can be shown between variables, this is not enough information to state that the variables have a causal relationship.
A causal relationship is one in which a change in one of the variables causes a change in the other variable.
Practice Problems
1. Here is a scatter plot.
Select all the following that describe the association in the scatter plot.
□ Linear association
□ Non-linear association
□ Positive association
□ Negative association
□ No association


2. Using the data in the scatter plot, what can you tell about the slope of a good model?

A. The slope is positive.
B. The slope is zero.
C. The slope is negative.
D. There is no association.
3. Using the data in the scatter plot, what is a reasonable slope of a model that fits this data?

A. −2.5
B. −1
C. 1
D. 2.5
Unit 8: Rational Numbers and Probability
Unit 8, Lesson 1: Converting Rational Numbers to Any Form
Warm-Up: Rational Numbers
1. For each problem, rate your confidence in your ability to complete the problem as stated. You do not need to actually complete the problems.
Use a scale from 1 to 5, where 1 means you don’t feel confident at all about how to complete the problem and 5 means you feel very confident.
Rewrite 2 2 5 in its equivalent decimal form.
Rewrite 0.625 as a fraction with the same value.
Rewrite 0.9 as an equivalent percentage.
Rewrite 75% in its equivalent decimal form.
Collaborative Activity: Rewriting Rational Numbers in Equivalent Forms
Rational numbers can be expressed as fractions, decimals, or percentages.
1. Andrés and Nayda are discussing how to write 17 20 as a decimal.
Andrés says he can use long division to divide 17 by 20 to get the decimal.
Nayda says she can write an equivalent fraction with a denominator of 100 by multiplying 17 20 by 5 5 and then writing the number of hundredths as a decimal.
a. Discuss each student’s strategy with your partner. Explain whether 1, both, or neither of these strategies would work.
b. Rewrite 17 20 in its equivalent decimal form. Show your work.
2. Complete the statement.
A percentage is a ratio that, when expressed as a fraction, has a denominator of because percent means “per .”
3. What percentage is equivalent to 17 20 ?
4. There are many strategies that can be used to rewrite rational numbers in different forms. Some of them are included in the table.
a. Work with your partner to match each phrase in the column on the left with a strategy in the column on the right. Draw arrows to indicate each match.
Rewriting Rational Numbers in Different Forms Strategy
To rewrite a fraction as a decimal, . . . . . . start by finding an equivalent fraction with a denominator of 100.
To rewrite a decimal as a fraction, . . .
To rewrite a fraction as a percentage, . . .
To rewrite a percentage as a fraction, . . .
To convert between decimals and percentages, . . .
. . . express it as a fraction out of 100, and simplify, if necessary.
. . . divide the numerator by the denominator.
. . . multiply or divide by 100.
. . . use the place value of the digits to express the decimal as a fraction.
b. Choose 1 phrase from the list on the left, and complete it using a different strategy than what you matched it with above. Your strategy can be different from those listed above.
Guided Activity: Rewriting Rational Numbers in Equivalent Forms
1. Complete the table by rewriting the fraction in its equivalent decimal form. Show your work in the space provided.
2. Complete the table by rewriting each decimal as an equivalent percentage.
3. What is the equivalent decimal form of 5 8 ?
4. What is 0.625 rewritten as a percentage?
5. What is 5 8 rewritten as a percentage?
6. When rewriting a fraction as a percentage, why might it be helpful to first rewrite it in its equivalent decimal form?
Lesson Summary
Rational numbers can be written in a variety of equivalent forms, including fractions, decimals, and percentages.
A rational number is a real number that can be expressed as a ratio of two integers.
• To rewrite a fraction as a decimal, divide the numerator by the denominator.
• To rewrite a decimal as a fraction, first identify the place value of the last digit. Then, use each digit in the decimal value as the numerator, and use the place value of the last digit as the denominator.
• To convert between decimals and percentages, use the fact that a percentage is 100 times the decimal and the decimal is 1 100 of the percentage.
Practice Problems
1. Complete the table by rewriting each value in its equivalent forms. The first row has been completed as an example.
2. For each rational number, rewrite it in the specified equivalent form.
a. 7 16 as a decimal
b. 0.35 as a simplified fraction
c. 0.275 as a percentage
3. Dora wrote 0.475 as a fraction, but she made an error. Her work is shown.
0.475 = 475 100 = 4 3 4
a. Explain Dora’s error.
b. Write the correct simplified fraction that is equivalent to 0.475.
Review Problems
4. Triangle ������ is shown on the coordinate plane.
Triangle ������ is dilated by a scale factor of 1 4 centered at the origin ��, resulting in the image ��′��′��′.
a. Complete the table with the vertices of the preimage and the image after the dilation.
b. Draw the image of ∆������ on the coordinate plane. Label the image ��′��′��′.
5. A relation is shown on the coordinate plane.
Complete the table of key features.
Key Features
��-intercept(s)
Domain Type Continuous Discrete
��-intercept Increasing interval(s)
Domain Decreasing interval(s)
Range Constant interval(s)
Unit 8, Lesson 2: Converting Repeating Decimals to Fractions
Warm-Up: Gone Fishing
1. Wayne and his dad have been fishing for 2 hours. In that time, they have caught 9 bluegills and 1 yellow perch.
a. The next time Wayne gets a bite, what kind of fish do you think it will be? Explain your reasoning.
b. Complete the table to represent the portion of the fish caught in the first 2 hours that were bluegills—as a fraction, as a decimal, and as a percentage.
Portion of Fish That Are Bluegills
Collaborative Activity: Repeating Decimals
1. Consider the fractions in the following table.
a. Rewrite each fraction in its equivalent decimal form. Then, indicate whether each decimal is a terminating or repeating decimal. If a decimal repeats digits in a pattern, use an ellipsis (. . .) to indicate that the pattern continues.
b. Circle the fractions in the table that are greater than 1. Then, rewrite each fraction as a mixed number.
c. Based on your work in part A, explain whether it is possible for a repeating decimal to ever terminate.
2. Isabel divided 85 by 99 to rewrite 85 99 in decimal form. She found the resulting pattern
0.858585 . . . Write 85 99 in its equivalent decimal form.
Guided Activity: Rewriting Repeating Decimals as Fractions
When given a repeating decimal, equations can be used to find its equivalent value represented as a fraction.
1. Consider the decimal 0.06. Some fraction, ��, is equivalent to 0.06. This can be represented by the equation �� = 0.06
a. If �� = 0.06, complete the step shown to determine what value is equivalent to 10��.
b. Complete the next steps to determine what value is equivalent to 100��.
0.06
c. These relationships can be used to find the value of �� represented as a fraction. Complete the steps shown.
d. Rewrite the solution as a fraction in the simplest form.
2. Consider the repeating decimal 0. 36.
a. If �� = 0. 36, complete each equation.
�� = 0. 36 10�� = 100�� =
b. Which 2 values, when subtracted, would result in the repeating portion of the decimal being eliminated?
c. Use 2 of the relationships represented in the equations in part A to complete the steps to find the fraction equivalent of 0. 36.
d. Rewrite the solution as a fraction in the simplest form, if possible.
Collaborative Activity: Rewriting Repeating Decimals as Fractions
3. Consider the repeating decimal 0.38.
a. If �� = 0. 38, complete each equation.
= 0. 38
b. Which 2 values, when subtracted, would result in the repeating portion of the decimal being eliminated?
c. Use 2 of the relationships represented in the equations in part A to complete the steps to find the fraction equivalent of 0. 38.
d. Rewrite the solution as a fraction in the simplest form, if possible.
e. Write the fraction or mixed number that is equivalent to 14.38.
Lesson Summary
Rational numbers can be written as a fraction, �� �� , where �� and �� are integers and �� ≠ 0, or written as a decimal. In decimal form, rational numbers either terminate or repeat. A number with a decimal that never ends but has a pattern that repeats infinitely is called a repeating decimal.
A repeating decimal has digits that keep going in the same pattern over and over. The repeating digits are marked with a line above them.
For example, the fraction 13 6 is expressed as 2.16 when written as a decimal because the 6 is the digit that repeats infinitely. Rewriting a repeating decimal as a fraction involves writing the repeated part of the number as part of an equation. Repeated decimals can be rewritten in equivalent forms of mixed numbers, fractions, and percentages.
The work to convert the number 4.25 into a mixed number is shown.
Let �� = 0.25.
Practice Problems
1. In a package of candies, Carmela found that 21% of them were red and 0.16 of them were green.
a. What fraction of the candies in the package were red?
b. What fraction of the candies in the package were green?
2. Complete the table with the equivalent fraction in lowest terms for each decimal.
Fraction
3. Benito was converting the repeating decimal 0.34 to a fraction, but he made an error. His work is shown.
0.34
a. Explain where Benito first made an error.
b. Determine the correct fraction that is equivalent to 0.34.
4. Triangle ������ is shown on the coordinate plane.
x
a. Rotate Δ������ 90° clockwise with the origin as the center of rotation. Label the image Δ��′��′��′.
5. Determine another way to describe the rotation performed in part A.
Unit 8, Lesson 3: Exploring Sample Space of Compound Events
Warm-Up: Equivalent Forms
1. Complete the table so each row shows the same value in 3 equivalent forms.
Exploration Activity: Exploring Repeated Processes
Consider the random event of flipping 2 fair coins and both coins landing on heads (HH).
1. Examine the discussion shown with your partner.
Raheim and Octavia are discussing their thoughts on how likely it is to get only heads when 2 fair coins are flipped.
• Octavia says, “The likelihood of both coins landing on heads when 2 coins are flipped is 1 2 . Because 1 2 of the outcomes when 1 coin is flipped are heads, then 1 2 of the outcomes when 2 coins are flipped will also be heads.”
• Raheim says, “I’m not exactly sure what the likelihood of both coins landing on heads when flipping 2 coins is, but I know it’s not 1 2 . When 2 coins are flipped, if the first coin is heads, the second coin could be heads or tails. In this case, 2 outcomes (HH and HT) are possible, but there are other potential outcomes outside of these. I’m just not sure how many more outcomes there are.”
Work with your partner to decide if you agree more with Raheim or with Octavia and why. Explain your thinking.
2. List the sample space of flipping a fair coin twice. On the first toss, the possible outcomes are heads and tails. On the second toss, the outcomes are also heads and tails.
3. Use the sample space to determine how likely it is to flip all heads when 2 coins are flipped. Create a ratio to compare the number of outcomes with only heads to the total number of outcomes in the sample space.
4. What if 3 fair coins are flipped? Consider how the sample space and the likelihood of flipping only heads change.
a. Make a prediction.
b. Work with your partner to determine the sample space when 3 fair coins are flipped.
c. Find the likelihood of flipping all heads when 3 fair coins are flipped.
d. Compare your work with that of another pair of students. Revise your work to make it more accurate, if necessary.
5. Work as a group of 4 to investigate how the sample space and the likelihood of flipping all heads change when 4 fair coins are flipped. Fill in the table with the information for flipping 1, 2, and 3 coins. Then, use the patterns observed to make predictions for flipping 4 coins.
Flipping a fair coin multiple times is an example of a repeated experiment. Each repetition—in this case, a coin toss—is called a trial.
Guided Activity: Tree Diagrams to Determine Sample Space
In addition to making a list, tree diagrams can also be used to determine the sample space for a repeated experiment.
1. A tree diagram that can be used to organize the possible outcomes when a fair coin is flipped 2 times is shown.
a. Complete the tree diagram by following the steps in the process described.
Fill in the possible outcomes for the first coin toss where indicated.
Fill in the possible outcomes for the second coin toss where indicated.
First toss:
Second toss:
b. Complete the sample space using the tree diagram.
{HH, , , }
c. Complete the table.
Experiment
Flipping a fair coin 2 times
Number of Outcomes in the First Step
Number of Outcomes in the Second Step
Total Number of Outcomes in the Sample Space
Process
Tree Diagram
2. Suppose a fair coin is tossed 3 times.
a. Create a tree diagram to determine the sample space of flipping a fair coin 3 times.
b. How many outcomes are in the sample space?
Experiment Number of Outcomes in the First Step
Number of Outcomes in the Second Step Number of Outcomes in the Third Step
Total Number of Outcomes in the Sample Space
Flipping a fair coin 2 times
c. Consider event A is flipping all heads. How many outcomes are possible in event A?
d. Consider event B is flipping exactly 1 head. How many outcomes are possible in event B?
Tree diagrams can also be set up horizontally.
3. The sample space for rolling a fair six-sided numbered cube 2 times can be displayed in a tree diagram. Complete the tree diagram for rolling a 3 on the first roll. Then, add to the list of outcomes for the 2 rolls.
1,1 1,2 1,3 1,4 1,5 1,6 2,1 2,2 2,3 2,4 2,5 2,6 3
This tree diagram only shows half of the sample space because it does not include the outcomes for rolling a 4, 5, or 6 on the first roll, yet it fills at least half a page. Even though a tree diagram can take up a lot of space, they are especially useful because they can be used to determine the sample space for repeated experiments with any number of steps, not just 2 steps.
Lesson Summary
Compound events are comprised of multiple random events. Compound events can occur during repeated experiments.
A repeated experiment is a random experiment done with the same conditions and parameters as a previous one.
There are multiple methods for determining the sample space for compound events.
In a probability model for a random process, the sample space is a list of the individual outcomes that are to be considered.
Two such methods explored in this lesson are a list of outcomes and a tree diagram. Both of the representations include all the possible combinations of outcomes from the multiple events. The tree diagram is a display that organizes all the possible outcomes of repeated experiments by using branches to help visualize the sample space. Each branch of the tree diagram represents 1 possible combination of outcomes. Another method of organizing the sample space for compound events is to use outcome tables, which will be explored in the next lesson.
Practice Problems
Marianne and 3 of her friends are playing a game that requires them to spin the spinner shown, and then roll a fair six-sided number cube on each person’s turn to play.
1. Determine the number of outcomes in the sample space in each scenario.
a. The spinner is spun once.
b. A fair six-sided number cube is rolled once.
c. The spinner is spun, and then a six-sided number cube is rolled.


Blue Red Yellow
2. Use a tree diagram to determine the sample space for the game Marianne is playing with her friends.
3. Write out the sample space for 1 player’s turn.
Review Problem
4. A rule mapping �� to �� is shown.

Complete the table of values using the rule.
Multiply the input by 2 and then add 3 x y
Unit 8, Lesson 4: Keeping Track of All Possible Outcomes
Warm-Up: Flipping Chips
1. The integer chips shown each have a yellow side to represent a positive integer and a red side to represent a negative integer.
Complete the table for the random process shown.
Exploration Activity: Exploring Outcome Tables
Another way to organize the outcomes in a sample space is with an outcome table.
One limitation of an outcome table is that it cannot be used to determine the sample space of experiments with more than 2 steps.
An outcome table showing the possible outcomes when a coin is flipped 2 times is shown.
Because there are 6 possible outcomes when a standard six-sided number cube is rolled, the outcome table for rolling 2 six-sided number cubes needs to be 6 by 6.
1. In the outcome table shown, the numbers 1–6 in the second column from the left represent the possible outcomes when the first six-sided number cube is rolled.
a. Complete the gray row to represent the possible outcomes from rolling the second number cube.
The pairs of numbers in the first white row of the outcome table represent all outcomes that can occur when a 1 is rolled on the first number cube. The outcome (1, 3) means the first number cube rolled is a 1, and the second number cube rolled is a 3.
b. Complete the next row of the outcome table to show the possible outcomes when a 2 is rolled on the first number cube.
c. What patterns do you see in the outcome table at this point?
d. Work with your partner to complete the rest of the outcome table.
e. When your outcome table is complete, find another pair of students to check your work with. Revise your work, if necessary.
2. Complete the table.
Experiment
Rolling a fair six-sided number cube 2 times
Number of Outcomes in the First Step
Number of Outcomes in the Second Step
Total Number of Outcomes in the Sample Space
3. Consider event �� = rolling the same number on both number cubes. How many outcomes are in event ��?
Collaborative Activity: Lists, Tables, and Trees
Consider the experiment: Flip a coin, and then roll a number cube.
Elena, Kiran, and Priya each use a different method for finding the sample space of this experiment.
• Elena carefully writes a list of all the options: Heads 1, Heads 2, Heads 3, Heads 4, Heads 5, Heads 6, Tails 1, Tails 2, Tails 3, Tails 4, Tails 5, Tails 6.
• Kiran makes a table:
• Priya draws a tree with branches in which each pathway represents a different outcome:
1. Compare the three methods. What is the same about each method? What is different? Be prepared to explain why each method produces all the different outcomes without repeating any.

2. Which method do you prefer for this situation?
Pause here so your teacher can review your work.
3. Find the sample space for each of these experiments using any method. Make sure you list every possible outcome without repeating any.
a. Flip a dime, then flip a nickel, and then flip a penny. Record whether each lands heads or tails up.
b. Han’s closet has: a blue shirt, a gray shirt, a white shirt, blue pants, khaki pants, and black pants. He must select one shirt and one pair of pants to wear for the day.
c. Spin a color, and then spin a number.

d. Spin the hour hand on an analog clock, and then choose a.m. or p.m.
Collaborative Activity: How Many Sandwiches
1. A submarine sandwich shop makes sandwiches with one kind of bread, one protein, one choice of cheese, and two vegetables. How many different sandwiches are possible? Explain your reasoning. You do not need to write out the sample space.
• Breads: Italian, white, wheat
• Proteins: Tuna, ham, turkey, beans
• Cheese: Provolone, Swiss, American, none

• Vegetables: Lettuce, tomatoes, peppers, onions, pickles
2. Andre knows he wants a sandwich that has ham, lettuce, and tomatoes on it. He doesn’t care about the type of bread or cheese. How many of the different sandwiches would make Andre happy?
3. If a sandwich is made by randomly choosing each of the options, what is the probability it will be a sandwich that Andre would be happy with?
Lesson Summary
When working with probability, it’s often helpful to have a systematic way to count the number of outcomes that are possible in a given situation. For example, suppose there are 3 people (A, B, and C) who want to run for president of a school club and 4 different people (1, 2, 3, and 4) who want to run for vice president of the club. A tree diagram, a table, or an ordered list can be used to count how many different combinations are possible for a president to be paired with a vice president.
With a tree diagram, start with a branch for each of the people who want to be president. Then, for each possible president, add a branch for each possible vice president, for a total of 3 ⋅ 4 = 12 possible pairs. The tree diagram can also be built by selecting a vice president first and then adding a branch for each possible president, for a total of 4 ⋅ 3 = 12 possible pairs.

An outcome table is another useful way to list and organize all possible outcomes. The table shows the same result of possible outcomes.
An ordered list can also be used to represent all the possible outcomes.
{A1, A2, A3, A4, B1, B2, B3, B4, C1, C2, C3, C4}
Practice Problems
1. Noah is planning his birthday party. Here is a tree showing all of the possible themes, locations, and days of the week that Noah is considering.
a. How many themes is Noah considering?
b. How many locations is Noah considering?
c. How many days of the week is Noah considering?
d. One possibility that Noah is considering is a party with a space theme at the skating rink on Sunday. Write two other possible parties Noah is considering.

e. How many different possible outcomes are in the sample space?
2. For each event, write the sample space and tell how many outcomes there are.
a. Lin selects one type of lettuce and one dressing to make a salad.
• Lettuce types: iceberg, romaine
• Dressings: ranch, Italian, French
b. Diego chooses rock, paper, or scissors, and Jada chooses rock, paper, or scissors.
c. Spin these 3 spinners.

Review Problem
3. Determine the number of outcomes in the sample space in each scenario.
a. Spinning a spinner with 5 equal sections once
b. Flipping a fair coin with sides heads and tails
c. Spinning a spinner with 5 equal sections and then flipping a fair coin with sides heads and tails
Unit 8, Lesson 5: Compound Events
Warm-Up: True or False?
Is each equation true or false? Explain your reasoning.
= (8 + 8 + 8 + 8) ÷ 3
+ 10 + 10 + 10 + 10) ÷ 5 = 10
(6 + 4 + 6 + 4 + 6 + 4) ÷ 6 = 5
Exploration Activity: Spinning a Color and Number
The other day, you wrote the sample space for spinning each of these spinners once.
What is the probability of getting:
and 3?
and any odd number?
Any color other than red and any number other than 2?
1. 8
2. (10
3.
1. Green
2. Blue
3.
Collaborative Activity: Cubes and Coins
The other day you looked at a list, a table, and a tree that showed the sample space for rolling a number cube and flipping a coin.
1. Your teacher will assign you one of these three structures to use to answer these questions. Be prepared to explain your reasoning.
a. What is the probability of getting tails and a 6?
b. What is the probability of getting heads and an odd number?
Pause here so your teacher can review your work.
2. Suppose you roll two number cubes. What is the probability of getting:
a. Both cubes showing the same number?
b. Exactly one cube showing an even number?
c. At least one cube showing an even number?
d. Two values that have a sum of 8?
e. Two values that have a sum of 13?
3. Jada flips three quarters. What is the probability that all three will land showing the same side?
Collaborative Activity: Pick a Card
Imagine there are 5 cards. They are colored red, yellow, green, white, and black. You mix up the cards and select one of them without looking. Then, without putting that card back, you mix up the remaining cards and select another one.
1. Write the sample space and tell how many possible outcomes there are.
2. What structure did you use to write all of the outcomes (list, table, tree, something else)? Explain why you chose that structure.
3. What is the probability that:
a. You get a white card and a red card (in either order)?
b. You get a black card (either time)?
c. You do not get a black card (either time)?
d. You get a blue card?
e. You get 2 cards of the same color?
f. You get 2 cards of different colors?
Lesson Summary
Consider an experiment where 2 bags contain blocks that each feature a moon or a star. One bag contains 1 star block and 4 moon blocks. The other bag contains 3 star blocks and 1 moon block.

When 1 block is selected at random from each bag, what is the probability that 2 star blocks or 2 moon blocks will be drawn?
To answer this question, a sample space display may be helpful. Consider creating a table or a tree diagram to represent drawing a block from the first bag and a block from the second bag. A tree diagram for this compound event is shown.

There are 5 ⋅ 4 = 20 possible outcomes. Of these, 3 of them are both stars, and 4 are both moons. Therefore, the probability of drawing 2 star blocks or 2 moon blocks is 7 20.
The probability of a chance event is a number from 0 to 1 that expresses the likelihood of the event occurring, with 0 meaning it will never occur and 1 meaning it will always occur.
In general, if all outcomes in an experiment are equally likely, then the probability of an event is the fraction of outcomes in the sample space for which the event occurs. Remember, probabilities can be expressed as decimals, fractions, or percentages.
Practice Problems
1. A vending machine has 5 colors (white, red, green, blue, and yellow) of gumballs and an equal chance of dispensing each. A second machine has 4 different animalshaped rubber bands (lion, elephant, horse, and alligator) and an equal chance of dispensing each. If you buy one item from each machine, what is the probability of getting a yellow gumball and a lion band?
2. The numbers 1 through 10 are put in one bag. The numbers 5 through 14 are put in another bag. When you pick one number from each bag, what is the probability you get the same number?
3. When rolling 3 standard number cubes, the probability of getting all three numbers to match is 6 216. What is the probability that the three numbers do not all match? Explain your reasoning.
Review Problem
4. For each event, write the sample space and tell how many outcomes there are.
a. Roll a standard number cube. Then flip a quarter.
b. Select a month. Then select 2020 or 2025.
Unit 8, Lesson 6: Calculating Theoretical Probability of Compound Events
Warm-Up: Error Analysis
1. A spinner is shown with each section labeled.
a. What do you notice?
b. Explain what’s wrong with the spinner as shown.
Guided Activity: Determining Probability
Probability can be used to better understand random processes. One way to analyze a random process is by calculating the theoretical probability of the events in a sample space.
1. Samaria plays a game that involves rolling 2 fair six-sided number cubes.
a. Determine the outcomes in the sample space for the game.
b. Samaria only wins if she rolls a sum of 9 or more. How many of the outcomes will result in a win?
c. Because each outcome in the sample space is equally likely, a ratio can be created to compare the outcomes with a sum greater than or equal to 9 to the total number of outcomes.
P(Sum _ 9) = > the number of ways to get a sum _ 9 > = the total number of outcomes in the sample space
This ratio represents the probability of Samaria winning.
d. Complete the statement.
The probability Samaria wins the game, represented as a fraction, is because there are possible winning outcomes out of total possible outcomes for rolling the 2 six-sided number cubes.
e. Write the probability of winning as a fraction, a decimal rounded to the nearest hundredth, and a percentage rounded to the nearest tenth.
Collaborative Activity: Calculating Theoretical Probability
1. Megan places 3 red marbles, 3 blue marbles, 3 yellow marbles, and 3 orange marbles in a bag. A representation of the marbles is shown.
a. What are the possible outcomes of randomly choosing 1 marble?
b. How many outcomes are in the sample space when choosing 2 marbles, with replacement?
c. Write the sample space for choosing 2 marbles from the bag, with replacement.
d. Are all outcomes equally likely when choosing 2 marbles, with replacement? Explain your reasoning.
e. Let event �� = 2 marbles of the same color are chosen. How many outcomes are in event ��?
f. What is the probability of choosing 2 marbles of the same color, ��(��)?
2. A fair coin with 1 pink side and 1 blue side and a fair spinner are shown.
Y G R
a. If the coin is tossed and the spinner is spun, how many outcomes are in the sample space?
b. Write the sample space.
c. What is the probability that both land on blue, B?
d. If the coin is tossed 8 times, how many outcomes are in the sample space?
e. What is the probability that the coin lands on pink all 8 times?
Lesson Summary
To calculate a theoretical probability, think through the random process, and use the sample space to determine the probability of certain events in the sample space.
Theoretical probability is a number between 0 and 1 that represents the likelihood of an event in a theoretical model based on a sample space. If all outcomes in the sample space are equally likely, then the theoretical probability of an event is the ratio of the number of outcomes in the event to the number of outcomes in the sample space.
As a strategy to determine the probability of random events, consider using a representation such as a tree diagram, a list of outcomes, or an outcome table. Use the sample space to determine the total number of outcomes as well as the total possible outcomes for the events of interest.
probability of event A = number of outcomes of event A total number of outcomes
Practice Problems
1. A dreidel is a four-sided spinning top, played with during the Jewish holiday of Hanukkah. Each side has a letter of the Hebrew alphabet: נ (nun), ג (gimel), ה (hey), and ש (shin).
David presents a new game to his friends involving a dreidel and a fair coin. If the dreidel lands on ה (hey) and the coin lands on heads or the dreidel lands on ג (gimel) and the coin lands on tails, the player wins.
a. Define the sample space.
b. How many outcomes result in a win?
c. What is the probability that a player wins?
2. A food stand has a special of 1 main course and 1 side for $6.99. A customer can choose a hamburger, a hot dog, a chicken sandwich, or a veggie burger for a main course, and fries, coleslaw, or a fruit cup for a side. Liana can’t decide what to order, so she decides to choose randomly.
a. How many outcomes are in the sample space for 1 main course and 1 side?
b. How many outcomes have a hamburger as the main course?
c. What is the probability that Liana chooses a hamburger as the main course of her special?
Review Problems
3. Triangle ������ is dilated using point �� as the center to form ∆��′��′��′ as shown.
a. Determine the scale factor for the dilation.
b. Find the length of ��′��′.
4. Manny is solving the linear equation
2(�� − 4) + 1 = 2�� + 3. To find the solution, Manny graphed the equations �� = 2(�� − 4) + 1 and �� = 2�� + 3 on the coordinate plane, as shown.
Based on Manny’s graph, explain whether the equation has 1 solution, no solution, or infinitely many solutions. If the equation has 1 solution, find it.
Unit 8, Lesson 7: Probability of Compound Independent and Dependent Events
Warm-Up: Probability with Jelly Beans
1. A bag of jelly beans contains 10 red, 7 blue, 8 green, and 5 orange jelly beans. A jelly bean is randomly selected from the bag. Determine the probability of each of these jelly beans being randomly selected.
a. Red
b. Orange
c. Green or red
d. Not blue
Guided Activity: Independent and Dependent Events
Random events can occur in different scenarios. Sometimes compound events can be described as being completed with replacement. This statement means that after the first random event is completed, such as pulling a card from a deck or selecting an object from a group of objects, the selected object is placed back into the original group of objects before the next random event is completed. When compound events are described as without replacement, it means that the selected object is not included in the possible selection of the next event.
Three marbles are placed in a bag, as shown, with 2 red marble and 1 blue marble.
1. A partial tree diagram is shown for pulling 2 marbles from the bag with replacement.
R B
Ra. Complete the tree diagram for pulling 2 marbles from the bag with replacement.
b. Use the tree diagram to list all the possible outcomes from the experiment.
c. What is the probability of pulling a red marble on the second pull when the marbles are pulled with replacement?
d. What is the probability of pulling 2 red marbles with replacement?
2. A partial tree diagram is shown for pulling 2 marbles from the bag without replacement.
RBR
a. Complete the tree diagram for pulling 2 marbles from the bag without replacement.
b. Use the tree diagram to list all the possible outcomes for the experiment.
c. What is the probability of pulling a red marble on the second pull when the marbles are pulled without replacement?
d. What is the probability of pulling 2 red marbles without replacement?
3. Explain whether the probabilities of pulling 2 red marbles with and without replacement are the same or different.
4. The events explored in problems 1 and 2 are considered independent and dependent events, respectively. Discuss with your partner the similarities and differences between dependent and independent events.
5. Complete the table by identifying 2 examples of compound dependent events and compound independent events from the compound events explored so far in this unit.
Dependent Events
Independent Events
Collaborative Activity: Probability of Compound Events
1. Two spinners are shown.
a. Create a sample space of all possible outcomes from spinning each spinner once.
b. What is the probability that at least 1 of the spinners lands on 2?
c. What is the probability that both spinners land on an odd number?
d. Explain whether spinning the 2 spinners are dependent or independent events.
2. A jewelry box has 5 different pairs of matching earrings.
a. What is the probability that 2 randomly selected earrings will match?
b. Explain whether randomly selecting 1 earring and then randomly selecting another earring are dependent or independent events.
3. Two cards are drawn from a standard deck of 52 playing cards. Of the 52 cards in a standard deck, half are red (hearts and diamonds), half are black (spades and clubs), and 12 are “face” cards (jacks, queens, and kings). Aces are considered to have a value of 1.


a. What is the probability of drawing a red card, keeping it, and then drawing a club?
b. What is the probability of drawing a 3, returning it to the deck, and then drawing a 10 from the deck?
c. What is the probability of drawing 2 red cards with replacement?
d. Explain which event(s) in parts A through C is (are) independent.
Collaborative Activity: Probability of Independent and Dependent Events
1. For each compound event described, determine whether the events are dependent or independent, and find the probability of the event.
Compound Event
Flip a coin 2 times. What is the probability that the coin will land on heads both times?
Roll 2 six-sided number cubes. What is the probability that both cubes land on a number greater than 4?
A teacher randomly selects 1 of her 10 students to answer a question on the board. The teacher then randomly selects another student of those remaining to answer a different question on the board.
A bag includes letter tiles that spell the word CHANCE. What is the probability that the first tile pulled is a consonant and the second tile pulled is a vowel, without replacement?
Dependent or Independent Probability of Event
Dependent Independent
Dependent Independent
Dependent Independent
Dependent Independent
Lesson Summary
Compound events can be classified as independent events or dependent events. Their classification depends on whether the probability of the second event is dependent on the outcome of the first event.
Independent events are two events from the same experiment for which the probability of one event is not affected by whether the other event occurs or not.
If events A and B are independent, then the probability of A and B occurring is the probability of A multiplied by the probability of B.
��(�� and ��) = ��(��) ⋅ ��(��) when A and B are independent events.
Dependent events are two events from the same experiment for which the probability of one event depends on whether the other event happens.
If events A and B are dependent, to find the probability of A and B occurring, use the tree diagram.
��(�� and ��) = ��(��) ⋅ ��(�� after ��) when A and B are dependent events.
Practice Problems
1. A game show contestant is spinning a wheel containing 50 equal sections. There are 2 sections labeled $1,000, 4 sections labeled $500, 1 section labeled Jackpot, and 3 sections labeled Bankrupt. If the player lands on Jackpot, they win $50,000, and if they land on Bankrupt, they lose all the money they’ve collected.
a. What is the probability that the contestant lands on $1,000 and then $500?
b. What is the probability that the contestant lands on Jackpot and then Bankrupt?
2. For each compound event described, determine if the events are independent or dependent.
Compound Event Independent or Dependent
Roll a six-sided number cube, and then toss a fair coin. Dependent Independent
Choose a person for a committee from a group of 10 people, and then choose a second person. Dependent Independent
Pull a letter from a bag containing the letters of the alphabet. Set it aside, and then choose a second letter.
Choose a flower from a group of flowers, and add it to a bouquet. Then, choose another flower to add to the bouquet.
Dependent Independent
Dependent Independent
Spin a spinner with 5 equal sections twice. Dependent Independent
3. A bag contains 2 blue marbles, 3 green marbles, 1 red marble, and 4 yellow marbles.
a. Determine the probability of randomly choosing a blue marble, replacing it in the bag, choosing a green marble, replacing it in the bag, and then choosing a yellow marble.
b. Determine the probability of randomly choosing a blue marble, setting it aside, choosing a green marble, setting it aside, and then choosing a yellow marble.
Review Problems
4. A vending machine has an equal chance of dispensing 4 different flavors of candy (grape, cherry, lemon, orange). A second vending machine has an equal chance of dispensing 5 different-colored rubber balls (red, blue, green, yellow, purple). If 1 item is purchased from each machine, what is the probability of getting a grape candy and a red ball?
5. Quadrilateral �������� is shown on the coordinate plane.
Translate quadrilateral �������� 5 units to the right and 1 unit down. Label the image
Unit 9: Pythagorean Theorem and Irrational Numbers
Unit 9, Lesson 1: The Areas of Squares and Their Side Lengths
Warm-Up: Two Regions
Which shaded region is larger? Explain your reasoning.


Find the area of each shaded square (in square units).


Exploration Activity: Estimating Side Lengths from Areas

1. What is the side length of square A? What is its area?
2. What is the side length of square C? What is its area?
3. What is the area of square B? What is its side length? (Use tracing paper to check your answer to this.)
4. Find the areas of squares D, E, and F. Which of these squares must have a side length that is greater than 5 but less than 6? Explain how you know.


Collaborative Activity: Making Squares
Your teacher will give your group a sheet with three squares and 5 cut out shapes labeled D, E, F, G, and H. Use the squares to find the total area of the five shapes. Assume each small square is equal to 1 square unit.
Lesson Summary
The area of a square with side length 12 units is 122, or 144 square units (sq. units).
The side length of a square with area 900 sq. units is 30 units, because 302 = 900.
When squares are placed on a coordinate grid, the area of the square can be determined using the side lengths along the grid. Sometimes the orientation of squares on a grid makes determining the side lengths difficult because the sides are not oriented along horizontal or vertical grid lines.
For example, while the side lengths of square �������� cannot be determined by counting grid lines, there are ways to compose and decompose the figure to determine its area.
One way is to enclose it in a square whose side lengths are horizontal and vertical, and therefore easier to determine using the grid. The outside square �������� has side lengths of 11 units, so its area is 121 sq. units. The area of each of the 4 triangles is 1 2 ⋅ 8 ⋅ 3 = 12 sq. units, so the area of all 4 triangles combined is 4 ⋅ 12 = 48 sq. units. To determine the area of the shaded square, find the difference between the area of the outside square and the combined area of the 4 triangles. Therefore, the area of the shaded square �������� is 121 − 48 = 73, or 73 sq. units.


Practice Problems
1. Find the area of each square. Each grid square represents 1 square unit.


2. Find the length of a side of a square if its area is:
a. 81 square inches (sq. in.)
b. 4 25 square centimeters (sq. cm)
c. 0.49 sq. units
d. ��2 sq. units
3. Find the area of a square if its side length is:
a. 3 inches (in.)
b. 7 units
c. 100 centimeters (cm)
d. 40 in.
e. �� units
Review Problems
4. Triangle ������ is shown on the coordinate plane.
Reflect ∆������ across the ��-axis. Label the image
∆��′��′��′.
5. Determine the slope of a line formed with each pair of points.
a. (−1, 5) and (2, 7)
b. (−4, 3) and (−5, 3)
c. (−3, 6) and (1, 2)
Unit 9, Lesson 2: Side Lengths and Areas
Warm-Up: Intersecting Circles
What do you notice? What do you wonder?

Exploration Activity: One Square
1. Use the circle to estimate the area of the square shown here.


2. Use the grid to check your answer to the first problem.


Guided Activity: The Sides and Areas of Tilted Squares
1. Find the area of each square and estimate the side lengths using your geometry toolkit. Then write the exact lengths for the sides of each square.


2. Complete the tables with the missing side lengths and areas.
3. Plot the points, (��, ��), on the coordinate plane shown here.
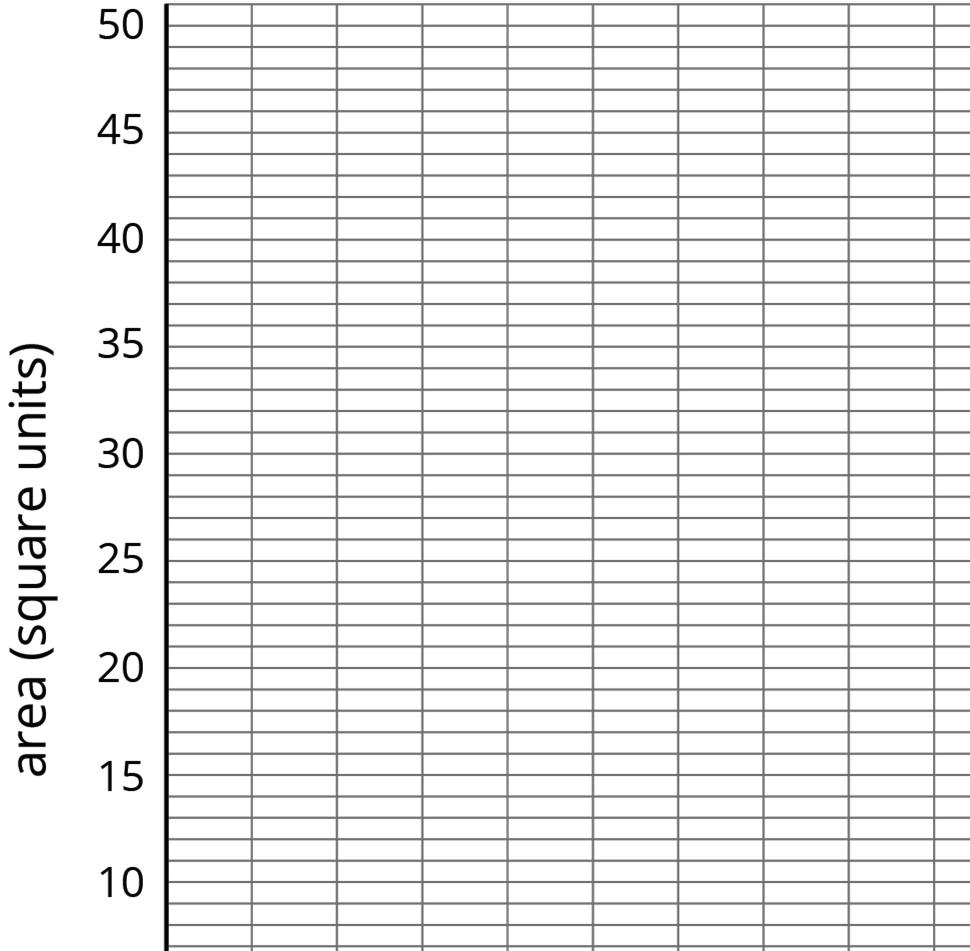

4. Use this graph to estimate the side lengths of the squares in the first question. How do your estimates from the graph compare to the estimates you made initially using your geometry toolkit?
5. Use the graph to approximate 45 .
Lesson Summary
The area of square �������� is 73 square units (sq. units).
Since the area is between 82 = 64 and 92 = 81, the side lengths must be between 8 units and 9 units. Tracing paper can be used to trace a side length and compare it to the grid, which also shows the side length is between 8 units and 9 units.

Determining the exact side length of the square involves using square roots.
The square root of a positive number �� is the positive number whose square is ��. It is also the side length of a square whose area is ��.
In order to write “the side length of a square whose area is 73 sq. units,” use the square root symbol, . “The square root of 73” is written 73 , and it means “the length of a side of a square whose area is 73 sq. units.”
The side length of a square with area of 73 sq. units is 73 units. This means that
� 73 �2 = 73.
For the squares shown, the following statements are also true.
• 9 = 3 because 32 = 9
• 16 = 4 because 42 = 16
• 10 units is the side length of a square whose area is 10 sq. units, and � 10 �2 = 10.

Practice Problems
1. A square has an area of 81 square feet (sq. ft.). Select all the expressions that equal the side length of this square, in feet (ft.).
2. Write the exact value of the side length, in units, of a square whose area, in sq. units, is:
3. Square A is smaller than Square B. Square B is smaller than Square C.
The three squares’ side lengths are 26 , 4.2, and 11 .
What is the side length of Square A? Square B? Square C? Explain how you know.

Review Problem
4. Find the area of a square if its side length is:
1 5 centimeters (cm)
3 7 units
11 8 inches (in.)
0.1 meters (m)
3.5 cm
a.
b.
c.
d.
e.
Unit 9, Lesson 3: Rational
and Irrational Numbers
Warm-Up: Algebra Talk: Positive Solutions
Find a positive solution to each equation.
Exploration Activity: Three Squares
1. Draw 3 squares of different sizes with vertices aligned to the vertices of the grid.

2. For each square:
a. Label the area.
b. Label the side length.
c. Write an equation that shows the relationship between the side length and the area.
Guided Activity: Looking for a Solution
Complete the table by determining whether each value could be a solution to the equation ��2 = 2, and provide a justification of your reasoning.
Collaborative Activity: Looking for Square Root of ��
A rational number is a fraction or its opposite (or any number equivalent to a fraction or its opposite).
1. Find some more rational numbers that are close to 2 .
2. Can you find a rational number that is exactly 2 ?
Lesson Summary
In the previous lesson, square root notation was used to write the length of the side of a square given its area. For example, a square with an area of 2 square units (sq. units) has a side length of 2 units, which means that 2 ⋅ 2 = 2.
A square whose area is 25 sq. units has a side length of 25 units, which means that 25 ⋅ 25 = 25. Since 5 ⋅ 5 = 25, it can be determined that 25 = 5.
Any rational number can be rewritten as a ratio of 2 integers. For example, 25 can be rewritten as 5 1 , showing that 25 is a rational number. Rational numbers can be positive or negative, so −5 is also a rational number.

A rational number is a real number that can be expressed as a ratio of two integers.
Rational numbers can be represented in different ways, such as fractions, decimals, positive, negative, zero, and roots. Recall from 7th grade that when represented as decimals, rational numbers either terminate or repeat in a pattern. Several examples of rational numbers are shown.
An irrational number is a number that is not rational.
An irrational number is a real number that cannot be expressed as a ratio of two integers.
2 is an example of an irrational number. It has a location on the number line, and its location can be approximated using rational numbers (it’s a tiny bit to the right of 7 5 ), but 2 cannot be found as a ratio of 2 integers. Several examples of irrational numbers are shown.
Every real number can be classified as either rational or irrational.
Practice Problems
1. Decide whether each number in this list is rational or irrational.
−13 3 , 0.1234, 37 , −77, − 100, − 12
2. Which value is an exact solution of the equation ��2 = 14?
7
B. 14
C. 3.74
Review Problems
3. A square has vertices (0,0), (5,2), (3,7), and (−2,5). Which of these statements is true?
A. The square’s side length is 5.
B. The square’s side length is between 5 and 6.
C. The square’s side length is between 6 and 7.
D. The square’s side length is 7.
A.
D. 3.74
4. The graph represents the area of arctic sea ice in square kilometers (sq. km) as a function of the day of the year in 2016.


a. Give an approximate interval of days when the area of arctic sea ice was decreasing.
b. On which days was the area of arctic sea ice 12 million sq. km?
Unit 9, Lesson 4: Square Roots on the Number Line
Warm-Up: Notice and Wonder: Diagonals
What do you notice? What do you wonder?
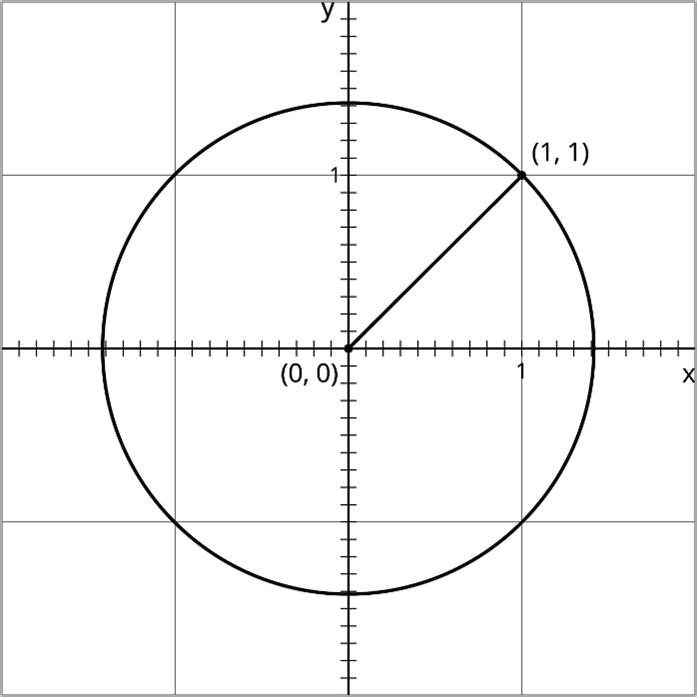
Exploration Activity: Squaring Lines
1. Estimate the length of the line segment to the nearest tenth of a unit (each grid square is 1 square unit (sq. unit).
2. Find the exact length of the segment.
Collaborative Activity: Square Root of ��
Diego said that he thinks that 3 ≈ 2.5.
1. Use the square to explain why 2.5 is not a very good approximation for 3 . Find a point on the number line that is closer to 3 . Draw a new square on the axes and use it to explain how you know the point you plotted is a good approximation for 3 .

2. Use the fact that 3 is a solution to the equation ��2 = 3 to find a decimal approximation of 3 whose square is between 2.9 and 3.1.
Lesson Summary
A line segment is shown on a grid. To estimate the length of the segment, consider drawing some circles using the grid lines. Based on the radius of the circles, the segment is longer than 2 units, but shorter than 3 units.


To find an exact value for the length of the segment, build a square on it, using the segment as 1 of the sides of the square. Using the grid lines, it can be determined that the area of the square shown is 5 square units (sq. units). Therefore, the exact length of the side of the square is 5 units.
Notice that 5 is greater than 4, but less than 9. That means that 5 is greater than 4 = 2, but less than 9 = 3. This makes sense because the estimate of the length of the segment is between 2 and 3 units.
Using a calculator can help approximate the value of 5 , where 5 ≈ 2.2360679775. Since 5 is an irrational number, it cannot be expressed as a ratio of 2 integers. A calculator will round irrational numbers to the number of places available on the display. Pay attention to rounding expectations when answering questions. When a question asks for an exact value, the answer should be written using a square root.

Practice Problems
1. Line segments ���� and ���� are shown on the coordinate grid.
a. Find the exact length of each line segment.
b. Estimate the length of each line segment to the nearest tenth of a unit. Explain your reasoning.

2. Plot each number on the ��-axis: 16 , 35 , 66 . Consider using the grid to help.

3. Use the fact that 7 is a solution to the equation ��2 = 7 to find a decimal approximation of 7 whose square is between 6.9 and 7.1.
Review Problem
4. The points (12,23) and (14,45) lie on a line. What is the slope of the line?
Unit 9, Lesson 5: Reasoning about Square Roots
Warm-Up: True or False: Squared
Decide if each statement is true or false. 1. � 5 �2 = 5
� 9 �2 = 3
7 = � 7 �2
� 10 �2 = 100
� 16 � = 22
Exploration Activity: Square Root Values
What two whole numbers does each square root lie between? Be prepared to explain your reasoning. 1. 7
Guided Activity: Solutions on a Number Line
The numbers ��, ��, and �� are positive, and ��2 = 3, ��2 = 16, and ��2 = 30.
1. Plot ��, ��, and �� on the number line. Be prepared to share your reasoning with the class.
2. Plot 2 on the number line.
2. 23 3. 50 4. 98
Lesson Summary
In general, the value of a square root can be approximated by observing the whole numbers around it on a number line, and remembering the relationship between square roots and squares. Some examples of approximating square roots are shown.
• 65 is a little more than 8 because 65 is a little more than 64 and 64 = 8.
• 80 is a little less than 9 because 80 is a little less than 81 and 81 = 9.
• 75 is between 8 and 9 because 75 is between 64 and 81.
• 75 is approximately 8.67 because 8.672 = 75.1689.
The number line shows the approximate values of the square roots plotted.
To find a square root between 2 whole numbers, use the perfect squares of the integers surrounding the square root to approximate it. For example, since 222 = 484 and 232 = 529, that means 500 is between 22 and 23. Since 500 is closer to 484 than 529, 500 should be plotted closer to 484 = 22 than 529 = 23.
Many calculators have a square root command, which makes it simple to find the approximate value of a square root. However, using the calculator, regardless of how many decimal places the square root is evaluated to, is still considered an approximation. The only exact square root is expressed using the square root symbol.
Approximating square roots without using a calculator will be explored in future lessons.
Practice Problems
1.
a. Explain how you know that 37 is a little more than 6.
b. Explain how you know that 95 is a little less than 10.
c. Explain how you know that 30 is between 5 and 6.
2. Plot each number on the number line. 6, 83 , 40 , 64 , 7.5

3. The equation ��2 = 25 has two solutions. This is because both 5 ∙ 5 = 25, and also −5 ∙ −5 = 25. So, 5 is a solution, and also −5 is a solution.
Select all the equations that have a solution of −4.
□ 10 + �� = 6
□ 10 − �� = 6
□ −3�� = −12
□ −3�� = 12
□ 8 = ��2
□ ��2 = 16
4. Each grid square represents 1 square unit. What is the exact side length of the shaded square?

Unit 9, Lesson 6: Finding Side Lengths of Right Triangles
Warm-Up: Which One Doesn’t Belong: Triangles
Which triangle doesn’t belong?

Collaborative Activity: Exploring Relationships in Right Triangles and Squares
1. A right triangle is shown with 3 squares on a grid.
a. The 3 squares from the diagram are shown. Complete the table with the area of each square.
b. Explain how the diagram shows that the area of the original green square plus the area of the original blue square is equal to the area of the original orange square.
c. Complete the relationship of the areas by filling in the box to create a mathematical statement that is true.
2. A blue square inscribed in a red square is shown.
a. A square inscribed in a square creates 4 right triangles. Discuss with your partner what you notice about the 4 triangles.
b. Discuss with your partner what you notice about the side lengths of the larger red square.
c. What is the area of the inner blue square?
d. What is the area of the larger red square?
The squares were broken down and rearranged to create a new image, as shown.
e. Discuss with your partner the similarities and differences between the 2 arrangements of the set of squares.
f. What is the total area of the 2 blue squares?
g. Explain how the area of the blue square in part C relates to the total area of the blue squares in part E.
h. Complete the relationship of the areas by filling in the box.
Guided Activity: Relationships in Right Triangles
In a right triangle, the side lengths that meet to form the right angle are called the legs of the right triangle. The side length opposite of the right angle is called the hypotenuse.
1. A right triangle is shown with 3 squares on a grid.
a. Use the squares that share a side length with the right triangle to determine the length of each leg of the right triangle.
b. Use the square that shares a side length with the hypotenuse of the right triangle to determine the length of the hypotenuse.
2. A square inscribed in a square is shown. Consider the 4 right triangles created by the inscribed square.
a. What are the lengths of the legs of each right triangle?
b. What is the length of the hypotenuse of each right triangle?
3. In the previous component, the following relationships were determined between the legs and hypotenuse of the right triangles.
32 + 42 = 52 and 52 + 122 = 132
Discuss with your partner how to describe the relationship between the lengths of the legs and the length of the hypotenuse in each right triangle.
4. Write a conjecture about the relationships between the hypotenuse and the 2 legs that create a right triangle.
5. A right triangle is shown.
Use your conjecture to complete the equation representing the relationship between the side lengths of the right triangle.
Lesson Summary
This lesson explored a special relationship between the side lengths of right triangles.
A right triangle is a triangle containing an interior right angle.
In a right triangle, the side opposite the right angle is called the hypotenuse, and the 2 other sides are called its legs.
The hypotenuse is the longest side of a right triangle, the side opposite the right angle.
The legs of a right triangle are the sides that make the right angle.
Four right triangles are shown with each triangle’s hypotenuse and legs labeled.
The letters �� and �� are often used to represent the lengths of the shorter sides of a triangle and �� to represent the length of the longest side of a triangle. If the triangle is a right triangle, then �� and �� are used to represent the lengths of the legs and �� is used to represent the length of the hypotenuse, since the hypotenuse is always the longest side of a right triangle.

For example, in the right triangle shown, �� and �� are legs and �� is the hypotenuse, where �� = 20 , �� = 5 , and �� = 5.

Additional right triangles are shown with adjacent squares equal to the length of each side of the right triangle.

Notice that for these examples of right triangles, the square of the hypotenuse is equal to the sum of the squares of the legs. In the first right triangle in the diagram, 9 + 16 = 25, in the second, 1 + 16 = 17, and in the third, 9 + 9 = 18.
Expressed another way, the rule of side lengths in all right triangles is ��2 + ��2 = ��2. This relationship is unique to right triangles and will be explored more in upcoming lessons.
Practice Problems
1. For each right triangle, label the legs �� and �� and the hypotenuse ��. a.
2. Here is a diagram of an acute triangle and three squares.
Priya says the area of the large unmarked square is 26 square units because 9 + 17 = 26. Do you agree? Explain your reasoning.
3. Use the areas of the two identical squares to explain why 52 + 122 = 132 without doing any calculations.


Review Problems
4. Order the following expressions from least to greatest.
5. Which is the best explanation for why 10 is irrational?
A. 10 is irrational because it is not rational.
B. 10 is irrational because it is less than zero.
C. 10 is irrational because it is not a whole number.
D. 10 is irrational because if I put 10 into a calculator, I get −3.16227766, which does not make a repeating pattern.
Unit 9, Lesson 7: The Pythagorean Theorem
Warm-Up: A Square and Four Triangles


What do you notice? What do you wonder?
Guided Activity: Pythagorean Theorem
In any right triangle, the sum of the squares of the legs is equal to the square of the hypotenuse. This is called the Pythagorean theorem.
The Pythagorean theorem is written ��2 + ��2 = ��2.
1. Use the word bank to complete the statements. Words or phrases can be used more than once or not at all.
b c
2 = 9 c2 = 25 b2 = 16
hypotenuse legs longer than longest meet at opposite shorter than shortest �� �� ��
For any right triangle, the is the side the right angle. It is always the side of the triangle. The are the sides that the right angle. They are always each the In the Pythagorean theorem, the hypotenuse is represented by the variable , while the legs are represented by the variables and
2. A triangle has side lengths of 24 units, 25 units, and 7 units.
a. Which side length is the hypotenuse of the triangle?
b. Which side lengths are the legs of the triangle?
c. If the Pythagorean theorem, ��2 + ��2 = ��2, is true, what can be concluded about the triangle?
d. Use the Pythagorean theorem to substitute the given side lengths for the appropriate values. Then, complete the statement.
A triangle with side lengths 24 units, 25 units, and 7 units is is not a right triangle.
3. Three students substituted the side lengths of the triangle into the Pythagorean theorem differently. Their work is shown.
a. Which student(s) correctly substituted the given side lengths for the appropriate values?
b. Discuss with your partner why the values for �� and �� are interchangeable.
The Pythagorean theorem can be used to determine a missing side length in a right triangle.
Jaleesa’s Work
Collaborative Activity: Let’s Take It for a Spin
Find the unknown side lengths in these right triangles.

Lesson Summary
The Pythagorean theorem represents a relationship between the side lengths of any right triangle such that the sum of the squares of the side lengths, �� and ��, is equal to the square of the hypotenuse, ��. It is expressed ��2 + ��2 = ��2.
The Pythagorean theorem describes the relationship between the side lengths of right triangles.
This is true for any right triangle. If the legs are �� and �� and the hypotenuse is ��, then ��2 + ��2 = ��2. This property can be used any time to verify that the 3 sides of a triangle will form a right triangle.
It is important to note that this relationship does not hold true for all triangles. Some triangles that are not right triangles are shown on the grid. Notice that the lengths of their sides do not have the special relationship ��2 + ��2 = ��2. That is, 16 + 10 does not equal 18, and 2 + 10 does not equal 16.

Practice Problems
1. Find the lengths of the unlabeled sides.


2. ��, ��, and �� represent the lengths of the three sides of this right triangle.
Select all the equations that represent the relationship between ��, ��, and ��.
□ ��2 + ��2 = ��2
□ ��2 = ��2 + ��2
□ ��2 = ��2 + ��2
□ ��2 + ��2 = ��2
□ ��2 + ��2 = ��2
□ ��2 + ��2 = ��2

3. Each number is between which two consecutive integers?
a. 10
b. 54
18
99
e. 41
c.
d.
Unit 9, Lesson 8: Finding Unknown Side Lengths
Warm-Up: Which One Doesn’t Belong: Equations
1. Which one doesn’t belong?
A. 32 + ��2 = 52
B. ��2 = 52 − 32
C. 32 + 52 = ��2
D. 32 + 42 = 52
Guided Activity: Solving for the Hypotenuse Using the Pythagorean Theorem
1. A right triangle with side lengths 6 and 8 is shown.
a. Complete the statement.
The unknown side length of the right triangle is the hypotenuse. one of the legs.
b. Use the Pythagorean theorem to substitute the given side lengths for the appropriate variables.
c. Solve the equation for the value of the missing variable.
2. For each triangle, complete the steps shown to find the length of the hypotenuse using the Pythagorean theorem. If the measure of the side length is an irrational value, write an exact solution and an approximate solution.
a. Right triangle ������ is shown, with side lengths 4 and 14. Description
State the Pythagorean theorem.
Substitute the known values.
Isolate the variable.
Find the exact solution. �� =
Find the approximate solution, if necessary. �� ≈
b. Right triangle ������ is shown, with side lengths √10 and √40.
the Pythagorean theorem.
Isolate the variable.
Find the exact solution. ��
Find the approximate solution, if necessary. ��
Collaborative Activity: Comparing �� Right Triangles
1. Triangles ������ and ������ are shown. Both triangles have 1 side with an unknown measurement.
a. How are the triangles similar?
b. How are the triangles different?
c. Work with your partner to write equations to determine the length of the missing side in each right triangle using the Pythagorean theorem. Triangle ������ Triangle ������
Collaborative Activity: Find the Missing Side Lengths
1. Triangle P with side lengths 8 and 26 is shown. Find ��.

2. A right triangle has sides of length 2.4 cm and 6.5 cm. What is the length of the hypotenuse?
3. A right triangle has a side of length 1 4 and a hypotenuse of length 1 3 . What is the length of the other side?
4. Find the value of �� in the figure.

Lesson Summary
There are many examples where the lengths of 2 legs of a right triangle are known and can be used to find the length of the hypotenuse with the Pythagorean theorem. If the length of the hypotenuse and the length of 1 leg are known, the Pythagorean theorem can also be used to find the length of the other leg.
A right triangle is shown, where 1 leg has a length of 5 units, the hypotenuse has a length of 10 units, and the length of the other leg is represented by ��.
To find the length of the unknown leg, start with the Pythagorean theorem, ��2 + ��2 = ��2, make substitutions, and solve for the unknown value.
+ ��2 = ��2

Use estimation strategies to determine that the length of the other leg is between 8 and 9 units since 75 is between 64 and 81. A calculator with a square root function may be used to determine the approximation of 75 ≈ 8.66. The exact length of �� is 75 units. The approximate length of ��, rounded to the nearest hundredth, is 8.66 units.
Practice Problems
1. Find the exact value of each variable that represents a side length in a right triangle.
2. Four right triangles are shown.

Match the triangle to the appropriate equation that could be used to solve for the missing side.
a. 82 + ��2 = 152 can be used to find the missing side in triangle .
b. 122 + 62 = ��2 can be used to find the missing side in triangle .
c. ��2 + 62 = 122 can be used to find the missing side in triangle .
d. 82 + 152 = ��2 can be used to find the missing side in triangle .
3. Find the measures of �� and �� in the diagram using the Pythagorean theorem.
Review Problem
4. What is the exact length of each line segment? Explain or show your reasoning. (Each grid square represents 1 square unit.)


Unit 9, Lesson 9: The Converse of the Pythagorean Theorem
Warm-Up: The Hands of a Clock
Consider the tips of the hands of an analog clock that has an hour hand that is 3 centimeters (cm) long and a minute hand that is 4 cm long.

Over the course of a day:
1. What is the farthest apart the two tips get?
2. What is the closest the two tips get?
3. Are the two tips ever exactly five centimeters apart?
Collaborative Activity: The Converse of the Pythagorean Theorem
The side lengths of 3 triangles are shown.
B
C
1. Discuss with your partner which sets of side lengths you think form a right triangle.
2. Test your prediction by using the Pythagorean theorem. Show your work in the space provided.
3. Work with your partner to complete the statement.
Triangle A
Triangle B
Triangle C is a right are right triangle(s) because .
Triangle A
Triangle B
Triangle C
Exploration Activity: Exploring Pythagorean Triples
1. Right triangle ������ is shown with leg lengths 3 and 4.
a. What is the length of the hypotenuse of the triangle?
b. Triangle ������ is dilated by a factor of 2 to form ∆������. What are the lengths of the sides of ∆������?
c. Use the Pythagorean theorem to verify whether ∆������ is a right triangle.
The 3 side lengths of a right triangle form what is called a Pythagorean triple when all 3 side lengths are positive integers.
2. Three Pythagorean triples are given in the table. Apply each given scale factor to determine the new side lengths of another right triangle.
3. Circle the sets of new side lengths that are also considered Pythagorean triples.
4. Discuss with your partner any patterns you see in the Pythagorean triples in the table.
5. Explain how familiar Pythagorean triples can be used to determine unknown side lengths of right triangles.
6. Consider a triangle with side lengths 3 5 , 4 5 , and 1 unit.
a. Determine whether the side lengths form a right triangle.
b. Complete the statements.
Using the familiar Pythagorean triple 3, 4, 5, a similar triangle with side lengths 3 5 , 4 5 , and 1 unit can be formed using a scale factor of .
The triangle with side lengths 3 5 , 4 5 , and 1 unit is also similar to a triangle with side lengths 9, , and 15 using a scale factor of .
Collaborative Activity: Calculating Legs of Right Triangles
1. Given the information provided for the right triangles shown here, find the unknown leg lengths to the nearest tenth.

2. The triangle shown here is not a right triangle. What are two different ways you change one of the values so it would be a right triangle? Sketch these new right triangles, and clearly label the right angle.

Lesson Summary
What if it isn’t clear whether a triangle is a right triangle or not? Consider the triangle shown.
It’s hard to tell just by looking if it is a right triangle, and it may be that the sides aren’t drawn to scale.
For a triangle with side lengths ��, ��, and ��, where �� is the longest of the 3, the converse of the Pythagorean theorem states that any time ��2 + ��2 = ��2, the triangle must be a right triangle.

The converse of the Pythagorean theorem states that if the lengths ��, ��, and �� of the 3 sides of a triangle satisfy the relationship ��2 + ��2 = ��2, then the triangle is a right triangle.
For example, since 82 + 152 = 64 + 225 = 289 = 172, any triangle with side lengths 8, 15, and 17 must be a right triangle.
Together, the Pythagorean theorem and its converse provide a one-step test for checking to see if a triangle is a right triangle just by using its side lengths. If ��2 + ��2 = ��2, it is a right triangle. If ��2 + ��2 ≠ ��2, it is not a right triangle.
Practice Problems
1. Determine if each set of side lengths forms a right triangle by using the converse of the Pythagorean theorem.
Side Lengths
8 inches (in.), 15 in., and 17 in.
12 cm, 35 cm, and 37 cm
9 ft., 16 ft., and 36 ft.
Yes No
Yes
Yes No
2. Which of these triangles are definitely right triangles? Explain how you know. (Note that not all triangles are drawn to scale.)


3. A right triangle has a hypotenuse of 15 cm. What are possible lengths for the two legs of the triangle? Explain your reasoning.

4. In each part, �� and �� represent the length of a leg of a right triangle, and �� represents the length of its hypotenuse. Find the missing length, given the other two lengths.
a. �� = 12, �� = 5, �� =?
b. �� =? , �� = 21, �� = 29
5. For which triangle does the Pythagorean Theorem express the relationship between the lengths of its three sides?

Unit 9, Lesson 10: Applications of the Pythagorean Theorem
Warm-Up: Closest Estimate: Square Roots
Which estimate is closest to the actual value of the expression? Explain your reasoning.
Exploration Activity: Cutting Corners
Mai and Tyler were standing at one corner of a large rectangular field and decided to race to the opposite corner. Since Mai had a bike and Tyler did not, they thought it would be a fairer race if Mai rode along the sidewalk that surrounds the field while Tyler ran the shorter distance directly across the field. The field is 100 meters (m) long and 80 m wide. Tyler can run at around 5 m per second (sec.), and Mai can ride her bike at around 7.5 m per sec.

1. Before making any calculations, who do you think will win? By how much? Explain your thinking.
2. Who wins? Show your reasoning.
Guided Activity: Applying the Pythagorean Theorem
The Pythagorean theorem can be used to find an unknown side length of any right triangle. It is often helpful to represent the problem using a diagram to determine which side length is unknown in a real-world situation.
1. A 12 foot (ft.) ladder leans against a vertical wall. The base of the ladder is 7 ft. from the bottom of the wall.
a. Label the diagram with the given information.
b. Use the Pythagorean theorem to determine how high the ladder reaches up the wall, to the nearest tenth of a foot.
2. A cable is being placed on level ground to support a tower. The cable is 17 ft. long and should be connected 15 ft. up the tower.
a. Represent the problem with a diagram labeled with the given information.
b. How far away from the bottom of the tower should the other end of the cable connect to the ground?
3. A soccer field is 115 yards (yd.) long by 70 yd. wide. What is the length of the diagonal of the soccer field?
a. Represent the problem with a diagram labeled with the given information.
b. Determine the length of the diagonal. Round to the nearest tenth.
4. Malik leaves his house and drives 7 miles (mi.) west. He then turns and drives 5 mi. north. How far away is he from his house? Round to the nearest tenth.
5. Audrey designs a 15 ft. slide from her bedroom window into her swimming pool. The end of the slide is 9 ft. from the base of her house. How high up is her window? Round to the nearest tenth.
Collaborative Activity: Applying the Pythagorean Theorem in ��-Dimensional Figures
1. Two rectangular prisms, K and L, are shown. The dimensions of each prism are given.
a. A diagonal connecting the bases of each prism is drawn within each prism. Predict which prism has a longer diagonal. The figures are not drawn to scale.
b. Discuss with your partner if there is enough information to find the length of the diagonals connecting the bases of each prism using the Pythagorean theorem. Summarize your discussion.
c. What other measurements must be calculated first to find the diagonal? Label these extra measurements on the figures.
d. Find the exact length of the diagonals of the base of each prism using the Pythagorean theorem.
e. Use the Pythagorean theorem to calculate the lengths of the diagonals connecting the bases of each prism. Which diagonal is longer?
Lesson Summary
The Pythagorean theorem can be used to solve any problem that can be modeled with a right triangle where the lengths of 2 sides are known and the length of the other side needs to be found.
For example, a 17 ft. cable is being placed on level ground to support a tower. The cable is connected 15 ft. up the tower. How far away from the bottom of the tower should the other end of the cable connect to the ground?
It’s often very helpful to draw a diagram of a situation, such as the one shown.
In a real-world situation like this, it can often be assumed that the tower makes a right angle with the ground for the structure to be stable. Since this is a right triangle, the relationship between its sides is ��2 + ��2 = ��2, where �� represents the length of the hypotenuse and �� and �� represent the lengths of the legs. The hypotenuse is the side opposite the right angle. Making substitutions gives ��2 + 152 = 172. Solving this for �� results in �� = 8. So, the other end of the cable should connect to the ground 8 ft. away from the bottom of the tower.

Practice Problems
1. A man is trying to zombie-proof his house. He wants to cut a length of wood that will brace a door against a wall. The wall is 4 feet away from the door, and he wants the brace to rest 2 feet up the door. About how long should he cut the brace?
2. At a restaurant, a trash can’s opening is rectangular and measures 7 inches (in.) by 9 in. The restaurant serves food on trays that measure 12 in. by 16 in. Jada says it is impossible for the tray to accidentally fall through the trash can opening because the shortest side of the tray is longer than either edge of the opening. Do you agree or disagree with Jada’s explanation? Explain your reasoning.
Review Problems
3. Select all the sets that are the three side lengths of right triangles.
4. A line contains the point (3,5). If the line has negative slope, which of these points could also be on the line?
A. (2,0)
B. (4,7)
C. (5,4)
D. (6,5)
Unit 9, Lesson 11: Finding Distances in the Coordinate Plane
Warm-Up: Closest Distance
1. Order the following pairs of coordinates from closest to farthest apart. Be prepared to explain your reasoning.
A. (2,4) and (2,10)
B. (−3,6) and (5,6)
C. (−12, −12) and (−12, −1)
D. (7,0) and (7, −9)
E. (1, −10) and (−4, −10)
2. Name another pair of coordinates that would be closer together than the first pair on your list.
3. Name another pair of coordinates that would be farther apart than the last pair on your list.
Exploration Activity: Finding Distance on the Coordinate Plane
Work with your partner to complete the following.
1. What is the distance between points �� and ��?
2. What is the distance between points �� and ��?
3. What strategy did you and your partner use to find the lengths of the horizontal and vertical lines?
4. A line segment connecting points �� and �� is shown.
a. On the coordinate plane, label the length of segment ����, ��.
b. Create a right triangle with hypotenuse �� by drawing the horizontal and vertical legs on the coordinate plane.
c. Label the legs �� and ��.
d. Apply the Pythagorean theorem to find the length of ��. Round to the nearest tenth, if necessary.
5. Discuss with your partner how to find the length of any diagonal on the coordinate plane.
6. Complete the statement.
The length of any diagonal line segment can be determined by using the diagonal line segment as the hypotenuse a leg of a right triangle, drawing the horizontal and
vertical hypotenuse, legs, and then applying the Pythagorean theorem. area formula.
Collaborative Activity: Perimeters with Pythagoras
1. Which figure do you think has the longer perimeter?


2. Select one figure and calculate its perimeter. Your partner will calculate the perimeter of the other. Were you correct about which figure had the longer perimeter?
Collaborative Activity: Finding the Right Distance
Have each person in your group select one of the sets of coordinate pairs shown here. Then calculate the length of the line segment between those two coordinates. Once the values are calculated, have each person in the group briefly share how they did their calculations.
• (−3, 1) and (5, 7)
• (−1, −6) and (5, 2)
• (−1, 2) and (5, −6)
• (−2, −5) and (6, 1)
1. How does the value you found compare to the rest of your group?
2. In your own words, write an explanation to another student for how to find the distance between any two coordinate pairs.
Lesson Summary
The Pythagorean theorem can be used to find the distance between any 2 points on the coordinate plane. For example, ���� is shown on the coordinate plane with �� at (−2, −3), and �� at (−8, 4). The length of ���� is the distance between points �� and ��.
Think of the distance between �� and ��, or the length of ����, as the hypotenuse of a right triangle. The lengths of the legs can be deduced from the coordinates of the points.

The length of the horizontal leg is 6, which can be seen in the second diagram, but it is also the distance between the ��- coordinates of �� and ��, since |-8 − -2| = 6. The length of the vertical leg is 7, which can be seen in the second diagram, but it is also the distance between the ��-coordinates of �� and ��, since |4 − -3| = 7.
Once the lengths of the legs are known, use the Pythagorean theorem to find the length of the hypotenuse, ����, which can be represented by ��. The work to determine the value of �� is shown.

62 + 72 = ��2
36 + 49 = ��2
85 = ��2
85 = ��
This length is a little longer than 9, since 85 is a little longer than √81. Using a calculator, it can be determined that 85 ≈ 9.22. Therefore, the exact length of ���� is 85 units, and the approximate length is 9.22 units.
Practice Problems
1. The right triangles are drawn in the coordinate plane, and the coordinates of their vertices are labeled. For each right triangle, label each leg with its length.


2. Find the distance between each pair of points. If you get stuck, try plotting the points on graph paper.
�� = (0, −11) and �� = (0, 2)
b. �� = (0, 0) and �� = (−3, −4)
c. �� = (8, 0) and �� = (0, −6)
a.
3. Determine the perimeter of the triangle shown on the coordinate plane. Round the answer to the nearest tenth.
Review Problem
4. Which line has a slope of 0.625, and which line has a slope of 1.6? Explain why the slopes of these lines are 0.625 and 1.6.

Unit 9, Lesson 12: Edge Lengths and Volumes
Warm-Up: Ordering Squares and Cubes
Let ��, ��, ��, ��, ��, and �� be positive numbers.
1. Given these equations, arrange ��, ��, ��, ��, ��, and �� from least to greatest. Explain your reasoning. □ ��2 = 9 □ ��3 = 8 □ ��2 = 10
��3 = 9
��2 = 8
��3 = 7
Exploration Activity: Name That Edge Length
Fill in the missing values using the information provided for the cube shown.

cu. in.
16 3
= 16
Collaborative Activity: Card Sort: Rooted in the Number Line
Your teacher will give your group a set of cards. For each card with a letter and value, find the two other cards that match. One shows the location on a number line where the value exists, and the other shows an equation that the value satisfies. Be prepared to explain your reasoning.
Lesson Summary
The side length of the square is the square root of its area. In this diagram, the square has an area of 16 units and a side length of 4 units.
The equations 42 = 16 and √16 = 4 are both true.

A solid cube with edge lengths of 4 units is shown. The cube has a volume, and the edge length of the cube is called the cube root of its volume.

The cube root of a number, ��, is the number whose cube is ��. It is also the edge length of a cube with a volume of ��. We write the cube root of �� as �� 3 .
The cube shown has a volume of 64 cubic units (cu. units) and an edge length of 4 units. The equations 43 = 64 and 64 3 = 4 are both true. 64 3 is read as “the cube root of 64” and is equal to 4. Some additional equations using cube roots are shown.
• 8 3 = 2 because 23 = 8.
• 27 3 = 3 because 33 = 27.
• 125 3 = 5 because 53 = 125.
Practice Problems
1. Determine the volume of a cube with each given edge length.
a. 4 centimeters (cm)
b. 11 3 feet (ft.)
c. �� units
2. Determine the edge length of a cube with each given volume.
a. 1,000 cubic centimeters (cu. cm)
b. 23 cubic inches (cu. in.)
c. �� cu. units
3. Complete each equation with an equivalent expression that doesn’t use a cube root symbol.
a. 1 3 = b. 216 3 = c. 8000 3 =
d. 1 64 3 = e. 27 125 3 = f. 0.027 3 = g. 0.000125 3 =
Review Problem
4. Here is a 15-by-8 rectangle divided into triangles. Is the shaded triangle a right triangle? Explain or show your reasoning.

Unit 9, Lesson 13: Cube Roots
Warm-Up: True or False: Cubed
Decide if each statement is true or false.
What two whole numbers does each cube root lie between? Be prepared to explain your reasoning.
Guided Activity: Solutions on a Number Line
The numbers ��, ��, and �� are positive, and:
= 5 ��3 = 27 ��3 = 700
1. Plot ��, ��, and �� on the number line. Be prepared to share your reasoning with the class.
2. Plot 2 3 on the number line.
Lesson Summary
Remember that square roots of whole numbers are defined as side lengths of squares. For example, 17 units is the side length of a square whose area is 17 square units (sq. units). Cube roots are defined similarly, but using cubes instead of squares. The number 17 3 , pronounced “the cube root of 17,” is the edge length of a cube that has a volume of 17 cubic units (cu. units).
The value of a cube root can be approximated by observing the whole numbers around it and remembering the relationship between cube roots and cubes. For example, 20 3 is between 2 and 3 since 23 = 8 and 33 = 27, and 20 is between 8 and 27. Similarly, since 100 is between 43 = 64 and 53 = 125, that means 100 3 is between 4 and 5. Many calculators have a cube root function that can be used to approximate the value of a cube root more precisely. Using the previous examples, a calculator will show that 20 3 ≈ 2.7144 and that 100 3 ≈ 4.6416.
Also like square roots, most cube roots of whole numbers are irrational. The only time the cube root of a number is a whole number is when the original number is a perfect cube.
Practice Problems
1. Find the positive solution to each equation. If the solution is irrational, write the solution using square root or cube root notation.
a. ��3 = 216 b. ��2 = 15
��3 = 8 d. ��3 = 343 e. ��3 = 181
2. For each cube root, find the two whole numbers that it lies between.
c.
3. Order the following values from least to greatest. 530 3 , 48 , ��, 121, 27 3 , 19 2
Review Problems
4. Find the value of each variable, to the nearest tenth.


5. A standard city block in Manhattan is a rectangle measuring 80 m by 270 m. A resident wants to get from one corner of a block to the opposite corner of a block that contains a park. She wonders about the difference between cutting across the diagonal through the park compared to going around the park, along the streets. How much shorter would her walk be going through the park? Round your answer to the nearest meter.
Unit 9, Lesson 14: Approximating Nonperfect Square and Cube Roots
Warm-Up: Rational and Irrational Numbers
1. Complete the table by filling in each box with a digit from 1 to 8, no more than once each, such that the value of the expression matches the given description.
Expression
Description
This is a rational number.
This is an irrational number.
This is a rational number and an integer.
This is a rational number with a terminating decimal expansion.
This is a rational number with a repeating decimal expansion.
Collaborative Activity: Error Analysis
Robin is learning about square roots. A question and her response are shown in the table. Because this is new for Robin, there are some mistakes in her response.
Question
Where would 116 be located on a number line?
Robin’s Response
Taking the square root is the inverse of squaring a number. Squaring a number is the same as raising it to the second power. To find the value of a square root, you divide the radicand by 2. The number line shows the location of 116 because 116 ÷ 2 = 58.
1. Discuss Robin’s response with your partner. Then, cross out any incorrect statements in her response.
2. Work with your partner to write a correct explanation of how to locate 116 on a number line.
3. Use the number line to plot and label a point to better approximate the location of 116 . Be sure to write an appropriate scale using the tick marks.
Exploration Activity: Square Roots of Nonperfect Squares
There are an infinite number of perfect squares in the real number system.
1. Complete the list of the first 15 perfect squares.
2. Check your answers with your partner.
The square roots of perfect squares are rational numbers because they can be expressed as a ratio of 2 integers.
Square roots of nonperfect squares, such as 14 , are irrational numbers. The decimal expansions of irrational numbers do not terminate nor repeat. Therefore, the values of a square root of a nonperfect square can only be approximated.
3. Complete the following to approximate the square root of 14 .
a. Complete the inequality to show which 2 perfect squares 14 lies between.
< 14 <
b. Use your answers to part A to indicate which 2 square roots 14 lies between.
< 14 <
c. Discuss with your partner which square root the value of 14 is closer to.
d. Plot 14 on the number line to indicate its approximate value based on your discussion.
4. The approximate locations of 6 square roots are plotted on the number line shown.
Work with your partner to determine which point matches the approximate value of each square root given in the table.
5. Complete the statement to explain how you determined the approximate location of the point selected.
is between and , but closer to .
6. Complete the statement.
Guided Activity: Approximating Irrational Numbers and Locating Them on a Number Line
The values of irrational numbers and expressions involving irrational numbers can be approximated.
1. Consider the expression 47 3 .
a. Which 2 whole numbers does 47 3 lie between on a number line?
b. Which whole number is 47 3 closer to?
c. Faith thinks the value of 47 3 will be close to 3.6 or 3.7. Discuss with your partner why Faith may have made these estimates.
d. Check Faith’s estimates to determine if either estimate is close to the value of 47 3 .
e. Based on your work in part D, complete the statement. The approximate value of 47 3 , to the nearest tenth, is . .
f. Plot and label 47 3 on the number line to indicate its approximate location.
2. Use the approximation of 47 3 from the previous question to complete the following.
a. Approximate the value of each expression.
b. Plot and label the approximate location of each expression from part A on the number line.
Lesson Summary
The square root of a perfect square is a rational number because it can be expressed as a ratio of 2 integers. Square roots of nonperfect squares, such as 37 , are irrational numbers. The cube roots of perfect cubes are also rational numbers, while cube roots of nonperfect cubes, such as 56 3 , are irrational.
The exact value of an irrational number can be written with a root such as 37 or 56 3 . The approximations of irrational numbers include decimals that do not terminate nor repeat. Therefore, the value of the square root of a nonperfect square or the cube root of a nonperfect cube can only be approximated.
To approximate the value of square and cube roots, first identify the 2 whole numbers that the square root or cube root will be between. Then, estimate which decimal, to the nearest tenth, is closest to where the root may be on the number line.
The work and explanation to approximate 37 and 55 3 are shown.
Explanation of Step
Identify which 2 whole numbers the root is located between.
which whole number is closer to the root.
Estimate which 2 decimal values the root is located between.
Determine the square or cube of each estimate. Continue until the decimal value with the square or cube closest to the root is found.
Write an approximation statement.
To approximate the value of an expression involving an irrational number, first approximate the value of the irrational number. Then, use that approximation to perform any operations indicated.
Practice Problems
Plot and label the approximate location of 42 on the number line.
2. Plot and label the approximate location of 315 3 on the number line.
1.
3. Six equations are shown.
a. Plot and label the approximate locations of ��, ��, ��, ��, ��, and �� on the number line. 0 1 2 3 4 5
b. Choose 1 value, and explain how you determined its location on the number line.
Review Problem
4.
Unit 9, Lesson 15: Classifying Real Numbers
Warm-Up: Number Classification
Complete the table by classifying each real number as rational or irrational.
Collaborative Activity: Exploring Real Number Types
1. Complete the table by selecting the type of real number that matches each description and writing an example of the type of number.
Description
The counting numbers and zero
A real number that cannot be expressed as a ratio of two integers
The counting numbers
The counting numbers, their opposites, and zero
A real number that can be expressed as a ratio of two integers
Number Type
Natural number
Whole number
Integer
Rational number
Irrational number
Natural number
Whole number
Integer
Rational number
Irrational number
Natural number
Whole number
Integer
Rational number
Irrational number
Natural number
Whole number
Integer
Rational number
Irrational number
Natural number
Whole number
Integer
Rational number
Irrational number
Example
2. Complete the table by identifying a number that can be classified as both types of numbers listed and a number that cannot be classified as both types of numbers.
Number Types
Integer and rational number
Whole number and natural number
Real number and irrational number
3. Compare your responses to question 2 with your partner’s. Summarize any similarities and differences.
4. Which 2 types of real numbers cannot describe the same number?
Guided Activity: Classify Numbers Using Venn Diagrams
A real number can be classified as multiple types of numbers.
1. Complete the table by selecting all possible classifications of each number.
A Venn diagram is shown that can be used to summarize the relationship between the different types, or subsets, of real numbers.
2. Classify each number by writing it in the appropriate section of the Venn diagram. − 10 2 , 36 , 0 8 , 2.74, 7, 140 −8, 8, −2.89
3. Explain whether a number can be located in multiple sections of the Venn diagram.
4. Complete each statement.
a. Whole numbers are a subset of .
b. Irrational numbers are a subset of .
c. Integers are a subset of .
d. Natural numbers are a subset of .
Lesson Summary
Real numbers can be classified into 1 or more of the following subsets.
• Irrational number
• Rational number
• Integer
• Whole Number
• Natural Number
Some numbers can be located in multiple subsets within the real number system. Use the Venn diagram to determine which number types are subsets of other number types.
For example, notice that natural numbers are a subset of whole numbers, integers, rational numbers, and real numbers. Nested Venn diagrams show how some subsets are included in other subsets of real numbers.
Rational Numbers Integers Whole Numbers
Natural Numbers Real Numbers Irrational Numbers
All real numbers are classified as either rational or irrational. A number cannot be both rational and irrational.
Practice Problems
1. Renee and Jasmine are classifying the number 9 . Renee says 9 is a rational number, and Jasmine says it is an integer.
a. Determine who is correct, Renee, Jasmine, or both of them. Explain your reasoning.
b. Determine whether 9 belongs to any other sets of numbers.
2. Complete the table by classifying each number. Choose all subsets of real numbers that each number belongs to.
3. Simon thinks that a number can be both irrational and whole. Explain whether you agree or disagree with Simon.
Review Problems
4. Quadrilateral ��′��′��′��′ is the image after a single transformation of quadrilateral ��������, as shown on the coordinate plane.
Describe the transformation that maps �������� onto ��′��′��′��′.
5. A cylinder and a cone have the same radius and height. If the volume of the cylinder is 81 cubic centimeters (cu. cm), determine the volume of the cone.
Unit 9, Lesson 16: Locating Real Numbers on a Number Line
Warm-Up: Which One Doesn’t Belong?
1. Four numbers are shown in the table. Choose 2 of the values and write an argument for why each one doesn’t belong with the others.
Guided Activity: Compare and Order Rational and Irrational Numbers
1. Use the numbers shown to complete the following.
a. Write each number under the appropriate description in the table. Rational Numbers
b. Order the numbers from least to greatest.
2. Plot and label each number on the number line.
3. Complete the table by comparing each pair of expressions using >, ≥, <, ≤, or = . Then, plot and label the expressions on the number line. Comparison
4. For which mathematical statements in question 3 could the symbol ≠ also be used?
5. Ejon wrote the mathematical statement −5 2 9 ≠ −5.2.
a. Rewrite the mathematical statement to create another true statement using >, ≥, <, or ≤.
b. Explain why both mathematical statements are true.
Collaborative
Activity: Ordering Rational and Irrational Numbers
1. Your teacher will give you a card with a numerical expression on it.
a. What is the numerical expression on your card?
b. Does the expression include any irrational numbers?
c. If your expression contains only rational numbers, write the exact value of your card, expressed as a decimal. If your expression contains any irrational numbers, write the approximate value of your card, expressed as a decimal.
2. Once in your group, label the tick marks on the number line to match your group’s assigned number line.
a. Work with your group to order your number cards from least to greatest.
b. Work with your group to determine the approximate location of each expression on the number line. Then, plot and label each expression on your number line.
Guided Activity: Ordering Rational and Irrational Numbers
1. Use your experience doing the previous activity to complete the following.
a. List any strategies you learned that are helpful to keep in mind when comparing and ordering rational and irrational numbers or plotting them on a number line.
Strategies for Comparing and Ordering
Strategies for Plotting on a Number Line
b. Compare and discuss your list with your partner. Add any strategies your partner shares that you find helpful that aren’t on your list.
Lesson Summary
Different symbols can be used to compare real numbers. Several symbols and their meanings are shown in the table. Symbol Meaning Symbol Meaning
> “is greater than” ≥ “is greater than or equal to” = “is equal to”
< “is less than” ≤ “is less than or equal to” ≠ “is not equal to”
When comparing real numbers, consider their comparative locations on a number line.
• Given 2 real numbers �� and �� where �� > ��, �� is located to the right of �� on a horizontal number line. The inequality also means that �� ≠ ��.
• Given 2 real numbers �� and ��, where �� ≤ ��, �� is located either to the left of �� or at the same location as �� on a horizontal number line.
Practice Problems
1. Use the numbers shown to complete the following.
a. Order the numbers from greatest to least.
b. Plot and label each number on the number line.
2. For the numbers 8 and −3.1, complete the following.
a. Complete the statement using >, ≥, <, ≤ or = .
b. Plot and label each number on the number line.
3. Rianna and Brad each compared the numbers 28 3 and 9 . Their answers are shown.
Explain which student is correct.
Review Problems
4. A linear inequality is shown.
a. Solve the inequality.
Rianna’s Answer Brad’s Answer
28 3 > 9
5(2�� − 3) > 4�� + 9
b. Graph the solution to the inequality on the number line.
28 3 < 9
5. Point �� has coordinates (−5, 1). Determine the coordinates of the image of point �� after a reflection over the ��-axis and a translation right 2 units and up 4 units.
Unit 9, Lesson 17: Plotting, Ordering, and Comparing Real Numbers
Warm-Up: Ordering and Classifying Real Numbers
1. Use the numbers shown to complete the following.
a. Complete the table by sorting the numbers into rational and irrational numbers. Rational Numbers Irrational Numbers
b. Order the numbers from least to greatest.
Collaborative Activity: Station 1 – Comparing and Ordering
1. Compare each pair of expressions using the symbols <, >, ≤, ≥ or = .
2. Choose 1 pair of expressions from the previous question that were not equivalent.
a. Circle the pair of expressions.
b. Explain how you determined which value was greater.
3. Order each set of numbers from least to greatest.
a. 34 , �� + 2, 5 1 2
b. 60 3 , − 18 4 , −��
Collaborative Activity: Station 2 – Plotting Rational and Irrational Numbers on a Number Line
1. Five expressions are shown.
a. Write each expression under the appropriate description in the table. Includes Only Rational Numbers Includes an Irrational Number
b. Plot and label the location of each expression on the number line. 9 10 11 12 13 14 15 16
2. Six expressions are shown.
Plot and label the location of each expression on the number line.
Collaborative Activity: Station 3 – Error Analysis
1. Abby approximated the value of 2 . Her thinking is shown.
The number 2 is between 1 and 4, which are both perfect squares. Therefore, I know 2 lies between 1 and 2 on a number line. I would plot its approximate location here.
a. Discuss Abby’s thinking with your partner. Then, complete the table.
What is correct in Abby’s thinking? What error(s) did Abby make?
b. Plot and label the correct approximate value of √2 on the number line.
2. For each pair of numbers, an explanation comparing the values is provided.
a. Determine whether each explanation is correct or incorrect.
Pair of Numbers
��2 and 9
Comparison and Explanation Is it correct?
9 is greater than ��2 because �� is slightly more than 3, so ��2 is slightly more than 6.
Correct Incorrect
50 and 8
50 is less than 8 because 8 is equal to 64 , and 50 is less than that.
Correct Incorrect
13 3 and 60 3
−2�� and −6
13 3 is greater than 60 3 because 13 3 is slightly more than 4, and 60 3 is slightly less than 4.
−6 is less than −2�� because −2 ∙ �� is between −6 and −7, which means it’s larger than −6.
Correct Incorrect
Correct Incorrect
b. Two of the explanations above are incorrect. Write the correct explanation for each of them by completing the sentence stems.
is greater than because . . . is less than because . . .
Lesson Summary
Different types of real numbers can be classified, ordered, and compared using inequality statements and number lines. Comparing real numbers includes writing statements that include phrases and symbols such as is equal to (=), is not equal to (≠), is less than (<), is greater than (>), is greater than or equal to (≥), or is less than or equal to (≤).
When asked to classify subsets of real numbers, consider using a Venn diagram to analyze which subsets each number may be a part of. Remember that some numbers may be included as part of multiple subsets, such as natural numbers, whole numbers, integers, and rational numbers.
When you’re asked to order real numbers, a number line can be a useful tool.
Practice Problems
1. Use the number 8 for each problem.
a. Plot the approximate location of 8 on the number line.
b. Explain your reasoning for your approximation of 8 .
2. Candace was comparing the numbers 4�� and 12, but she made an error when she stated 4�� < 12.
Explain why Candace’s answer is incorrect.
3. For each pair of numbers, complete the statement with <, >, ≤, ≥, or =. Explain your reasoning for each statement.
a. 144 3 64 3
b. −3�� − 25 3
c. 126 3 9 + 2
Review Problems
4. Two different linear functions are shown.
a. Determine if line A is increasing or decreasing. Explain your reasoning.
b. Determine if line B is increasing or decreasing. Explain your reasoning.
c. Determine which line has a greater ��-intercept. Explain your reasoning.
5. Triangle ������ is translated to create ∆������, as shown.
Describe the translation(s) that map(s) ∆������ onto ∆������.
Unit 10, Lesson 1: Applying Laws of Exponents to Algebraic Expressions – Part 1
Warm-Up: Numeric Expressions with Exponents
1. Evaluate each expression.
a. 24 ⋅ 52
b. (3 ⋅ 4) 2
c. 103 42
Exploration Activity: Equivalent Algebraic Expressions
1. A square is shown where each side length is represented by the expression 3��5
The formula �� = ��2 can be used to find the area of the square, where �� is the side length of the square.
a. Using this formula, the area of the square shown can be expressed as (3��5)2. Discuss with your partner how this expression represents the area of the square.
b. Complete the steps to find an equivalent expression that represents the area of the square.
= 3a5 • 3a5 = 9a (3a5)2 = 3 • 3 • a5 • a5 = 3 • 3
c. Suppose �� = 1.5 units. Find the length of 1 side of the square using a calculator.
d. Use your answer to part C to find the area of the square. Round to the nearest thousandth.
e. Use the expression generated in part B to find the area of the square. Round to the nearest thousandth.
f. What do you notice?
Exploration Activity: Laws of Exponents with Algebraic Expressions
1. Several algebraic expressions are given in the table.
a. For each given expression, work with your partner to rewrite the expression in expanded form. Then, write an equivalent algebraic expression with 1 variable base and 1 coefficient. The first row has been partially completed.
b. Discuss with your partner what you notice about how the coefficients and variable powers of the equivalent expressions compare to the coefficients and variable powers of the given expressions.
c. Gavin said properties of exponents could be applied to the original expressions to generate the same equivalent expressions. Match each pair of expressions with the exponent law that applies. Then, complete the explanation.
Original Expressions Which property of exponents applies?
5��2 ∙ ��6 and 3��5 ∙ 2��
Product of powers
Power of a product
Power of a power
Explanation
The powers of the variable bases from the original expression were added multiplied to result in the power of the variable base in the equivalent expression.
(2��6)2 and (��2)4
Product of powers
Power of a product
Power of a power
The powers of the variable bases from the original expression were added multiplied to result in the power of the variable base in the equivalent expression.
(�� ∙ ��)3 and (3�� ∙ ��)2
Product of powers
Power of a product
Power of a power
Each factor in the expression within parentheses was raised to the power of the product. power of the power.
d. Use words from the bank to complete the explanations of how the laws of exponents applied to the coefficients when generating the equivalent expressions.
multiplied power product same
In the expressions where the product of powers law applied to the variable factors, the coefficients were ________________ to find the coefficient of the
In the expressions where the power of a power law applied, the coefficient was also raised to the power of the ________________.
In the expressions where the power of a product law applied, the coefficients of the factors were also raised to the ________________ power.
Guided Activity: Applying Laws of Exponents to Variables
1. Apply the given law of exponents to generate equivalent expressions.
Collaborative Activity: Missing Numbers
1. Work with your partner to complete the equations using the digits 0 − 9. Each digit is used exactly once. Blue boxes are coefficients, and orange boxes are exponents.
•
=
(3c • b3)2 = c8 • b
Lesson Summary
Laws of exponents can be applied to generate equivalent algebraic expressions in the same way that they can be applied to numerical expressions. The Product of Powers, Power of a Power, and Power of a Product laws of exponents apply to both variable and numerical bases when generating equivalent algebraic expressions.
The table summarizes the laws of exponents used in this lesson with both numeric and algebraic expressions.

Practice Problems
1. Complete the table by finding an equivalent exponential expression for each expression given and then identifying the law of exponents used.
Original Expression
2��3 ∙ 3��4
(−4����)2
(78)10
Equivalent Expression Law of Exponents
Power of a power Product of powers
Power of a product
Power of a power Product of powers
Power of a product
Power of a power
Product of powers
Power of a product
2. McKenna and Jacob each simplified the expression 6��4 ∙ 2��5. Their answers are shown.
Explain which student is correct.
3. Select all the expressions that are equivalent to 8��6��9
□ 2����2 ∙ 4��5��7
□ 2����3 ∙ 4��6��3
□ (2��2��5)4
□ (2��2��3)3
□ 8���� ∙ ��5��8
□ (2��3��6)3
Review Problems
4. A sequence of transformations is applied to ������ to produce the image ������, as shown on the coordinate plane.
a. Determine the sequence of transformations that maps ������ onto ������.
b. Explain whether ������ and ������ are congruent.
5. A line is shown on the grid, along with a right triangle.
a. Determine the length of ����.
b. Determine the length of ����.
c. Determine the slope of the line.
Unit 10, Lesson 2: Applying Exponent Laws to Algebraic Expressions – Part 2
Warm-Up: Exponents with Numeric Expressions
Evaluate each numerical expression.
(3
3. (34)2
Guided Activity: Exponent Laws Involving Division
When dividing algebraic expressions, the quotient of powers law of exponents is used.
A breakdown of dividing 35 by 34 and dividing ��5 by ��4 are shown side by side.
1. Consider the expression ��2 ��5 .
a. Complete the steps to find an equivalent expression.
b. With your partner, discuss what value is in the numerator of the equivalent expression.
c. Explain the quotient of powers law of exponents in your own words.
2. Use the quotient of powers law of exponents to rewrite each expression.
a. ��3��11��3 ��2��2
b. 12��3�� 6����3
3. Three students generated equivalent expressions using exponent laws.
a. Finish Amir’s work using a similar strategy to the one used by Luis and Maya.
b. Complete the statement. When �� and �� are nonzero real numbers and �� is an integer, the exponential expression
is equal to
4. Use the power of a quotient law of exponents from the question 3 to rewrite each expression.
a.
Luis Maya Amir
Exploration Activity: Equivalent Algebraic Expressions Involving Division
1. For each expression, rewrite the expression in expanded form, applying the quotient of powers law of exponents, and write an equivalent algebraic expression using the fewest possible variable bases.
2. Consider the expression 16��9��6 8����3 . Generate an equivalent expression using division by completing the steps shown.
The coefficient in the resulting expression will not always be an integer.
3. Consider the value of 3 ÷ 12.
a. Express the value of 3 ÷ 12 as a fraction and as a decimal.
b. Generate an expression equivalent to −3��6��5 ÷ 12��4��2. 16x9y6 8xy3 = x y
4. Three expressions are given in the table.
a. For each given expression, rewrite the expression in expanded form. Then, write an equivalent algebraic expression using the fewest possible variable bases.
b. Complete the statements.
When a quotient is raised to a power, the
power of a quotient power of a product quotient of a power law of exponents can be applied by raising both the dividend and divisor to the same power. If either the dividend or divisor includes a product, the power of a quotient power of a product quotient of a power law of exponents can also be applied. For example,
Collaborative Activity: Equivalent Algebraic Expressions Involving Division
1. Match each expression in the column on the left to an equivalent expression in the column on the right, by drawing arrows.
Lesson Summary
The quotient of powers and the power of a quotient laws of exponents can be applied to generate equivalent expressions involving division with algebraic expressions.
• The quotient of powers law of exponents shows that when 2 expressions with the same bases are divided, they can be rewritten using the base raised to the difference of powers. For example, ��7��4 ��3�� = ��(7−3)��(4−1) = ��4��3.
• The power of a quotient law of exponents shows that when a quotient of 2 algebraic expressions is raised to a power, both the numerator and denominator are raised to the power. For example, �2�� 4���4 = 24��4 44��4 = 16��4 256��4 = ��4 16��4.
When dividing algebraic expressions, the coefficients are divided as well. In the first example above, the coefficients of the divisor and the dividend are both 1, so the coefficient of the resulting expression is also 1, because 1 ÷ 1 = 1. In the second example, the coefficients resulting after applying the power of a quotient law are 16 and 256 in the numerator and denominator, respectively. The fraction 16 256 reduces to 1 16 .
Similarly, the coefficients 2 4 could have been reduced to 1 2 prior to applying the power of a quotient.
| Unit 10
Practice Problems
1. For each expression, apply exponent laws to generate an equivalent expression with the fewest factors possible.
a. ��9 ��4 = _____________
b. 5��4��7 15����5 = _____________
c. 21��5��6 7��4��2 = _____________
d. � �� 2 �3 = _____________
e. � �� ���8 = _____________
f. ��7��9 ��6�� = _____________
2. Find the quotient of each expression by applying the laws of exponents to generate an equivalent expression.
a. ��2��18 −5s��7
b. � 0.5�� 10�����2
c. −204��2��8��31 17��16��15��4
3. Maddox was working to find an equivalent expression for �−2��3��2 ���� �4, but he made an error. His work is shown.
a. Explain where Maddox first made an error.
b. Determine the correct equivalent expression.
Review Problem
4. Faith is rolling a four-sided number tetrahedron with faces labeled 1 to 4, and also flipping a coin with a red side and a green side.
a. List the outcomes in the sample space for 1 roll of the number tetrahedron and 1 flip of the coin.
b. If Faith rolls an odd number and flips red, she wins $1. Determine the probability that Faith will win $1.
Unit 10, Lesson 3: Algebraic Expressions with Negative Exponents
Warm-Up: Laws of Exponents with Algebraic Expressions
For each expression, apply the laws of exponents to generate an equivalent expression with the fewest factors possible.
Exploration Activity: Negative Exponents in Algebraic Expressions
1. Rewrite each expression using positive exponents.
a. 6−4 = __________
b. (−3)−2 = __________
c. �4 5 �−6 = __________ d. �−7 8 �−1 = __________
2. Make a conjecture about how to rewrite the algebraic expression shown with a positive exponent.
= _____
3. Work with your partner to complete the following exercises that explore negative exponents in algebraic expressions.
a. Rewrite each expression in expanded form.
b. Discuss with your partner what factor could be multiplied by each expression to generate the expression in the next row. Then, fill in the blanks to the right of the table.
c. Complete the statement.
As the value of the exponent of �� increases decreases by 1 in the column on the left, the equivalent expression in the column on the right can be found by multiplying the previous value by the opposite reciprocal of ��.
d. Continue the pattern.
e. Compare your conjecture in question 2 with the expression you found in part D.
f. Complete the statement.
A variable base with a negative exponent, (��)−��, can be rewritten using the reciprocal opposite of the base with the reciprocal opposite exponent.
4. For each expression, write an equivalent expression with positive exponents.
a. ��−4 = ______________
��−9 = ______________
Collaborative Activity: Equivalent Expressions Card Sort
1. Work with your partner or group to match the equivalent expressions in the set of cards. Each numbered card in the set shown in the table has 3 equivalent matches. Record the letters of the matching cards in the table.
Lesson Summary
Rewriting algebraic expressions involving exponents into equivalent forms involves applying the laws of exponents explored in the previous lessons. The same laws of exponents can be applied to both numeric and algebraic expressions.
Three additional laws of exponents were revisited in this lesson in terms of algebraic expressions: the negative exponent law, the identity exponent law, and the zero exponent law.
• Expressions involving negative exponents can be rewritten using the reciprocal of the base raised to the opposite exponent. For example, 4��−3 = 4 ��3, where 4 remains in the numerator since it has an exponent of 1, and �� is in the denominator with a positive exponent of 3.
If a base with a negative exponent is located in the denominator, the same strategy applies, using the reciprocal base raised to the opposite exponent. For example, 3 ��−4 = 3��4, and since the base of �� is raised to a negative exponent in the denominator, the equivalent expression will have the base raised to a positive exponent in the numerator.
• The identity exponent law states that when raising a base that is a nonzero real number to the power of 1, the base is a factor 1 time and, therefore, has the same value as the original base. For example, 31 = 3 and ��1 = ��. Bases without a power noted can be rewritten as bases raised to the exponent of 1.
• The zero exponent law states that when a real number is raised to the zero power, ��0, its value equals 1. For example, 20 = 1 and ��0 = 1. The law can be applied to numeric expressions or to algebraic expressions such as �3��3�� 2��2 �0 = 1.
Practice Problems
1. For each expression, generate an equivalent expression with positive exponents by applying 1 or more laws of exponents
a. 9��3 ��−4 = ________
b. 3��−4 ∙ 2��−6 = _________
2. Find the value of �� that makes the equation true.
3. Katsuji is trying to simplify the expression 5�� ∙ 2��−7 using laws of exponents, but he is stuck. Help Katsuji by completing the steps in the table using the laws shown.
Review Problems
4. Determine whether each given set of side lengths for a triangle can be the side lengths of a right triangle. Explain your reasoning.
a. 3, 4, 6
b. √5, 4, √21
5, 12, 13 Expression Exponent Law
c.
5. Quadrilateral �������� is shown on the coordinate plane. �������� is reflected over the ��-axis and then reflected over the ��-axis.
a. Complete the tables with the coordinates after each transformation.
b. Draw the image after the reflections. Label the image ��"��"��"��".
Unit 10, Lesson 4: Applying Multiple Laws of Exponents
Warm-Up: Laws of Exponents
1. Rewrite each expression by applying laws of exponents.
a. 24��2��12 6��5��7
b. (2��−3)−2
c. �(2��7)(3��2) 6��3 �
d. �− 2�� 3��4�−1
Guided Activity: Applying Multiple Laws of Exponents to Algebraic Expressions
The laws of exponents are included in the bank shown for reference when completing the following problems.
Laws of Exponents
product of powers quotient of powers power of a power power of a product power of a quotient negative exponent identity exponent zero exponent
1. Miguel and Gia generated the same expression equivalent to (��3 ∙ ��2)2. They both applied laws of exponents but in different ways. Their work is shown.
a. For each student, identify which laws of exponents they applied and in what order.
b. Discuss with your partner which strategy you prefer. Summarize your discussion.
2. Jack and Angel rewrote the expression ���3��−4 ����2 �2 in different ways and arrived at different expressions. Their work is shown.
a. Even though 1 of the students’ resulting expressions is not equivalent to
, complete the table to identify which laws of exponents each student applied and in what order.
Order of Laws
b. Which student generated an expression that is not equivalent to
c. Which statement best describes the incorrect student’s strategy?
The incorrect student used a correct strategy but applied 1 of the laws incorrectly.
The incorrect student tried to use an exponent law that didn’t apply to this expression.
d. Based on your responses to parts B and C, show how to correct the student’s error in the space provided above part A.
Jack Angel
Collaborative Activity: Exponent Laws Relay
Work with your partner to complete the relay.
• Start by generating an equivalent expression for question 1 using the fewest factors possible.
• Insert the answer from question 1 into the box in question 2. Repeat until you have completed all of the questions in this manner.


5. To successfully complete the relay, your final answer should be 1. Go back to check your answers if needed.
Lesson Summary
Writing equivalent expressions with exponents includes applying laws of exponents. Unlike the order of operations, the order of laws can be applied in different orders to reach the same equivalent expressions.
Consider the expression
��2��−3 2����0 ⋅ 4��2 ��3 �4. Two different methods of rewriting the expression are shown. Each method uses the same laws of exponents but in a different order. Regardless of the order, the resulting expressions are equivalent.
Practice Problems
1. For each expression, write an equivalent expression using positive exponents and the fewest factors possible. Show your work in the space provided. Then, for each expression, check off the exponent laws applied from the list provided.
a. 8��3 2��9 ∙ ��4
b. � ��0 ∙ ��−2 (��−3 ∙ ��)2�
Exponent Laws Applied
□ Identity exponent
□ Negative exponent
□ Power of a power
□ Power of a product
□ Power of a quotient
□ Product of powers
□ Quotient of powers
□ Zero exponent
Exponent Laws Applied
□ Identity exponent
□ Negative exponent
□ Power of a power
□ Power of a product
□ Power of a quotient
□ Product of powers
□ Quotient of powers
□ Zero exponent
2. Write an expression equivalent to �3��3��2 6����4 �2 using positive exponents and the fewest factors possible.
3. Dario was simplifying the expression �
, but he made an error in 1 of his steps, which gave him an incorrect equivalent expression. His work is shown.
a. Complete the table by identifying the exponent law used, even if applied incorrectly.
b. Explain in which step Dario applied an exponent law incorrectly.
c. Determine the correct equivalent expression.
4. A bag contains 4 green marbles, 5 blue marbles, and 1 yellow marble.
a. If a marble is randomly chosen, replaced in the bag, and then another marble is chosen, determine the probability of choosing 2 blue marbles. Give the answer as a simplified fraction.
b. If a marble is randomly chosen, set aside, and then another marble is chosen, determine the probability of choosing 2 blue marbles. Give the answer as a simplified fraction.
5. Triangle ������ is shown on the coordinate plane. Triangle ������ is translated 4 units left, 2 units down, and then dilated by a scale factor of 3 2 centered at the origin.
a. Complete the tables with the coordinates after each transformation.
b. Draw the image after the transformations. Label the image ��′′��′′��′′
Unit 10, Lesson 5: Applying Distributive Property to Algebraic Expressions
Warm-Up: Which One Doesn’t Belong?
1. Julius wrote a list of expressions using variables, numbers, and operators.
a. Circle the expression that does not belong.
ℎ(4 ∙ ℎ) (�� + 1)(−��)
2(−3 − ��) −5(2 ∙ ��)
b. Explain why the expression does not belong.
Exploration Activity: Areas of Rectangles
Work with your partner to complete the following.
1. Two rectangles are shown. The length and width of rectangle B are 6 and 3, respectively. The width of rectangle A is also 3. Its length is unknown, so it is labeled ��. Rectangle A
B 3 x 3 6
a. Write an expression to represent the sum of the areas of rectangles A and B.
b. Rectangles A and B can be composed into 1 larger rectangle, as shown.
3 6 x
Complete the statement.
The width of the new rectangle is 3, 6, 18, 3��, and the length is 3. (3 + ��). 6. (�� + 6).
c. Tajae and Elyse wrote different expressions to represent the area of the larger rectangle.
Discuss with your partner whether Tajae, Elyse, or both students wrote a correct expression of the area.
3(��) + 3(6) 3(�� + 6)
d. Write another expression to represent the area of the larger rectangle.
3
Tajae Elyse
2. For each rectangle, complete the table. In the first 2 columns, write expressions for the width and length of the rectangle. Then, in the next 2 columns, express the area of the rectangle in 2 different ways using either multiplication or addition.
Guided Activity: Multiplying Linear Expressions
Find each product using your preferred method.
−2.4��5(−9�� − 3.16)
4.79��3��(0.3 + 2.1��)
(5��
1.
3.
Collaborative Activity: Equivalent Algebraic Expressions Involving Division
1. With your partner, determine who is partner A and who is partner B.
a. Apply the distributive property to rewrite each expression in your column in the space provided below each given expression.
Partner A Partner B
− 8��)
3 ��(6�� + 9)
− ��)
− ��)12��
4 ��(10 + 16��)
+ 6)
− 3)2��
− 15)
− 4��)
− 5)
b. Compare your work with your partner’s work. The expressions in each row are equivalent. If your expressions are not equivalent, work together to find and correct any error(s).
Lesson Summary
The area models used in the Collaborative Activity demonstrate the distributive property of multiplication over addition.
Distributive property of multiplication over addition �� × (�� + ��) = (�� × ��) + (�� × ��)
The factor outside of parentheses is distributed to each part of the factor within a set of parentheses. With the distributive property, multiplication is performed over, or before, addition or subtraction.
For example, when applying the distributive property to the expression ��(3 − ��), distribute �� to each term inside the parentheses to create the expression 3�� − ��2. When common bases are multiplied together using the distributive property, apply laws of exponents when necessary.
Practice Problems
1. Find the product −4��4�� �3 2 − 8���.
2. Find the product (12.7�� + 9.2)(4.01��2��3).
3. Find the product 4 5 ��4��2�7 2�� − 10�.
4. Find the product (2.005 − ��) ∙ (��5����3).
Review Problem
5. Triangle ������ is shown on the coordinate plane.
y
Rotate Δ������ 180° clockwise about the origin. Label the image Δ��′��′��′.
Unit 10, Lesson 6: Multiplying Algebraic Expressions
Warm-Up: Applying Laws of Exponents
1. Find the product.
2. Fill in the blanks in each expression to make the equation true.
Guided Activity: Multiplying Monomials by Algebraic Expressions
1. Determine the product of (−5��3��2) and (−2��2 + 9 5 ��4) using both methods in the table.
Method 1: Use an Area Model
Method 2: Apply the Distributive Property
(−5��3��2)(−2��2 + 9 5 ��4)
2. Work with your partner to find 3 expressions equivalent to 3��2(−2��3 + ��).
Collaborative Activity: Equivalent Expressions
1. Two expressions are given in the table. For each expression, work with your partner to find as many equivalent expressions as you can.
Equivalent Expressions
2. Find another partner pair, and compare your expressions from the previous question. Discuss any differences, and add any additional equivalent expressions to your table.
Collaborative Activity: Scavenger Hunt
Work with your partner or group to complete the scavenger hunt. Each card in the scavenger hunt appears as shown.
If the product of your previous problem is equivalent to ...
(an expression will appear here)
Your given expression will appear here. Result from previous problem Problem Problem number
Find the product.
1. Write the number of the problem you start with and the given expression in the first row of the table. Then, work with your group or partner to find the product of the given expression.
2. Look for the card with your product from the previous problem to find your next problem.
3. Repeat this process until your group has completed all the scavenger hunt problems and has ended up back at your original problem.
Lesson Summary
When multiplying a term by an expression, apply the distributive property and the laws of exponents, when applicable. Use caution when applying the distributive property with a negative coefficient. The negative coefficient should be distributed to each term in the expression. An example is shown for rewriting the expression
Notice after applying the distributive property with the negative coefficient that the terms in the resulting expression have the opposite as the original.
Practice Problems
1. Use the expression 5��3(2��2 + 6) to complete the following.
a. Complete the missing parts of the area model that could be used to multiply the expression.
b. Use the area model to determine the product of 5��3(2��2 + 6).
2. Select all of the expressions that are equivalent to −2��4��3 + ��4��2.
3. Use the distributive property to find the product for each expression.
a. 3����(4���� + ��2��2)
b. 2 3��3��5(9��2��3 − 27��3��2)
c. −4��4��4(−6��2��2 − 2����)
Review Problem
4. Triangle ������ is dilated with center point ��, resulting in the image triangle ������, as shown.
a. Determine the scale factor of the dilation.
b. Find the length of ����.
5. A sphere has diameter of 6 centimeters (cm). Determine the volume of the sphere. Write the answer in terms of ��.