
Grade 8 SOUTH
CAROLINA
ISBN: 979-8-893539-07-3
Math Nation 6-8 was originally developed by Illustrative Mathematics®, and is copyright 2019 by Illustrative Mathematics. It is licensed under Creative Commons Attribution 4.0 International License (CCBY 4.0).
The online curriculum resource platform offered at "mathnation.com", including the videos and practice questions are additions to the original Illustrative Mathematics content is copyright 2023 by Accelerate Learning, Inc.
The trademark "Math Nation" is owned by Accelerate Learning, Inc. All other trademarks and product names referred to in the Math Nation AGA curriculum are the property of their respective owners and used solely for educational purposes. Unless otherwise stated, Math Nation has no relationship with any of the companies or brands mentioned in the curriculum and does not endorse or have a preference for any of those companies or brands.
This curriculum includes public domain images or openly licensed images that are copyright by their respective owners. Openly licensed images remain under the terms of their respective licenses. See the image attribution section for more information.
00820231215
Unit 1: Rigid Transformations and Congruence
Unit 1, Lesson 1: Moving in the Plane
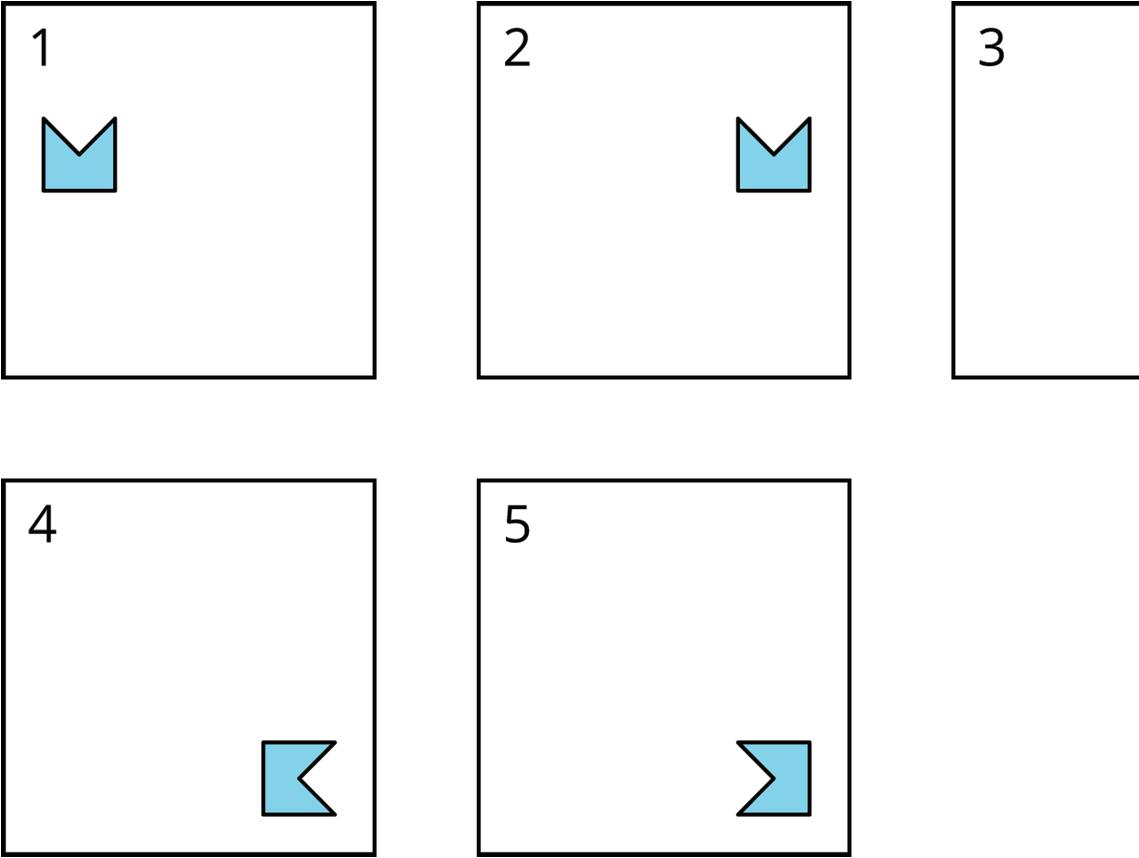
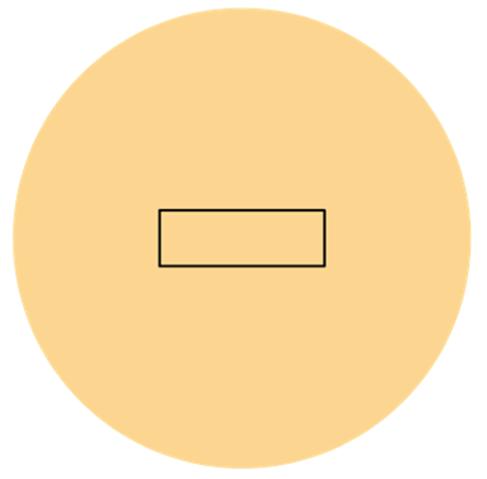
Warm-Up: Which One Doesn’t Belong
Which one doesn’t belong?
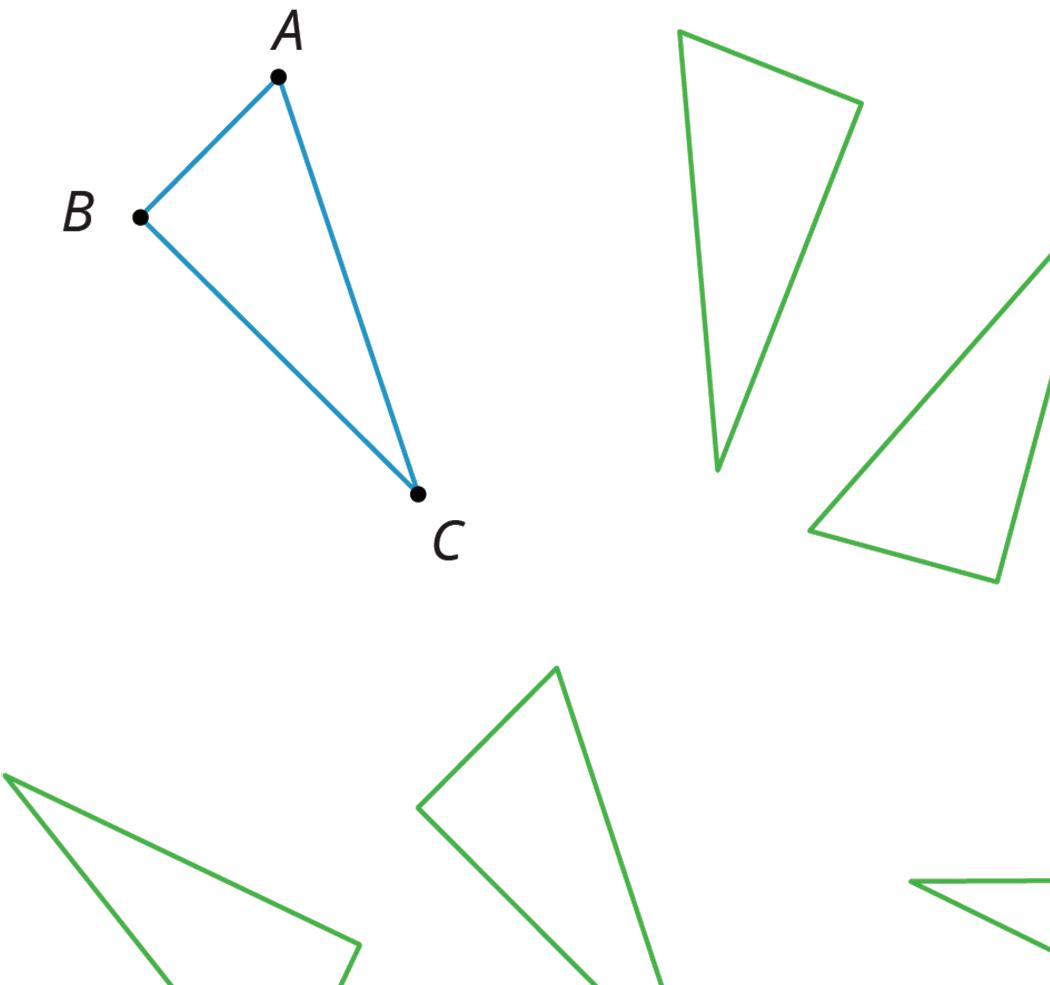
Exploration Activity: Triangle Square Dance
Your teacher will give you three pictures. Each shows a different set of dance moves.
1. Arrange the three pictures so you and your partner can both see them right way up. Choose who will start the game.
• The starting player mentally chooses A, B, or C and describes the dance to the other player.
• The other player identifies which dance is being talked about: A, B, or C.
2. After one round, trade roles. When you have described all three dances, come to an agreement on the words you use to describe the moves in each dance.
3. With your partner, write a description of the moves in each dance.
Lesson Summary
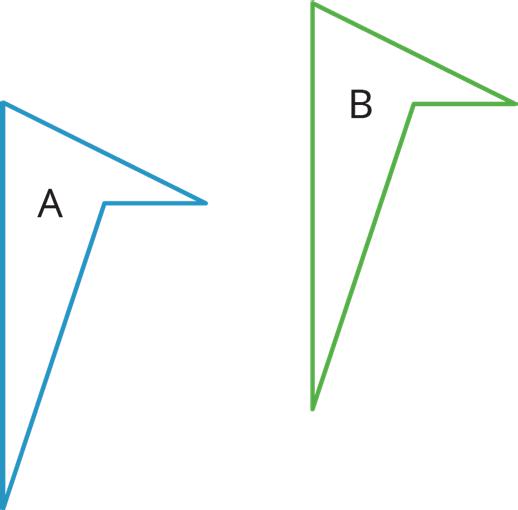
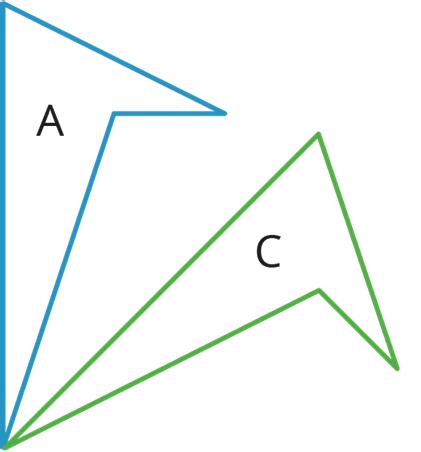
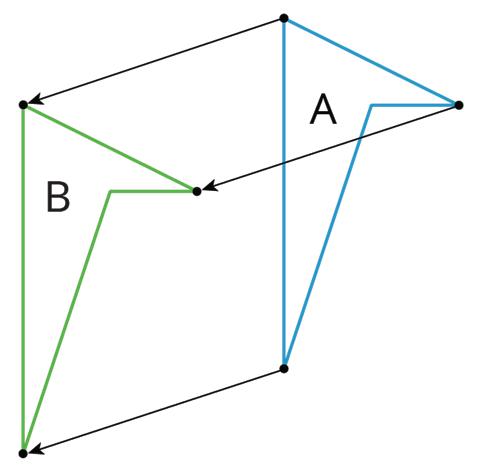
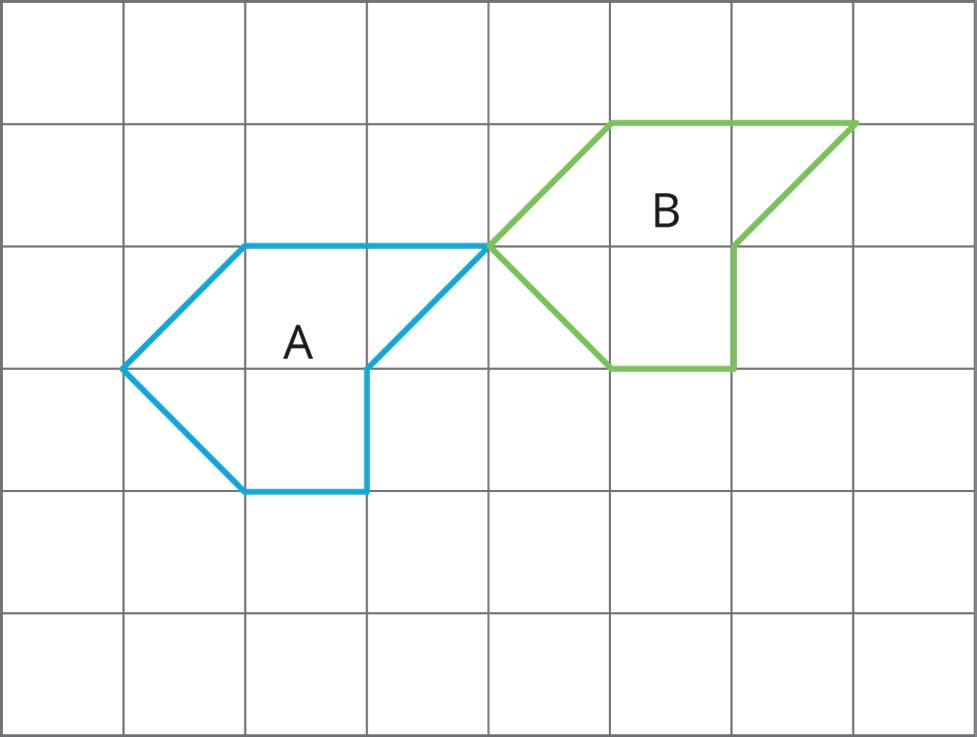
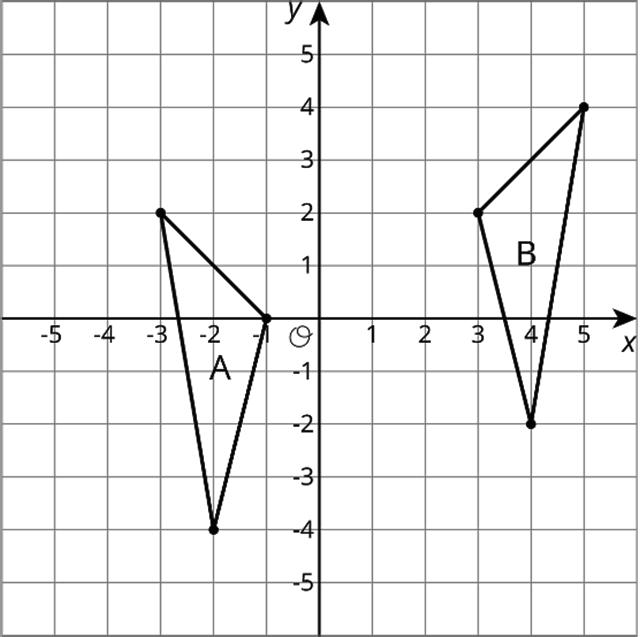
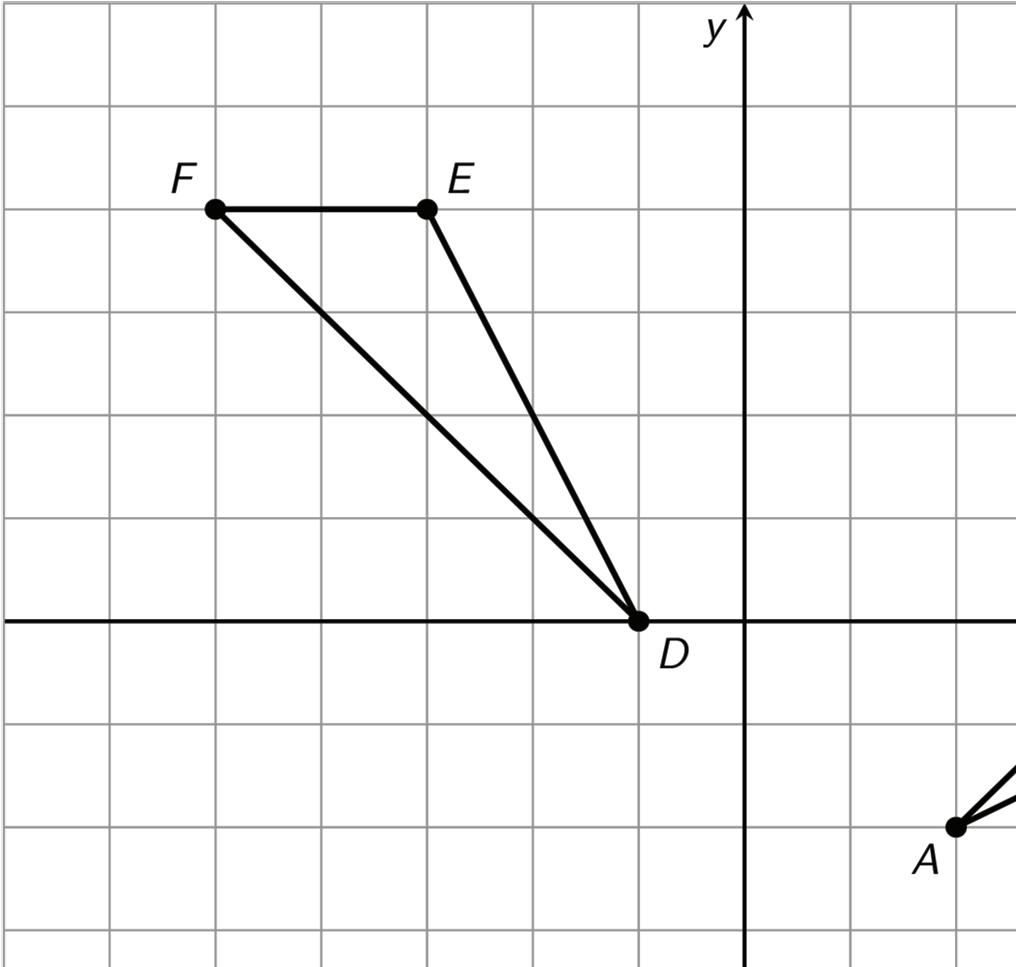
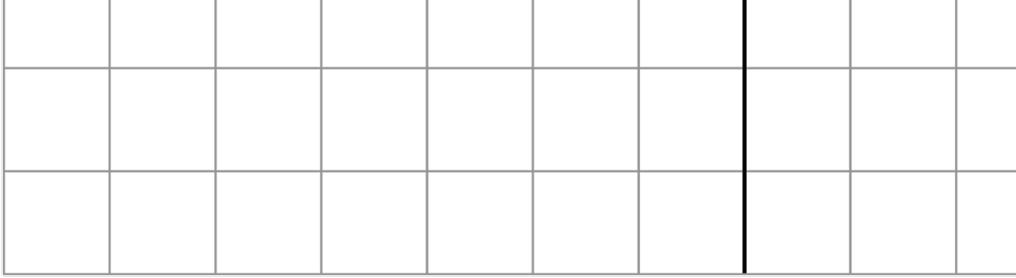
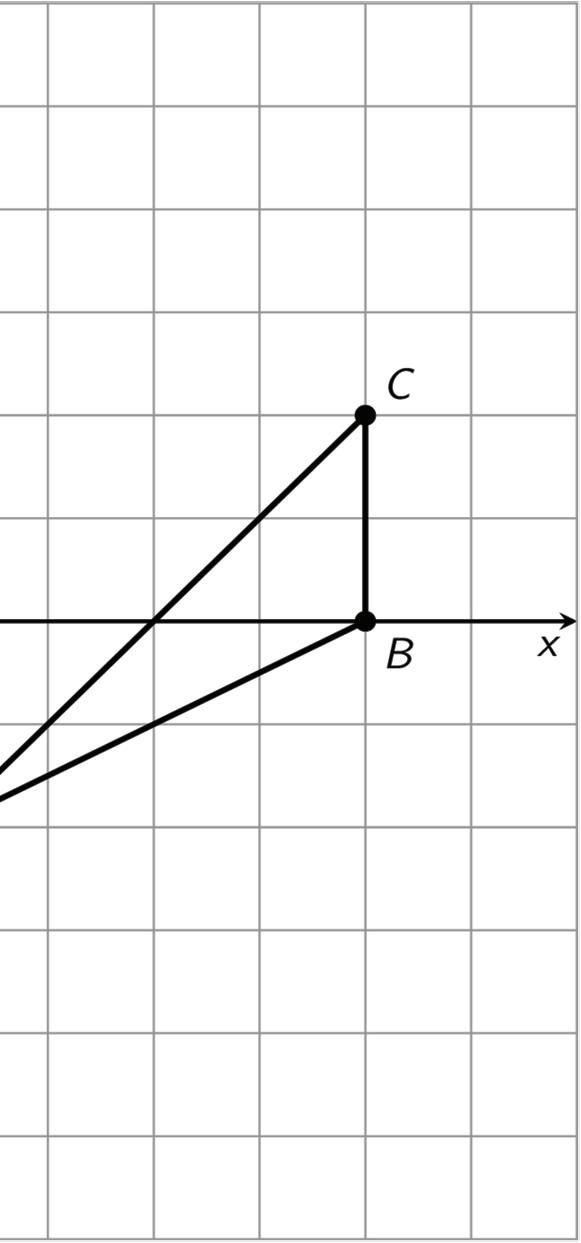
In this lesson, 2 different ways of changing the position of a figure in a plane without changing its shape or size were explored. Each is described with an example shown.
• Sliding or shifting the figure without turning it
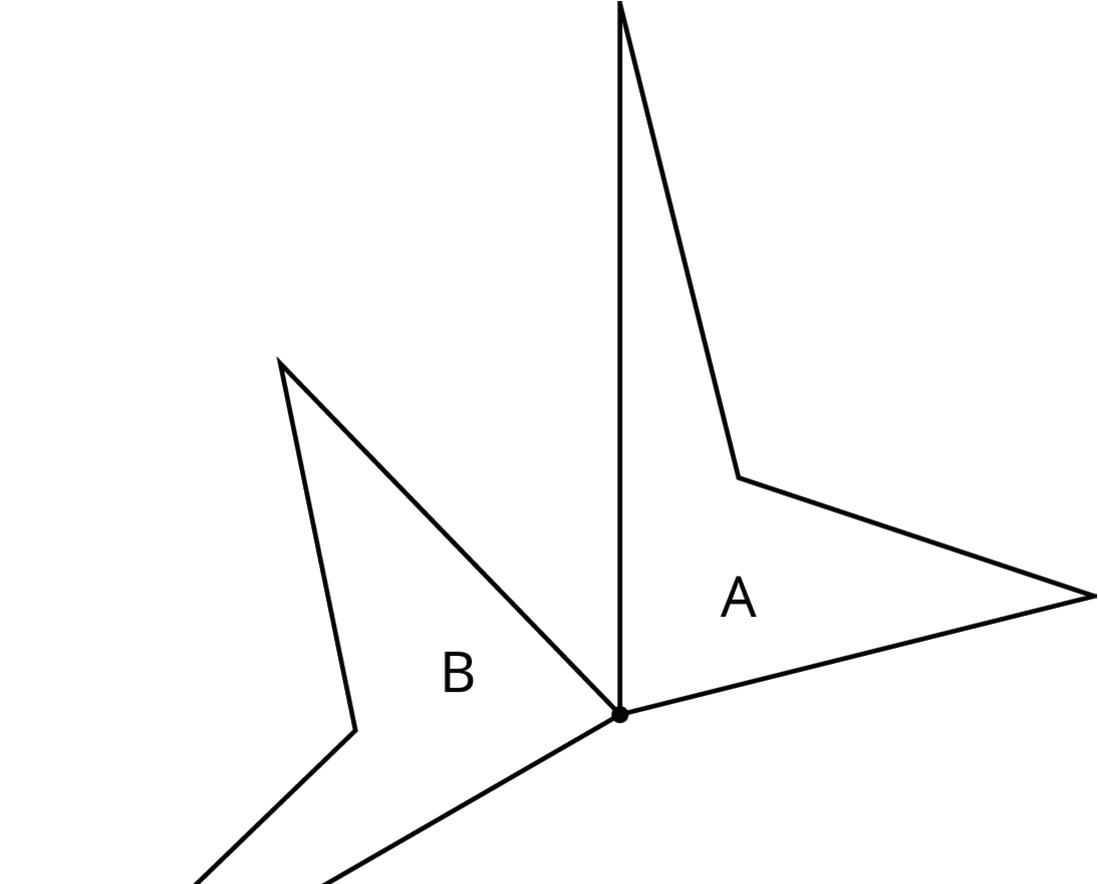
For example, shifting figure A to the right and up moves it to the position of figure B.
• Turning or rotating the figure around a point
For example, figure A is rotated around the bottom vertex to create figure C.
A vertex (of a figure) is the point at which the rays or sides of an angle, the sides of a two-dimensional figure, or the edges of a three-dimensional figure meet.
Note that figures A, B, and C are congruent to each other after each of these movements.
Congruent figures are those having exactly the same shape and size. Equivalently, two figures are congruent if one can be mapped to the other using a rigid transformation.
The next lessons will explore rigid transformations more closely.

Practice Problems
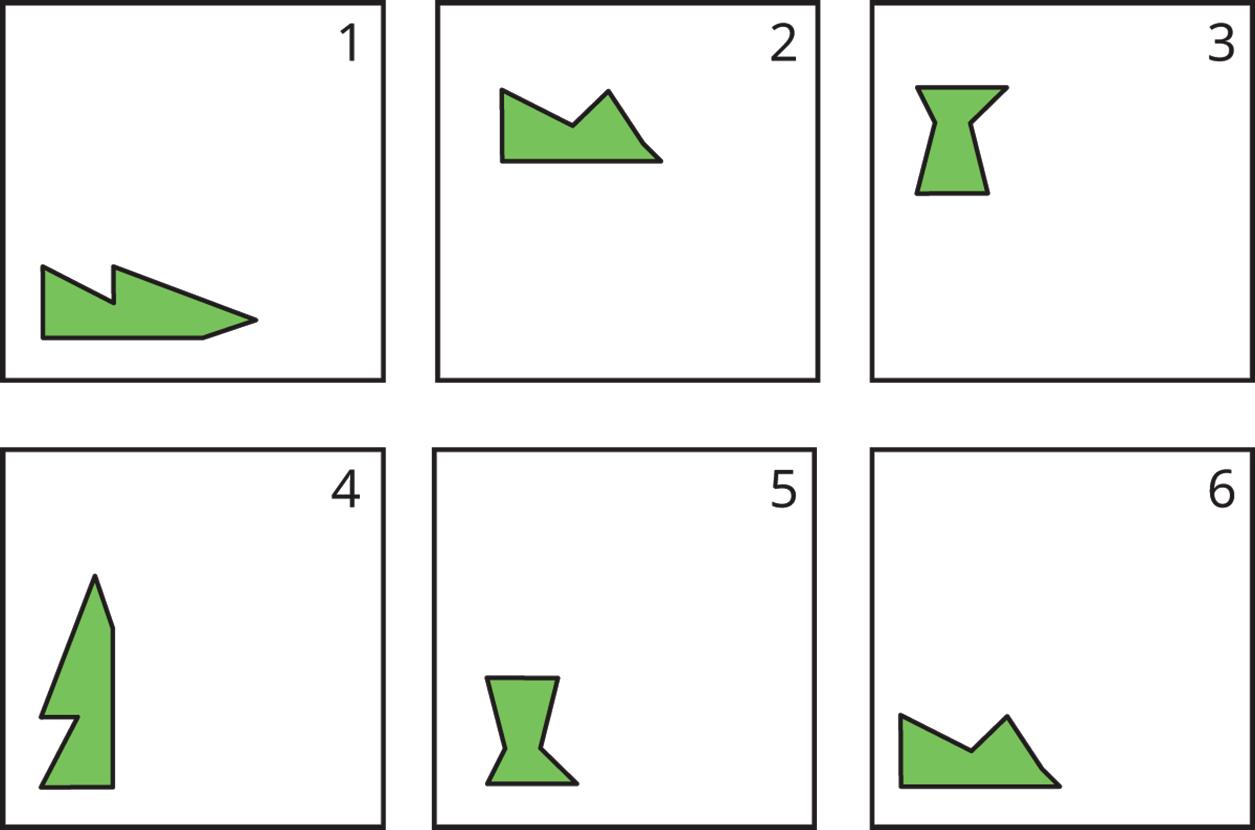
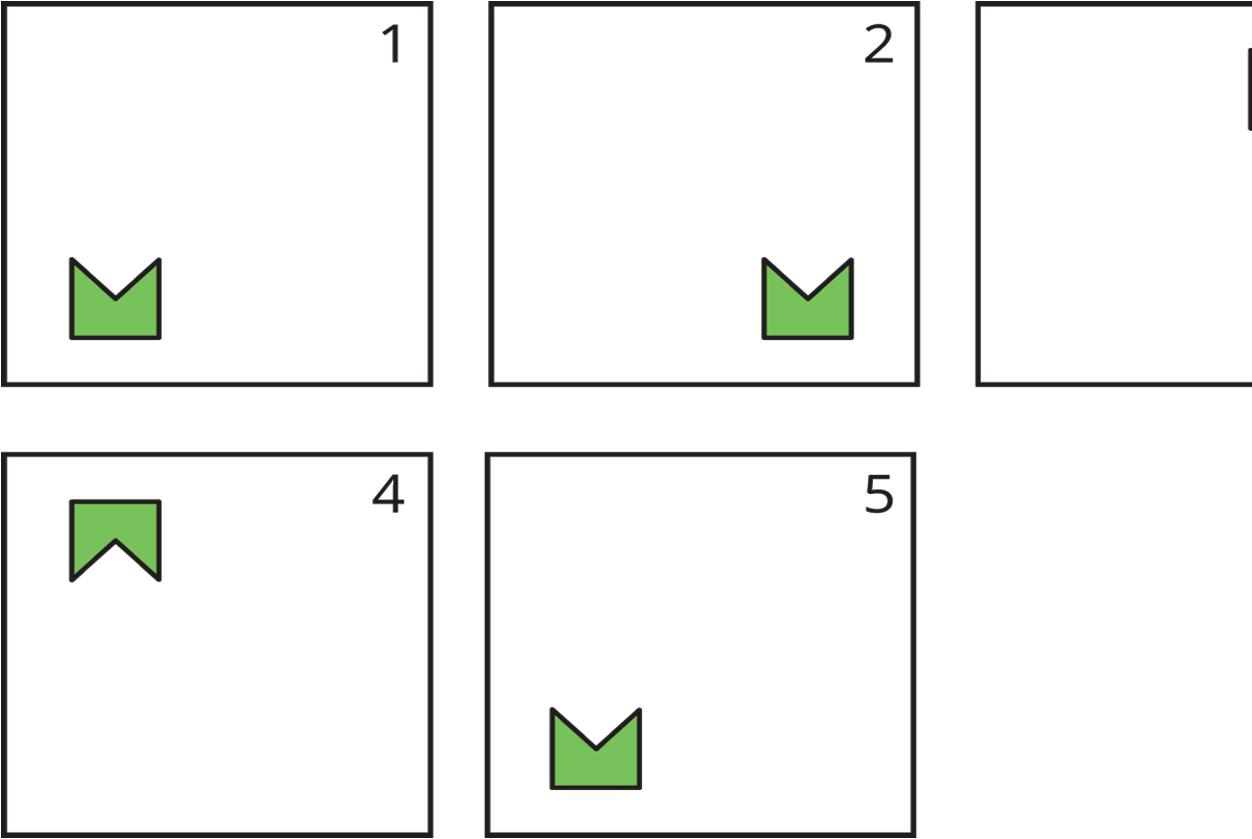
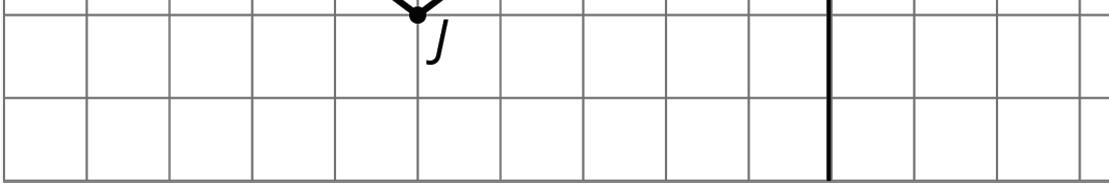
1. The six frames show a shape’s different positions.
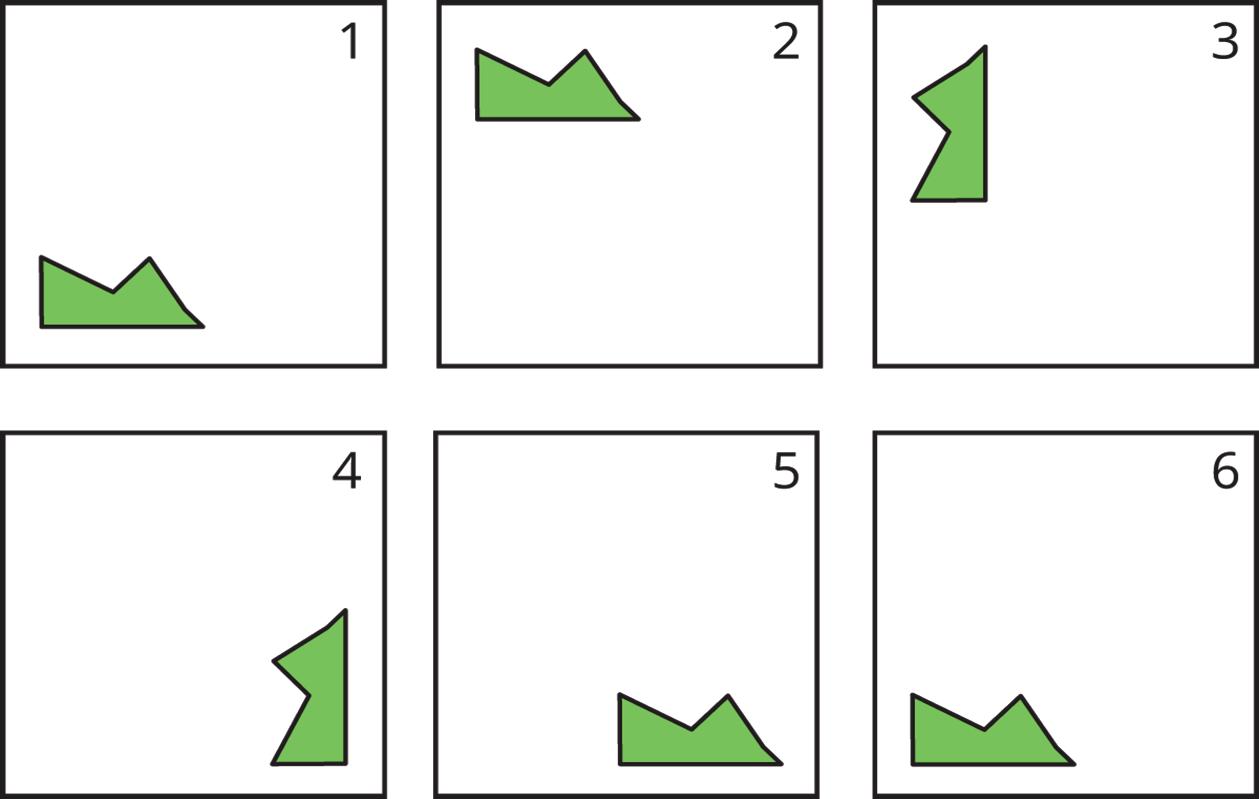
Describe how the shape moves to get from its position in each frame to the next.
Frame 1 to 2: _____________________________________________________
Frame 2 to 3: _____________________________________________________
Frame 3 to 4: _____________________________________________________
Frame 4 to 5: _____________________________________________________
Frame 5 to 6: _____________________________________________________
2. These five frames show a shape’s different positions.

Describe how the shape moves to get from its position in each frame to the next.
Frame 1 to 2: _____________________________________________________
Frame 2 to 3: _____________________________________________________
Frame 3 to 4: _____________________________________________________
Frame 4 to 5: _____________________________________________________
3. Diego started with this shape.
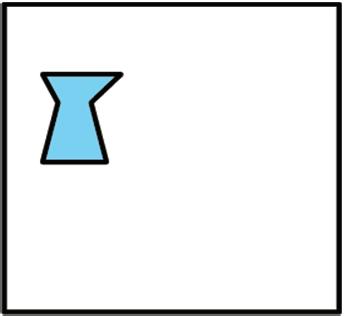
Diego moves the shape down, turns it 90° clockwise, then moves the shape to the right. Draw the location of the shape after each move.
Unit 1, Lesson 2: Naming the Moves
Warm-Up: Describing Movements
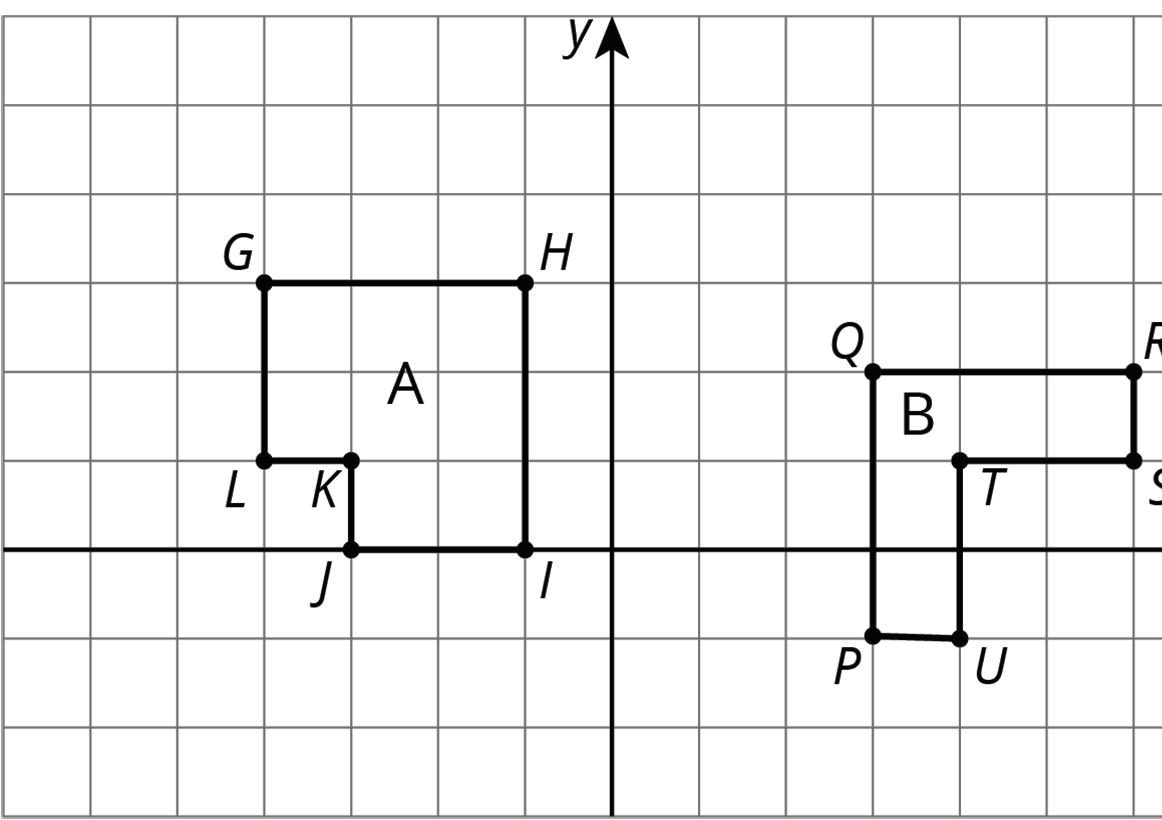
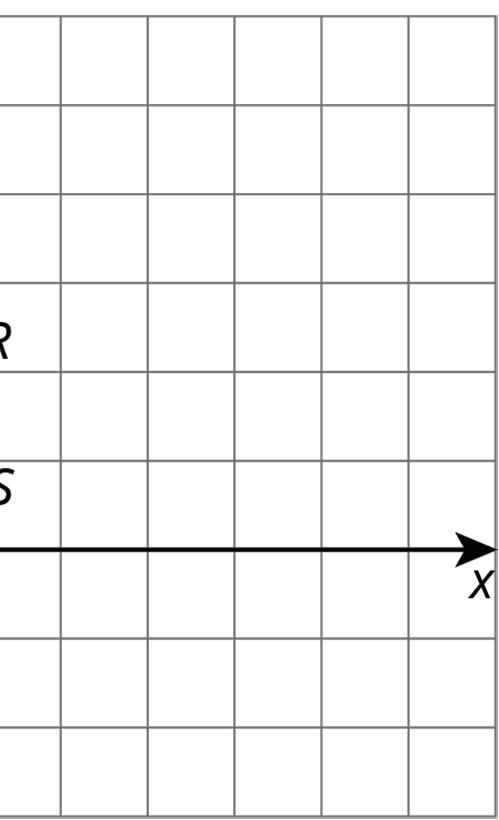
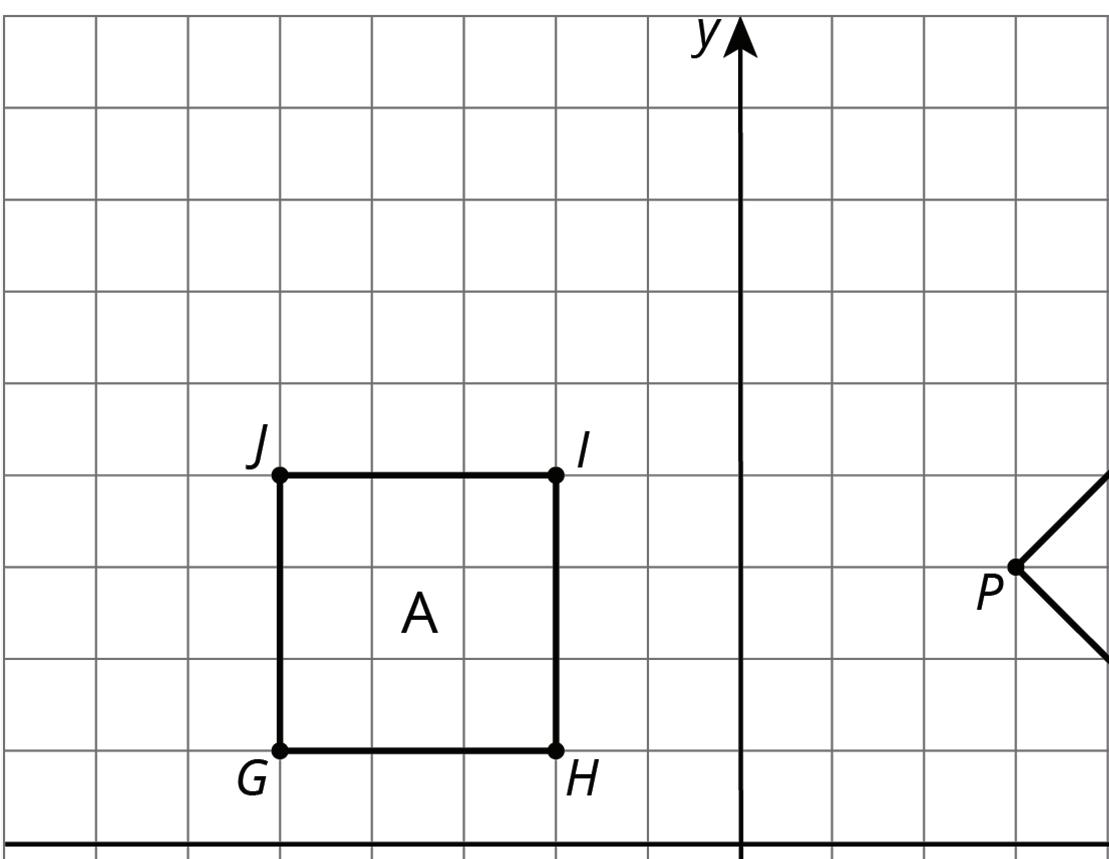
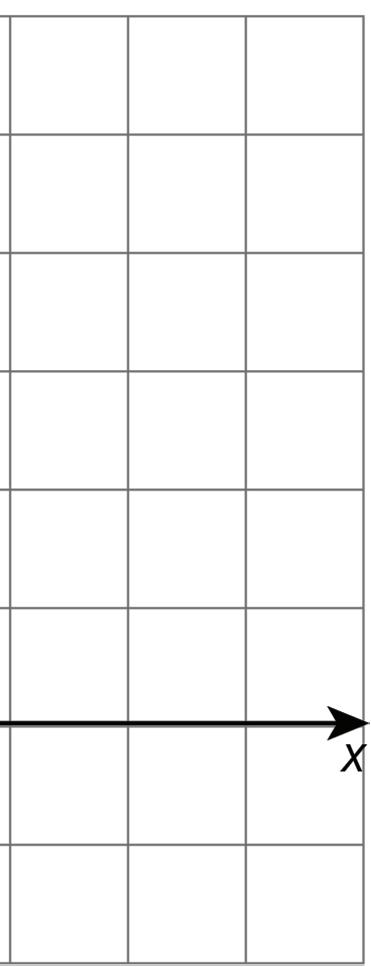
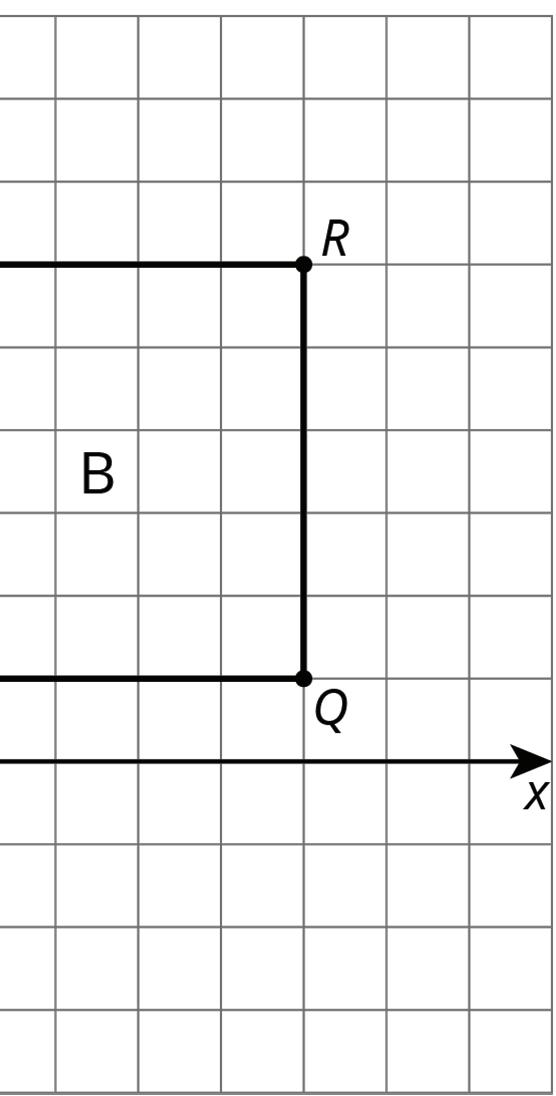
Two different types of movements are shown in the table.
1. Use words or letters from the bank to complete the statements that describe each movement. Some words or letters may not be used. down left right rotation shift slide turn up X Y L
a. Movement A shows a ________________ of ������ ______ and to the __________ to the position of ������.
b. Movement B shows a ________________ of quadrilateral �������� 90° around point _____ to the position of quadrilateral ��������.
Exploration Activity:
How Did You Make That Move?
Here is another set of dance moves.

1. Describe each move or say if it is a new move.
a. Frame 1 to Frame 2
b. Frame 2 to Frame 3
c. Frame 3 to Frame 4
d. Frame 4 to Frame 5
e. Frame 5 to Frame 6
2. How would you describe the new move?
Collaborative Activity: Move Card Sort
Your teacher will give you a set of cards. Sort the cards into categories according to the type of move they show. Be prepared to describe each category and why it is different from the others.
Lesson Summary
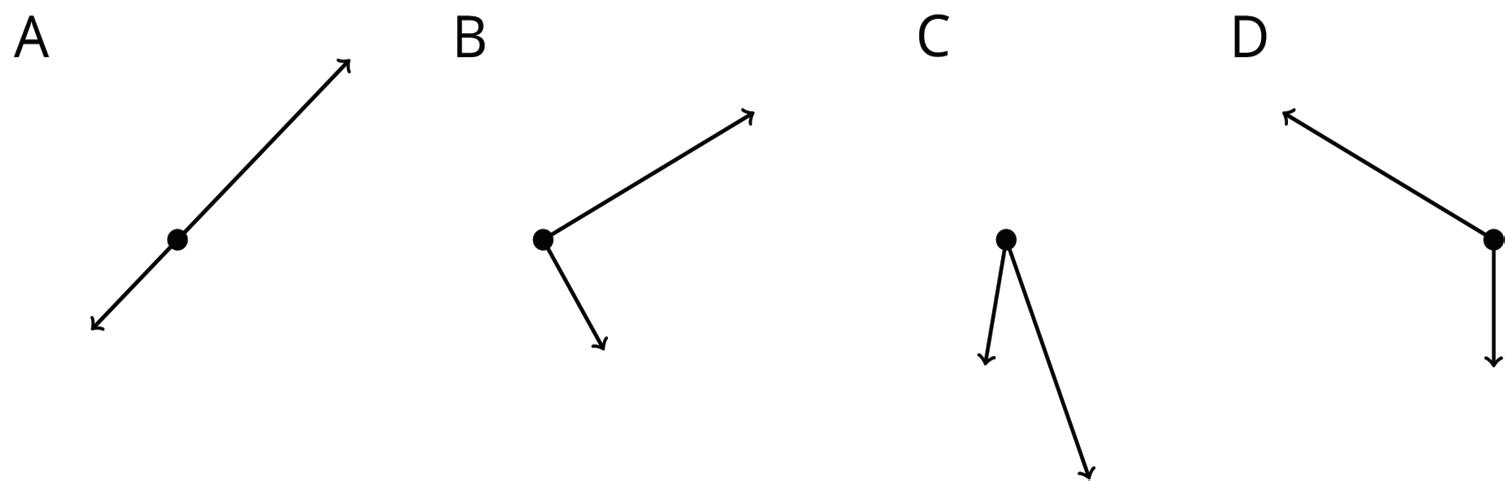
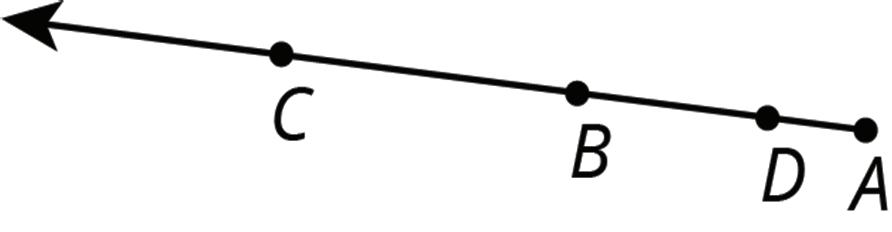
Three different types of moves were explored in this lesson. Each type is described with an example shown.
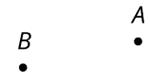
• A translation slides a figure without turning it. Every point in the figure moves the same distance in the same direction. For example, figure A was translated down and to the left, as shown by the arrows. Figure B is a translation of figure A.
A translation is a transformation in which every point in a figure is moved in the same direction and by the same distance.
• A rotation turns a figure about a point, called the center of the rotation. Every point on the figure moves in a circle around the center and forms the same angle with the center. The rotation can be clockwise, going in the same direction as the hands of a clock, or counterclockwise, going in the opposite direction. For example, figure A was rotated 45° clockwise around its bottom vertex. Figure C is a rotation of figure A.
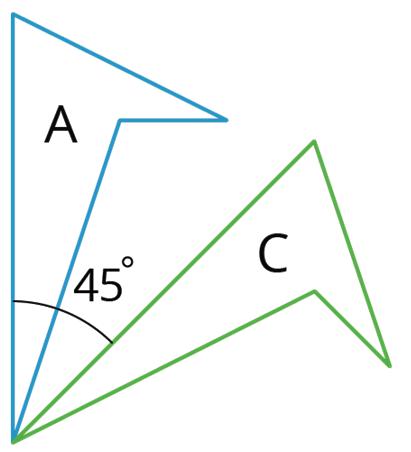
A rotation is a transformation of a figure by turning it about a center point or axis. The amount of rotation can be expressed in the number of degrees. The direction of the rotation for two-dimensional figures can be expressed as clockwise or counterclockwise.
Clockwise means to turn in the same direction as the hands of a clock. The top turns to the right.
Counterclockwise means to turn opposite of the way the hands of a clock turn. It is a turn to the left.
• A reflection moves points to the opposite side of a line of reflection, the same distance from the line of reflection as the original figure. The mirror image is a backward copy of the original figure, with the line of reflection showing where the mirror should stand. For example, figure A was reflected across the dotted line. Figure D is a reflection of figure A.
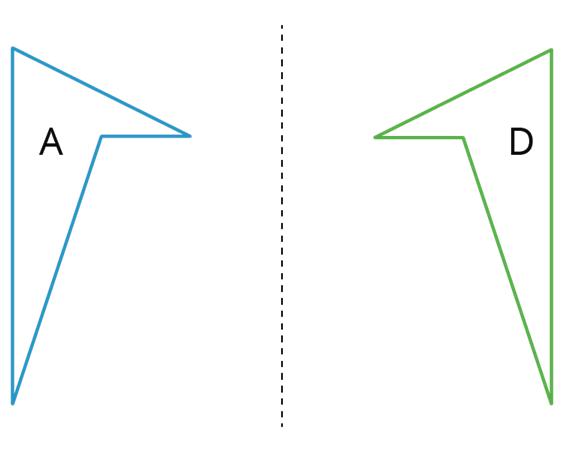
A reflection is a transformation that produces the mirror image of a geometric figure across a line of reflection.
The word image is used to describe the new figure created by moving the original figure, called the preimage. When a point on the preimage moves to another point on the image, these points are called corresponding points.
An image is the result of translations, rotations, and reflections on an object. Every part of the original object moves in the same way to match up with a part of the image.
Practice Problems
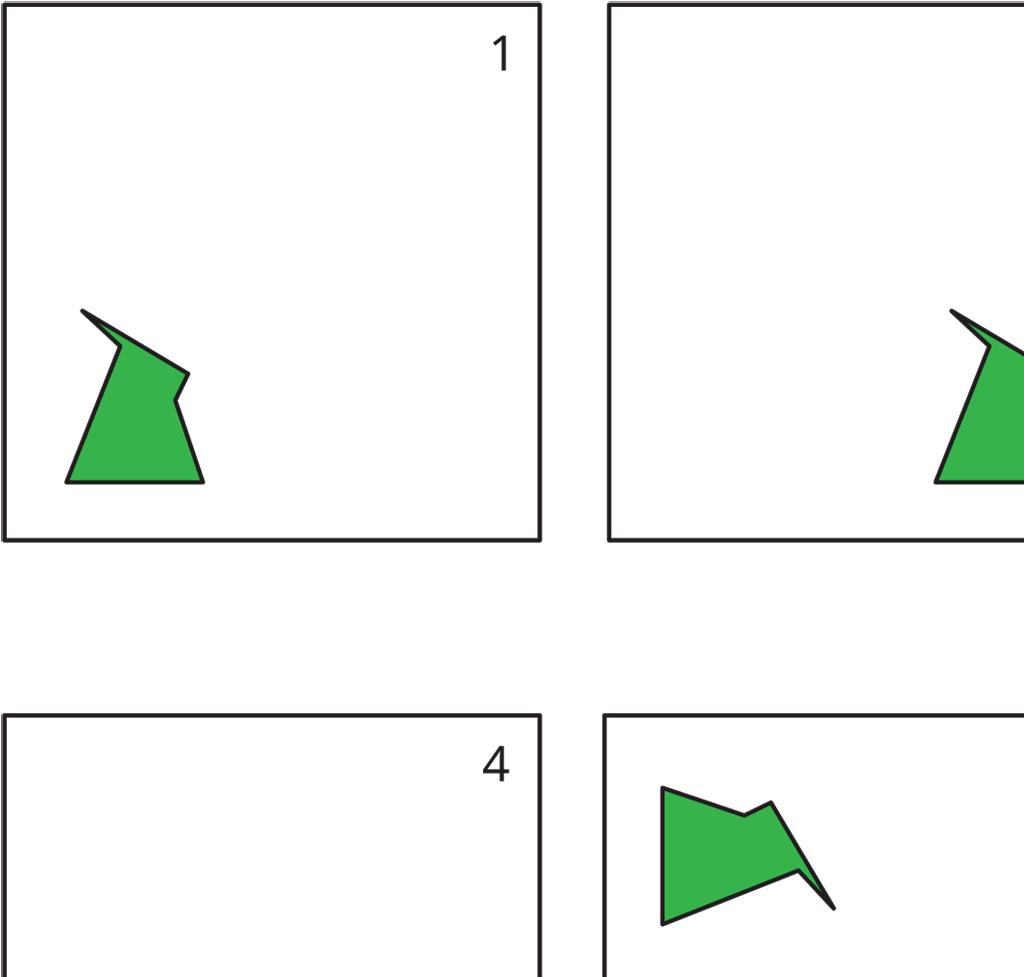
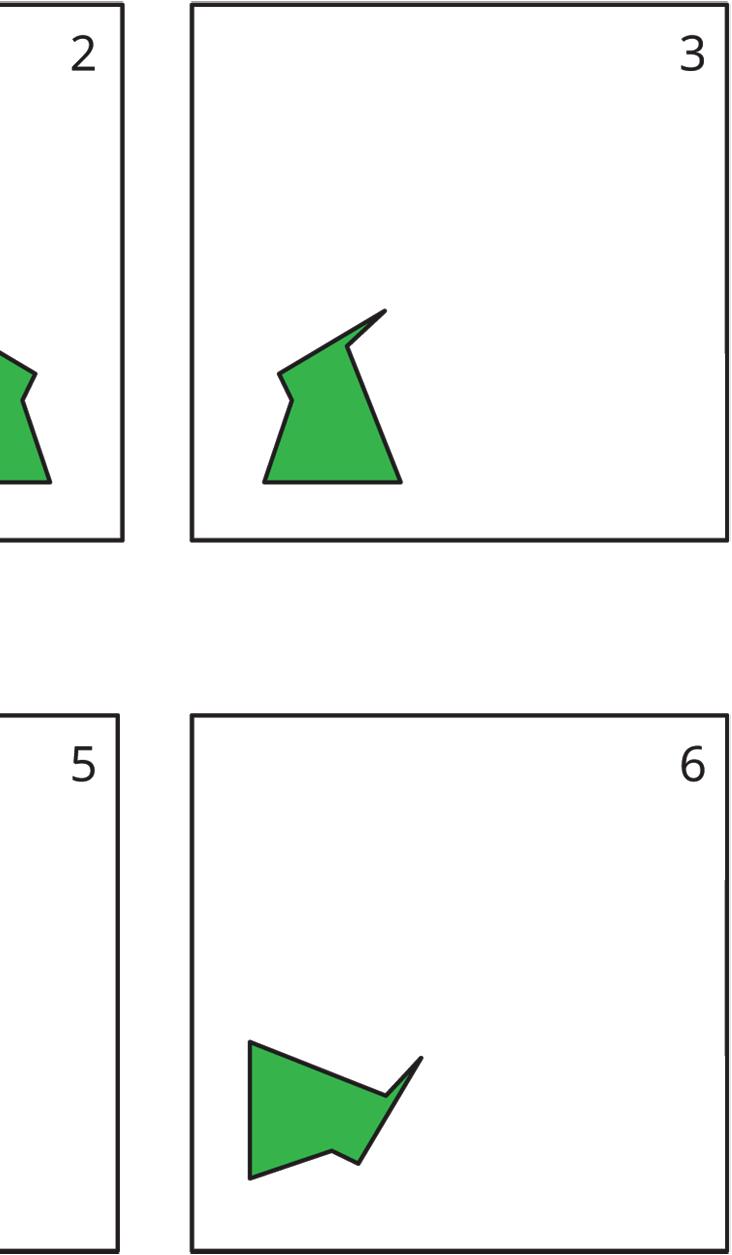
1. Each of the six cards shows a shape.
a. Which pair of cards shows a shape and its image after a rotation?
b. Which pair of cards shows a shape and its image after a reflection?
2. The five frames show a shape’s different positions.

Describe how the shape moves to get from its position in each frame to the next.
Frame 1 to 2: _____________________________________________________
Frame 2 to 3: _____________________________________________________
Frame 3 to 4: _____________________________________________________
Frame 4 to 5: _____________________________________________________
Unit 1, Lesson 3: Grid Moves
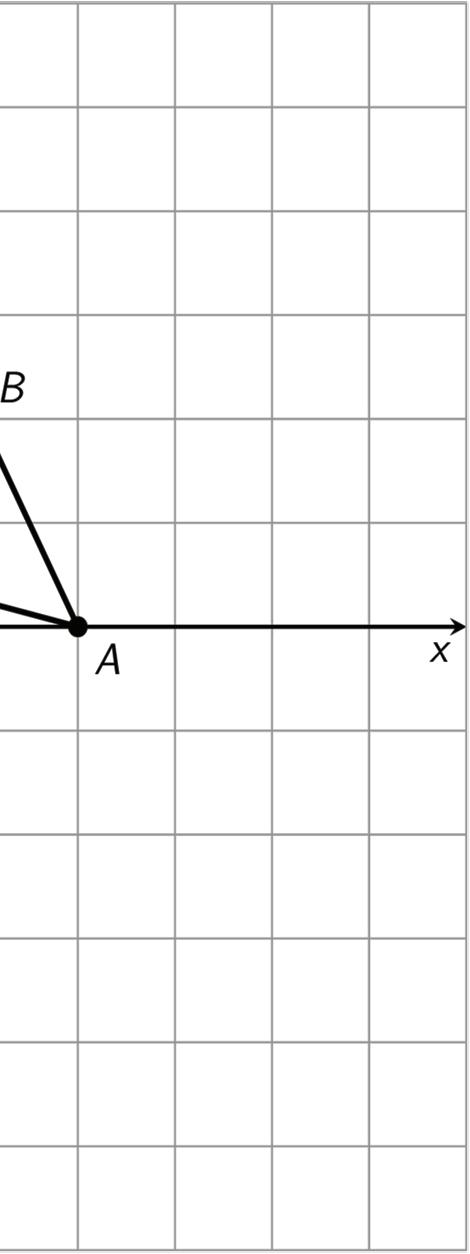
Warm-Up: A Pair of Quadrilaterals
Quadrilateral A can be rotated into the position of Quadrilateral B.
Estimate the angle of rotation.

Guided Activity: Transformation Information
1. The grid shows figures 1–4. Each figure includes Δ������ and another point or a line.
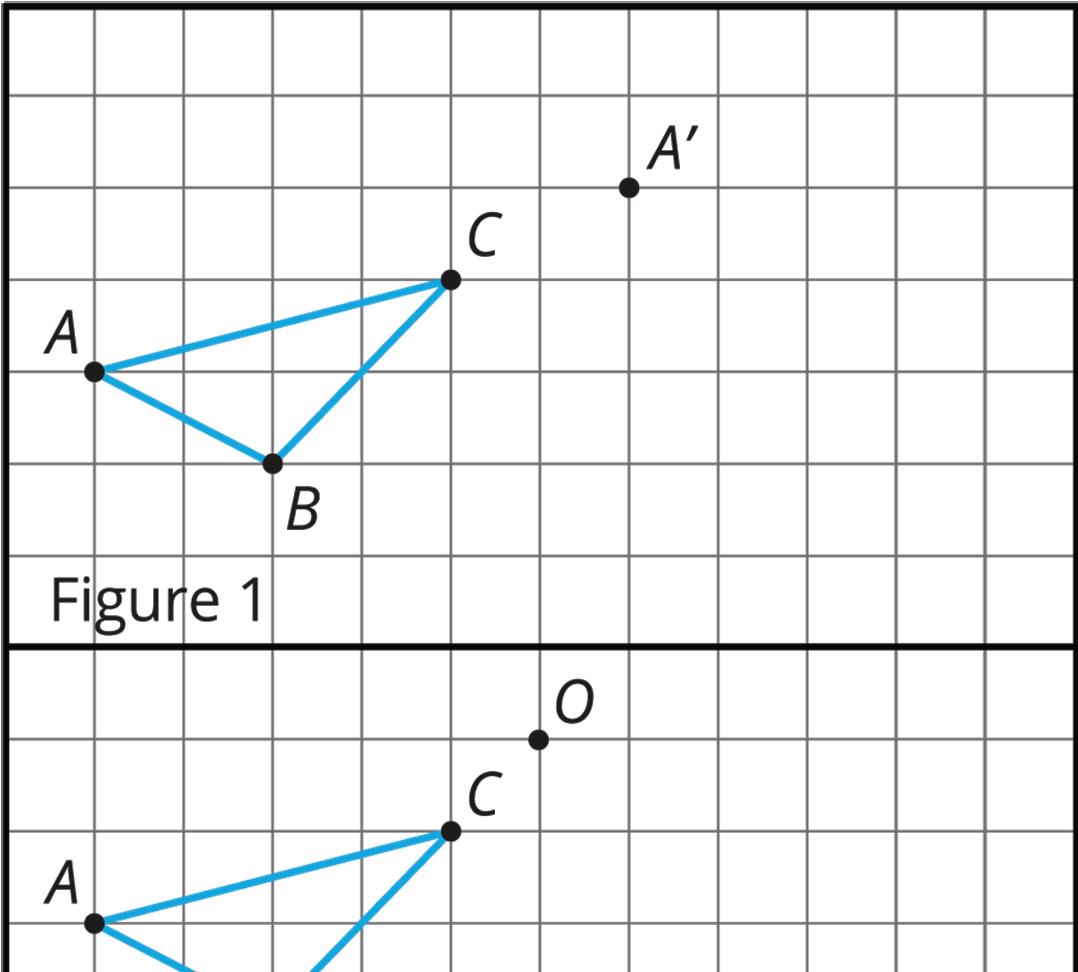

a. In figure 1, translate Δ������ so that point �� maps to point ��′.
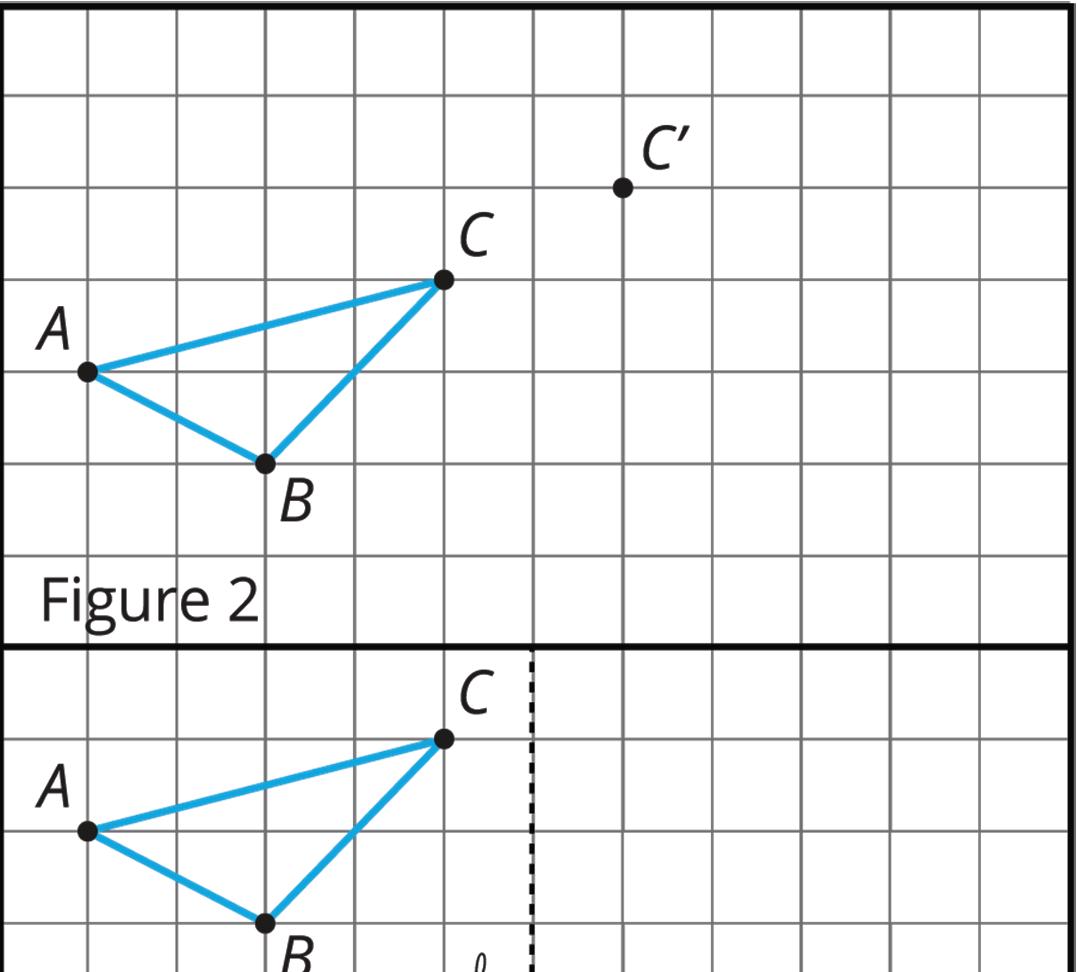
b. In figure 2, translate Δ������ so that point �� maps to point ��′.
c. In figure 3, rotate Δ������ 90° counterclockwise using point �� as the center.
d. In figure 4, reflect Δ������ across line ℓ.
2. The grid shows figures 5–8. Each figure includes quadrilateral ��������.
Figure 5
Figure 6
Figure 7
Figure 8
a. In figure 5, rotate quadrilateral �������� 90° counterclockwise using point �� as the center.
b. In figure 6, rotate quadrilateral �������� 180° clockwise using point �� as the center.
c. In figure 7, reflect quadrilateral �������� across line ��.
d. In figure 8, translate quadrilateral �������� so that point �� maps to point ��.
Collaborative Activity: Make That Move
Your partner will describe the image of this triangle after a certain transformation. Sketch it here.
Lesson Summary
A move, or combination of moves, is called a transformation.
A transformation is a translation, rotation, reflection, or dilation, or a combination of these.
To distinguish the preimage from its image, points in the image are sometimes labeled with the same letters as the preimage but with the symbol ′, as in ��′. This is pronounced “B prime.”
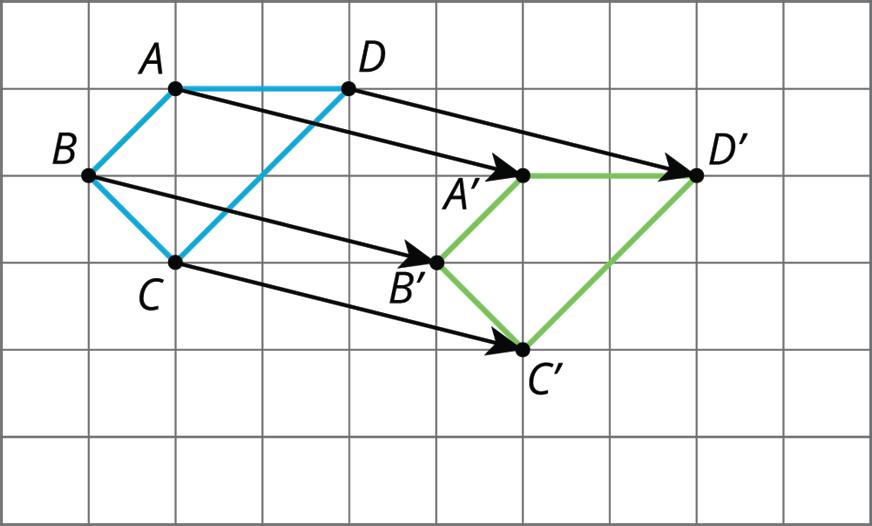
• A translation can be described by two points. If a translation maps point �� to point ��′, it moves the entire figure the same distance and direction as the distance and direction from �� to ��′. The distance and direction of a translation can be shown with an arrow.
For example, a translation of quadrilateral �������� that maps �� to ��′ is shown on the grid.
• A rotation can be described by an angle and a center. The direction of the rotation can be clockwise or counterclockwise.
For example, hexagon ������������ is rotated 90° counterclockwise using point �� as the center of rotation.
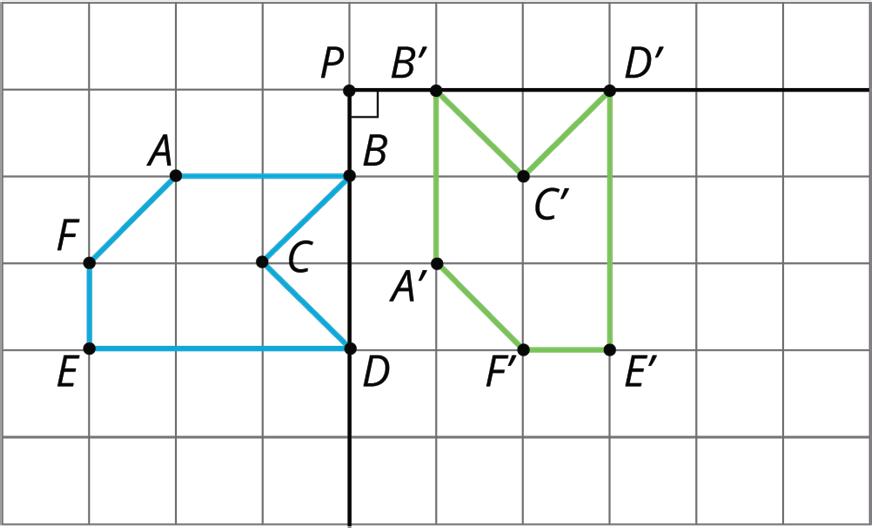
• A reflection can be described by a line of reflection. Each point is reflected directly across the line so that it is just as far from the line, but on the opposite side.
For example, pentagon ���������� is reflected across line ��.
Practice Problems
1. Figure A is shown on the grid with point ��, point ��′, and line ��. Apply each transformation described to figure A.
a. A translation which maps point �� to point ��′
b. A counterclockwise rotation of figure A of 270° using point �� as the center of rotation
c. A reflection of figure A across line ��
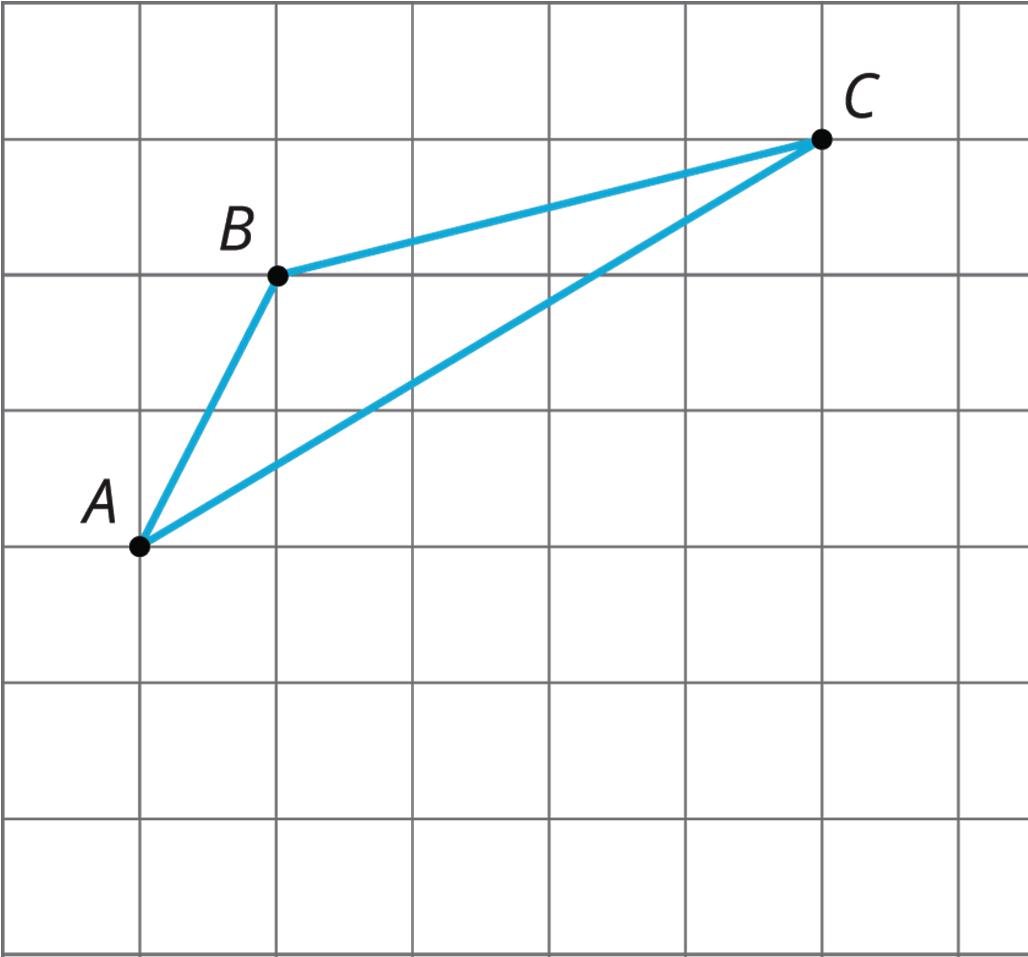
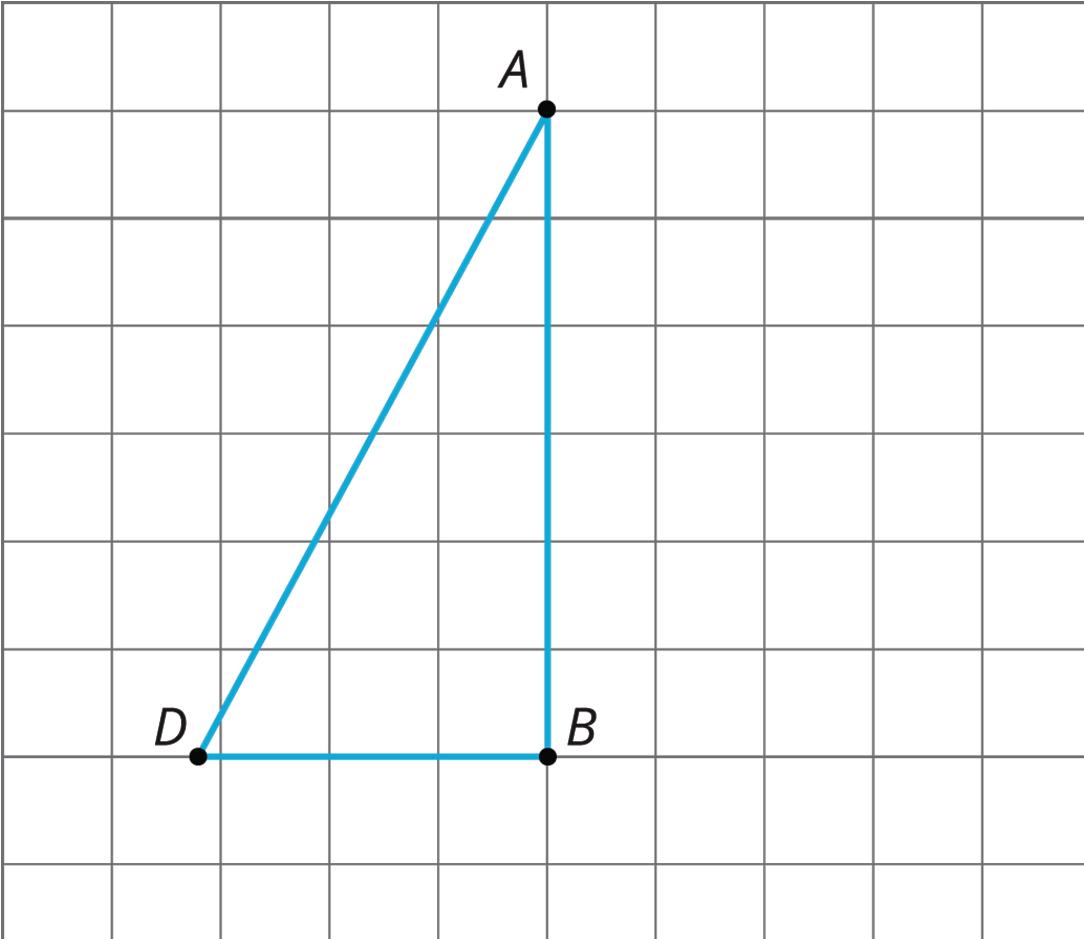
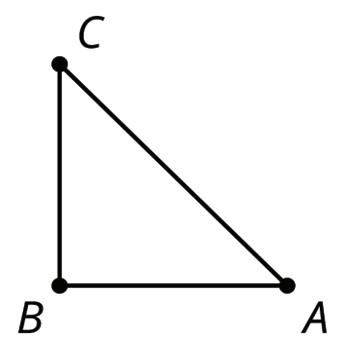
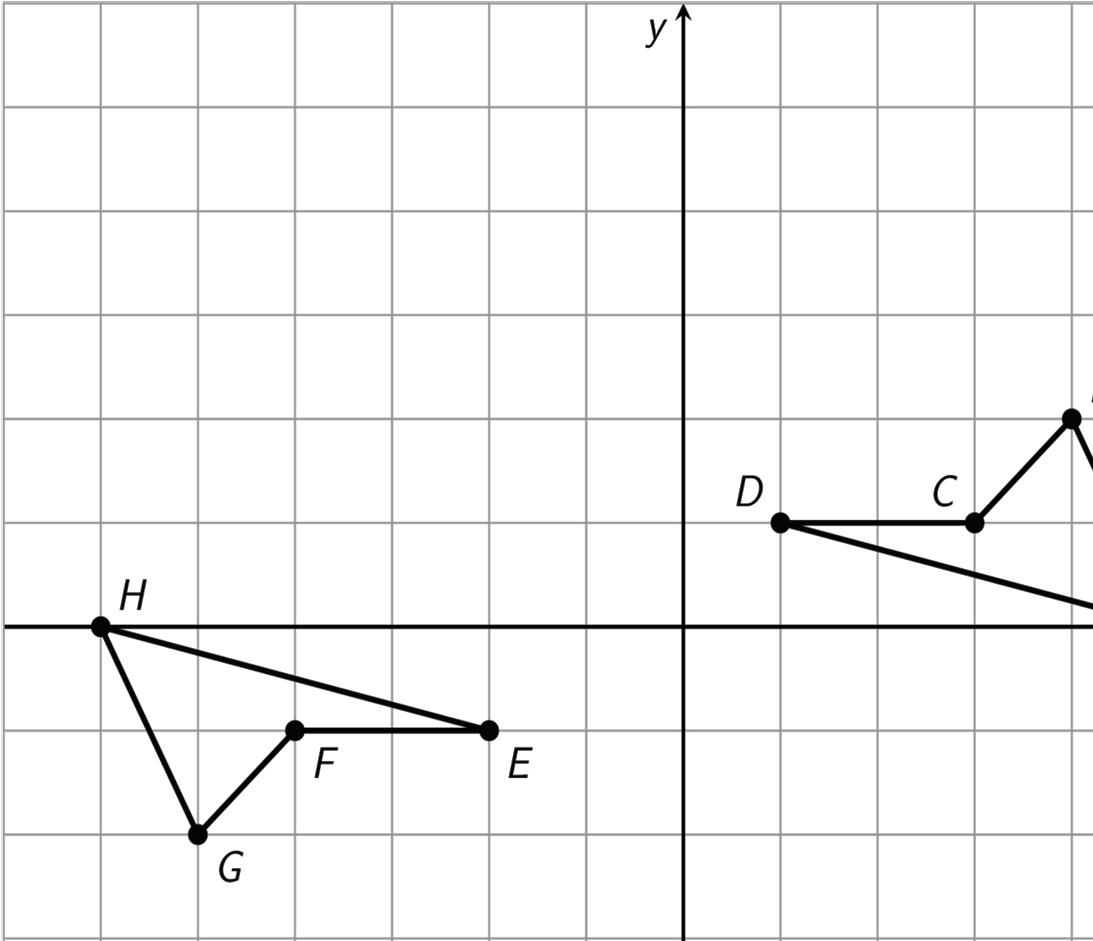
2. Here is triangle ������ drawn on a grid.
On the grid, draw a rotation of ������, a translation of ������, and a reflection of ������. Describe clearly how each was done.
Rotation:
Translation:

Reflection:
Review Problem
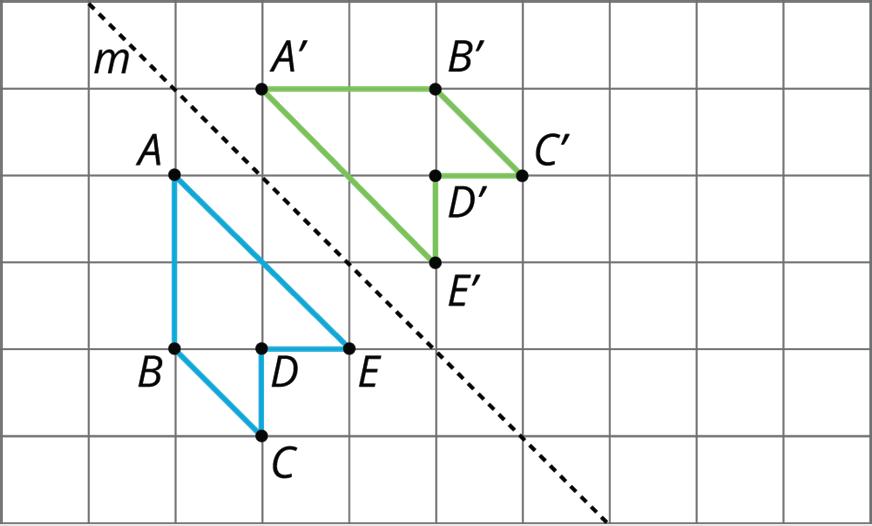
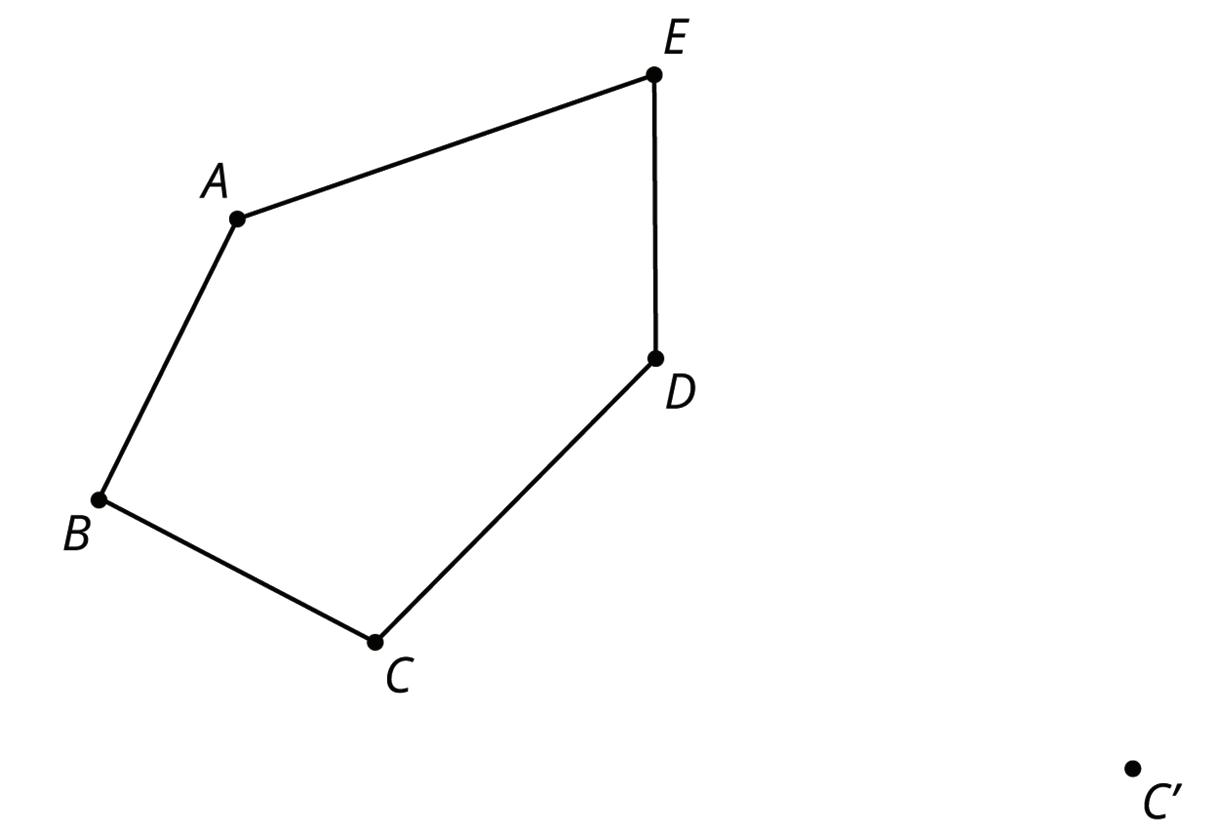
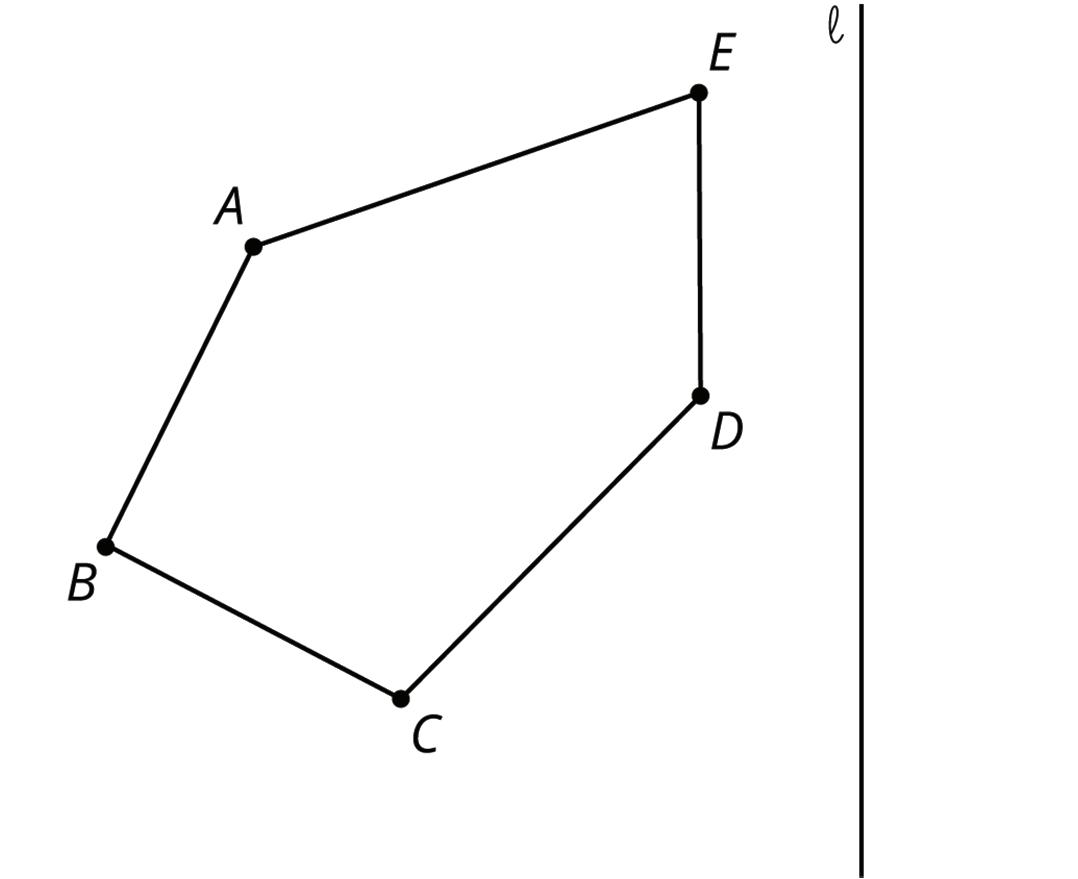
3. Use pengaton ���������� to draw each transformation.
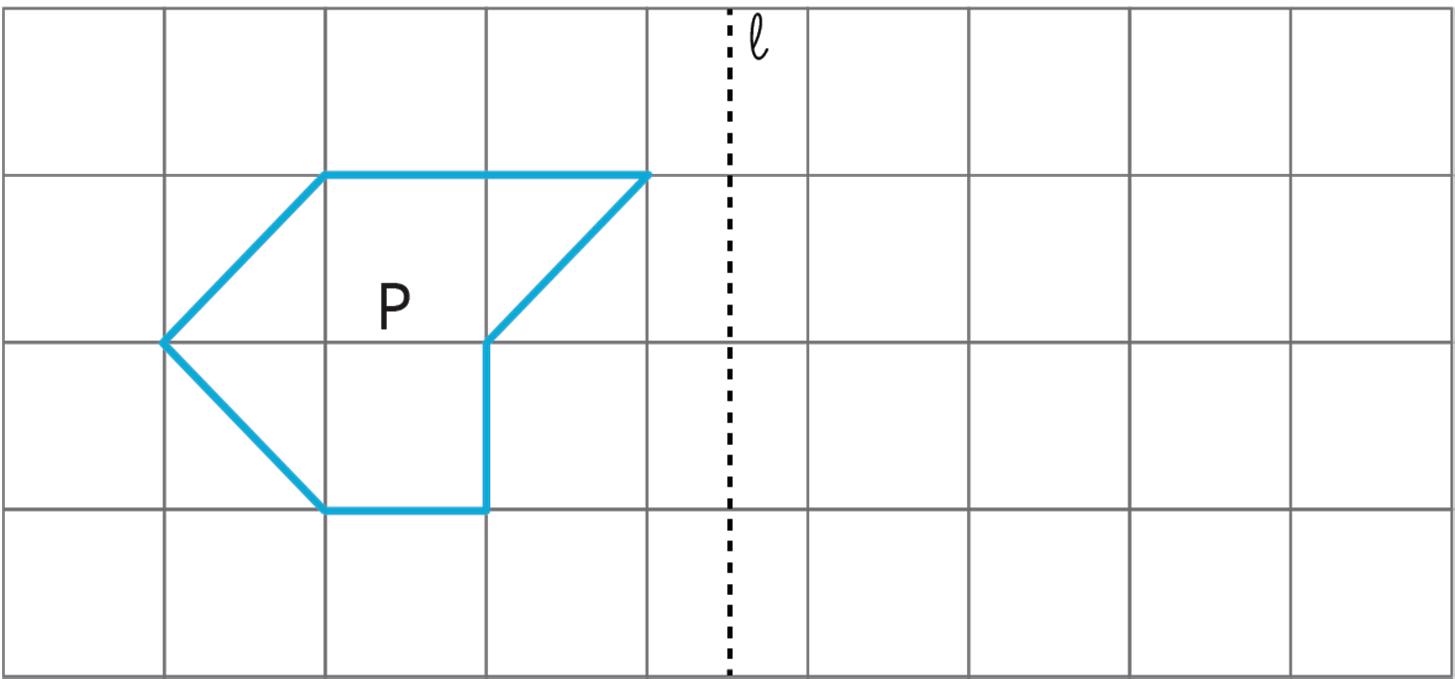
a. Draw the translated image of pentagon ���������� so that vertex �� maps to ��′. Tracing paper may be useful.

b. Draw the reflected image of pentagon ���������� using line of reflection ℓ. Tracing paper may be useful.

c. Draw the rotation of pentagon ���������� 90° clockwise about point ��. Tracing paper and a protractor may be useful.
Unit 1, Lesson 4: Translations
Warm-Up: Describing Patterns
A pattern is formed using ceramic tiles.
1. Describe the geometric transformations that could have been used to make the pattern.
Guided Activity: Defining Translations
Work with your partner to complete the following.
The rigid transformation of moving a figure horizontally or vertically on a plane is called a translation.
1. In the figure shown, quadrilateral �������� was translated to create quadrilateral ��������.
a. Each grid line in the image represents 1 centimeter (cm).
Complete the table.
Corresponding Vertices Distance (cm)
and ��
and ��
and ��
and ��
b. What do you notice about the distances from the vertices of the preimage to the vertices of the image?
c. Complete the statements.
Quadrilateral �������� was translated ____ cm left right to map to quadrilateral ��������.
2. Rigid transformations can also be performed on a coordinate plane. The example shows a translation performed on ������.
Triangle ��′��′��′ is read as “triangle N prime, R prime, S prime.” This notation is often used when a figure has been transformed. Prime notation is most commonly used for the vertices of the image.
The arrows show a possible path of movement, called a mapping. When a figure is translated on the coordinate plane, the figure’s movement is best described as a combination of horizontal and vertical movements, rather than diagonal.
a. Complete the statements to describe the translation of Δ������ to Δ��′��′��′.
• Point �� was translated ____ units left and ____ units down to point ��′.
• Point �� was translated ____ units left and ____ units down to point ��′.
• Point �� was translated ____ units left and ____ units down to point ��′.
b. What do you notice about the number of units and the direction that each point was translated?
Translations can also be described using ordered pairs.
c. Use the answers to part A to complete the statement .
To translate each point on Δ������ to Δ��′��′��′,
add 4 to add 12 to subtract 4 from subtract 12 from the
��-value and add 4 to add 12 to subtract 4 from subtract 12 from the ��-value of each point on ������.
d. Complete the description of the transformation using ordered pairs. Write an operator in each box and a value on each blank line.
(��, ��) → (�� _______ , �� ________)
3. Complete the statements.
a. When describing translations using ordered pairs, horizontal movements impact the ___-values of the ordered pairs. ___________ to the ��-value for movements to the right (→), and ___________ from the ��-value for movements to the left (←).
b. When describing translations using ordered pairs, vertical movements impact the ___-values of the ordered pairs. ___________ to the ��-value for movements up (↑), and ___________ from the ��-value for movements down (↓).
Collaborative Activity: Translations on and off the Coordinate Plane
1. The figure shows quadrilateral �������� and the mapping for vertex ��. Assume the transformation is a translation on the plane.
a. Measure the length of the mapping from point �� to point ��′ to the nearest tenth of a centimeter. What is the distance?
b. Parallel line segments that can be used for the mapping are shown on the image above in gray. Use the measurement from part A and the parallel line segments provided to complete the translation. Draw the mapping from vertices ��, ��, and �� that are the same length and parallel to the first mapping from point �� to point ��′. Label the image quadrilateral ��′��′��′��′.
2. Quadrilateral �������� is shown on the coordinate plane.
a. Translate quadrilateral �������� 4 units to the right and 3 units up. Label the image ��′��′��′��′
b. Draw the mapping to show how each vertex moves from the preimage to the image.
c. Record the coordinates of the vertices of the preimage and image.
d. Describe the relationship between the coordinates of the preimage and image.
Lesson Summary
Translations can be described in words as well as with ordered pairs. To describe a translation, consider how the points on the original figure moved horizontally and vertically. For example, if parallelogram �������� is the result of a transformation performed on parallelogram ��������, the transformation can be described both ways shown in the table.
Using Words
Using Ordered Pairs
A translation 4 units right and 2 units down (��, ��) → (�� + 4, �� − 2)
The vertices of each figure can be used to determine the description, and every point on the preimage maps to the image following the translation described.
Describing transformations with ordered pairs uses the notation (��, ��) →(�� + ℎ, �� + ��), where ℎ is the number of units that each point moves to the right or to the left and �� is the number of units that each point moves up or down. Movements to the right or up are represented by positive values, while movements to the left or down are represented by negative values. The notation (��, ��) → can be read as “any point (��, ��) transforms to.”
Practice Problems
1. In the figure, polygon ���������� is the result of a translation performed on polygon ����������.
a. Record the coordinates of the preimage and the image.
b. Complete the statement.
Polygon ���������� was translated ___ units right left and ___ units up down to create polygon ����������.
2. Triangle ��′��′��′ is the result of a translation of Δ������ that can be described as (��, ��) → (�� − 5, �� − 2). Draw Δ��′��′��′ on the coordinate plane, label the image, and draw the mapping.
3. Use a straightedge to complete the translation of Δ������ started below. Label the image Δ��′��′��′, and draw the mapping of vertices �� and ��.
4. Triangle T and triangle U are shown on the coordinate plane.
a. Describe the transformation of triangle T to triangle U using words.
b. Describe the transformation of triangle T to triangle U using ordered pairs.
Review Problem
5. Triangle ������ is shown on the grid with line ��.
Unit 1, Lesson 5: Reflections
Warm-Up: Reflection Quick Image
Here is an incomplete image. Your teacher will display the completed image twice, for a few seconds each time. Your job is to complete the image on your copy.
Exploration Activity: Reflecting Points on the Coordinate Plane
1. Here is a list of points �� = (0.5, 4) �� = (−4, 5) �� = (7, −2) �� = (6, 0) �� = (0, −3)
On the coordinate plane:
a. Plot each point and label each with its coordinates.
b. Using the ��-axis as the line of reflection, plot the image of each point.
c. Label the image of each point with its coordinates.
d. Include a label using a letter. For example, the image of point �� should be labeled ��′.

2. If the point (13, 10) were reflected using the ��-axis as the line of reflection, what would be the coordinates of the image? What about (13, −20)? (13, 570)? Explain how you know.
3. The point �� has coordinates (3, 2).
a. Without graphing, predict the coordinates of the image of point �� if point �� was reflected using the ��-axis as the line of reflection.
b. Check your answer by finding the image of �� on the graph.
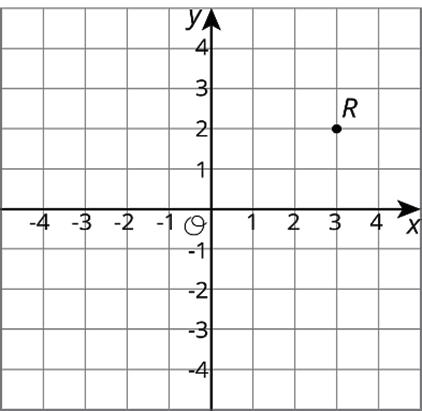
c. Label the image of point �� as ��′.
d. What are the coordinates of ��′?
4. Suppose you reflect a point using the ��-axis as line of reflection. How would you describe its image?
Guided Activity: Reflections on the Coordinate Plane
1. On the coordinate plane shown, Δ������ is reflected to create Δ��′��′��′.
a. What is the line of reflection?
b. Complete the table with the coordinates of each vertex.
c. What do you notice about the coordinates of the corresponding vertices in the preimage and the image?
2. Quadrilateral �������� is shown on the coordinate plane.
a. Complete the left side of the table for points ��, ��, ��, and ��.
b. Reflect quadrilateral �������� across the ��-axis. Label the image quadrilateral ��′��′��′��′.
c. Complete the right side of the table in part A for vertices ��′, ��′, ��′, and ��′.
d. Describe what you notice about the coordinates of the corresponding vertices in the preimage and the image.
Lesson Summary
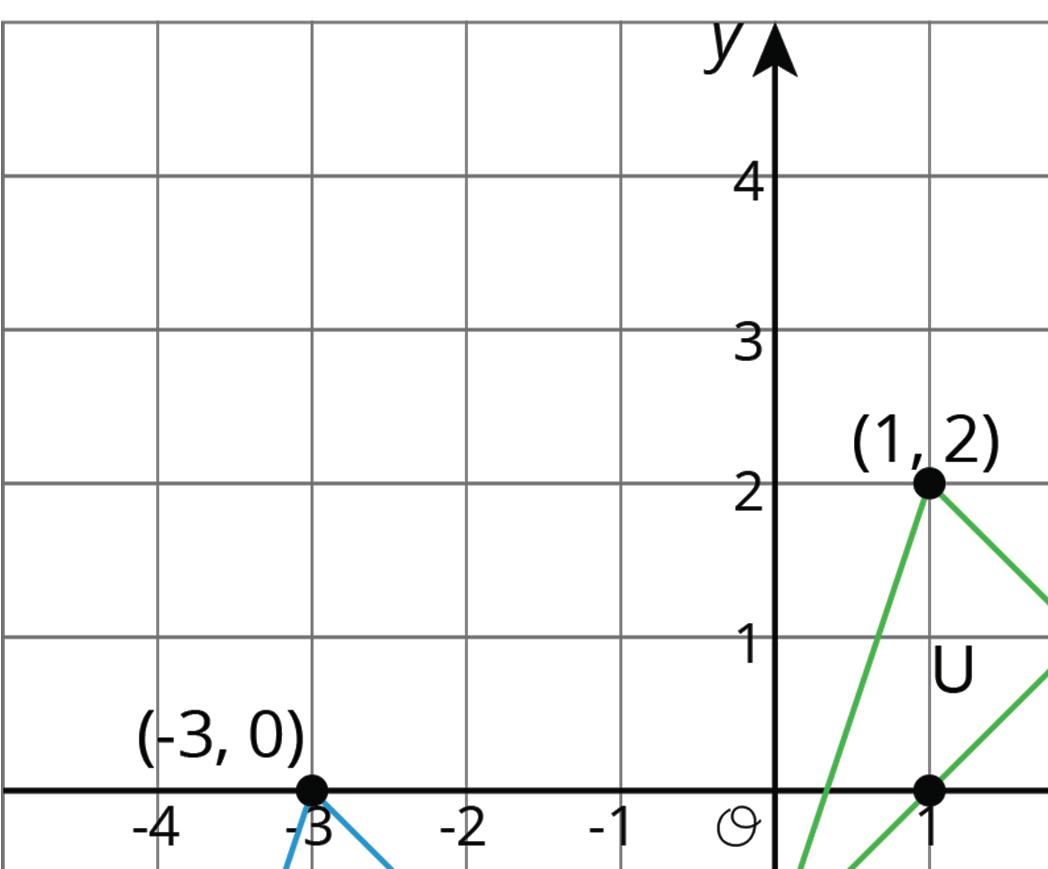
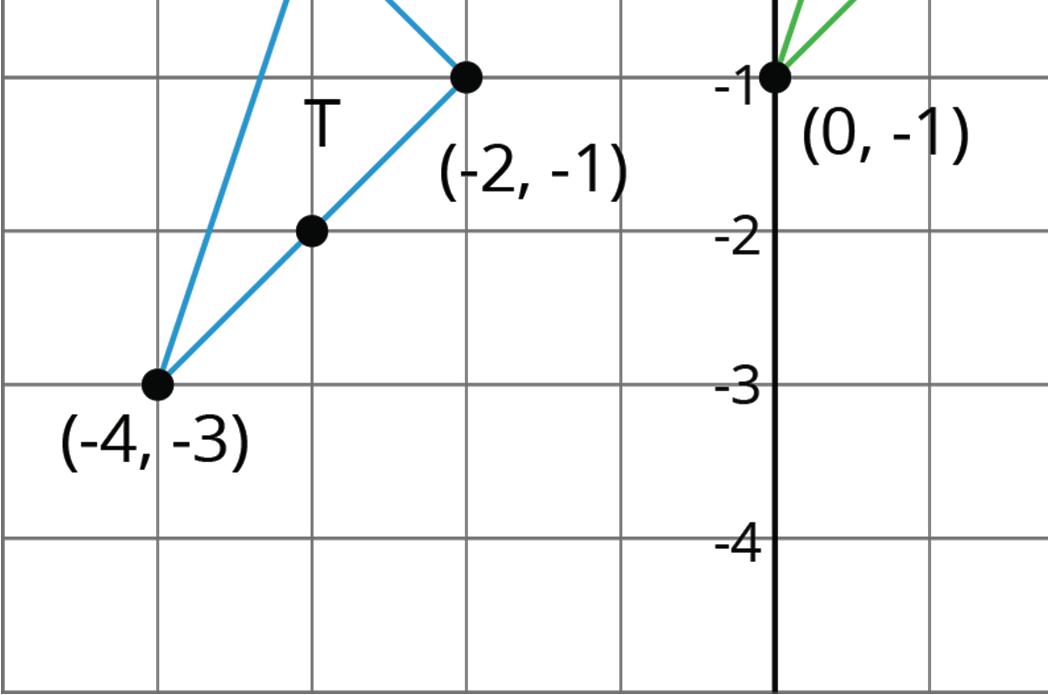
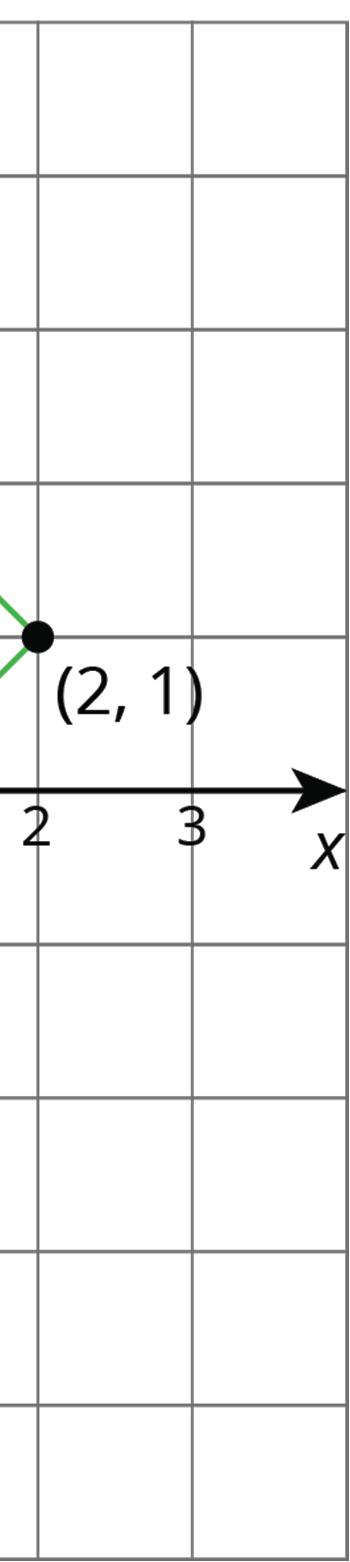
Ordered pairs, or coordinate pairs, describe the location of points on the coordinate plane. Different patterns can be found by comparing how the coordinates of a point change after applying a transformation.
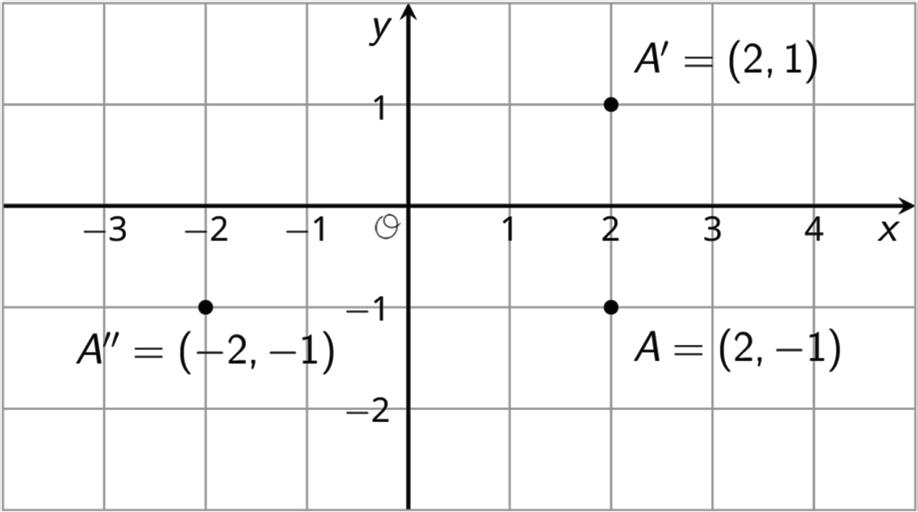
Reflecting a point across an axis changes the sign of 1 coordinate.
For example, the coordinates of point �� are (2, −1).
• Reflecting point �� across the ��-axis changes the sign of the ��-coordinate. Point ��′, whose coordinates are (2, 1), represents this reflection.
• Reflecting point �� across the ��-axis changes the sign of the ��-coordinate. Point ��″, whose coordinates are (−2, −1), represents this reflection.
Reflections across other lines on the coordinate plane are possible and will be explored in future courses.
Practice Problems
1. Reflect polygon �� using line ℓ.
2. The coordinates of the vertices of ������ are given in the table.
Point �� (−3, −5)
Point �� (6, −2)
Point �� (−5, −1)
a. Plot ������ on the coordinate plane.
Point ��′
Point ��′
Point ��′
b. Reflect Δ������ across the ��-axis. Label the image Δ��′��′��′.
c. Record the coordinates of the vertices of Δ��′��′��′ in the table.
d. Describe the relationship between the corresponding vertices of the preimage and image.
Review Problems
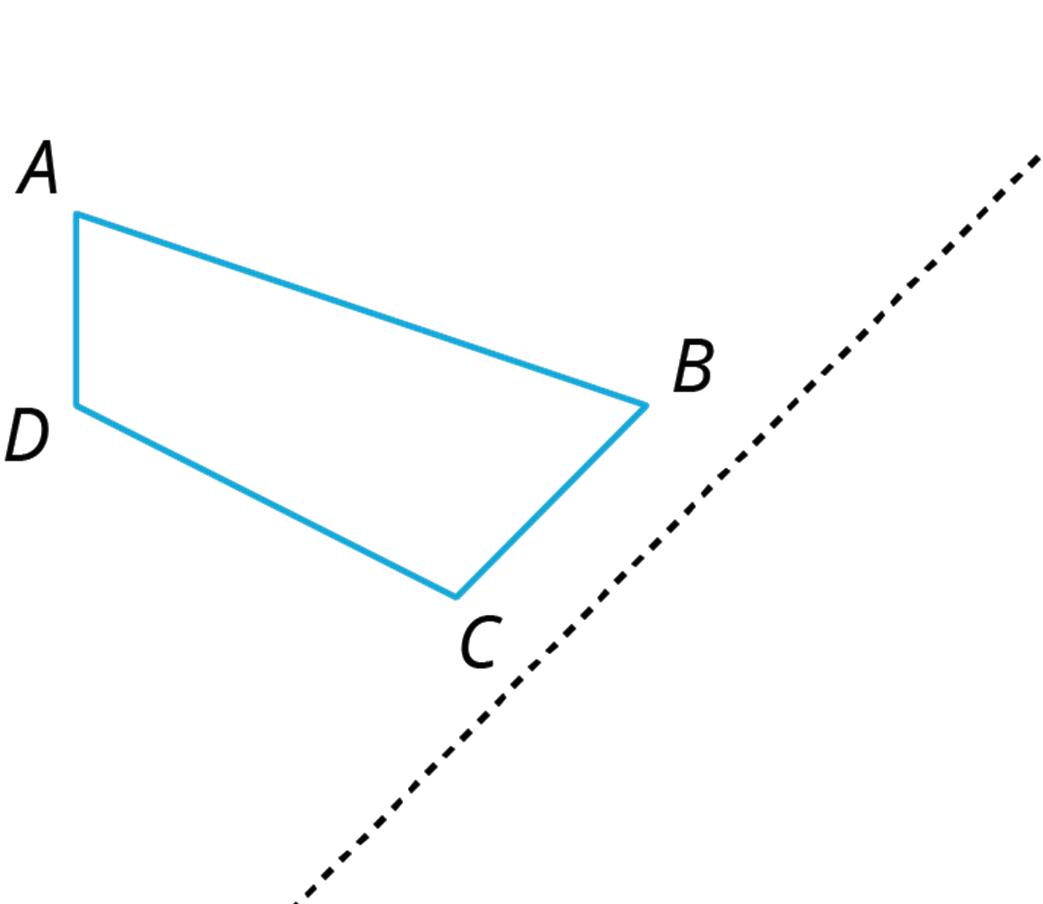
3. Here is quadrilateral �������� and line ℓ.
Draw the image of quadrilateral �������� after reflecting it across line ℓ.

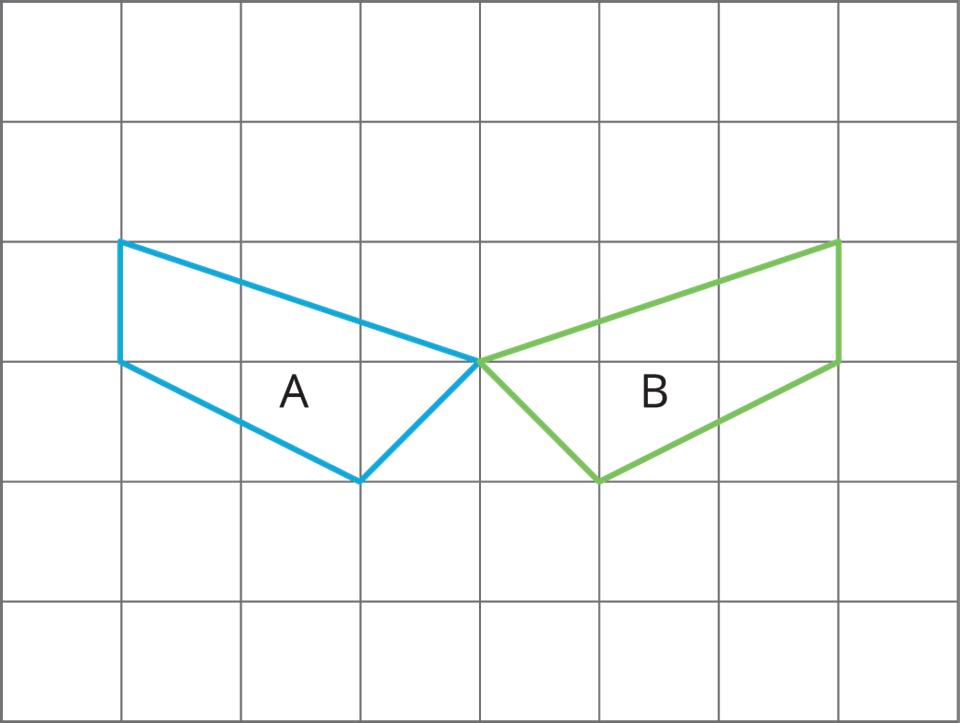
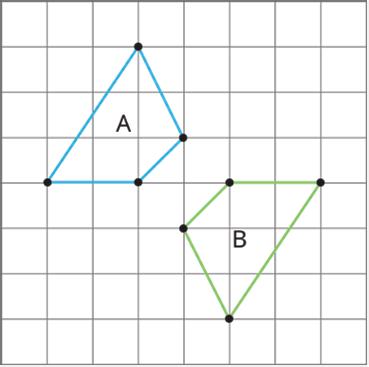
4. Each picture shows two polygons, one labeled Polygon A and one labeled Polygon B. Describe how to move Polygon A into the position of Polygon B using a transformation.
Unit 1, Lesson 6: Rotations
Warm-Up: Building a Quadrilateral
A right isosceles triangle is shown.
1. Rotate Δ������ 90° clockwise about point ��.
2. Rotate Δ������ 180° clockwise about point ��.
3. Rotate Δ������ 270° clockwise about point ��.
4. Explain what would it look like if the 4 triangles were rotated 90°, 180°, or 270° clockwise about point ��.
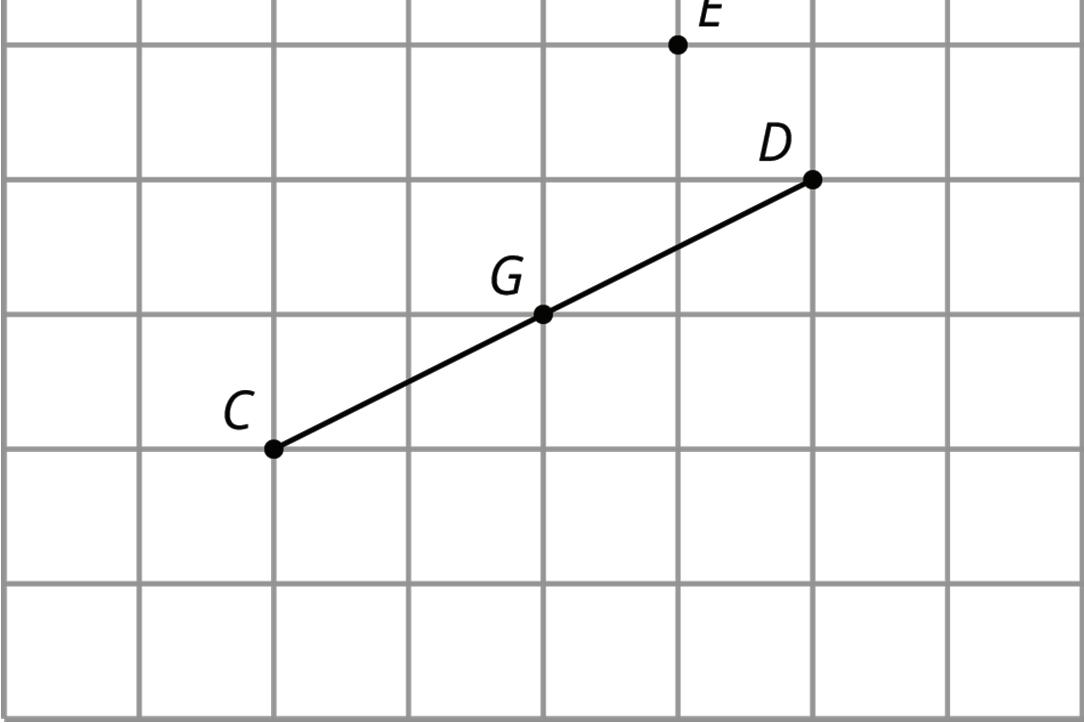
Exploration Activity: Rotating a Segment
1. Rotate segment ���� 180° around point ��. Draw its image and label the image of �� as ��.
2. Rotate segment ���� 180° around point ��. Draw its image and label the image of �� as �� and the image of �� as ��.
3. Rotate segment ���� 180° around its midpoint, ��. What is the image of ��?
4. What happens when you rotate a segment 180° around a point?

Guided Activity: Rotations on the Coordinate Plane
1. On the coordinate plane, ∆������ is rotated to create ∆��′��′��′.
a. There are 2 ways to describe the rotation. Complete both statements using the information given in the figure.
∆������ was rotated _____° clockwise about the origin to create ∆��′��′��′.
∆������ was rotated _____° counterclockwise about the origin to create ∆��′��′��′.
b. For every rotation clockwise, there is a rotation counterclockwise that would create the same image. Complete the table.
c. Explain what would happen if a figure were rotated 360° with the origin as the center of rotation.
2. Triangle ������ is shown on the coordinate plane.
Triangle ��′��′��′ is the image created by rotating ∆������ 180° clockwise about the origin.
a. To graph the rotation, follow the steps shown.
• Because a 180° angle forms a straight line, use a straightedge to draw a dotted line from point �� through the origin that extends to the end of the grid.
• Plot and label point ��′ on the dotted line so that ��′��′ is congruent to ����.
• Use a straightedge to draw a dotted line from point �� through the origin that extends to the end of the grid.
• Plot and label point ��′ on the dotted line so that ��′��′ is congruent to ����.
• Connect the vertices to create ∆��′��′��′.
b. Describe how point �� and point ��′ relate to each other.
c. Complete the table with the coordinates of each point.
d. What do you notice about the coordinates of the corresponding points in the preimage and the image after this rotation?
Collaborative Activity: Rotational Symmetry
A figure has symmetry if there is a rigid transformation which moves the figure onto itself. A figure is considered to have rotational symmetry when, after a rotation around the center of the figure is applied, the image is mapped onto itself.
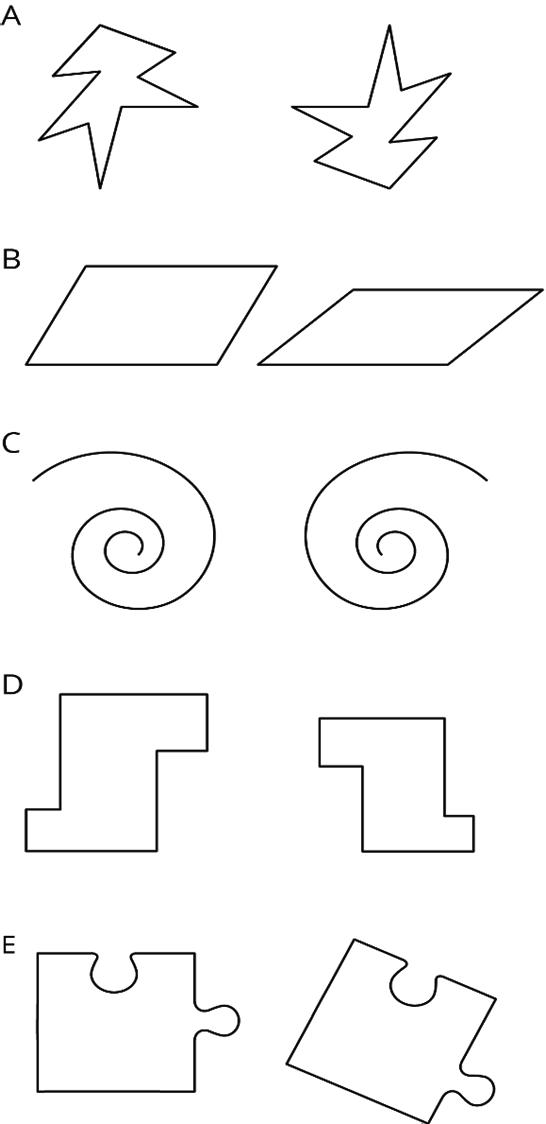
Four images are shown.


1. Discuss with your partner whether each image has rotational symmetry. Summarize your discussion.
Image A
Image B
Image C
Image D
2. Complete the chart by determining the minimum rotation angle needed to map each polygon onto itself.
Minimum Rotation Angle to Map Polygon onto Itself
Isosceles triangle
Equilateral triangle
Square
Parallelogram
Isosceles trapezoid
3. Draw a figure that does not have rotational symmetry.
Polygon
Figure
Lesson Summary
The center of rotation for a figure doesn’t have to be one of the points on the figure. To determine the center of rotation given a preimage and an image, look for a point that is the same distance from 2 corresponding points. It is best to do this for multiple pairs of corresponding points.
A point can be rotated about a center point using any angle measure. For rotations on the coordinate plane in this course, the focus is on 90°, 180°, and 270° rotations about the origin in both clockwise and counterclockwise directions.
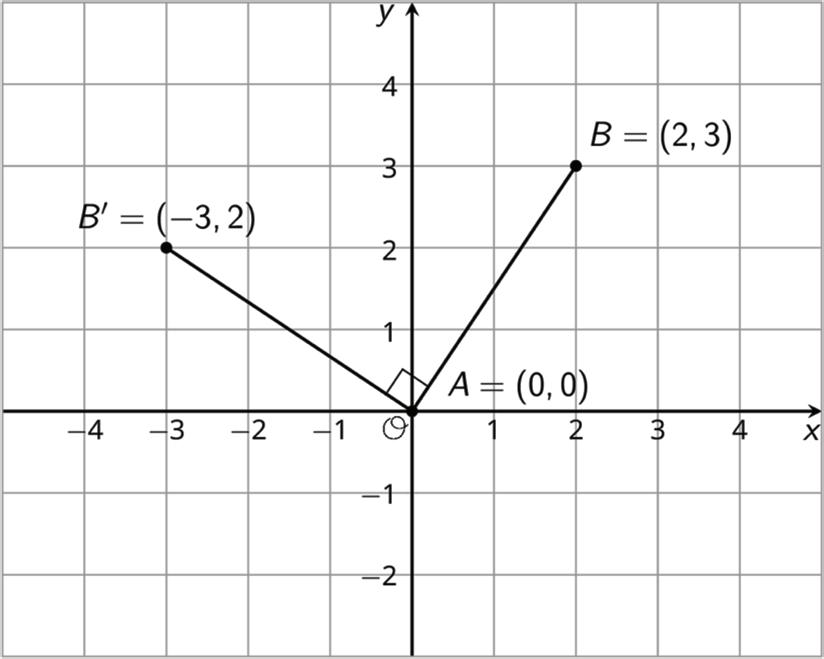
An example of a rotation about the origin, (0, 0), is shown.
• Point �� has coordinates (0, 0). Line segment ���� was rotated 90° counterclockwise about point ��.
• Point ��, with coordinates (2, 3), rotates to point ��′, with coordinates (− 3, 2).
• The points �� and ��′ form a 90° angle at the origin, point ��, in the counterclockwise direction.
Figures can also map onto themselves following a rotation if they have rotational symmetry
A figure has rotational symmetry if there is a rotation that takes the figure onto itself. (We don’t count rotations using angles such as 0° and 360° that leave every point on the figure where it is.)
Practice Problems
1. A regular octagon is shown.
a. Determine if the shape has rotational symmetry.
b. Determine the minimum rotation angle needed to map the polygon onto itself.
2. Triangle ������ is shown on the coordinate plane.
a. Rotate Δ������ 270° counterclockwise with the origin as the center of rotation. Label the image Δ��′��′��′.
b. What is another way to describe the rotation performed in part A?
3. Lin says that she can map Polygon A to Polygon B using only reflections. Do you agree with Lin? Explain your reasoning.
Unit 1, Lesson7: Describing Transformations
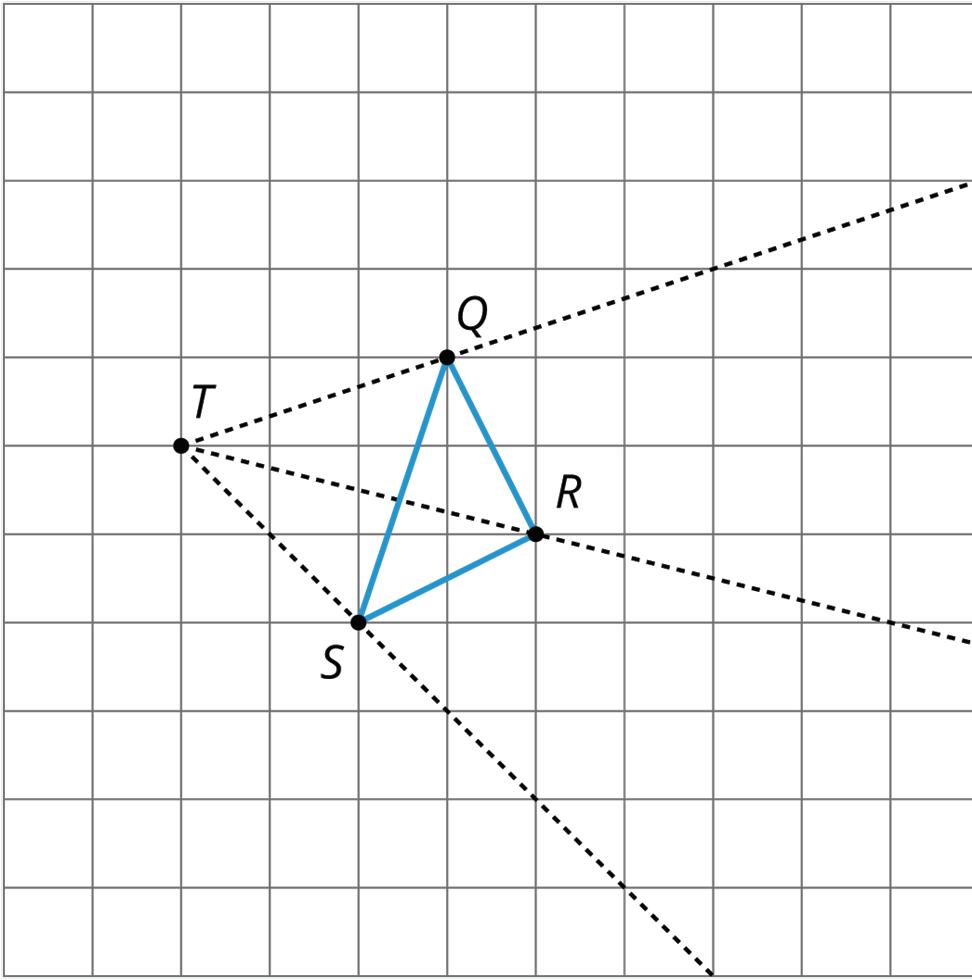
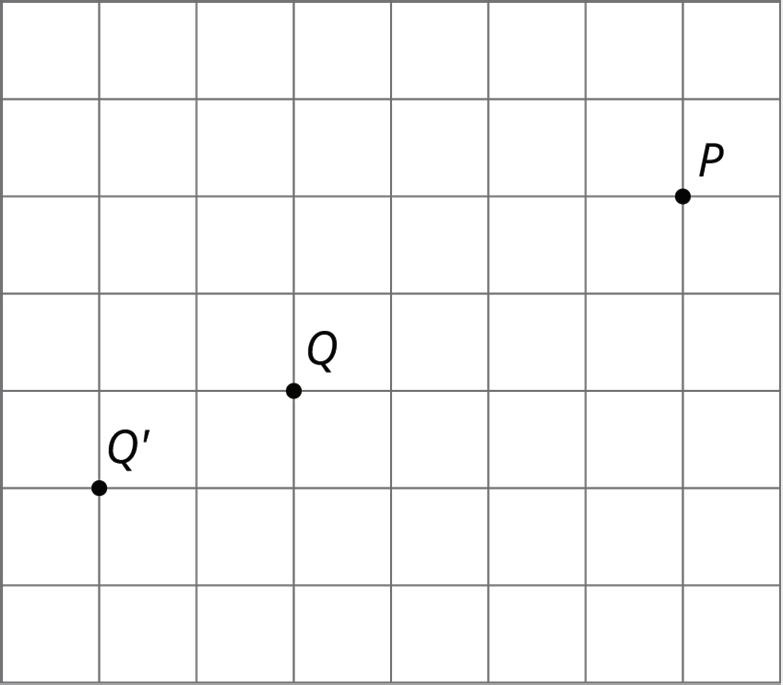
Warm-Up: Finding a Center of Rotation
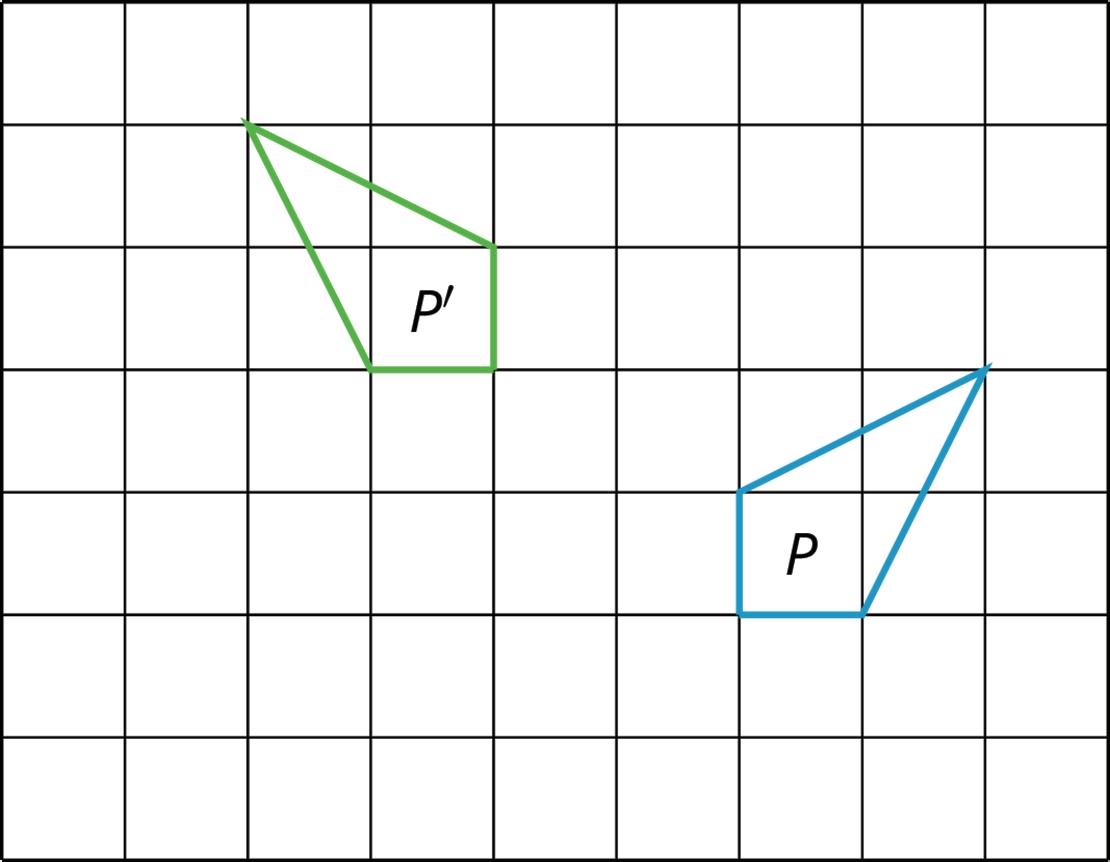
Andre performs a 90° counterclockwise rotation of Polygon P and gets Polygon P’, but he does not say what the center of the rotation is. Can you find the center?
Guided Activity: Describing Transformations
1. On the coordinate plane shown, ������ is the preimage, and ������ is the image after a single transformation.
Select the statement that best describes the transformation. Then, complete the chosen statement.
Triangle ������ can be mapped to ������ by translating it ____ units to the right.
Triangle ������ can be mapped to ������ by reflecting it over _______________.
Triangle ������ can be mapped to Δ������ by rotating it _____° clockwise about the origin.
2. Describe each transformation.
Triangle ������ is the preimage, and Δ��′��′��′ is the image.
Quadrilateral �������� is the preimage, and quadrilateral ��′��′��′��′ is the image.
Info Gap: Transformation Information
Your teacher will give you either a problem card or a data card. Do not show or read your card to your partner.
If your teacher gives you the problem card:
1. Silently read your card and think about what information you need to be able to answer the question.
2. Ask your partner for the specific information that you need.
3. Explain how you are using the information to solve the problem.
4. Continue to ask questions until you have enough information to solve the problem.
5. Share the problem card and solve the problem independently.
6. Read the data card and discuss your reasoning.
If your teacher gives you the data card:
1. Silently read your card.
2. Ask your partner “What specific information do you need?” and wait for them to ask for information.
3. If your partner asks for information that is not on the card, do not do the calculations for them. Tell them you don’t have that information.
4. Before sharing the information, ask “Why do you need that information?” Listen to your partner’s reasoning and ask clarifying questions.
5. Read the problem card and solve the problem independently.
6. Share the data card and discuss your reasoning.
Pause here so your teacher can review your work. Ask your teacher for a new set of cards and repeat the activity, trading roles with your partner.
Lesson Summary
Rigid transformations can be performed either on or off a coordinate plane.
A rigid transformation is a transformation of points in space consisting of a sequence of one or more translations, reflections, or rotations. Rigid transformations preserve distances and angle measures.
When describing a transformation on the coordinate plane, the description should include the type of transformation as well as the following information for each type.
• Descriptions of translations should include the direction and number of units moved. A translation can be described in words, such as “3 units to the left and 1 unit up,” or using an ordered pair, such as (��, ��) → (�� − 3, �� + 1).
• Descriptions of rotations about the origin should include the angle and direction of the rotation. For example, a rotation could be described as 270° counterclockwise centered at the origin.
• Descriptions of reflections should include the line of reflection. For example, a reflection could be described as a reflection over the ��-axis.
Transformations can be a single transformation or a sequence of transformations. Care should be taken when multiple transformations are applied to make sure that the transformations are applied in the correct order. Sequences of transformations will be explored in future lessons.
Practice Problems
1. Here is Trapezoid A in the coordinate plane.
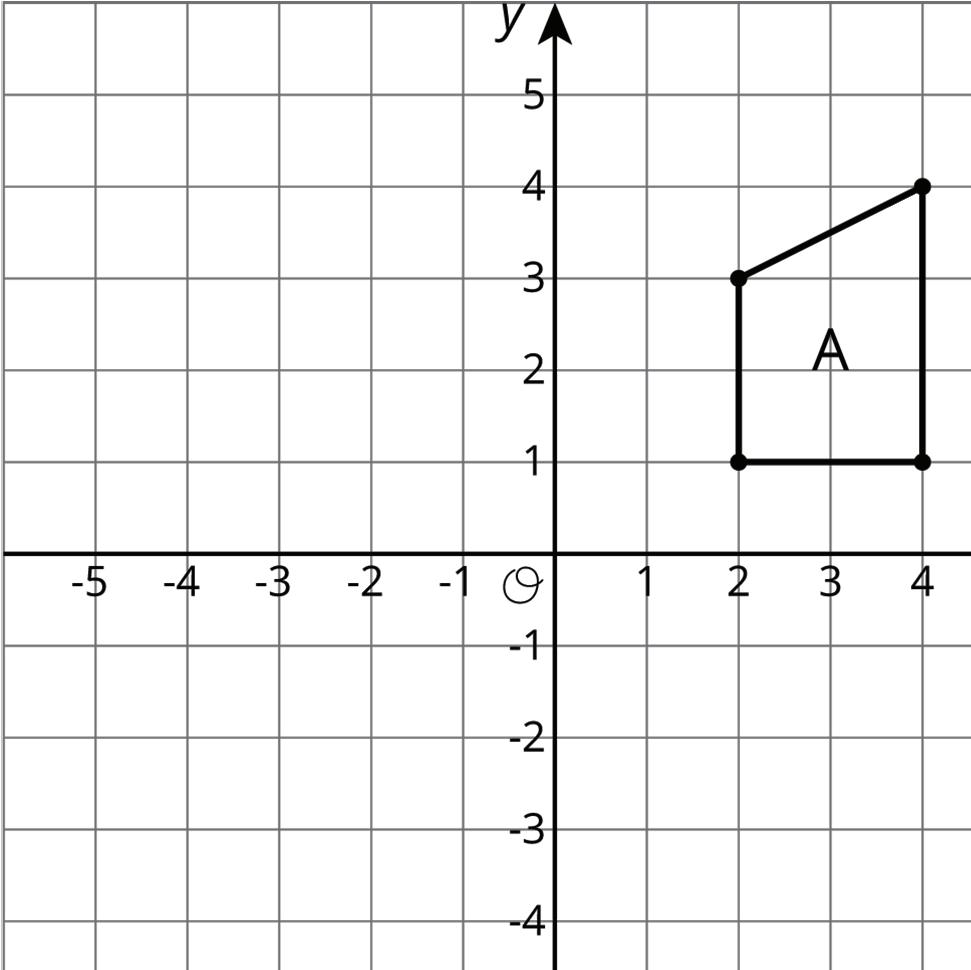
a. Draw Polygon B, the image of A, using the ��-axis as the line of reflection.
b. Draw Polygon C, the image of B, using the ��-axis as the line of reflection.
c. Draw Polygon D, the image of C, using the ��-axis as the line of reflection.
2. The point (−4, 1) is rotated 180° counterclockwise about the point (0, 0). What are the coordinates of the image?
(4, 1)
(−4, 1)
−1)
(−4, −1)
A.
B.
C. (4,
D.
3. Describe a sequence of transformations for which Triangle B is the image of Triangle A.
Review Problem
4. Here is quadrilateral ��������.
Draw the image of quadrilateral �������� after each transformation.
a. The translation that takes �� to ��
b. The reflection over segment ����
c. The rotation about point �� by angle ������, counterclockwise
Unit 1, Lesson 8: Sequence of Transformations
Warm-Up: Translated Images
All of these triangles are congruent. Sometimes we can take one figure to another with a translation. Shade the triangles that are images of triangle ������ under a translation.


Guided Activity: Sequences of Transformations
Quadrilaterals �������� and �������� are shown on the coordinate plane.
1. Describe a sequence of transformations, including at least one rotation, that can be used to map �������� onto ��������.
Translation of (��, ��) → (�� _______ , �� _________)
First Transformation
Second Transformation
Reflection over ____________
Rotation of _____° ____________________ about the origin
Translation of (��, ��) → (�� _______ , �� _________)
Reflection over ____________
Rotation of _____° ____________________ about the origin
2. The order of transformations matters in completing the correct mapping of figures. Discuss with your partner what the image would look like if the order of the transformations in problem 1 was reversed.
3. Describe a different sequence of transformations that can be used to map �������� onto ��������.
Translation of (��, ��) → (�� _______ , �� _________)
First Transformation
Second Transformation
Reflection over ____________
Rotation of _____° ____________________ about the origin
Translation of (��, ��) → (�� _______ , �� _________)
Reflection over ____________
Rotation of _____° ____________________ about the origin
4. Triangles ������ and ������ are shown on the coordinate plane.
Describe a sequence of transformations that can be used to map ������ onto ������.
5. Compare your sequence of transformations to your partner’s. Summarize the similarities and differences between your sequences.
Collaborative Activity: How Did This Get There?
Triangles ������, ������, and ������ are shown on the coordinate plane.
1. Which transformation can be used to map ������ to ������?
A. Reflect ������ over the ��-axis.
B. Translate Δ������ using the rule (��, ��) → (�� + 3, �� − 5).
C. Rotate Δ������ 90° clockwise about the origin.
D. Rotate Δ������ 90° counterclockwise about the origin.
2. Which transformation can be used to map ������ to ������?
A. Reflect ������ over the ��-axis.
B. Translate Δ������ using the rule (��, ��) → (�� + 5, �� + 1).
C. Translate Δ������ using the rule (��, ��) → (�� − 1, �� − 5).
D. Rotate Δ������ 180° clockwise about the origin.
3. To map ������ to ������, the following sequence of transformations is applied.
First, translate Δ������ using the rule (��, ��) → (�� + 3, �� + 1), and then reflect the resulting image over the ��-axis.
Draw ������ on the coordinate plane shown.
4. Four triangles are shown on the coordinate plane.
Complete the table by identifying the first and second steps of the sequence and then filling in the description of each step.
Transformation
First Step of Sequence
Translation of (��, ��) → (�� _______ , �� _________)
Reflection across ________
������ to ������
������ to ������
Second Step of Sequence
Translation of (��, ��) → (�� _______ , �� _________)
Reflection across ________
������ to ������
Rotation of _____°
_____________________ about the origin
Translation of (��, ��) → (�� _______ , �� _________)
Reflection across ________
Rotation of _____°
_____________________ about the origin
Translation of (��, ��) → (�� _______ , �� _________)
Reflection across ________
Rotation of _____°
_____________________ about the origin
Rotation of _____°
_____________________ about the origin
Translation of (��, ��) → (�� _______ , �� _________)
Reflection across ________
Rotation of _____° _____________________ about the origin
Translation of (��, ��) → (�� _______ , �� _________)
Reflection across ________
Rotation of _____° _____________________ about the origin
Lesson Summary
A combination of moves, or transformations, is called a sequence of transformations. A sequence of transformations is a set of translations, rotations, reflections, and dilations on a figure. The transformations are performed in a given order.
Dilations will be explored in the next unit of study.
When a sequence of transformations is applied, the order of the transformations may be important. Examples of the importance of order are described and shown.
• Triangle ������ is shown on the coordinate plane, and a green triangle is shown after a translation up 2 units and then a reflection across the ��-axis.
• In the second graph, triangle ������ is first reflected across the ��-axis and then translated up 2 units to form the green triangle.
The green triangle ends up in different places when the transformations are applied in the opposite order. While there are some cases where the order of the transformations does not matter, it is important to pay attention to the order in the description of any sequence of transformations.
Practice Problems
1. Point �� has coordinates (3, 4). After a translation 4 units left, a reflection across the ��-axis, and a translation 2 units down, what are the coordinates of the image?
2. Quadrilateral �������� was transformed to create quadrilateral ��′′��′′��′′��′′.
Describe the sequence of transformations that will map quadrilateral �������� onto quadrilateral ��′′��′′��′′��′′.
3. Triangle ������ and triangle ��′��′��′ are shown on the coordinate plane.
Describe a sequence of transformations where Δ��′��′��′ is the image of Δ������
Review Problems
4. Nigel and Elena are discussing what single transformation took place to map ������ to ������.
Nigel claims that the transformation is a rotation about the origin. Elena says the transformation is a reflection. Explain which student you agree with.
5. Quadrilateral �������� is rotated 90° counterclockwise about the origin to create quadrilateral ��������, as shown.
Describe another transformation that could be used to map �������� to ��������.
Unit 1, Lesson 9: Congruent Figures
Warm-Up: Are They the Same?
For each pair of shapes, decide whether or not they are the same.
Guided Activity: Corresponding Parts
A figure and its image have corresponding points. With a rigid transformation, figures like polygons also have corresponding sides and corresponding angles. These corresponding parts have the same measures.
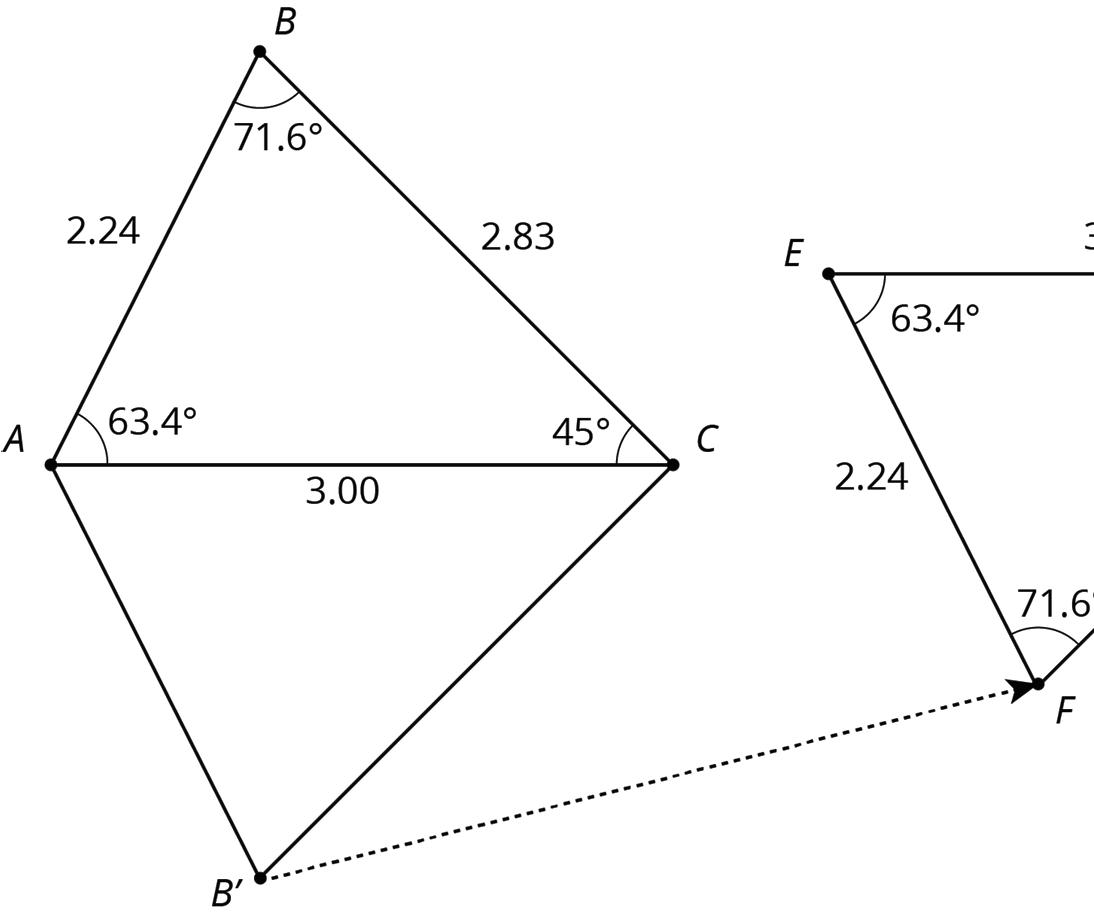
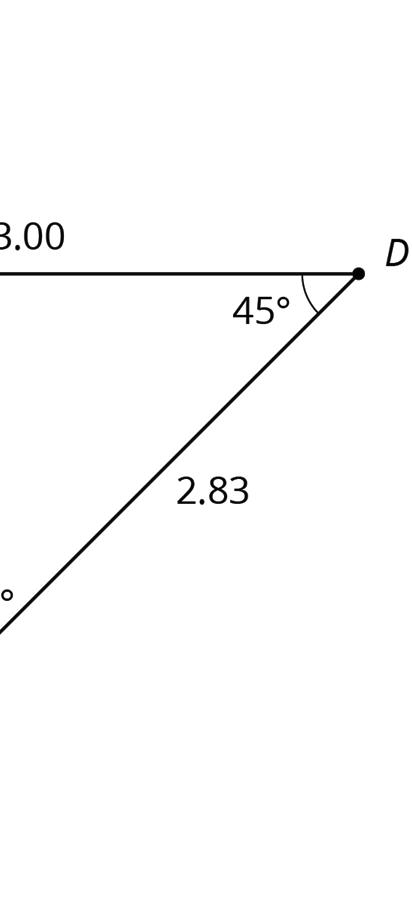
1. Triangle ������ is reflected over ���� and then translated from ��′ to �� to create Δ������. In rigid transformations, corresponding sides have the same lengths, and corresponding angles have the same measures.
a. Complete the table by identifying corresponding parts and their measures.
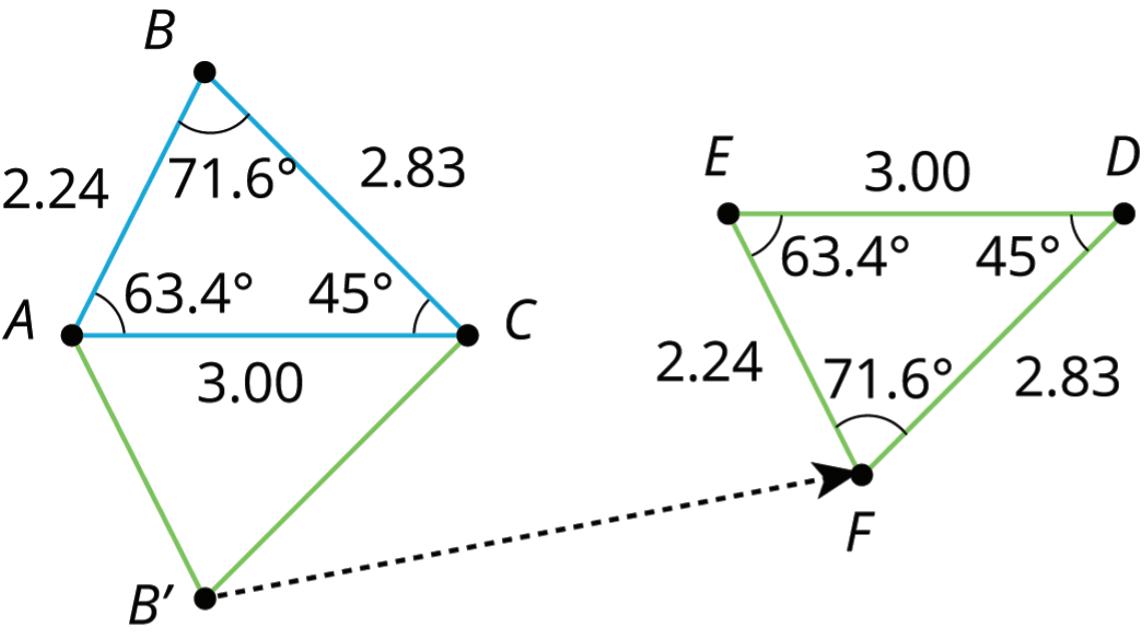
When two angles or side lengths have equal measures, they are congruent. An equal sign, =, is used when making statements of equality. For example, the statement ���� = ���� is read as “���� is equal to ����.” A congruence sign, ≅, is used when making statements of congruence. For example, the statement ���� ≅ ���� is read as “line segment ���� is congruent to line segment ����.”
b. Complete each congruence statement.
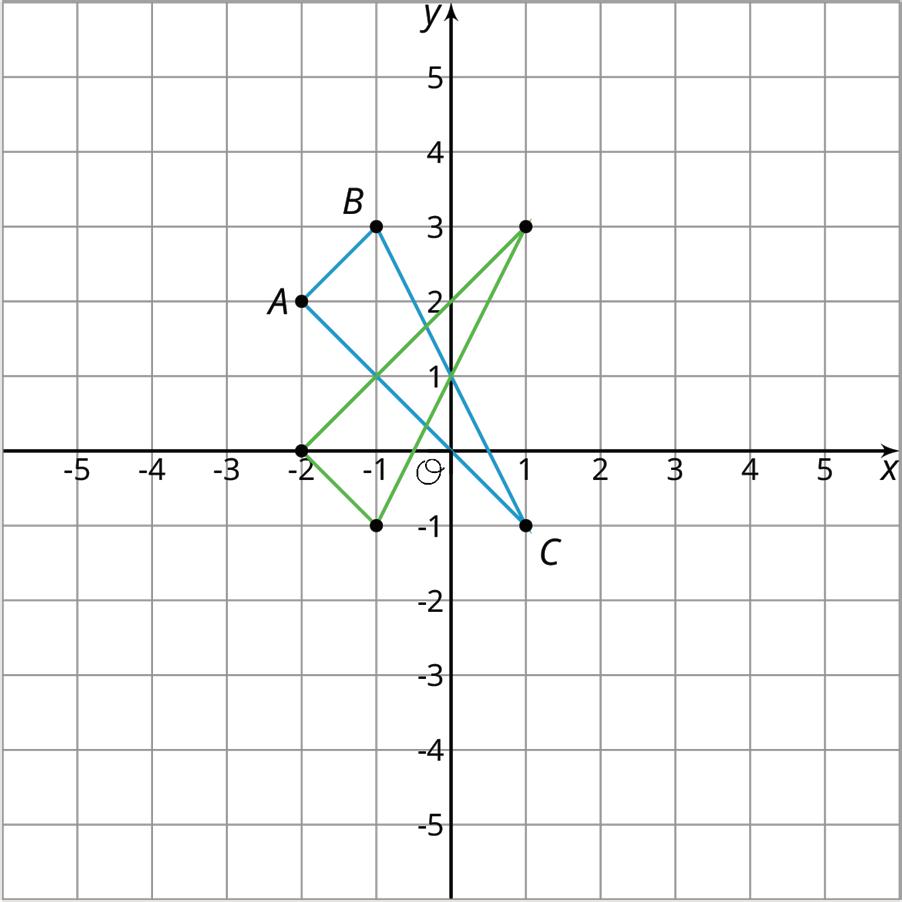
2. Five triangles are shown on the coordinate plane. Triangles ������, ������, ������, and ������ are created using a single transformation of ������. Each color indicates corresponding points on the figures.
a. Complete the table by indicating whether each triangle is congruent to ������ and, if so, describing the transformation.
Triangle Is the given triangle congruent to ������?
������
������
������
������
Congruent Not congruent
Congruent Not congruent
Congruent Not congruent
Congruent Not congruent
b. Complete each congruence statement.
Description of Transformation
c. Discuss with your partner why there could be multiple answers to each statement. Summarize your discussion.
Exploration Activity: Congruent Pairs
For each pair of shapes, decide whether or not Shape A is congruent to Shape B. Explain how you know.


Lesson Summary
Two figures are congruent if one can be lined up exactly with the other by a sequence of rigid transformations.
For example, ������ is congruent to ������ because they can be matched up by reflecting ������ across ���� followed by the translation represented by the arrow. Notice that all corresponding angles and side lengths are equal.
The criteria described below can be used to show that figures are congruent.
• If 1 figure is copied on tracing paper and the paper can be moved so the copy covers the other figure exactly, then that suggests they are congruent.
• It is possible to prove that 2 figures are congruent by describing a sequence of translations, rotations, and reflections that move 1 figure onto the other so they match up exactly.
Figures are not congruent if there are corresponding parts that do not have equal measures. Three examples of figures that are not congruent are shown and described.
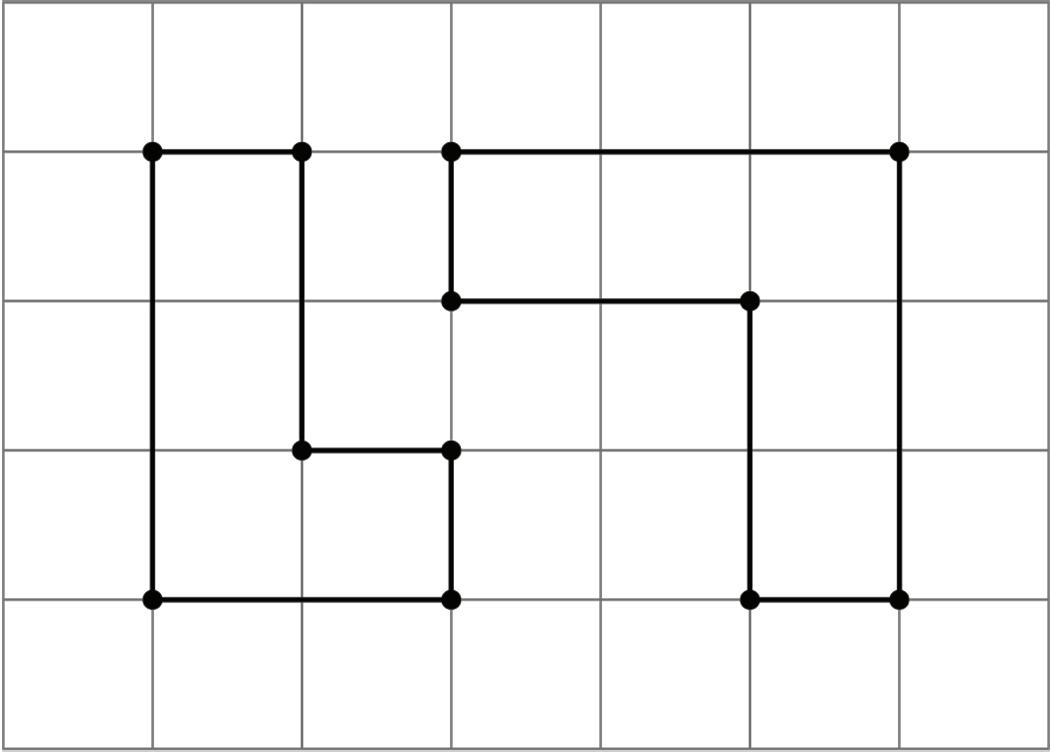
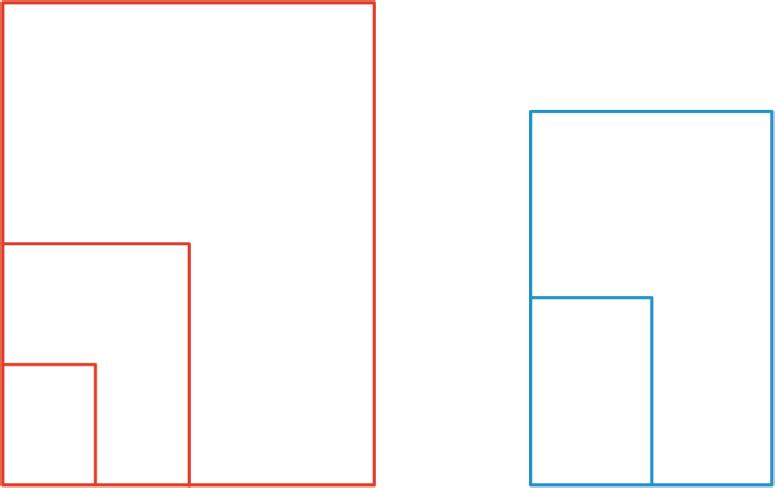
• If 2 polygons have different sets of side lengths, they can’t be congruent. For example, the figure on the left has side lengths 3, 2, 1, 1, 2, 1. The figure on the right has side lengths 3, 3, 1, 2, 2, 1. There is no way to make a correspondence between them where all corresponding sides have the same length.
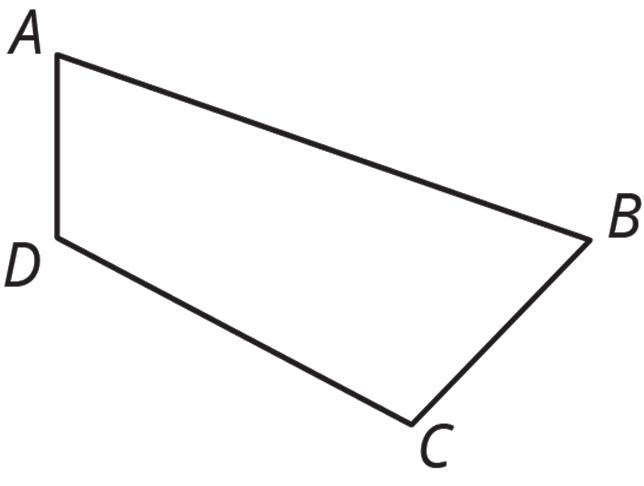
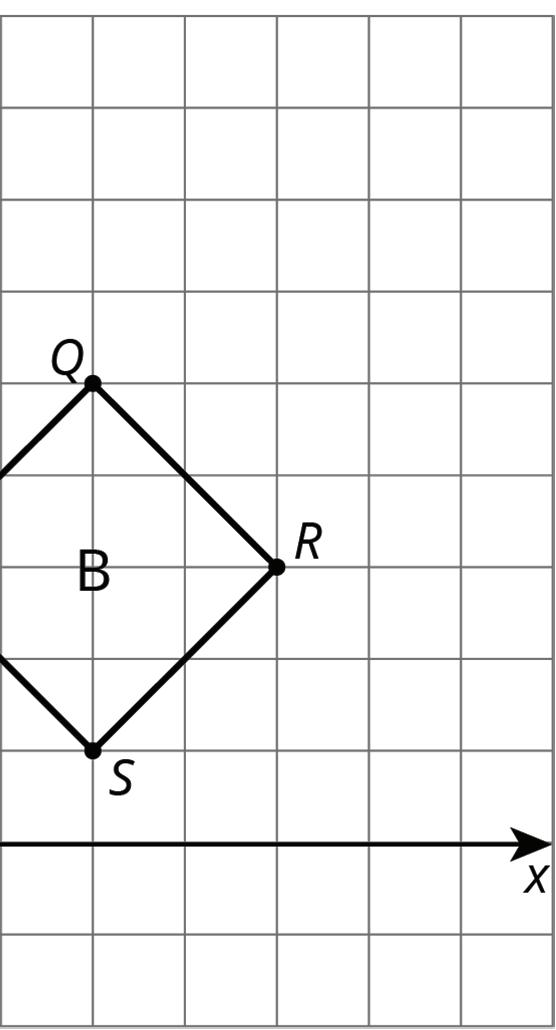
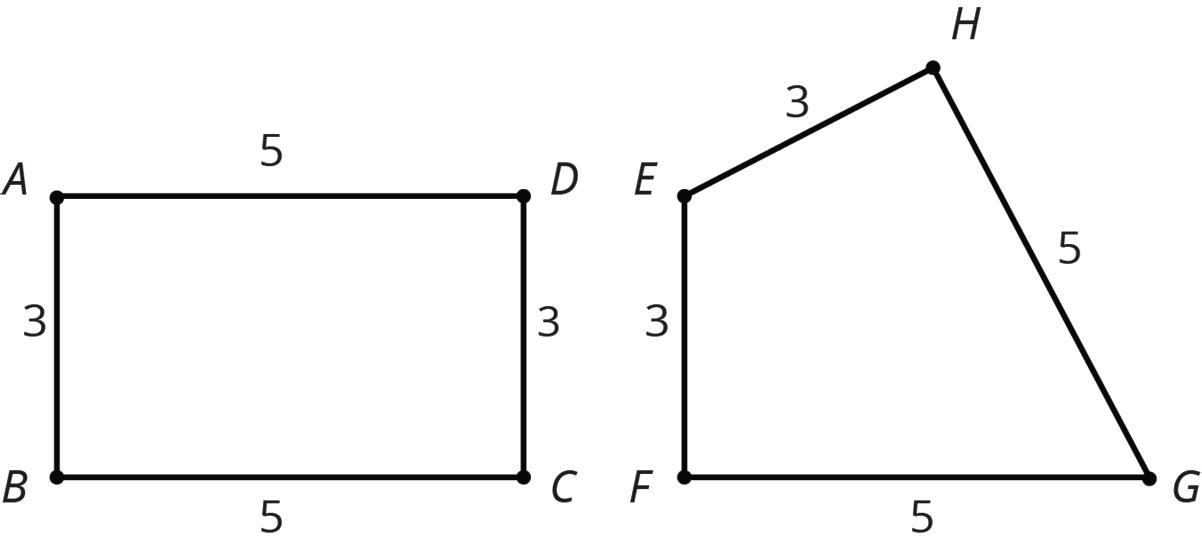
• If 2 polygons have the same side lengths, but their orders can’t be matched while going around each polygon, the polygons can’t be congruent. For example, rectangle �������� can’t be congruent to quadrilateral ��������. Even though they both have 2 sides of length 3 and 2 sides of length 5, the lengths don’t correspond in the same order.
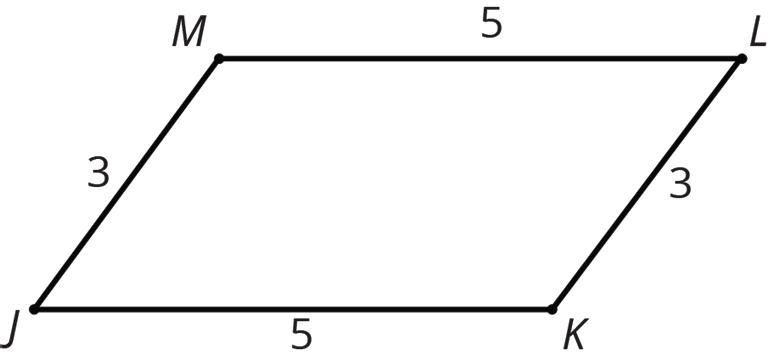
• If 2 polygons have the same side lengths, in the same order, but different corresponding angles, the polygons can’t be congruent. For example, parallelogram �������� can’t be congruent to rectangle ��������. Even though they have the same side lengths in the same order, the angles are different. All angles in �������� are right angles. In ��������, angles �� and �� are less than 90°, and angles �� and �� are more than 90°.
Practice Problems
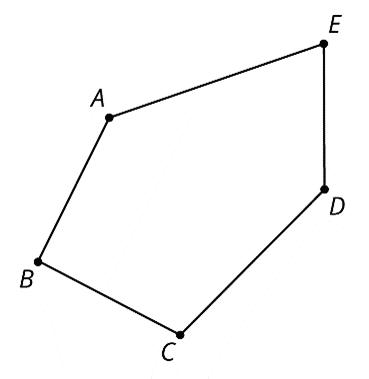
1. Two pentagons are shown.
a. Show that the two pentagons are congruent.

b. Find the side lengths of ���������� and the angle measures of ����������.
2. For each pair of shapes, decide whether or not the two shapes are congruent. Explain your reasoning.
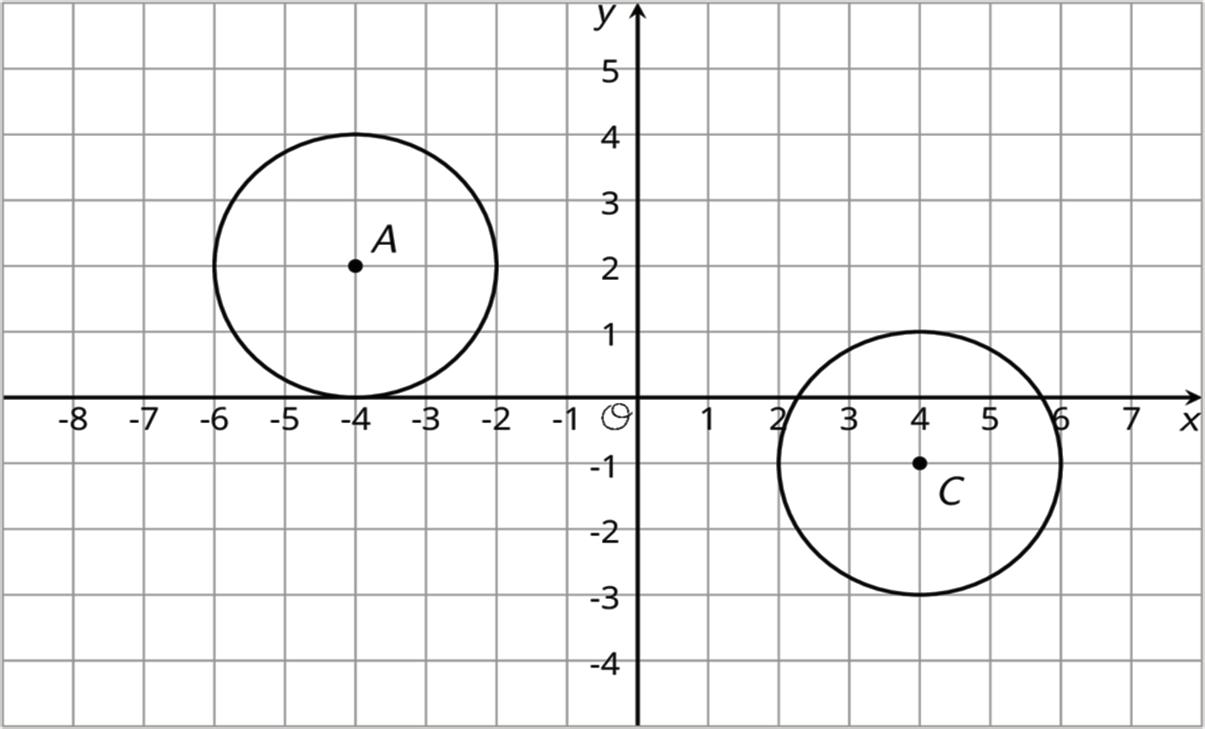
3. Quadrilateral A is shown.
a. Reflect Quadrilateral A over the ��-axis. Label the image Quadrilateral B. Reflect Quadrilateral B over the ��-axis. Label the image C.
b. Are Quadrilaterals A and C congruent? Explain how you know.

4. The point (−2, −3) is rotated 90° counterclockwise using center (0, 0). What are the coordinates of the image?
A. (−3, −2)
B. (−3, 2)
C. (3, −2)
D. (3, 2)
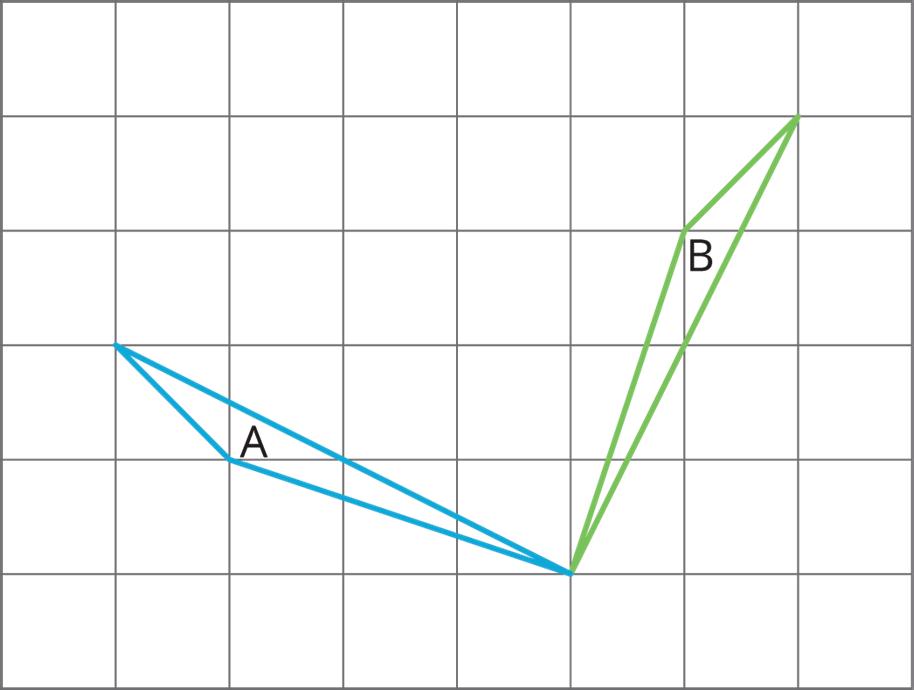
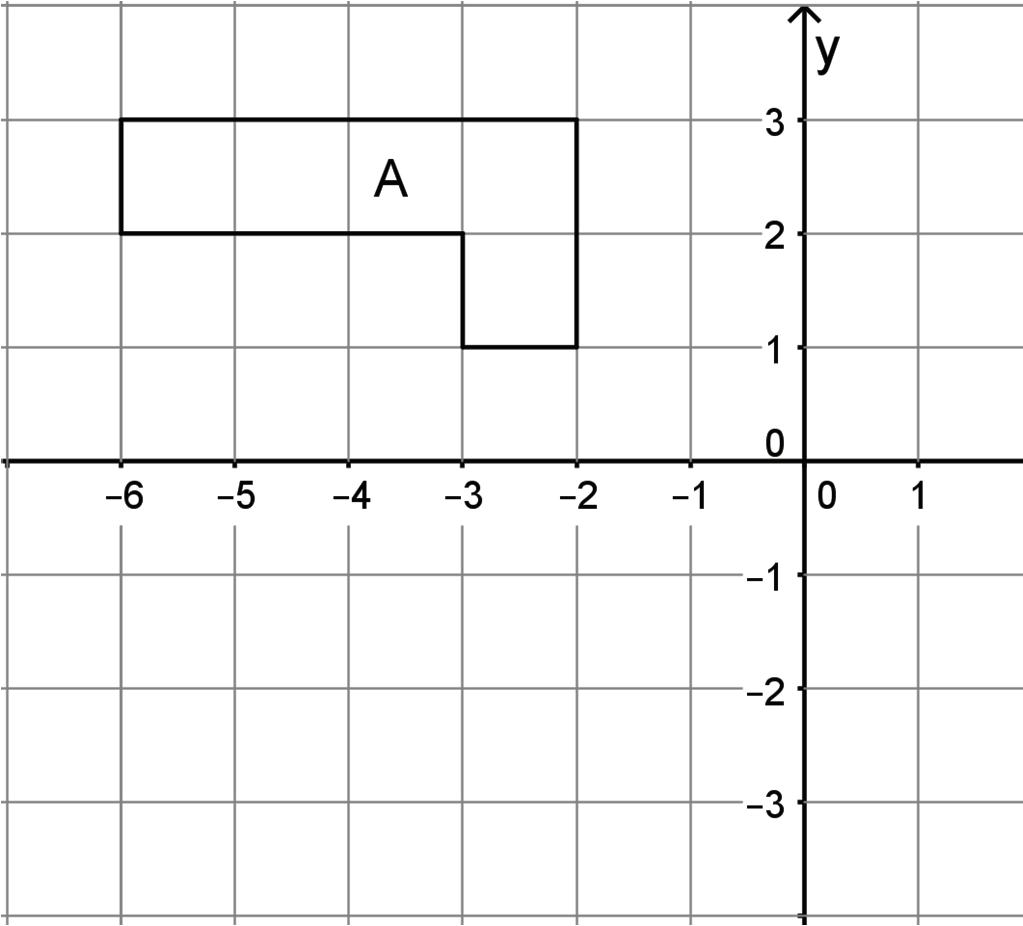
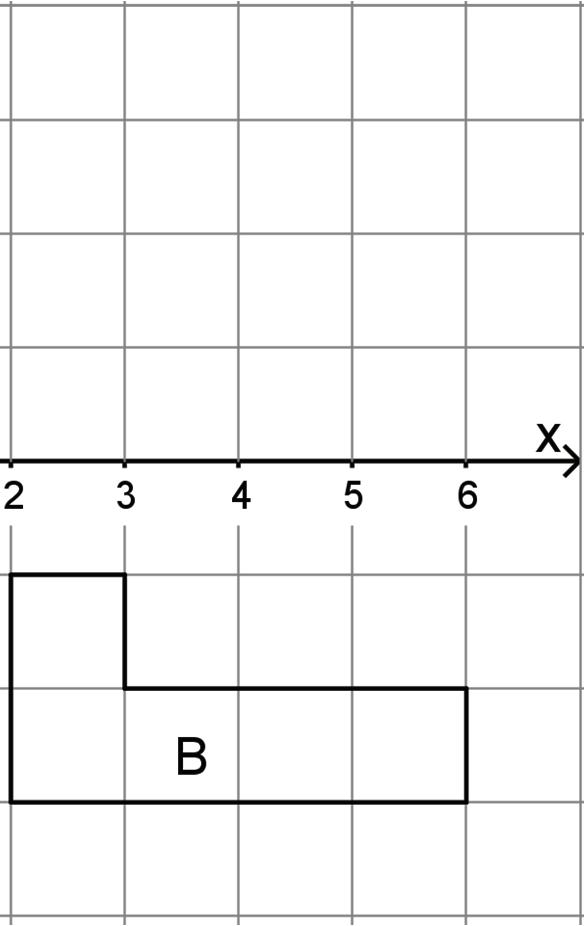
5. Describe a rigid transformation that takes Polygon A to Polygon B.
Unit 1, Lesson 10: Exploring Angle Relationships with
Parallel Lines
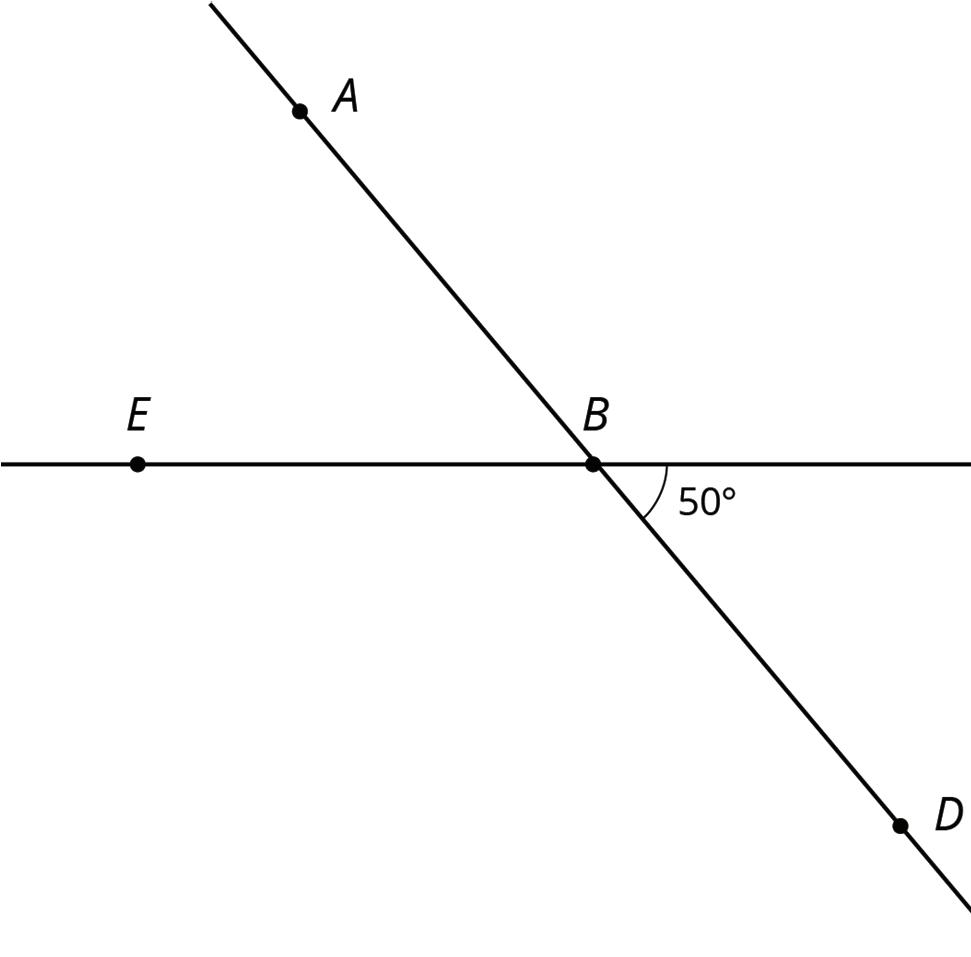
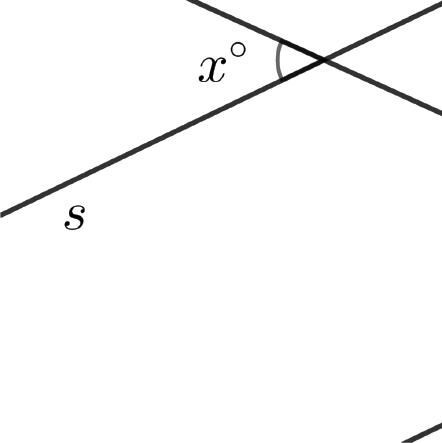
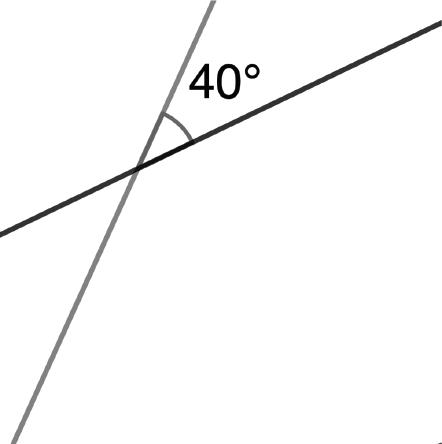
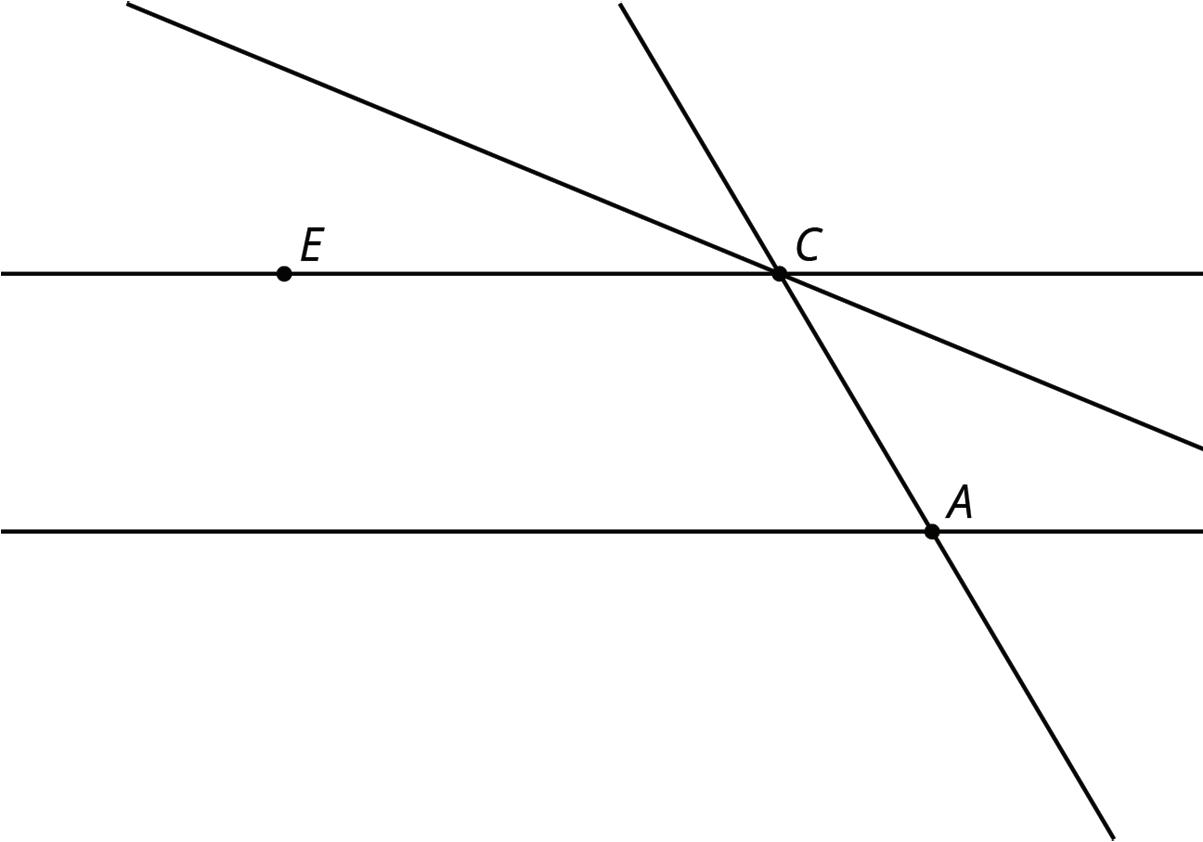
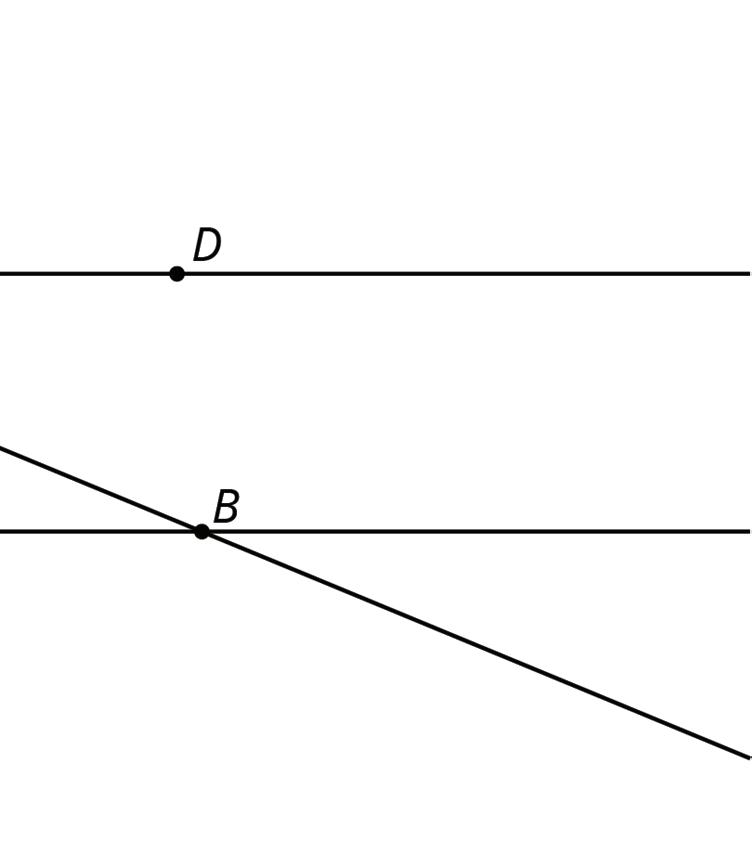
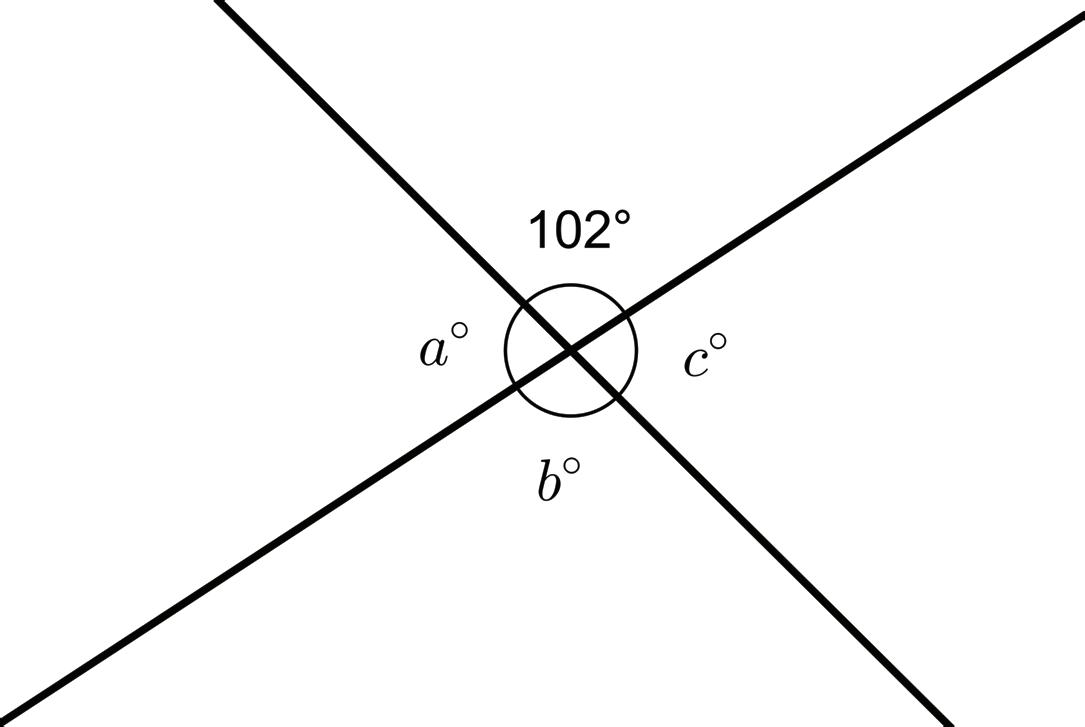
Warm-Up: Angles Formed by Intersecting Lines
1. Use the diagram to find the measures of each angle. Explain your reasoning.

Collaborative
Activity: Exploring Angle Relationships with Parallel Lines
1. Parallel lines ���� and ���� are intersected by transversal ����, as shown.
a. Copy ∠������ onto tracing paper.
b. Move the copy of ∠������ to lie over the other angles created by the parallel lines and transversal. Determine which angles are congruent to ∠������.
c. Copy ∠������ onto tracing paper.
d. Move the copy of ∠������ to lie over the other angles created by the parallel lines and transversal. Determine which angles are congruent to ∠������.
e. Determine whether each pair of angles is congruent, supplementary, or neither congruent nor supplementary.
f. Discuss your answers from the table in part E with your partner. Make revisions if needed.
When 2 parallel lines are intersected, or cut, by a transversal, each pair of angles will either be congruent or supplementary.
g. Complete the statements.
Adjacent angles ������ and ������ form a straight line, and their sum is 90°. 180°. 360°.
Adjacent angles ������ and ������ form a straight line, and their sum is 90°. 180°. 360°.
Since ∠������ is congruent to ∠������, ∠������, the sum of angles ∠������ and ∠������ is 90°. 180°. 360°.
Guided Activity: Angle Relationships with Parallel Lines
1. In each diagram, ���� and ���� are parallel lines, and ���� is a transversal. Each highlighted pair of angles is described in the corresponding statement.
Complete the table to describe each angle relationship based on your conclusions from the Collaborative Activity.
Corresponding angles are angles that are in the same position on 2 parallel lines in relation to a transversal.
Congruent
Supplementary
Diagram
Alternate interior angles are inside the parallel lines on opposite sides of the transversal.
Same-side interior angles are inside the parallel lines on the same side of the transversal.
Congruent
Supplementary
Alternate exterior angles are outside the parallel lines on opposite sides of the transversal.
Congruent
Supplementary
Vertical angles are opposite angles that share the same vertex.
Congruent
Supplementary
Congruent
Supplementary
2. Parallel lines ���� and ���� are cut by transversal ����, where ��∠������ = 59°, as shown.
Complete the table by determining the angle measure for each angle.
Lesson Summary
When 2 parallel lines are intersected by a transversal, several relationships exist between the angles.
A transversal is a line that intersects 2 or more lines in the same plane at different points.
For example, the parallel lines �� and �� are intersected by the transversal ��.
• Corresponding angles are angles that are in the same position on 2 parallel lines in relation to a transversal. Corresponding angles in parallel lines are congruent. For example, ∠1 ≅ ∠5 and ∠3 ≅ ∠7.
• Same-side interior angles are angles that are between the parallel lines on the same side of the transversal. Same-side interior angles in parallel lines are supplementary. For example, ��∠2 + ��∠5 = 180°.
• Alternate interior angles are between the parallel lines on opposite sides of the transversal. Alternate interior angles in parallel lines are congruent. For example, ∠2 ≅ ∠8 and ∠3 ≅ ∠5.
• Alternate exterior angles are outside the parallel lines on opposite sides of the transversal. Alternate exterior angles in parallel lines are congruent. For example, ∠1 ≅ ∠7 and ∠4 ≅ ∠6.
Practice Problems
1. In each diagram, ���� and ���� are parallel lines, and ���� is a transversal.
1
a. In each diagram, mark ∠������ with an asterisk (*).
b. In each diagram, mark all of the angles that are congruent to ∠������ with an asterisk (*).
c. In each diagram, mark all of the angles that are supplementary to ∠������ with a smiley face ().
d. In diagram 3, select all of the angles that are congruent to ∠������.
Diagram
Diagram 2
Diagram 3
2. Parallel lines ���� and ���� with transversal ���� are shown.
Complete the table by identifying each angle relationship and the type of angle pair.
Angles Angle Relationship Type of Angle Pair
∠������ and ∠������
Congruent
Supplementary
∠������ and ∠������
Congruent
Supplementary
∠������ and ∠������
Congruent
Supplementary
∠������ and ∠������
Congruent
Supplementary
Vertical angles
Corresponding angles
Alternate interior angles
Alternate exterior angles
Same-side interior angles
Vertical angles
Corresponding angles
Alternate interior angles
Alternate exterior angles
Same-side interior angles
Vertical angles
Corresponding angles
Alternate interior angles
Alternate exterior angles
Same-side interior angles
Vertical angles
Corresponding angles
Alternate interior angles
Alternate exterior angles
Same-side interior angles
3. Parallel lines ���� and ���� with transversal ���� are shown, where ��∠������ = 46°.
Freddie found ��∠������, but he made an error. His reasoning is shown.
Freddie’s Reasoning
∠������ and ∠������ are vertical angles.
Therefore, ∠������ ≅ ∠������.
��∠������ = 46°
∠������ and ∠������ are corresponding angles.
Therefore, ∠������ ≅ ∠������.
��∠������ = 46°
a. Explain Freddie’s error(s).
b. Determine the correct ��∠������.
Review Problems
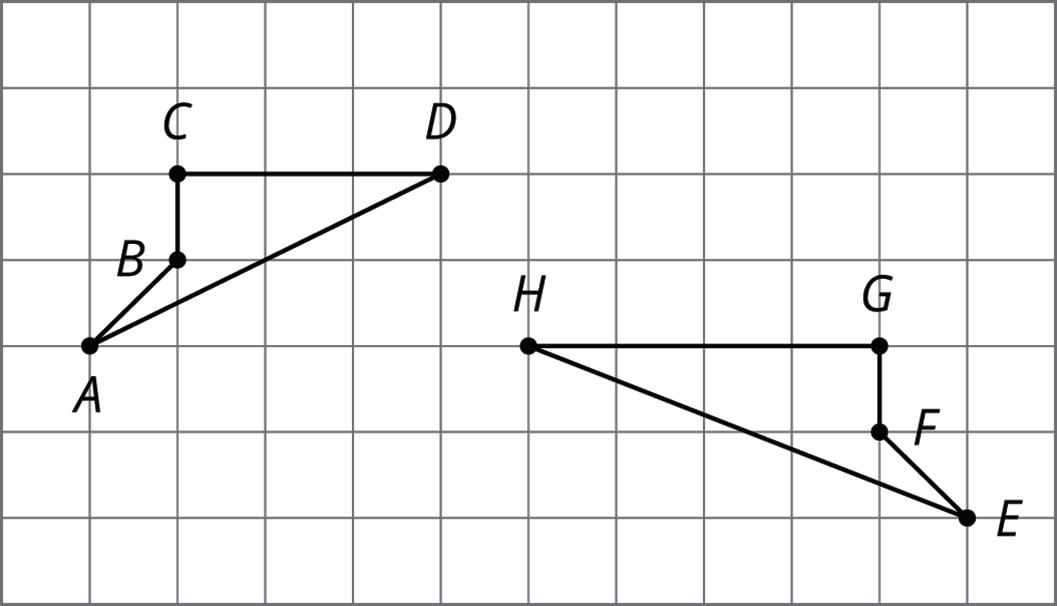
4. Triangles ������, ������, and ������ are shown on the coordinate plane.
For each pair given, explain whether the figures are congruent.
a. ������ and ������
b. ������ and ������
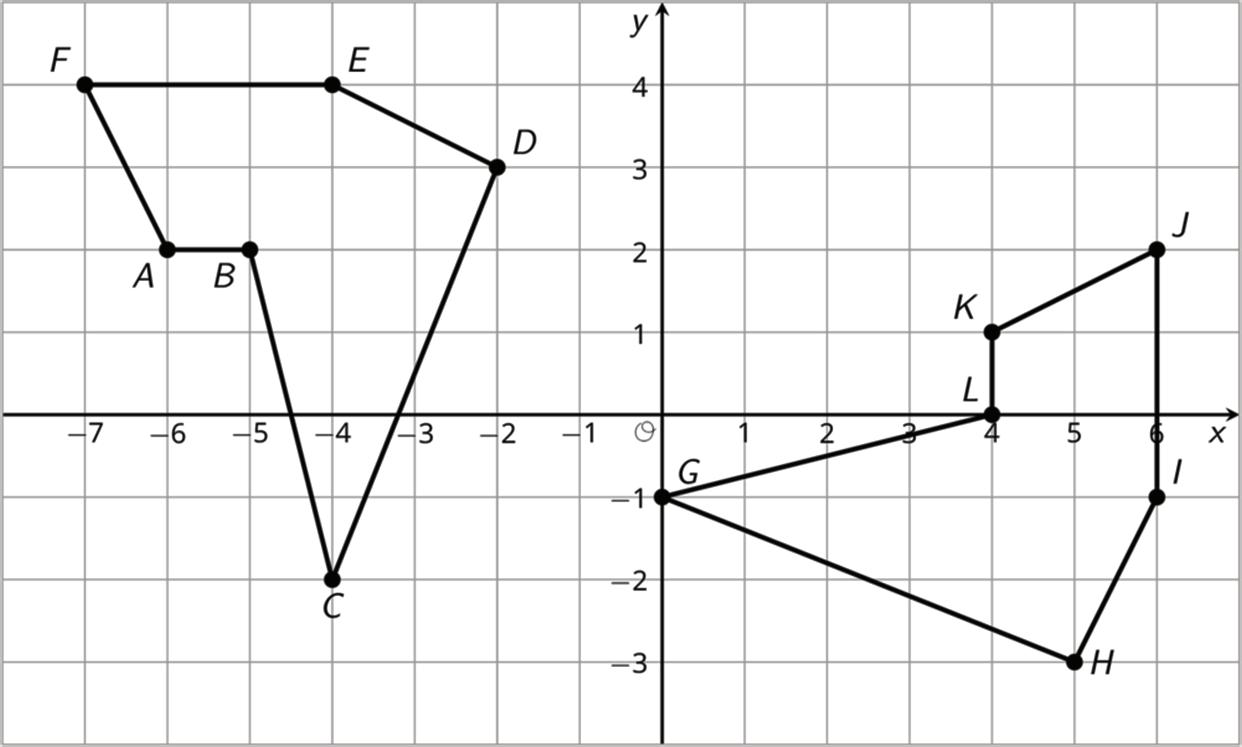
5. Quadrilateral �������� is shown on the coordinate plane.
Quadrilateral ��′��′��′��′ is created by translating quadrilateral �������� 5 units to the left and 2 units up. Complete the table by identifying the coordinates of the vertices of ��′��′��′��′.
Unit 1, Lesson 11: Alternate Interior Angles
Warm-Up: Angle Pairs
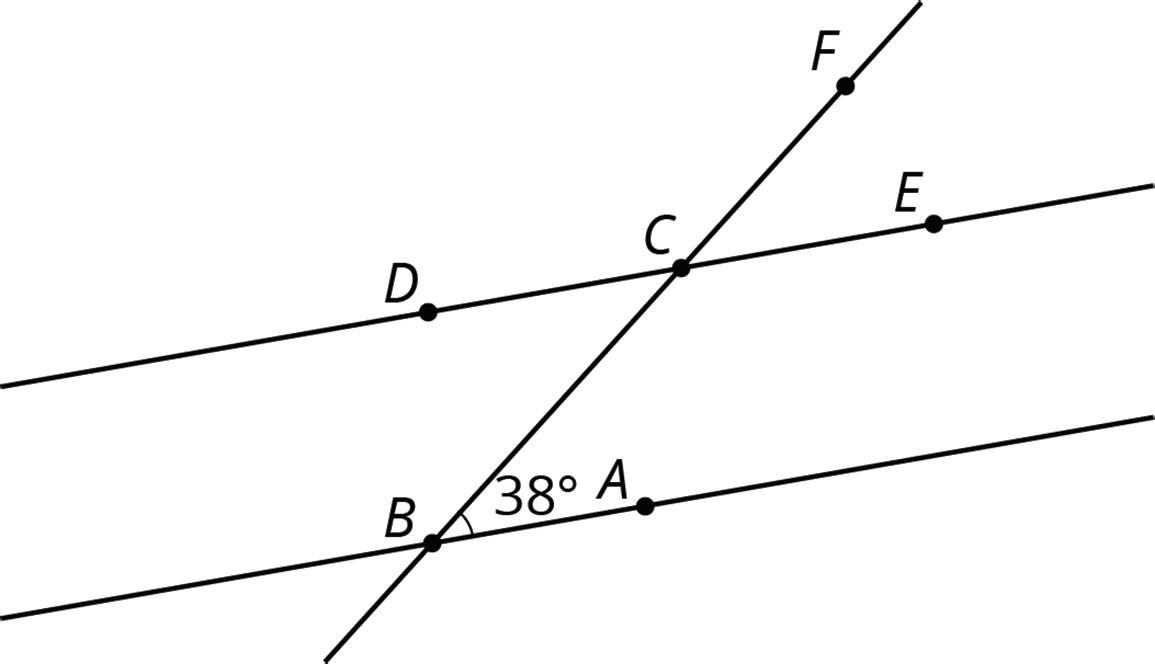
1. Find the measure of angle ������. Explain or show your reasoning.
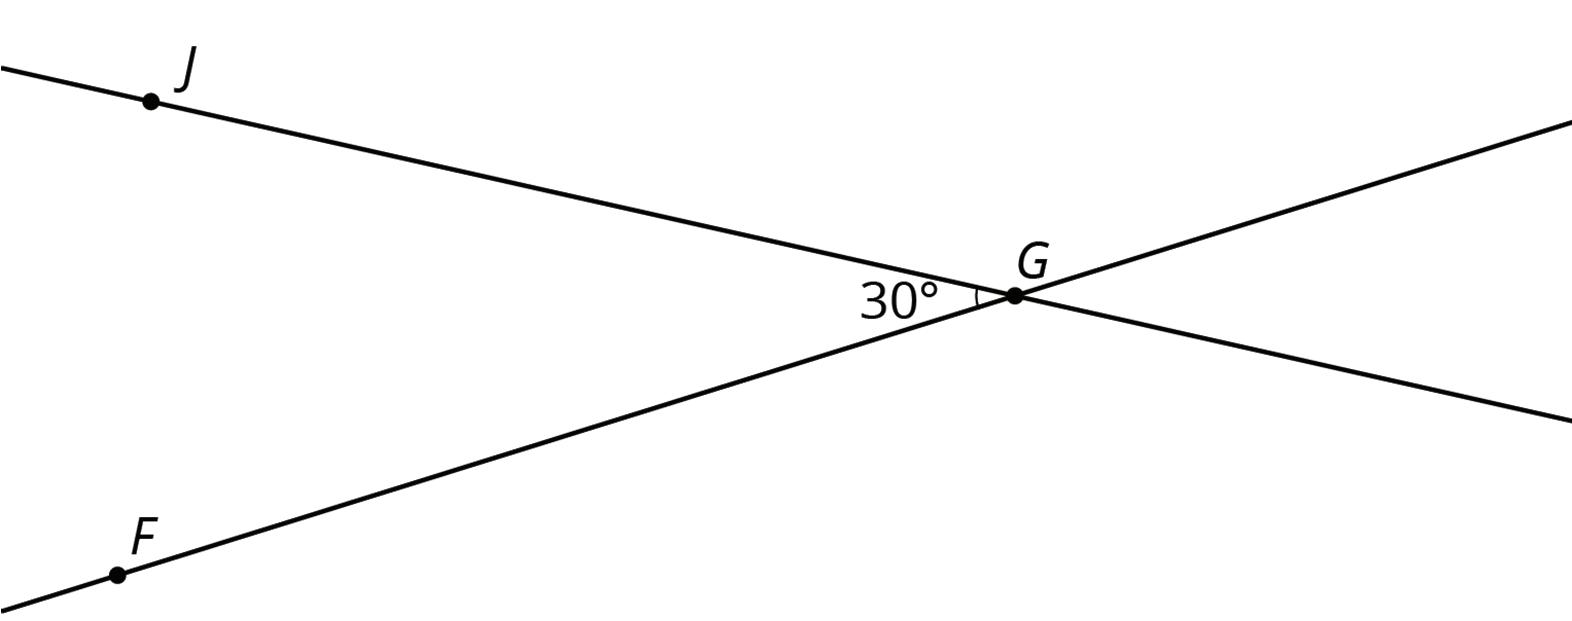
2. Find and label a second 30° angle in the diagram. Find and label an angle congruent to angle ������.
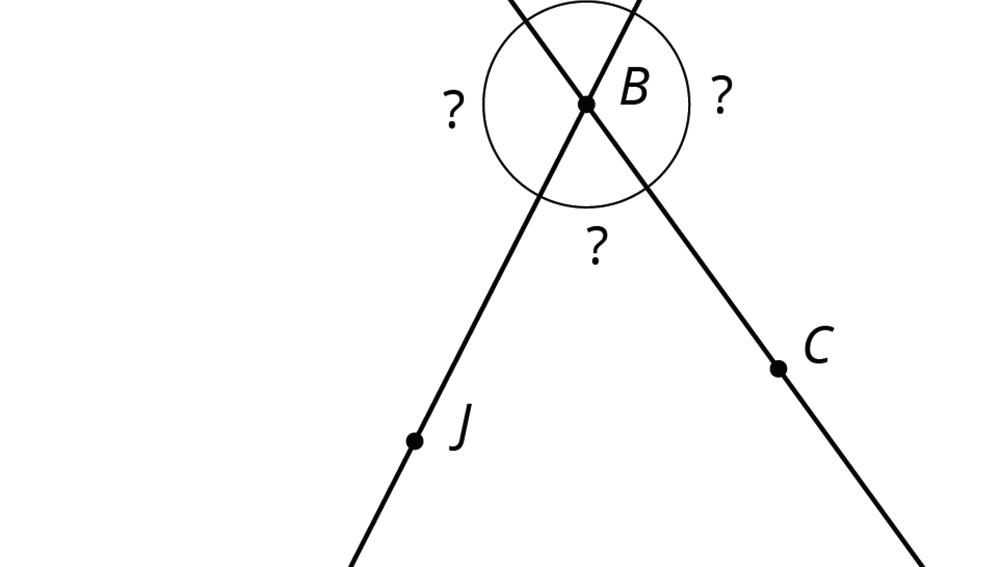
Exploration Activity: Cutting Parallel Lines with a Transversal
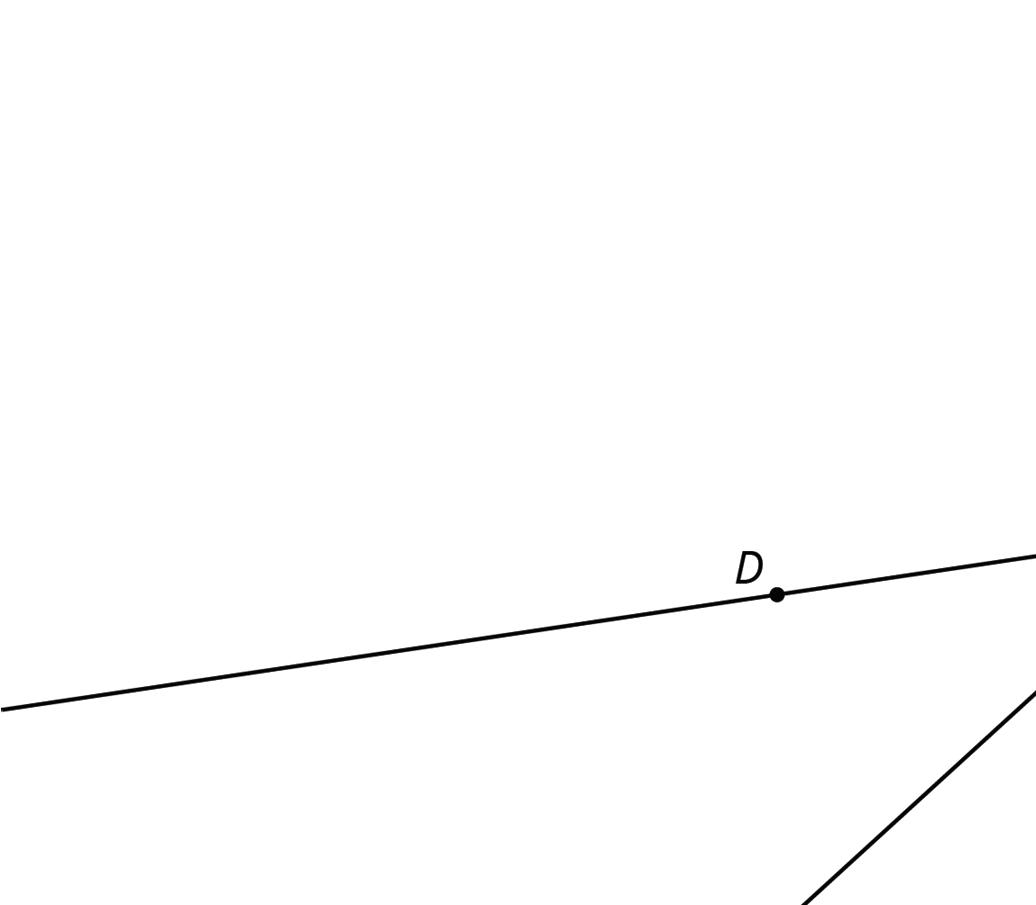
Lines ���� and ���� are parallel. They are cut by transversal ����.
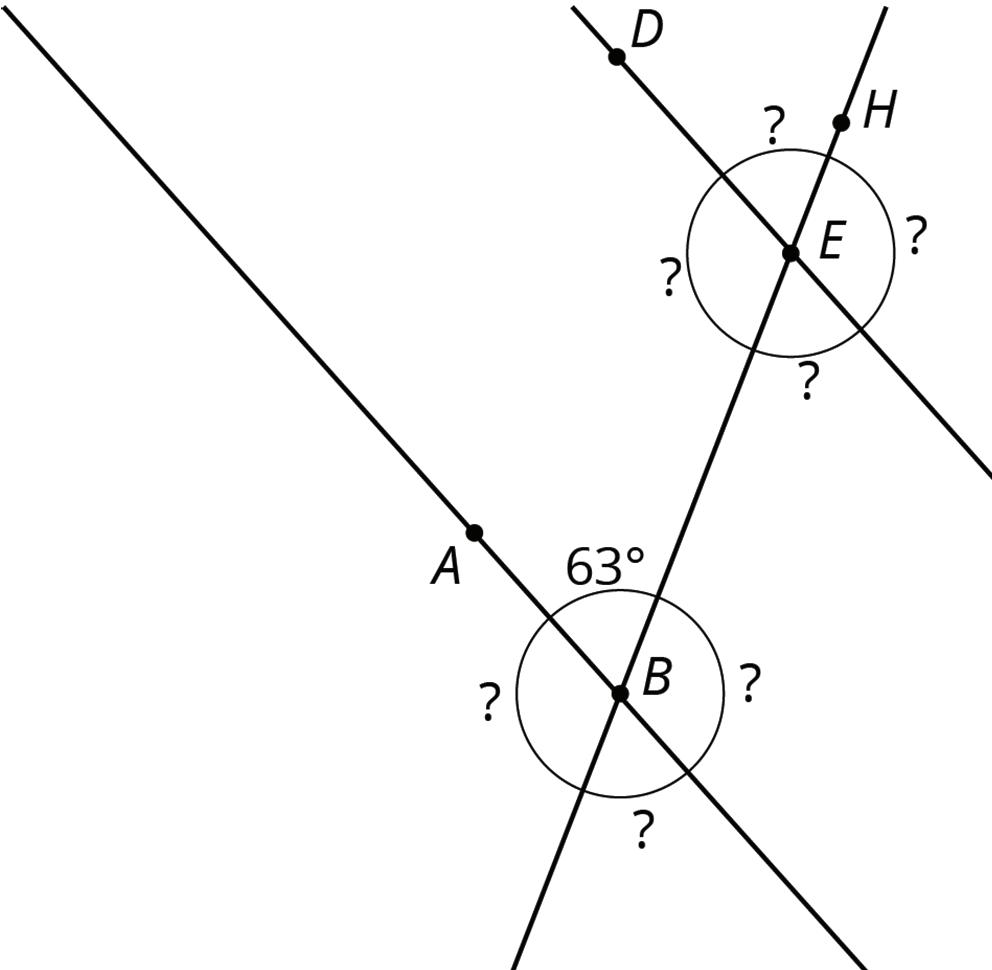

1. With your partner, find the seven unknown angle measures in the diagram. Explain your reasoning.
2. What do you notice about the angles with vertex �� and the angles with vertex ��?
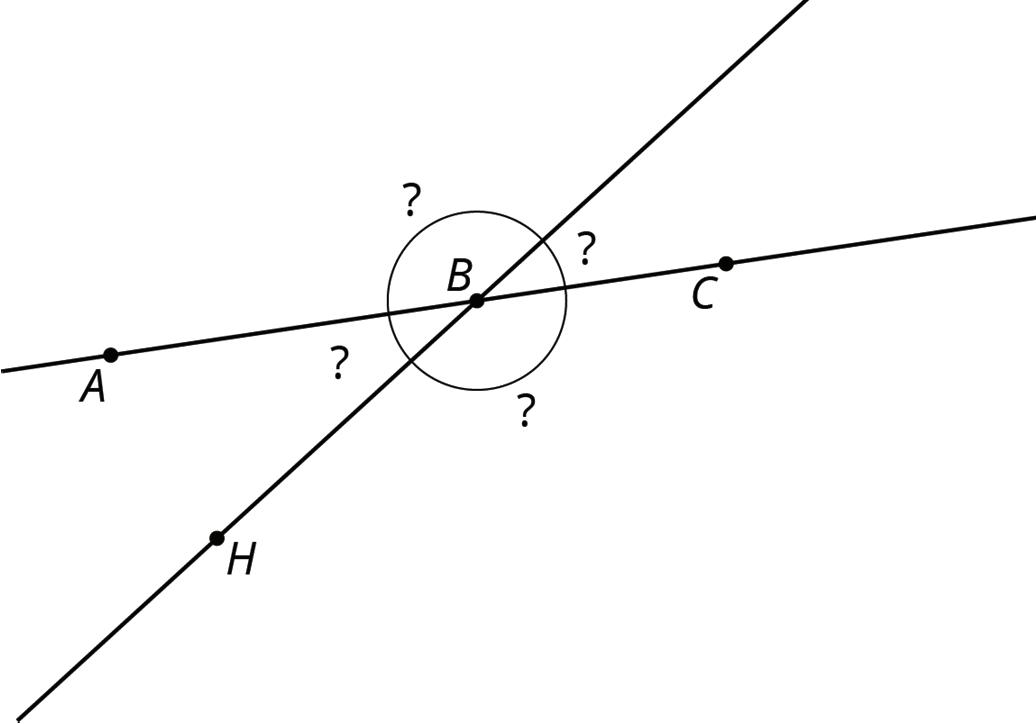
3. Using what you noticed, find the measures of the four angles at point �� in the second diagram. Lines ���� and ���� are parallel.
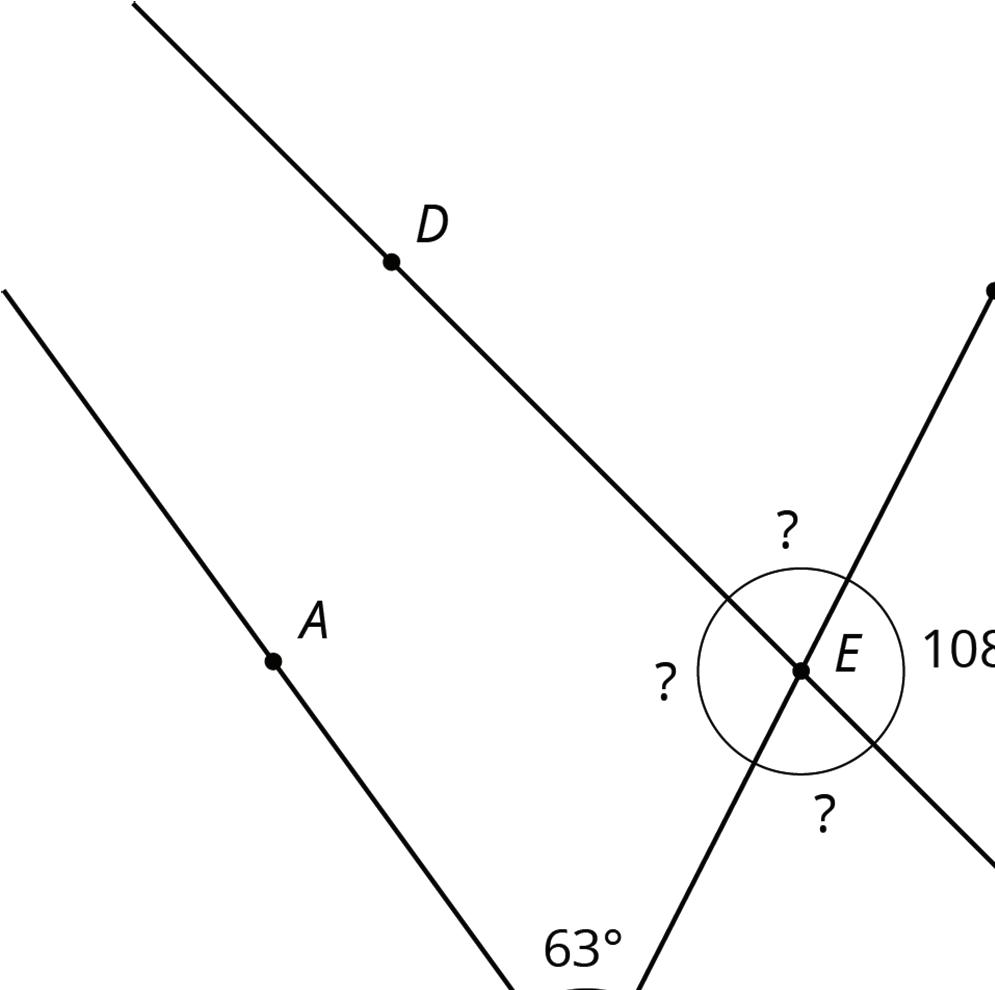
4. The next diagram resembles the first one, but the lines form slightly different angles. Work with your partner to find the six unknown angles with vertices at points �� and ��.
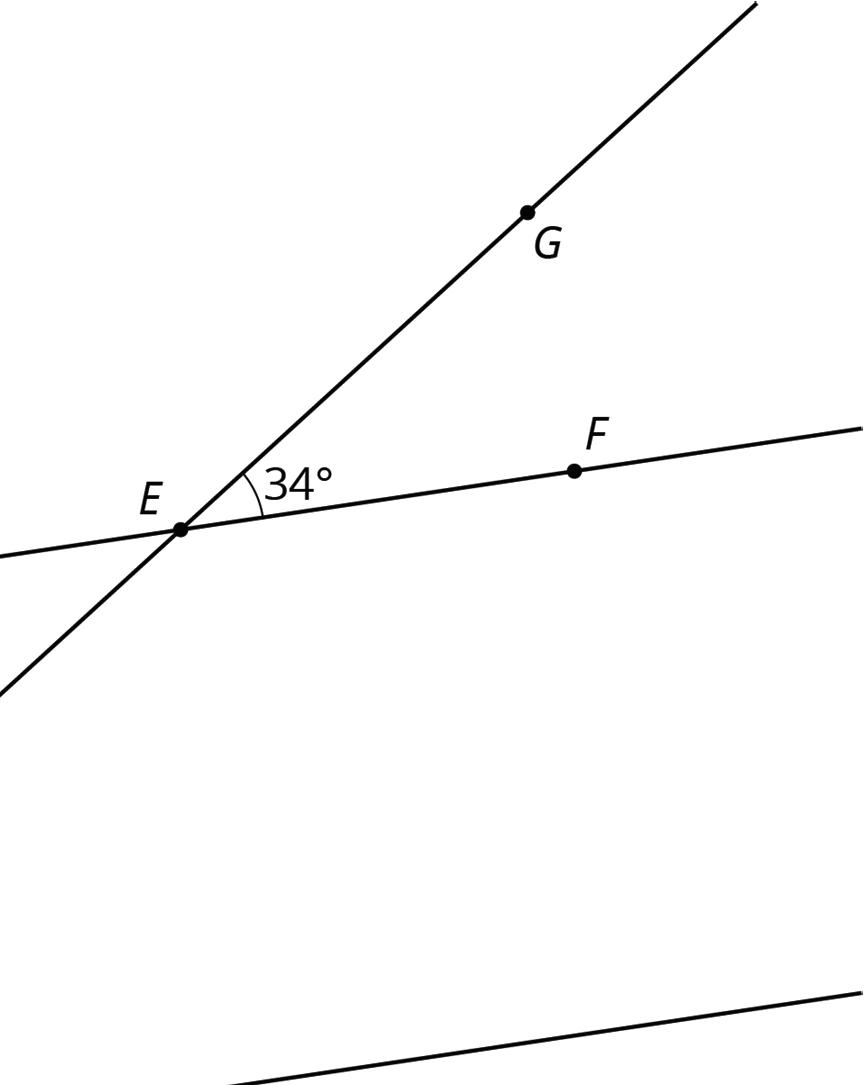

5. What do you notice about the angles in this diagram as compared to the earlier diagram? How are the two diagrams different? How are they the same?
Collaborative Activity: Alternate Interior Angles Are Congruent
1. Lines ℓ and �� are parallel and �� is a transversal. Point �� is the midpoint of segment ����.
Find a rigid transformation showing that angles ������ and ������ are congruent.

2. In this picture, lines ℓ and �� are no longer parallel. �� is still the midpoint of segment ����.
Does your argument in the earlier problem apply in this situation? Explain.

Lesson Summary
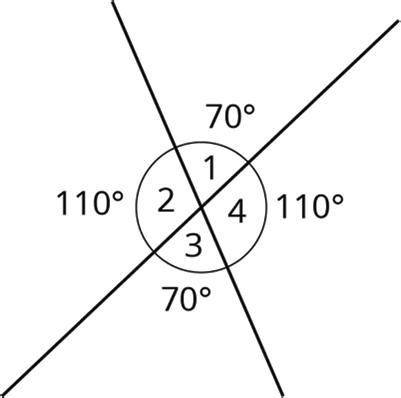
When 2 lines intersect, vertical angles are congruent and adjacent angles are supplementary, which means their measures sum to 180°. For example, in this figure, angles 1 and 3 are congruent, angles 2 and 4 are congruent, angles 1 and 4 are supplementary, and angles 2 and 3 are supplementary.
When 2 parallel lines are cut by another line, called a transversal, additional angle relationships are created. These relationships include angle pairs that are congruent and supplementary. Pairs of corresponding angles, alternate interior angles, and alternate exterior angles are congruent to each other, while pairs of same-side interior angles are supplementary to each other.
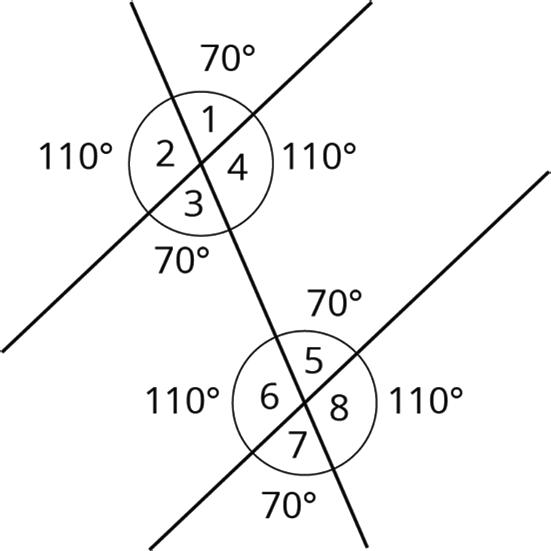
Using facts about vertical angles, adjacent angles, and at least 1 other pair of angles, the measures of any of the 8 angles created by a transversal crossing parallel lines can be found if only 1 measure is given. For example, starting with the fact that angle 1 is 70°, use vertical angles to determine that angle 3 is 70°. Then, use alternate interior angles to find that angle 5 is 70°. Then, use the fact that angle 5 is supplementary to angle 8 to determine that angle 8 is 110° since 180 − 70 = 110.
When parallel lines are cut by a transversal, it turns out that there are only 2 different angle measures. In this example, angles 1, 3, 5, and 7 all measure 70°, and angles 2, 4, 6, and 8 all measure 110°.
While other pairs of lines can be cut by a transversal, these special angle relationships are only formed when the lines being cut by the transversal are parallel.
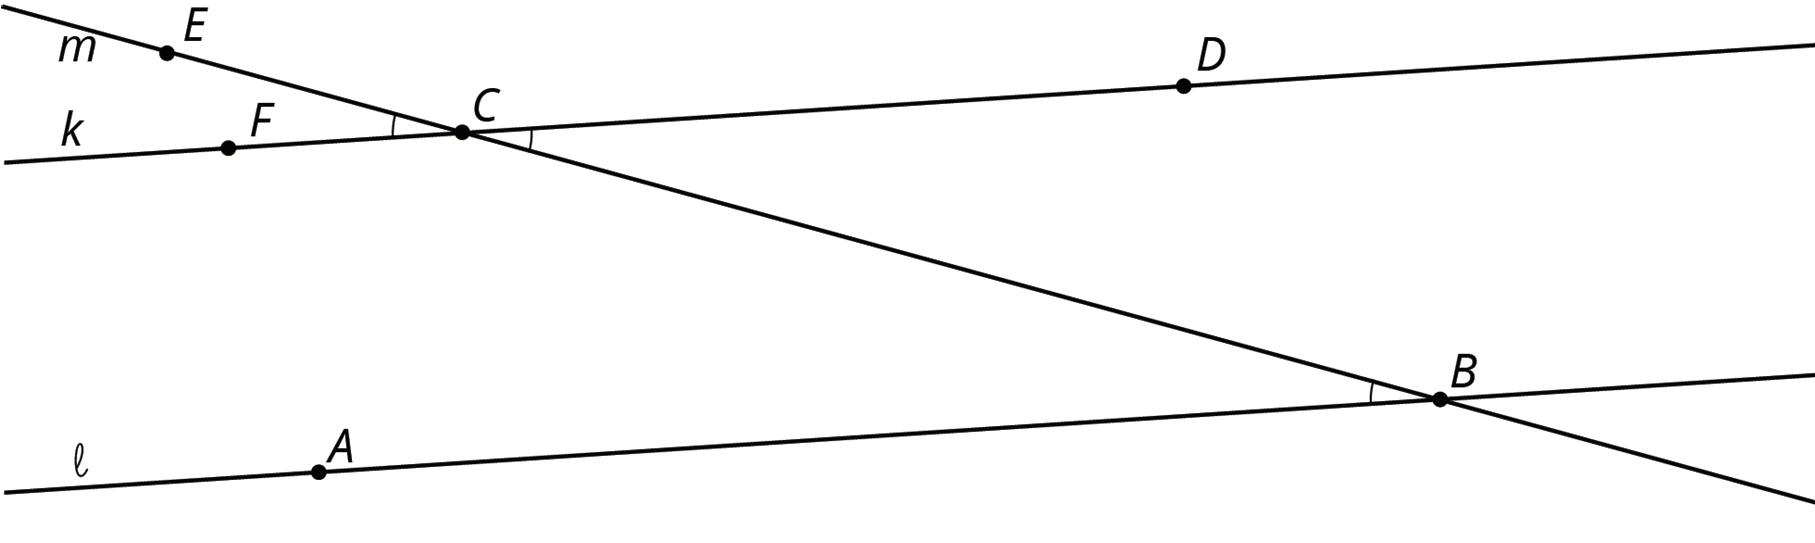
Note that a pair of parallel lines can be cut by more than 1 transversal. In this case, use the pairs of angles created by each transversal separately to determine the measure of any missing angles.
Practice Problems
1. Lines �� and ℓ are parallel, and the measure of angle ������ is 19°.
a. Explain why the measure of angle ������ is 19°. If you get stuck, consider translating line ℓ by moving �� to ��.
b. What is the measure of angle ������? Explain.
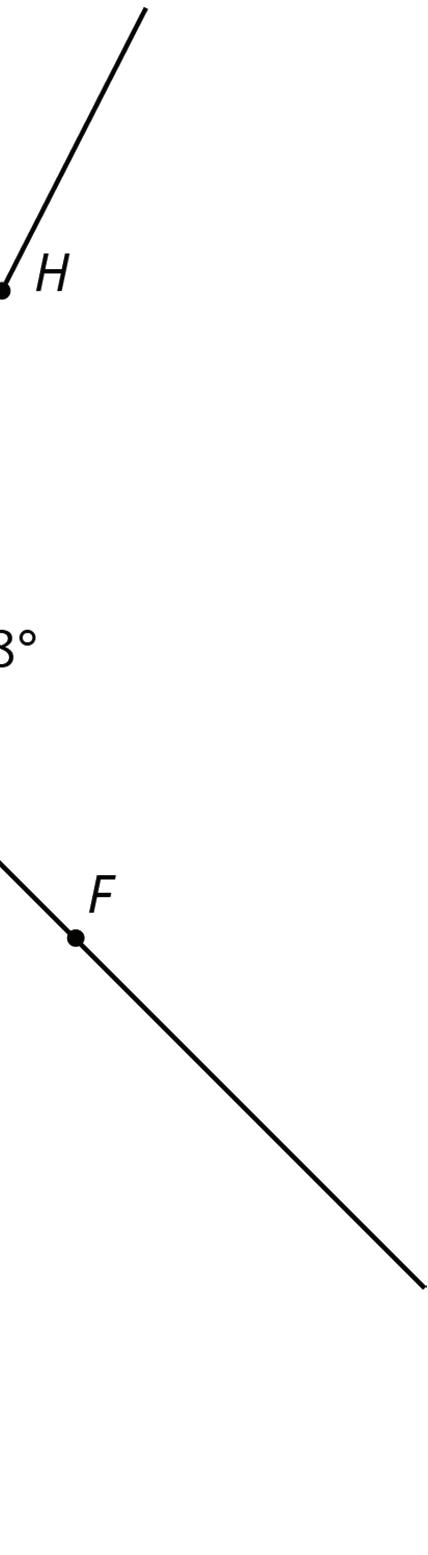
2. The diagram shows three lines with some marked angle measures.
Find the missing angle measures marked with question marks.

3. Lines �� and �� are parallel. Find the value of ��.


Review Problem
4. The two figures are scaled copies of each other.
a. What is the scale factor that takes Figure 1 to Figure 2?
b. What is the scale factor that takes Figure 2 to Figure 1?
Unit 1, Lesson 12: Solving for Unknown Angles with Parallel Lines
Warm-Up: Angle Relationships in Parallel Lines
1. In the figure shown, line �� is parallel to line ��, and they are intersected by transversal line ��.
Complete the statements.
a. If ∠�� = 55°, then ∠�� = ________.
b. If ∠�� = _____, then ∠�� = ______.
2. In the figure shown, ���� is parallel to ����, and they are intersected by transversal ����.
Complete the statements.
a. ∠������ is corresponding with _____.
b. ∠������ is alternate interior with _____.
c. ∠������ and _____ are vertical angles.
Collaborative Activity: Solving for Unknown Angles
1. Parallel lines ���� and ���� are intersected by transversal ����, where ��∠������ = 93° and ��∠������ = (11�� + 5)°, as shown.
a. Complete the statements.
Angles ������ and ������ are congruent supplementary angles. The equation that can be used to solve for �� is 11�� + 5 = 93. 11�� + 5 + 93 = 180.
b. Work with your partner to determine the value of ��.
c. What is the measure of ∠������? ��∠������ = _________°
2. In the diagram, ���� ∥ ���� with transversals ���� and ����, where ��∠������ = 59° and ��∠������ = 113°.
a. Write the given angle measurements on the diagram.
b. Determine the angle measures. Then, explain your strategy for determining each measure. Angle
Measure
Explanation of Strategy
3. In the diagram, ���� ∥ ���� and ���� ∥ ����.
= (11�� + 12)°, ��∠������ = (15�� − 22)°, and
= (12�� + 5)°.
a. Select all the angles that are congruent to ∠������.
b. Compare your responses with your partner’s responses. Discuss any differences, and make corrections if needed.
c. Write and solve an equation to find the value of ��.
d. What is the measure of ∠������?
e. Determine the value of ��.
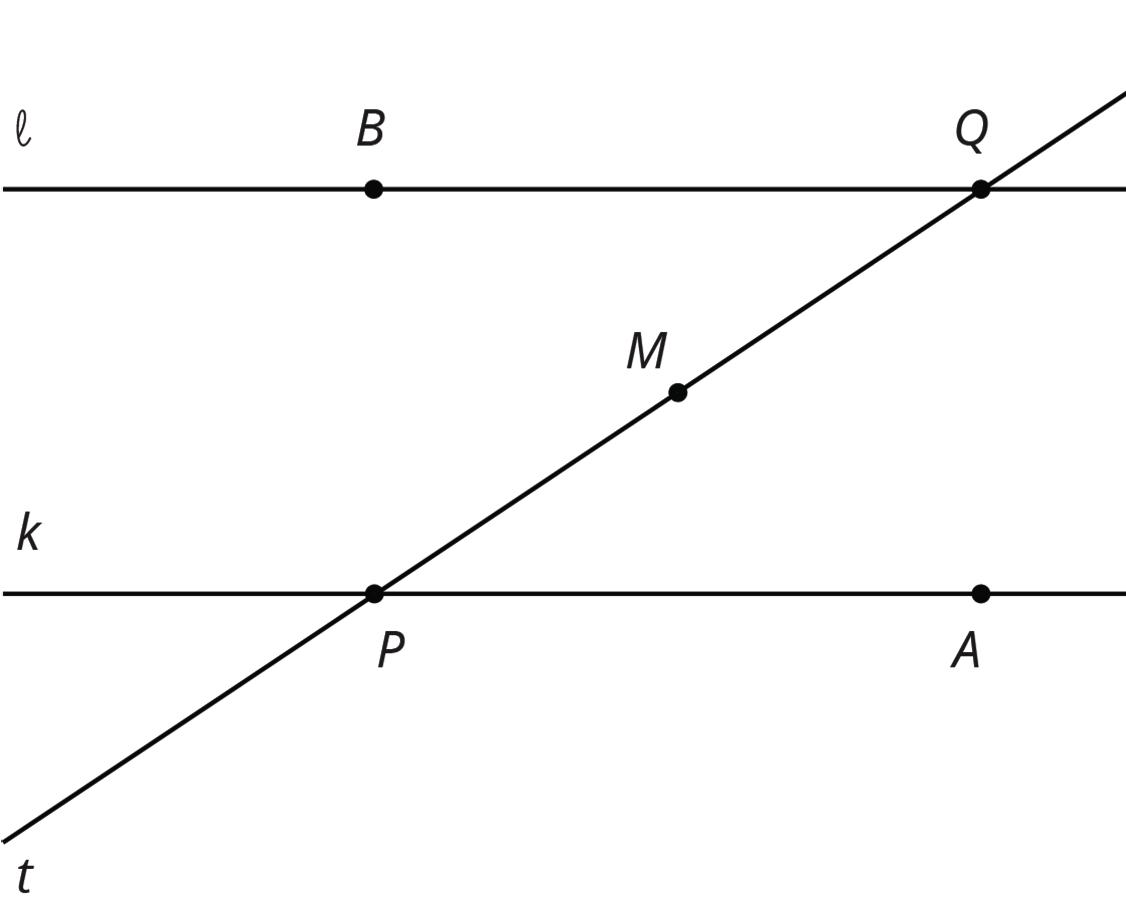
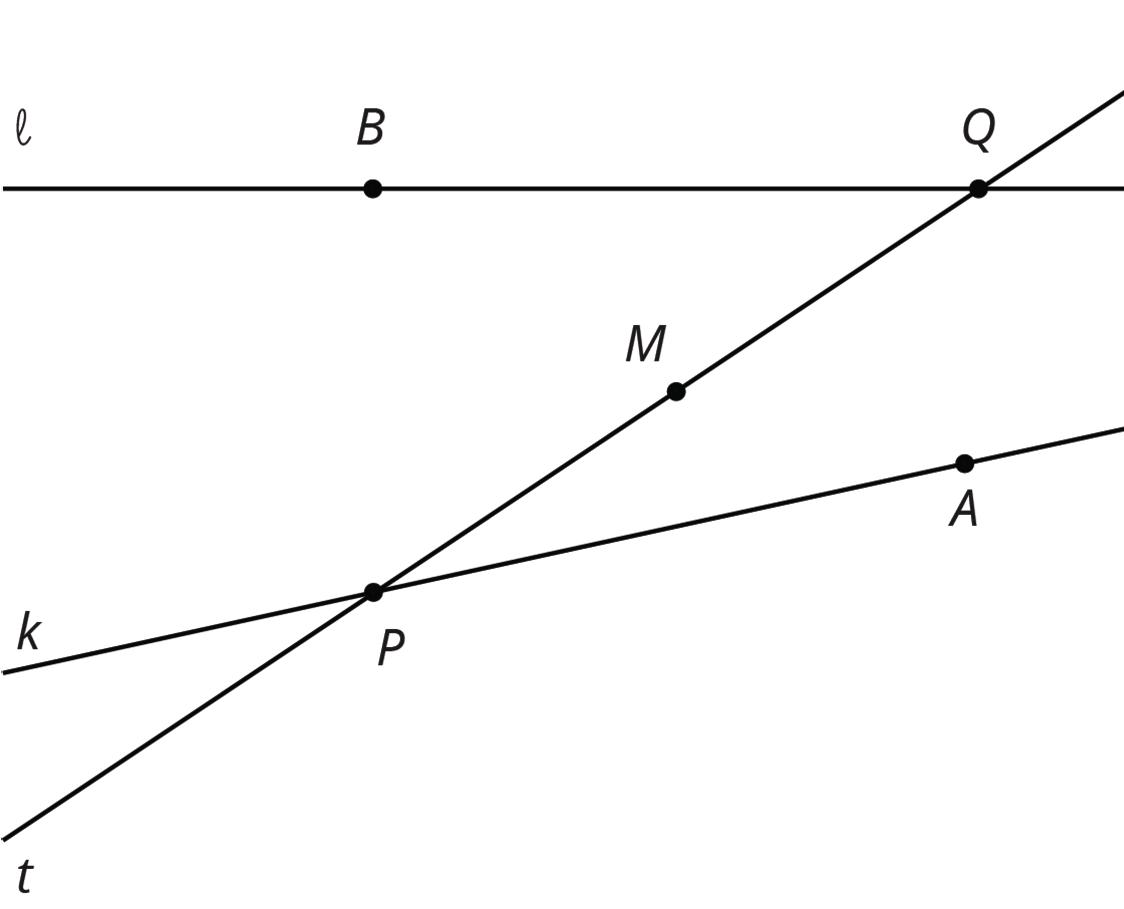
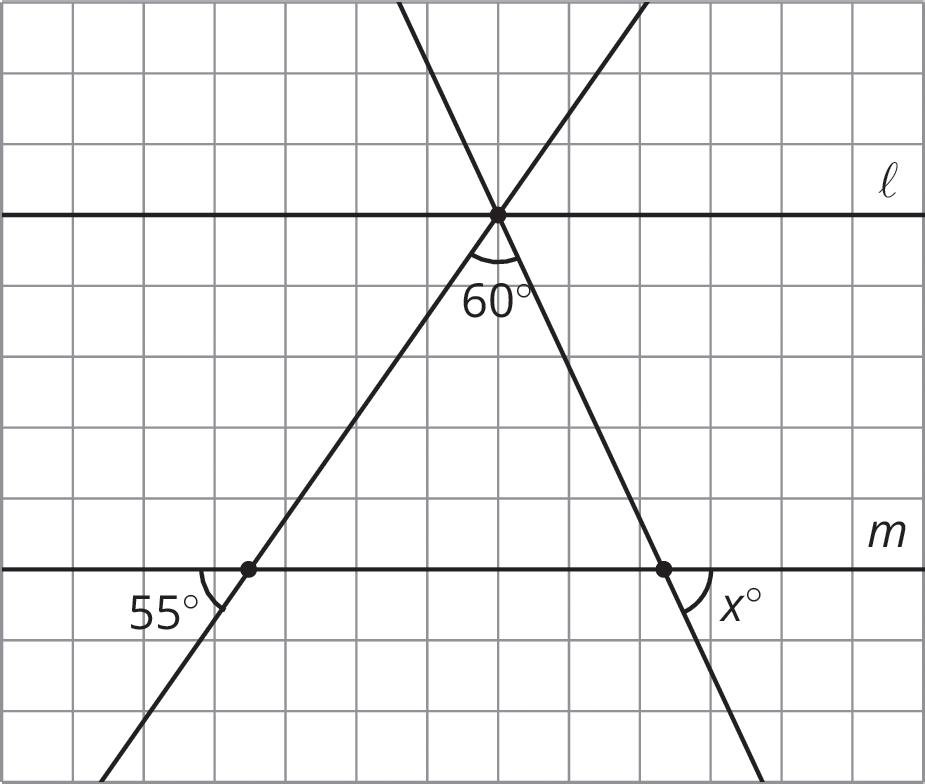
Collaborative Activity: Parallel Lines and Triangles
Parallel lines ℓ and �� are cut by 2 transversals, which intersect ℓ at the same point. Two angles are marked in the figure.
Find the measure of the third angle, ��.
Lesson Summary
Use properties of special angles formed by parallel lines to determine unknown angle measures. Angle measures can be presented as numerical values or as algebraic expressions. The table summarizes angles that you have used in the previous lessons to solve for unknown values.
Angle Relationship Angle Measures
Corresponding angles
Same-side interior angles
Alternate interior angles
Alternate exterior angles
Vertical angles
Congruent angles
Supplementary angles
Congruent angles
Congruent angles
Congruent angles
Practice Problems
1. In the diagram, ���� ∥ ���� with transversal ����, where ��∠������ = (14�� + 18)° and ����∠������ = (12�� − 7)°.
a. Complete the statements.
Angles ������ and ������ are ______________________ angles, so
��∠������ = ��∠������.
��∠������ + ��∠������ = 90°.
��∠������ + ��∠������ = 180°. Therefore,
14�� + 18 = 12�� − 7, 14�� + 18 + 12�� − 7 = 90, 14�� + 18 + 12�� − 7 = 180, where �� =___________.
b. Find the measure of each angle.
2. Parallel lines ���� and ���� and transversal ���� are shown, where ��∠������ = (14�� + 11)° and ��∠������ = (20�� − 4)°.
a. Solve for ��.
b. Complete the table.
Review Problems
3. Parallel lines ���� and ���� and transversal ���� are shown with ��∠������ = 24°.
a. Determine ��∠������. Explain your reasoning.
b. Determine ��∠������. Explain your reasoning.
4. Point �� has coordinates (−2, 4). After a reflection across the ��-axis, a translation 3 units to the right, and a translation 1 unit up, what are the coordinates of the image?
Unit 1, Lesson 13: Parallel Lines and the Angles in a Triangle
Warm-Up: True or False: Computational Relationships
1. Is each equation true or false?
a. 62 − 28 = 60 − 30
b. 3 ⋅ −8 = (2⋅ − 8) − 8
c. 16 −2 + 24 −2 = 40 −2
Exploration Activity: Angle Plus Two
Here is triangle ������.

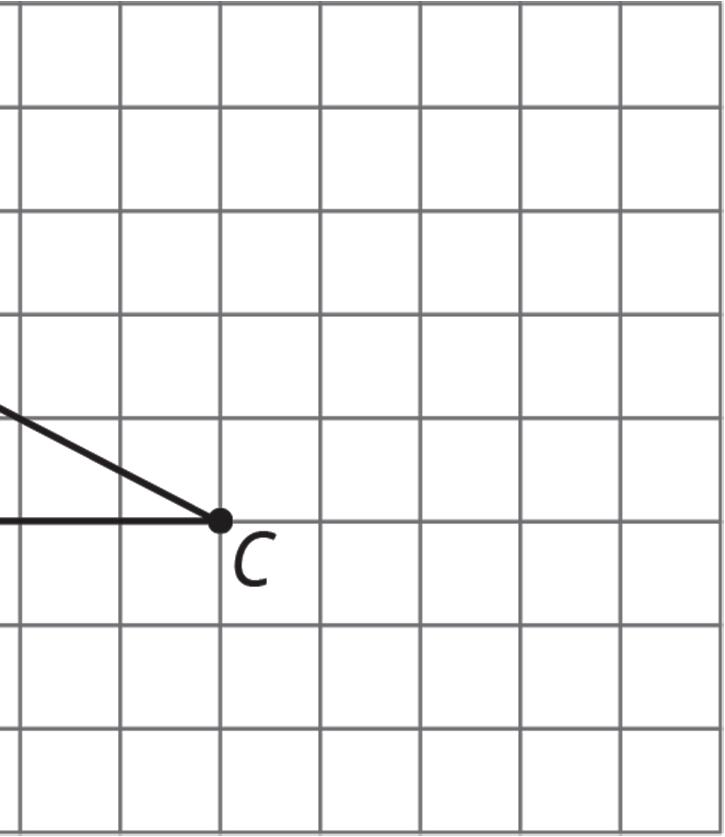
1. Rotate triangle ������ 180° around the midpoint of side ����. Label the new vertex ��.
2. Rotate triangle ������ 180° around the midpoint of side ����. Label the new vertex ��.
3. Look at angles ������, ������, and ������. Without measuring, write what you think is the sum of the measures of these angles. Explain or show your reasoning.
4. Is the measure of angle ������ equal to the measure of any angle in triangle ������? If so, which one? If not, how do you know?
5. Is the measure of angle ������ equal to the measure of any angle in triangle ������? If so, which one? If not, how do you know?
6. What is the sum of the measures of angles ������, ������, and ������?
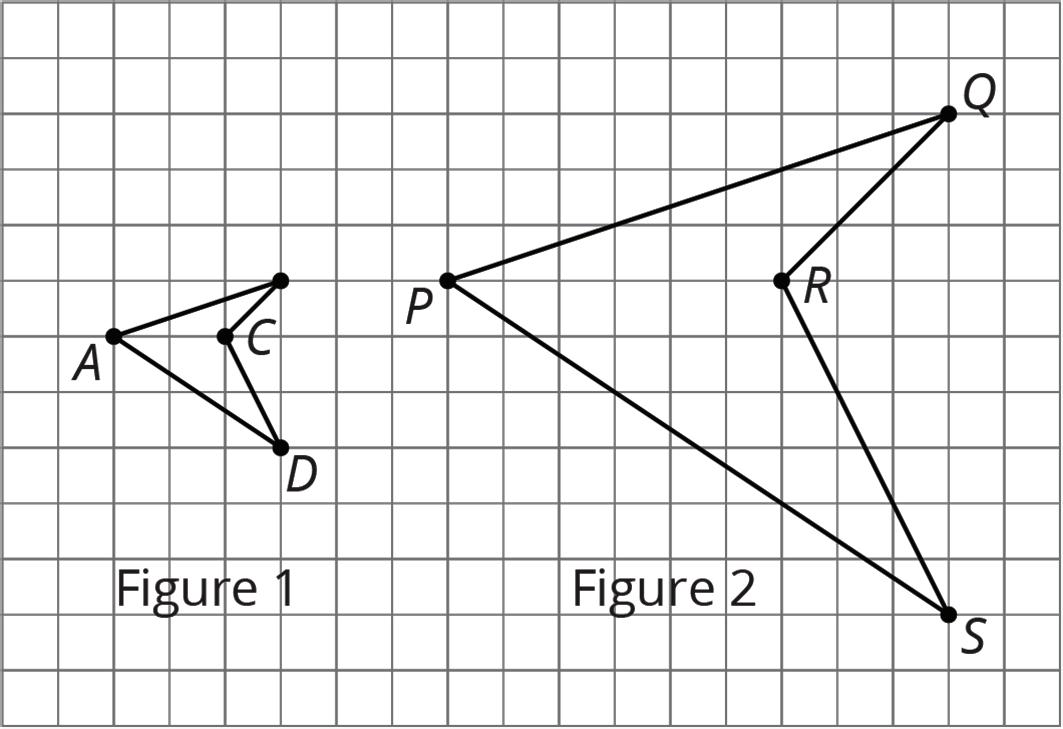
Collaborative Activity: Every Triangle in the World
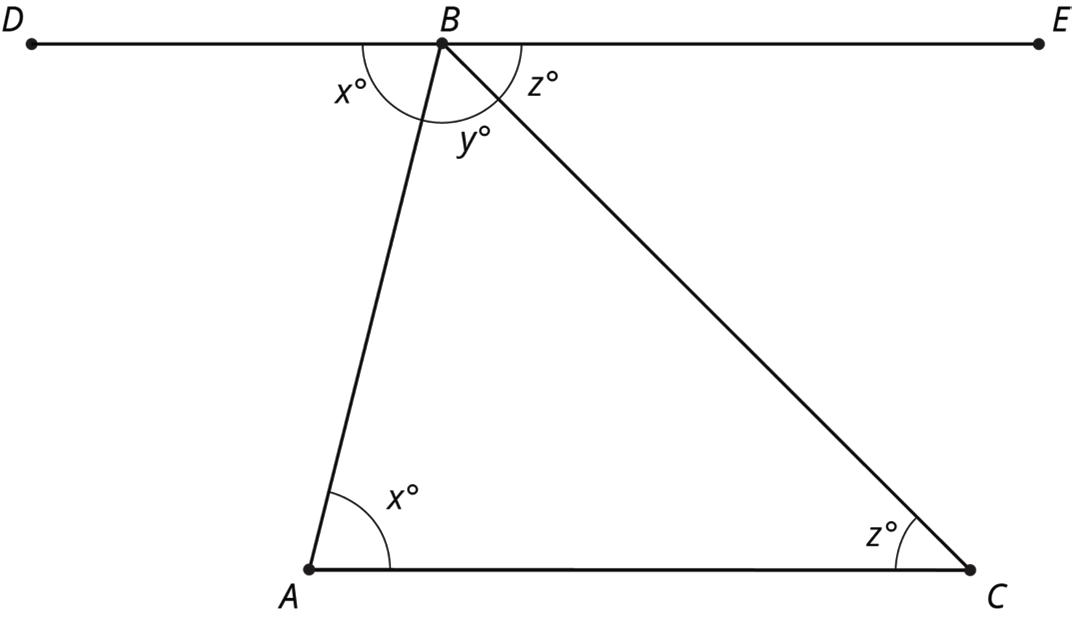
Here is ������. Line ���� is parallel to line ����.
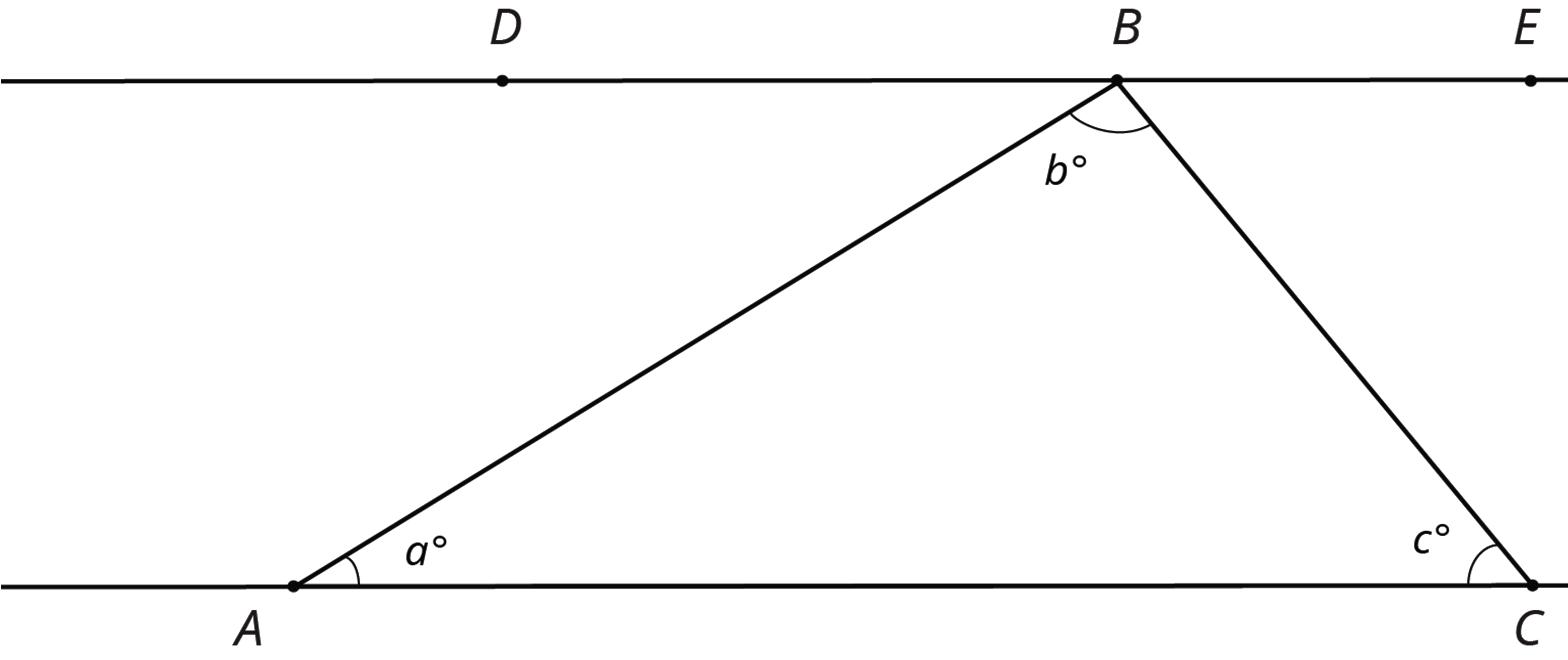
1. What is ��∠������ + �� + ��∠������? Explain how you know.
2. Use your answer to explain why �� + �� + �� = 180.
3. Explain why your argument will work for any triangle: that is, explain why the sum of the angle measures in any triangle is 180°.
Collaborative Activity: Four Triangles Revisited
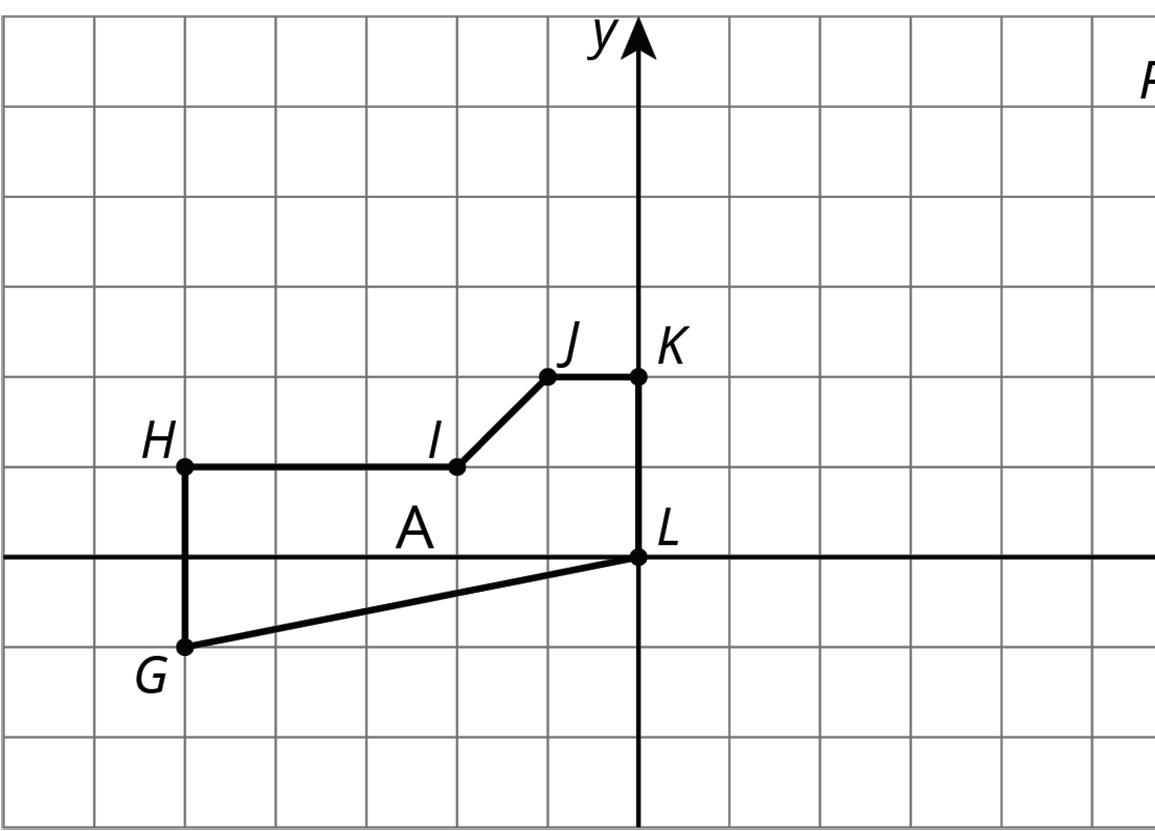
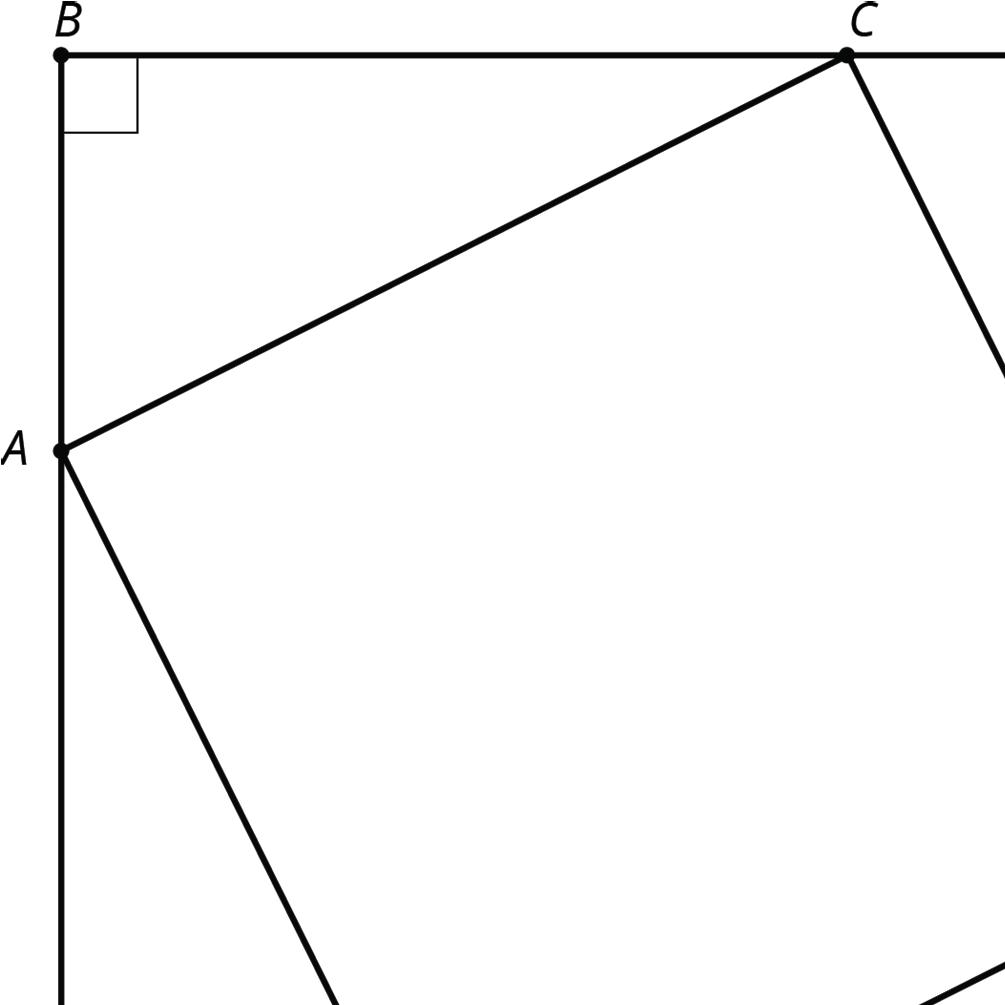
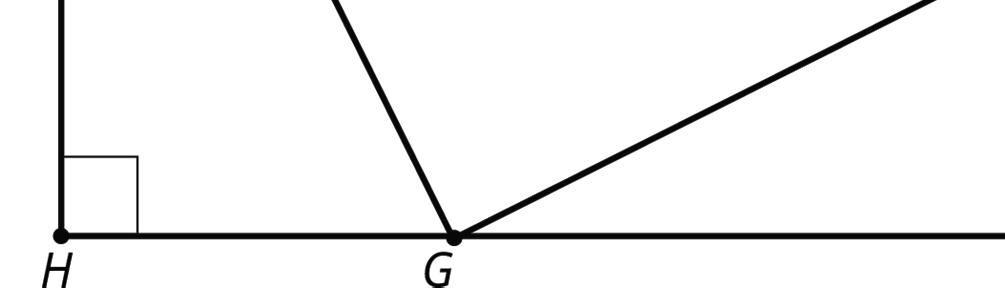
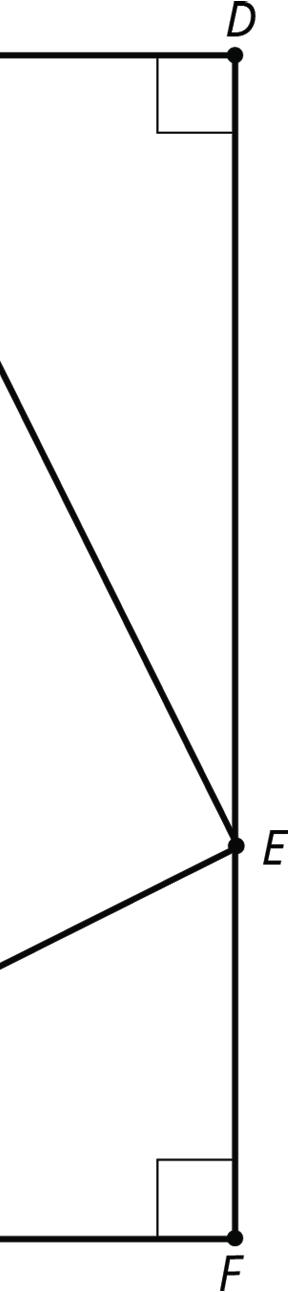
This diagram shows a square �������� that has been made by images of triangle ������ under rigid transformations.
Given that angle ������ measures 53°, find as many other angle measures as you can.
Lesson Summary
Parallel lines and rotations can be used to prove that the angles in a triangle always have a sum of 180°. Triangle ������ is shown, where ���� contains point �� and is parallel to ����.
• A 180° rotation of Δ������ around the midpoint of ���� interchanges ∠�� and ∠������ so they have the same measure. In the diagram, these angles are marked as ��°.
• A 180° rotation of Δ������ around the midpoint of ���� interchanges ∠�� and ∠������ so they have the same measure. In the diagram, these angles are marked as ��°.
• The 3 angles with vertex �� form a straight line, so their measures add up to 180° (�� + �� + �� = 180). Since ��, ��, and �� are also the measures of the 3 interior angles in Δ������, it can therefore be proven that the sum of the angles in a triangle is always 180°.
Practice Problems
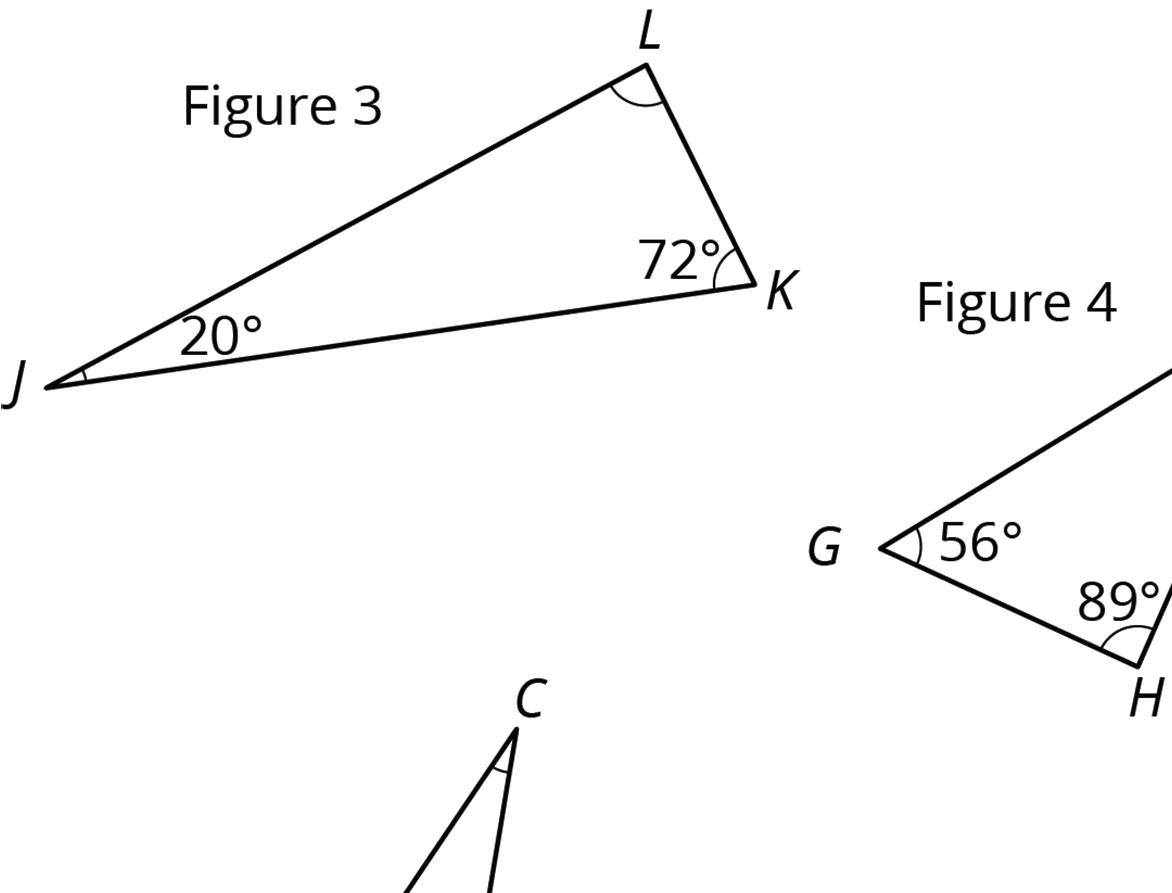
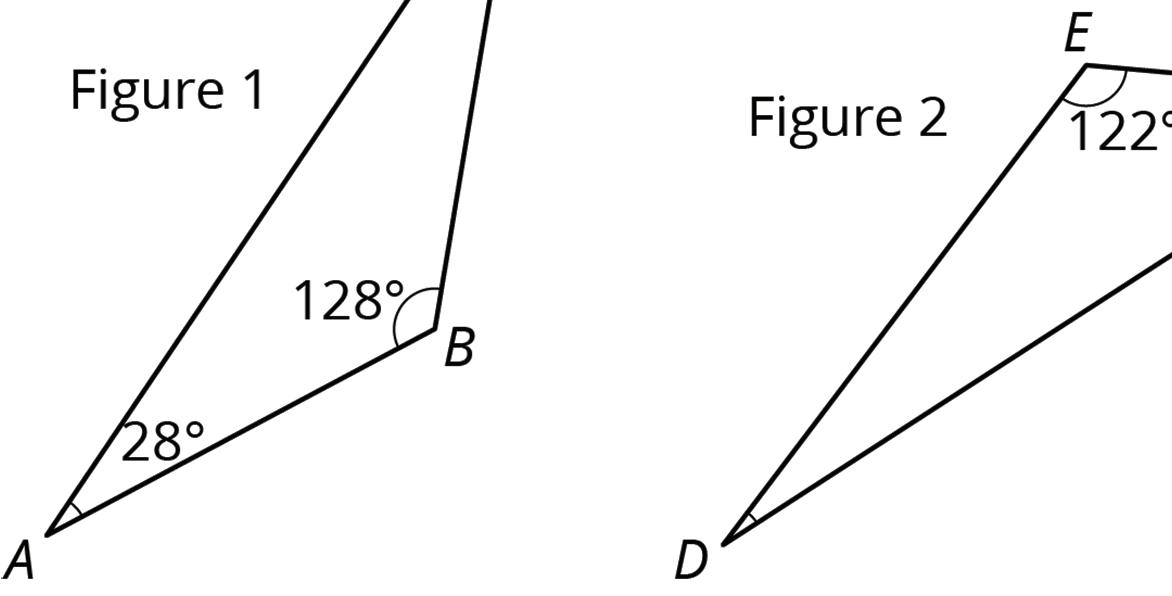
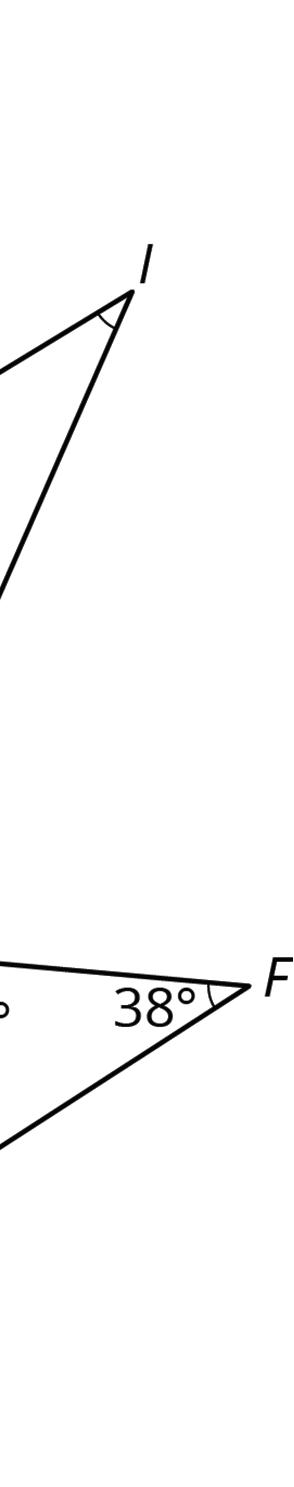
1. For each triangle, find the measure of the missing angle.
2. Is there a triangle with two right angles? Explain your reasoning.
3. In this diagram, lines ���� and ���� are parallel.
Angle ������ measures 35° and angle ������ measures 115° .
?
?
a. What is ��∠������
b. b. What is ��∠������?
c. c. What is ��∠������
4. Here is a diagram of triangle ������.
a. Find the measures of angles ��, ��, and ��.
b. Find the sum of the measures of angles ��, ��, and ��.
c. What do you notice about these three angles?
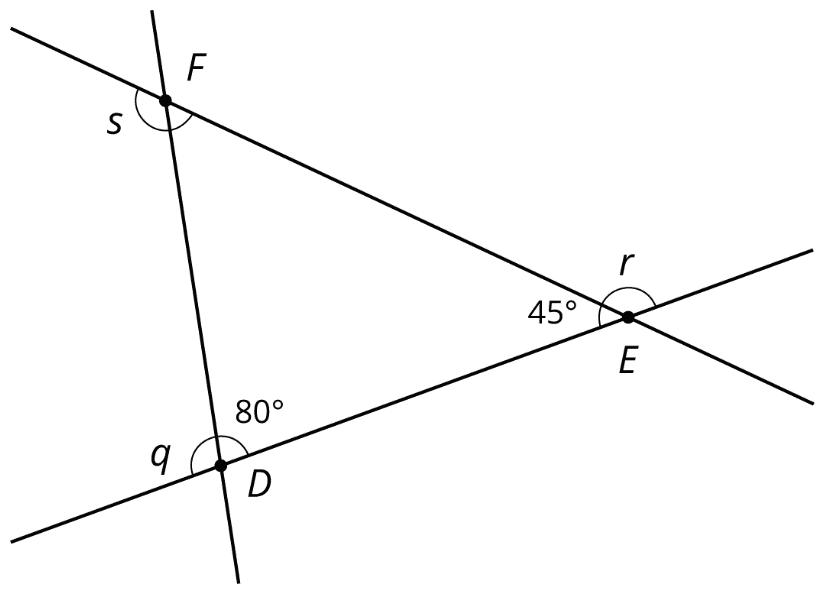
Unit 1, Lesson 14: Exterior Angles of Triangles
Warm-Up: Interior Angles of a Triangle
1. Triangle ������ is shown.
2x + 9 3x – 4
a. Write an equation that can be used to find the value of ��.
b. Solve the equation.
c. Find the measure of ∠������.
Collaborative Activity: Exploring Exterior Angles of Triangles
An exterior angle is an angle created by one leg of a triangle and an extended adjacent leg of the triangle.
In the triangle shown, ∠�� is an exterior angle, and ∠�� is its adjacent interior angle.
1 4 3
Work with your partner to complete the following based on the given information.
1. Complete the statements.
An exterior angle is complementary supplementary vertical to its adjacent interior angle, so the sum of ∠3 and ∠4 is 90°. 180°. 360°. Angles 1, 2, and 3 are the interior exterior angles of the triangle. Their sum is 90°. 180°. 360°.
The notation ��∠1 is read as “The measure of angle 1.”
2. Destiny wrote the following mathematical statements on her paper after looking at the triangle in problem 1.
+ ��∠3 = 180°
+ ��∠2 + ��∠3 = 180°
+ ��∠2 = ��∠4
a. Discuss Destiny’s reasoning with your partner.
b. Complete the statement.
Any exterior angle of a triangle is equal to 1 of the interior angles of the triangle. the sum of the 2 non-adjacent interior angles of the triangle.
3. Every interior angle of a triangle has 2 possible exterior angles, depending on the side length that is extended. Consider the triangle shown, where both exterior angles adjacent to ∠�� are labeled ��°.
a. Discuss with your partner the angle relationship between both possible exterior angles adjacent to ∠3.
b. Work with your partner to complete the statements.
The 2 possible exterior angles adjacent to ∠3 are complementary supplementary vertical angles, so they both have the same measure. Therefore, it does not matter which side length is extended to create an exterior angle, because both are equivalent to each other and complementary supplementary vertical to the adjacent interior angle.
Guided Activity: Exterior Angles of Triangles
The relationship of the exterior angles of a triangle can be used to solve for unknown angle measures in a triangle. The measure of an exterior angle of a triangle is equal to the sum of the measures of the 2 non-adjacent interior angles of the triangle.
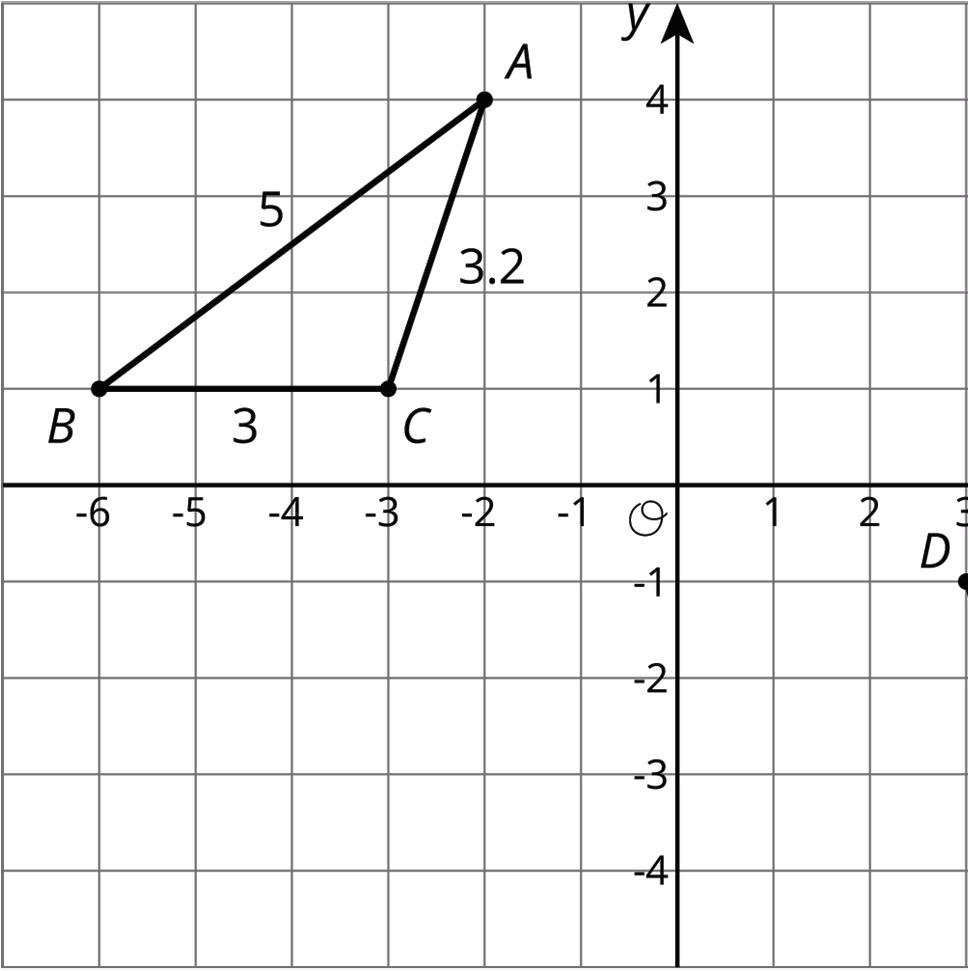
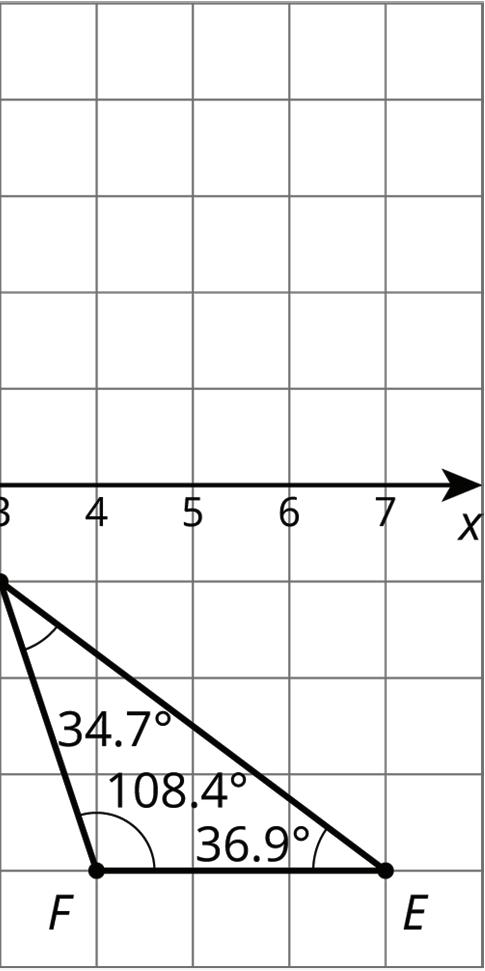
1. Triangle ������ is shown, where ��∠������ = 31.3° and ��∠������ = 67.5°.
Find the measure of ∠������.
2. A figure is shown, where ��∠������ = 86°, ��∠������ = 143°, and ��∠������ = ��°.
a. Write an equation that can be used to find the value of ��.
b. Solve the equation.
Collaborative Activity: Using Multiple-Angle Relationships to Find Missing Angles
1. Triangle ������ is shown, where ��∠������ = (2�� + 21)°, ��∠������ = 70°, and ��∠������ = (3�� + 19)°.
x + 19)°
x + 21)°
a. Complete the table by writing the angle relationship for each set of angles using 1 of the phrases from the bank. Then, complete the description of the relationship between the angles.
exterior angles to ∠������ supplementary angles
interior angles of triangle ������ vertical angles
Angles
Angle Relationship
Description of Relationship
∠������ and ∠������ Angle measures are ____________.
∠������ and ∠������ Angles sum to ________.
∠������ or ∠������ ______________ to the sum of ∠������ and ∠������.
∠������, ∠������, and ∠������ Angles sum to ________.
b. Different combinations of the relationships described in the table can be used to find the value of ��. Discuss with your partner which relationship(s) you prefer to use to find the value of ��.
c. Write and solve an equation to find the value of ��.
d. Find the measure of ∠������.
2. A figure including Δ������ is shown, where ��∠������ = (12�� + 14)°, ��∠������ = (13�� + 6)°,
��∠������ = (9�� − 2)°,
��∠������ = (17�� + 4)°, ��∠������ = (5��)°, and ��∠������ = (8�� + 6)°.
a. Three equations shown in the table can be used along with the angle relationships in the figure to find the value of ��. Identify which angle relationship was used to write each equation.
(17y + 4)° (9y – 2)° H F
y° (13y + 6)° (12y + 14)°
(8y + 6)°
Equation
13�� + 6 + 9�� − 2 = 180
12�� + 14 = 9�� − 2 + 5��
5�� + 9�� − 2 + 8�� + 6 = 180
Angle Relationship
Exterior and interior angles of a triangle
Only interior angles of a triangle
Supplementary angles
Exterior and interior angles of a triangle
Only interior angles of a triangle
Supplementary angles
Exterior and interior angles of a triangle
Only interior angles of a triangle
Supplementary angles
b. Choose 1 of the equations from part A, and use it to find the value of ��.
c. Find the value of each angle measure in the table.
The 3 angles in part C are the exterior angles of ������.
d. What is the sum of the measures of the exterior angles from part C?
3. Complete the statement.
The sum of the interior angles of any triangle is _______°. The sum of the exterior angles of any triangle is _______° .
Lesson Summary
Algebraic equations can be written to express the relationship between the interior and exterior angles of triangles. These equations can then be solved to find the measures of unknown angles.
The Triangle Angle Sum Theorem states that the sum of the 3 angles in a triangle is 180°. The Exterior Angle Theorem states that the measure of an exterior angle of a triangle is equal to the sum of the measures of the 2 non-adjacent interior angles. These 2 theorems can be used to determine angle measures inside and outside of a triangle.
For example, Δ������ is shown, where ��∠�� = 61° and ��∠�� = 82°. Using the Triangle Angle Sum Theorem, it can be shown that 61 + 82 + ��∠������ = 180°. So, ��∠������ = 37°. Using the Exterior Angle Theorem, it can be shown that 61 + 82 = ��∠������. So, ��∠������ = 143°. Since ��∠������ + ��∠������ = 180°, the angles are supplementary.
Practice Problems
1. Triangle ������ is shown, where ��∠������ = 78°, ��∠������ = (�� + 48)°, and ∠������ = (5�� − 12)°.
a. Write and solve an equation to find the value of ��.
b. Find the measure of ∠������.
2. Triangle ������ is shown, where ��∠������ = 55°, ��∠������ = (15�� − 14)°, and ��∠������ = (11�� − 25)°.
a. Write and solve an equation to find the value of ��.
b. Find the measures of ∠������ and ∠������.
Review Problems
3. For each set of angles, determine whether there exists a triangle whose angles have these measures.
a. 70°, 20°, 90°
b. 120°, 50°, 25°
c. 57°, 100°, 23°
4. Parallel lines ���� and ���� and transversal ���� are shown, where ��∠������ = (2�� + 17)° and ��∠������ = (5�� − 28)°.
a. Find the value of ��.
b. Find ��∠������ and ��∠������.
Unit 2: Dilations, Similarity, and Introducing Slope
Unit 2, Lesson 1: Projecting and Scaling
Warm-Up: Number Talk: Remembering Fraction Division
Find each quotient. Write your answer as a fraction or a mixed number.
Collaborative Activity: Sorting Rectangles
Rectangles were made by cutting an 8 1 2 -inch (in.) by 11-in. piece of paper in half, in half again, and so on, as illustrated in the diagram. Find the lengths of each rectangle and enter them in the appropriate table.
1. Some of the rectangles are scaled copies of the full sheet of paper (Rectangle A). Enter the measurements of those rectangles in the table.
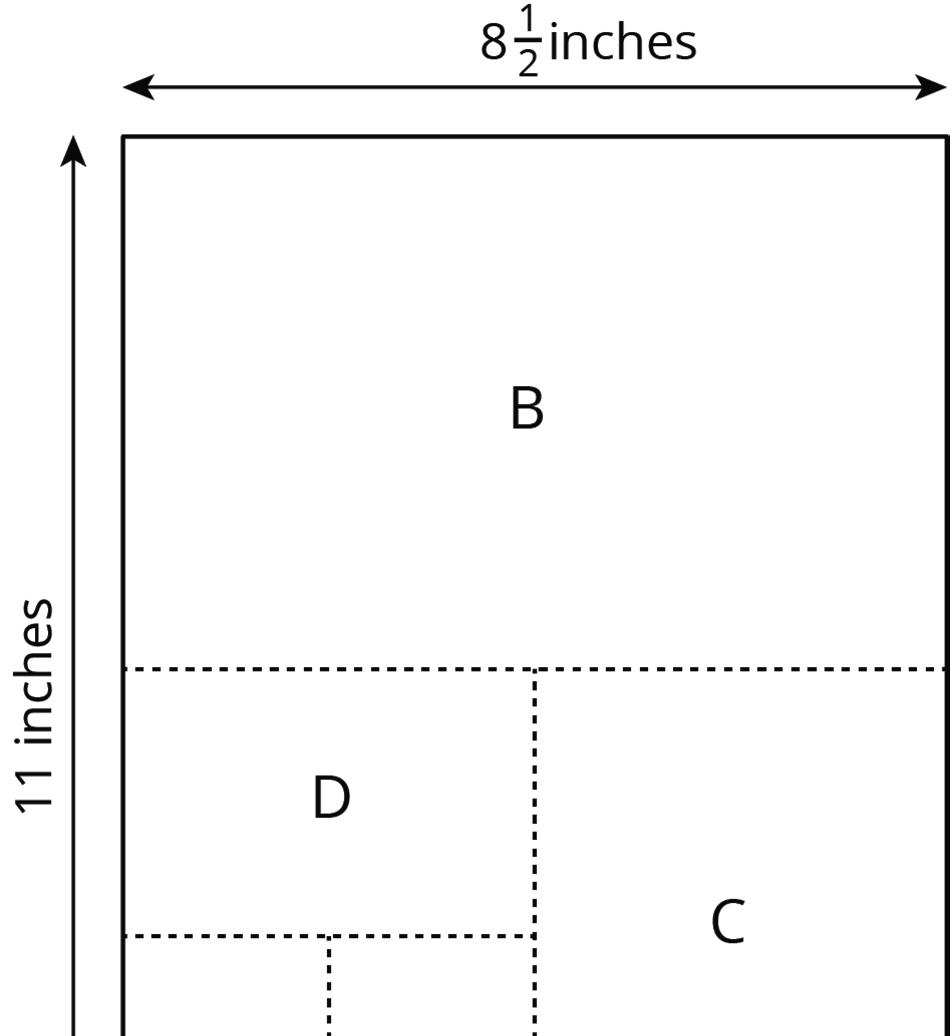
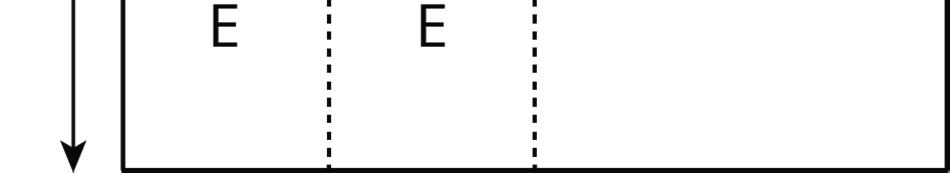
2. Some of the rectangles are not scaled copies of the full sheet of paper. Enter the measurements of those rectangles in the table.
Rectangle
Length of Short Side (in.) Length of Long Side (in.)
Rectangle
3. Look at the measurements for the rectangles that are scaled copies of the full sheet of paper. What do you notice about the measurements of these rectangles? Look at the measurements for the rectangles that are not scaled copies of the full sheet. What do you notice about these measurements?
4. Stack the rectangles that are scaled copies of the full sheet so that they all line up at a corner, as shown in the diagram. Do the same with the other set of rectangles. On each stack, draw a line from the bottom left corner to the top right corner of the biggest rectangle. What do you notice?
5. Stack all of the rectangles from largest to smallest so that they all line up at a corner. Compare the lines that you drew. Can you tell, from the drawn lines, which set each rectangle came from?
Collaborative Activity: Scaled Rectangles
Here is a picture of Rectangle R, which has been evenly divided into smaller rectangles. Two of the smaller rectangles are labeled B and C.
1. Is B a scaled copy of R? If so, what is the scale factor?
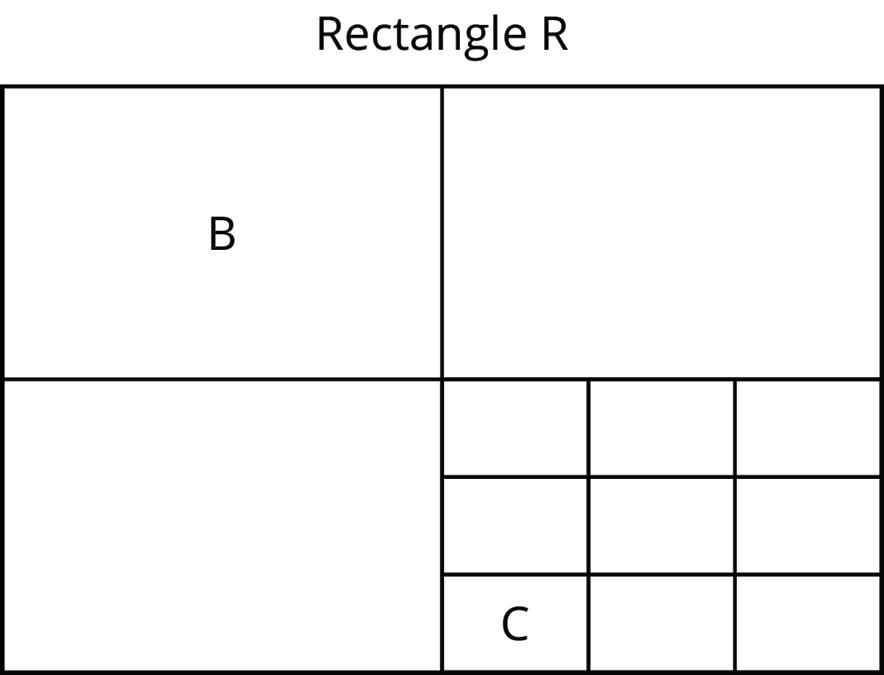
2. Is C a scaled copy of B? If so, what is the scale factor?
3. Is C a scaled copy of R? If so, what is the scale factor?
Lesson Summary
Scaled copies of rectangles have an interesting property.
A scaled copy is a copy of a figure where every length in the original figure is multiplied by the same number.
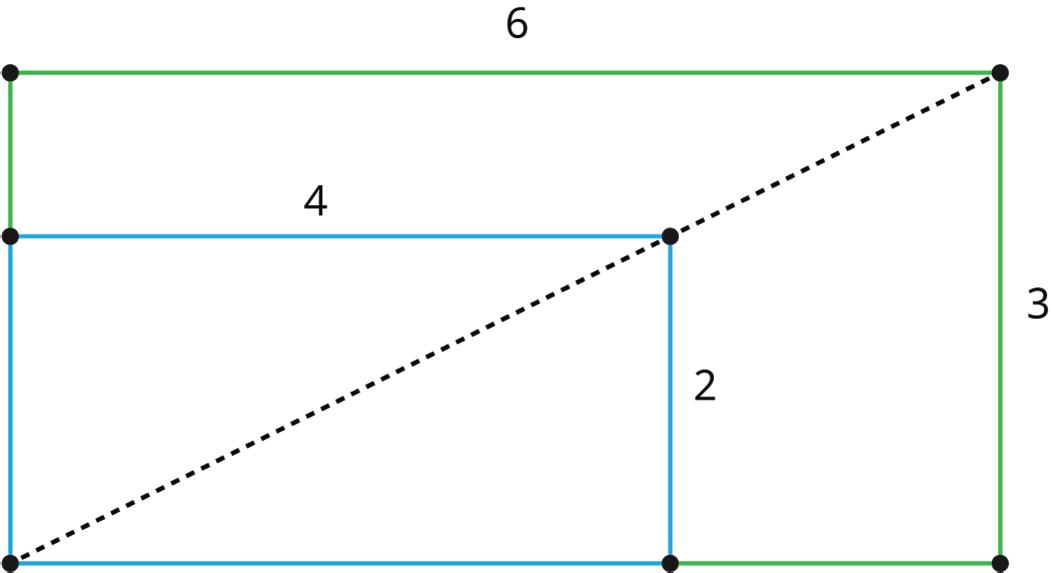
The larger rectangle shown is a scaled copy of the smaller one with a scale factor of 3 2 . Notice how the diagonal of the large rectangle contains the diagonal of the smaller rectangle. This is the case for any 2 scaled copies of a rectangle if they are lined up as shown. If 2 rectangles are not scaled copies of one another, then the diagonals will not match up.
A scale factor is the constant that is multiplied by the length of each side of a figure to produce an image that is the same shape as the original figure.
You learned about scale drawings and scaled copies in the previous course. In this unit, you will expand on this knowledge in terms of transformations and similar figures.

Practice Problems
1. Rectangle �� measures 12 centimeters (cm) by 3 cm. Rectangle �� is a scaled copy of Rectangle ��. Select all of the measurement pairs that could be the dimensions of Rectangle ��.
□ 6 cm by 1.5 cm
□ 10 cm by 2 cm
□ 13 cm by 4 cm
□ 18 cm by 4.5 cm
□ 80 cm by 20 cm
2. Rectangle �� has length 12 and width 8. Rectangle �� has length 15 and width 10. Rectangle �� has length 30 and width 15.
a. Is Rectangle �� a scaled copy of Rectangle ��? If so, what is the scale factor?
b. Is Rectangle �� a scaled copy of Rectangle ��? If so, what is the scale factor?
c. Explain how you know that Rectangle �� is not a scaled copy of Rectangle ��.
d. Is Rectangle �� a scaled copy of Rectangle ��? If so, what is the scale factor?
Review Problems
3. Which of these sets of angle measures could be the three angles in a triangle?
40°, 50°, 60°
B. 50°, 60°, 70°
60°, 70°, 80°
70°, 80°, 90°
A.
C.
D.
4. In the picture, lines ���� and ���� are parallel. Find the measures of the following angles. Explain your reasoning.
a. ∠������
b. ∠������
c. ∠������
Unit 2, Lesson 2: Dilations with No Grid
Warm-Up: Points on a Ray
1. Find and label a point �� on the ray whose distance from �� is twice the distance from �� to ��.
2. Find and label a point D on the ray whose distance from A is half the distance from B to A.

Guided Activity: Dilation Obstacle Course
A dilation is a transformation that is used to move points on a figure along a line. Dilations change the distance a figure is from a fixed point, called the center of dilation. The change in distance is determined using a scale factor. Nine points are shown on a plane.
1. Dilate point �� using a scale factor of 5 and point �� as the center of dilation. Which point is the resulting image?
2. Using point �� as the center of dilation, dilate point �� so that its image is point ��. What is the scale factor used?

3. Using point �� as the center of dilation, dilate point �� so that its image is point ��. What is the scale factor used?
4. To dilate point �� so that its image is point ��, which point on the diagram can be used as the center?
5. Dilate point �� using a scale factor of 1 3 with point �� as the center. Which point is its image?
6. Describe a dilation that uses a labeled point as its center and that would take point �� to point ��.
7. Using point �� as the center of dilation, dilate point �� so that its image is itself. What is the scale factor used?
Collaborative Activity: Getting Perspective
1. Using one colored pencil, draw the images of points �� and �� using �� as the center of dilation and a scale factor of 4. Label the new points ��′ and ��′.
2. Using a different color, draw the images of points �� and �� using �� as the center of dilation and a scale factor of 1 2 . Label the new points ��″ and Q″ .
Pause here so your teacher can review your diagram. Your teacher will then give you a scale factor to use in the next part.
3. Now you’ll make a perspective drawing. Here is a rectangle.
a. Choose a point inside the shaded circular region but outside the rectangle to use as the center of dilation. Label it ��.
b. Using your center �� and the scale factor you were given, draw the image under the dilation of each vertex of the rectangle, one at a time. Connect the dilated vertices to create the dilated rectangle.
c. Draw a segment that connects each of the original vertices with its image. This will make your diagram look like a cool three-dimensional drawing of a box! If there’s time, you can shade the sides of the box to make it look more realistic.
d. Compare your drawing to other people’s drawings. What is the same and what is different? How do the choices you made affect the final drawing? Was your dilated rectangle closer to �� than to the original rectangle, or farther away? How is that decided?
Lesson Summary
In addition to the transformations learned in Unit 1, another type of transformation is called a dilation. Dilations are not rigid transformations because the size of the image can change from the preimage. Every dilation has a center of dilation and a scale factor.
A dilation is a transformation in which each point on a figure moves along a line and changes its distance from a fixed point. The fixed point is the center of dilation. All of the original distances are multiplied by the same scale factor.
The center of dilation is a fixed point on a plane. It is the starting point from which we measure distances in a dilation.
In a dilation, the distance of the image to the center of dilation is proportional to the distance of the preimage to the center of dilation. The constant of proportionality is equal to the scale factor.
A ray is shown with multiple points. Suppose point �� is the center of dilation and point �� is dilated using a scale factor of 2.
Since the scale factor is larger than 1, the resulting point after the dilation must be farther away from point �� than point �� is, which makes point �� a possibility. To verify that point �� is the resuting image, measure the distances between the points. The distance between points �� and �� should be exactly twice the distance between points �� and �� because the scale factor is 2.
A dilation with a scale factor less than 1 brings a point closer to the center of dilation. Point �� is the dilation of point �� with center point �� using a scale factor of 1 3 . The distance between points �� and �� is 1 3 of the distance between points �� and ��.
Practice Problems
1. Segment AB measures 3 centimeters (cm). Point �� is the center of dilation. How long is the image of AB after a dilation with . . .
a. Scale factor 5?
b. Scale factor 3.7?
c. Scale factor 1 5 ?
d. Scale factor ��?
2. Here are points �� and ��. Plot the points for each dilation described.
a. �� is the image of �� using �� as the center of dilation and a scale factor of 2.
b. �� is the image of �� using �� as the center of dilation and a scale factor of 2.
c. �� is the image of �� using �� as the center of dilation and a scale factor of 1 2 .
d. �� is the image of �� using �� as the center of dilation and a scale factor of 1 2 .
Review Problems
3. Triangle ������ is a scaled copy of ∆������. Side ���� measures 12 cm and is the longest side of ∆������. Side ���� measures 8 cm and is the longest side of ∆������.
a. Triangle ������ is a scaled copy of triangle ������ with what scale factor?
b. Triangle ������ is a scaled copy of triangle ������ with what scale factor?
4. The diagram shows two intersecting lines.
Find the missing angle measures.
5. Two triangles are shown.
a. Show that the two triangles are congruent.
b. Find the side lengths of DEF and the angle measures of ABC.
Unit 2,
Lesson
3: Dilations on a Square Grid
Warm-Up: Estimating a Scale Factor
Point �� is the dilation of point �� with center of dilation �� and scale factor ��.
Estimate ��. Be prepared to explain your reasoning.
Exploration
Activity: Dilations on a Grid
1. Find the dilation of quadrilateral �������� with center �� and scale factor 2.
2. Find the dilation of triangle ������ with center �� and scale factor 2.
3. Find the dilation of triangle ������ with center �� and scale factor 1 2 .
Collaborative Activity: Matching Dilations on a Coordinate Grid
Your teacher will give you some cards. Each of Cards 1 through 6 shows a figure in the coordinate plane and describes a dilation.
Each of Cards A through E describes the image of the dilation for one of the numbered cards.
Match number cards with letter cards. One of the number cards will not have a match. For this card, you’ll need to draw an image.
Lesson Summary
Square grids can be useful for showing dilations. The grid is especially helpful when the center of dilation and the point(s) being dilated lie at grid points. Rather than using a ruler to measure the distance between the points, grid units can be used.
For example, suppose point �� is dilated with point �� as the center of dilation and a scale factor of 3 2 . Since point �� is 4 grid squares to the left and 2 grid squares down from point ��, the dilation will be 6 grid squares to the left and 3 grid squares down from point �� because 4 ∙ 3 2 = 6 and 2 ∙ 3 2 = 3. The dilated image is marked as point ��′ on the grid.
Sometimes the square grid comes with coordinates. The coordinate grid provides a convenient way to name points, and sometimes the coordinates of the image can be found with just arithmetic.
For example, to make a dilation of the triangle with coordinates (−1, −2), (3, 1), and (2, −1) using center (0, 0) and a scale factor of 2, the coordinates can each be multiplied by 2 to get (−2, −4), (6, 2), and (4, −2). Note that multiplying the coordinates by the scale factor only works if the center of dilation is (0, 0).

Practice Problems
1. Triangle ������ is dilated using �� as the center of dilation with scale factor 2.
The image is triangle A′ B′ C′. Clare says the two triangles are congruent, because their angle measures are the same. Do you agree? Explain how you know.
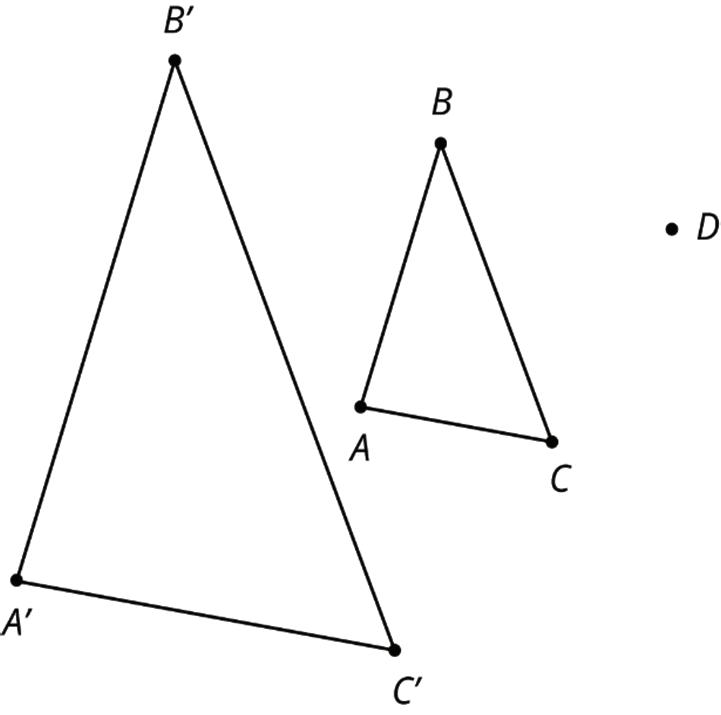
2. On graph paper, sketch the image of quadrilateral PQRS under the following dilations:
a. The dilation centered at �� with scale factor 2.
b.
c.
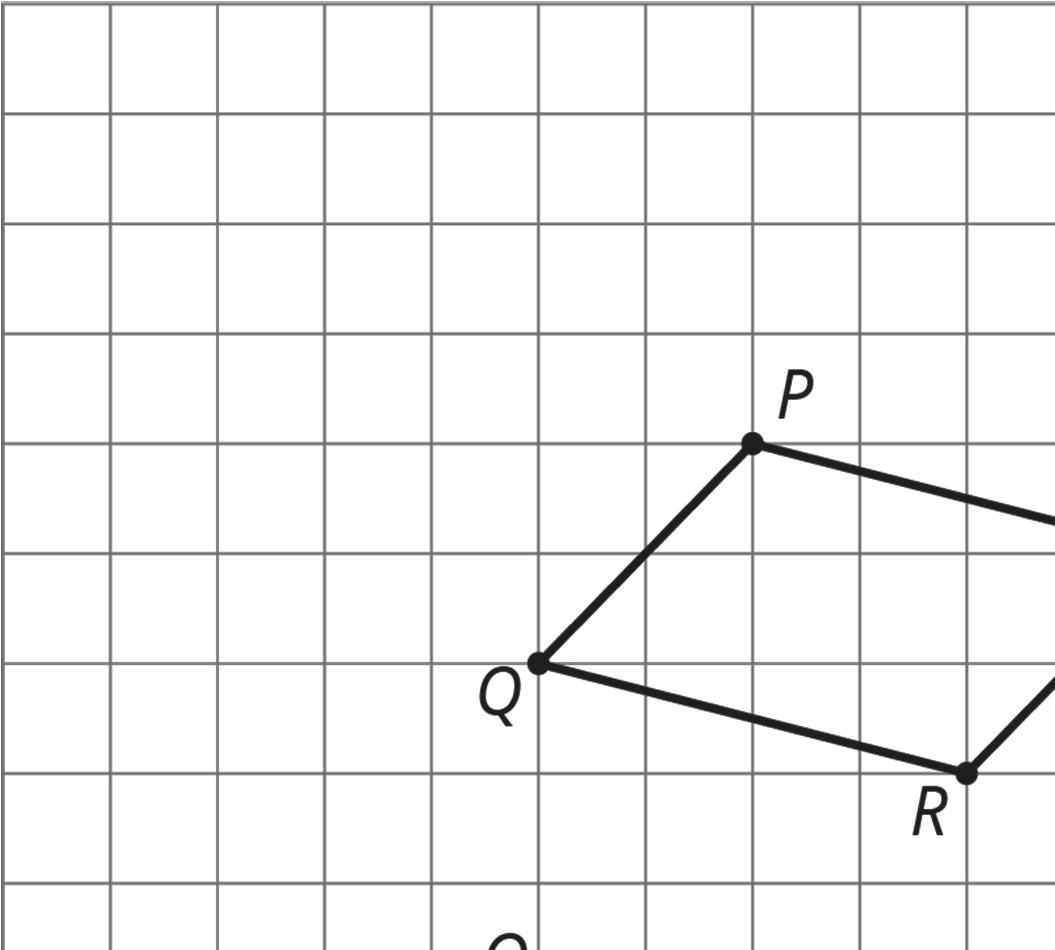
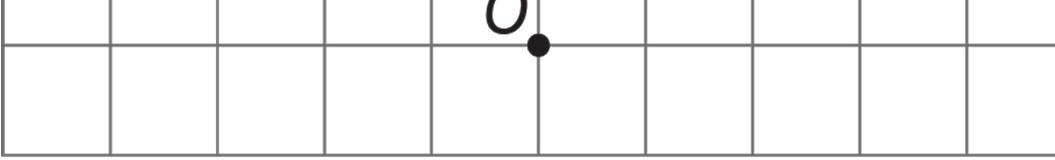
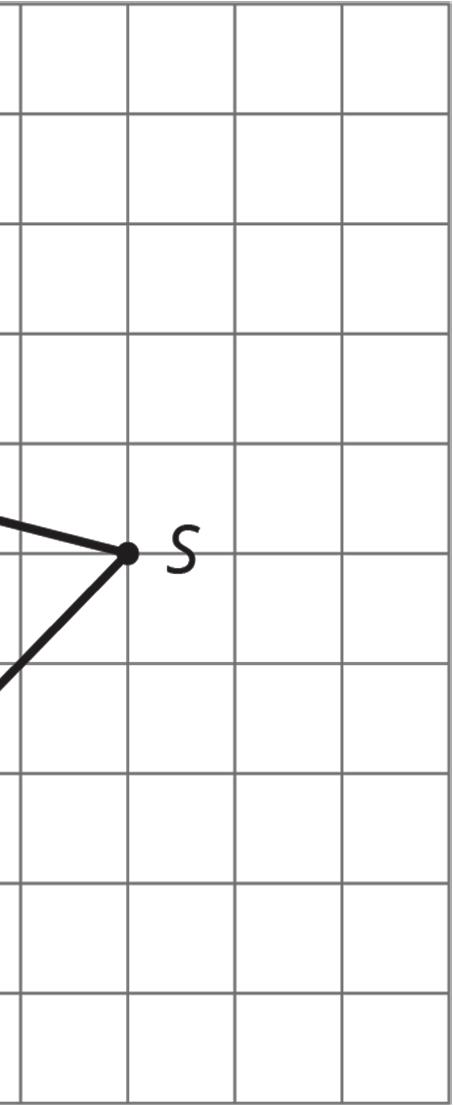
3. The diagram shows three lines with some marked angle measures.
Find the missing angle measures marked with question marks.
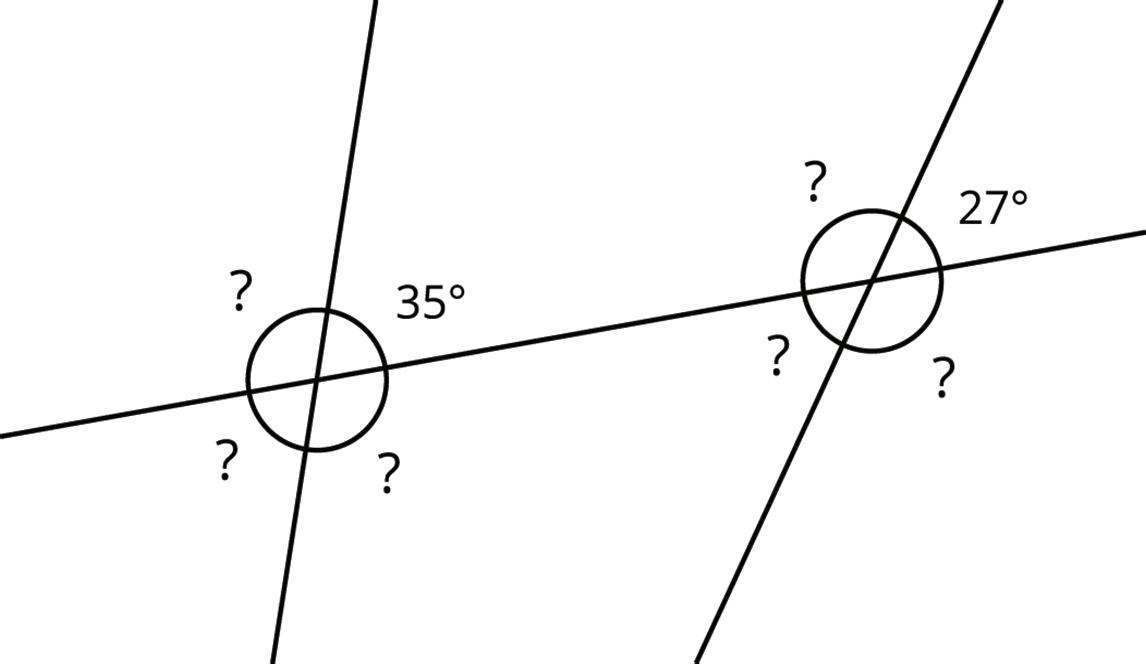
4. Describe a sequence of translations, rotations, and reflections that takes Polygon P to Polygon Q.
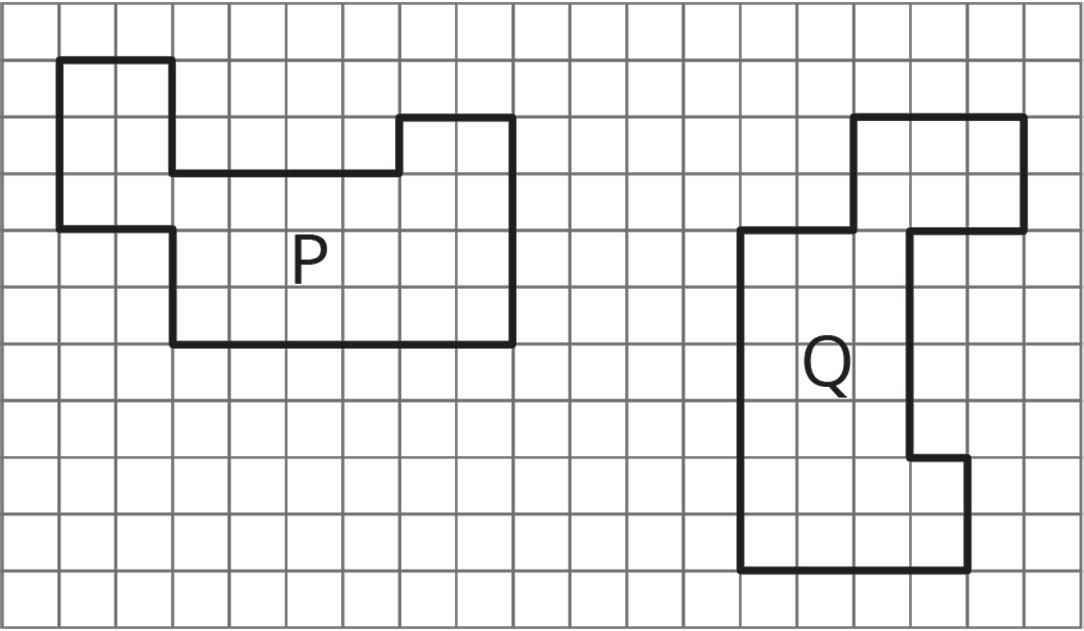
5. Point �� has coordinates (−2, −5). After a translation 4 units down, a reflection across the ��-axis, and a translation 6 units up, what are the coordinates of the image?
Unit 2, Lesson 4: More Dilations
Warm-Up: Many Dilations of a Triangle
All of the triangles shown are dilations of triangle D. The dilations use the same center, ��, but different scale factors.

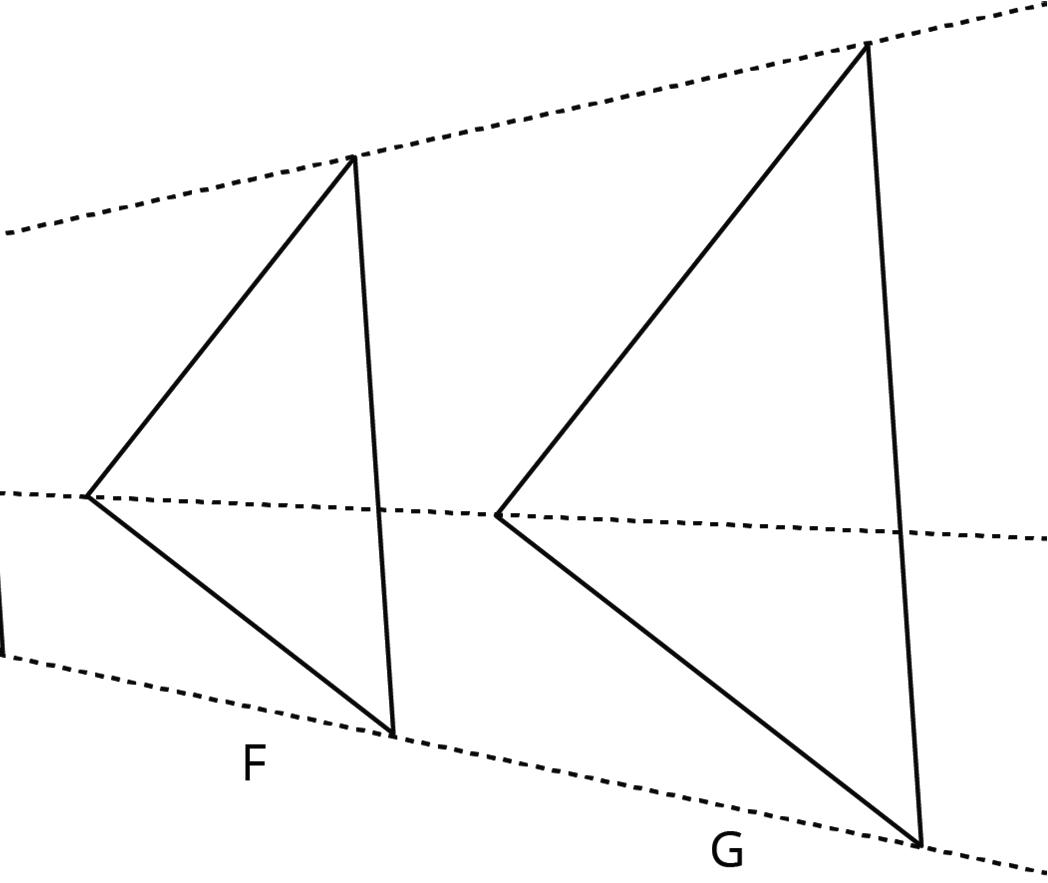
1. What do triangles A, B, and C have in common?
2. What do triangles E, F, and G have in common?
3. Explain how your answers to questions 1 and 2 relate to the scale factors used.
Info Gap: Dilations
Your teacher will give you either a problem card or a data card. Do not show or read your card to your partner.
If your teacher gives you the problem card:
1. Silently read your card and think about what information you need to be able to answer the question.
2. Ask your partner for the specific information that you need.
3. Explain how you are using the information to solve the problem.
4. Continue to ask questions until you have enough information to solve the problem.
5. Share the problem card and solve the problem independently.
6. Read the data card and discuss your reasoning.
If your teacher gives you the data card:
1. Silently read your card.
2. Ask your partner “What specific information do you need?” and wait for them to ask for information.
3. If your partner asks for information that is not on the card, do not do the calculations for them. Tell them you don’t have that information.
4. Before sharing the information, ask “Why do you need that information?” Listen to your partner’s reasoning and ask clarifying questions.
5. Read the problem card and solve the problem independently.
6. Share the data card and discuss your reasoning.
Pause here so your teacher can review your work. Ask your teacher for a new set of cards and repeat the activity, trading roles with your partner.
Collaborative Activity: Dilations on the Coordinate Plane
1. On the coordinate plane, quadrilateral �������� was dilated with a scale factor of 1 3 centered at the origin.
a. Complete the table.
b. Complete the statement. The side lengths of quadrilateral
length of the sides of quadrilateral ��������
c. Complete the table with the coordinates of the vertices of the preimage and the image.
Vertices of the Preimage Coordinates
Point ��
Point ��
Point ��
Point ��
Vertices of the Image Coordinates
Point ��′
Point ��′
Point ��′
Point ��′
d. What do you notice about the relationship between the coordinates of the corresponding points on the preimage and the image?
2. On the coordinate plane, ∆��′��′��′ is the result of a dilation of ∆������ centered at the origin. The scale factor is 1.5.
a. Complete the table with the coordinates of the vertices of the preimage and the image.
Vertices of the Preimage Coordinates
Vertices of the Image Coordinates
b. Discuss with your partner how the relationship between the coordinates is related to the scale factor. Summarize your discussion.
3. Suppose point �� is the vertex of a polygon and has coordinates (2, 10).
a. If this polygon were dilated by a scale factor of 2.7 centered at the origin, discuss with your partner how you could determine the coordinates of the image of point ��.
b. Determine the coordinates of point ��′. Show your work.
Lesson Summary
One important use of coordinates is to communicate geometric information precisely. Consider quadrilateral �������� on the coordinate plane. Performing a dilation of �������� requires three vital pieces of information:
• The coordinates of ��, ��, ��, and ��
• The coordinates of the center of dilation, ��
• The scale factor of the dilation
With this information, the vertices ��, ��, ��, and �� can be dilated, and then the corresponding segments can be drawn to find the dilation of ��������. Without coordinates, describing the location of the new points would likely require sharing a picture of the polygon and the center of dilation.
When a dilation is performed on a figure on the coordinate plane with its center at the origin, the coordinates of the image are equal to the coordinates of the preimage multiplied by the scale factor.
Practice Problems
1. Quadilateral �������� is dilated with center (0, 0), taking B to B′. Draw A′B′C′D′.
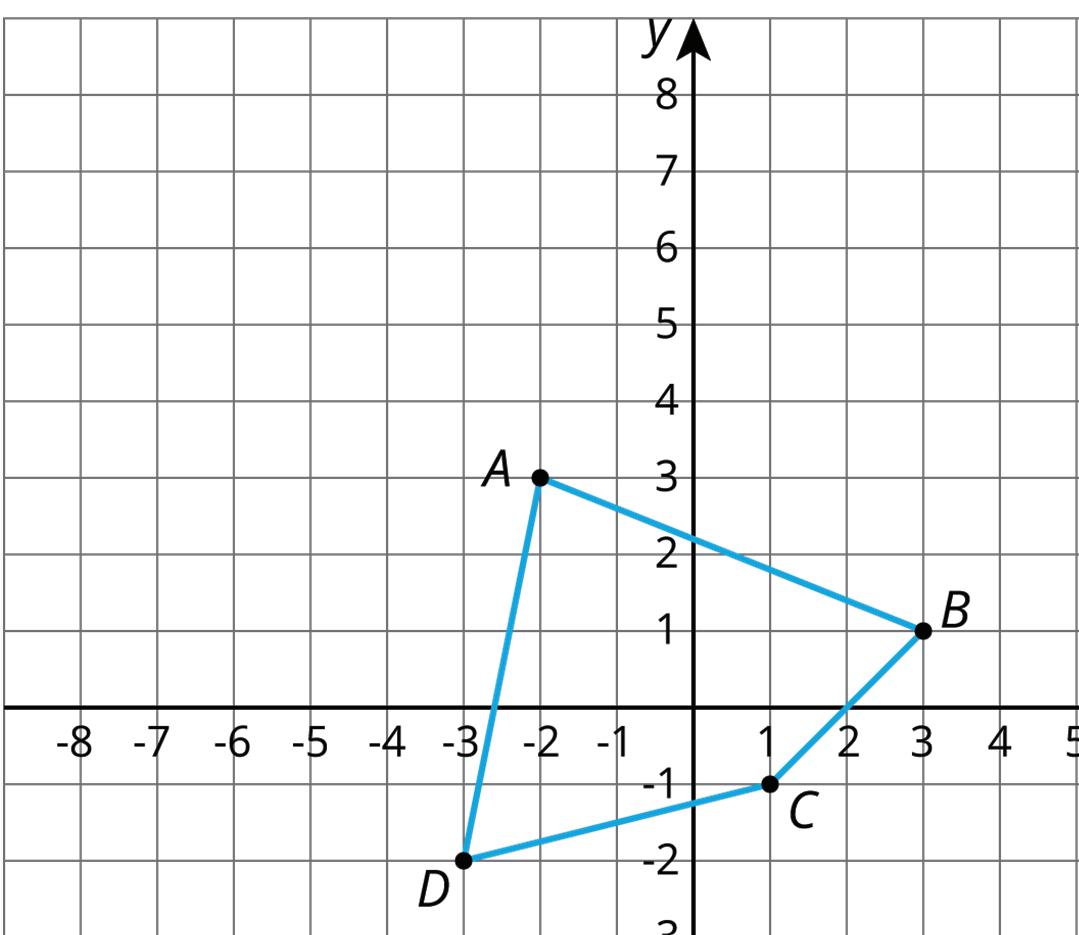
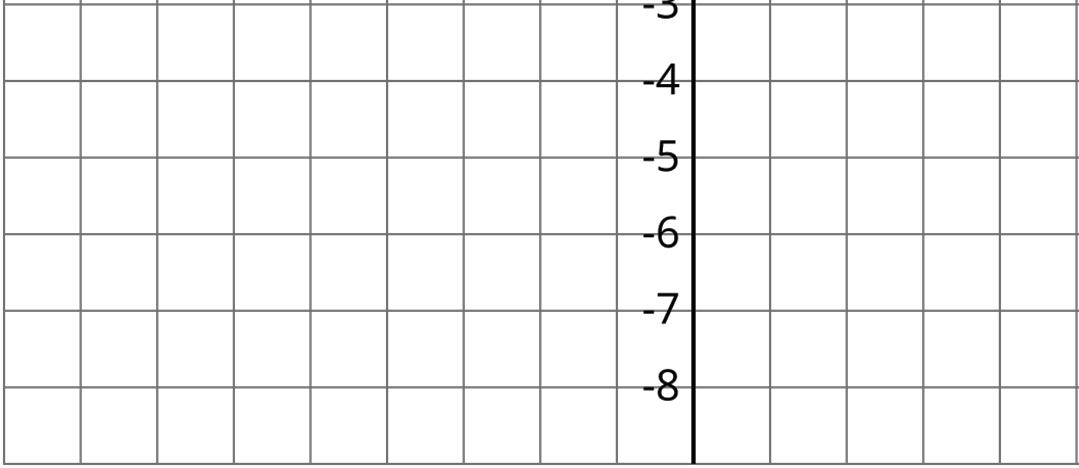
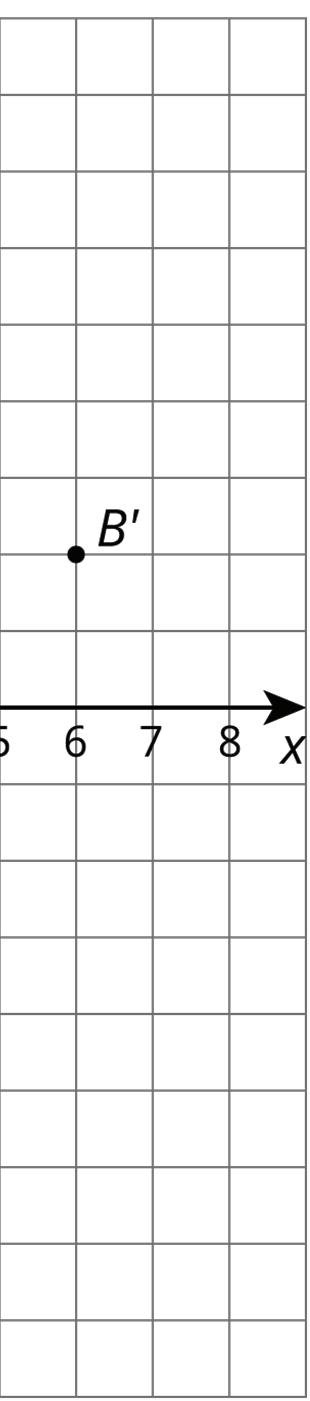
2. Triangles �� and �� have been built by dilating Triangle ��.
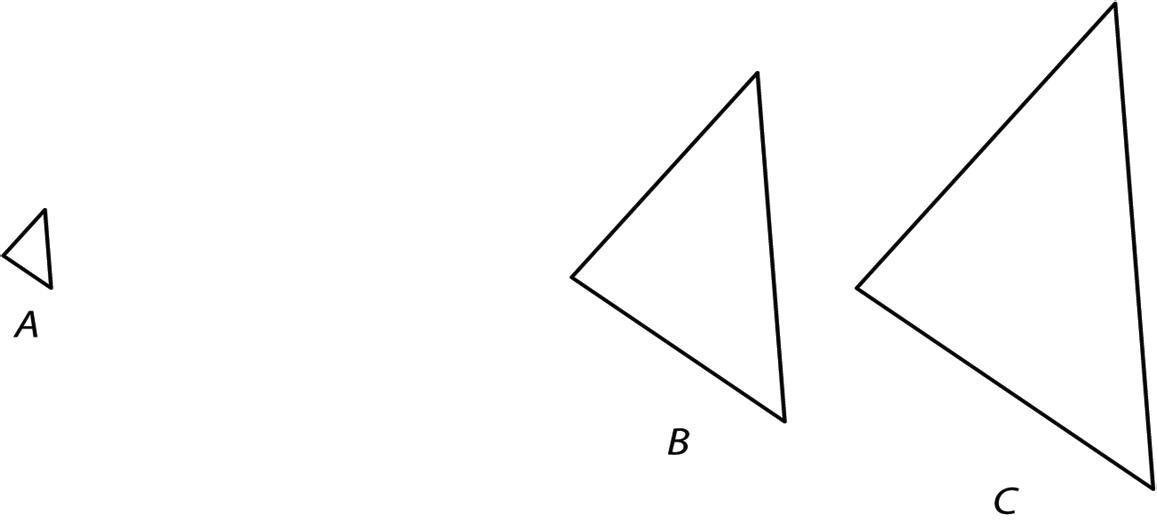
a. Fnd the center of dilation.
b. Triangle �� is a dilation of �� with approximately what scale factor?
c. Triangle �� is a dilation of �� with approximately what scale factor?
d. Triangle �� is a dilation of �� with approximately what scale factor?
3. Here is a triangle.
a. Draw the dilation of triangle ������, with center (0, 0), and scale factor 2.
Label this triangle ��′��′��′.
b. Draw the dilation of triangle ������, with center (0, 0), and scale factor 1 2 .
Label this triangle ��″��″��″.
c. Is ��″��″��″ a dilation of triangle ��′��′��′? If yes, what are the center of dilation and the scale factor?
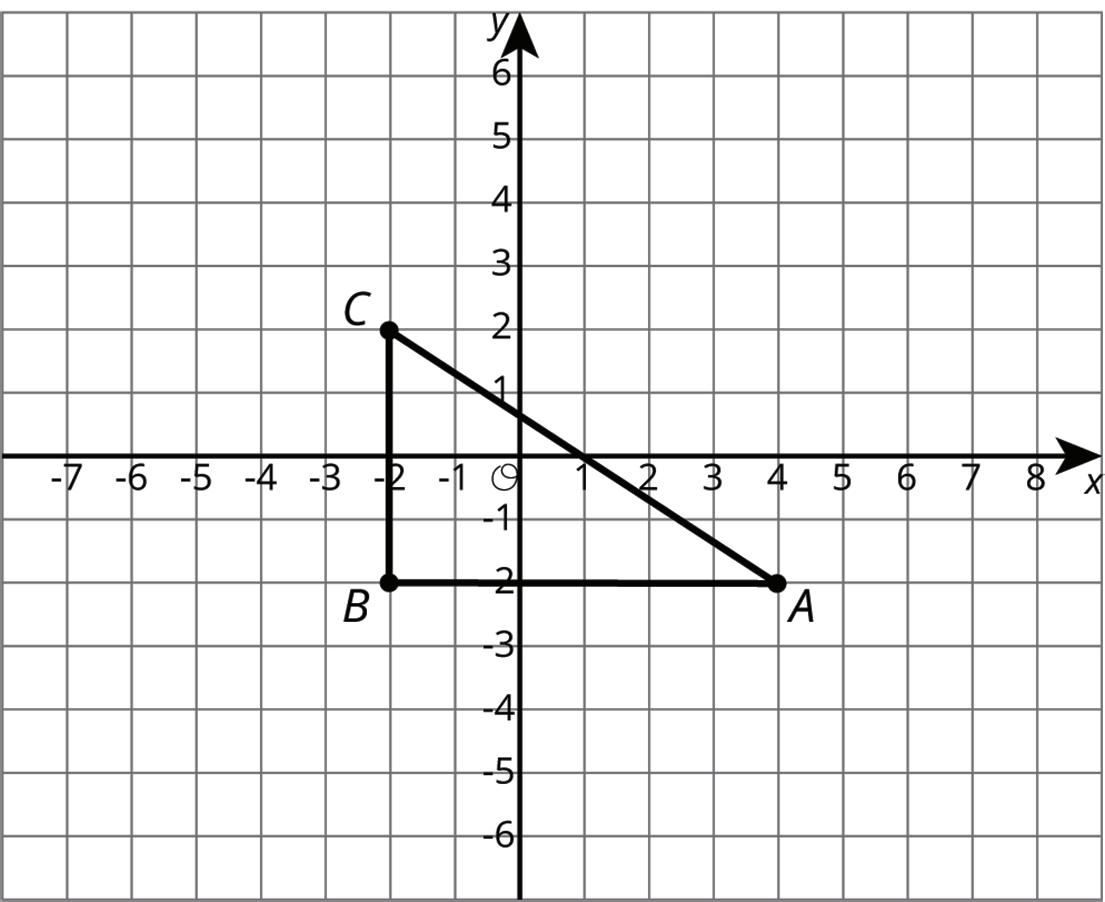
4. Triangle ������ is a right triangle, and the measure of angle �� is 28°. What are the measures of the other two angles?
Unit 2, Lesson 5: Sequences of Transformations with Dilations
Warm-Up: Sequence of Transformations
Five congruent figures are shown on the coordinate plane.
Complete the table by identifying which figure is the image after the sequence of transformations described or by identifying the transformation(s) that can be used to map the preimage to the image.
Preimage
Figure P
Transformation(s) Image
1. Reflect over the ��-axis.
2. Translate (��, ��) → (�� + 2, �� − 3).
Figure R 1. 2. Figure P
Figure O
1. Rotate 180° clockwise around the origin.
2. Reflect over the ��-axis.
Guided Activity: Sequences of Transformations with Dilations
1. A sequence of transformations of ∆������ is shown on the coordinate grid. Triangle ������ is dilated and then translated, where ∆��′��′��′ is the dilation and ∆��″��″��″ is the translation of ∆��′��′��′
(1, 1)
(2, 2)
(4, 1)
a. Complete the description.
2)
(4, 4)
(8, 2)
(4, 0)
(6, 2)
(10, 0)
Triangle ������ was dilated using a scale factor of centered at the origin. The resulting triangle, ∆��′��′��′, was translated
b. Determine the coordinates of each triangle if ∆������ is first translated and then dilated.
1)
(2, 2)
(4, 1)
Some sequences of transformations are commutative, which means the transformations can be applied in any order.
c. Use the tables to determine whether the sequence of transformations applied to ∆������ is commutative. Work with your partner to write an explanation.
2. Quadrilaterals ��������, ��′��′��′��′, and ��″��″��″��″ are shown on the coordinate grid.
4)
0)
0)
2)
4)
0)
0)
2)
16)
0)
0)
8)
a. Discuss with your partner the first transformation that occurred. Explain how you determined the first transformation.
b. Determine the scale factor in the second transformation.
c. Complete the description of the transformations.
�������� was to create ��′��′��′��′. ��′��′��′��′ was dilated using a scale factor of centered at to create ��″��″��″��″.
d. Work with your partner to determine whether the sequence of transformations applied to �������� is commutative. Complete the table by first applying the dilation and then the other transformation. Then, write a conclusion based on the completed tables.
�� (−5, 4) �� (−5, 0) �� (−7, 0) �� (−8, 2)
Collaborative Activity: Mapping a Dilation
1. A sequence of transformations of ∆������ is shown on the coordinate grid.
a. Complete the table of coordinates for each triangle.
Preimage Transformation 1 Transformation 2
8)
(6, 1)
3)
6)
b. Describe each transformation applied to ∆������.
10.5)
21)
Lesson Summary
A sequence of transformations maps 1 figure onto another using rotations, reflections, translations, and dilations. When a sequence of transformations is applied, the order of the transformations can be important.
A commutative sequence of transformations is one where the image will be in the same location and orientation regardless of the order in which the sequence of transformations are applied. Note that not all sequences are commutative.
Practice Problems
1. ��������, ��′��′��′��′, ��″��″��″��″, and ��‴��‴��‴��‴ are shown on the coordinate grid.
a. Complete the table by describing the sequence of transformations of �������� that results in ��‴��‴��‴��‴.
b. Explain whether the sequence of transformations applied to �������� is commutative.
2. Triangle ������ is shown on the coordinate plane.
Triangle ������ is translated 1 unit down, reflected over the ��-axis, and then dilated by a scale factor of 1 2 centered at the origin.
a. Complete the table of coordinates after each transformation.
Preimage Translation Reflection Dilation
b. Graph ∆��‴��‴��‴ on the coordinate plane.
3. Quadrilateral �������� is shown on the coordinate plane.
x
�������� is dilated by a scale factor of 2 centered at the origin. Draw the image and label it ��′��′��′��′.
4. Rectangle �������� has length 3 centimeters (cm) and width 27 cm. Rectangle �������� has length 1 cm and width 9 cm.
Determine if rectangle �������� is a scaled copy of rectangle ��������. If so, what is the scale factor?
Unit 2, Lesson 6: Similarity
Warm-Up: Equivalent Expressions
Use what you know about operations and their properties to write three expressions equivalent to the expression shown.
10(2 + 3) − 8 ⋅ 3
Collaborative Activity: Similarity Transformations (Part 1)
1. Triangle ������ and triangle ������ are similar. Find a sequence of translations, rotations, reflections, and dilations that shows this.
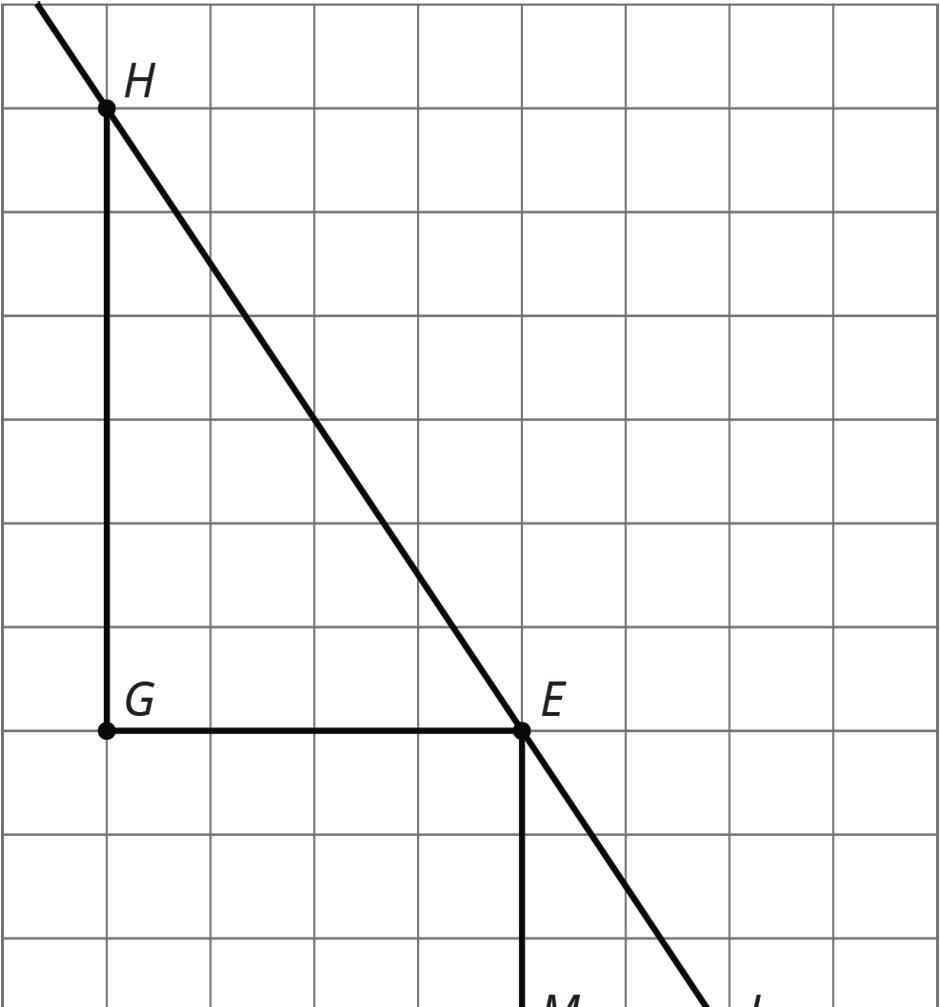

2. Hexagon ������������ and hexagon ������������ are similar. Find a sequence of translations, rotations, reflections, and dilations that shows this.
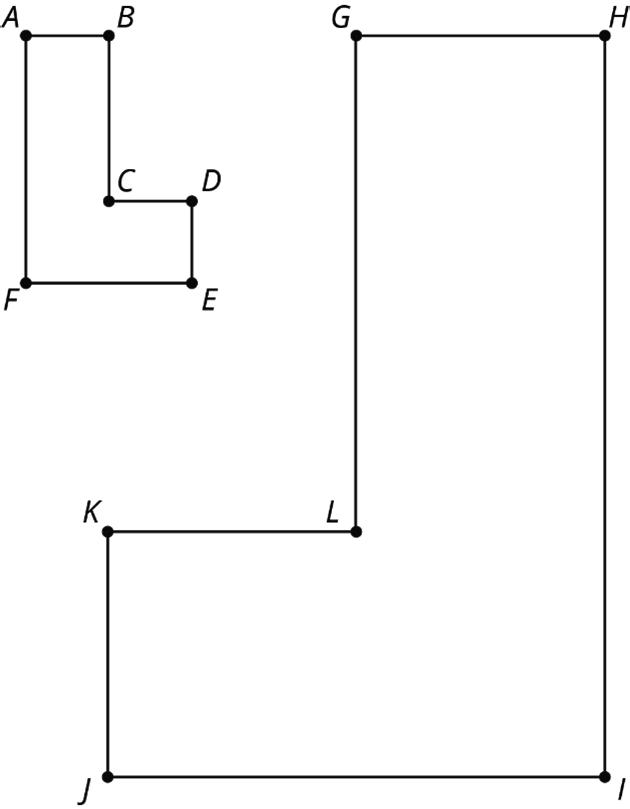
Exploration Activity: Similarity Transformations (Part 2)
Sketch figures similar to Figure A that use only the transformations listed to show similarity.
1. A translation and a reflection. Label your sketch Figure B. Pause here so that your teacher can check your work.
2. A reflection and a dilation with scale factor greater than 1. Label your sketch Figure C.
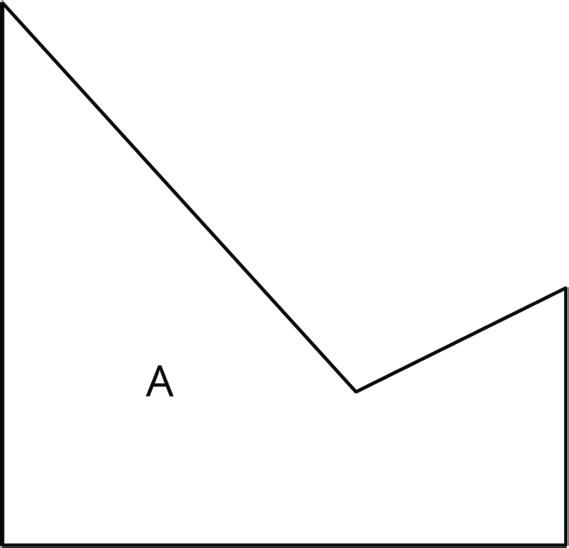
3. A rotation and a reflection. Label your sketch Figure D.
4. A dilation with scale factor less than 1 and a translation. Label your sketch Figure E.
Collaborative Activity: Methods for Translations and Dilations
Your teacher will give you a set of five cards and your partner a different set of five cards. Using only the cards you were given, find at least one way to show that triangle ������ and triangle ������ are similar. Compare your method with your partner’s method. What is the same about your methods? What is different?
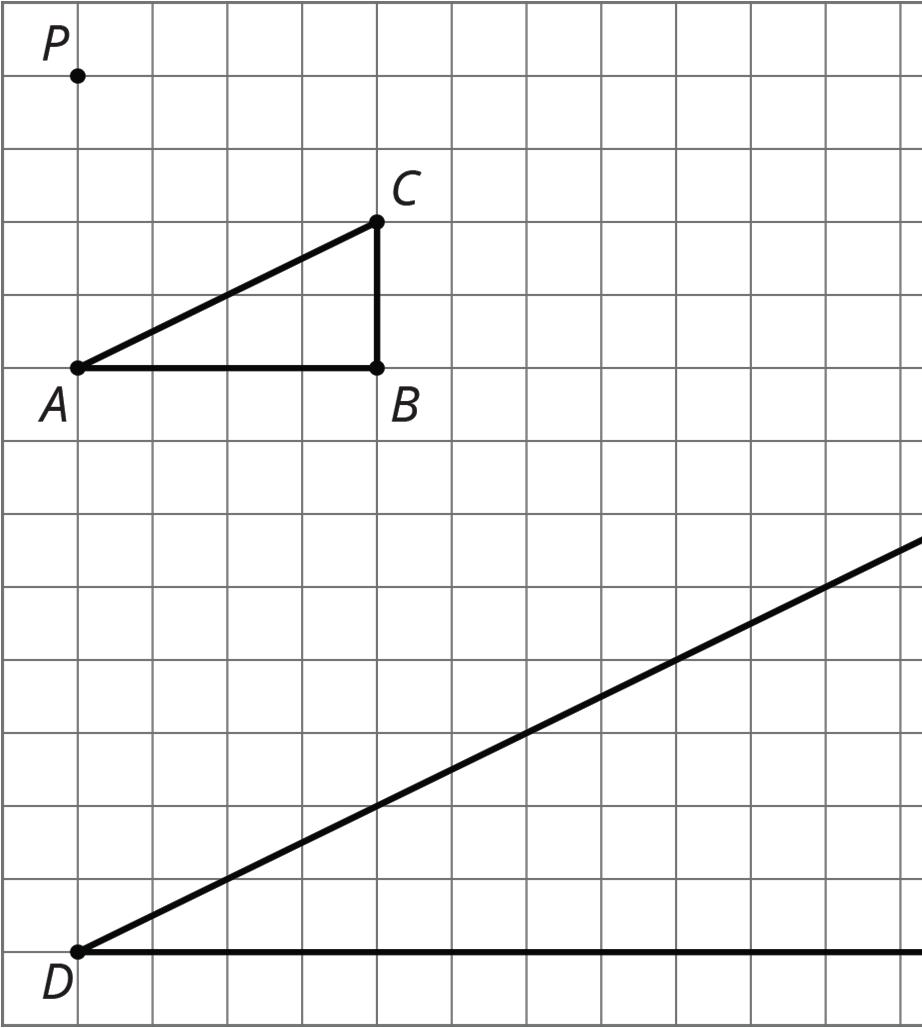
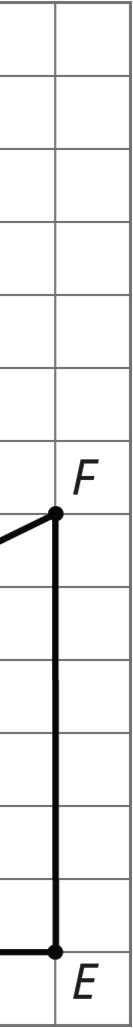
Lesson Summary
Triangle ������ is similar to ∆������.
Two figures are similar if 1 figure can be transformed into the other by a sequence of translations, rotations, reflections, and/ or dilations. While there are many correct sequences of transformations to map 1 figure onto another, only 1 sequence needs to be described to show that 2 figures are similar.
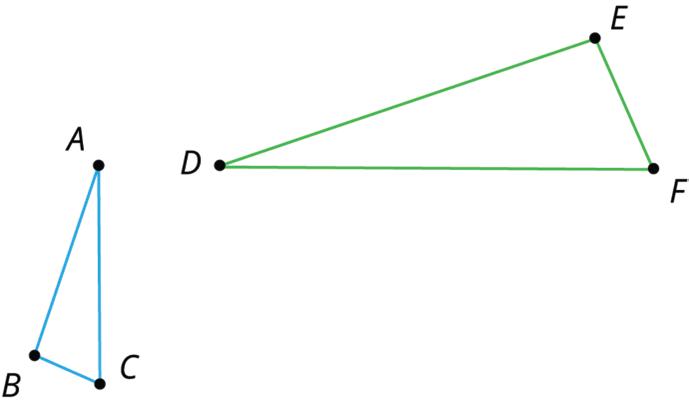
One figure is similar to another if there is a sequence of rigid motions and dilations that takes the first figure onto the second.
One sequence that maps ∆������ onto ∆������ is shown and described.
• Step 1: Reflect across line ��.
• Step 2: Rotate 90° counterclockwise around ��.
• Step 3: Dilate with center �� and scale factor 2.
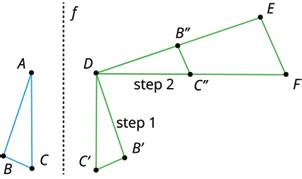
Another sequence that maps ∆������ onto ∆������ is to dilate ∆������ by a scale factor of 2 with center of dilation ��, and then translate �� to ��, and then reflect over a vertical line through ��, and finally rotate the figure so it matches up with ∆������.
Practice Problems
1. The diagram has a pair of figures, 1 larger than the other. Show that the 2 figures are similar by identifying a sequence of translations, rotations, reflections, and/or dilations that takes the smaller figure onto the larger one.

2. Two similar polygons are shown.
Measure the side lengths and angles of each polygon. What do you notice?
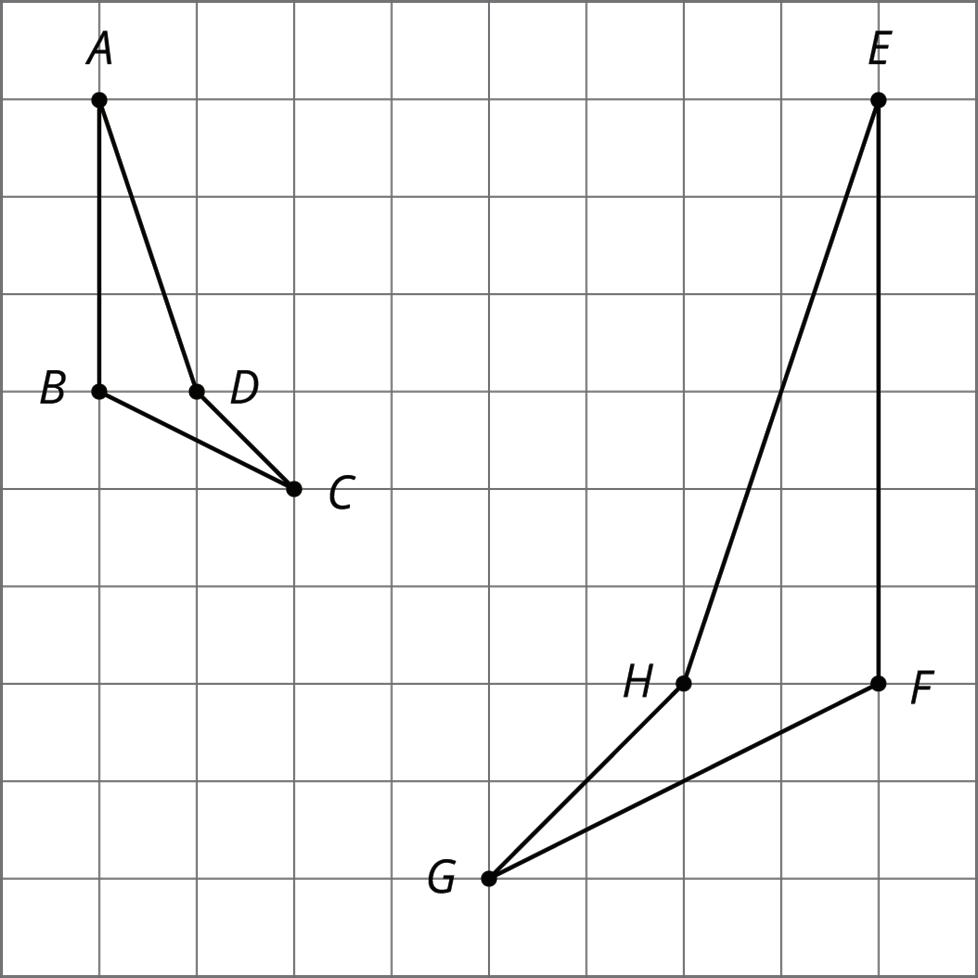
3. Quadrilateral �������� is shown on the coordinate plane.
a. Determine the translation(s) necessary to map �� onto ��′.
b. Apply the translation(s) from part A to �������� to create ��′��′��′��′.
4. Triangle ������ is shown on the coordinate plane.
Draw the image of ∆������ after a rotation of 90° clockwise about the origin. Label the image ��′��′��′.
Unit 2, Lesson 7: Similar Polygons
Warm-Up: All, Some, None: Congruence and Similarity
Choose whether each of the statements is true in all cases, in some cases, or in no cases.
1. If two figures are congruent, then they are similar.
2. If two figures are similar, then they are congruent.
3. If an angle is dilated with the center of dilation at its vertex, the angle measure may change.
Exploration Activity: Are They Similar?
1. Let’s look at a square and a rhombus.
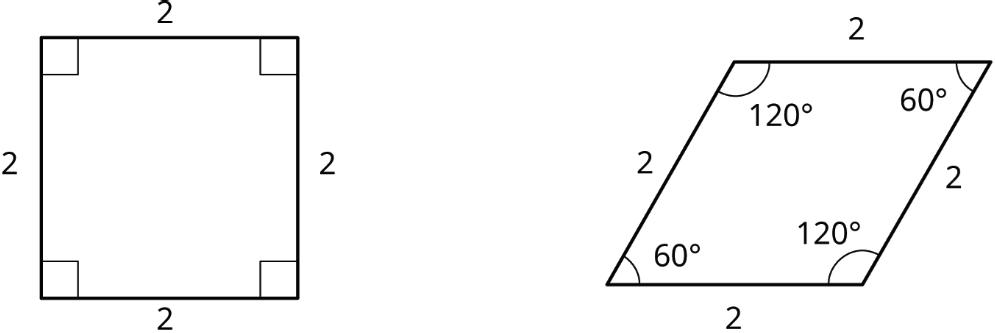
Priya says, “These polygons are similar because their side lengths are all the same.” Clare says, “These polygons are not similar because the angles are different.” Do you agree with either Priya or Clare? Explain your reasoning.
2. Now, let’s look at rectangles �������� and ��������.
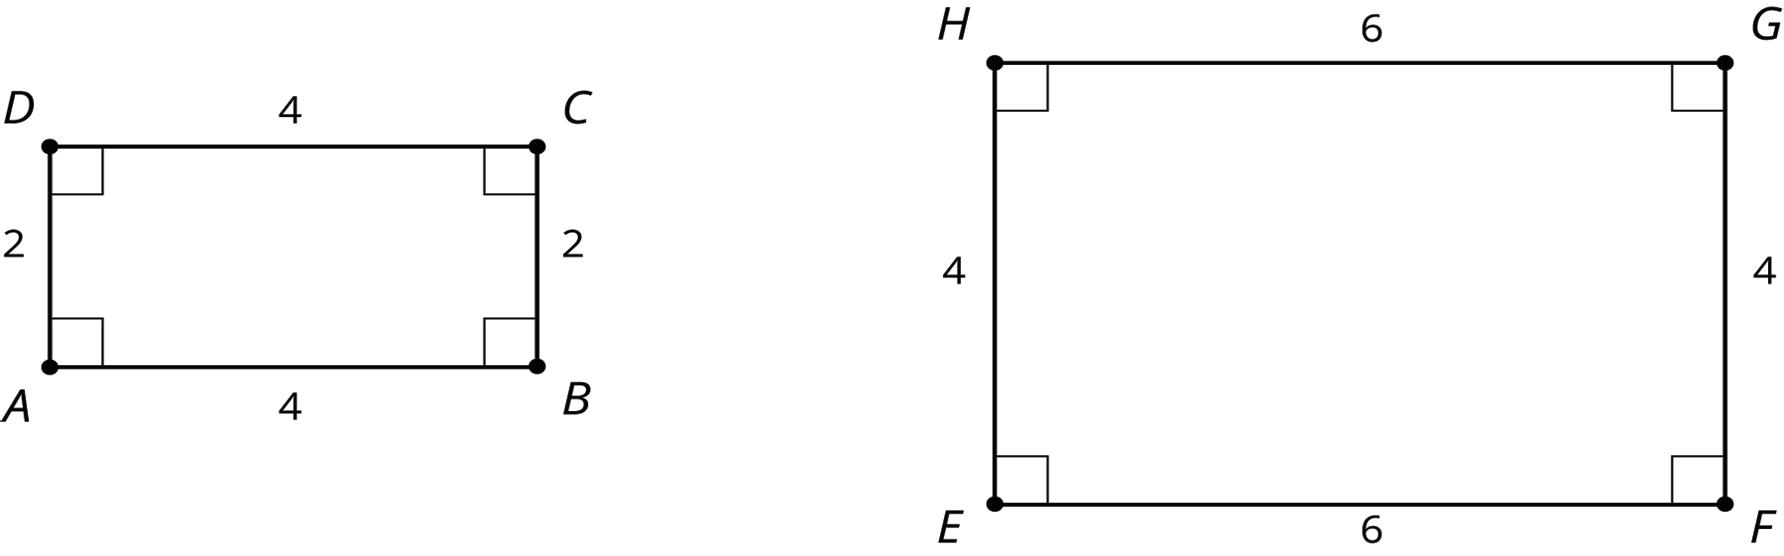
Jada says, “These rectangles are similar because all of the side lengths differ by 2.” Lin says, “These rectangles are similar. I can dilate ���� and ���� using a scale factor of 2 and ���� and ���� using a scale factor of 1.5 to make the rectangles congruent. Then I can use a translation to line up the rectangles.” Do you agree with either Jada or Lin? Explain your reasoning.
Collaborative Activity: Find Someone Similar
Your teacher will give you a card. Find someone else in the room who has a card with a polygon that is similar but not congruent to yours. When you have found your partner, work with them to explain how you know that the two polygons are similar.
Lesson Summary
When 2 polygons are similar, they share the characteristics listed.
• Every angle and side in 1 polygon has a corresponding part in the other polygon.
• Each pair of corresponding angles has the same measure.
• Corresponding sides are related by a single scale factor. Each side length in 1 figure is multiplied by the scale factor to get the corresponding side length in the other figure.
Consider whether the 2 rectangles shown are similar.
It looks like rectangles �������� and �������� could be similar. All the corresponding angles are congruent because they are all right angles. However, calculating the scale factor between the corresponding sides shows that “looking like” they’re similar isn’t enough to make them similar. To scale the long side ���� to the long side ����, the scale factor must be 3 4 , because 4 · 3 4 = 3. But the scale factor to match side ���� to side ���� has to be 2 3 , because 3 · 2 3 = 2. Therefore, the rectangles are not similar because the scale factors for all the corresponding parts are not the same.
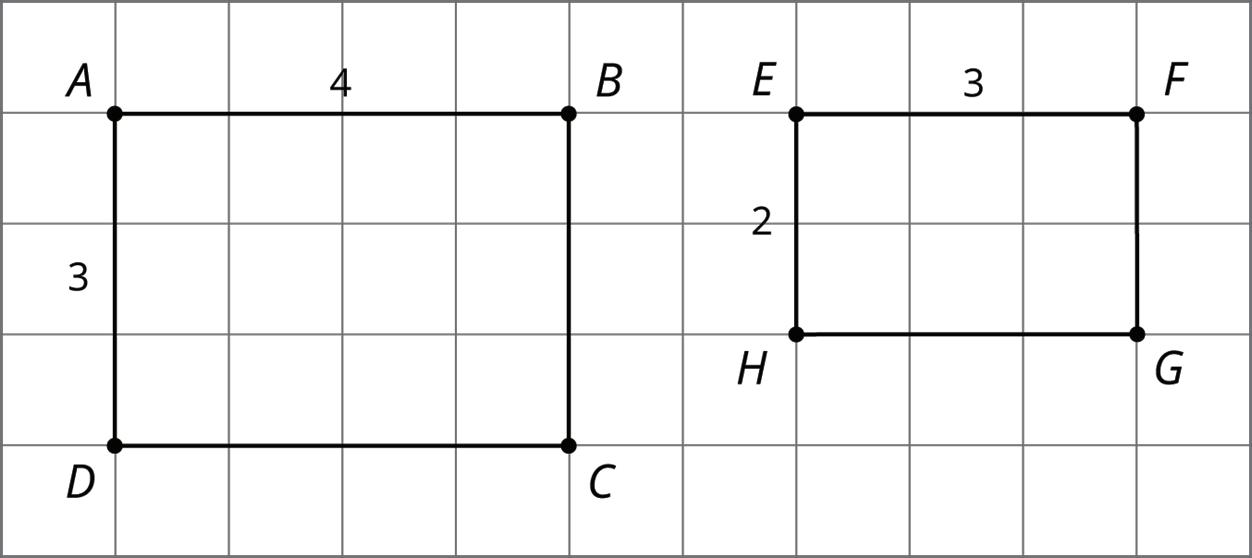
Another nonexample is shown. In the quadrilaterals shown, the sides can correspond with a scale factor of 1, but the quadrilaterals are not similar because the corresponding angles don’t have the same measure.
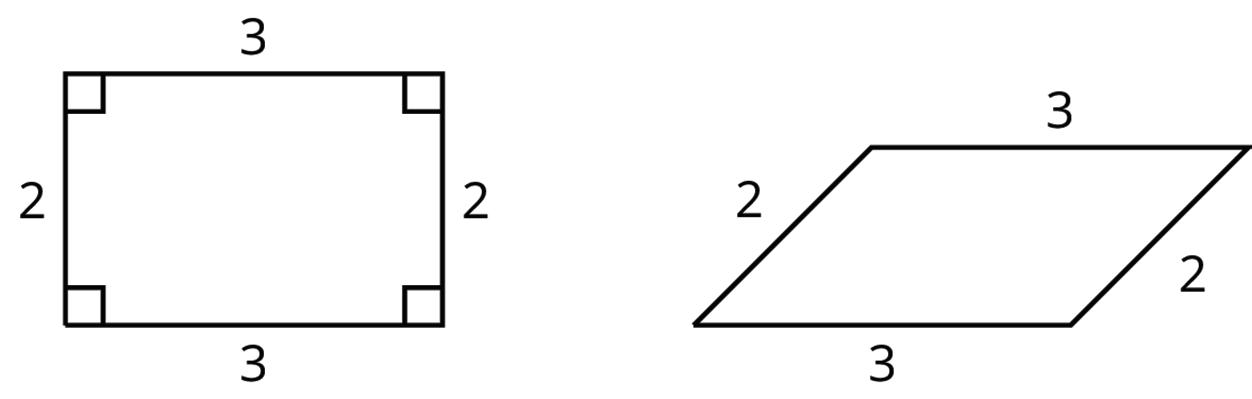
For figures to be similar, they must have corresponding angles that are congruent and corresponding side lengths that are proportional.
Practice Problems
1. Triangle ������ is a dilation of triangle ������ with scale factor 2. In triangle ������, the largest angle measures 82°. What is the largest angle measure in triangle ������?
A. 41°
B. 82°
C. 123°
D. 164°
2. Draw two polygons that are similar but could be mistaken for not being similar. Explain why they are similar.
3. Draw two polygons that are not similar but could be mistaken for being similar. Explain why they are not similar.
4. These two triangles are similar. Find side lengths �� and ��. Note: the two figures are not drawn to scale.
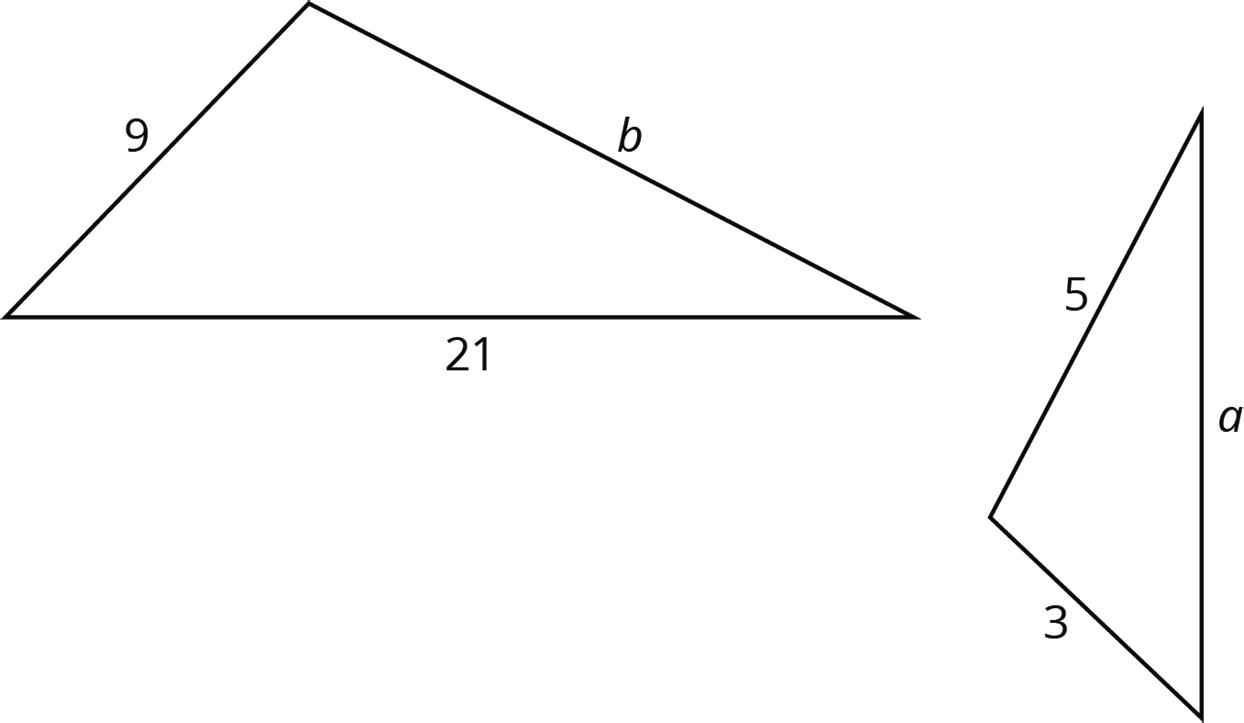
Review Problems
5. Jada claims that ��′��′��′ is a dilation of ������ using �� as the center of dilation.
What are some ways you can convince Jada that her claim is not true?
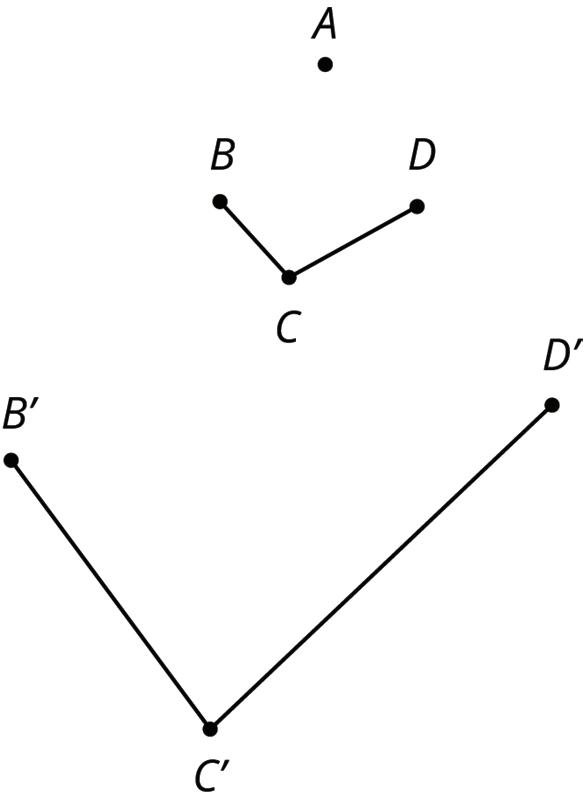
a. Draw a horizontal line segment ����.
b. Rotate segment ���� 90° counterclockwise around point ��. Label any new points.
c. Rotate segment ���� 90° clockwise around point ��. Label any new points.
d. Describe a transformation on segment ���� you could use to finish building a square.
Unit 2, Lesson 8: Similar Triangles
Warm-Up: Equivalent Expressions
Create three different expressions that are each equal to 20. Each expression should include only these three numbers: 4, −2, and 10.
Exploration Activity: Making Pasta Angles and Triangles
Your teacher will give you some dried pasta and a set of angles.
1. Create a triangle using three pieces of pasta and angle ��. Your triangle must include the angle you were given, but you are otherwise free to make any triangle you like. Tape your pasta triangle to a sheet of paper so it won’t move.
a. After you have created your triangle, measure each side length with a ruler and record the length on the paper next to the side. Then measure the angles to the nearest 5° using a protractor and record these measurements on your paper.
b. Find two others in the room who have the same angle �� and compare your triangles. What is the same? What is different? Are the triangles congruent? Similar?
c. How did you decide if they were or were not congruent or similar?
2. Now use more pasta and angles ��, ��, and �� to create another triangle. Tape this pasta triangle on a separate sheet of paper.
a. After you have created your triangle, measure each side length with a ruler and record the length on the paper next to the side. Then measure the angles to the nearest 5° using a protractor and record these measurements on your paper.
b. Find two others in the room who used your same angles and compare your triangles. What is the same? What is different? Are the triangles congruent? Similar?
c. How did you decide if they were or were not congruent or similar?
3. Here is ∆������. Break a new piece of pasta, different in length than segment ����.
• Tape the piece of pasta so that it lays on top of line ���� with one end of the pasta at �� (if it does not fit on the page, break it further). Label the other end of the piece of pasta ��.
• Tape a full piece of pasta, with one end at ��, making an angle congruent to ∠������.

• Tape a full piece of pasta on top of line ���� with one end of the pasta at ��. Call the point where the two full pieces of pasta meet ��.
a. Is your new pasta ∆������ similar to ∆������? Explain your reasoning.
b. If your broken piece of pasta were a different length, would the pasta triangle still be similar to ∆������? Explain your reasoning.
Guided Activity: Similar Figures in a Regular Pentagon
1. This diagram has several triangles that are similar to ∆������.
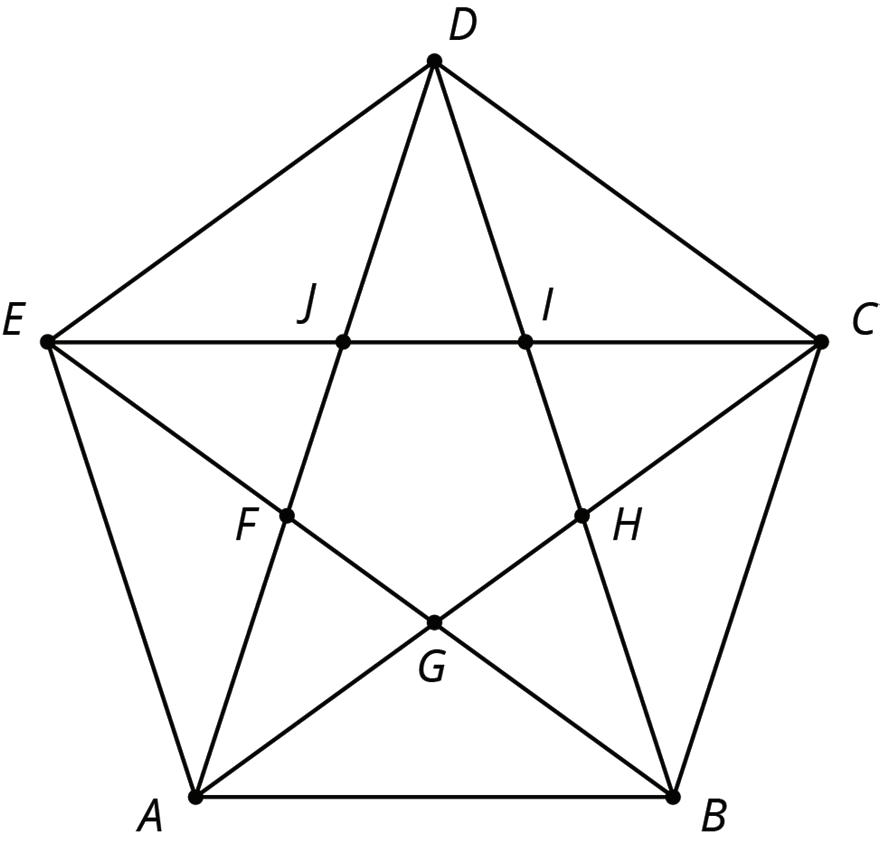
a. Multiple triangles in the figure are congruent to ∆������. Complete the statements to describe 1 such triangle.
Triangle ������ ≅ ∆ , which means they are also similar triangles using a scale factor of .
b. Two other scale factors were used to make triangles similar to ∆������. In the diagram, find at least 1 triangle of each size that is similar to ∆������. Then, complete the statements.
Triangle ������ is similar to ∆ using a scale factor of approximately .
Triangle ������ is similar to ∆ using a scale factor of approximately .
c. Explain how you know that each of these 3 triangles is similar to ∆������.
2. Complete each congruence statement with 2 angles that are congruent to the given angle.
c.
3. Find a triangle in the diagram that is not similar to ∆������. Explain how you know.
Lesson Summary
We learned earlier that 2 polygons are similar when there is a sequence of translations, rotations, reflections, and/or dilations that take 1 polygon onto the other. Corresponding angles can be used to determine whether triangles are similar. When the polygons are triangles, only 2 of the corresponding angles need to be checked to show that the triangles are similar.
For example, ∆������ and ∆������ each have a 30° angle and a 45° angle, as shown.
Triangle ������ can be translated so that point �� moves to point ��, and then the triangle can be rotated so that the two 30° angles are aligned, resulting in the second image shown.
From here, a dilation with center point �� and the appropriate scale factor will move point ��′ to point ��. This dilation also moves point ��′ to point ��, showing that ∆������ and ∆������ are similar.
Because corresponding angles in similar triangles are congruent, congruence statements can be used to relate the corresponding angles. Examples for similar triangles ������ and ������ are shown.
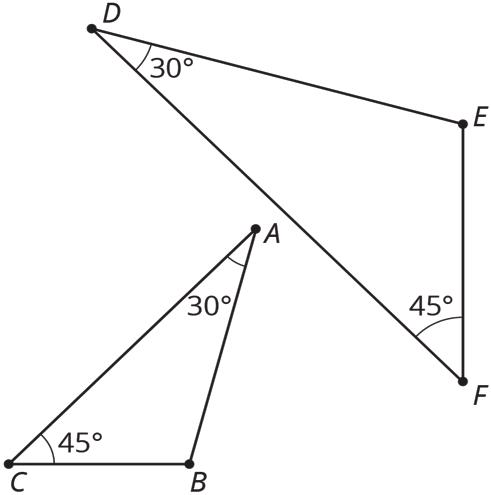
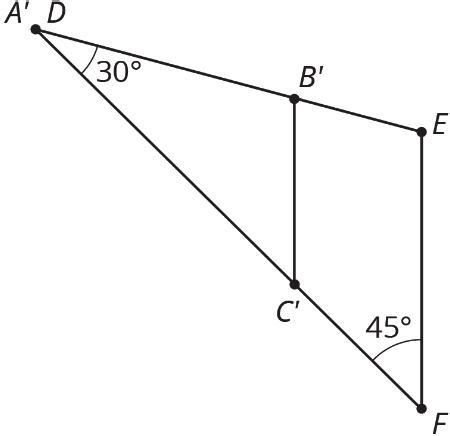
Practice Problems
1. In each pair, some of the angles of two triangles in degrees are given. Use the information to decide if the triangles are similar or not. Explain how you know.
a. Triangle A: 53°, 71°, ; Triangle B: 53°, 71°,
b. Triangle C: 90°, 37°, ; Triangle D: 90°, 53°,
c. Triangle E: 63°, 45°, ; Triangle F: 14°, 71°,
d. Triangle G: 121°, , ; Triangle H: 70°, , 2.
a. Draw two equilateral triangles that are not congruent.
b. Measure the side lengths and angles of your triangles. Are the two triangles similar?
c. Do you think two equilateral triangles will be similar always, sometimes, or never? Explain your reasoning.
3. In the figure, ���� is parallel to ����.
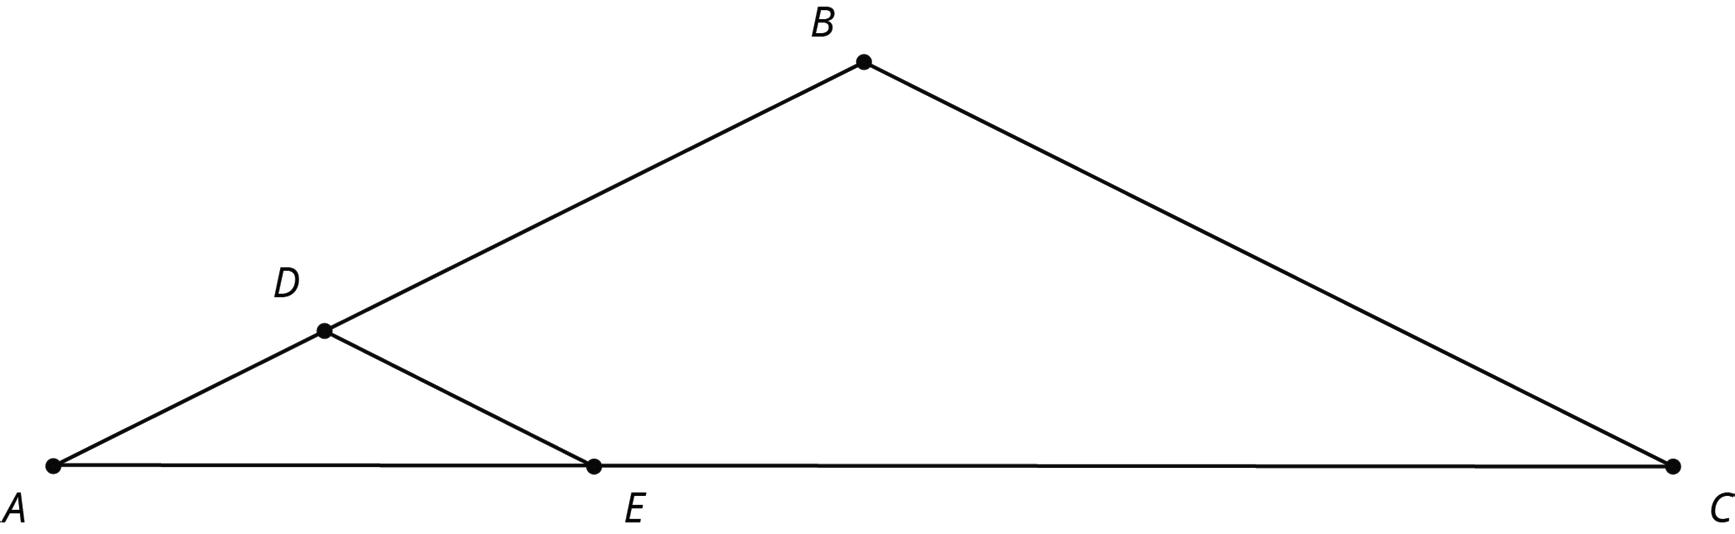
a. Explain why ∆������ is similar to ∆������.
b. Complete each congruence statement.
Review Problems
4. The quadrilateral �������� in the diagram is a parallelogram. Let ��′��′��′��′ be the image of �������� after applying a dilation centered at a point �� (not shown) with scale factor 3.
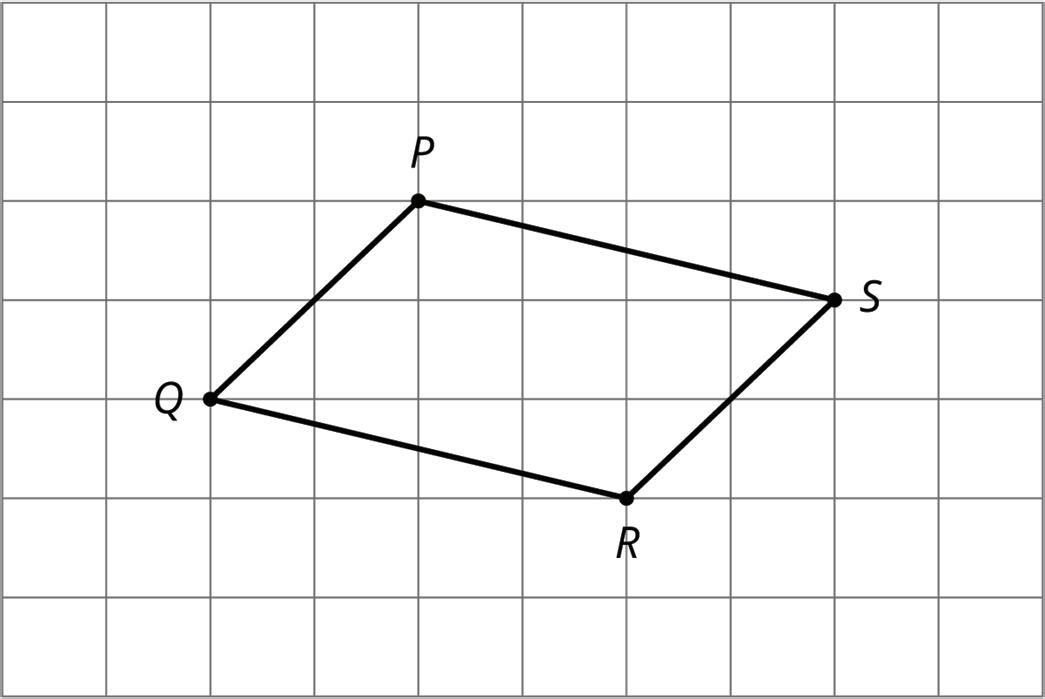
Which of the following is true?
D. Cannot be determined from the information given.
5. Describe a sequence of transformations for which Quadrilateral P is the image of Quadrilateral Q.
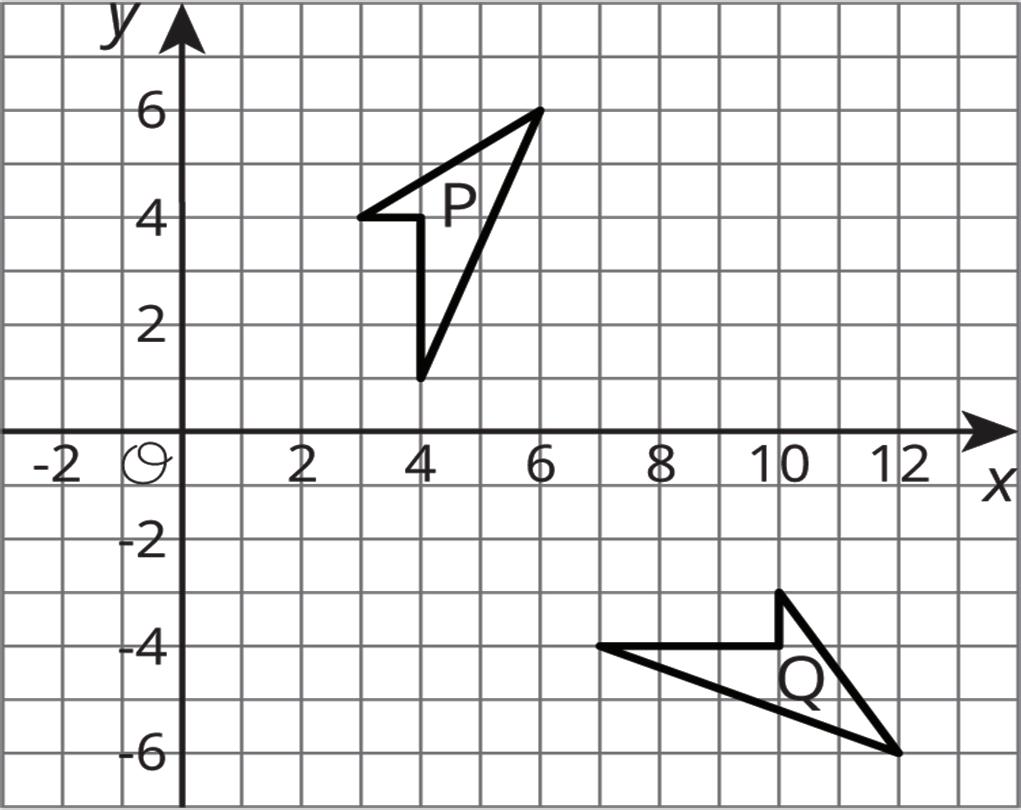
Unit 2, Lesson 9: Side Length Quotients in Similar
Triangles
Warm-Up: Two-Three-Four and Four-Five-Six
Triangle �� has side lengths 2, 3, and 4. Triangle �� has side lengths 4, 5, and 6. Is triangle �� similar to triangle ��?
Exploration Activity: Quotients of Sides within Similar Triangles
Triangle ������ is similar to triangles ������, ������, and ������. The scale factors for the dilations that show ∆������ is similar to each triangle in the table.

1. Find the side lengths of triangles ������, ������, and ������. Record them in the first table.
2. Your teacher will assign you one of the three columns. For all four triangles, find the quotient of the triangle side lengths assigned to you and record it in the second table. What do you notice about the quotients?
3. Compare your results with your partner’s and complete your table.
Collaborative Activity: Using Side Quotients to Find Side Lengths of Similar Triangles
Triangles ������, ������, and ������ are all similar. The side lengths of the triangles all have the same units. Find the unknown side lengths.
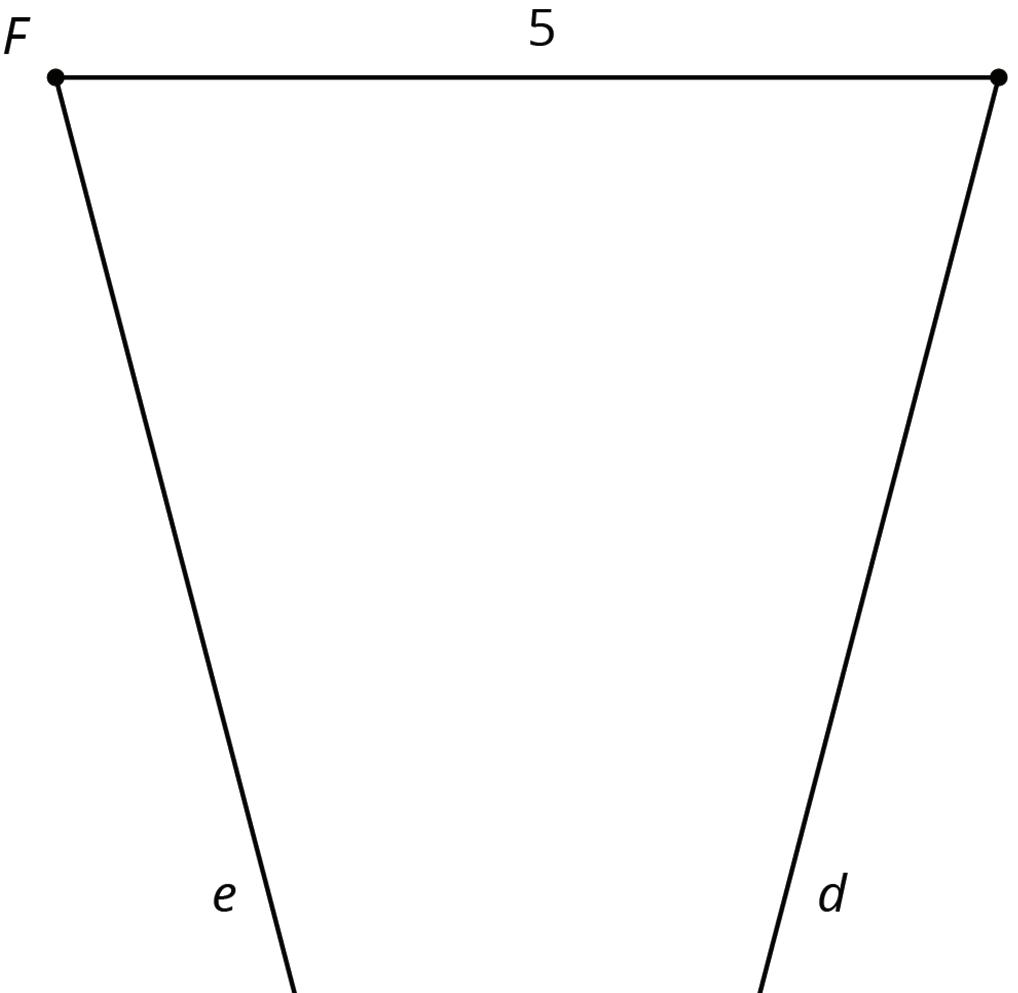
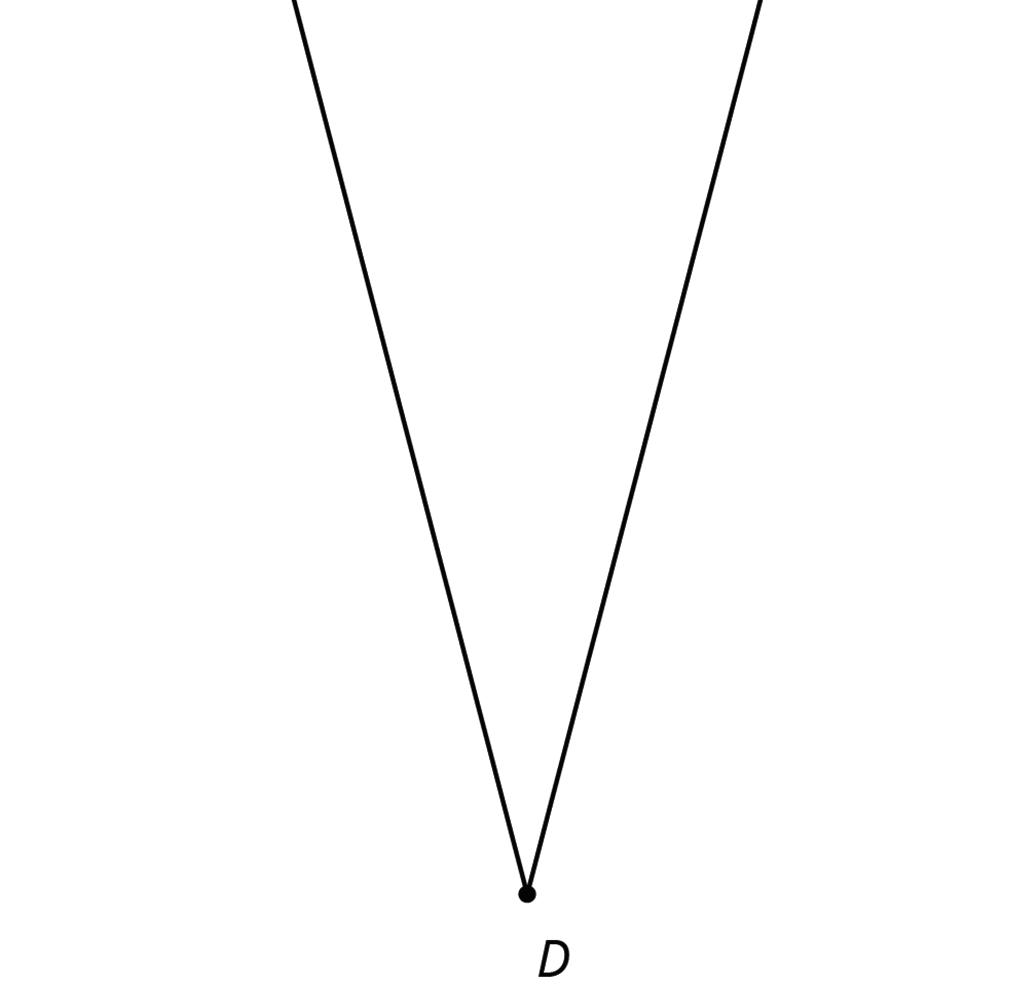
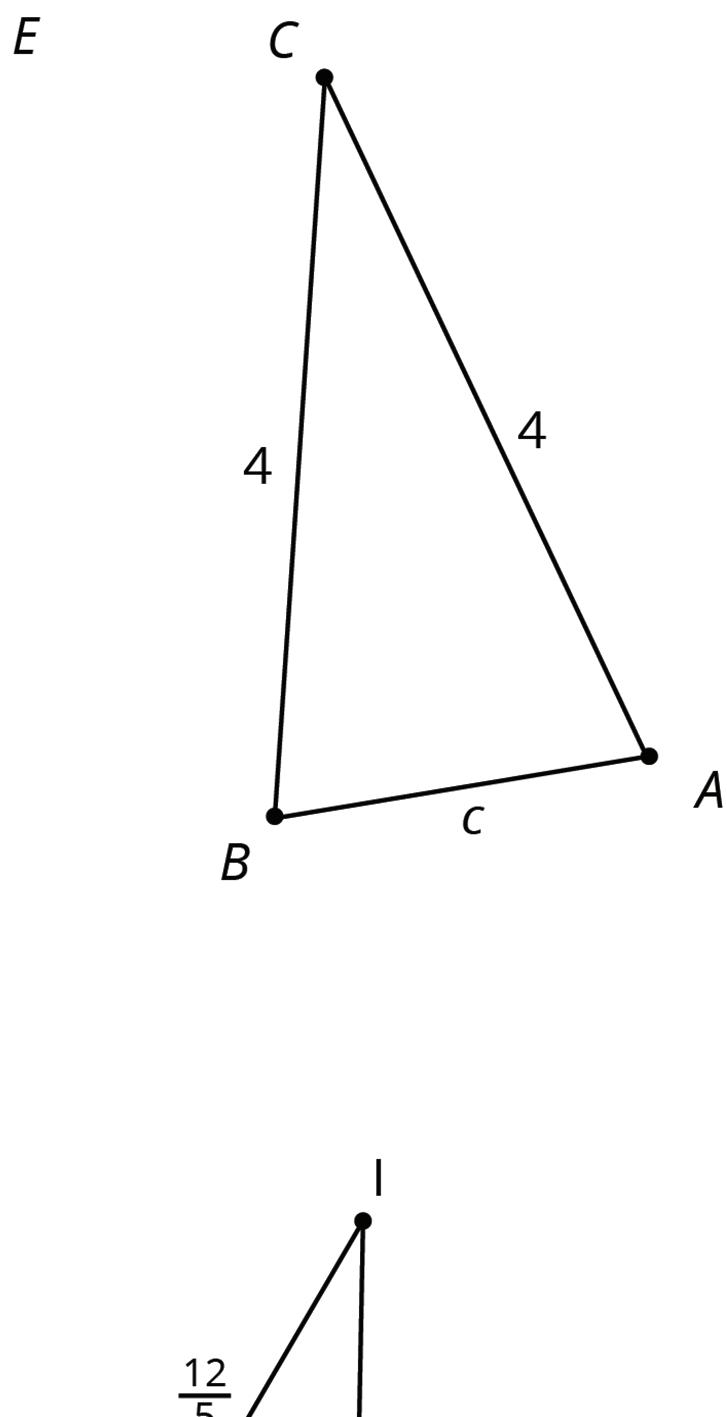
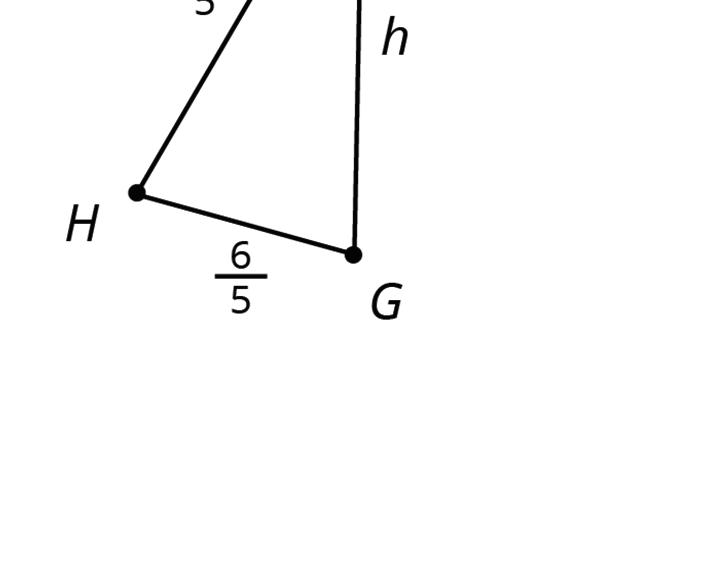
Lesson Summary
If 2 triangles are similar, then the side lengths of one of the triangles can be multiplied by the same scale factor to get the corresponding side lengths of the other triangle. For the triangles shown, the scale factor is 2.
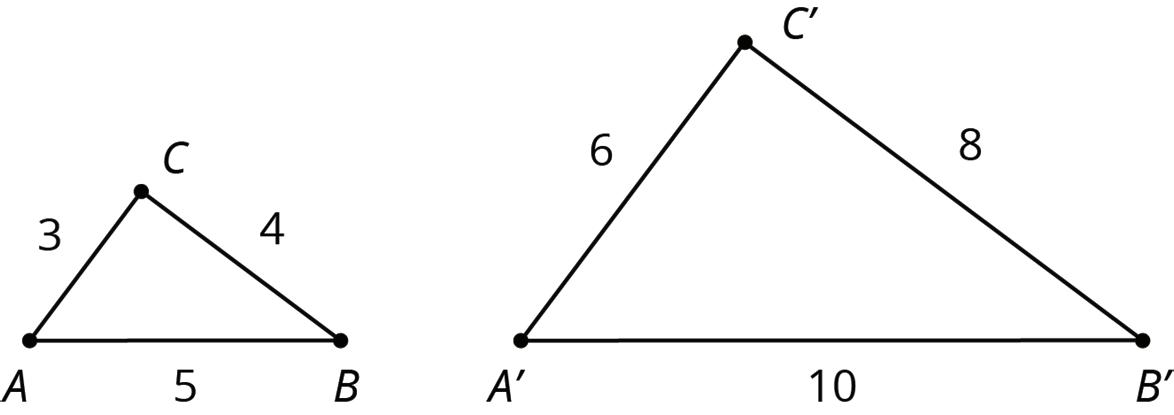
The table shows the relationships between the short and medium-length sides of the smaller triangle and the larger triangle.
The lengths of the medium side and the short side have a ratio of 4 ∶ 3. This means that the medium side in each triangle is 4 3 as long as the short side.
This is true for all similar polygons. The ratio between 2 sides of a polygon is the same as the ratio between the corresponding sides of a similar polygon.
These facts can be used to calculate missing side lengths in similar polygons. For example, triangles ��′��′��′ and ������ shown here are similar. The given information can be used to find the length of segment ��′��′.
In ∆������, side ���� is twice as long as side ����, so this must be true for any triangle that is similar to ∆������. Since ��′��′ is 1.2 units long and 2 ⋅ 1.2 = 2.4, the length of side ��′��′ is 2.4 units.
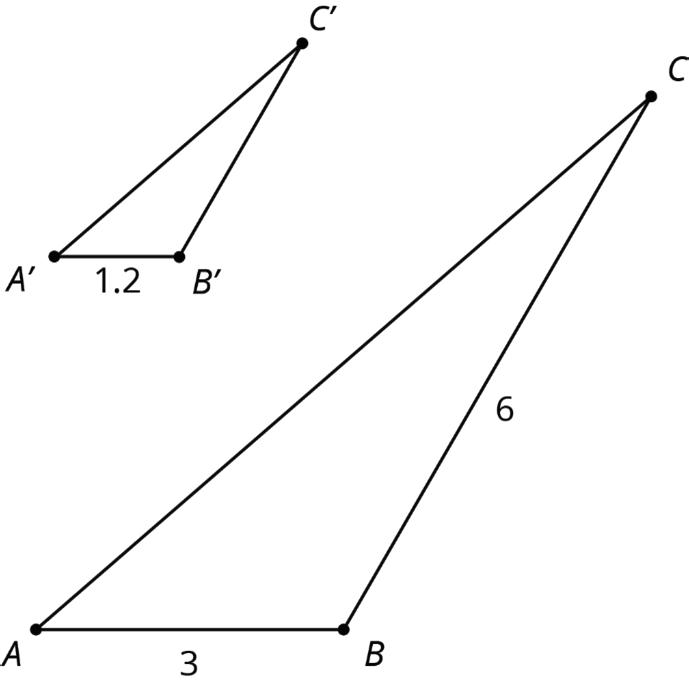
Practice Problems
1. These two triangles are similar.
What are �� and ��? Note: the two figures are not drawn to scale.
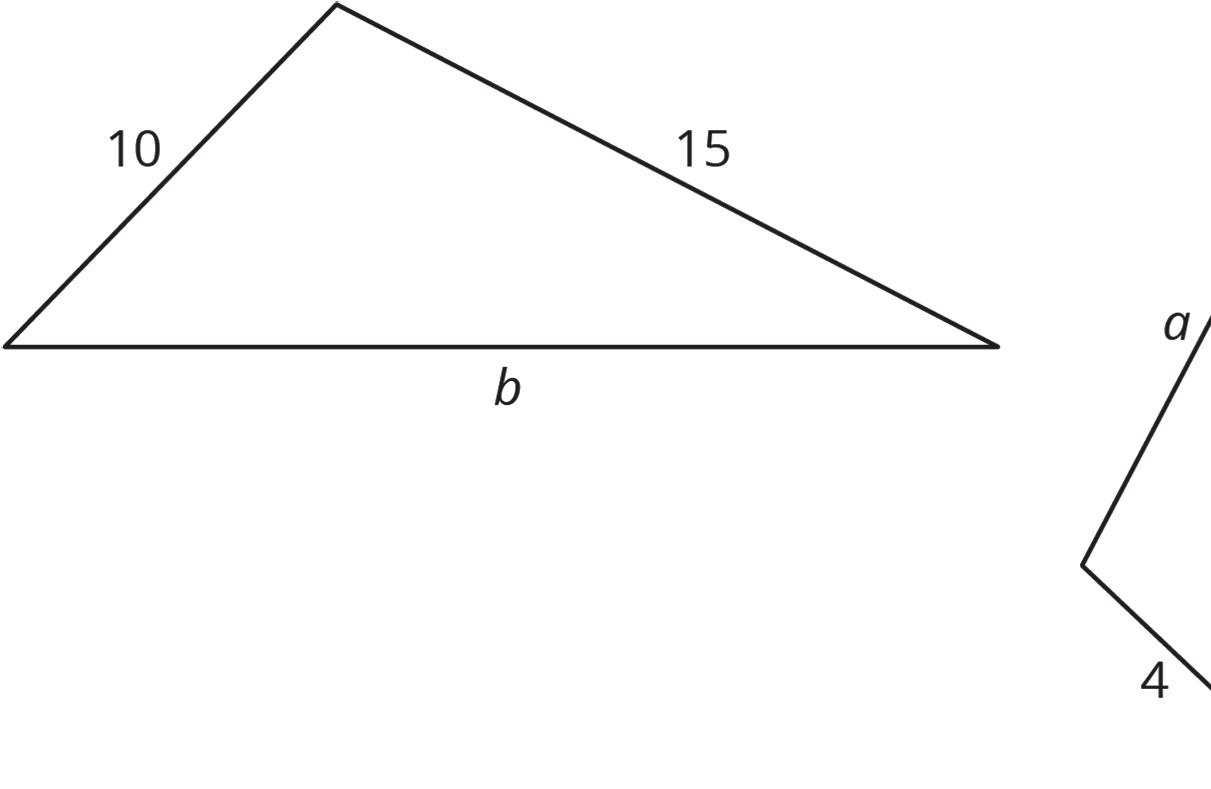
2. Here is ∆������. Triangle ������ is similar to ∆������ with scale factor 1 4 .
a. Draw what ∆������ might look like.
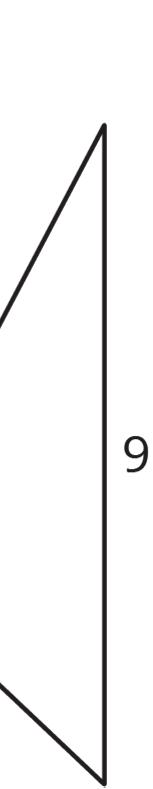
b. How do the angle measures of ∆������ compare to ∆������? Explain how you know.
c. What are the side lengths of ∆������?
d. For ∆������, calculate (long side) ÷ (medium side), and compare to ∆������.
3. The two triangles shown are similar. Find the value of d c .
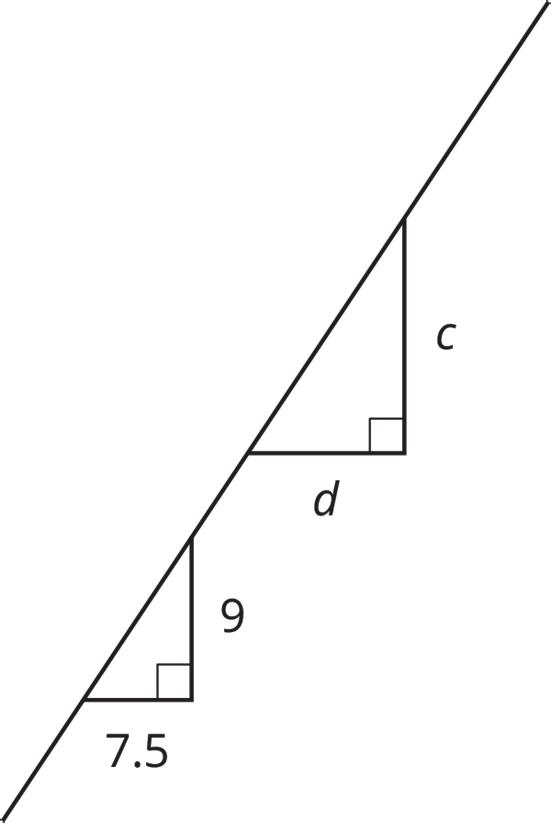
Review Problem
4. Two nested triangles are shown on the coordinate plane.
Identify the center and scale factor for a dilation that would transform the larger triangle to create the smaller triangle.
Unit 2, Lesson 10: Using Proportions to Find Side Lengths
Warm-Up: Which One Doesn’t Belong?
1. Four triangles are shown.
a. Which one doesn’t belong?
b. Explain your reasoning.
Guided Activity: Identifying the Scale Factor of Dilations
1. Triangle ������ is dilated using point �� as the center, as shown.
a. Complete the statement.
The scale factor of this dilation is between 0 and 1. equal to 1. greater than 1.
b. Explain your reasoning.
c. The measurements, in units, of the side lengths of each triangle have been added to the figure.
Myrical said the scale factor used is 1 3 , whereas Joshua said it is 3. Explain who is correct.
d. Discuss with your partner how the distance between points �� and �� should compare with the distance between points �� and ��′. Then, complete the statement.
The distance between points �� and �� should be times the distance between �� and ��′.
e. The distances, in units, between the center of dilation and each vertex on the preimage are shown in purple. The distances, in units, between the center of dilation and each vertex on the image are shown in orange.
Explain whether the provided information confirms your answer to part D.
2. Similar figures �������� and �������� are shown.
a. Complete the proportion, and then use it to determine the length of ����.
���� 3.5 =
b. Determine the length of ����. Show your work.
c. Determine the length of ����. Show your work.
Collaborative Activity: Similar Polygons
Work with your partner to complete the following.
1. Quadrilateral �������� is dilated using point �� as the center of dilation.
Latonya found the scale factor of the dilation to be 8 3 . Her work is shown.
a. Is Latonya correct?
b. Explain your reasoning.
2. For each pair of dilated similar figures in the table, determine the scale factor and the missing side lengths indicated. Round to the nearest tenth where needed.
Lesson Summary
The scale factor of a dilation can be determined using the lengths of the corresponding sides of the preimage, or using the distances between the center of dilation and the vertices of the preimage and the image.
scale factor = side length of image corresponding side length of preimage
scale factor = distance from center to vertex on the image distance from center to corresponding preimage vertex
The proportional relationship between 2 pairs of corresponding sides in similar figures can be used to determine unknown side lengths.
A proportional relationship is a collection of pairs of numbers that are in equivalent ratios.
Corresponding sides of similar figures can be used to write a proportion. The proportion can be used to solve for unknown side lengths.
Practice Problems
1. Similar figures �������� and �������� are shown.
Determine the scale factor of the dilation that maps �������� onto ��������.
2. Similar triangles ������ and ������ are shown, where ∆������ is dilated from a point not shown, using a scale factor of 3.
Determine the missing side lengths.
3. Similar quadrilaterals �������� and �������� are shown.
Jerusha was determining the length of ����, but she made an error. Her work is shown.
a. Explain Jerusha’s error.
b. Determine the correct length of ����.
Review Problems
4. A sequence of transformations of �������� is shown on the coordinate grid.
Describe each transformation applied to �������� to map to ��″��″��″��″.
5. Triangle ������ is dilated using point �� as the center of dilation with a scale factor of 2 3 , as shown.
Explain whether the figures are congruent or similar.
Unit 2, Lesson 11: Exploring Slope
Warm-Up: Equal Quotients
Write some numbers that are equal to 15 ÷ 12.
Exploration Activity: Similar Triangles on the Same Line
1. The figure shows three right triangles, each with its longest side on the same line.
Your teacher will assign you two triangles. Explain why the two triangles are similar.
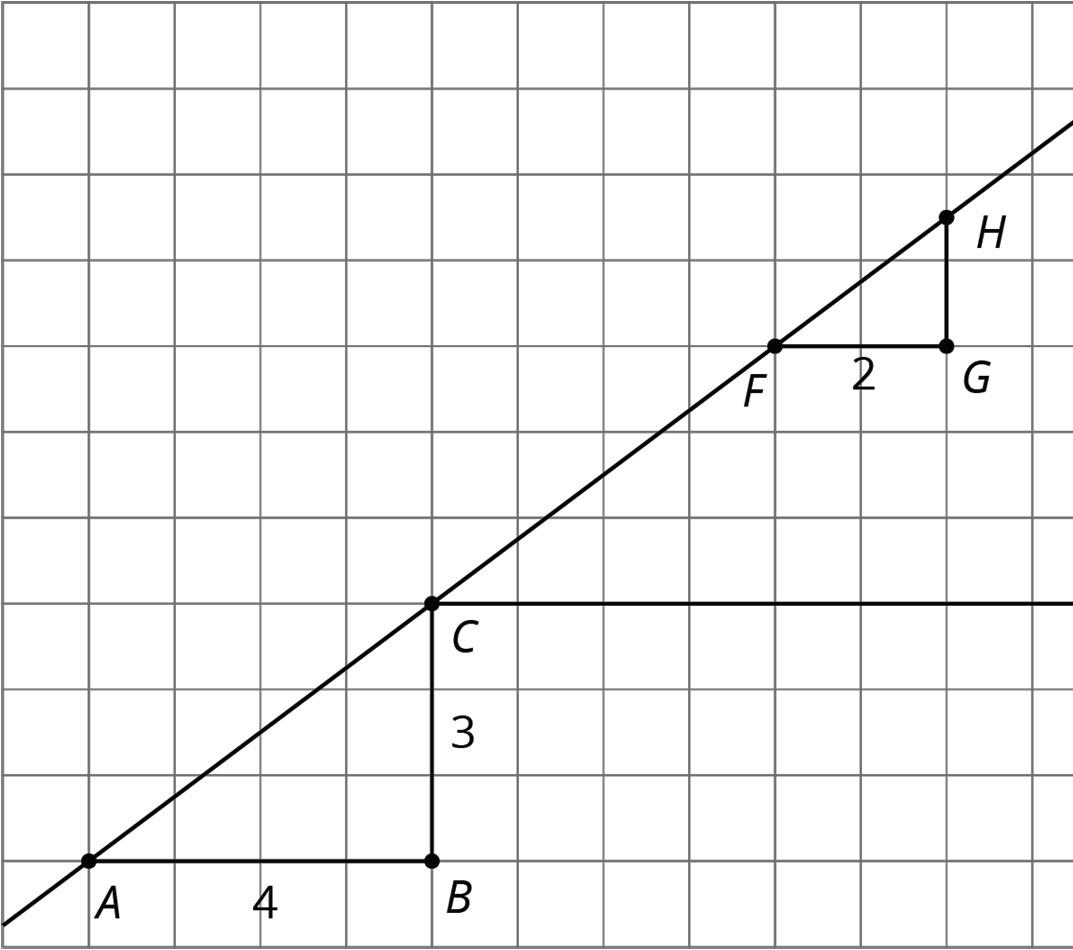
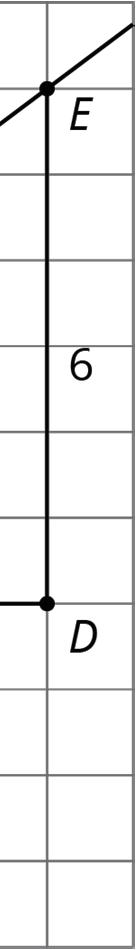
2. Complete the table.
Guided Activity: Multiple Lines with the Same Slope
1. Draw two lines with slope 3. What do you notice about the two lines?
2. Draw two lines with slope 1 2 . What do you notice about the two lines?
Collaborative Activity: Different Slopes of Different Lines
Here are several lines.
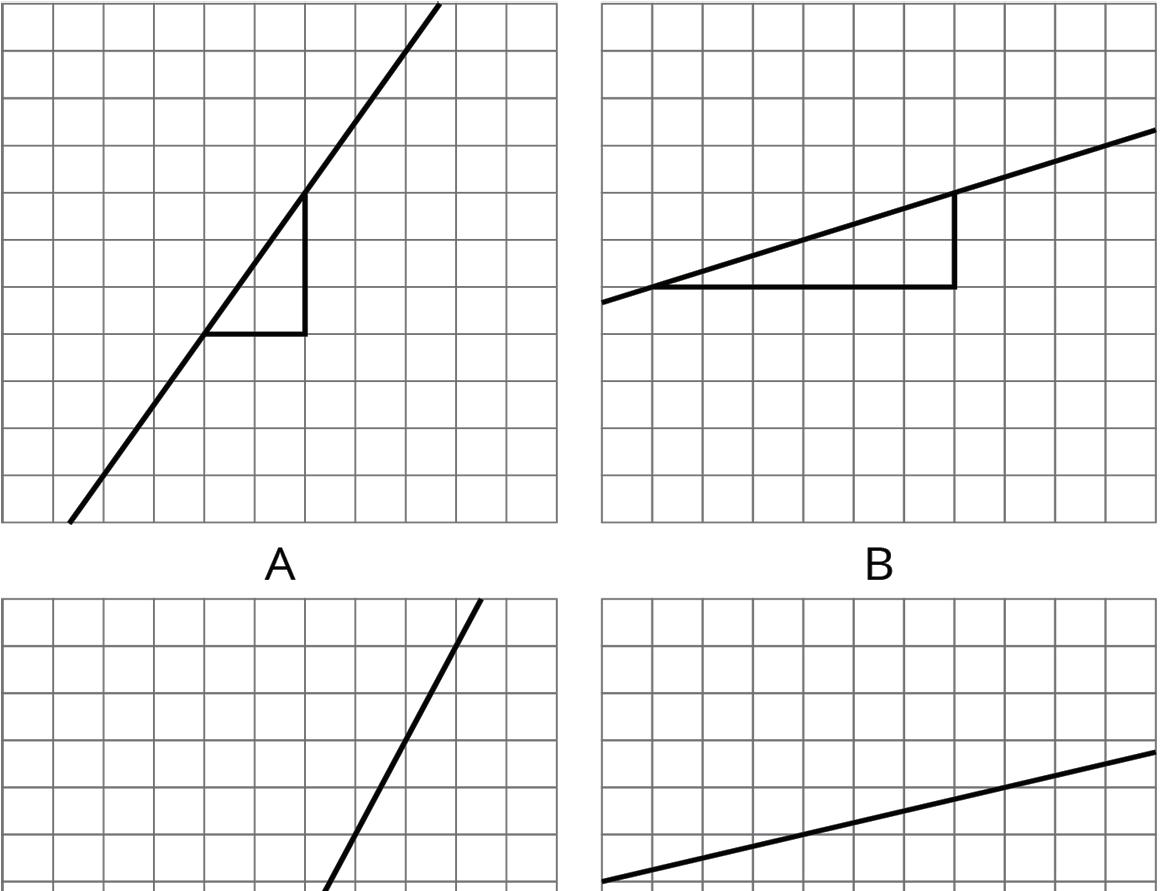
1. Match each line shown with a slope from this list: 1 3 , 2, 1, 0.25, 3 2 , 1 2 .
2. One of the given slopes does not have a line to match. Draw a line with this slope on the empty grid F.
Lesson Summary
A line is drawn on the grid along with 4 right triangles.
These 4 triangles are all examples of slope triangles. One side of a slope triangle is on the line, 1 side is vertical, and another side is horizontal. The horizontal and vertical sides meet at a right angle. The slope of the line is the ratio of the length of the vertical side of the slope triangle to the length of the horizontal side. This ratio is the same for all slope triangles for the same line because all slope triangles for the same line are similar.

The slope of a line is the ratio of the change in the vertical direction (�� direction) to the change in the horizontal direction (�� direction), often expressed as ∆�� ∆�� .
The expression ∆�� ∆�� is read as “change in �� over change in ��.”
In this example, the slope of the line is 2 3 . The ratio ∆�� ∆�� is equivalent to 2 3 between each pair of points on the line used to create the slope triangles shown.
• Between points �� and
• Between points �� and
• Between points �� and
• Between points �� and
Practice Problems
1. Of the three lines in the graph, one has slope 1, one has slope 2, and one has slope 1 5 . Label each line with its slope.
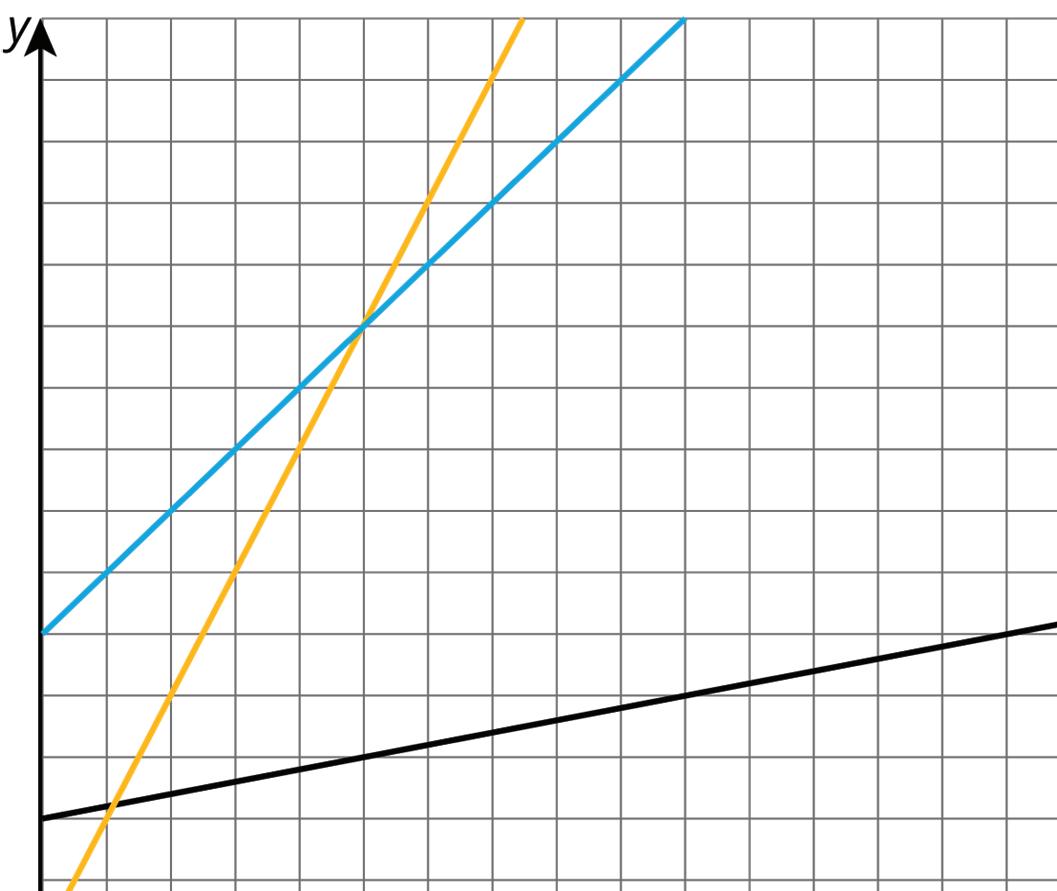
2. Draw three lines with slope 2, and three lines with slope 1 3 . What do you notice?
3. The figure shows two right triangles, each with its longest side on the same line.
a. Explain how you know the two triangles are similar.
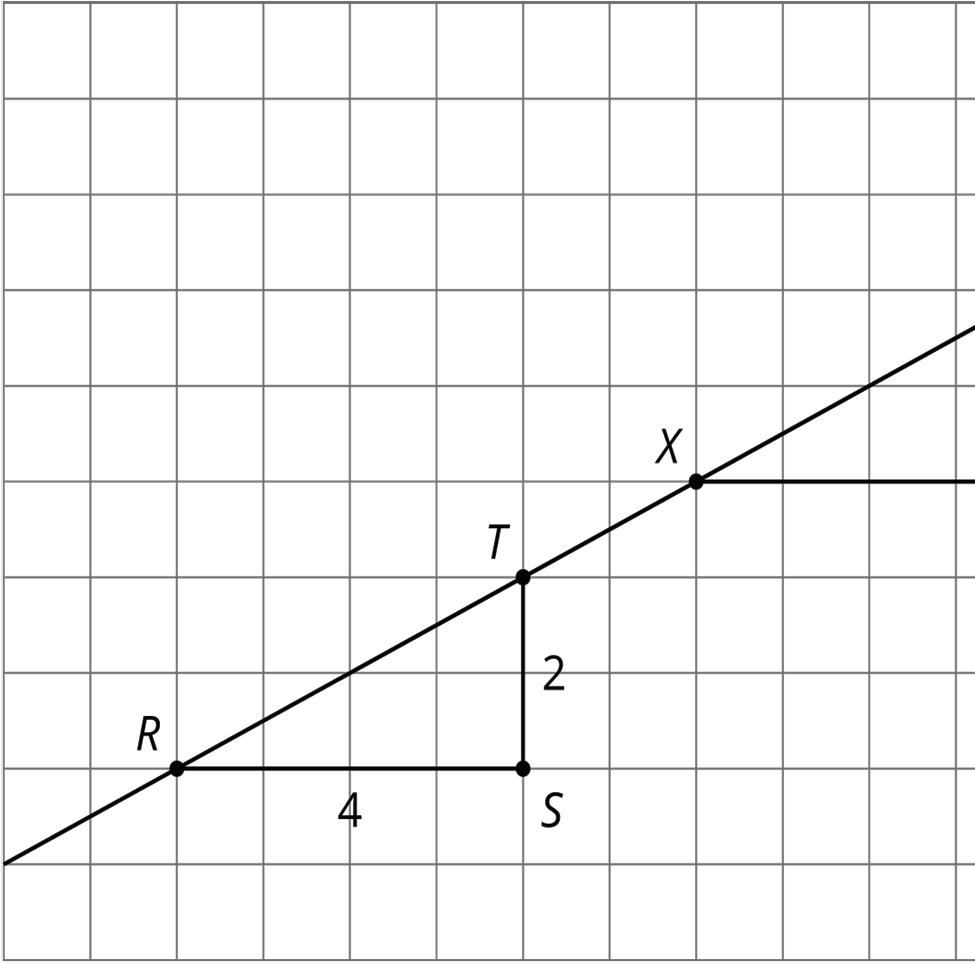
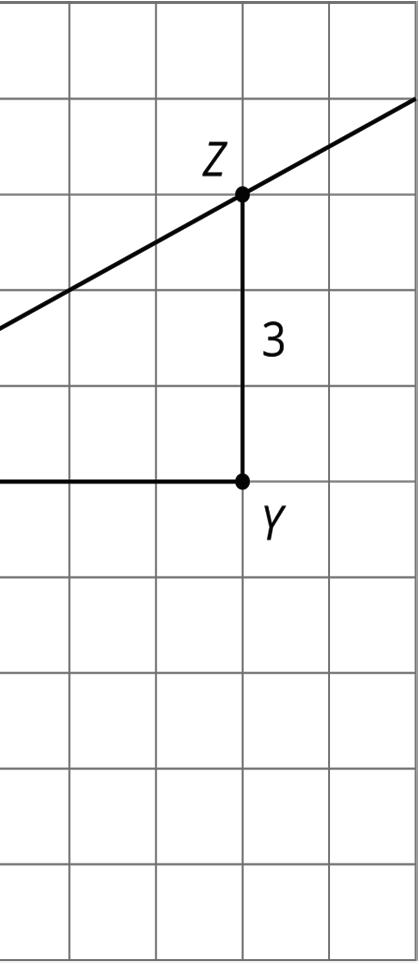
b. How long is ����?
c. For each triangle, calculate (vertical side) ÷ (horizontal side).
d. What is the slope of the line? Explain how you know.
Review Problem
4. Triangle �� has side lengths 3, 4, and 5. Triangle �� has side lengths 6, 7, and 8.
a. Explain how you know that Triangle �� is not similar to Triangle ��.
b. Give possible side lengths for Triangle �� so that it is similar to Triangle ��.
Unit 2, Lesson 12: Writing Equations for Lines
Warm-Up: Coordinates and Lengths in the Coordinate Plane
Find each of the following and explain your reasoning.
1. The length of segment ����.
2. The coordinates of ��.
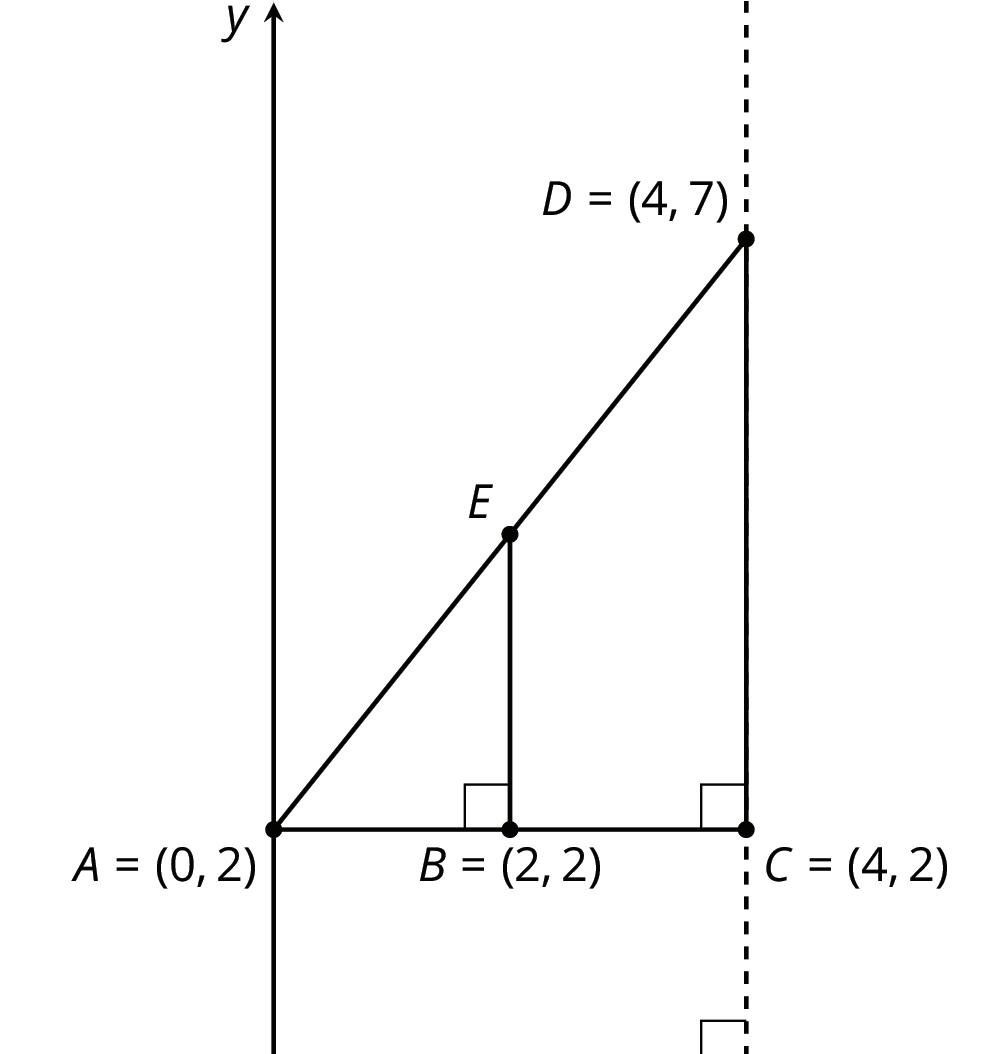
Exploration Activity: The Meaning of an Equation of a Line
Line �� is shown in the coordinate plane.
1. What are the coordinates of �� and ��?
2. Is point (20, 15) on line ��? Explain how you know.
3. Is point (100, 75) on line ��? Explain how you know.
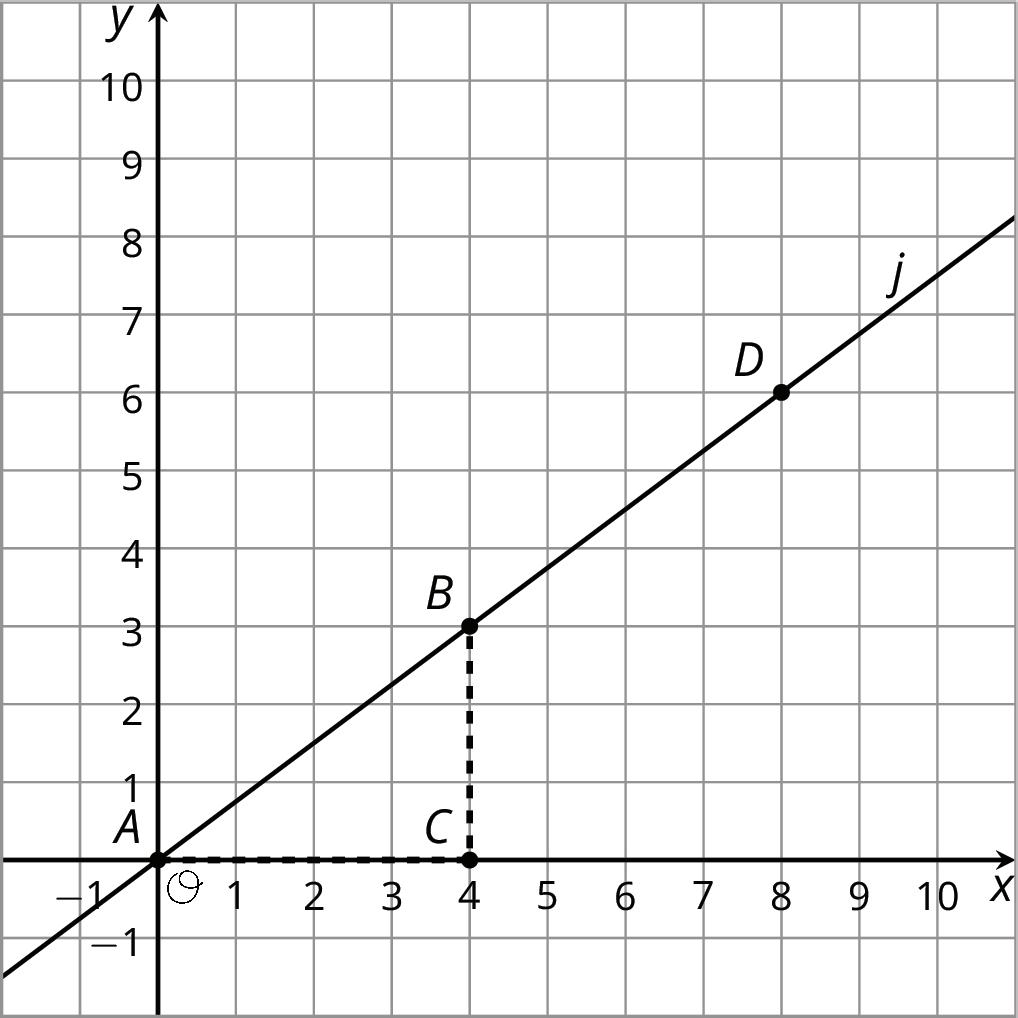
4. Is point (90, 68) on line ��? Explain how you know.
5. Suppose you know the ��- and ��-coordinates of a point. Write a rule that would allow you to test whether the point is on line ��.
Collaborative Activity: Writing Relationships from Slope Triangles
Two diagrams are shown.
1. Complete each diagram so that all vertical and horizontal segments have expressions for their lengths.
2. Use what you know about similar triangles to find an equation for the quotient of the vertical and horizontal side lengths of ∆������ in each diagram.
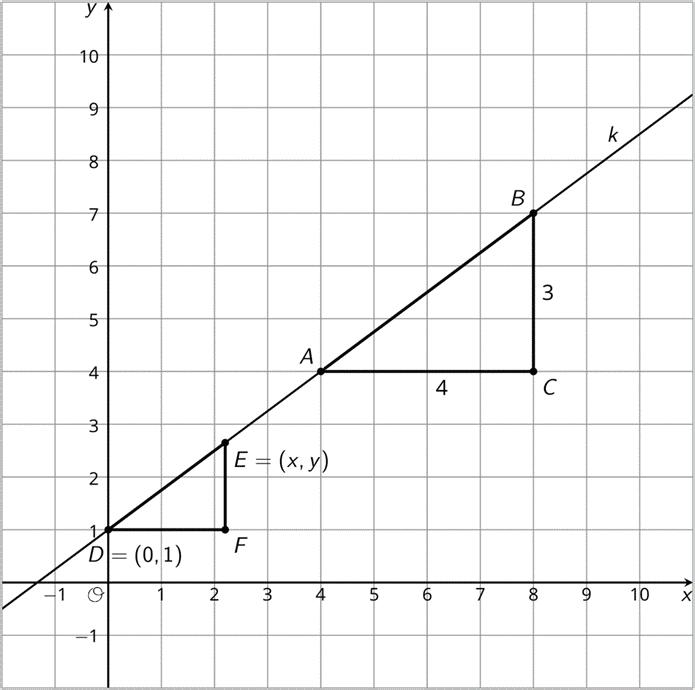
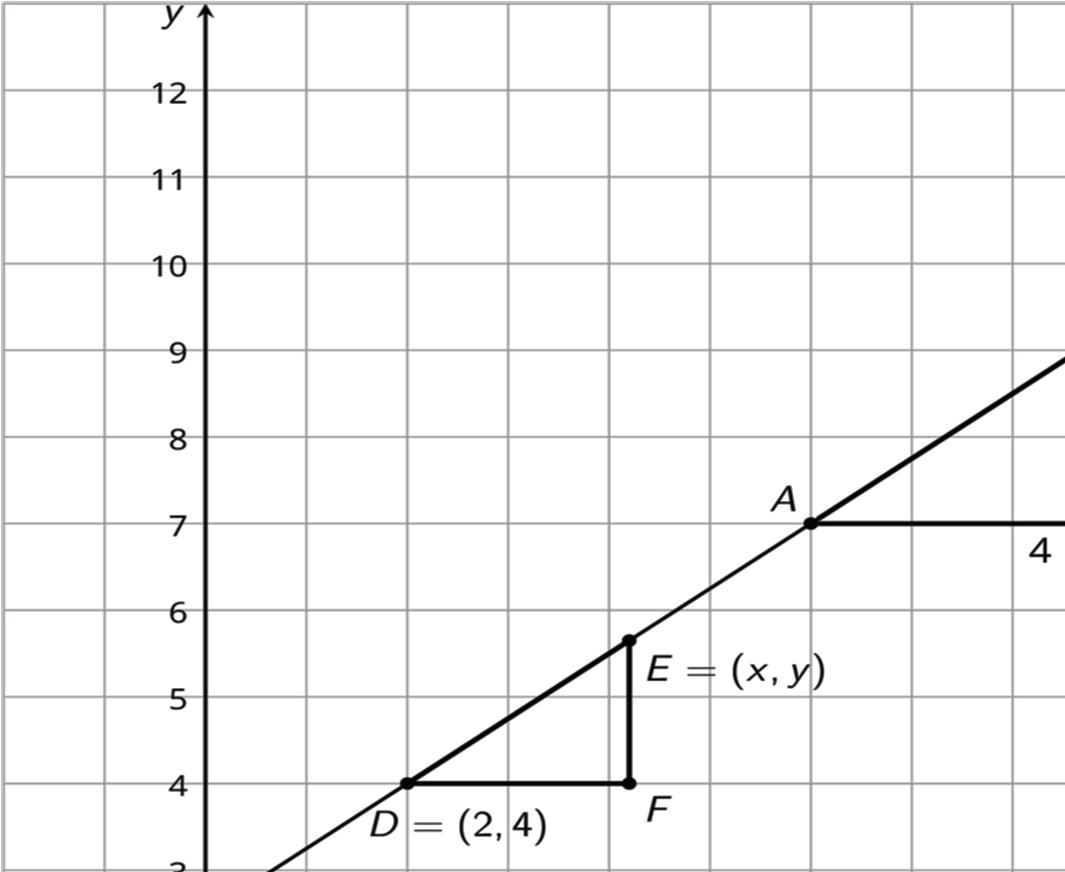
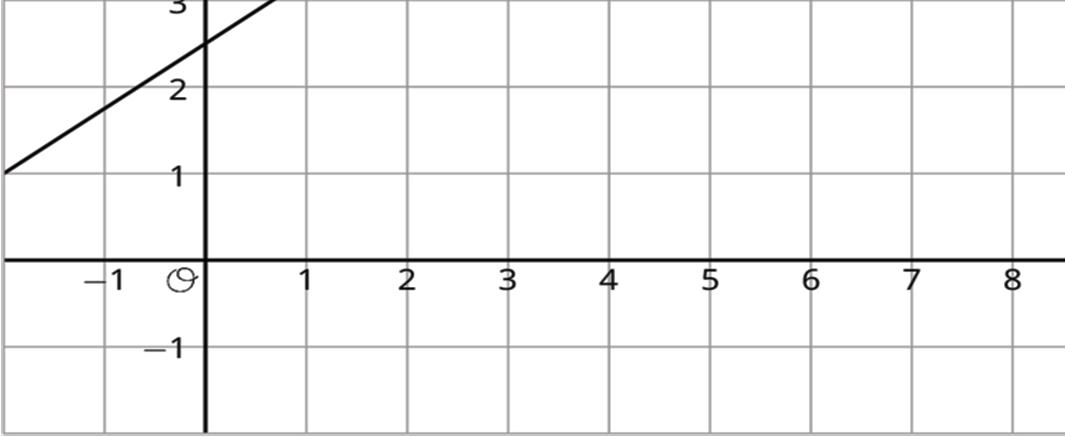
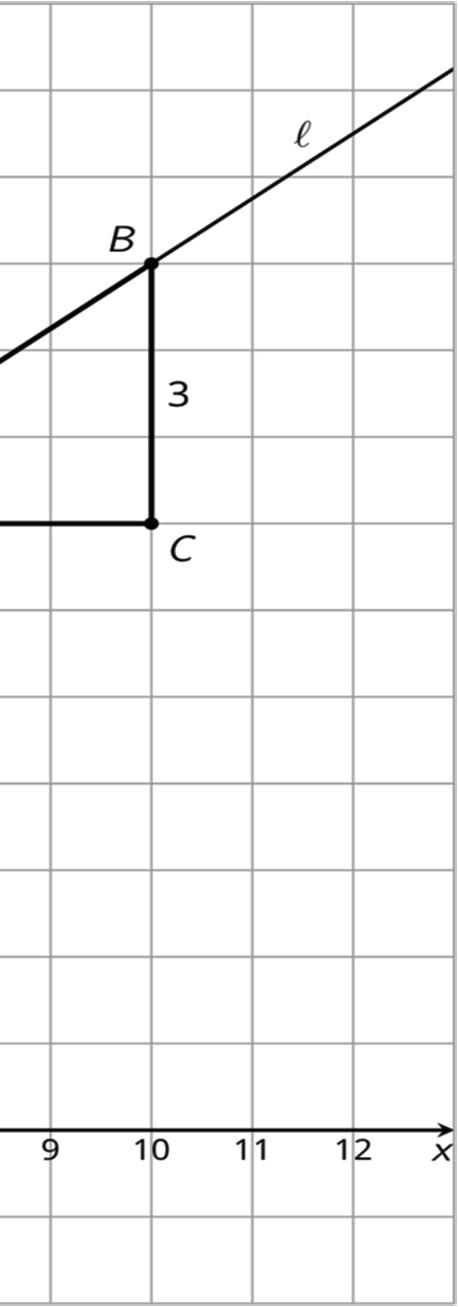
Lesson Summary
The distances between points on a line are always proportionally the same. Proportional relationships can be used to better understand lines and their slopes.
Points ��, ��, and �� are shown on the same line. Triangles ������ and ������ are slope triangles for the line, so they are similar triangles. The relationship between the values of �� and ��, which make up the coordinates of point ��, can be explored using similarity.
The slope for ∆������ is 2 1 since the vertical side has length 2 and the horizontal side has length 1. The slope for ∆������ is �� �� because the vertical side has length �� and the horizontal side has length ��. These 2 slopes must be equal since they are from slope triangles for the same line. Therefore, 2 1 = �� �� .
Since 2 1 = 2, this means that the value of �� is twice the value of ��, or that �� = 2��. This equation is true for any point (��, ��) on the line.
Two different slope triangles are shown on a different line. The same reasoning can be used to describe the relationship between �� and �� for this point ��.
The slope for ∆������ is 2 1 since the vertical side has length 2 and the horizontal side has length 1. For ∆������, the horizontal side has length ��. The vertical side has length �� − 1 because the distance from the point (��, ��) to the ��-axis is ��, but the vertical side of the triangle stops 1 unit short of the ��-axis. The slope ∆������ is �� −1 �� . The slopes for the 2 slope triangles are equal, so 2 1 = �� −1 �� .
Since �� − 1 is twice ��, another way to write this equation is �� − 1 = 2��. This equation is true for any point (��, ��) on the line.
The slope between any 2 points on the same line is the same.
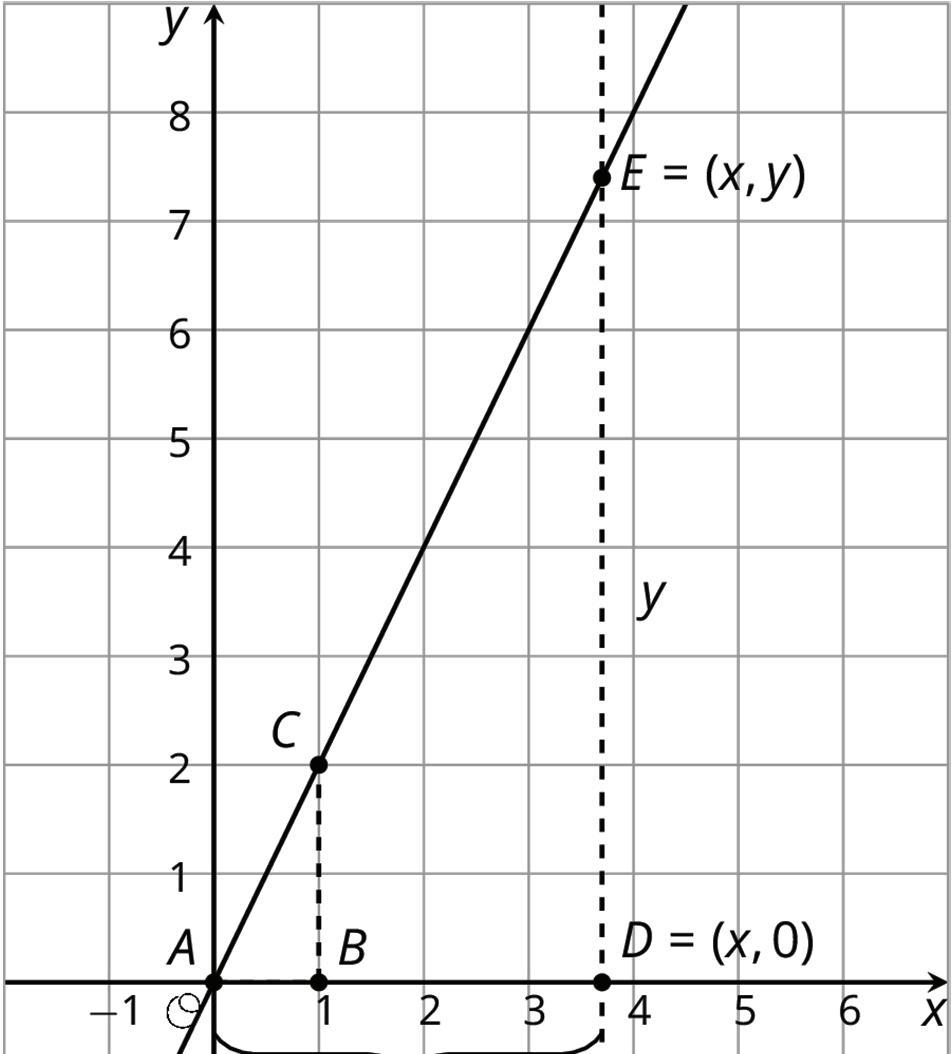
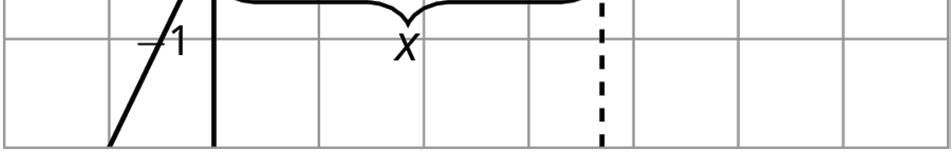
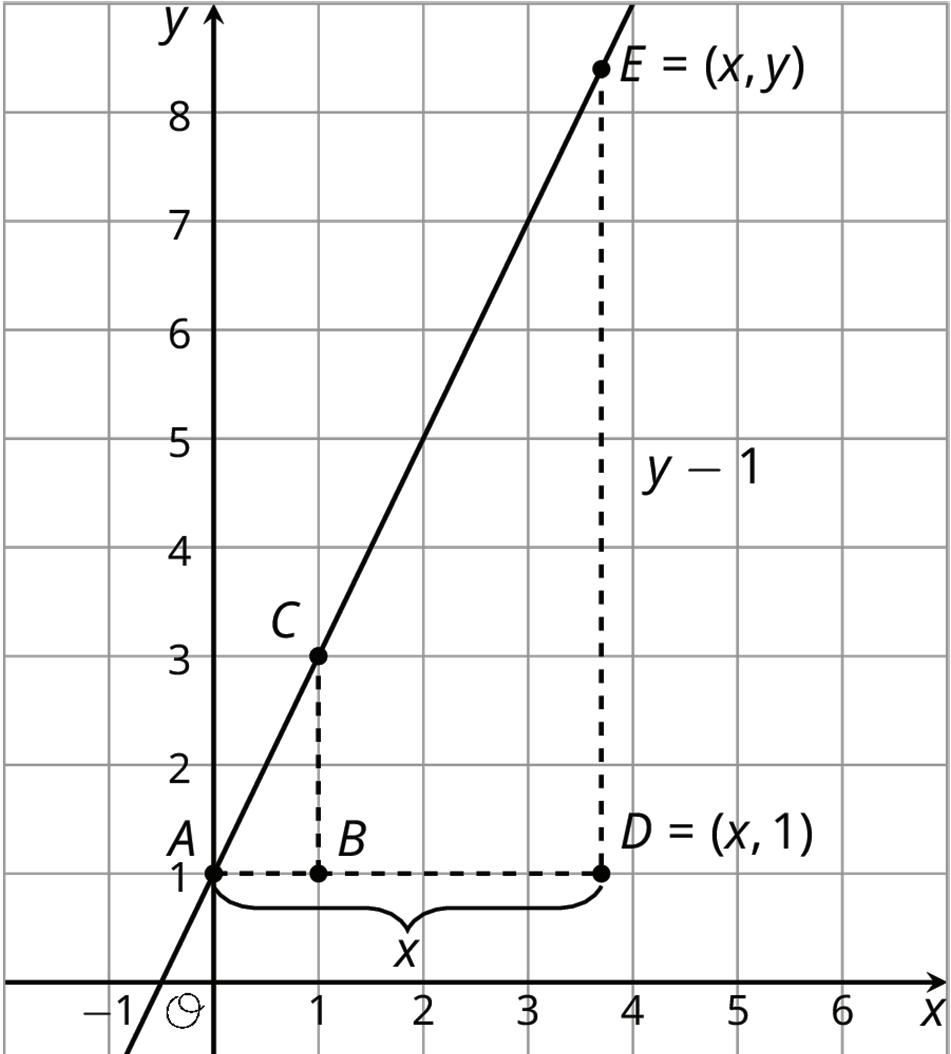
Practice Problems
1. For each pair of points, find the slope of the line that passes through both points. If you get stuck, try plotting the points on graph paper and drawing the line through them with a ruler.
a. (1, 1) and (7, 5)
b. (1, 1) and (5, 7)
c. (2, 5) and (−1, 2)
d. (2, 5) and (−7, −4)
2. Consider the graphed line.
Mai uses Triangle A and says the slope of this line is 6 4 . Elena uses Triangle B and says no, the slope of this line is 1.5. Do you agree with either of them? Explain.
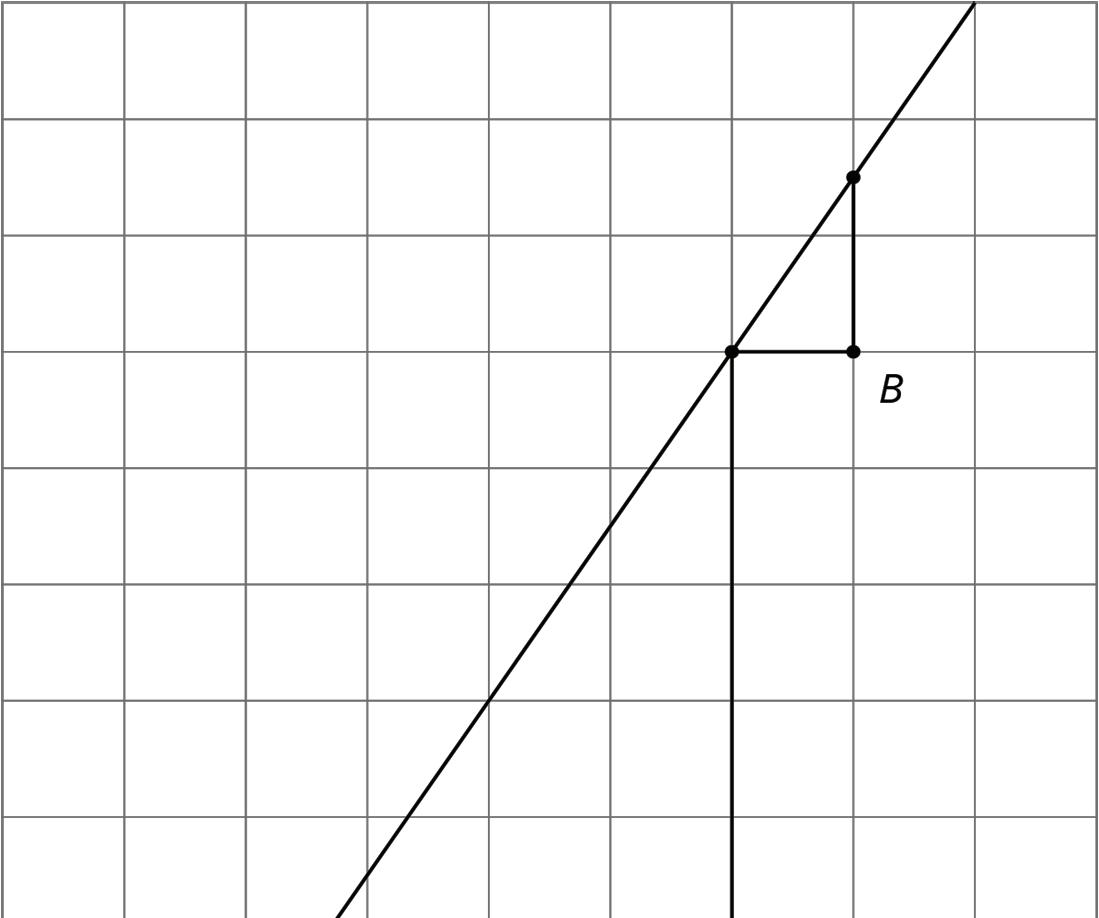
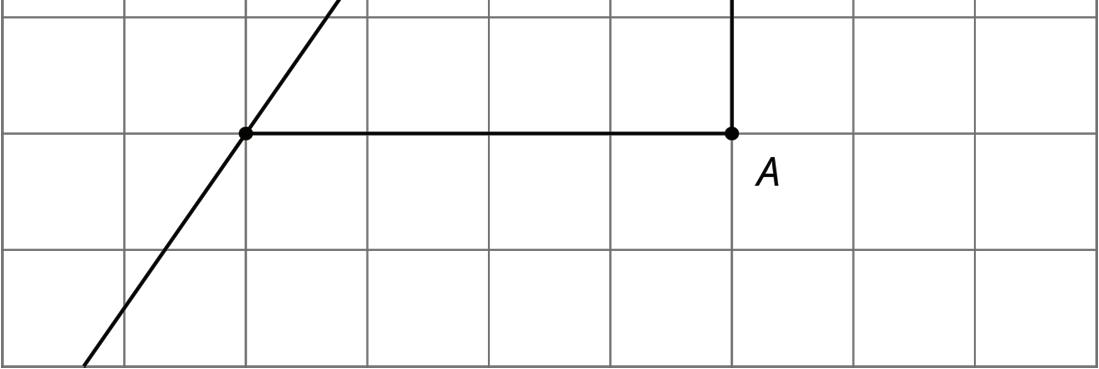
3. Line ℓ is shown in the coordinate plane.
a. What are the coordinates of �� and ��?
��:
b. Is the point (16, 20) on line ℓ? Explain how you know.
c. Is the point (20, 24) on line ℓ? Explain how you know.
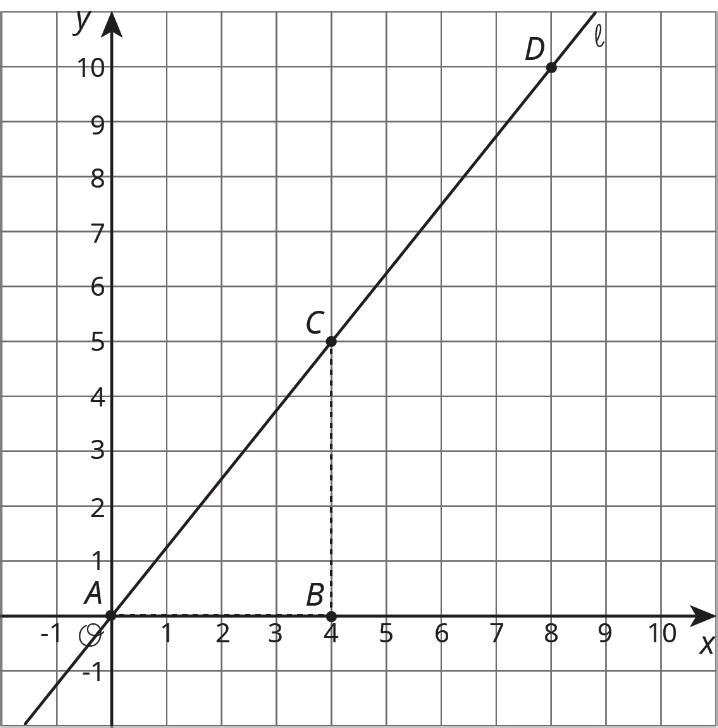
d. Is the point (80, 100) on line ℓ? Explain how you know.
e. Write a rule that would allow you to test whether (��, ��) is on line ℓ.
Review Problem
4. A rectangle has length 6 and height 4.
Which of these would tell you that quadrilateral �������� is definitely not similar to this rectangle? Select all that apply.
Unit 2, Lesson 13: Using Equations for Lines
Warm-Up: Missing Center
A dilation with scale factor 2 sends �� to ��. Where is the center of the dilation?
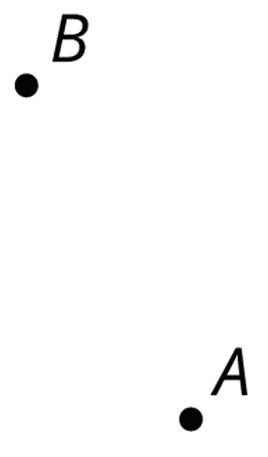
Guided Activity: Writing Relationships from Two Points
Here is a line.
1. Using what you know about similar triangles, find an equation for the line in the diagram.
2. What is the slope of this line? Does it appear in your equation?
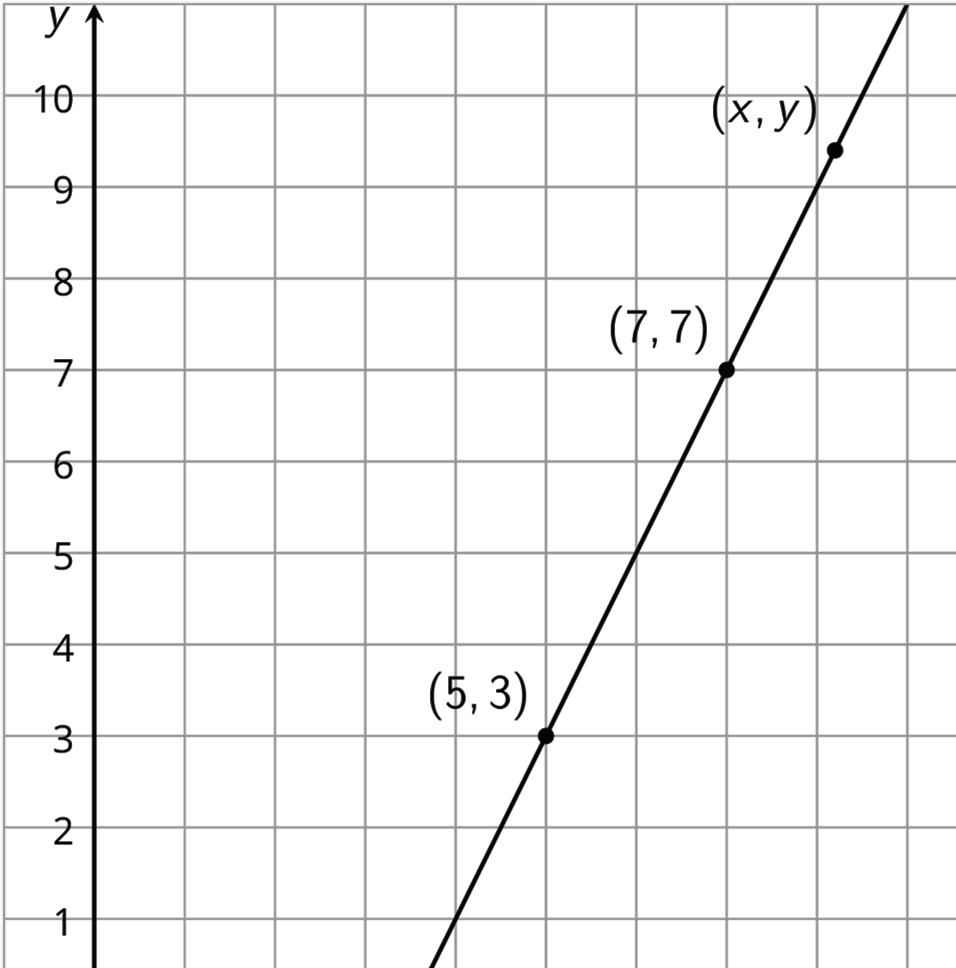
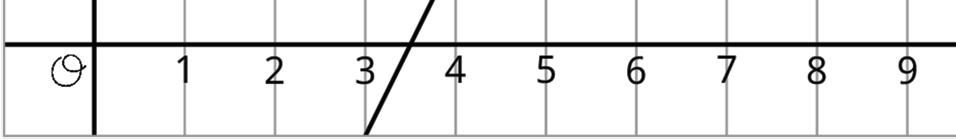
3. Is (9, 11) also on the line? How do you know?
4. Is (100, 193) also on the line?
Collaborative Activity: Slope Triangles and Equation of Line
Triangle ������ is shown on the coordinate plane.
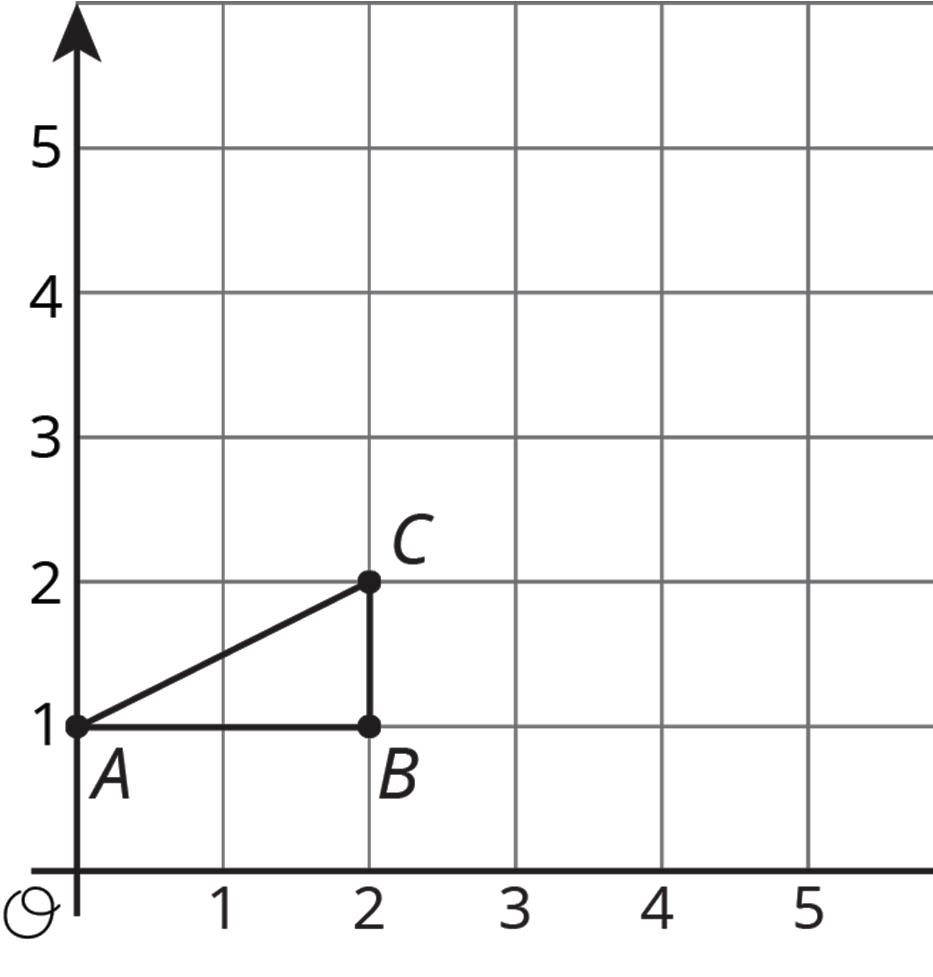

1. Draw ∆������ after a translation of (��, ��) → (�� + 4, �� + 2). Label the new triangle ������.
2. Describe the relationship between ∆������ and ������.
3. Plot points �� (4, 1) and �� (6, 1) on the coordinate plane. Draw triangles ������ and ������.
4. Describe the relationships between ∆������, ∆������, and ∆������.
5. What is the slope of the line formed between points �� and ��?
6. Write an equation for the line formed by points ��, ��, ��, and ��.
7. Identify 2 additional points on the line formed by points ��, ��, ��, and ��.
Lesson Summary
The slope of a line can be used to decide if a point lies on the line. A line is shown on the coordinate plane with a few points labeled.
The slope triangle with vertices (0, 1) and (2, 5) can be used to find the slope, 5 −1 2 −0 = 2. The slope triangle with vertices (0, 1) and (��, ��) can be used to show the slope is �� −1 �� . Since the slope between any 2 points on the same line is the same, �� −1 �� = 2 is an equation for the line.
To verify whether the point (11, 23) lies on this line, the coordinates of the point can be substituted into the equation to see if it is true, as shown.
23 −1 11 = 2
22 11 = 2
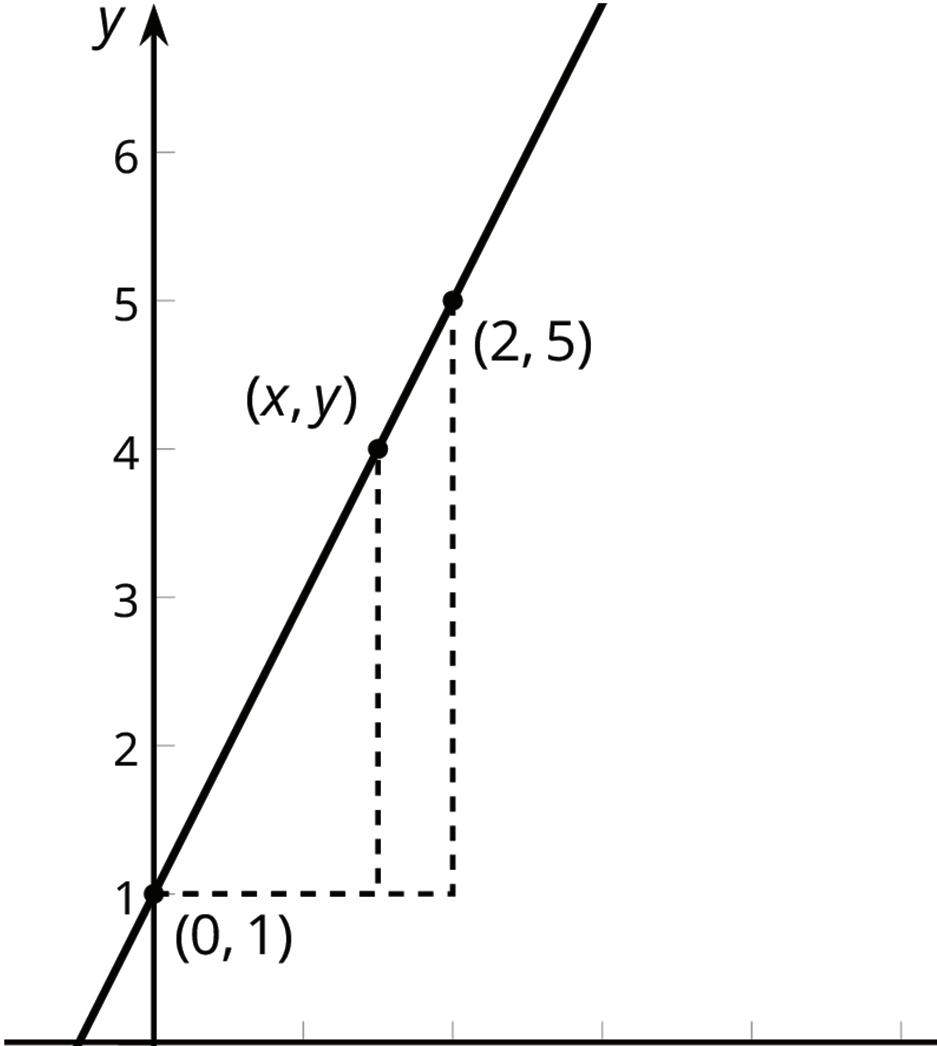
Since the coordinates (11, 23) result in a true equation, the point is on the graph of the line.
Practice Problems
1. Select all the points that are on the line through (0, 5) and (2, 8).
□ (4, 11)
□ (5, 10)
□ (6, 14)
□ (30, 50)
□ (40, 60)
2. All three points displayed are on the line. Find an equation relating �� and ��.
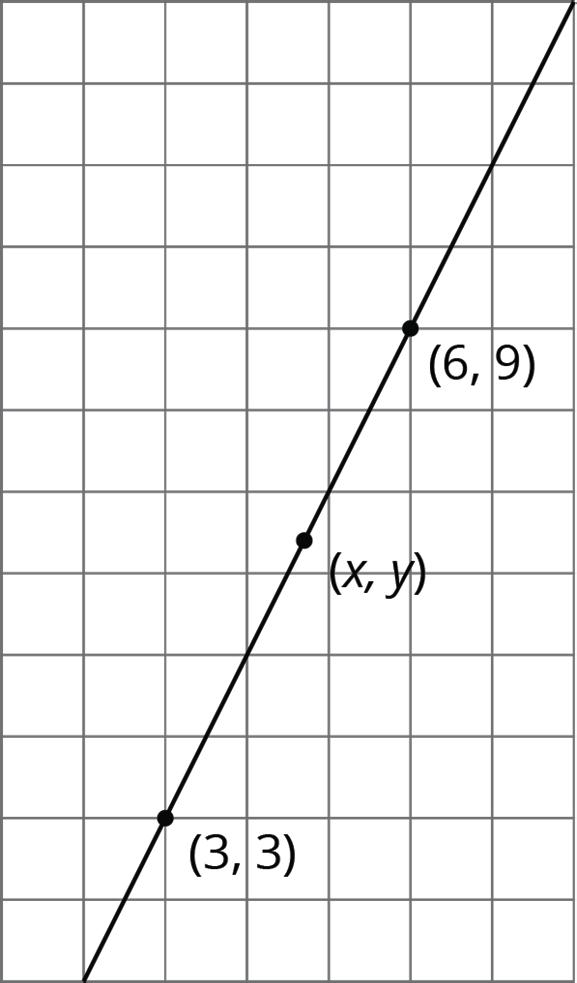
3. Triangle ������ is shown on the coordinate plane.
a. Draw ∆������ with coordinates ��(2, 0), ��(11, 0), and ��(11, 3).
b. What is the scale factor to map ∆������ to ∆������?
c. What is the slope of the line containing points ��, ��, and ��?
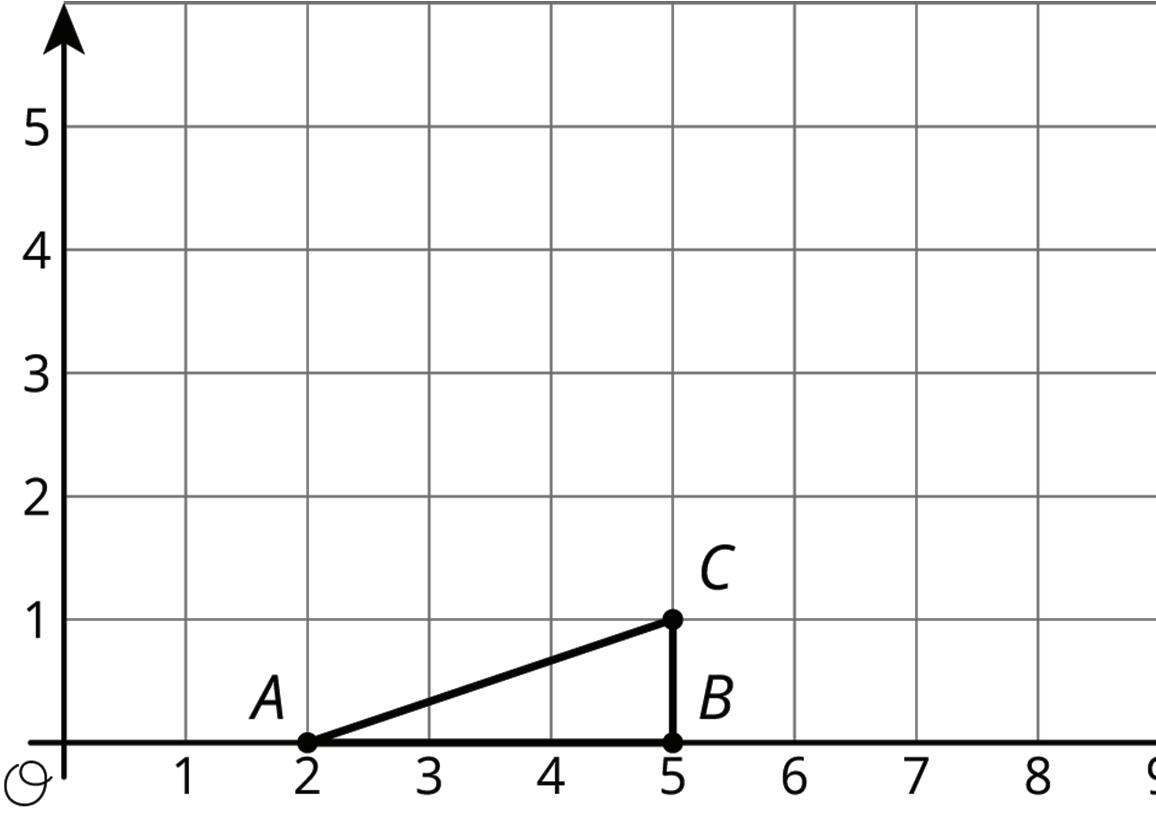
4. Here are some line segments.
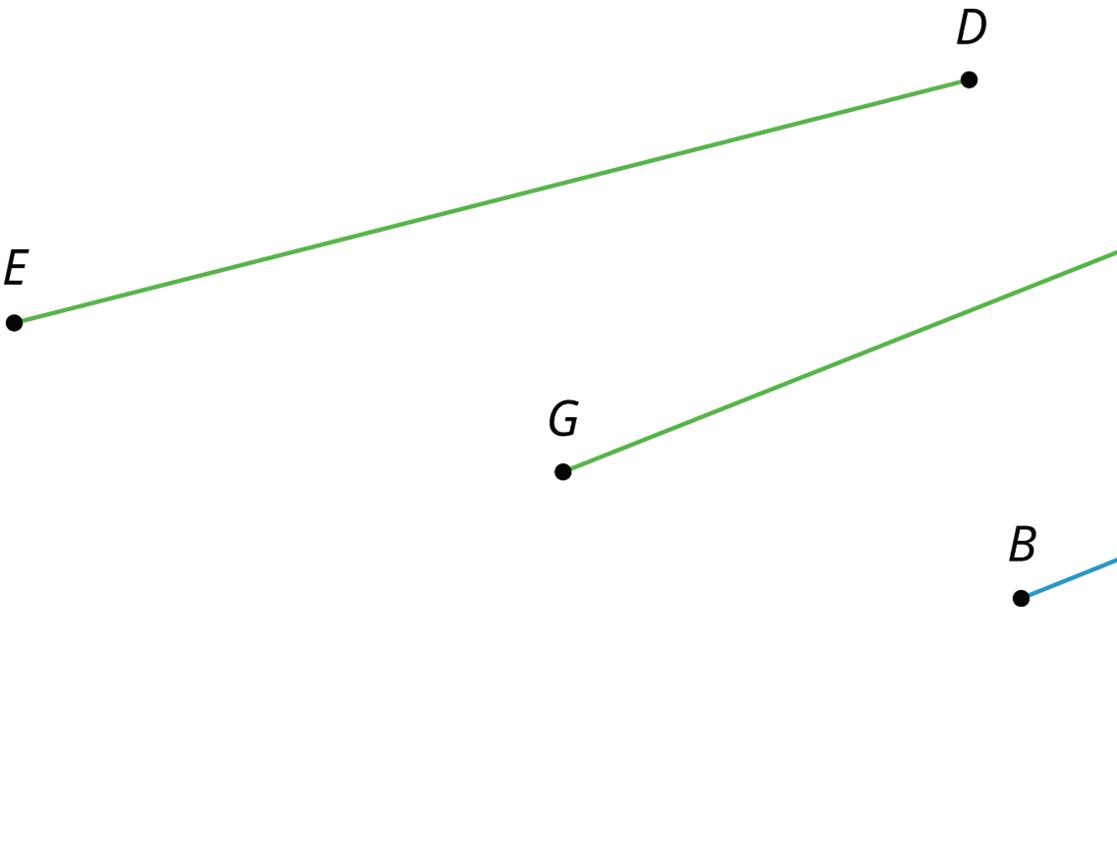

a. Which segment is a dilation of ���� using �� as the center of dilation and a scale factor of 2 3 ?
b. Which segment is a dilation of ���� using �� as the center of dilation and a scale factor of 3 2 ?
c. Which segment is not a dilation of ����, and how do you know?
Unit 3: Linear Relationships
Unit 3, Lesson 1: Representing Proportional Relationships
Warm-Up: Number Talk: Multiplication
1. Find the value of each product mentally.
a. 15 ⋅ 2
b. 15 ⋅ 0.5
c. 15 ⋅ 0.25
d. 15 ⋅ (2.25)
Collaborative Activity: Card Sort: Proportional Relationships
You teacher will give you 12 graphs of proportional relationships.
1. Sort the graphs into groups based on what proportional relationship they represent.
2. Write an equation for each different proportional relationship you find.
Exploration Activity: Representations of Proportional Relationships
1. Here are two ways to represent a situation.
Description
Equation
Jada and Noah counted the number of steps they took to walk a set distance. To walk the same distance, Jada took 8 steps while Noah took 10 steps. Then they found that when Noah took 15 steps, Jada took 12 steps. Let �� represent the number of steps Jada takes and let �� represent the number of steps Noah takes.
= 5 4 ��
a. Create a table that represents this situation with at least 3 pairs of values.
b. Graph this relationship and label the axes.
c. How can you see or calculate the constant of proportionality in each representation? What does it mean?
d. Explain how you can tell that the equation, description, graph, and table all represent the same situation.
2. Here are two ways to represent a situation.
Description Table
The Origami Club is doing a car wash fundraiser to raise money for a trip. They charge the same price for every car. After 11 cars, they raised a total of $93.50. After 23 cars, they raised a total of $195.50.
a. Write an equation that represents this situation. (Use �� to represent number of cars and use �� to represent amount raised, in dollars.)
b. Create a graph that represents this situation.
c. How can you see or calculate the constant of proportionality in each representation? What does it mean?
d. Explain how you can tell that the equation, description, graph, and table all represent the same situation.
Lesson Summary
Proportional relationships can be represented in multiple ways. Which representation is used depends on the purpose. For example, a stew recipe calls for 3 carrots for every 2 potatoes. One way to represent this is to use an equation. If there are �� potatoes and �� carrots, then �� = 3 2 ��.
Suppose a large batch of this recipe using 150 potatoes is needed for a family gathering. The equation can be used to find the number of carrots needed.
3 2 ⋅ 150 = 225 carrots
Suppose the recipe were used in a restaurant that makes the stew in large batches of different sizes depending on how busy a day it is, using up to 300 potatoes at a time. In this case, a graph could be used to show how many carrots are needed for different amounts of potatoes. Set up a pair of coordinate axes with a scale from 0 to 300 along the horizontal axis and 0 to 450 along the vertical axis, because 450 = 3 2 ⋅ 300. The graph can be used to see how many carrots are needed for any number of potatoes up to 300.
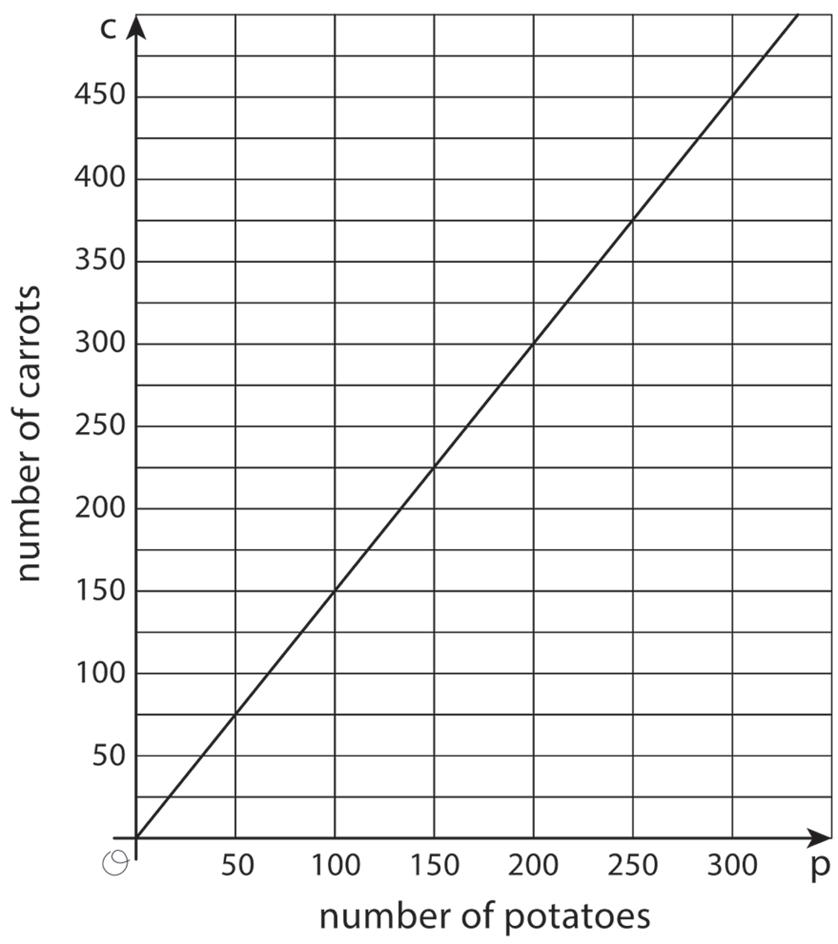
Lastly, suppose the recipe were used in a food factory that produces very large quantities, and suppose that the potatoes came in bags of 150. In this case, a table of values showing the number of carrots needed for different multiples of 150 may be most useful.
No matter the representation or the scale used for this context, the constant of proportionality, 3 2 , is evident in each.
In a proportional relationship, the values for one quantity are each multiplied by the same number to get the values for the other quantity. This number is called the constant of proportionality.
In the equation, it is the number multiplied by ��. In the graph, it is the slope. In the table, it is the number that the values in the left column are being multiplied by to get the values in the right column.
The constant of proportionality is also the rate of change of �� with respect to ��. In this case, the rate of change is 3 2 carrots per potato.
A rate of change is the ratio of change in one quantity to the corresponding change in another quantity.
Practice Problems
1. Here is a graph of the proportional relationship between calories and grams of fish.
a. Write an equation that reflects this relationship using �� to represent the amount of fish, in grams, and �� to represent the number of calories.
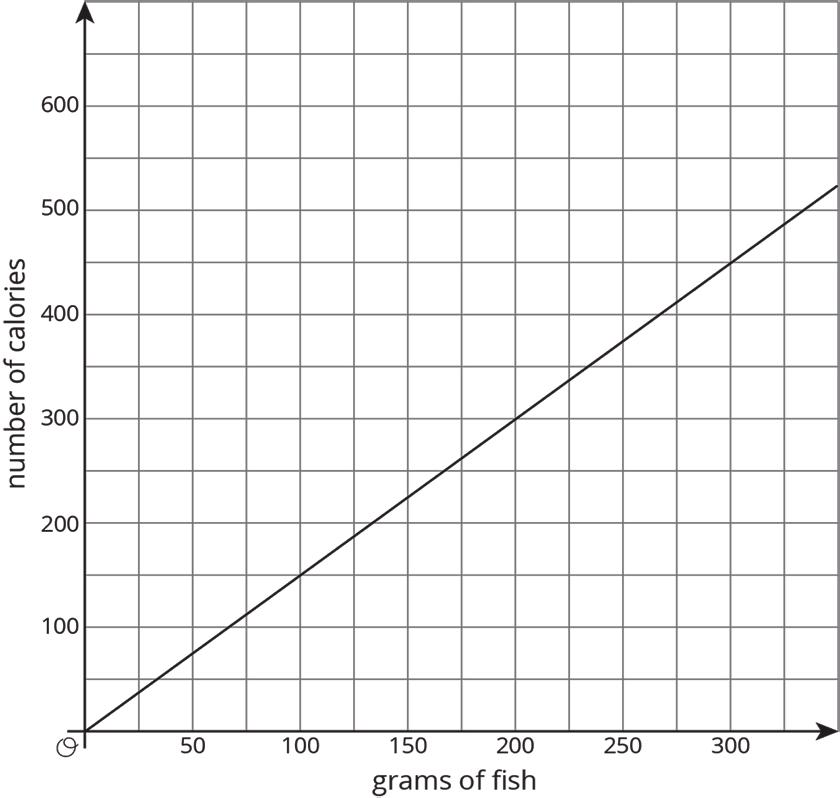
b. Use your equation to complete the table.
Review Problems
2. Describe how you can tell whether a line’s slope is greater than 1, equal to 1, or less than 1.
3. A line is represented by the equation �� ��−2 = 3 11 . What are the coordinates of some points that lie on the line? Graph the line on graph paper.
Unit 3, Lesson 2: Comparing Proportional Relationships
Warm-Up: What’s the Relationship?
The equation �� = 4.2�� could represent a variety of different situations.
1. Write a description of a situation represented by this equation. Decide what quantities �� and �� represent in your situation.
2. Make a table and a graph that represent the situation.
Guided Activity: Comparing Two Different Representations
1. Elena babysits her neighbor’s children. Her earnings are given by the equation �� = 8.40��, where �� represents the number of hours (hr.) she worked and �� represents the amount of money she earned.
Jada earns $7 per hr. mowing her neighbors’ lawns.
a. Who makes more money after working 12 hr.? How much more do they make? Explain your reasoning by creating a graph or a table.
b. What is the rate of change for each situation and what does it mean?
c. Using your graph or table, determine how long it would take each person to earn $150.
2. Clare and Han have summer jobs stuffing envelopes for two different companies.
Han earns $15 for every 300 envelopes he finishes.
Clare’s earnings can be seen in the table.
a. By creating a graph, show how much money each person makes after stuffing 1,500 envelopes.
b. What is the rate of change for each situation and what does it mean?
c. Using your graph, determine how much more money one person makes relative to the other after stuffing 1,500 envelopes. Explain or show your reasoning.
3. Tyler plans to start a lemonade stand and is trying to perfect his recipe for lemonade. He wants to make sure the recipe doesn’t use too much lemonade mix (lemon juice and sugar) but still tastes good.
Lemonade Recipe 1 is given by the equation �� = 4�� where �� represents the amount of lemonade mix in cups and �� represents the amount of water in cups (c.).
Lemonade Recipe 2 is given in the table.
a. If Tyler had 16 c. of lemonade mix, how many c. of water would he need for each recipe? Explain your reasoning by creating a graph or a table.
b. What is the rate of change for each situation and what does it mean?
c. Tyler has a 5-gallon jug (which holds 80 c.) to use for his lemonade stand and 16 c. of lemonade mix. Which lemonade recipe should he use? Explain or show your reasoning.
Lesson Summary
When 2 proportional relationships are represented in different ways, they can be compared by finding a common piece of information.
For example, Deon’s earnings are represented by the equation �� = 14.5��, where �� is the amount of money he earns, in dollars, for working �� hr.
The table shows information about Alexis’s pay.
Who is paid at a higher rate per hr.? How much more does that person have after 20 hr.?
Deon’s equation shows that the constant of proportionality relating his earnings to time worked is 14.50. This means he earns $14.50 per hr.
Alexis’s constant of proportionality can be found by dividing a value in the Earnings column by the corresponding value in the Time Worked column. Using the last row, the constant of proportionality for Alexis is 13.25, since 490.25 ÷ 37 = 13.25. An equation representing Alexis’s earnings is �� = 13.25��. This means she earns $13.25 per hr.
Deon is paid at a higher rate than Alexis. Deon earns $1.25 more per hr. than Alexis, which means that after 20 hr. of work, he has earned (20 ⋅ $1.25) or $25 more than Alexis.
Practice Problems
1. Andre and Priya are tracking the number of steps they walk. Andre records that he can walk 6,000 steps in 50 minutes (min.). Priya writes the equation �� = 118��, where �� is the number of steps and �� is the number of min. she walks, to describe her step rate. This week, Andre and Priya each walk for a total of 5 hr. Who walks more steps? How many more?
2. A contractor must haul a large amount of dirt to a work site. She collected information from two hauling companies.
EZ Excavation gives its prices in a table.
Happy Hauling Service gives its prices in a graph.
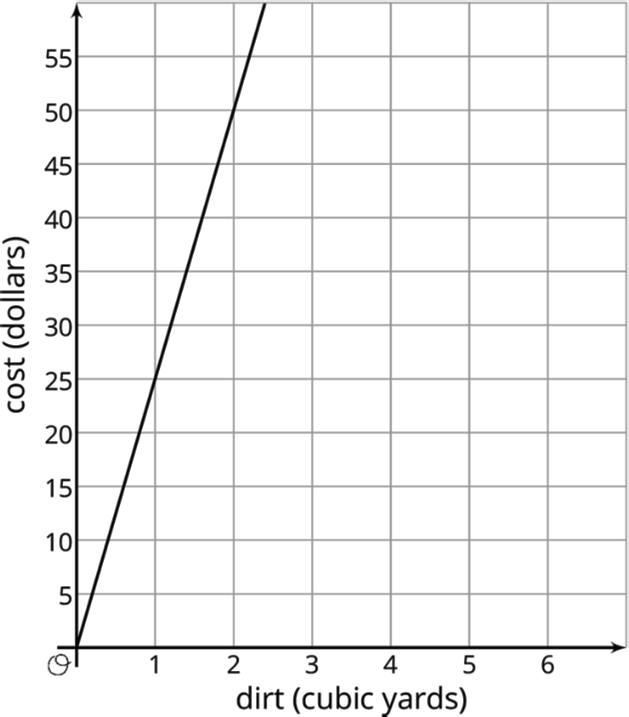
a. How much would each hauling company charge to haul 40 cubic yards (cu. yd.) of dirt? Explain or show your reasoning.
b. Calculate the rate of change for each relationship. What do they mean for each company?
c. If the contractor has 40 cu. yd. of dirt to haul and a budget of $1000, which hauling company should she hire? Explain or show your reasoning.
3. Find the coordinates of point �� in each diagram.
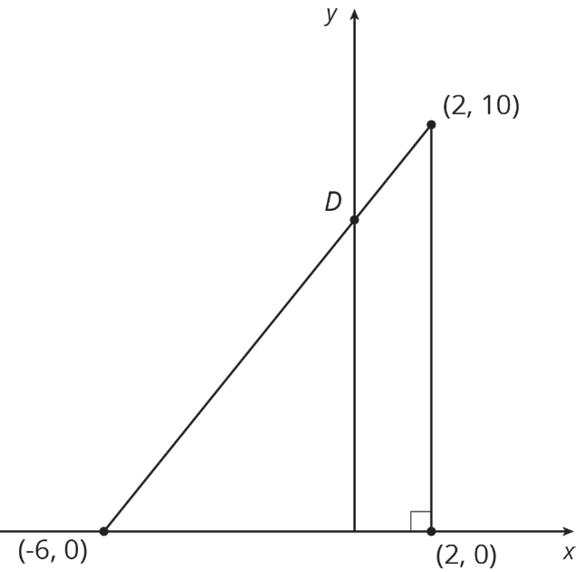
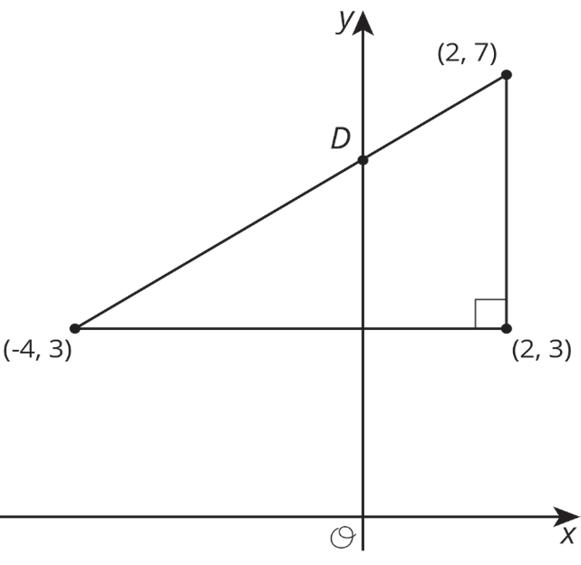
4. Select all the pairs of points so that the line between those points has slope 2 3 .
□ (0,0) and (2,3)
□ (0,0) and (3,2)
□ (1,5) and (4,7)
□ (−2, −2) and (4,2)
□ (20,30) and (−20, −30)
Unit 3, Lesson 3: Introduction to Linear Relationships
Warm-Up: Number Talk: Fraction Division
Find the value of 2 5 8 ÷ 1 2 .
Exploration Activity: Stacking Cups
We have two stacks of styrofoam cups.
• One stack has 6 cups (c.), and its height is 15 centimeters (cm).
• The other stack has 12 c., and its height is 23 cm.
How many cups are needed for a stack with a height of 50 cm?
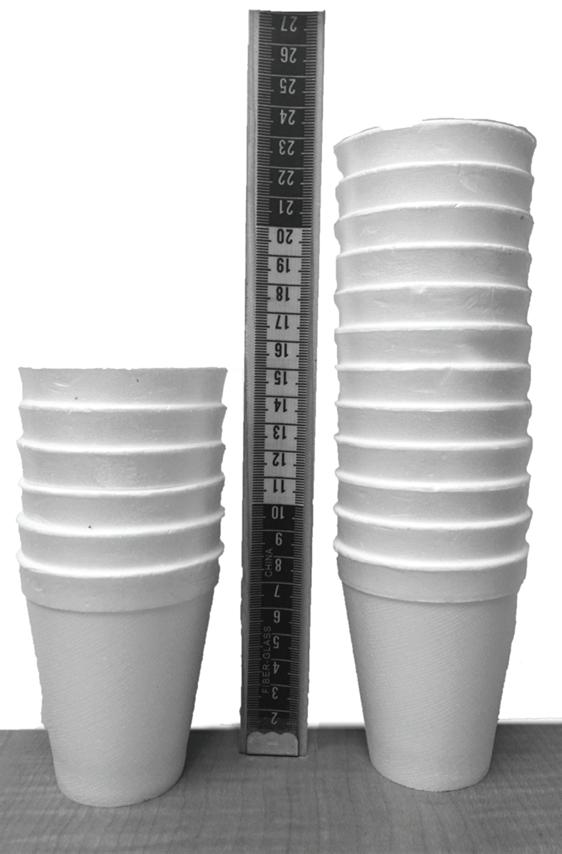
Collaborative
Activity: Connecting Slope to Rate of Change
1. If you didn’t create your own graph of the situation before, do so now.
2. What are some ways you can tell that the number of cups is not proportional to the height of the stack?
3. What is the slope of the line in your graph? What does the slope mean in this situation?
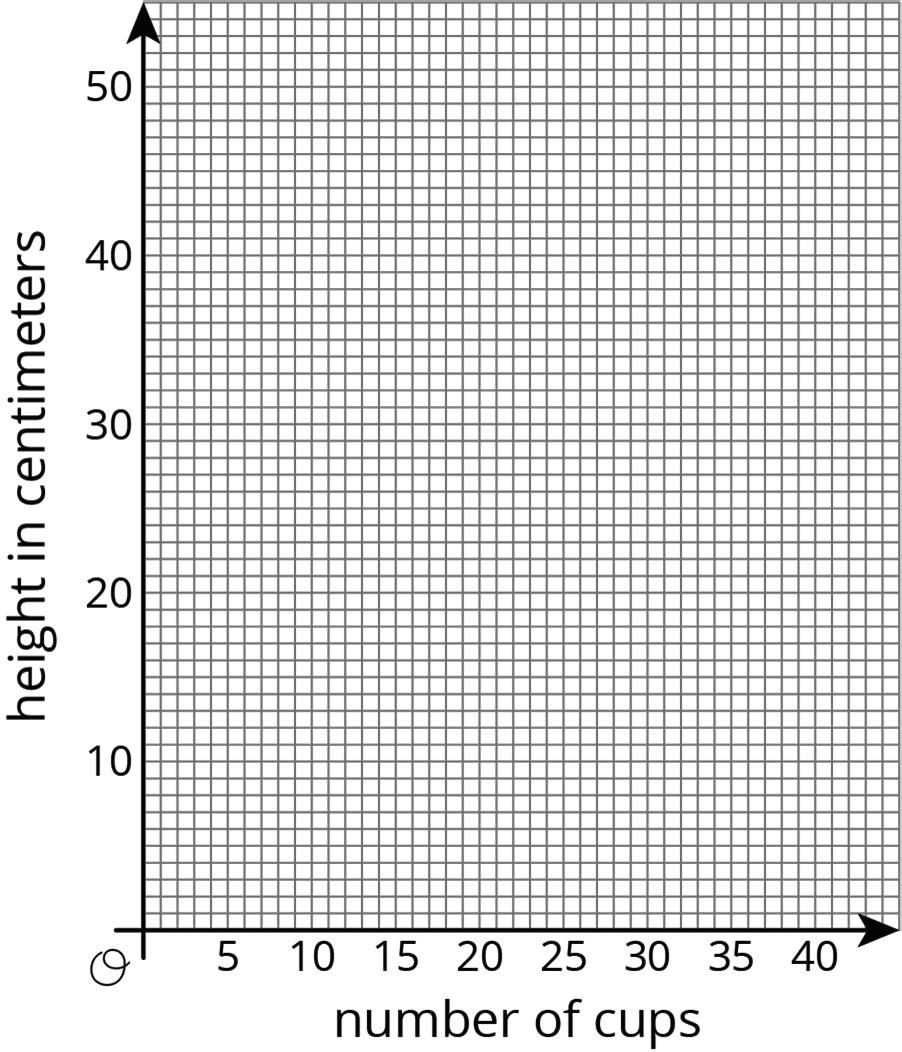
4. At what point does your line intersect the vertical axis? What do the coordinates of this point tell you about the cups?
5. How much height does each cup after the first add to the stack?
Lesson Summary
Shai starts babysitting and charges $10 for traveling to and from the job, plus $15 per hour (hr.). For every additional hour he works, he charges another $15. This is an example of a linear relationship.
A linear relationship between two quantities means they are related like this: When one quantity changes by a certain amount, the other quantity always changes by a set amount. In a linear relationship, one quantity has a constant rate of change with respect to the other.
The relationship is called linear because its graph is a line.
The graph representing Shai’s earnings based on how long he works would be a line that starts at $10 on the vertical axis and then increases by $15 each hr.
The rate of change can be determined using the graph. Because the rate of change is constant, any 2 points on the graph can be used. Divide the amount of vertical change between the 2 points by the amount of horizontal change. For example, take the points (2, 40) and (6, 100). They mean that Shai earns $40 for working 2 hr. and $100 for working 6 hr. The rate of change is 100 − 40 6 − 2 = 15 dollars per hr. Shai’s earnings increase $15 for each hr. of babysitting. Notice that this is the same method used to calculate the slope of the line. The rate of change of a linear relationship is the same as the slope of its graph.
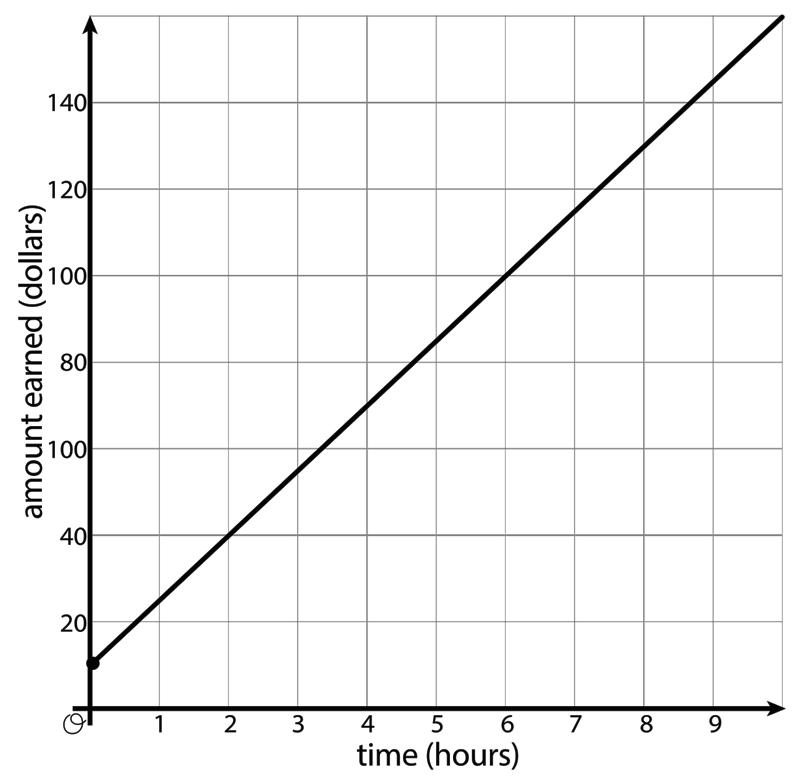
Recall that the graphs of proportional relationships contain the point (0, 0). Proportional relationships are just one type of linear relationship. The subsequent lessons in this unit will continue to explore the other type of linear relationship, where the quantities are not both 0 at the same time.
Practice Problems
1. A restaurant offers delivery for their pizzas. The total cost is a delivery fee added to the price of the pizzas. One customer pays $25 to have 2 pizzas delivered. Another customer pays $58 for 5 pizzas. How many pizzas are delivered to a customer who pays $80?
2. To paint a house, a painting company charges a flat rate of $500 for supplies, plus $50 for each hr. of labor.
a. How much would the painting company charge to paint a house that needs 20 hr. of labor? A house that needs 50 hr.?
b. Draw a line representing the relationship between ��, the number of hr. it takes the painting company to finish the house, and ��, the total cost of painting the house. Label the two points from the earlier question on your graph.
c. Find the slope of the line. What is the meaning of the slope in this context?
3. Tyler and Elena are on the cross-country team.
Tyler’s distances and times for a training run are shown on the graph.
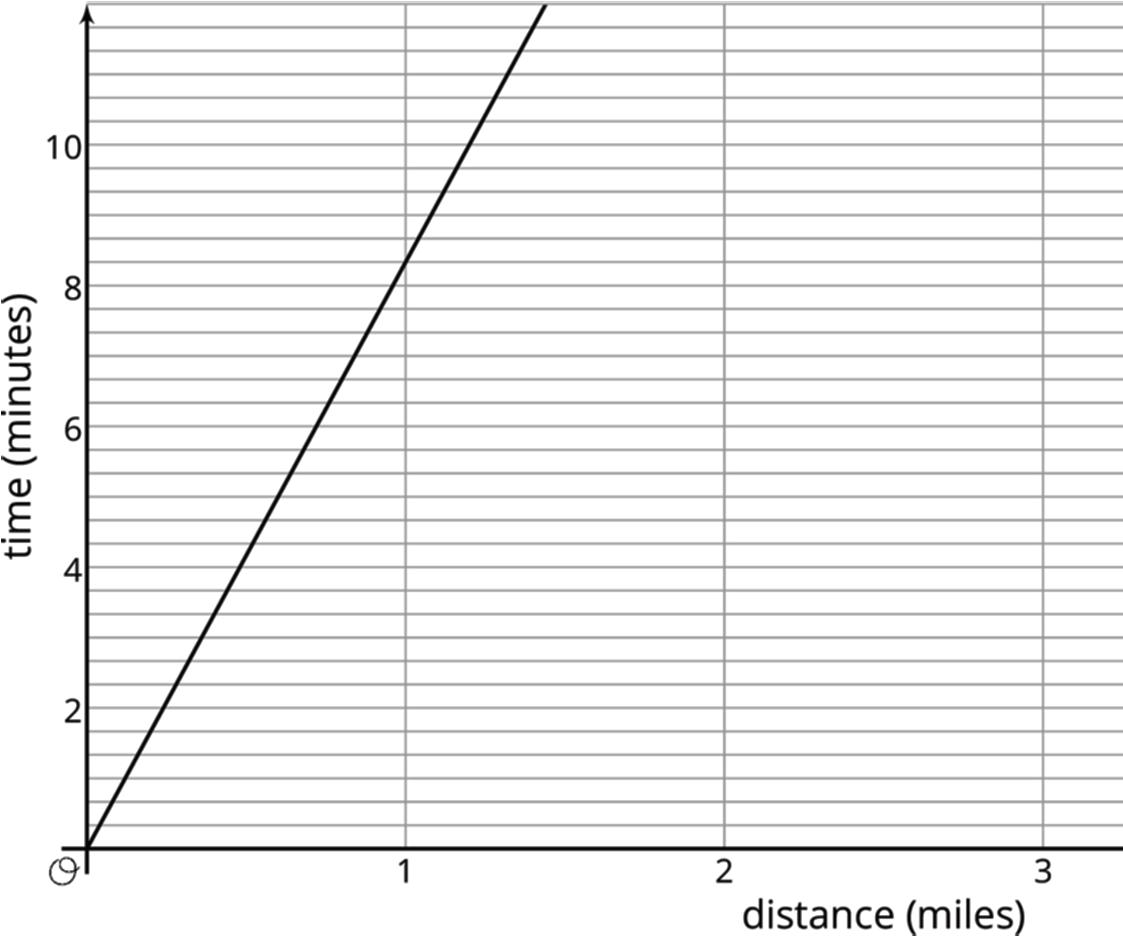
Elena’s distances and times for a training run are given by the equation �� = 8.5��, where �� represents distance, in miles (mi.), and �� represents time, in minutes (min.).
a. Who ran farther in 10 min.? How much farther? Explain how you know.
b. Calculate each runner’s pace in min. per mi.
c. Who ran faster during the training run? Explain or show your reasoning.
4. Write an equation for the line that passes through (2, 5) and (6, 7).
Unit 3, Lesson 4: More Linear Relationships
Warm-Up: Growing
Look for a growing pattern. Describe the pattern you see.
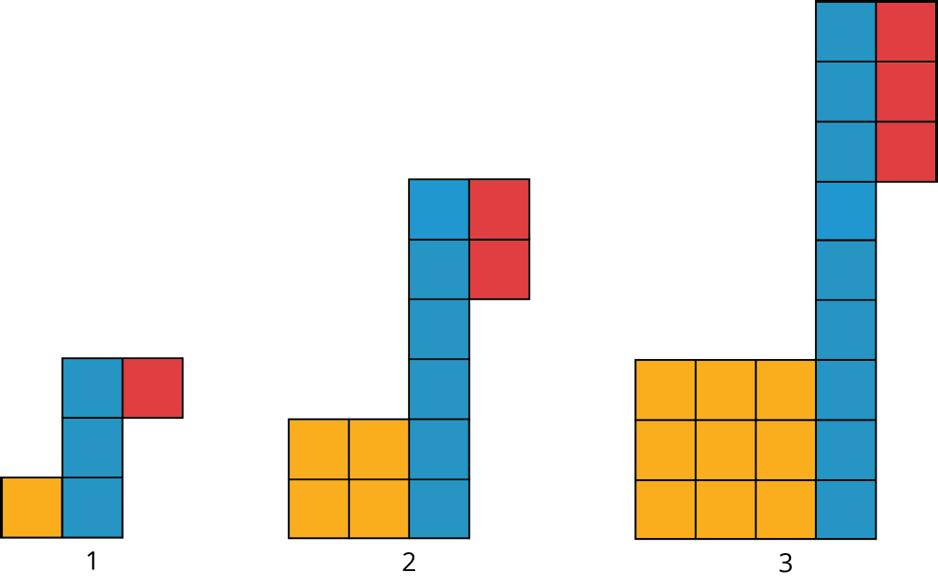
1. If your pattern continues growing in the same way, how many tiles of each color will be in the 4th and 5th diagram? The 10th diagram?
2. How many tiles of each color will be in the ��th diagram? Be prepared to explain your reasoning.
Collaborative Activity: Slopes, Vertical Intercepts, and Graphs
Your teacher will give you 6 cards describing different situations and 6 cards with graphs.
1. Match each situation to a graph.
2. Pick one proportional relationship and one non-proportional relationship and answer the following questions about them.
a. How can you find the slope from the graph? Explain or show your reasoning.
b. Explain what the slope means in the situation.
c. Find the point where the line crosses the vertical axis. What does that point tell you about the situation?
Exploration Activity: Summer Reading
Lin has a summer reading assignment. After reading the first 30 pages of the book, she plans to read 40 pages each day until she finishes. Lin makes the graph shown here to track how many total pages she’ll read over the next few days.
After day 1, Lin reaches page 70, which matches the point (1, 70) she made on her graph. After day 4, Lin reaches page 190, which does not match the point (4, 160) she made on her graph. Lin is not sure what went wrong since she knows she followed her reading plan.
1. Sketch a line showing Lin’s original plan on the axes.
2. What does the vertical intercept mean in this situation? How do the vertical intercepts of the two lines compare?

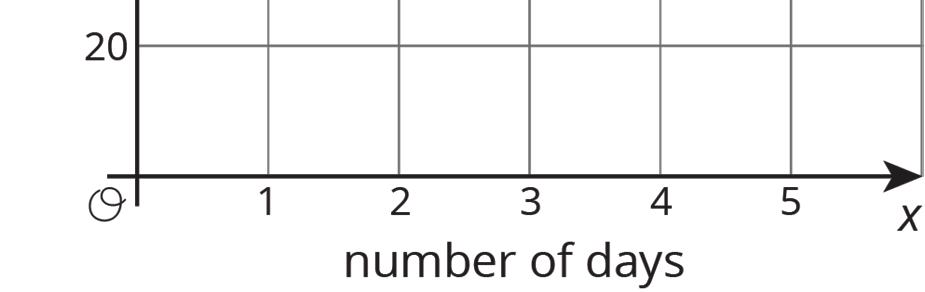
3. What does the slope mean in this situation? How do the slopes of the two lines compare?
Lesson Summary
At the start of summer break, Jada and Lin decide to save some of the money that they earn helping out their neighbors over the summer. Jada starts by putting $20 in a savings jar in her room and plans to save $10 a week. Lin starts by putting $10 in a savings jar in her room and plans to save $20 a week. The graphs shown represent how much money each of them will have saved after 10 weeks if they each follow their plans.
The value where a line intersects the vertical axis is called the vertical intercept. When the vertical axis is labeled with a variable like ��, this value is also often called the ��-intercept.
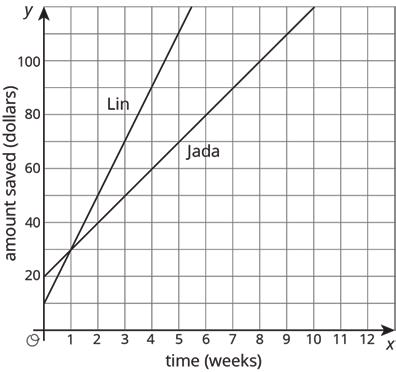
The ��-intercept is the value of �� at the point where a line or graph intersects the ��-axis. The value of �� is 0 at this point.
Jada’s graph has a ��-intercept of $20, while Lin’s graph has a ��-intercept of $10. These values reflect the amount of money they each started with. At the end of 1 week, they will have saved the same amount, $30. But after week 1, Lin will be saving more money per week, so she will end up saving more money over the summer if they each follow their plans. This is shown in the slope of the lines, where the slope of the line representing Lin’s savings is steeper than Jada’s because Lin’s savings are growing at a faster rate of change.
Practice Problems
1. Explain what the slope and ��-intercept mean in each situation.
a. A graph represents the perimeter, ��, in units, for an equilateral triangle with side lengths of �� units. The slope of the line is 3, and the ��-intercept is 0.
b. A graph represents the amount of money, ��, in dollars, in a cash box after �� tickets have been purchased for carnival games. The slope of the line is 1 4 , and the ��-intercept is 8.
c. A graph represents the number of chapters read, ��, after �� days. The slope of the line is 5 4 , and the ��-intercept is 2.
d. A graph represents the cost, ��, in dollars, of a muffin delivery, and the number of muffins ordered, ��. The slope of the line is 2, and the ��-intercept is 3.
2. Customers at the gym pay a membership fee to join and then a fee for each class they attend. Here is a graph that represents the situation.
a. What does the slope of the line shown by the points mean in this situation?
b. What does the vertical intercept mean in this situation?
Review Problem
3. The graph shows the relationship between the number of cups (c.) of flour and the number of c. of sugar in Lin’s favorite brownie recipe.
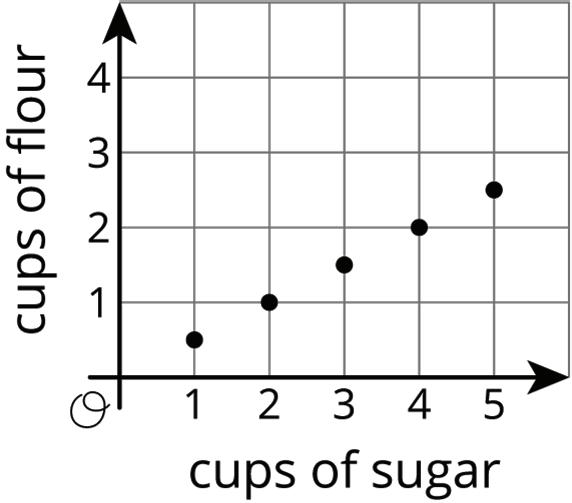
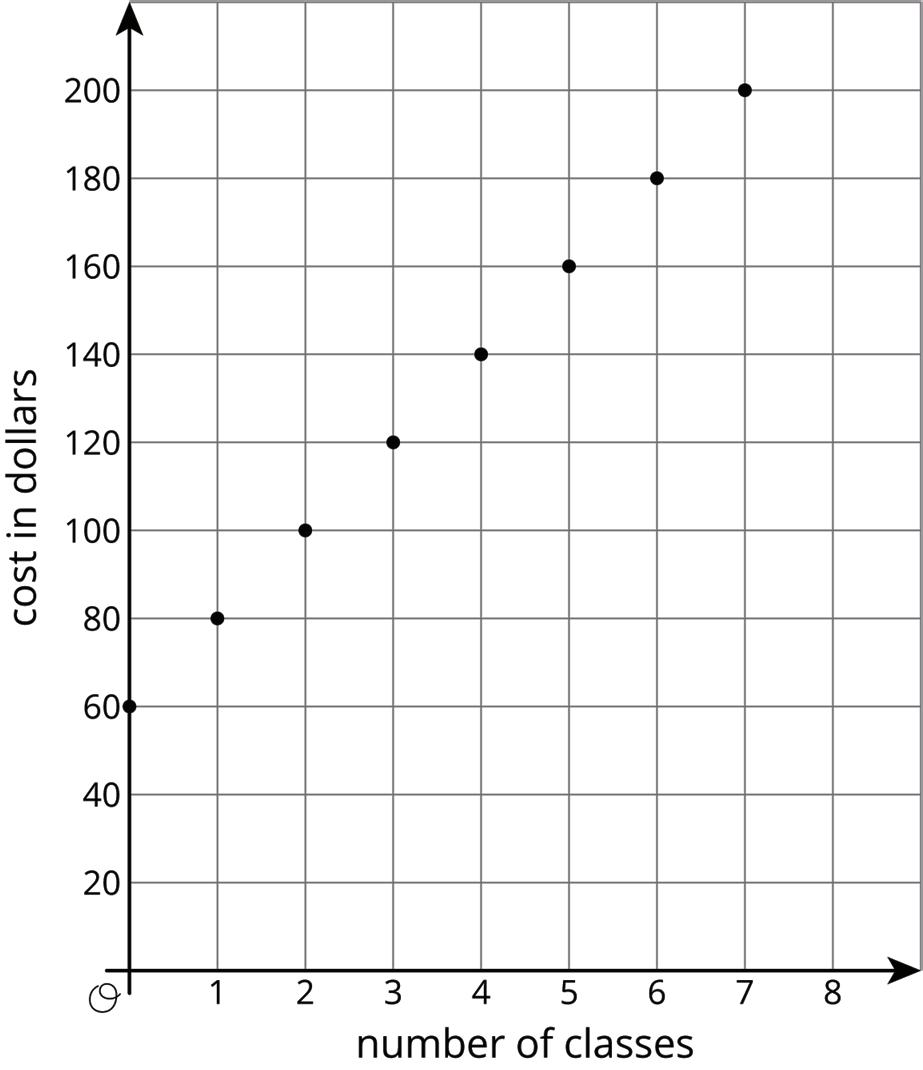
The table shows the amounts of flour and sugar needed for Noah’s favorite brownie recipe.
a. Noah and Lin buy a 12-cup bag of sugar and divide it evenly to make their recipes. If they each use all their sugar, how much flour do they each need?
b. Noah and Lin buy a 10-cup bag of flour and divide it evenly to make their recipes. If they each use all their flour, how much sugar do they each need?
Unit 3, Lesson 5: Representations of Linear Relationships
Warm-Up: Estimation: Which Holds More?
Which glass will hold the most water? The least?

Exploration Activity: Rising Water Levels
1. Record data from your teacher’s demonstration in the table. (You may not need all the rows.)
2. What is the volume, ��, in the cylinder after you add �� objects? Explain your reasoning.
3. If you wanted to make the water reach the highest mark on the cylinder, how many objects would you need?
4. Plot and label points that show your measurements from the experiment.
5. The points should fall on a line. Use a ruler to graph this line.
6. Compute the slope of the line. What does the slope mean in this situation?

7. What is the ��-intercept? What does ��-intercept mean in this situation?
Guided Activity: Calculate the Slope
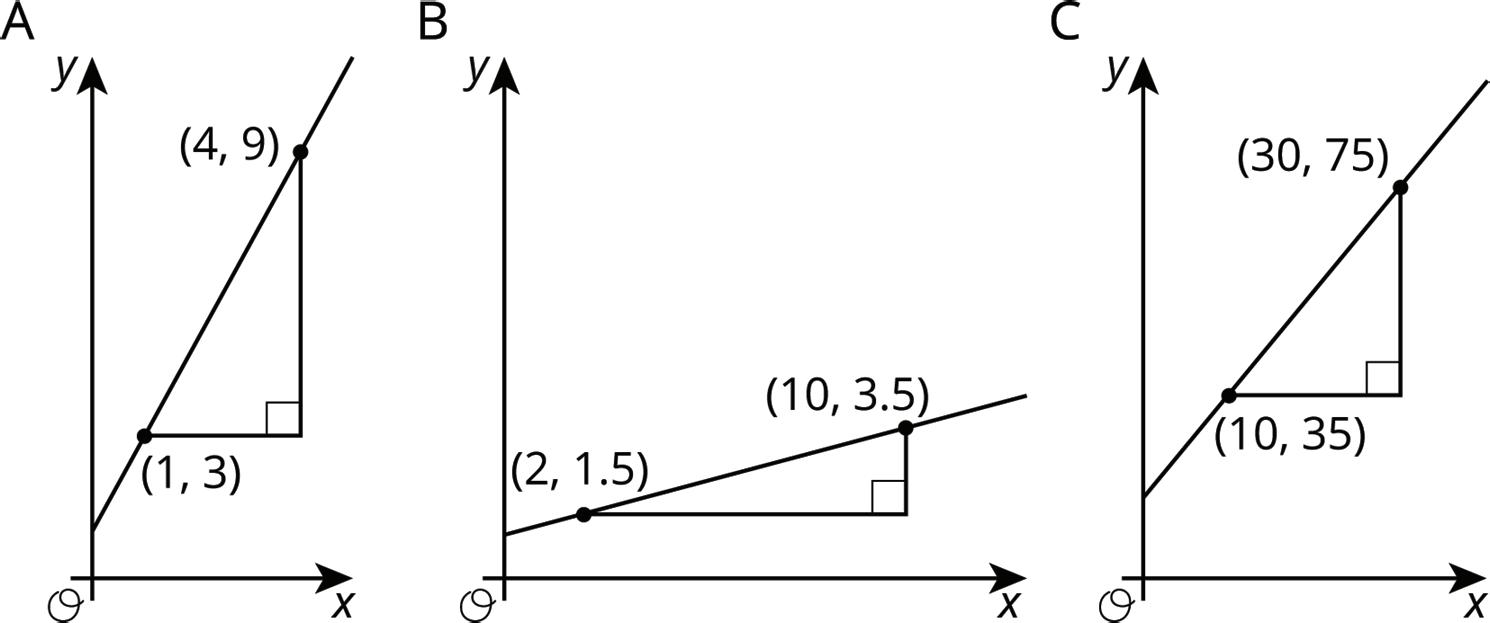
1. For each graph, complete the table.
2. Describe a procedure for finding the slope between any two points on a line.
3. Write an expression for the slope of the line in the graph using the letters ��, ��, ��, and ��.
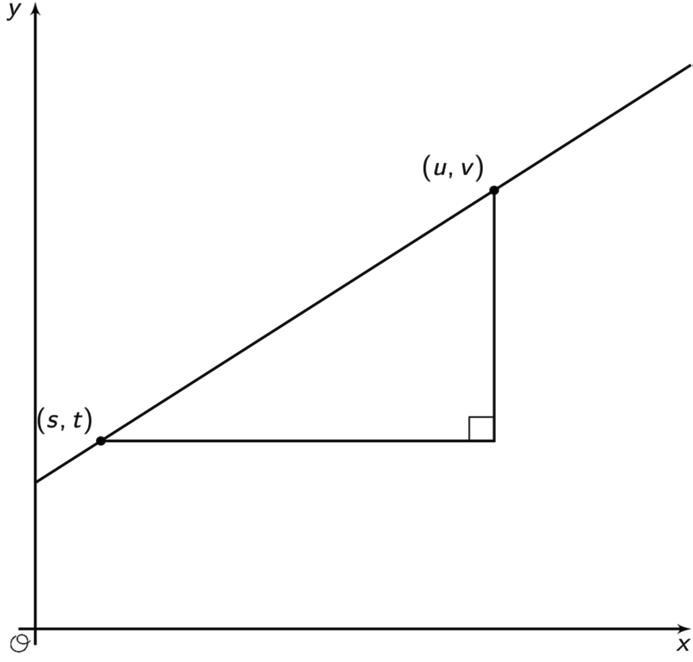
Lesson Summary
Suppose there is a glass cylinder filled with 50 mL of water and a bunch of marbles that are each 3 mL in volume. If the marbles are dropped into the cylinder one at a time, the height of the water will increase by the same amount, increasing the volume by 3 mL for each marble added. This constant rate of change means there is a linear relationship between the number of marbles and the volume. Add 1 marble and the volume goes up 3 mL. Add 2 marbles and the volume goes up 6 mL. Add �� marbles and the volume goes up 3�� mL.
Reasoning this way, the volume, ��, in mL, for �� marbles is �� = 3�� + 50. Any linear relationship can be expressed in the form �� = ���� + �� using just the rate of change, ��, and the initial amount, ��. The 3 represents the rate of change, or slope, of the graph, and the 50 represents the initial amount, or ��-intercept, of the graph. Equations will be explored more in future lessons.
Any 2 points on a line can be used to determine the slope. For the graph shown, 2 of the points on the line are (3, 3) and (9, 5), shown on the graph with a slope triangle.
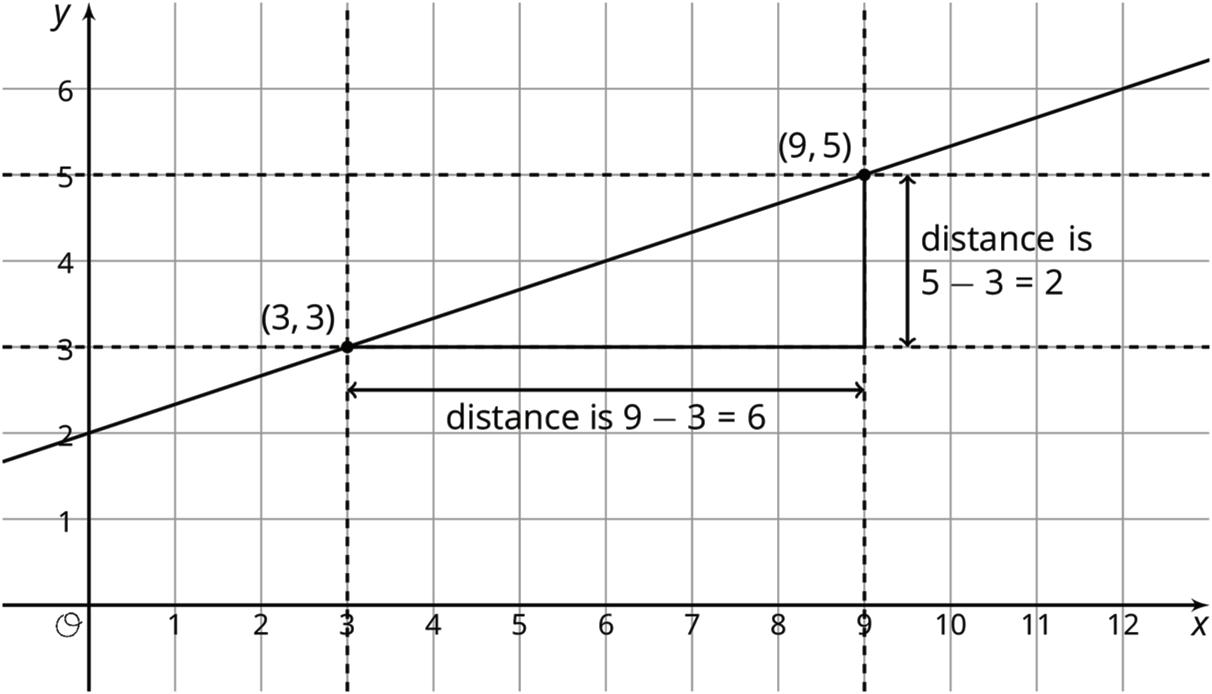
The slope of this line is the quotient of the length of the vertical side of the slope triangle and the length of the horizontal side of the slope triangle. So, the slope, ��, is vertical change horizontal change = 2 6 = 1 3 . The ��-intercept, ��, is 2. Both values can be used to write the equation for this line, �� = 1 3 �� + 2.
Practice Problems
1. Create a graph that shows three linear relationships with different ��-intercepts using the following slopes, and write an equation for each line.
Slopes: • 1 5 • 3 5 • 6 5

2. The graph shows the height, in inches (in.), ℎ, of a bamboo plant �� months after it has been planted.
a. Write an equation that describes the relationship between ℎ and ��.
b. After how many months will the bamboo plant be 66 in. tall? Explain or show your reasoning.
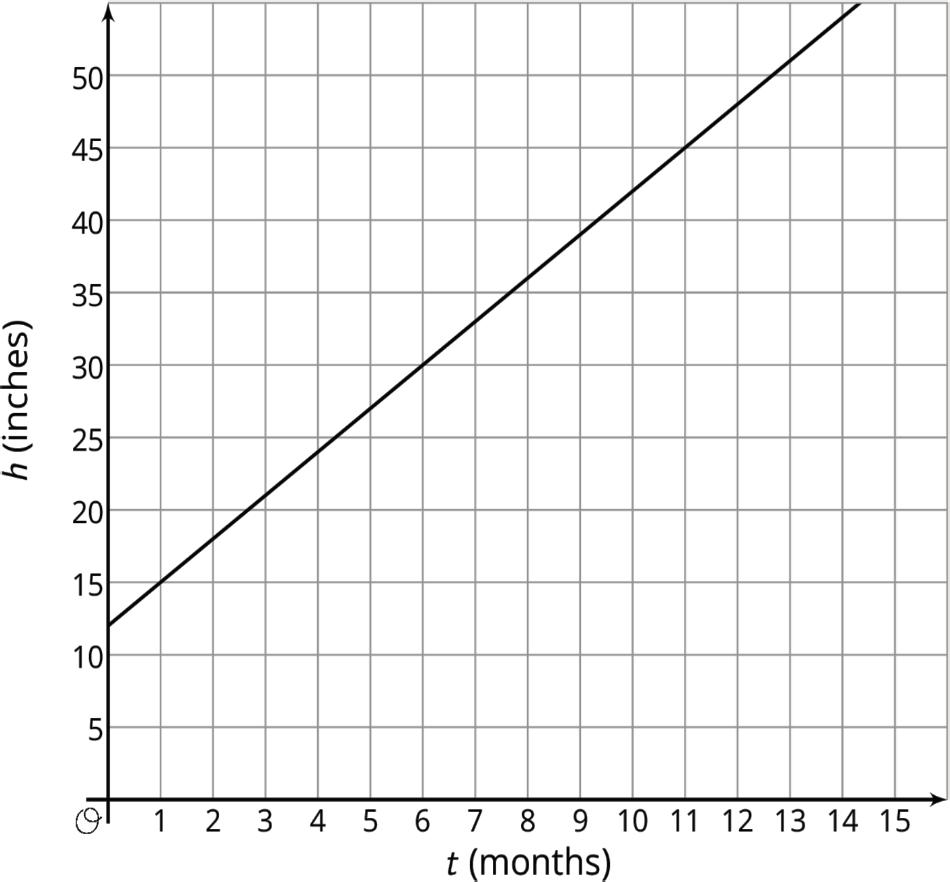
3. Here are recipes for two different banana cakes. Information for the first recipe is shown in the table.
The relationship between cups (c.) of flour, ��, and c. of sugar, ��, in the second recipe is �� = 7 4 ��
a. If you used 4 c. of sugar, how much flour does each recipe need?
b. What is the constant of proportionality for each situation and what does it mean?
4. Show that the two figures are similar by identifying a sequence of translations, rotations, reflections, and dilations that takes the larger figure to the smaller one.
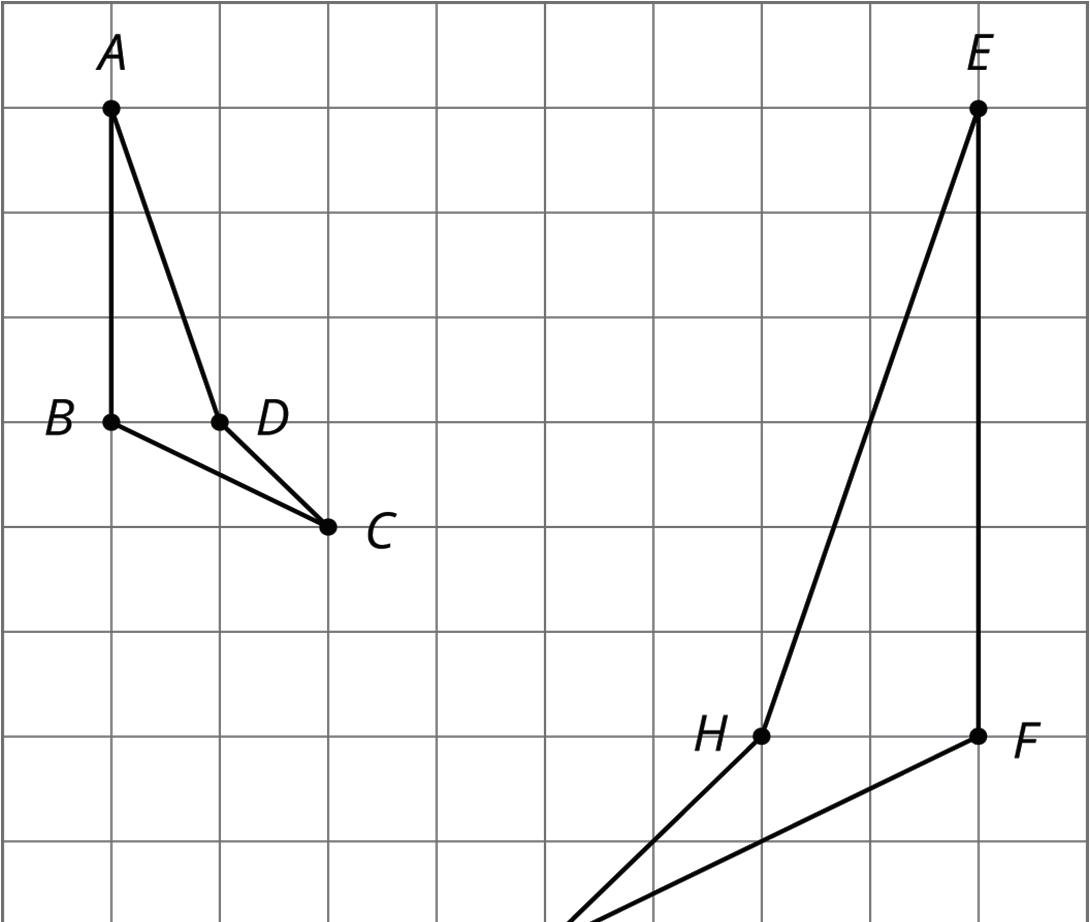
Unit 3, Lesson 6: Exploring Equations of Lines
Warm-Up: Lines That Are Translations
The diagram shows several lines. You can only see part of the lines, but they actually continue forever in both directions.
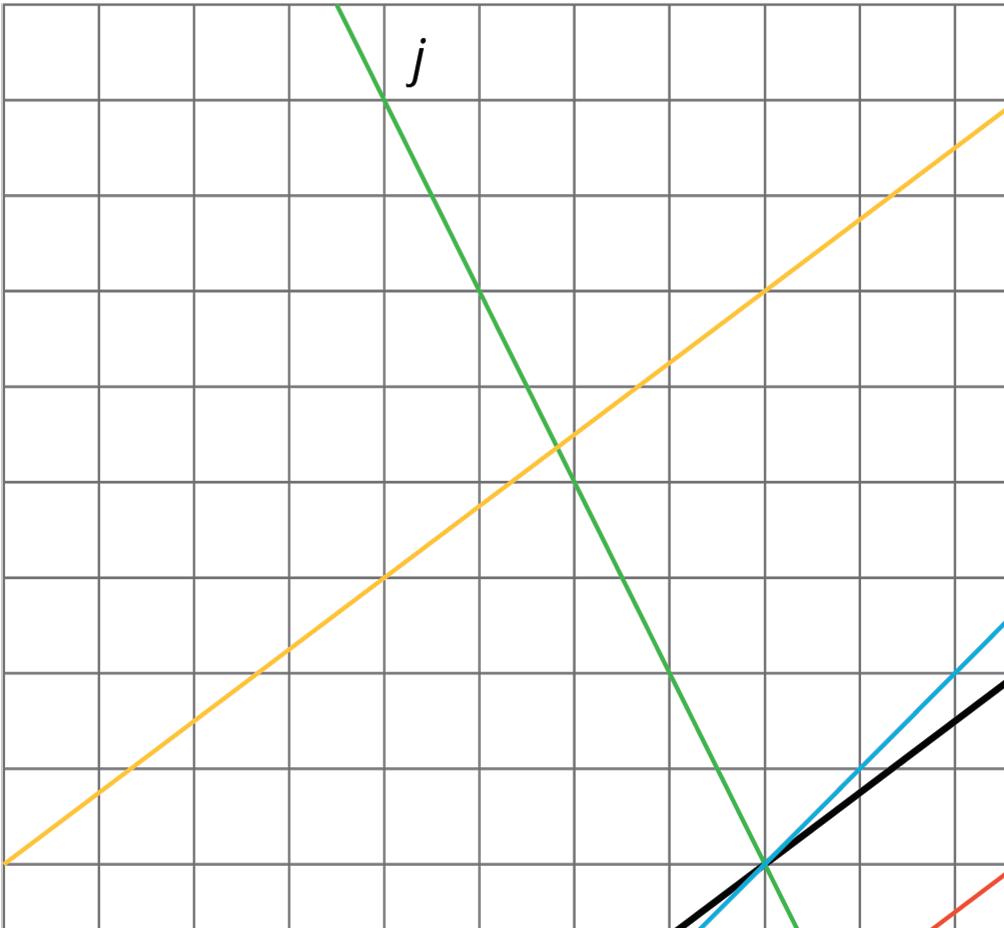
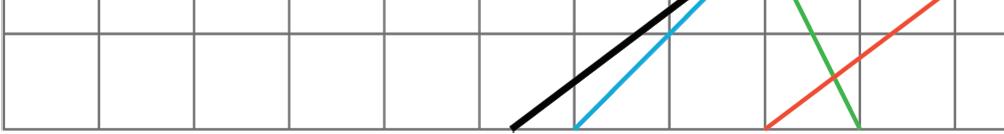
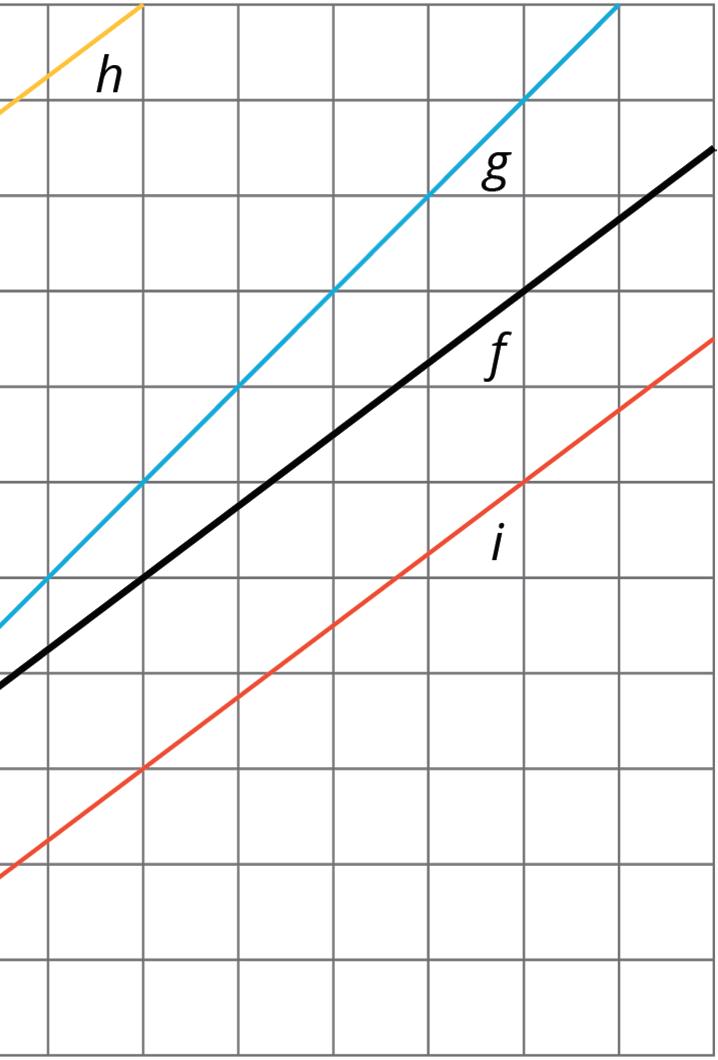
1. Which lines are images of line �� under a translation?
2. For each line that is a translation of ��, draw an arrow on the grid that shows the vertical translation distance.
Exploration Activity: Increased Savings
1. Diego earns $10 per hour (hr.) babysitting. Assume that he has no money saved before he starts babysitting and plans to save all of his earnings. Graph how much money, ��, he has after �� hr. of babysitting.
2. Now imagine that Diego started with $30 saved before he starts babysitting. On the same set of axes, graph how much money, ��, he would have after �� hr. of babysitting.
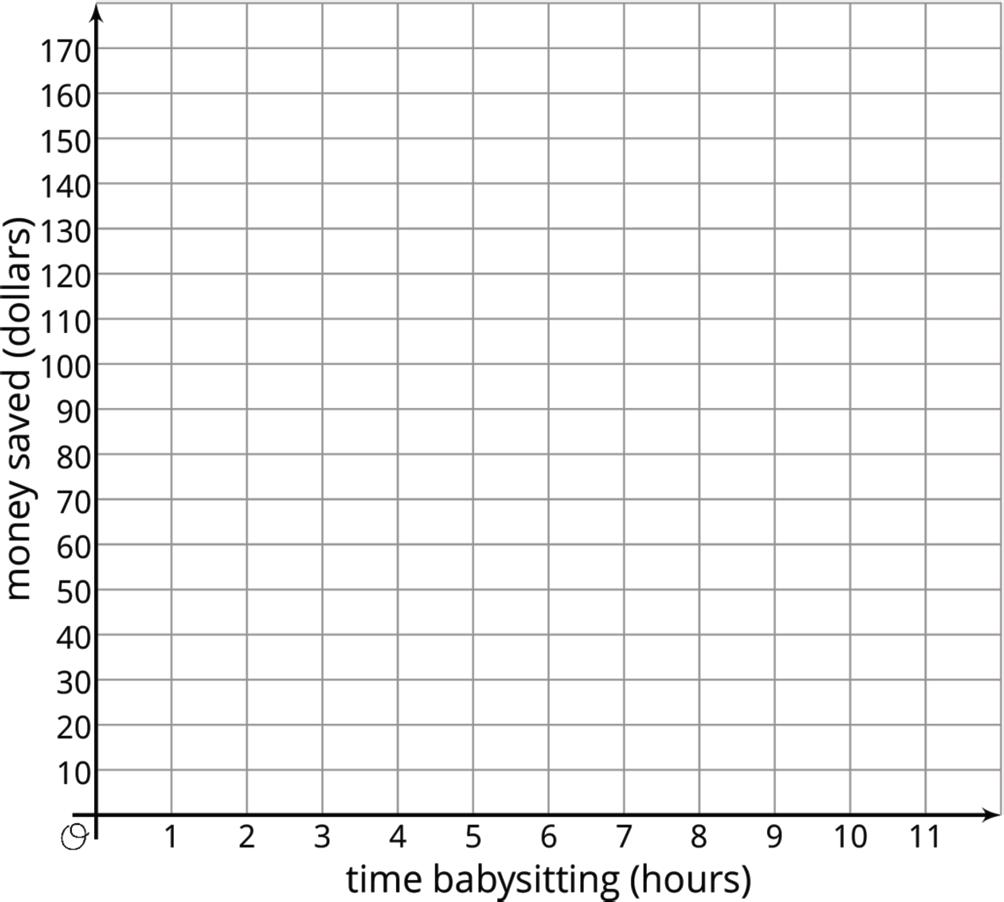
3. Compare the second line with the first line. How much more money does Diego have after 1 hr. of babysitting? 2 hr.? 5 hr.? �� hr.?
4. Write an equation for each line.
Collaborative Activity: Translating a Line
This graph shows two lines. Line �� goes through the origin (0, 0). Line ℎ is the image of line �� under a translation.
1. Select all of the equations whose graph is line ℎ.
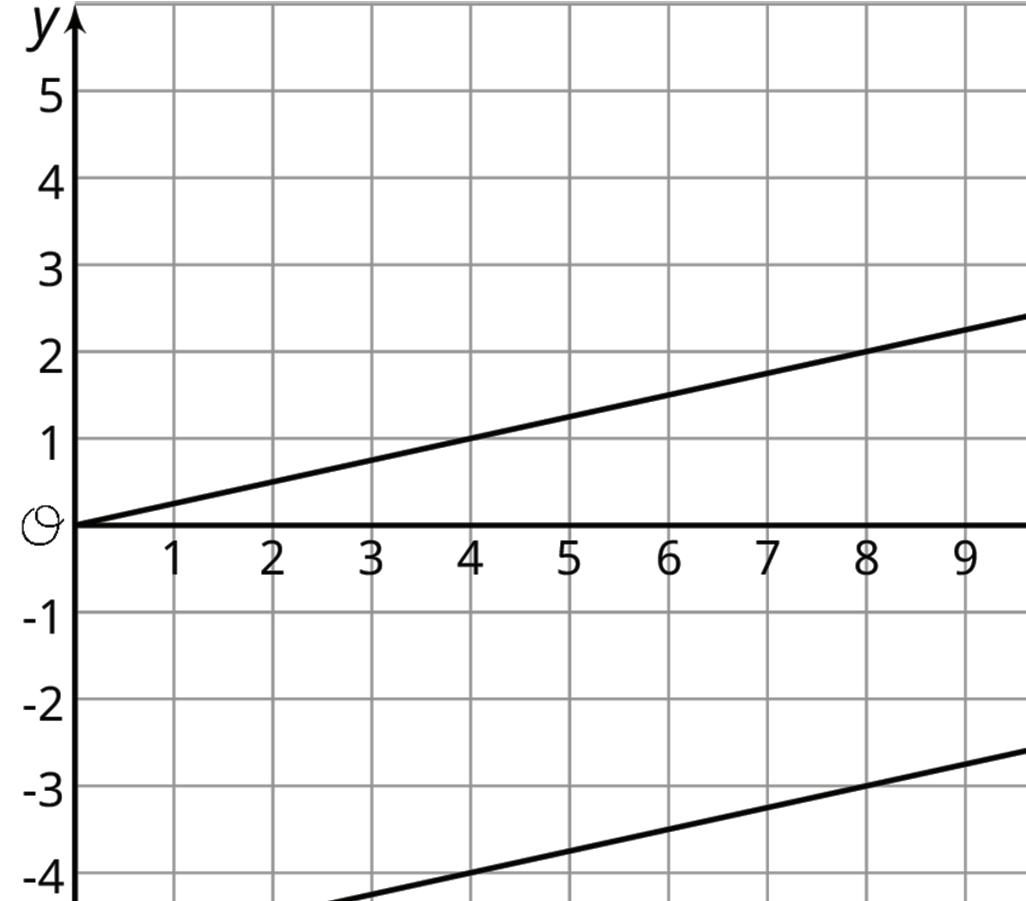
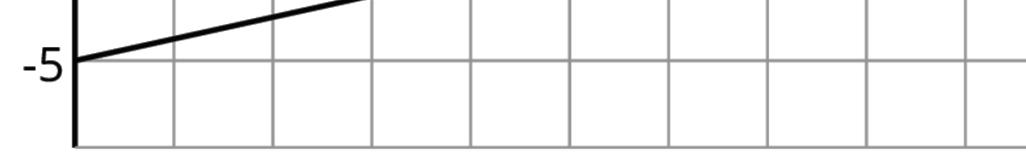
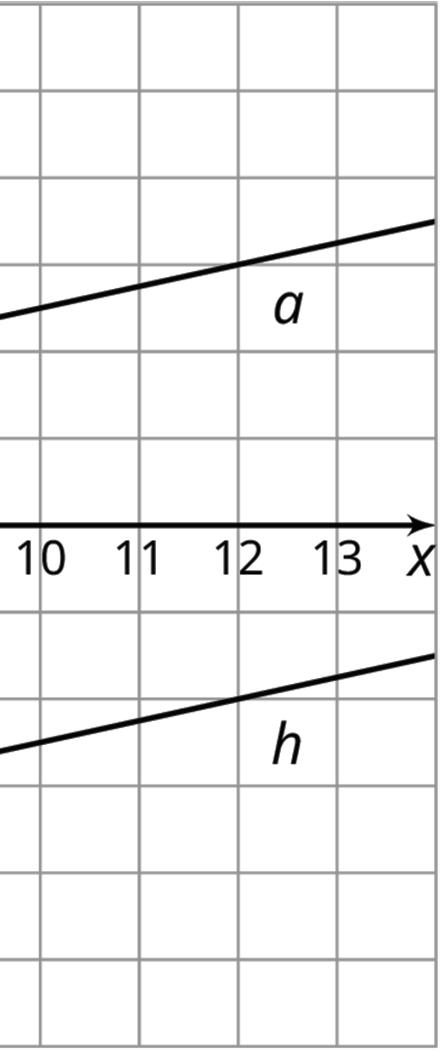
2. Your teacher will give you 12 cards. There are 4 pairs of lines, A–D, showing the graph, ��, of a proportional relationship and the image, ℎ, of �� under a translation. Match each line ℎ with an equation and either a table or description. For the line with no matching equation, write one on the blank card.
Lesson Summary
During an early winter storm, the snow fell at a rate of 1 2 of an inch (in.) per hr. This rate of change, 1 2 , can be seen in both the equation that represents the snowfall in the storm, �� = 1 2 ��, and in the slope of the line representing the snowfall in the storm, where �� is the number of hours since the storm began and �� is the depth of the snow, in inches.
In addition to there being a linear relationship between the time since the beginning of the storm and the depth of the snow, both the equation and the graph demonstrate that this is a proportional relationship, since the depth of snow was 0 at the beginning of the storm, and the ratio of �� �� is equivalent for every other point on the line.
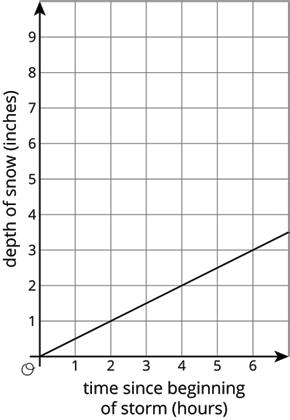
During a mid-winter storm, the snow again fell at a rate of 1 2 of an in. per hr., but this time, there was already 5 in. of snow on the ground. The line representing this storm can be graphed on the same axes as the first storm by taking all the points on the graph of the first storm and translating them up 5 in.
Two hr. after each storm begins, 1 in. of new snow has fallen. For the first storm, this means there is now 1 in. of snow on the ground. For the second storm, this means there is now 6 in. of snow on the ground. Unlike the first storm, the second is not a proportional relationship since the line representing the second storm has a ��-intercept of 5 rather than 0. The equation representing this storm, �� = 1 2 �� + 5, is in the form �� = ���� + ��, where �� is the rate of change, or slope, of the graph, and �� is the initial value, or ��-intercept, of the graph.

Practice Problems
1. Select all the equations that have graphs with the same ��-intercept.
□ �� = 3�� − 8
□ �� = 3�� − 9
□ �� = 3�� + 8
□ �� = 5�� − 8
□ �� = 2�� − 8
□ �� = 1 3 �� − 8
2. A cable company charges $70 per month for cable service to existing customers.
a. Find a linear equation representing the relationship between ��, the number of months of service, and ��, the total amount paid in dollars by an existing customer.
b. For new customers, there is an additional one-time $100 service fee. Repeat the previous problem for new customers.
c. When the two equations are graphed in the coordinate plane, how are they related to each other geometrically?
Review Problems
3. A mountain road is 5 miles (mi.) long and gains elevation at a constant rate. After 2 mi., the elevation is 5,500 feet (ft.) above sea level. After 4 mi., the elevation is 6,200 ft. above sea level.
a. Find the elevation of the road at the point where the road begins.
b. Describe where you would see the point in part A on a graph where �� represents the elevation, in ft., and �� represents the distance along the road, in mi.
4. Match each graph to a situation.
a. The graph represents the perimeter, ��, in units, for an equilateral triangle with side length of �� units. The slope of the line is 3.
b. The amount of money, ��, in a cash box after �� tickets are purchased for carnival games. The slope of the line is 1 4 .
c. The number of chapters read, ��, after �� days. The slope of the line is 5 4 .
d. The graph shows the cost in dollars, ��, of a muffin delivery and the number of muffins, ��, ordered. The slope of the line is 2.
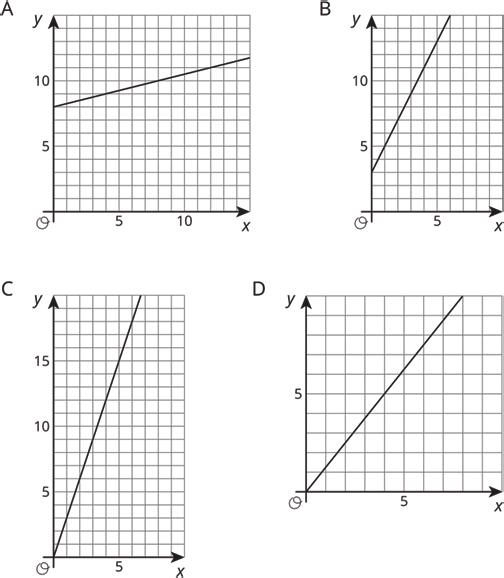
Unit 3, Lesson 7: Slopes Don’t Have to Be Positive
Warm-Up: Which One Doesn’t Belong: Odd Line Out
Which line doesn’t belong?
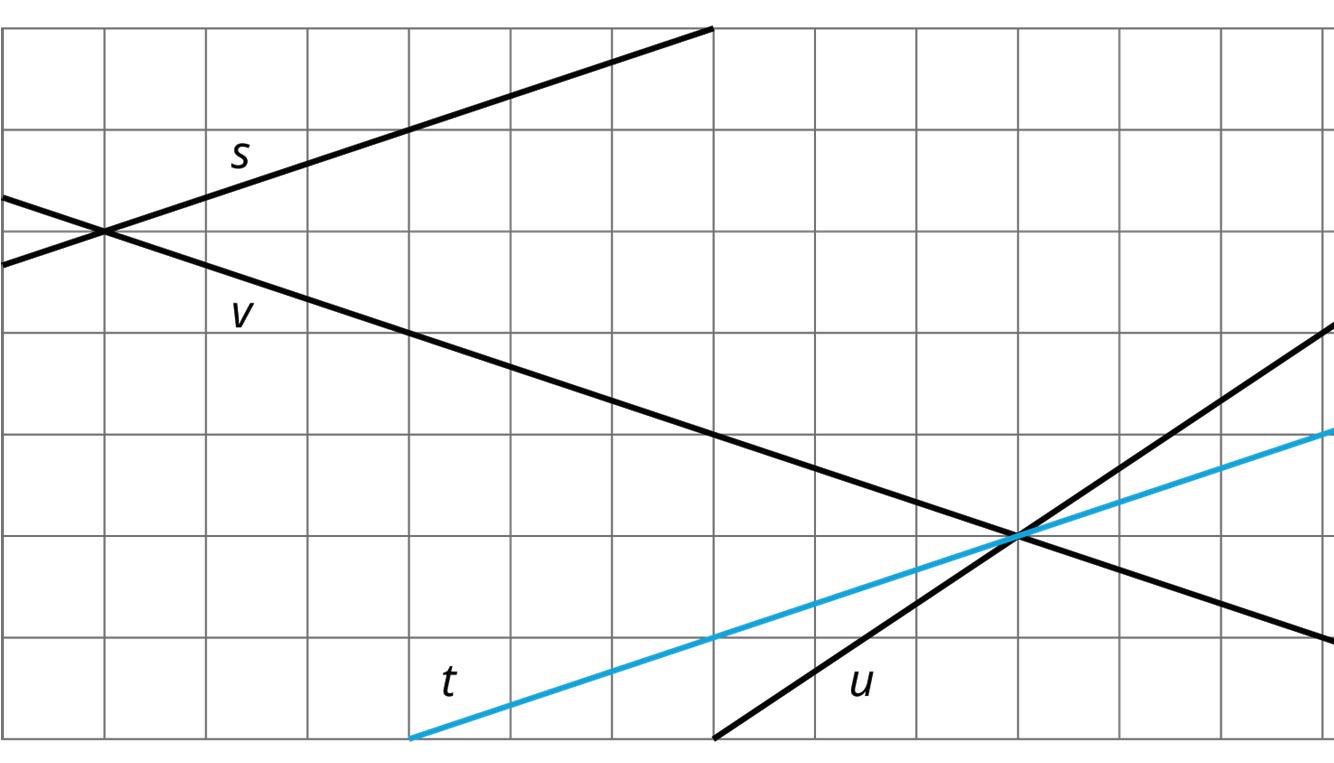
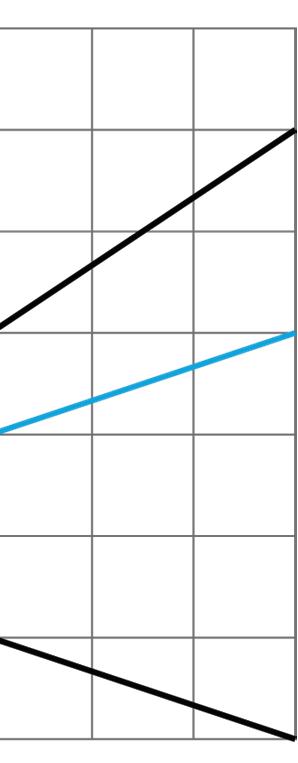
Guided Activity: Stand Clear of the Closing Doors, Please
Noah put $40 on his fare card. Every time he rides public transportation, $2.50 is subtracted from the amount available on his card.
1. How much money, in dollars, is available on his card after he takes
a. 0 rides?
b. 1 ride?
c. 2 rides?
d. �� rides?
2. Graph the relationship between amount of money on the card and number of rides.
3. How many rides can Noah take before the card runs out of money? Where do you see this number of rides on your graph?
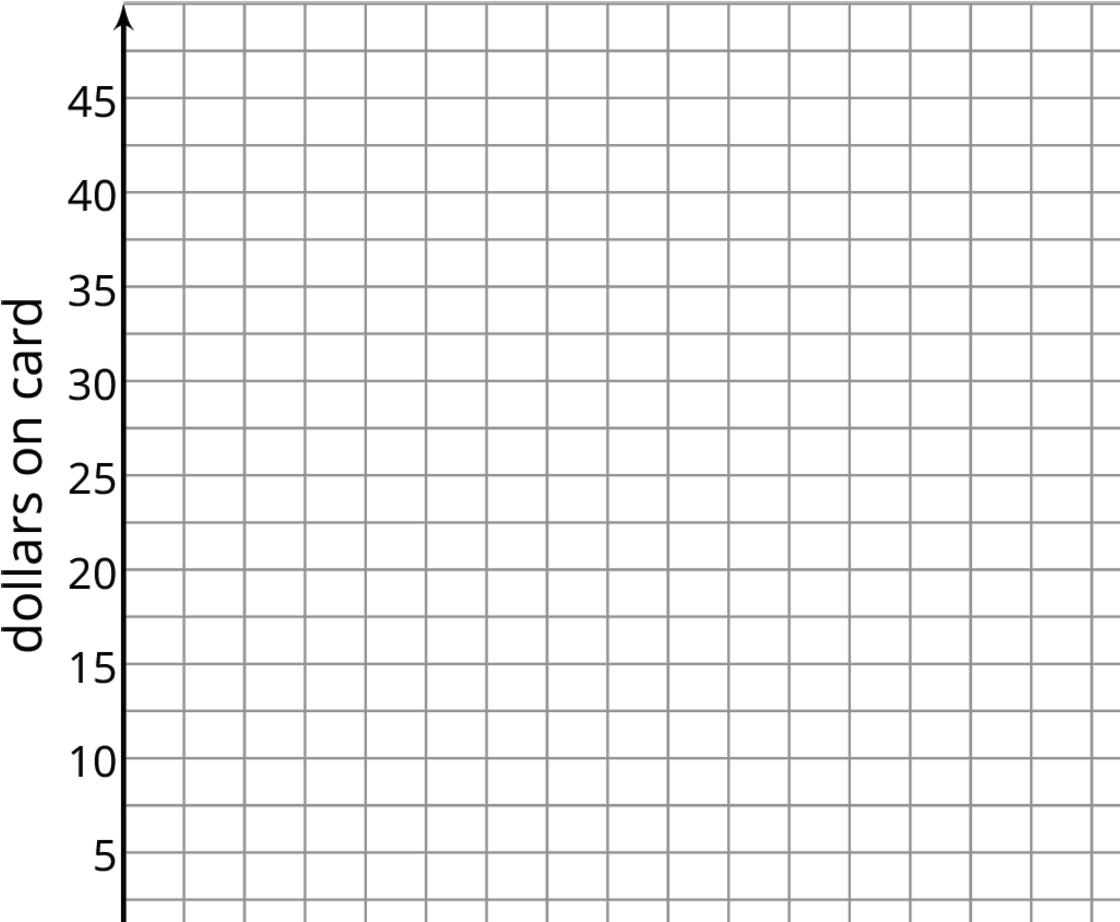
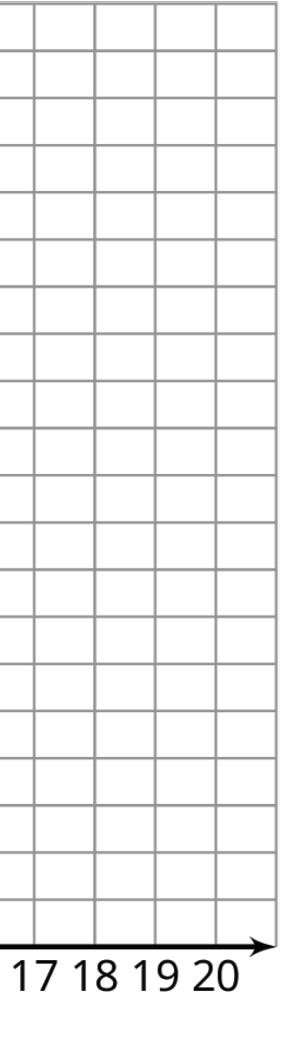
Exploration Activity: Travel Habits in July
Here is a graph that shows the amount on Han’s fare card for every day of last July.
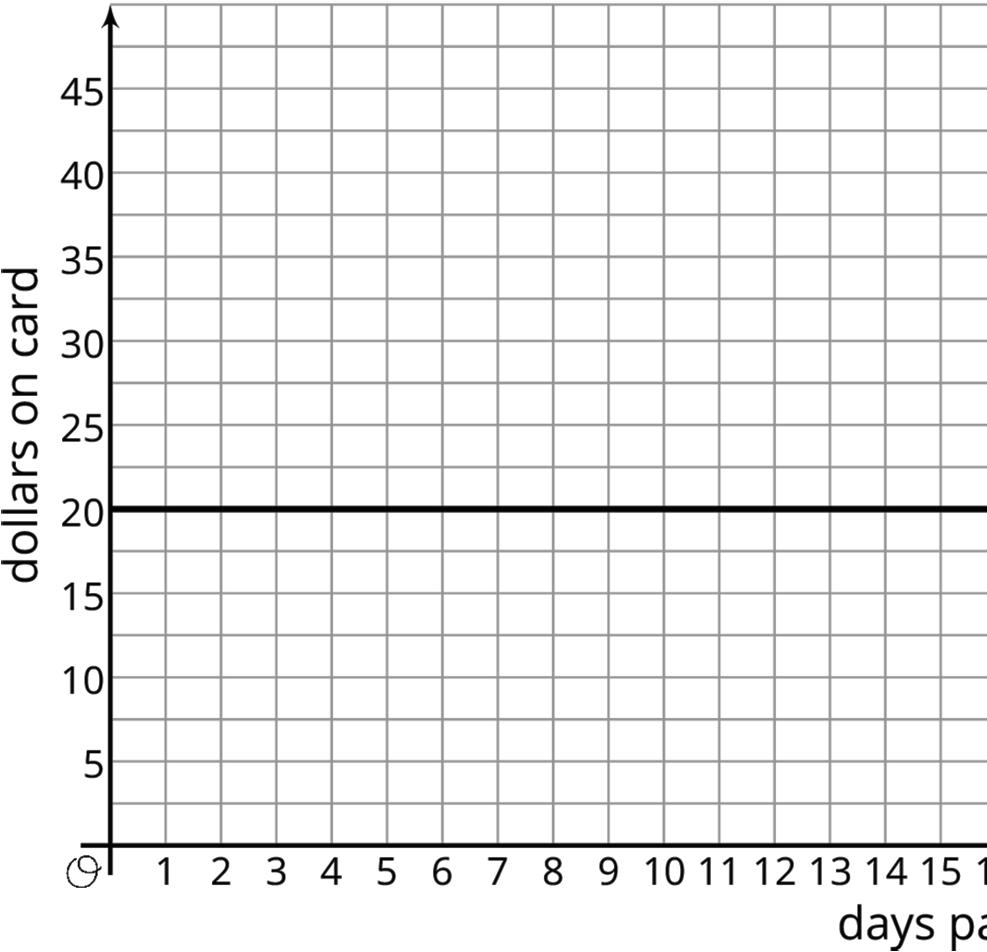
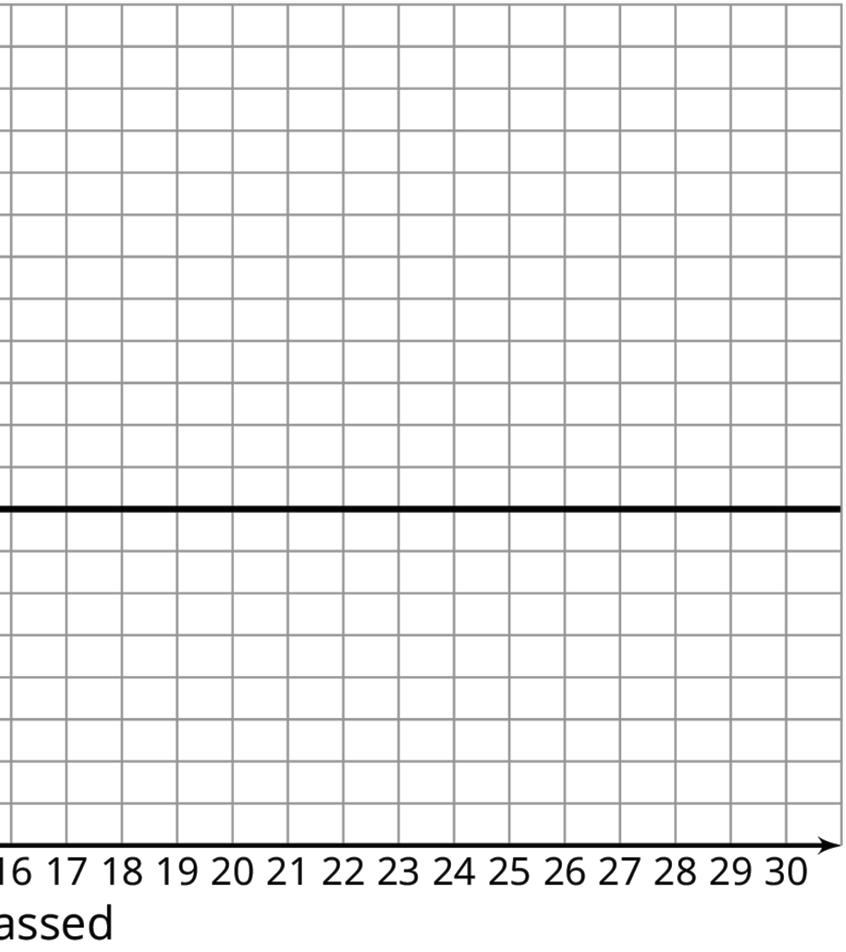
1. Describe what happened with the amount on Han’s fare card in July.
2. Plot and label 3 different points on the line.
3. Write an equation that represents the amount on the card in July, ��, after �� days.
4. What value makes sense for the slope of the line that represents the amounts on Han’s fare card in July?
Collaborative Activity: Payback Plan
Elena borrowed some money from her brother. She pays him back by giving him the same amount every week. The graph shows how much she owes after each week.
Answer and explain your reasoning for each question.
1. What is the slope of the line?
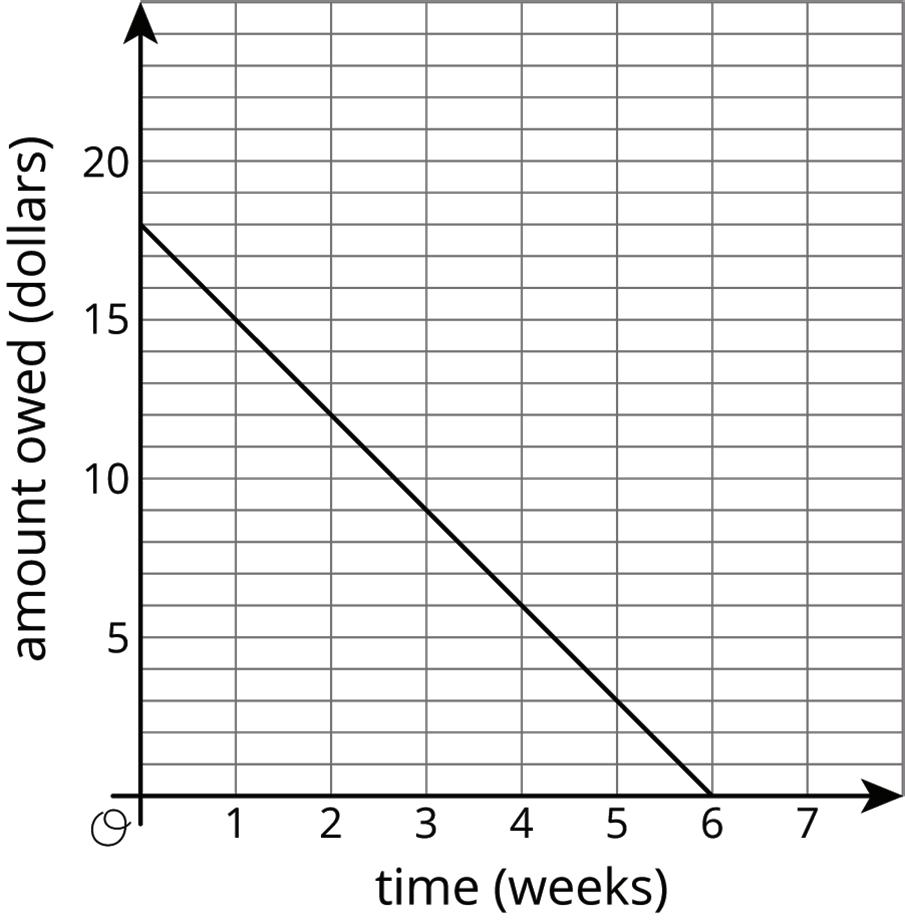
2. Explain how you know whether the slope is positive or negative.
3. What does the slope represent in this situation?
4. How much did Elena borrow?
5. How much time will it take for Elena to pay back all the money she borrowed?
Lesson Summary
At the end of winter in Maine, the snow on the ground was 30 inches (in.) deep. Then, there was a particularly warm day, and the snow melted at a rate of 1 in. per hour (hr.). The graph shows the relationship between the time since the snow started to melt and the depth of the snow.
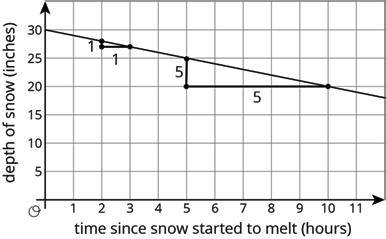
The slope of the graph is −1, since the rate of change is −1 in. per hr. That is, the depth decreases 1 in. per hr. The ��-intercept is 30, since the snow was 30 in. deep when the warmth started to melt the snow. The 2 slope triangles show that the rate of change is constant. It just also happens to be negative in this case because after each hour that passes, there is 1 in. less snow.
Graphs with negative slopes often describe situations where some quantity is decreasing over time, like the depth of snow on warm days, or the amount of money on a fare card being used for bus rides.
Slopes can be positive, negative, or 0. A slope of 0 means there is no change in the ��-value, even though the ��-value may be changing. For example, Elena won a contest where the prize was a special pass that gives her free bus rides for a year. Her fare card had $5 on it when she won the prize. The graph shows the amount of money on her fare card after winning the prize.
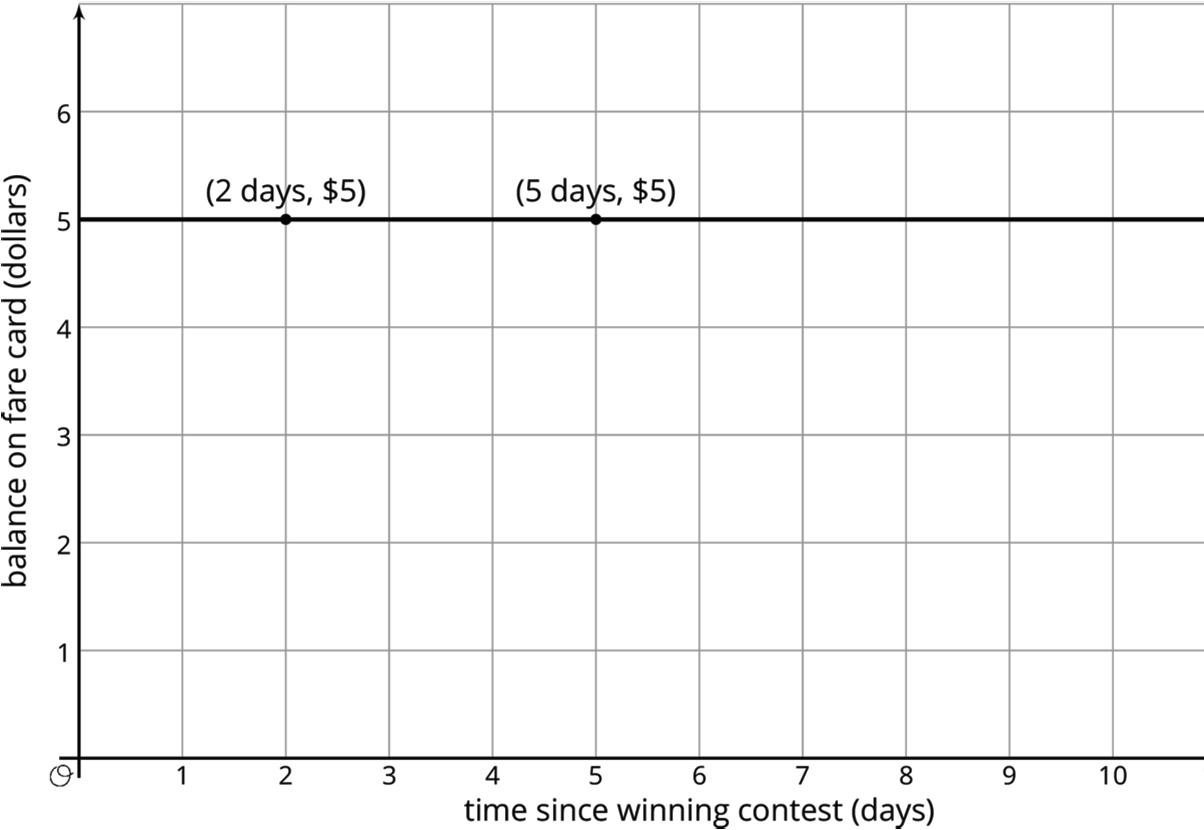
The ��-intercept is 5, since the graph starts when she has $5 on her fare card. The slope of the graph is 0, since she doesn’t use her fare card for the next year, meaning the amount on her fare card doesn’t change for a year. In fact, all graphs of linear relationships with slopes equal to 0 are horizontal. A rate of change of 0 means that from one point to the next, the ��-values remain the same.
Practice Problems
1. Suppose that during its flight, the elevation, ��, in feet (ft.), of a certain airplane and its time, ��, in minutes (min.), since takeoff, are related by a linear equation. Consider the graph of this equation, with time represented on the horizontal axis and elevation on the vertical axis. For each situation, decide if the slope is positive, zero, or negative.
a. The plane is cruising at an altitude of 37,000 ft. above sea level.
b. The plane is descending at rate of 1,000 ft. per min.
c. The plane is ascending at a rate of 2,000 ft. per min.
Review Problems
2. A group of hikers park their car at a trail head and hike into the forest to a campsite. The next morning, they head out on a hike from their campsite walking at a steady rate. The graph shows their distance in miles (mi.), ��, from the car on the day of their hike after ℎ hr.
a. How far is the campsite from their car? Explain how you know.
b. Write an equation that describes the relationship between �� and ℎ.
c. After how many hr. will the hikers be 16 mi. from their car? Explain or show your reasoning.
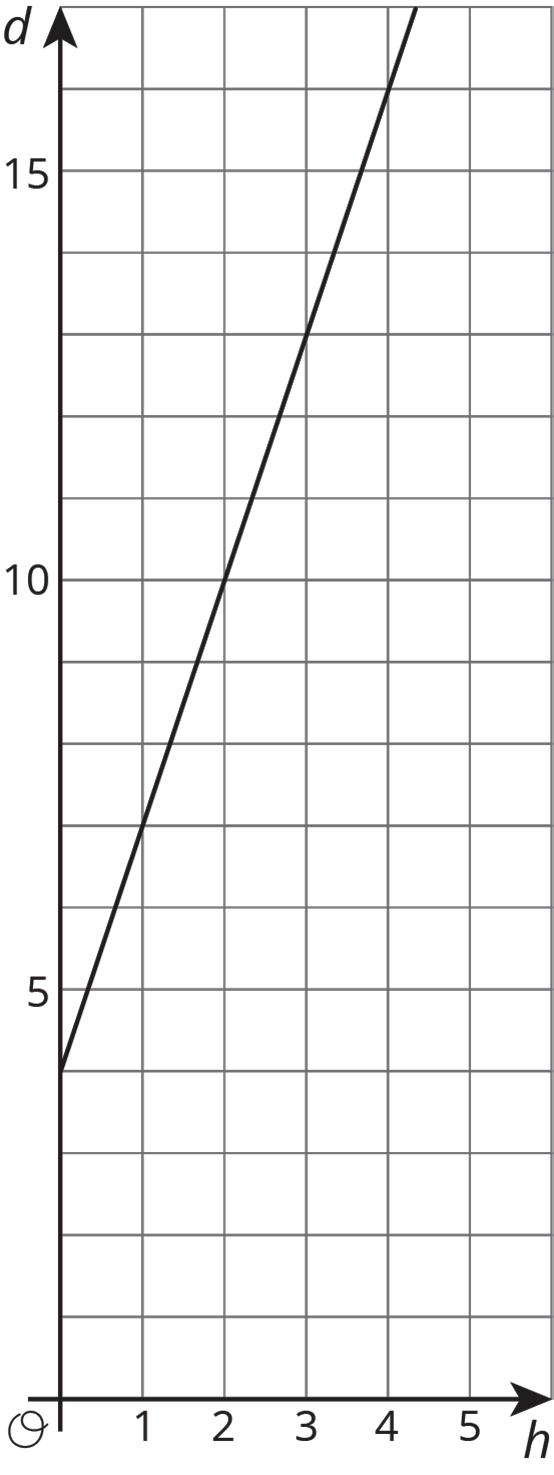
3. Elena’s aunt pays her $1 for each call she makes to let people know about her aunt’s new business.
The table shows how much money Diego receives for washing windows for his neighbors.
Select all the statements about the situation that are true.
□ Elena makes more money for making 10 calls than Diego makes for washing 10 windows.
□ Diego makes more money for washing each window than Elena makes for making each call.
□ Elena makes the same amount of money for 20 calls as Diego makes for 18 windows.
□ Diego needs to wash 35 windows to make as much money as Elena makes for 40 calls.
□ The equation �� = 9 10 ��, where �� is number of dollars and �� is number of windows, represents Diego’s situation.
□ The equation �� = ��, where �� is the number of dollars and �� is the number of calls, represents Elena’s situation.
4. Each square on a grid represents 1 unit on each side. Match the graphs with the slopes of the lines.
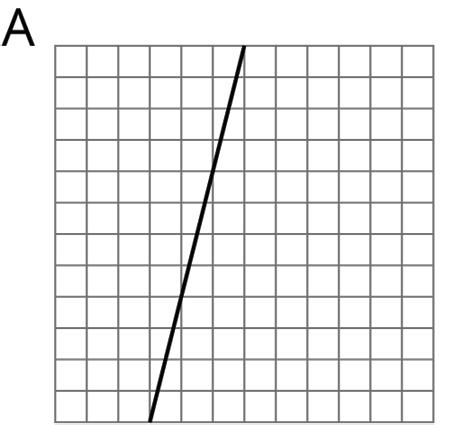
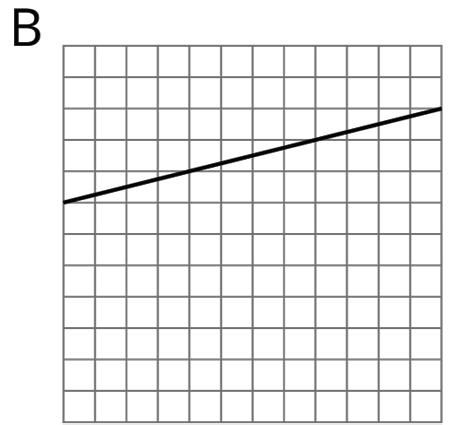
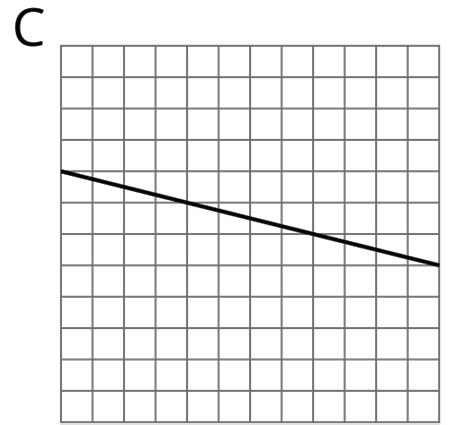
Unit 3, Lesson 8: Calculating Slope
Warm-Up: Integer Operations
Find values for �� and �� that make each side have the same value.
Exploration Activity: Toward a More General Slope Formula
1. Plot the points (1, 11) and (8, 2), and use a ruler to draw the line that passes through them.
2. Without calculating, do you expect the slope of the line through (1, 11) and (8, 2) to be positive or negative? How can you tell?
3. Calculate the slope of this line.
1. �� �� = −2
2. �� �� = 2
3. �� − �� = −2
Collaborative Activity: Making Designs
Your teacher will give you either a design or a blank graph. Do not show your card to your partner.
If your teacher gives you the design:
1. Look at the design silently and think about how you could communicate what your partner should draw. Think about ways that you can describe what a line looks like, such as its slope or points that it goes through.
2. Describe each line, one at a time, and give your partner time to draw them.
3. Once your partner thinks they have drawn all the lines you described, only then should you show them the design.
If your teacher gives you the blank graph:
1. Listen carefully as your partner describes each line, and draw each line based on their description.
2. You are not allowed to ask for more information about a line than what your partner tells you.
3. Do not show your drawing to your partner until you have finished drawing all the lines they describe.
When finished, place the drawing next to the card with the design so that you and your partner can both see them. How is the drawing the same as the design? How is it different? Discuss any miscommunication that might have caused the drawing to look different from the design.
Pause here so your teacher can review your work. When your teacher gives you a new set of cards, switch roles for the second problem.
Lesson Summary
One way to find the slope of a line, explored in Unit 2, is by drawing a slope triangle. For example, using the slope triangle shown here, the slope of the line is − 2 4 , or − 1 2 . The slope is negative because the line is decreasing from left to right.
But slope triangles are only one way to calculate the slope of a line. The slope of a line can be computed with any 2 points on the line. The points �� = (1, 5) and �� = (5, 3) are on the line. Since the slope is the ratio of the vertical change to the horizontal change between 2 points, calculate the change in the ��-values and the change in the ��-values between the points to find the slope. Between points �� and ��, the change in the ��-values is 3 − 5 = −2, and the change in the ��-values is 5 − 1 = 4. This means the slope is − 2 4 , or − 1 2 , which is the same slope as found using the slope triangle.
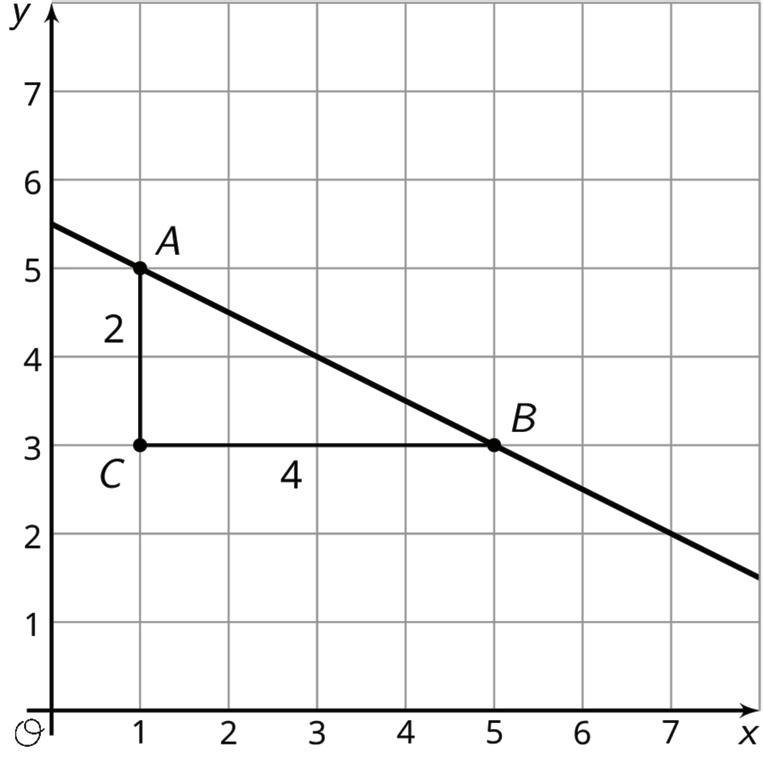
Notice that in each of the calculations, the value of point �� was subtracted from the value of point ��. If this were done in the reverse order, then the change in ��-values would have been 5 − 3 = 2, and the change in ��-values would have been 1 − 5 = −4, which would still result in a slope of − 1 2 . Either order can be used to find the slope of a line, but the order cannot be mixed up between the ��- and ��-values.
For example, if the ��-value of point �� were subtracted from the ��-value of point �� but the ��-value of point B were subtracted from the ��-value of point A, the result would have been positive 1 2 , which is clearly incorrect, given that the graph of the line shows a negative slope. However, if the graph is not available to check the calculation, it can be helpful to visualize the points. Think about how the point on the left, (1, 5), is higher than the point on the right, (5, 3), meaning the slope of the line must be negative, because it’s decreasing from left to right.
Practice Problems
1. For each graph, calculate the slope of the line.
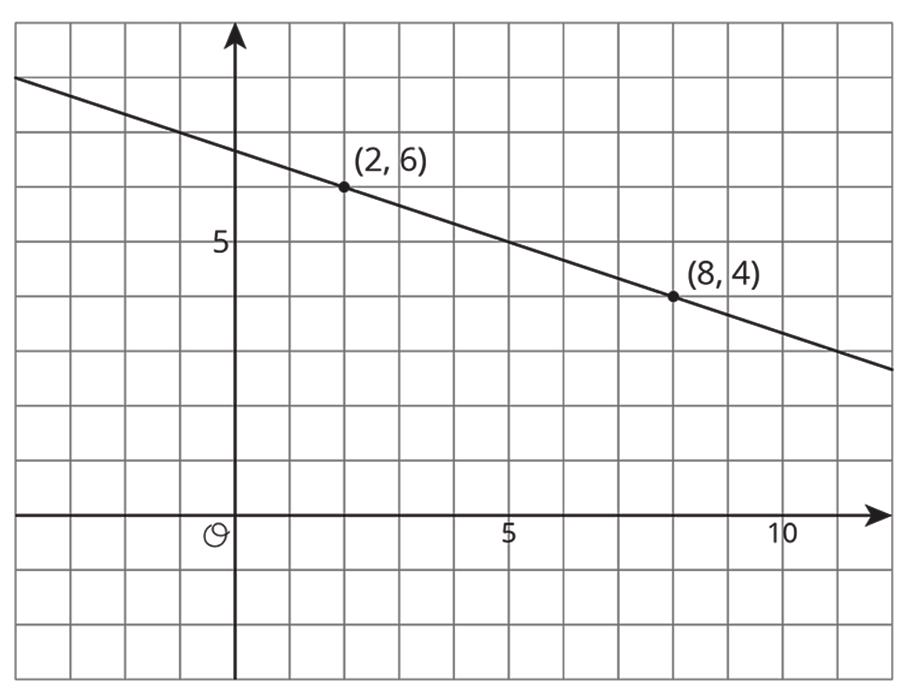
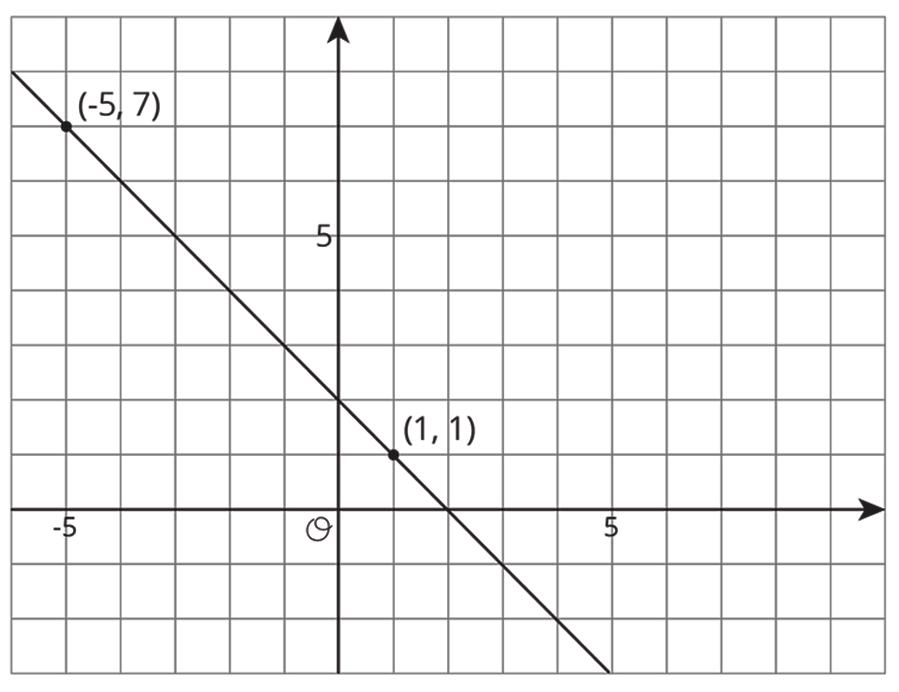
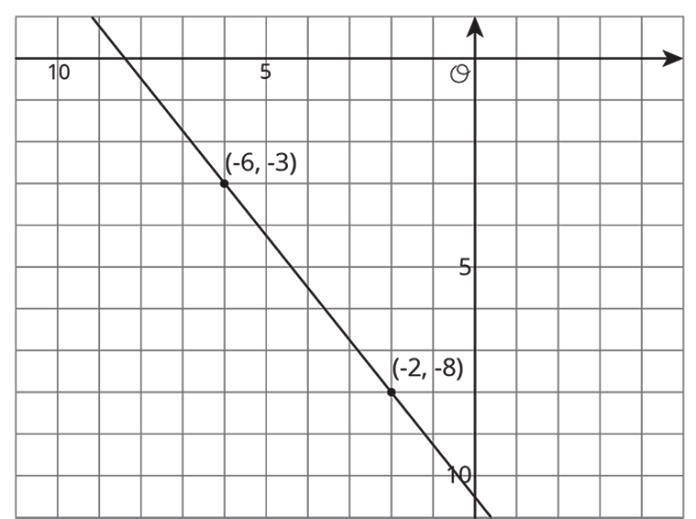
2. Match each pair of points to the slope of the line that joins them.
a. (9, 10) and (7, 2)
b. (−8, −11) and (−1, −5)
c. (5, −6) and (2, 3)
d. (6, 3) and (5, −1)
e. (4, 7) and (6, 2)
3. Draw a line with the given slope through the given point. What other point lies on that line?
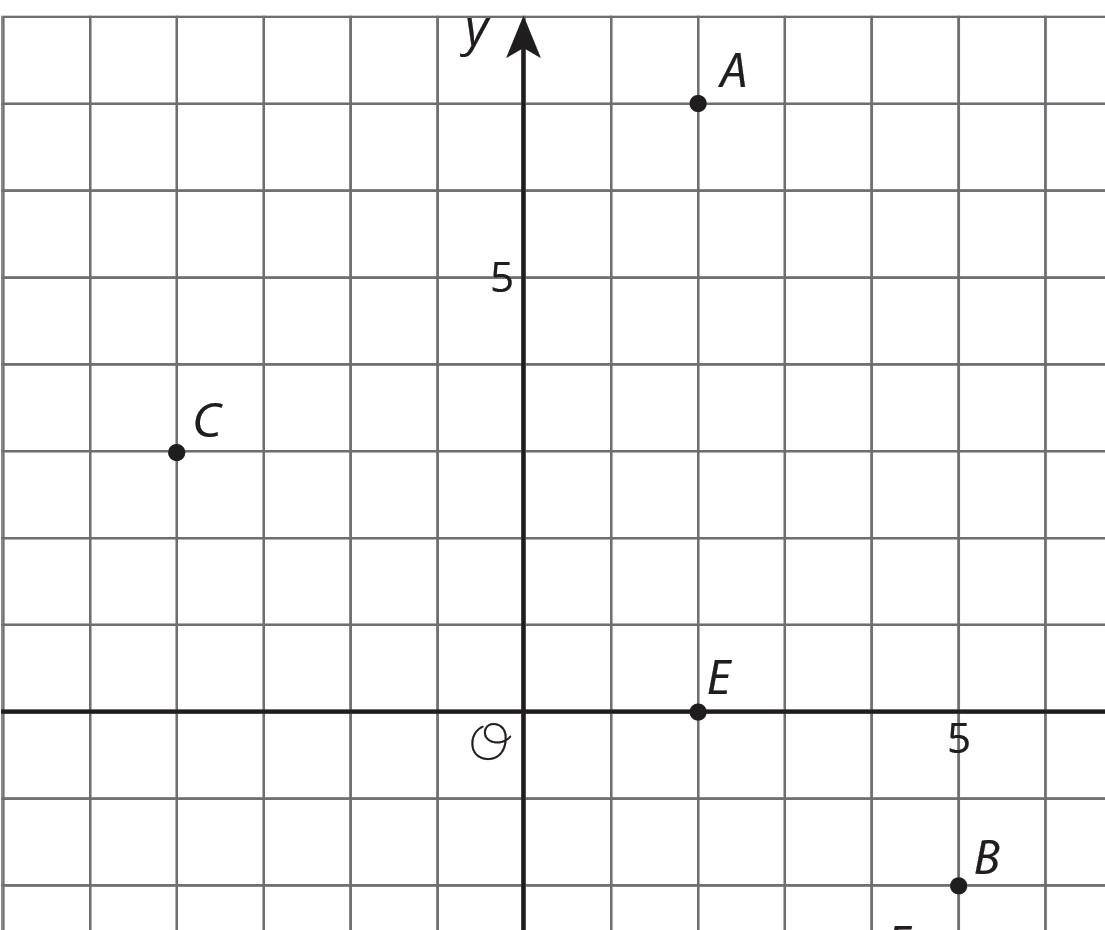
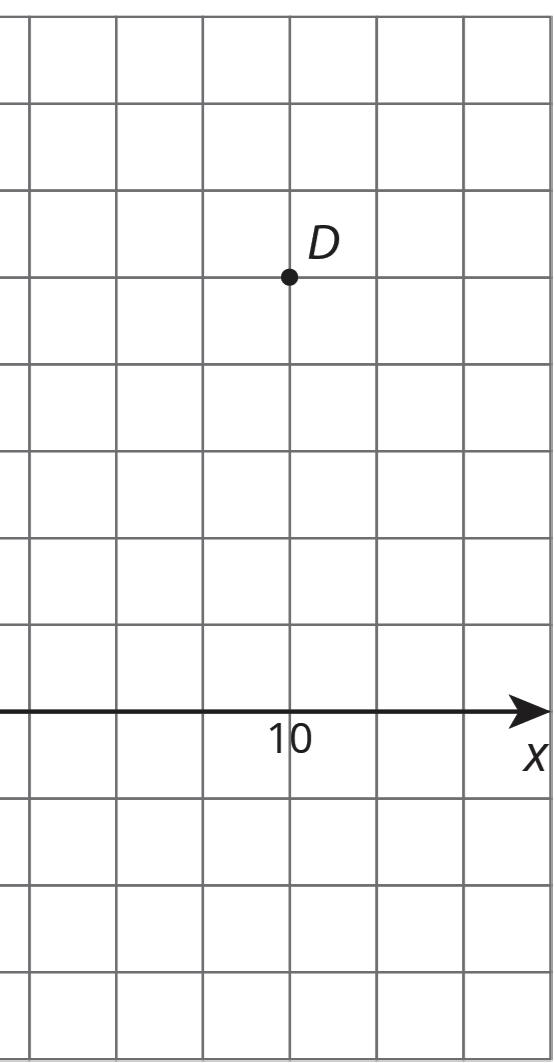
a. Point A, slope = −3
b. Point A, slope = −1 4
c. Point C, slope = −1 2
d. Point E, slope = −2 3
4. Make a sketch of a linear relationship with a slope of 4 and a negative ��-intercept. Show how you know the slope is 4 and write an equation for the line.
Unit 3, Lesson 9: Equations of All Kinds of Lines
Warm-Up: Which One Doesn’t Belong: Pairs of Lines
Which one doesn’t belong?
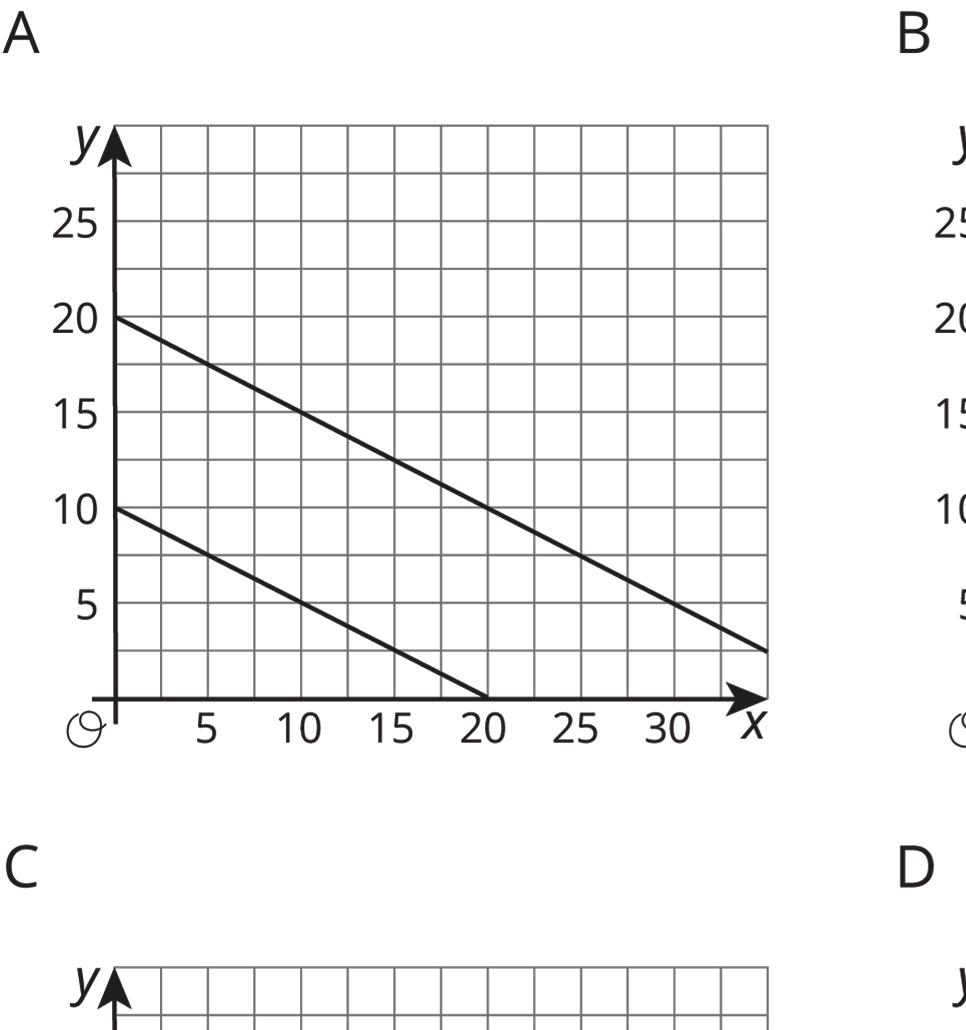
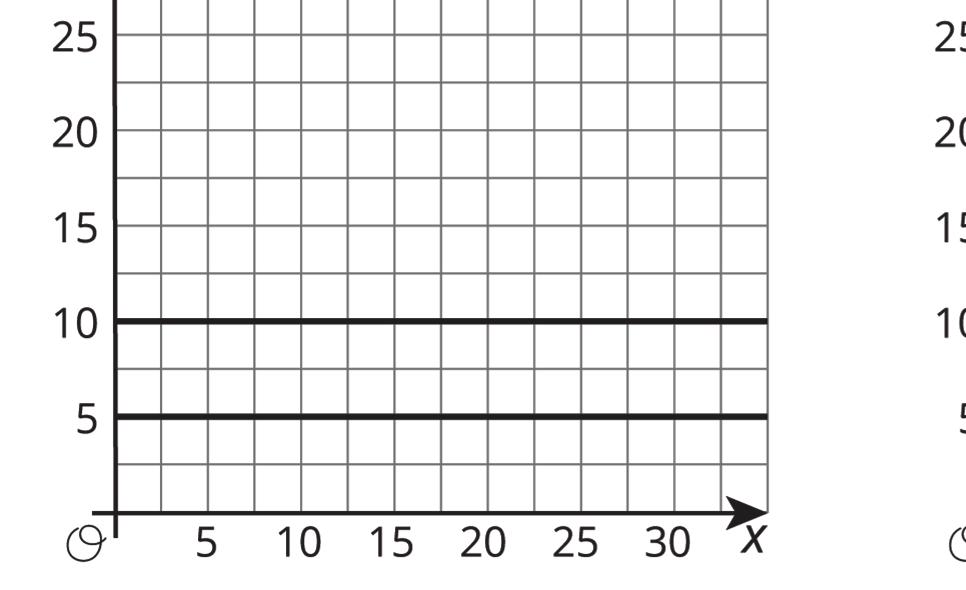
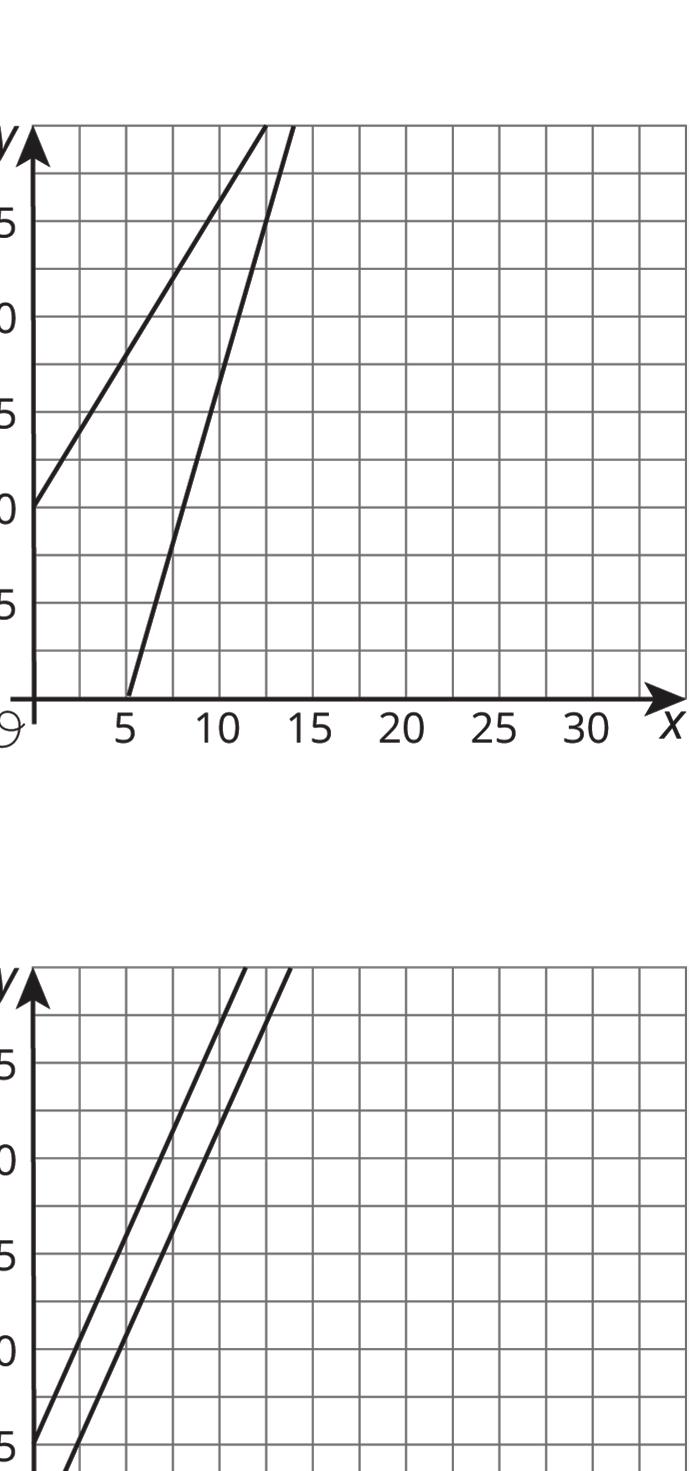
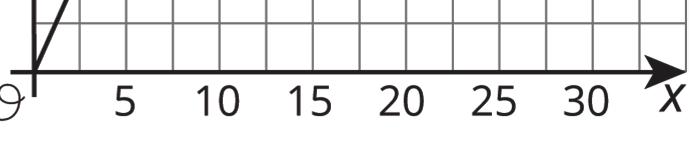
Exploration Activity: All the Same
1. Plot at least 10 points whose ��-coordinate is −4. What do you notice about them?
2. Which equation makes the most sense to represent all of the points with ��-coordinate −4? Explain how you know.
�� = −4
B. �� = −4��
C. �� = −4 D. �� + �� = −4
3. Plot at least 10 points whose ��-coordinate is 3. What do you notice about them?
4. Which equation makes the most sense to represent all of the points with ��-coordinate 3? Explain how you know.
�� = 3
�� = 3��
�� = 3
�� + �� = 3
5. Graph the equation �� = −2.
6. Graph the equation �� = 5.
A.
A.
B.
C.
D.
Collaborative Activity: Same Perimeter
1. There are many possible rectangles whose perimeter is 50 units. Complete the table with lengths, ℓ, and widths, ��, of at least 10 such rectangles.
2. The graph shows one rectangle whose perimeter is 50 units, and has its lower left vertex at the origin and two sides on the axes.
On the same graph, draw more rectangles with perimeter 50 units using the values from your table. Make sure that each rectangle has a lower left vertex at the origin and two sides on the axes.
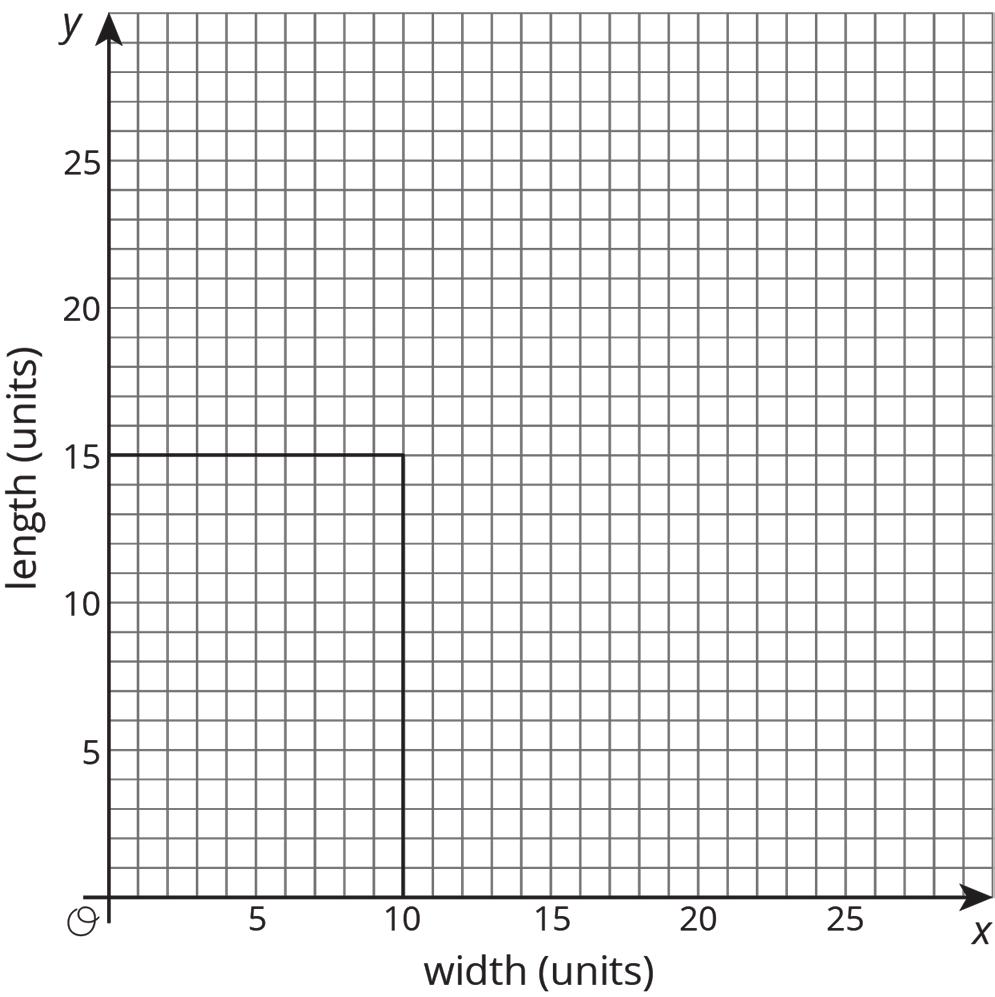
3. Each rectangle has a vertex that lies in the first quadrant. These vertices lie on a line. Draw in this line and write an equation for it.
4. What is the slope of this line? How does the slope describe how the width changes as the length changes (or vice versa)?
Lesson Summary
Horizontal lines in the coordinate plane represent situations where the ��-values don’t change at all while the ��-values change. For example, the horizontal line that goes through the point (0, 13) can be described in words as, “For all points on the line, the ��- value is always 13.” An equation that says the same thing is �� = 13.
Vertical lines represent situations where the ��-values don’t change at all while the ��- values change. The equation �� = −4 describes a vertical line through the point (−4, 0).
Horizontal lines have a slope of 0, while vertical lines have a slope that is undefined.
Practice Problems
1. Suppose you wanted to graph the equation �� = −4�� − 1.
a. Describe the steps you would take to draw the graph.
b. How would you check that the graph you drew is correct?
2. Write an equation for each line.

3. Graph the following lines and then write an equation for each.
a. Slope is 0, ��-intercept is 5
b. Slope is 2, ��-intercept is −1
c. Slope is −2, ��-intercept is 1
d. Slope is −1 2 , ��-intercept is −1
Review Problem
4. A publisher wants to figure out how thick their new book will be. The book has a front cover and a back cover, each of which have a thickness of 1 4 of an inch (in.). They have a choice of which type of paper to print the book on.
a. Bond paper has a thickness of 1 4 in. per one hundred pages. Write an equation for the width of the book, ��, if it has �� hundred pages, printed on bond paper.
b. Ledger paper has a thickness of 2 5 in. per one hundred pages. Write an equation for the width of the book, ��, if it has �� hundred pages, printed on ledger paper.
c. If they instead chose front and back covers of thickness 1 3 of an in., how would this change the equations in the previous two parts?
Unit 3, Lesson 10: Interpreting Linear Relationships
Warm-Up: Notice and Wonder: Two Graphs
What do you notice? What do you wonder?
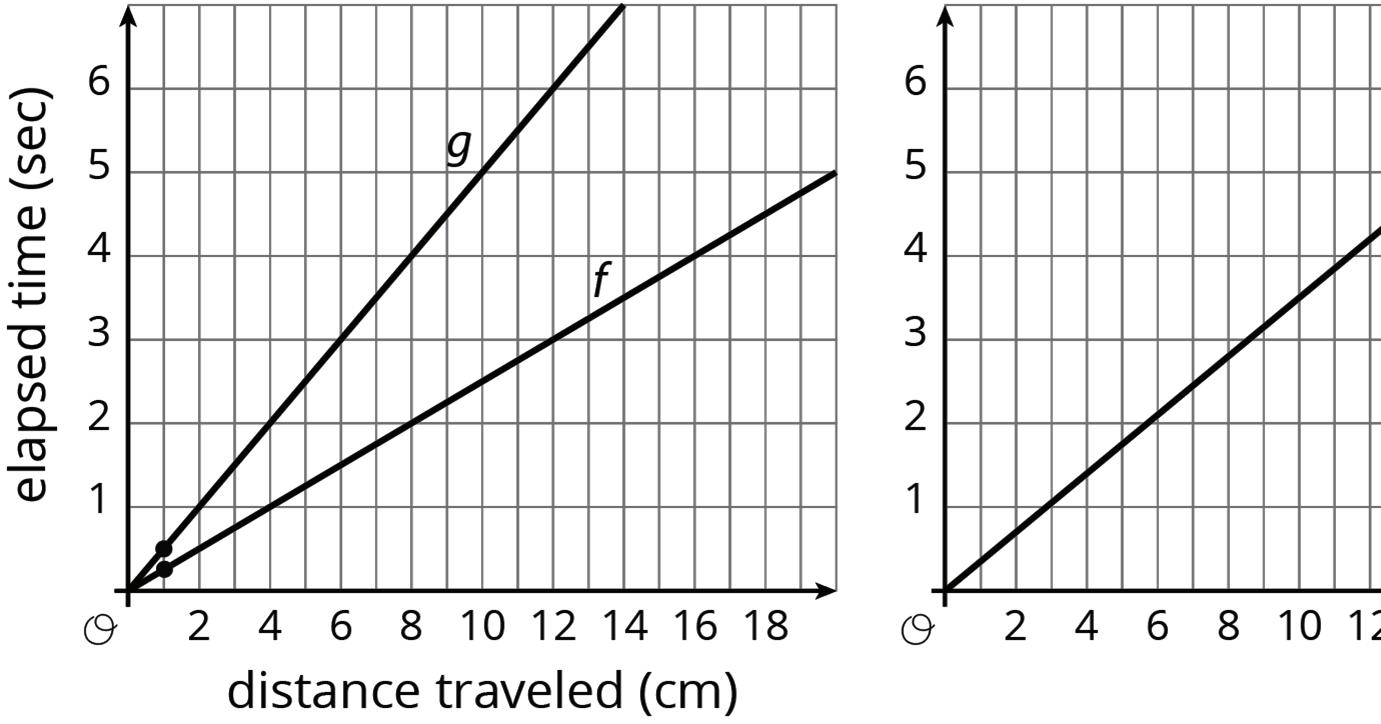

Collaborative Activity: Making Sense of Mathematical Models
A high school cross-country team ran a car wash on Saturday to raise money for their team’s new uniforms. The graph represents the relationship between the amount of money the team raised to buy uniforms, ��, and the number of cars they washed, ��.
Work with your partner to answer the questions using the graph shown.
1. What is the slope of the line? Show your work.
2. What does the slope mean in this context?
3. Explain whether the meaning of the slope makes sense in this context.
4. What is the ��-intercept of the line?
5. What does the ��-intercept mean in this context?
6. Explain whether the meaning of the ��-intercept makes sense in this context.
7. Complete the table.
Point What does this point represent in this context?
(7.5, 0)
(22, 145)
Explain whether the meaning of the point makes sense in this context.
8. What parts of the graph do not make sense in this context?
9. Discuss with your partner whether the graph is useful for modeling this situation, even if there are parts of it that do not make sense given the context.
Guided Activity: Interpreting Slope and ��-intercept from Different Representations
1. Econ Rental Car is a company that rents cars using a linear pricing plan. The company charges a daily rate in addition to maintenance fees. The total cost in dollars, ��, to rent a car for �� days is shown in the table.
a. Find the slope for this relationship. Show your work.
b. What does the slope mean in this context?
c. Olivia noticed that the table does not include a row where �� = 0. She said there is no way to know the ��-intercept from the table. Discuss with your partner how the information in the table could be used to determine the ��-intercept.
2. Carson and Jordyn determined the ��-intercept using different reasoning. Their thinking is shared in the table.
Carson’s Reasoning
Carson said he noticed a pattern when looking at the table. Every time the number of days increased by 2, the cost increased by $90.
Jordyn’s Reasoning
Jordyn said that she can use the rate of change to find the ��-intercept.
The ��-intercept is the value of �� when �� = 0, so he used his pattern to work backward.
She reasoned that if the daily rate is $45 each day to rent the car, then the rate for 2 days should be $90 and $180 for 4 days.
The difference between the daily rate and the actual cost represented in the table must be because of the maintenance fees.
a. Use either student’s reasoning to determine the ��-intercept.
b. What does this ��-intercept represent in the context?
3. Madison planted a royal palm tree in her front yard in 2012. The tree was 12 feet (ft.) tall when she planted it and has been growing at a nearly constant rate. By 2020, the royal palm measured 26 ft. tall.
a. Which 2 quantities are being compared in this linear relationship?
b. Use the information to determine the rate of change and ��-intercept in this relationship. Then, interpret each value given the context.
Feature Value
Rate of change
-intercept
Interpretation
Lesson Summary
Identifying the slope and ��-intercept of a line can help make sense of a real-world scenario that can be modeled by a linear relationship. Linear relationships can be represented in multiple ways, such as tables, graphs, written descriptions, or equations in linear form. The slope is the rate of change, which describes how one quantity changes in relation to the other. The ��-intercept is the initial value, or the value of �� when �� = 0.
Mathematical modeling is a process that uses mathematics to represent, analyze, and make predictions about real-world phenomena. Mathematical models are helpful tools for understanding and anticipating a situation. However, the mathematical model can sometimes include parts that do not make sense in a real-world context.
In the car wash example from the Collaborative Activity, washing part of a car or a negative number of cars does not make sense, but the model can still be a useful tool for answering questions such as “After how many car washes will the team have covered their expenses?” or “After how many car washes will the team have raised $100?” When interpreting models, it is important to analyze whether aspects of the model make sense given the context.
Practice Problems
1. Marcus collects rainwater in a 120 gallon (gal.) barrel to use for watering the plants in his garden during periods of time with low rainfall. The graph models the relationship between the number of gallons in the barrel, ��, and the number of days without rain, ��.
Use the graph to determine the slope and ��-intercept. Then, interpret each value in context.
2. Visitors to Ridgeville, South Carolina, can rent tubes to float along the Edisto River. Grayson begins his float 2.1 miles (mi.) from the launch point. After 2 hours (hr.), he is 0.6 mi. from the launch point.
Use the information to determine the slope and ��-intercept in this relationship. Then, interpret each value in context. Feature Value
3. Elijah is saving money to buy a new gaming system. He set aside some money he received for his birthday and then added more each week. The table shows the amount of money Elijah has saved at the end of each week, ��, for the number of weeks he has been saving, ��.
Use the information to determine the rate of change and ��-intercept in this relationship. Then, interpret each value in context.
Feature Value
Rate of change
��-intercept
Review Problem
Interpretation
4. The points (2, −4), (��, ��), ��, and �� all lie on the line. Find an equation relating �� and ��.
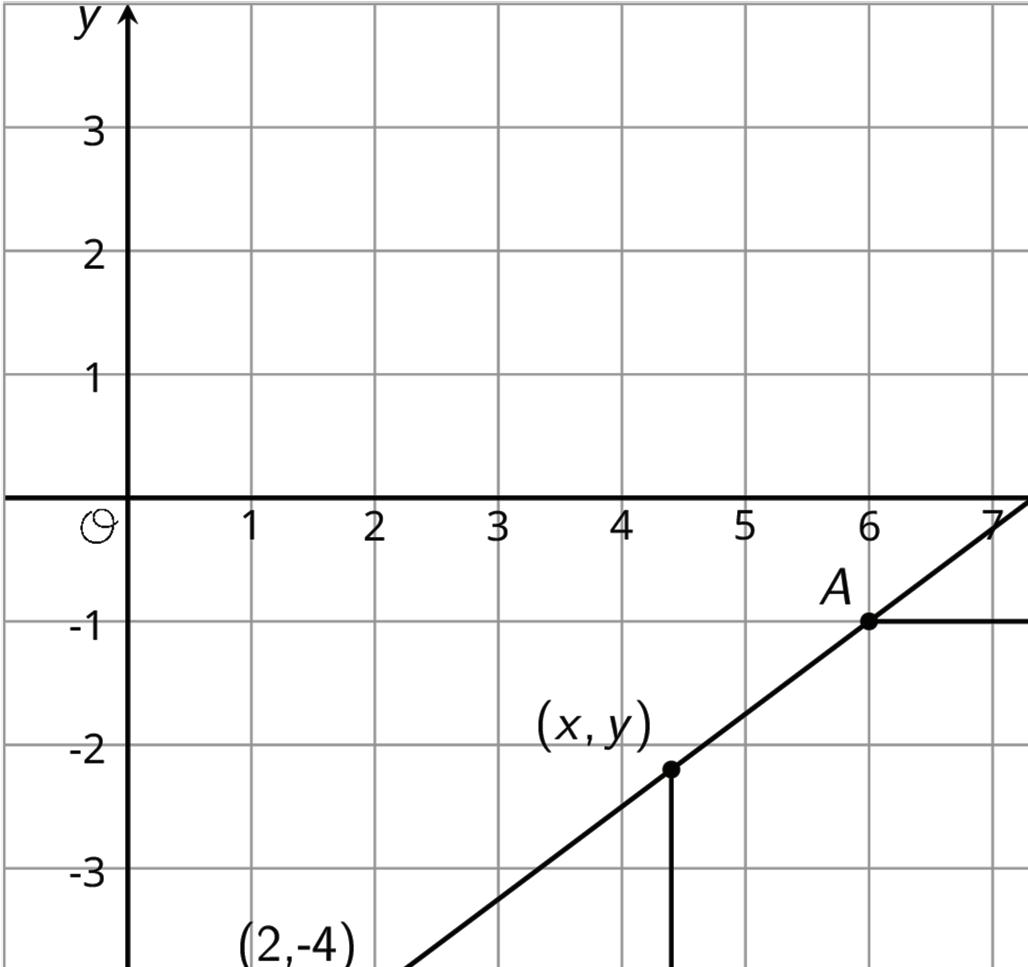
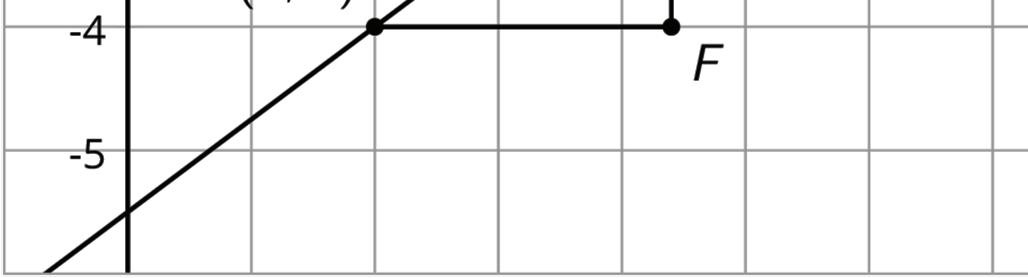
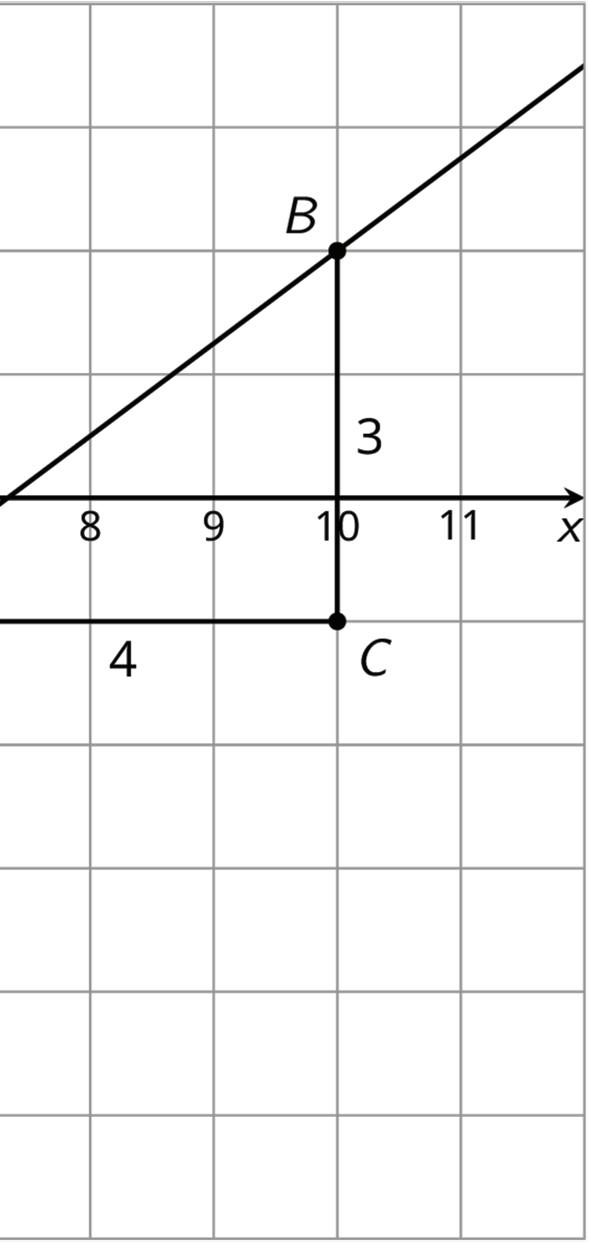
Unit 3, Lesson 11: Writing Equations of Linear Relationships
Warm-Up: Need for Speed
The fastest jet in the world is the Lockheed SR-71 Blackbird. On its last flight, on March 6, 1990, it hit a record speed by flying from Los Angeles to Washington, DC, in 1 hour (hr.), 4 minutes (min.), and 20 seconds (sec.).
A typical passenger airplane completed the same route in about 4 hr. and 45 min. The flight distance between Los Angeles, and Washington, DC, is 2,280 miles (mi.).
1. What was the Blackbird’s average speed when it set its record? Round your answer to the hundredths place.
Guided Activity: Writing Equations of Linear Relationships
1. For each linear relationship shown, work with your partner to determine the slope and ��-intercept of the line.
Linear Relationship A Slope ��-intercept
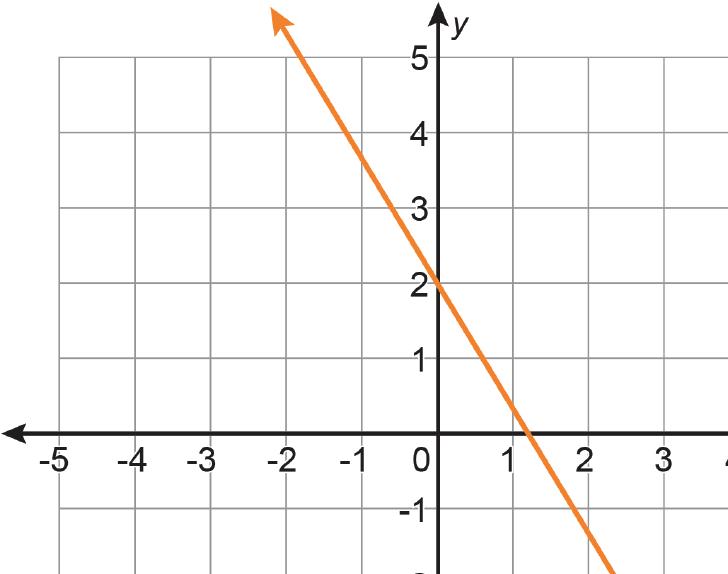
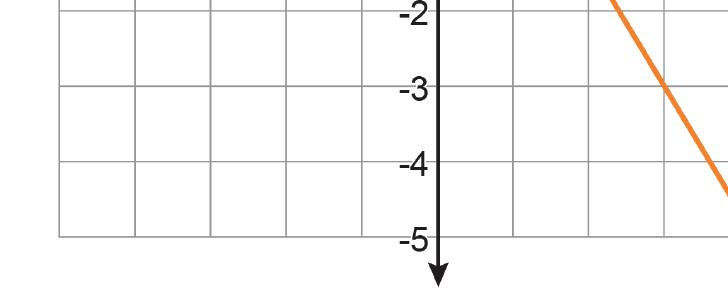
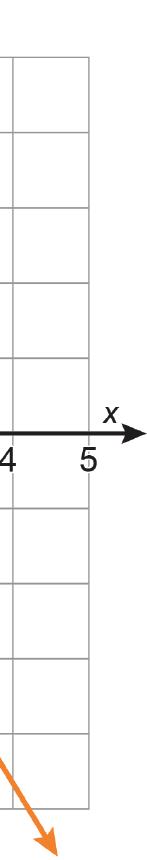
Linear Relationship B Slope ��-intercept
2. Use the slope and ��-intercept for each linear relationship to write the equation of each line.
Relationship
Collaborative Activity: Gallery Walk
Several students wrote equations to represent linear relationships given as tables or graphs, but each student made at least 1 error.
With your partner or small group, complete the table by analyzing each student’s work to identify their error(s). Then, write the correct equation for each linear relationship.
Student’s Name What error(s) did they make? Correct Equation
Sophia
Austin
Caleb
Hailey
Collaborative Activity: Writing Equations for Real-World Context
1. In 2015, the number of people with paid subscriptions to on-demand music streaming services was approximately 10.54 million. The number of people with paid subscriptions has been increasing at a constant rate since then. By 2019, the number of people with paid subscriptions to music streaming services increased to about 59.74 million.
a. Define the quantities in this relationship using variables.
b. Find the slope and ��-intercept for this relationship. Slope ��-intercept
c. Write an equation to represent the relationship between the number of people, in millions, with paid subscriptions to music streaming services, and the number of years since 2015.
2. Due to the increase in music streaming platforms, the revenue earned by the music industry from downloaded music content has decreased over the same period of time. The table shows the approximate revenues earned each year from 2015 to 2019, in millions of dollars.
Work with your partner to write an equation that represents the relationship between the quantities in this context.
Lesson Summary
A linear relationship between 2 quantities can be modeled using an equation when one quantity has a constant rate of change with respect to the other. A linear equation can be used to model the relationship in different forms. The slope-intercept form of a linear equation is written as �� = ���� + ��, where �� is the slope, or rate of change, of the relationship, and �� is the ��-intercept, or initial value, of the relationship.
Practice Problems
1. Write the equation of each line.
2. Tourism is a major industry in Florida. The graph shows the total number of visitors, in millions, who traveled to Florida from 2011 to 2017.
Write a linear equation that represents this relationship.
Review Problems
3. A container of fuel dispenses fuel at the rate of 5 gallons (gal.) per second. If �� represents the amount of fuel remaining in the container, and �� represents the number of sec. that have passed since the fuel started dispensing, then �� and �� satisfy a linear relationship. In the coordinate plane, will the slope of the line representing that relationship have a positive, negative, or zero slope? Explain how you know.
4. A sandwich store charges a delivery fee to bring lunch to an office building. One office pays $33 for 4 turkey sandwiches. Another office pays $61 for 8 turkey sandwiches. How much does each turkey sandwich add to the cost of the delivery? Explain how you know.
Unit 4: Linear Equations and Inequalities
Unit 4, Lesson 1: Number Puzzles
Warm-Up: Notice and Wonder: A Number Line
What do you notice? What do you wonder?

Exploration Activity: Telling Temperatures
Solve each puzzle. Show your thinking. Organize it so it can be followed by others.
1. The temperature was very cold. Then the temperature doubled.
Then the temperature dropped by 10°. Then the temperature increased by 40°. The temperature is now 16°. What was the starting temperature?
2. Lin ran twice as far as Diego. Diego ran 300 meters (m) farther than Jada. Jada ran 1 3 the distance that Noah ran. Noah ran 1200 m. How far did Lin run?
Collaborative Activity: Making a Puzzle
Write another number puzzle with at least three steps. On a different piece of paper, write a solution to your puzzle.
Trade puzzles with your partner and solve theirs. Make sure to show your thinking.
With your partner, compare your solutions to each puzzle. Did they solve them the same way you did? Be prepared to share with the class which solution strategy you like best.
Lesson Summary
An example of a puzzle problem is shown.
Twice a number plus 4 is 18. What is the number?
There are many different ways to represent and solve puzzle problems. Three such ways are described in the table.
Method
Reason through it.
Draw a diagram.
Write and solve an equation.
Representation and Solution
Twice a number plus 4 is 18. Then, twice the number is 18 − 4 = 14. That means the number is 7.
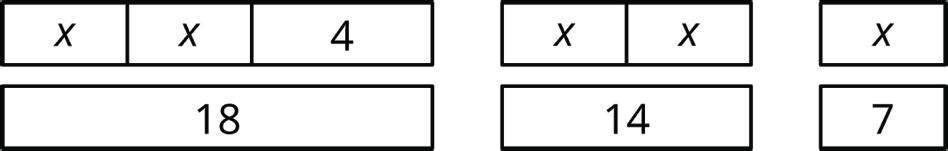
2�� + 4 = 18 2�� = 14 �� = 7
Using reasoning and drawing diagrams are helpful ways to show what is going on and why the answer is what it is. However, as number puzzles and story problems get more complex, those methods get harder, and equations become more and more helpful. In future lessons, different kinds of diagrams and strategies will be explored, building your understanding of how to use equations to solve increasingly complex mathematical problems.
Practice Problems
1. Tyler reads 2 15 of a book on Monday, 1 3 of it on Tuesday, 2 9 of it on Wednesday, and 3 4 of the remainder on Thursday. If he still has 14 pages left to read on Friday, how many pages are there in the book?
2. Clare asks Andre to play the following number puzzle:
• Pick a number
• Add 2
• Multiply by 3
• Subtract 7
• Add your original number
Andre’s final result is 27. Which number did he start with?
3. In a basketball game, Elena scores twice as many points as Tyler. Tyler scores four points fewer than Noah, and Noah scores three times as many points as Mai. If Mai scores 5 points, how many points did Elena score? Explain your reasoning.
Review Problems
4. Select all of the given points in the coordinate plane that lie on the graph of the linear equation 4�� − �� = 3.
□ (−1, −7)
□ (0, 3)
□ �3 4 , 0� □ (1, 1)
□ (2, 5)
□ (4, −1)
5. A store is designing the space for rows of nested shopping carts. Each row has a starting cart that is 4 feet (ft.) long, followed by the nested carts (so 0 nested carts means there's just the starting cart). The store measured a row of 13 nested carts to be 23.5 ft. long, and a row of 18 nested carts to be 31 ft. long.
a. Create a graph of the situation.
b. How much does each nested cart add to the length of the row? Explain your reasoning.
c. If the store design allows for 43 ft. for each row, how many total carts fit in a row?
6. Triangle �� is an isosceles triangle with two angles of measure �� degrees and one angle of measure �� degrees.
a. Find three combinations of �� and �� that make this sentence true.
b. Write an equation relating �� and ��.
c. If you were to sketch the graph of this linear equation, what would its slope be? How can you interpret the slope in the context of the triangle?
7. Consider the following graphs of linear equations. Decide which line has a positive slope, and which has a negative slope. Then calculate each line’s exact slope.
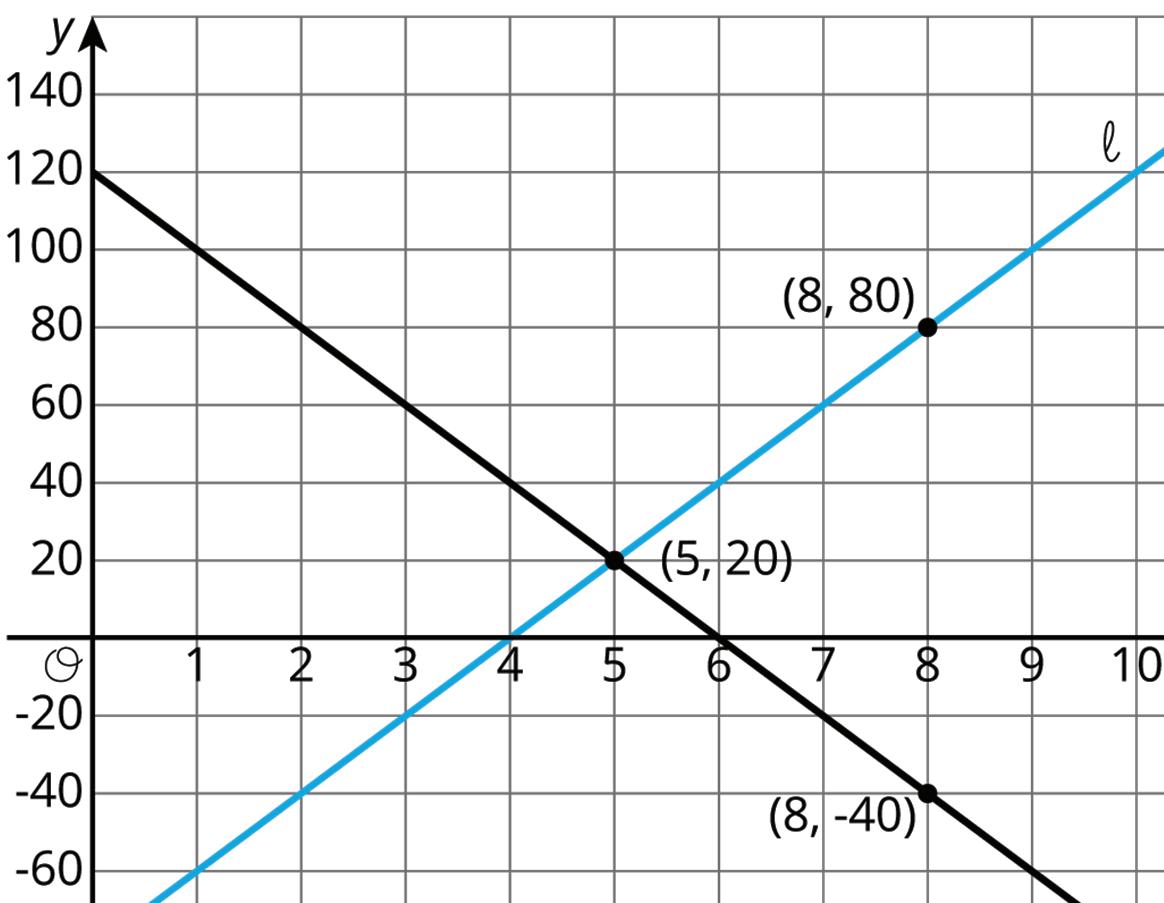
Unit 4, Lesson 2: Keeping the Equation Balanced
Warm-Up: Notice and Wonder: Hanging Socks
What do you notice? What do you wonder?

Exploration Activity: Hanging Blocks
This picture represents a hanger that is balanced because the weight on each side is the same.
1. Elena takes two triangles off of the left side and three triangles off of the right side. Will the hanger still be in balance, or will it tip to one side? Which side? Explain how you know.
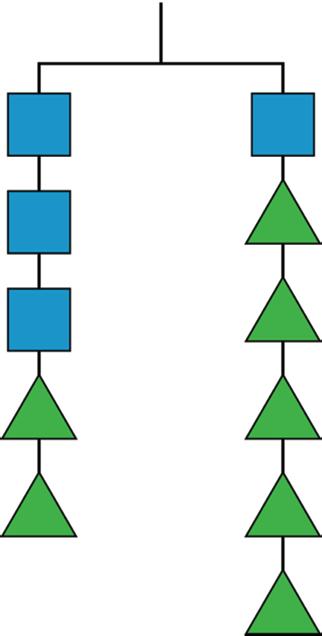
2. If a triangle weighs 1 gram (g), how much does a square weigh?
Collaborative Activity: More Hanging Blocks
A triangle weighs 3 g and a circle weighs 6 g.
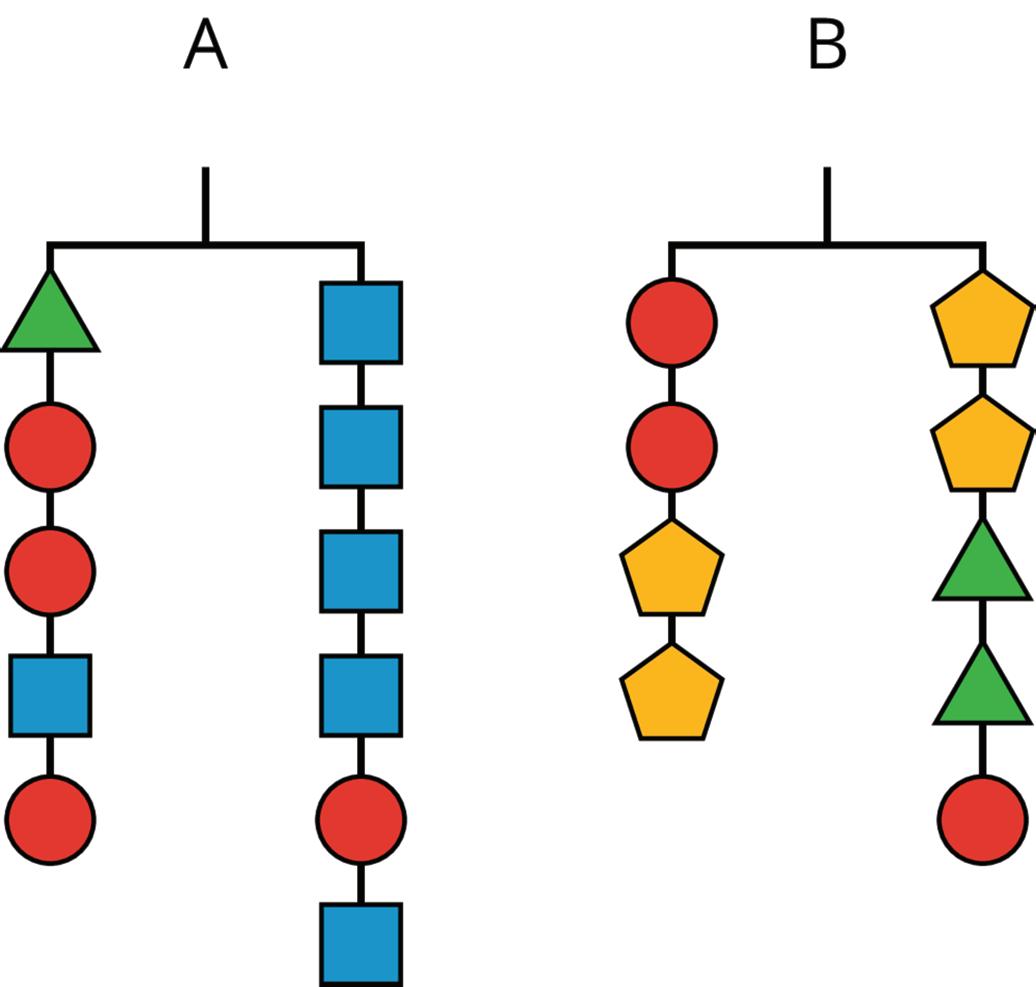
1. Find the weight of a square in Hanger A and the weight of a pentagon in Hanger B.
2. Write an equation to represent each hanger.
Lesson Summary
If there are equal weights on each end of a hanger, then the hanger will be in balance. If there is more weight on one side than on the other, the hanger will tilt to the heavier side.
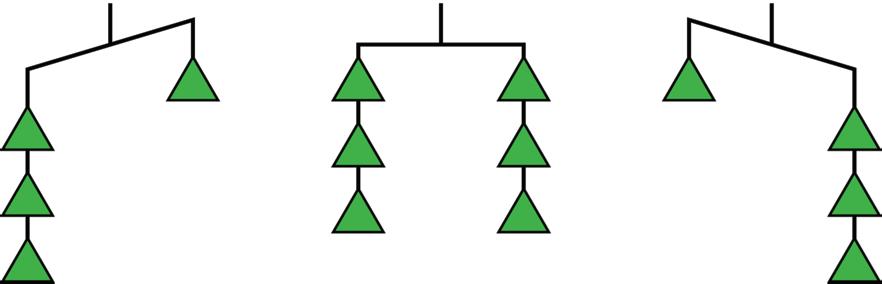
A balanced hanger can be used as a metaphor for an equation. An equation indicates that the expressions on either side have equal value, just like a balanced hanger has equal weights on each side.
If there is a balanced hanger and the same amount of weight is added to each side or removed from each side, the result will still be balanced. Consider how this is shown in the 2 hanger diagrams.
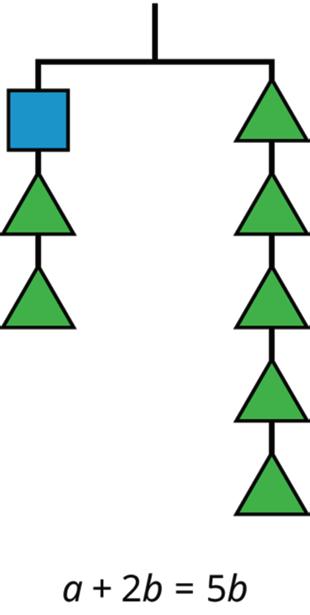
The same moves can be made with equations to keep them in balance. Adding or subtracting the same amount from each side of an equation maintains the equality. Consider how this is shown in the equations given under each hanger diagram.
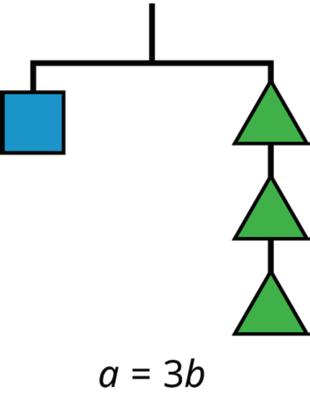
Practice Problems
1. Which of the changes would keep the hanger in balance? Select all that apply.
□ Adding two circles on the left and a square on the right
□ Adding 2 triangles to each side
□ Adding two circles on the right and a square on the left
□ Adding a circle on the left and a square on the right
□ Adding a triangle on the left and a square on the right
2. Here is a balanced hanger diagram.
Each triangle weighs 2.5 pounds (lb.), each circle weighs 3 lb., and �� represents the weight of each square. Select all equations that represent the hanger.
□ �� + �� + �� + �� + 11 = �� + 11.5
□ 2�� = 0.5
□ 4�� + 5 + 6 = 2�� + 2.5 + 6
□ 2�� + 2.5 = 3
□
3. What is the weight of a square if a triangle weighs 4 g?
Explain your reasoning.
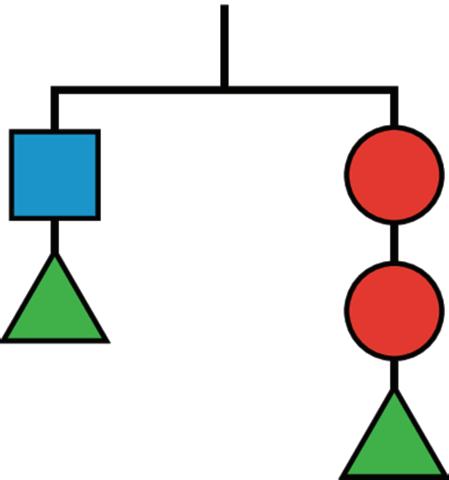
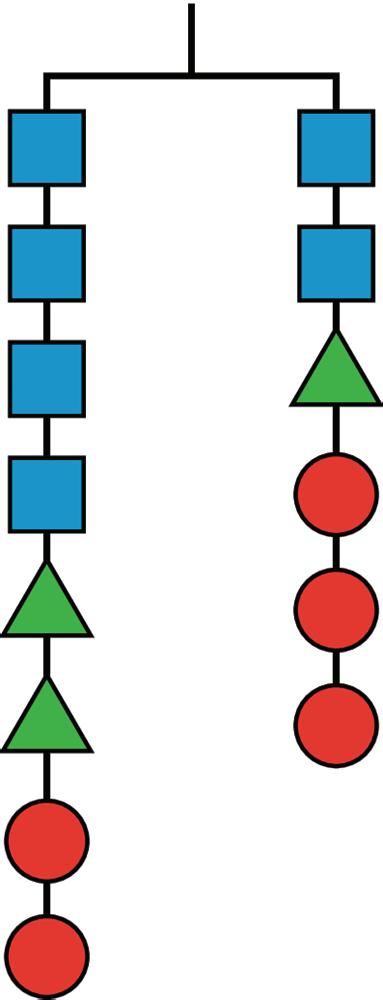
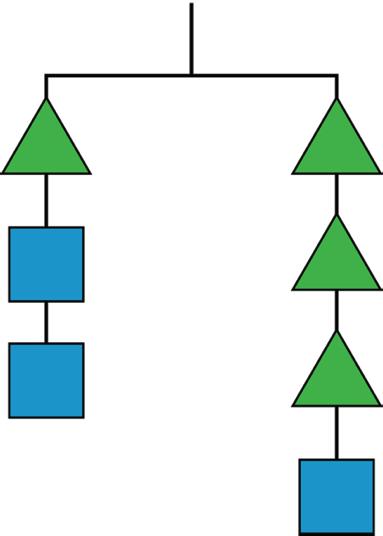
4. Andre came up with the following puzzle. “I am three years younger than my brother, and I am 2 years older than my sister. My mom's age is one less than three times my brother's age. When you add all our ages, you get 87. What are our ages?”
a. Try to solve the puzzle.
b. Jada writes this equation for the sum of the ages: (��) + (�� + 3) + (�� − 2) + 3(�� + 3) − 1 = 87.
Explain the meaning of the variable and each term of the equation.
c. Write the equation with fewer terms.
d. Solve the puzzle if you haven’t already.
5. These two lines are parallel. Write an equation for each.
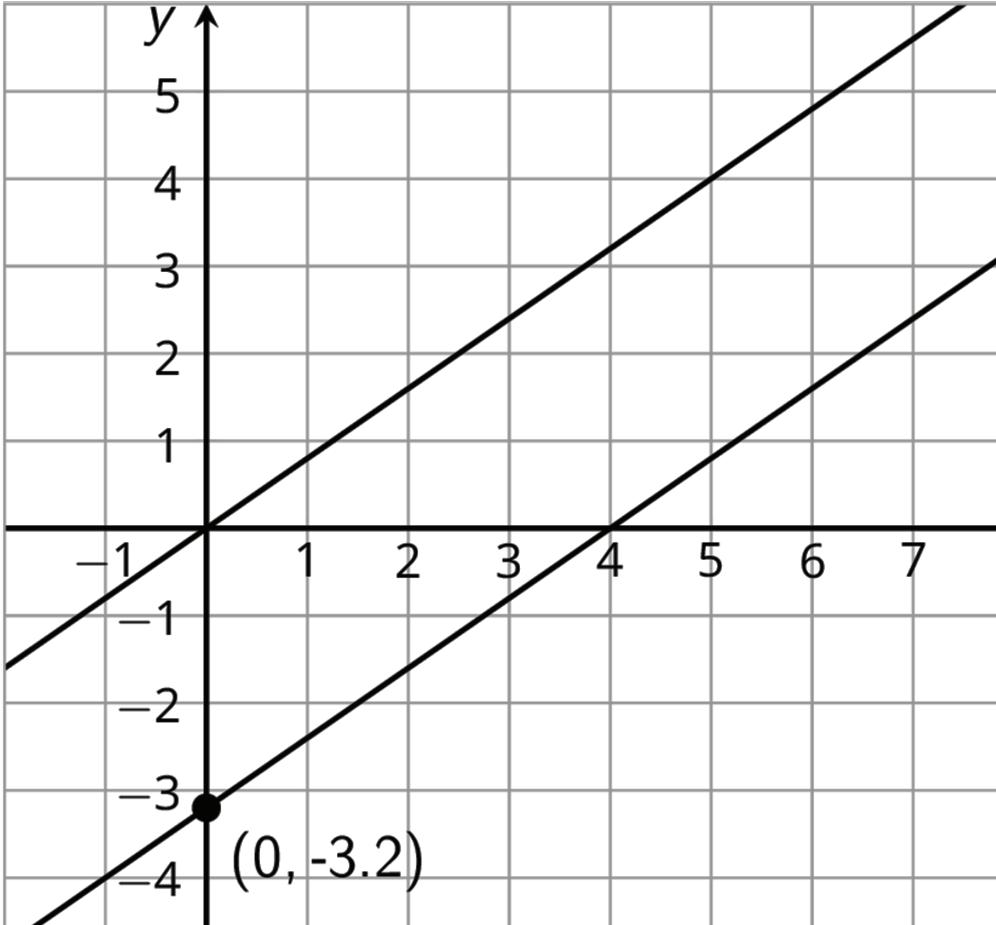
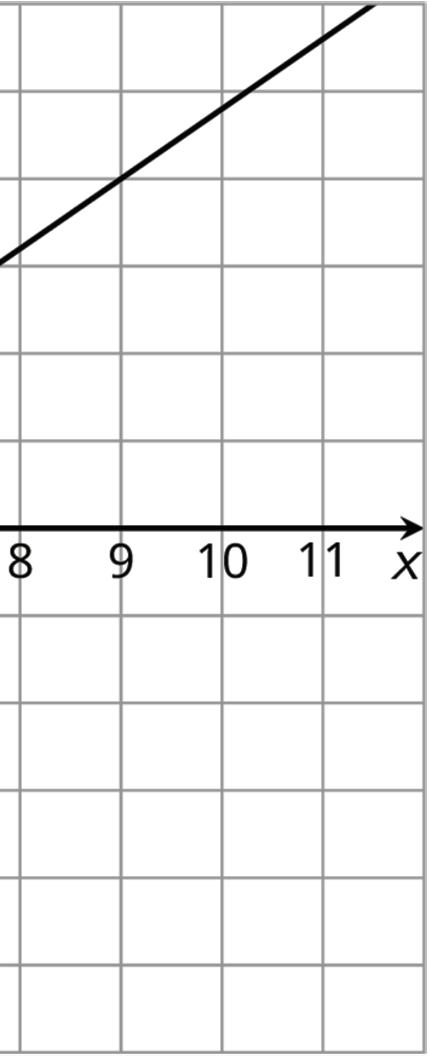
Unit 4, Lesson 3: Balanced Moves
Warm-Up: Matching Hangers
Figures A, B, C, and D show the result of simplifying the hanger in Figure A by removing equal weights from each side.
Here are some equations. Each equation represents one of the hanger diagrams.
2(�� + 3��) = 4�� + 2�� 2�� = ��
2(�� + 3��) + 2�� = 2�� + 4�� + 2�� �� + 3�� = 2�� + ��
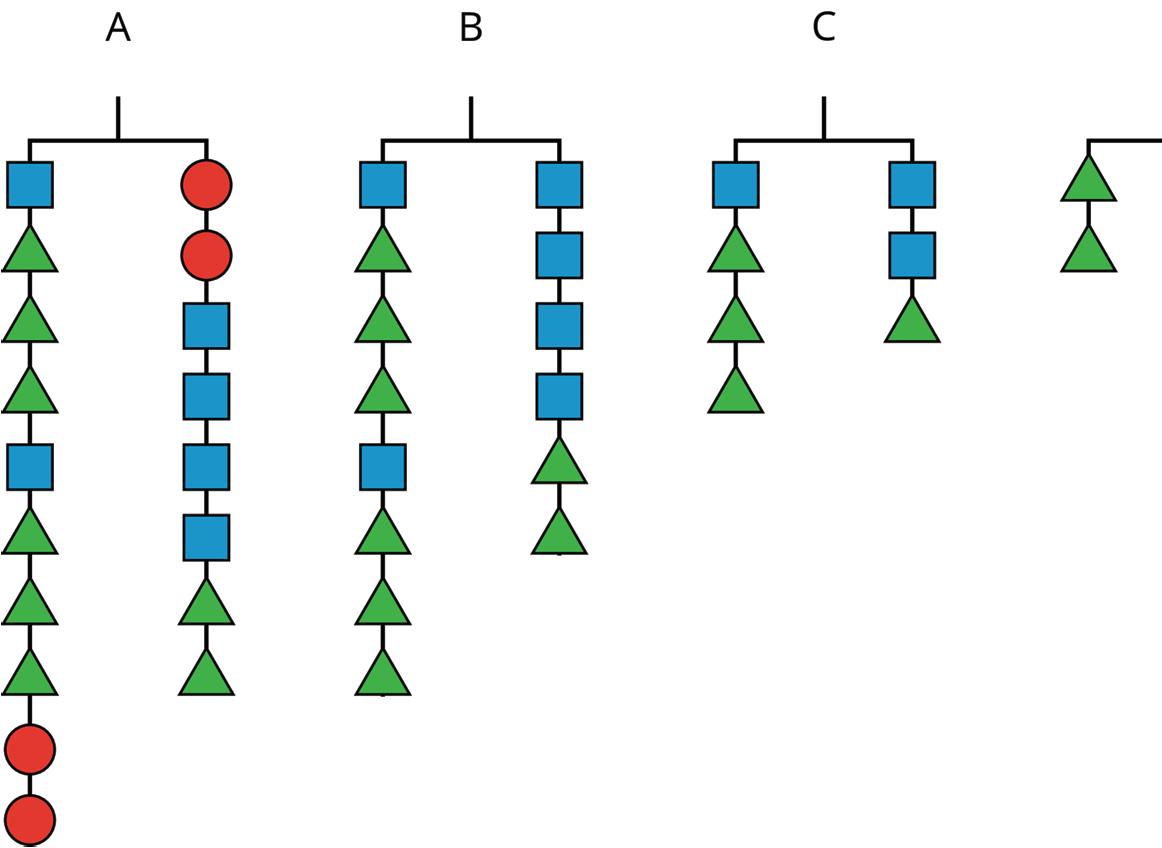

1. Write the equation that goes with each figure. A: ________________________________________ B: ________________________________________ C: ________________________________________ D: ________________________________________
2. Each variable (��, ��, and ��) represents the weight of one shape. Which goes with which?
3. Explain what was done to each equation to create the next equation. If you get stuck, think about how the hangers changed.
Exploration Activity: Matching Equation Moves
Your teacher will give you some cards. Each of the cards 1 through 6 show two equations. Each of the cards A through E describe a move that turns one equation into another.
1. Match each number card with a letter card.
2. One of the letter cards will not have a match. For this card, write two equations showing the described move.
Collaborative Activity: Keeping Equality
1. Noah and Lin both solved the equation 14�� = 2(�� − 3).
Noah's solution
14�� = 2(�� − 3)
14�� = 2�� − 6
Lin's solution
12�� = −6 �� = −12 14�� = 2(�� − 3)
Do you agree with either of them? Why?
7�� = �� − 3
6�� = −3 �� = −1 2
2. Elena is asked to solve 15 − 10�� = 5(�� + 9). What do you recommend she does to each side first?
3. Diego is asked to solve 3�� − 8 = 4(�� + 5). What do you recommend he does to each side first?
Lesson Summary
An equation signifies that 2 expressions have equal value. For example, if 4�� + 9 and −2�� − 3 have equal value, this can be expressed with the equation 4�� + 9 = −2�� − 3.
In the previous lesson, hangers were used to understand that if the same positive number is added to each side of the equation, the sides will maintain equal value. It also works to add negative numbers. For example, −9 can be added to each side of the equation, resulting in the equivalent equation shown.
Equation Equivalent to
Since expressions represent numbers, expressions can also be added to each side of an equation. For example, 2�� can be added to each side and still maintain equality.
Equation Equivalent to
Multiplying or dividing the expressions on each side of an equation by the same nonzero number also maintains the equality.
Whether using multiplication or division, the resulting solution to the equation is �� = −2.
Equation Equivalent to
These moves can be used in systematic ways to solve equations, which
be explored in future lessons.
Practice Problems
1. In this hanger, the weight of the triangle is �� and the weight of the square is ��.
a. Write an equation using �� and �� to represent the hanger.
b. If �� is 6, what is ��?
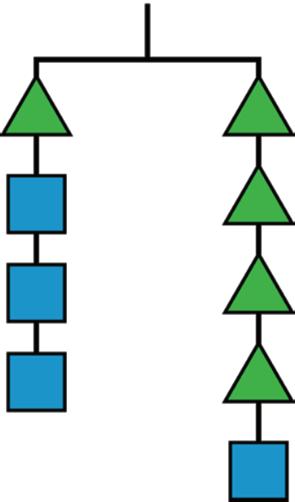
2. Andre and Diego were each trying to solve 2�� + 6 = 3�� − 8. Describe the first step they each make to the equation.
a. The result of Andre’s first step was −�� + 6 = −8.
b. The result of Diego’s first step was 6 = �� − 8.
3. Match each set of equations with the move that turned the first equation into the second.
a. 6�� + 9 = 4�� − 3 2�� + 9 = −3
b. −4(5�� − 7) = −18
5�� − 7 = 4.5
c. 8 − 10�� = 7 + 5��
4 − 10�� = 3 + 5��
d. −5�� 4 = 4 5�� = −16
e. 12�� + 4 = 20�� + 24 3�� + 1 = 5�� + 6
Review Problems
4.
i. Multiply both sides by −1 4
ii. Multiply both sides by −4
iii. Multiply both sides by 1 4
iv. Add −4�� to both sides
v. Add −4 to both sides
a. Complete the table with values for �� or �� that make this equation true. 3�� + �� = 15
b. Create a graph, plot these points, and find the slope of the line that goes through them.

5. Select all the situations for which only zero or positive solutions make sense.
□ Measuring temperature in degrees Celsius at an Arctic outpost each day in January.
□ The height of a candle as it burns over an hour.
□ The elevation above sea level of a hiker descending into a canyon.
□ The number of students remaining in school after 6:00 p.m.
□ A bank account balance over a year.
□ The temperature in degrees Fahrenheit of an oven used on a hot summer day.
Unit 4, Lesson 4: More Balanced Moves
Warm-Up: Different Equations?
Equation 1 �� − 3 = 2 − 4��
Which of these have the same solution as Equation 1? Be prepared to explain your reasoning.
Equation A
B
Equation C
D
Exploration Activity: Step by Step by Step by Step
Here is an equation, and then all the steps Clare wrote to solve it.
14�� − 2�� + 3 = 3(5�� + 9)
12�� + 3 = 3(5�� + 9)
3(4�� + 1) = 3(5�� + 9)
4�� + 1 = 5�� + 9
1 = �� + 9
−8 = ��
Here is the same equation, and the steps Lin wrote to solve it.
14�� − 2�� + 3 = 3(5�� + 9)
12�� + 3 = 3(5�� + 9)
12�� + 3 = 15�� + 27
12�� = 15�� + 24
−3�� = 24 �� = −8
1. Are both of their solutions correct? Explain your reasoning.
2. Describe some ways the steps they took are alike and different.
3. Mai and Noah also solved the equation, but some of their steps have errors. Find the incorrect step in each solution and explain why it is incorrect.
Mai’s solution
14�� − 2�� + 3 = 3(5�� + 9)
12�� + 3 = 3(5�� + 9)
7�� + 3 = 3(9)
7�� + 3 = 27
7�� = 24
�� = 24 7
Noah’s solution
14�� − 2�� + 3 = 3(5�� + 9)
12�� + 3 = 15�� + 27
27�� + 3 = 27
27�� = 24
�� = 24 27
Collaborative Activity: Make Your Own Steps
Solve each equation for ��.
1. 12 + 6�� 3 = 5−9 2
�� − 4 = 1 3(6�� − 54)
−(3�� − 12) = 9�� − 4
Lesson Summary
When solving an equation, it’s possible to make an error along the way. This could mean accidentally adding when we meant to subtract, missing a negative when we distributed, or forgetting to write an �� from one line to the next. There are many possible mistakes to watch out for.
Fortunately, each step in solving an equation results in a new equation with the same solution as the original. This means it’s easy to check if a solution is correct by substituting the value of the solution into the original equation.
2.
3.
For example, consider the work shown for solving the equation 2�� = −3(�� + 5).
2�� = −3(�� + 5)
2�� = −3�� + 15
5�� = 15
�� = 3
If we substitute 3 in place of �� into the original equation, the result is a statement that isn’t true, as shown.
2(3) = −3(3 + 5)
6 = −3(8)
6 = −24
This means a mistake must have been made somewhere. By checking the original steps carefully, we can find a mistake when distributing −3.
The corrected work is shown.
2�� = −3(�� + 5)
2�� = −3�� − 15
5�� = −15 �� = −3
Now, if we substitute −3 in place of �� into the original equation, the resulting equation is true, as shown.
2(−3) = −3(−3 + 5)
−6 = −3(2)
−6 = −6
Therefore, �� = −3 is the solution to the original equation.
Practice Problems
1. Solve 3(�� − 4) = 12��
2. Mai and Tyler work on the equation 2 5 �� + 1 = −11 together. Mai's solution is �� = −25 and Tyler's is �� = −28. Here is their work.
Mai’s solution
2 5 �� + 1 = −11
2 5 �� = −10 �� = −10 ⋅ 5 2 �� = −25
Tyler’s solution
2 5 �� + 1 = −11
2�� + 1 = −55 2�� = −56 �� = −28
Do you agree with their solutions? Explain or show your reasoning.
3. Describe what is being done in each step while solving the equation.
a. 2(−3�� + 4) = 5�� + 2
b. −6�� + 8 = 5�� + 2
c. 8 = 11�� + 2
d. 6 = 11��
e. �� = 6 11
4. Andre solved an equation, but when he checked his answer he saw his solution was incorrect. He knows he made a mistake, but he can’t find it. Where is Andre’s mistake and what is the solution to the equation? −2(3�� − 5) = 4(�� + 3) + 8
Review Problem
5. A length of ribbon is cut into two pieces to use in a craft project. The graph shows the length of the second piece, ��, for each length of the first piece, ��.
a. How long is the ribbon? Explain how you know.
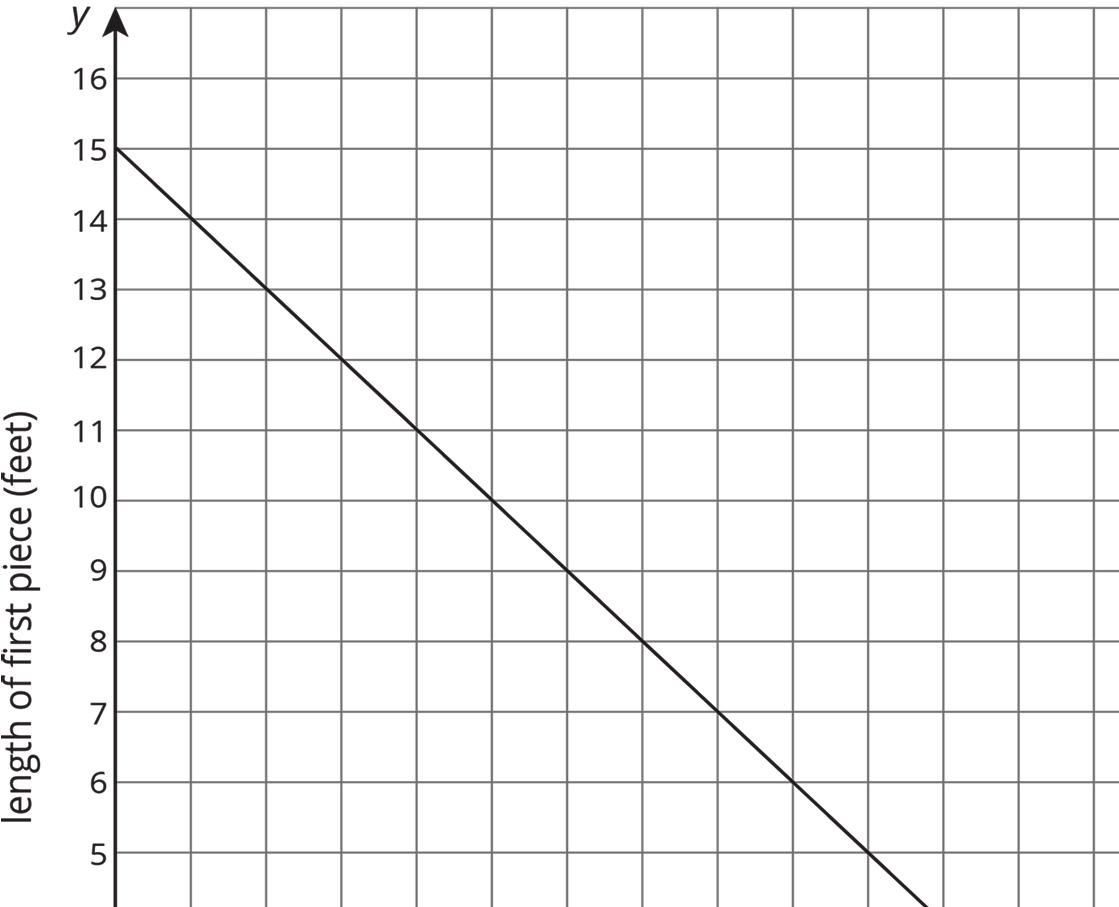
b. What is the slope of the line?
c. Explain what the slope of the line represents and why it fits the story.
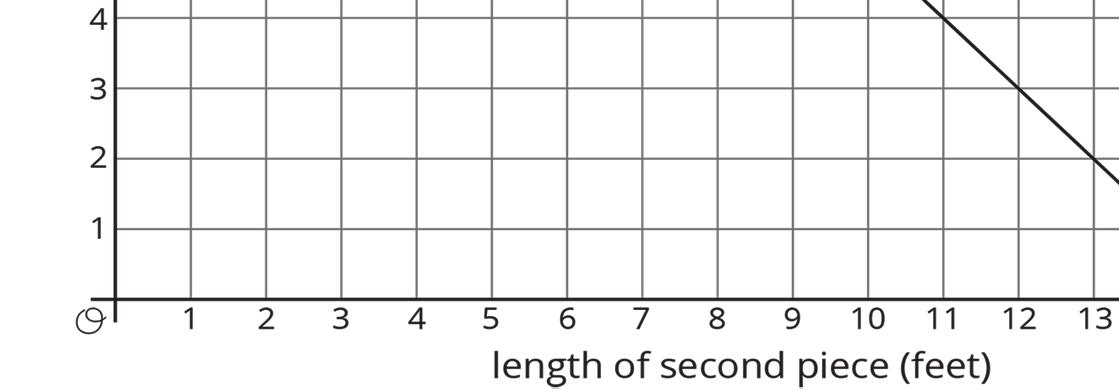

Unit 4, Lesson 5: Solving Any Linear Equation
Warm-Up: Equation Talk
Solve each equation mentally.
1. 5 − �� = 8
2. −1 = �� − 2
3. −3�� = 9 4. −10 = −5��
Collaborative Activity: Trading Moves
Your teacher will give you 4 cards, each with an equation.
1. With your partner, select a card and choose who will take the first turn.
2. During your turn, decide what the next move to solve the equation should be, explain your choice to your partner, and then write it down once you both agree. Switch roles for the next move. This continues until the equation is solved.
3. Choose a second equation to solve in the same way, trading the card back and forth after each move.
4. For the last two equations, choose one each to solve and then trade with your partner when you finish to check one another’s work.
Guided Activity: Solve Proportions with Linear Expressions
Recall from Unit 2 that corresponding sides of similar triangles are proportional.
1. Similar triangles ������ and ������ are shown.
a. A proportion relating corresponding sides is shown.
Create an equivalent proportion by substituting the lengths of the corresponding sides. =
b. Solve the equation for ��.
c. What is the length of ����?
2. Two figures are shown, where �������� is similar to ��������.
a. Write and solve an equation to find the value of ��.
b. Determine the length of each side.
Exploration Activity: A Puzzling Puzzle
Tyler says he invented a number puzzle. He asks Clare to pick a number, and then asks her to do the following.
• Triple the number
• Subtract 7
• Double the result
• Subtract 22
• Divide by 6
Clare says she now has a −3. Tyler says her original number must have been a 3. How did Tyler know that? Explain or show your reasoning. Be prepared to share your reasoning with the class.
Lesson Summary
There are many different ways to solve a one-variable equation. The goal is to make moves to get closer to the form of variable = some number. For example, �� = 5 or �� = 7 3 .
Since there are many ways to solve a one-variable equation, it helps to be strategic in moves that leave fewer terms or factors than there were in the previous step.
A term is a part of an expression. It can be a single number, a variable, or a number and a variable that are multiplied together.
For example, in the equation 3�� + 5 = 7, adding −5 to each side of the equal sign will result in an equation with fewer terms, 3�� = 2. Dividing each side of this equation by 3 will result in �� by itself on the left side of the equal sign, resulting in the solution �� = 2 3 .
In another example, the equation 4(5 − ��) = 12 is solved by first dividing each side by 4, resulting in the equation 5 − �� = 3.
Some people use the steps shown to solve a one-variable linear equation.
1. Use the distributive property so that all the expressions no longer have parentheses.
2. Collect like terms on each side of the equation.
3. Add or subtract an expression so that there is a variable on just one side.
4. Add or subtract an expression so that there is a constant value on the other side.
5. Multiply or divide by a number to result in an equation of variable = some number.
For example, these steps are shown to solve 9 − 2�� + 6 = −3(�� + 5) + 4��.
9 − 2�� + 6 = −3�� − 15 + 4��
15 − 2�� = �� − 15
15 = 3�� − 15
30 = 3��
10 = ��
Use the distributive property.
Combine like terms.
Add 2�� to each side.
Add 15 to each side.
Divide each side by 3.
Following these steps will always work, but it may not always be the most efficient method.
Practice Problems
1. Solve each of these equations. Explain or show your reasoning.
2(�� + 5) = 3�� + 1
3�� − 4 = 6 − 2��
3(�� + 2) = 9(6 − ��)
2. Clare was solving an equation, but when she checked her answer she saw her solution was incorrect. She knows she made a mistake, but she can’t find it. Where is Clare's mistake and what is the solution to the equation?
12(5 + 2��) = 4�� − (5 − 9��)
72 + 24�� = 4�� − 5 − 9��
72 + 24�� = −5�� − 5
24�� = −5�� − 77
29�� = −77 �� = −77 29
3. Solve each equation, and check your solution.
1 9 (2�� − 16) = 1 3 (2�� + 4)
−4(�� + 2) = 4(2 − 2��)
12(5 + 2��) = 4�� − (6 − 9��)
4. Similar triangles ������ and ������ are shown, where ���� and ���� correspond and ���� and ���� correspond. Write and solve an equation to find the value of ��.
Review Problem
5. A participant in a 21-mile walkathon walks at a steady rate of 3 miles per hour. He thinks, “The relationship between the number of miles left to walk and the number of hours I already walked can be represented by a line with slope −3.” Do you agree with his claim? Explain your reasoning.
Unit 4, Lesson 6: Strategic Solving
Warm-Up: Equal Perimeters
The triangle and the square have equal perimeters.
1. Find the value of ��.
2. What is the perimeter of each of the figures?
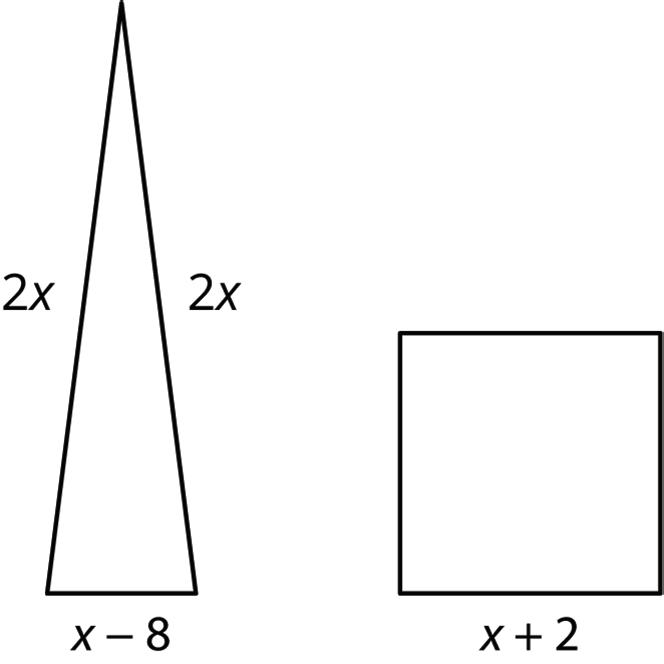
Exploration Activity: Activity: Predicting Solutions
Without solving, identify whether these equations have a solution that is positive, negative, or zero.
Collaborative Activity: Which Would You Prefer?
Nine equations are shown.
1. Consider the equations with your partner.
a. Without solving any of the equations, identify 3 equations that you and your partner think would be least difficult to solve, and write an L in each box next to these equations.
b. Then, identify 3 equations that you think would be the most difficult to solve, and write an M in each box next to these equations.
2. Choose 3 equations to solve. One equation must be from your list of least difficult equations, 1 from your list of most difficult equations, and 1 that was not on either list.
a. Circle the equations you will be solving from the original table.
b. Work with your partner to solve each equation. Write the equation being solved in the table, and show your work to find each solution in the space provided.
Most difficult Neither
Lesson Summary
Sometimes linear equations include several operations, grouping symbols, and variables on each side. For example, consider the equation �� − 2(�� + 5) = 3(2��−20) 6 .
The fraction on the right side of the equation includes the expression (2�� − 20) multiplied by 3 and divided by 6, which is the same as dividing by 2, so the equation can be rewritten as shown in step 1. It is now easier to see that all the terms in the numerator of right side are divisible by 2, resulting in the equation shown in step 2.
At this point, there are a variety of ways to solve the equation for ��. The remaining steps and explanations are shown in the table.
Step
Description
Simplify the expression on the right side.
Subtract �� from each side.
Divide both sides by −2.
Subtract 5 from each side.
Practice Problems
1. Solve each of these equations. Explain or show your reasoning.
a. 2�� + 8 − 5�� + 3 = −13 + 8�� − 5
b. 2�� + 7 − 5�� + 8 = 3(5 + 6��) − 12��
c. 2�� − 3 = 2(6 − ��) + 7��
2. Elena said the equation 9�� + 15 = 3�� + 15 has no solutions because 9�� is greater than 3��. Do you agree with Elena? Explain your reasoning.
3. Solve each equation and check your solution.
a. −3�� − 4 = �� + 3
b. 3(3 − 3��) = 2(�� + 3) − 30
c. 1 3 (�� + 4) − 6 = 2 3 (5 − ��)
Review Problems
4. Two similar quadrilaterals are shown, where �������� is similar to ��������. What is the value of ��?
5. The table gives some sample data for two quantities, �� and ��, that are in a proportional relationship.
a. Complete the table.
b. Write an equation that represents the relationship between �� and �� shown in the table.
c. Graph the relationship. Use a scale for the axes that shows all the points in the table.
Unit 4, Lesson 7: All, Some, or No Solutions
Warm-Up:
Which One Doesn’t Belong: Equations
Which one doesn’t belong?
A. 5 + 7 = 7 + 5
B. 5 ⋅ 7 = 7 ⋅ 5
C. 2 = 7 − 5
D. 5 − 7 = 7 − 5
Exploration Activity: Thinking about Solutions
Eight equations are shown.
1. Work with your partner to sort the equations into the 2 types, those that are true for all values of the variable and those that are true for no values of the variable.
True for All Values
True for No Values
2. Complete the equation by writing an expression on the right side so that this equation is true for all values of ��.
6(�� − 2) + 2 = ______________________
3. Complete the equation by writing an expression on the right side so that this equation is not true for any values of ��.
6(�� − 2) + 2 = ______________________
Collaborative Activity: What’s the Equation
1. Complete each equation so that it is true for all values of ��.
a. 3�� + 6 = 3(�� + _____ )
b. �� − 2 = −( _____ − ��)
c. 15��−10 5 = _____ − 2
2. Complete each equation so that it is true for no values of ��.
a. 3�� + 6 = 3(�� + _____ )
b. �� − 2 = −( _____ − ��)
c. 15��−10 5 = _____ − 2
3. Describe how you know whether an equation will be true for all values of �� or true for no values of ��.
Lesson Summary
An equation is a statement that says 2 expressions have an equal value.
Consider the equation 2�� = 6.
• The equation 2�� = 6 is a true statement if �� is 3 because 2 ⋅ 3 = 6.
• It is a false statement if �� is 4 because 2 ⋅ 4 ≠ 6.
The equation 2�� = 6 has one and only one solution, because there is only one number, 3, that can be doubled to get 6.
Some equations are true no matter what the value of the variable is.
For example, the equation 2�� = �� + �� is always true because double a number will always be the same as adding the number to itself. Equations like 2�� = �� + �� have an infinite number of solutions because they are true for all values of ��.
Some equations have no solutions. For example, the equation �� = �� + 1 has no solutions because no matter what the value of �� is, it can’t equal 1 more than itself.
When solving an equation, the goal is to find the value(s) of the variable that make(s) the equation true. When trying to solve the equation, allowable moves are made assuming the equation has a solution. But sometimes, after making these moves, an equation such as 8 = 7 may result. This statement is false, so it must be that the original equation had no solution at all, assuming no mathematical errors were made along the way.
Practice Problems
1. For each equation, decide if it is always true or never true.
a. �� − 13 = �� + 1
b. �� + 1 2 = �� − 1 2
c. 2(�� + 3) = 5�� + 6 − 3��
d. �� − 3 = 2�� − 3 − ��
e. 3(�� − 5) = 2(�� − 5) + ��
2. Mai says that the equation 2�� + 2 = �� + 1 has no solution because the left hand side is double the right hand side. Do you agree with Mai? Explain your reasoning.
a. Write the other side of this equation so it's true for all values of ��.
2(6�� − 10) − �� = ___________________
b. Write the other side of this equation so it's true for no values of ��.
2(6�� − 10) − �� = ___________________
4. Here is an equation that is true for all values of ��: 5(�� + 2) = 5�� + 10. Elena saw this equation and says she can tell 20(�� + 2) + 31 = 4(5�� + 10) + 31 is also true for any value of ��. How can she tell? Explain your reasoning.
Review Problems
5. Elena and Lin are trying to solve 1 2�� + 3 = 7 2 �� + 5. Describe the change they each make to each side of the equation.
a. Elena’s first step is to write 3 =
b. Lin’s first step is to write �� + 6 = 7�� + 10.
6. Solve each equation and check your solution.
3�� − 6 = 4(2 − 3��) − 8��
1 2�� + 6 = 3 2(�� + 6)
9 − 7�� = 8�� + 8
7. The point (−3, 6) is on a line with a slope of 4.
a. Find two more points on the line.
b. Write an equation for the line.
Unit 4, Lesson 8: How Many Solutions?
Warm-Up: Matching Solutions
Consider the unfinished equation 12(�� − 3) + 18 = _____.
Match the following expressions with the number of solutions the equation would have with that expression on the right hand side.
•
•
•
Collaborative Activity: Thinking about Solutions Some More
Your teacher will give you some cards.
1. With your partner, solve each equation.
2. Then, sort them into categories.
3. Describe the defining characteristics of those categories and be prepared to share your reasoning with the class.
1. 6(2�� − 3)
One solution?
2. 4(3�� – 3)
No solutions?
3. 4(2�� – 3)
All solutions?
Guided Activity: Make Use of Structure
For each equation, determine whether it has no solutions, exactly one solution, or is true for all values of �� (and has infinitely many solutions). If an equation has one solution, solve to find the value of �� that makes the statement true.
1.
2.
3.
4(2�� − 2) + 2 = 4(�� − 2)
4�� + 2(2�� − 3) = 8(�� − 1)
4�� + 2(2�� − 3) = 4(2�� − 2) + 2
6. What do you notice about equations with one solution? How is this different from equations with no solutions and equations that are true for every ��?
5.
Lesson Summary
Sometimes, it's possible to look at the structure of an equation and tell if it has infinitely many solutions or no solutions. For example, consider the equation shown.
2(12�� + 18) + 6 = 18�� + 6(�� + 7)
Using the distributive property on the left and right sides, the equation can be rewritten as 24�� + 36 + 6 = 18�� + 6�� + 42.
From here, collecting like terms results in the equation 24�� + 42 = 24�� + 42.
Since the left and right sides of the equation are the same, it can be concluded, without doing any more moves, that this equation is true for any value of ��. Therefore, it has infinitely many solutions.
Similarly, the structure of an equation can be used to tell if the equation has no solutions. For example, consider the equation 6(6�� + 5) = 12(3�� + 2) + 12.
The first few steps in a solution path for the equation are shown. At this point, additional steps do not need to be taken to realize that there is no solution.
1 6 ⋅ 6(6�� + 5) = 1 6 ⋅ (12(3�� + 2) + 12)
6�� + 5 = 2(3�� + 2) + 2
Multiply each side by 1 6 .
Distribute 1 6 on the right side. 6�� + 5 = 6�� + 4 + 2
Distribute 2 on the right side.
The last move makes it clear that the constant terms on each side of the equation, 5 and 4 + 2, are not the same.
In an expression like 5�� + 2, the number 2 is called the constant term because it doesn’t change when �� changes.
Since adding 5 to an amount is always less than adding 4 + 2 to that same amount, there are no solutions to this equation.
Performing moves to keep an equation balanced is a powerful part of solving equations, but thinking about what the structure of an equation reveals about the number of solutions is just as important.
Practice Problems
1. Lin was looking at the equation 2�� − 32 + 4(3�� − 2462) = 14��. She said, “I can tell right away there are no solutions, because on the left side, you will have 2�� + 12�� and a bunch of constants, but you have just 14�� on the right side.” Do you agree with Lin? Explain your reasoning.
2. Han was looking at the equation 6�� − 4 + 2(5�� + 2) = 16��. He said, “I can tell right away there are no solutions, because on the left side, you will have 6�� + 10�� and a bunch of constants, but you have just 16�� on the right side.” Do you agree with Han? Explain your reasoning.
3. Decide whether each equation is true for all, one, or no values of ��.
a. 6�� − 4 = −4 + 6��
b. 4�� − 6 = 4�� + 3
c. −2�� + 4 = −3�� + 4
Review Problems
4. Solve each of these equations. Explain or show your reasoning.
a. 3(�� − 5) = 6
b. 2 ��� − 2 3 � = 0
c. 4�� − 5 = 2 − ��
5. The points (−2, 0) and (0, −6) are each on the graph of a linear equation. Is (2, 6) also on the graph of this linear equation? Explain your reasoning.
6. In the picture triangle ��′��′��′ is an image of triangle ������ after a rotation. The center of rotation is ��.
a. What is the length of side ����? Explain how you know.
b. What is the measure of angle ��′? Explain how you know.
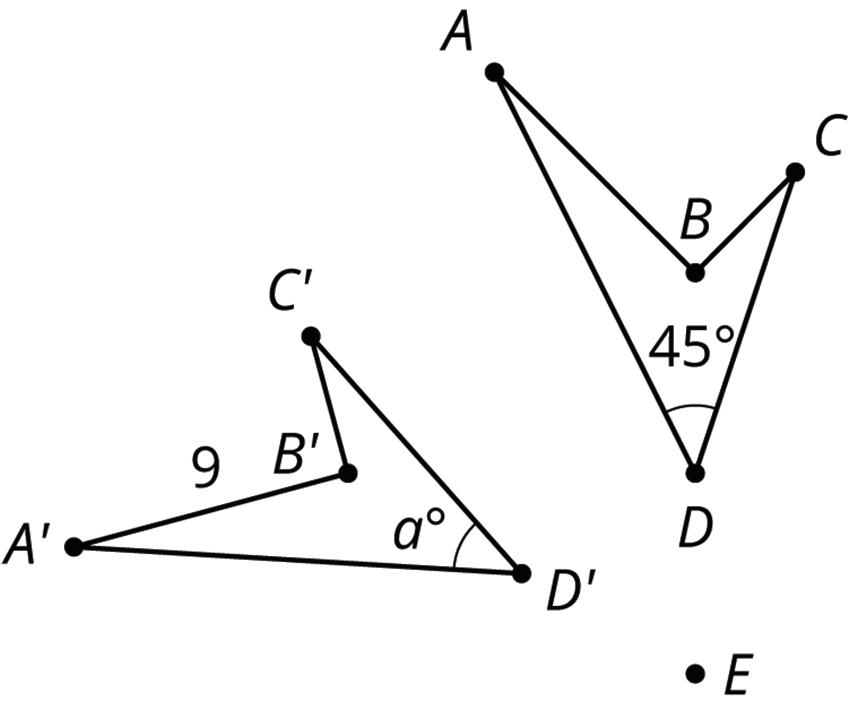
Unit 4, Lesson 9: Solutions in Different Representations
Warm-Up: Which One Doesn’t Belong: Lines in the Plane
Which one doesn’t belong? Explain your reasoning.

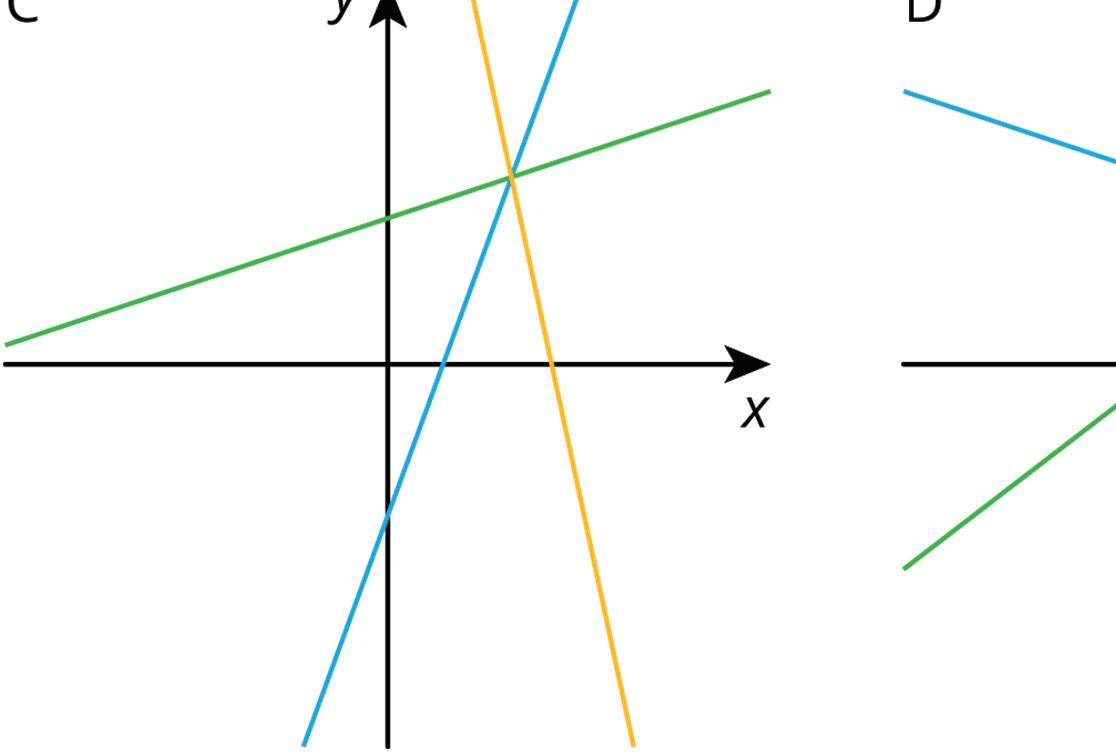
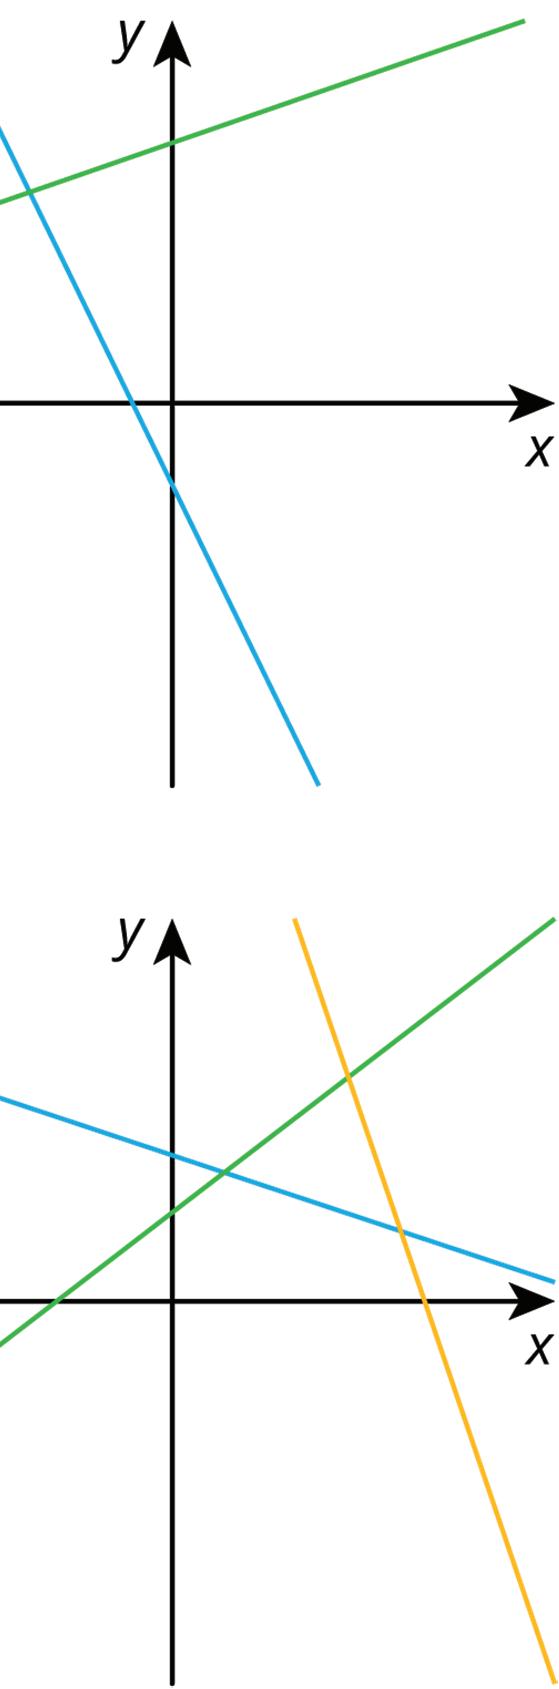
Guided Activity: Solving Equations Using Graphs and Tables
1. Solve the equation −�� + 5 = 1 2 �� + 2.
2. The equation −�� + 5 = 1 2 �� + 2 can be written as 2 linear equations, �� = −�� + 5 and �� = 1 2 �� + 2.
a. Complete the table of values for each linear equation.
b. Use the tables of values to identify the point that both equations share.
c. Discuss with your partner how to find the solution of the equation −�� + 5 = 1 2 �� + 2 using the tables of values.
3. The equation −�� + 5 = 1 2 �� + 2 can be graphed as 2 lines on the coordinate plane.
a. Graph the lines �� = −�� + 5 and �� = 1 2 �� + 2 on the coordinate plane.
b. Discuss with your partner how to find the solution of the equation −�� + 5 = 1 2 �� + 2 using the graph.
4. Complete the statements.
The solution to the equation −�� + 5 = 1 2 �� + 2 can be found using the slopes ��-intercepts point of intersection of the graphs of �� = −�� + 5 and �� = 1 2 �� + 2. The point (________ , ________) is a point on the graph of both lines. Therefore, its ��-value ��-value is the solution to the equation −�� + 5 = 1 2 �� + 2. This can also be shown in the tables of values because when �� = ______, the ��-values are different. the same.
5. Josh uses a graph to solve the equation 0.2�� + 0.6�� = 0.8�� − 3.2.
a. Write the 2 equations that Josh should use to determine the solution of the equation 0.2�� + 0.6�� = 0.8�� − 3.2.
b. Josh’s graphs of the 2 linear equations are shown on the coordinate plane.
Use the graph to describe the solution(s) of the equation 0.2�� + 0.6�� = 0.8�� − 3.2.
6. Eliza plans to use tables to solve the equation −0.5�� + 6 = 6 − 1 2 ��.
a. Write the 2 equations that Eliza should use to determine the solution of the equation −0.5�� + 6 = 6 − 1 2 ��.
b. Complete the table of values for each linear equation written in part A.
c. Use the tables of values to describe the solution(s) of the equation −0.5�� + 6 = 6 − 1 2 ��.
Collaborative Activity: Card Sort: Solving Equations
Your teacher will give you 16 cards.
1. Work with your partner to match the graphs, tables of values, and solution(s) to each equation.
2. Describe the strategies you and your partner used to determine how to correctly group each set of representations.
Lesson Summary
Various methods can be used to find the solution(s) to an equation in 1 variable, including solving algebraically, using graphs, and using tables of values.
A solution to an equation is a number that can be used in place of the variable to make the equation true.
• To solve a linear equation algebraically, apply properties of operations and properties of equality to isolate the variable to 1 side of the equation. When solving, pay special attention to variables occurring on both sides of the equal sign, as well as any grouping symbols, such as parentheses.
• To solve a linear equation using graphs, graph the lines formed by the expressions on each side of the equal sign. Then, look for the coordinate point at the intersection of the 2 lines. The ��-value of the point of intersection is the solution of the equation.
• To solve a linear equation using tables of values, start by evaluating the expression on each side of the equal sign for the same ��-value. When evaluating each expression, the ��-values in the tables represent the result. Continue building the tables of values until the same (��, ��) point is found for both expressions. The ��-value resulting in the same ��-value in both tables is the solution to the equation.
Any of these methods can also be used to determine whether a one-variable equation has no solutions or infinitely many solutions.
Practice Problems
1. Consider the equation 2�� + 5 = 1 3 �� + 10.
a. Complete the tables of values.
b. Use the tables to determine the number of solutions to the equation 2�� + 5 = 1 3 �� + 10
2. Graphs and tables used to determine the number of solutions to one-variable linear equations are shown. Select all representations that show there are no solutions to the equation used to create the representations.
3. Jacinta graphed the equations �� = �� − 1.3 + 2.1�� and �� = 2.1�� − 0.3 on the coordinate plane, as shown, to solve the equation −1.3 + 2.1�� = 2.1�� − 0.3.
Jacinta incorrectly stated that the graph shows that the equation −1.3 + 2.1�� = 2.1�� − 0.3 has infinitely many solutions. Explain why Jacinta’s statement is incorrect.
Review Problems
4. Explain whether �� = −1 is a solution to the linear equation −7�� + 3 = −3�� − 1. Show your work.
5. Solve the linear equation 4(�� − 1) + 6 = 2�� − 8.
Unit 4, Lesson 10: Solving Inequalities
Warm-Up: Equations vs. Inequalities
1. The work for solving the equation 17 = 5�� + 9 and the work for solving the inequality 17 < 5�� + 9 are shown.
Complete the table with the justification of each step used for solving the equation and the inequality.
17 = 5�� + 9
= 5�� 5
< 5�� + 9
5 < 5�� 5 1.6 < ��
Guided Activity: Solving and Graphing One-Variable Linear Inequalities
1. Two inequalities and their solutions are shown in the table. Inequality A Inequality B
a. What properties of inequalities were used to solve each inequality?
Properties Used to Solve Inequality A
Properties Used to Solve Inequality B
b. How did the final step of solving the inequality 13 ≥ −5�� − 7 differ from the final step of solving the inequality 17 < 5�� + 9?
c. Graph each solution set on the number line provided.
2. Two inequalities are given in the table.
a. Solve each inequality, and then graph each solution set on the number line provided.
C
b. Check your work with your partner, and resolve any differences.
c. Compare the given inequalities, the steps in solving each inequality, and the 2 solutions.
d. Discuss with your partner how the graph of each solution set can be found using previous work from this problem. Then, graph each solution set.
Collaborative Activity: Error Analysis
1. Work with your partner to identify the errors in each solution method shown in the table. Circle the mistake in each solution method. Then, solve the inequality correctly, and graph the solution set.
Inequality
2(3�� − 2) > −2 6�� − 4 > −2
+4
−6 > 2 −6
> −4
− �� 3 ≥ 3
−5
2.5 − 4�� ≥ 10.5
−2.5 4�� 4 ≥ 8 4 �� ≥ 2
Corrected Work Graph of
Solution Set
Corrected Work Graph of Solution Set
3(2�� − 3) 3 < 0 3 3�� − 3 < 0
3�� 3 < 3 3 �� < 1
Lesson Summary
The equation 2�� = 10 is a one-variable equation. Its solution is any value of �� that makes the equation true. The only value that can be identified as a solution to the equation is �� = 5.
The inequality 2�� < 10 is a one-variable inequality. Any value of �� that makes an inequality true is a solution to the inequality. In this case, any ��-value less than 5 will make the inequality true, so the solution to the inequality is �� < 5.
A solution to an inequality is a number that can be used in place of the variable to make the inequality true.
When the variable term in an inequality is negative, the inequality can be rewritten by multiplying or dividing the inequality by −1. In the resulting inequality, each term and the comparison symbol will change to its opposite.
Solutions to inequalities can be represented using the symbols <, >, ≤, and ≥. The solution set for any one-variable inequality can be represented on a number line with a point, open or closed, at the constant value in the solution and a ray extending in either direction on the number line to indicate which values are included as part of the solution. Recall that an open circle indicates the endpoint is not included in the solution set, while a closed circle indicates that it is included. The solution set for the inequality 2�� < 10 is represented on the number line shown.
Practice Problems
Solve each inequality, and represent the solution set on the number line provided.
5. Decide whether each equation is true for all, one, or no values of ��.
a. 2�� + 8 = −3.5�� + 19
b. 9(�� − 2) = 7�� + 5
c. 3(3�� + 2) − 2�� = 7�� + 6
Unit
4,
Lesson
11: Solving Inequalities with Variables on Both Sides
Warm-Up: Solving Equations with Variables on Both Sides
Solve each equation.
1. 3�� − 2.5 = 2(5 − ��)
2. 2�� − 3 4 = 1.75�� + 1 2
Guided Activity: Solutions to One-Variable Inequalities
A solution to an inequality is any value that, when substituted for the variable, makes the inequality statement true.
A list of possible solutions for the inequalities 3 + �� 2 < 4 and 16 >
1. Without solving the inequalities, determine whether each of the possible values is a solution to each inequality.
a. Record the solutions in the table.
b. Explain any strategies you used to identify the solution(s).
c. Solve 3 + �� 2 < 4.
d. Solve 16 > 4� 1 2 �� + 3�.
e. Verify that the possible solutions identified in part A support the solutions you found in parts C and D. Discuss with your partner why this is the case.
2. Solve each linear inequality, and graph the solution on the number line.
7(3�� + 4) ≥ 10 + 3��
a.
3. Leon and Ashley each solved the inequality 2(6 − ��) > 2 3 �� in different ways. Their partial work is shown.
Leon’s Work
2(6 − ��) > 2 3 �� 12 − 2�� > 2 3 ��
Ashley’s Work
2(6 − ��) > 2 3 �� 6(6 − ��) > 2��
a. Describe Leon’s and Ashley’s first steps to solve the inequality.
b. Solve the inequality 2(6 − ��) > 2 3 �� using either Leon’s or Ashley’s first step.
Collaborative Activity: Inequality Card Sort
Your teacher will give you 12 cards with inequalities, solutions, and graphs. Work with your partner to match each inequality, solution, and graph card to the given information.
Lesson Summary
When working with inequalities, it’s helpful to remember what each symbol represents in words.
• 100 < �� means “100 is less than ��.”
• �� ≤ 55 means “�� is less than or equal to 55” or “�� is at most 55.”
• 20 > 18 means “20 is greater than 18” or “20 is more than 18.”
• �� ≥ 40 means “�� is greater than or equal to 40” or “�� is at least 40.”
Note that any inequality can be rewritten or read in the opposite direction. For example, the inequality �� ≤ 7 can be rewritten as 7 ≥ �� and read as either “�� is less than or equal to 7” or “7 is greater than or equal to ��.”
Practice Problems
1. Select all of the inequalities that have the solution �� < 3. □ 3(2�� − 1) + 2 < 3�� + 8
(3�� − 6) < 10
(4�� + 2) > −7
□ 7�� − 2 > �� + 16
□ 5�� + 10 < 4(�� + 3) + 1
2. Solve −(�� + 4) − 6 ≤ 3�� + 10, and graph the solution on the number line.
3. Samuel incorrectly solved the inequality 1 4 (4�� + 12) < 3(�� − 1) + 14. His work is shown.
Explain Samuel’s error.
Samuel’s
Work
1 4 (4�� + 12) < 3(�� − 1) + 14 �� + 3
Review Problems
4. Consider the partial linear equation 3(�� − 2) + 7 = 3�� + .
a. Complete the right side of the equation so that the equation is true for all values of ��.
3(�� − 2) + 7 = 3�� +
b. Complete the right side of the equation so that the equation is true for no values of ��.
3(�� − 2) + 7 = 3�� +
5. Chiara was solving the equation 3(�� + 4) = 12. She stated that �� has to be positive because a positive number times a positive number will result in 12. Explain whether you agree with Chiara.
Unit 4, Lesson 12: Solving One-Variable Linear Inequalities
Warm-Up: Translating Inequalities
Write an inequality statement to describe each situation, using the variable �� for the unknown quantity.
Situation
1. The speed limit is 55 miles per hour.
2. A truck can tow up to 6,000 pounds.
3. You must be at least 48 inches tall to ride a certain roller coaster.
4. There are more than 10 animals in an exhibit at the zoo.
5. A restaurant needs to serve at least 200 meals per day to profit.
Guided Activity: Multistep Linear Inequalities
1. Mariana and Zion were working to solve the inequality shown.
Mariana and Zion took different first steps to solve the inequality. Their first steps are shown in the table.
a. Explain what Mariana did in her first step.
b. Explain what Zion did in his first step.
c. Discuss with your partner whether Mariana and Zion will get the same answer based on their first steps. Summarize your discussion.
d. Finish solving the inequality for both Mariana and Zion in the table, continuing from their first steps.
e. Write the solution of the inequality.
f. Graph the solution set of the inequality.
2. Use the inequality 0.04�� + 1.02 > −0.27�� + 17.14 to complete the following.
a. Solve the inequality.
0.04�� + 1.02 > −0.27�� + 17.14
b. Graph the solution set on the number line.
Collaborative Activity: Multistep One-Variable Inequalities
1. Marquis made an error in solving the inequality 82�� + 10 5 − 35 < 90. His work is shown.
Inequality
+ 10 5 − 35 < 90
a. With your partner, identify the step where Marquis made an error. Write a note to Marquis explaining his error.
b. Solve the inequality 82�� + 10 5 − 35 < 90.
c. Write the solution for the inequality.
d. Graph the solution set on the number line.
2. Grenada Lake in Mississippi is known to have calico bass, a freshwater species of fish that prefers warm climates. The equation �� = 3.08�� + 7.844 models the relationship between the length, ��, in inches (in.), and the weight, ��, in pounds (lb.), of the average calico bass. Legally, any calico bass caught at Grenada Lake that is less than 12 in. long must be released immediately. The inequality 3.08�� + 7.844 ≥ 12 can be used to determine whether a calico bass that has been caught is allowed to be kept.
a. Solve the inequality 3.08�� + 7.844 ≥ 12.
b. Explain what the solution represents in the context.
Lesson Summary
Inequalities can be used to represent and solve many real-world problems. Just like with equations, it’s important to remember what the variable represents in a given scenario. As the solution is determined in equations and inequalities, ask yourself, “Does this value make sense in this context?” It’s often easy to check your work by making sure that the solution makes sense in context.
For example, suppose Mona is sewing a rectangular quilt that needs to be 8 feet (ft.) in length and have a perimeter of at least 24 ft. The inequality 16 + 2�� ≥ 24 can be used to determine possible widths of the quilt. The solution of the inequality is �� ≥ 4, which means that the width needs to be at least 4 ft. However, it doesn’t make sense that any value greater than or equal to 4 would work, since a quilt with a very large width would not be practical. For example, a standard queen size bed is 5 ft. across, so a quilt with a width of more than 10 ft. would be lying on the floor, too large to be useful.
When working with real-world scenarios, it’s always important to make sense of which values are possible mathematically, a.k.a. the solution. Then, consider which values are reasonable based on the real-world context.
Practice Problems
1. Miren has quiz scores of 75%, 82%, and 90% so far this quarter. She wants to have a quiz average of at least 85% for the quarter, and there is 1 more quiz before the quarter ends. The inequality 75 + 82 + 90 + �� 4 ≥ 85 can be used to represent this situation.
a. Solve the inequality 75 + 82 + 90 + �� 4 ≥ 85.
b. Explain what the solution set represents in this context.
Solve the inequality 0.06�� + 2.56 > −0.15�� + 8.86.
3.
4. Solve each equation.
a. 3�� + 16 = −2(5 − 3��)
b. 2�� − 3(4 − ��) = 3�� + 4
c. 3�� − 6 9 = 4 − 2�� − 3
Unit 5, Lesson 1: Inputs and Outputs
Warm-Up: Dividing by 0
Study the statements carefully.
• 12 ÷ 3 = 4 because 12 = 4 ⋅ 3
• 6 ÷ 0 = �� because 6 = �� ⋅ 0
What value can be used in place of �� to create true statements? Explain your reasoning.
Exploration Activity: Guess My Rule
Keep the rule cards face down. Decide who will go first.
1. Player 1 picks up a card and silently reads the rule without showing it to Player 2.
2. Player 2 chooses an integer and asks Player 1 for the result of applying the rule to that number.
3. Player 1 gives the result, without saying how they got it.
4. Keep going until Player 2 correctly guesses the rule.
After each round, the players switch roles.
Collaborative Activity: Making Tables
For each input-output rule, fill in the table with the outputs that go with a given input. Add two more input-output pairs to the table.
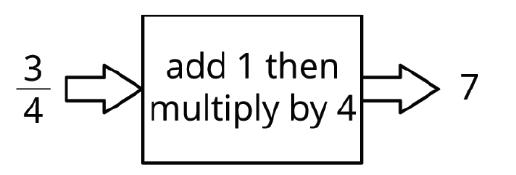
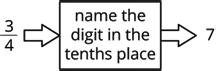
Pause here until your teacher directs you to the last rule.

Lesson Summary
An input-output rule is a rule that takes an allowable input and uses it to determine an output.

For example, the diagram shown represents the rule that takes any number as an input, and then adds 1, multiplies by 4, and gives the resulting number as an output.
In some cases, not all inputs are allowable, and the rule must specify which inputs will work. For example, this rule is fine when the input is 2.
But the same rule for an input of −3 would become 6 ÷ 0, which would not result in a real number. So, in some rules, it is also important to identify which inputs are not allowed.
Practice Problems
1. A rule is shown.
Complete the table for the function rule for the following input values.
2. Here is an input-output rule.
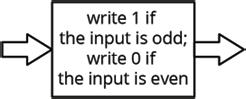
Complete the table for the input-output rule. Input −3
Output
Review Problems
3. For what value of �� do the expressions 2�� + 3 and 3�� − 6 have the same value?
4. Andre’s school orders some new supplies for the chemistry lab. The online store shows a pack of 10 test tubes costs $4 less than a set of nested beakers. In order to fully equip the lab, the school orders 12 sets of beakers and 8 packs of test tubes.
a. Write an equation that shows the cost of a pack of test tubes, ��, in terms of the cost of a set of beakers, ��.
b. The school office receives a bill for the supplies in the amount of $348. Write an equation with �� and �� that describes this situation.
c. Since �� is in terms of �� from the first equation, this expression can be substituted into the second equation where �� appears. Write an equation that shows this substitution.
d. Solve the equation for ��.
e. How much did the school pay for a set of beakers? For a pack of test tubes?
Unit 5, Lesson 2: Exploring Different Representations of Relations
Warm-Up: Input-Output Tables
Complete the input-output table for each rule.
1. Subtract 3, and then multiply by 5.
2. Multiply by 2, and then add 3.
Guided Activity: Representing Mathematical Rules and Relations
In the table shown, a rule was used to get each output value from its corresponding input value.
1. Work with your partner to determine the rule for the previous table. Then, complete the statement to describe the rule.
Each input output value is the result of taking the input output and adding 10 to it. dividing it by 3. multiplying it by 3. subtracting 10 from it.
2. Work with your partner to complete the input-output table for each rule. The first row has been completed as an example.
and then
by 4.
Write 1 if the input is odd; write 0 if the input is even.
Each table represents a relation.
Relations can also be represented by mapping diagrams. The mapping diagram shown represents input-output pairs for the rule “divide by 4, and then add 2.”
3. Work with your partner to complete the statements.
In a mapping diagram, an input output is mapped to its corresponding input output
using an arrow. In the mapping diagram above, the input 8 results in
for the relation shown.
4. Work with your partner to complete the mapping diagram for each rule.
5. Complete the statements.
The input values output values of a relation depend on the values used for the inputs. outputs. Therefore, the inputs are the dependent variables, independent variables, and the outputs are the dependent variables. independent variables.
Relations can be represented using graphs.
Each relation in the table is shown alongside its mapping diagram and graph.
6. With your partner, discuss your observations in comparing the mapping diagrams and graphs for each relation.
7. Complete the statements.
The mapping diagram for each of the relations has 2 3 4 input-output pairs
indicated by arrows. The graph showing the same relation has 2 3 4 points.
The input value from the mapping diagram matches the ��-value ��-value of each point on the graph, and its corresponding output value from the mapping diagram matches the ��-value ��-value of each point on the graph.
A relation can also be represented by a set of ordered pairs.
8. The set of ordered pairs shown can be used to represent relation A from the previous table.
{(−2,−3), �0, 5 2 �, (1.5, −1), (3, −3)}
Write the set of ordered pairs that represents relation B from the previous table.
Lesson Summary
Input-output pairs can be presented in a variety of ways, including lists, tables, mapping diagrams, written descriptions, and graphs. Each of these representations can be used to model a relation.
A relation is a set of input-output pairs.
Input values represent independent variables, while the output values are dependent on the rule defined for the relationship. In future lessons, special relations will be explored, including additional representations, such as equations.
Practice Problems
1. The graph of a relation is shown.
Complete the table of values and the mapping diagram for the relation.
2. The table of values for a relation is shown.
Complete the rule for the relation.
3. A mapping diagram for a relation is shown.
Gretchen graphed the relation, but she made an error. Her graph is shown.
Explain Gretchen’s error.
4. The point �� has coordinates (3, 2). The point �� is reflected over the ��-axis.
Label the image of point �� as ��′, and identify the coordinates of ��′.
5. A U-pick blueberry farm offers 5 pounds (lb.) of blueberries for $16.50.
Sketch a graph of the relationship between cost and lb. of blueberries.
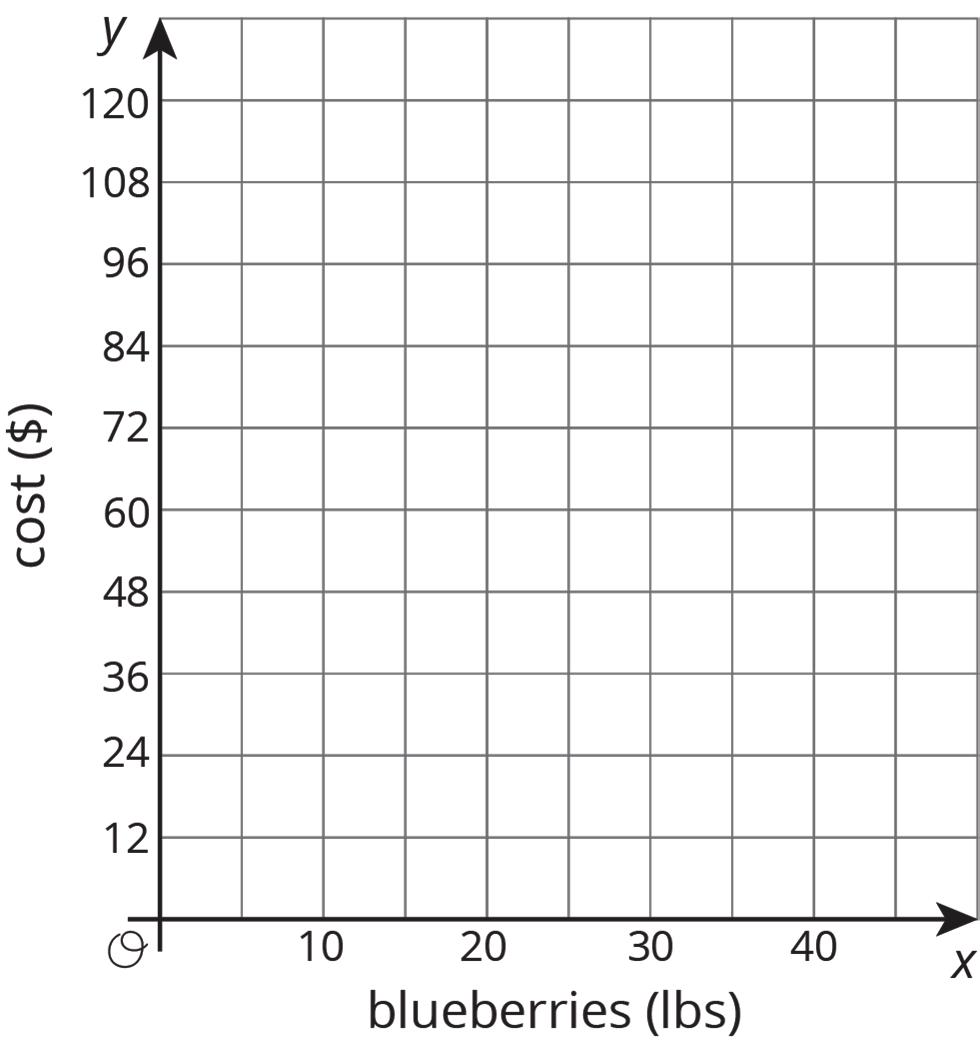
Unit 5, Lesson 3: Domain and Range
Warm-Up: Create a Pattern
1. Place a digit in each blue box to create a pattern where the next number changes by the same amount each time. Use only the digits 0 to 9, without repeating any digits. , , , ...
Guided Activity: Introducing Domain and Range
1. Consider the statements shown.
12 ÷ 3 = 4 because 12 = 4 ∙ 3.
4 ÷ �� = 1 because 4 = �� ∙ 1.
6 ÷ 0 = �� because 6 = �� ∙ 0.
a. In the second statement, what value can be used in place of �� so that the statement is true?
b. In the third statement, what value can be used in place of �� so that the statement is true?
The inputs of a relation are described as its domain. The domain of a relation can be written as a list of values or as an inequality. In some cases, 1 or more values are not allowed in the domain of a relation. The domain for a relation can be represented using inequalities that include all possible input values defined as ��.
2. Consider the rule shown for a relation.
a. Complete the table of values using the relation.
b. Identify any values for �� that are not allowed in the domain of the relation.
c. Work with your partner to determine if there is another input that is not allowed for the relation 1 �� .
d. Complete the statements to identify the domain of the relation.
The domain of the relation is �� > or �� < . These 2 inequalities can also be written as one statement, �� ≠ .
The outputs of a relation are described as its range. The range of a relation can be written as a list of values or as an inequality. In some cases, 1 or more values are not possible in the range of a relation. The range of a relation can be represented using inequalities that include all possible output values defined as ��.
3. Consider the rule shown for a relation.
a. Complete the mapping diagram for the relation.
b. Based on the rule, what type of output values are not possible for this relation?
c. Write an inequality to represent the range of this relation.
In some cases, the domain and range cannot be written as an inequality because the relation includes only specific values. In such cases, the domain and range are written as a set of numbers within brackets, { and }.
4. For each relation, write the domain and range as a set of numbers.
Relation A
Relation B
There are also instances where the domain and range of a relation can be represented by a compound inequality. For example, −4 ≤ �� ≤ 3 5 is a compound inequality that reads as “−4 is less than or equal to ��, which is less than or equal to 3 5 .” This inequality is true for any value of �� between −4 and 3 5 , including either of those values.
5. A graph is shown.
a. Represent the domain and range of the graph using compound inequalities.
Domain:
Range:
b. Compare this graph to relation A in the previous problem. Discuss with your partner why the domain and range of this graph could not be represented by writing the elements of each in a list.
Collaborative Activity: Identifying Domain and Range of a Relation
1. Identify the domain and range of each relation. Represent the domain and range as lists or using inequalities.
{(2.3, 7.4), (3.8, 6), (1.9, 5.2), (2.3, 8)}
Lesson Summary
The domain of a relation can be represented as a list or an inequality of all possible ��- values that can be used in the relation. The range of a relation can be represented as a list or an inequality of all possible ��-values that can be used in the relation.
Domain is the complete set of possible values of the input of a function or relation. The domain may vary depending on the context.
Range is the complete set of possible values of the output of a relation or function.
When organized in a list, the values are written in increasing order without duplicates. When represented as an inequality, a compound inequality is often used.
A compound inequality is a conjunction of two or more inequalities.
As you continue learning the different representations of input-output relations, you will be able to apply the concepts of domain and range in comparing different features of relationships between the variables.
Practice Problems
1. Five relations are shown. Select all of the relations with the domain {−4, 1, 3, 7}. □ {(7, 2), (1, 4), (3, 4), (−4, −1)}
2. The graph of a relation is shown.
a. Identify the domain of the relation.
b. Identify the range of the relation.
3. A rule is shown for a relation.
divide 3 by the sum of the input and 2 x 3 x + 2
Identify the domain of the relation.
Review Problems
4. The graphs represent the positions of 2 turtles in a race.
a. On the same axes, draw a line for a third turtle that is going half as fast as the turtle represented by line ��.
b. Explain how your line shows that the turtle is going half as fast.
Elapsed time (sec)
Distance traveled (cm)
5. Four successive positions of a shape are shown.
1
Describe how the shape moves from . . .
a. . . . frame 1 to frame 2.
b. . . . frame 2 to frame 3.
c. . . . frame 3 to frame 4.
Frame
Frame 2
Frame 3 Frame 4
Unit 5, Lesson 4: Introduction to Functions
Warm-Up: Square Me
Here are some numbers in a list.
1. How many different numbers are in the list?
2. Make a new list containing the squares of all these numbers.
3. How many different numbers are in the new list?
4. Explain why the two lists do not have the same number of different numbers.
Guided Activity: Is It a Function?
A function is a mathematical relation where each input corresponds to exactly 1 output.
1. Two relations are shown.
A
• Shaquana says neither relation A nor relation B is a function.
• Jason says relation A is not a function but reasons that relation B is a function.
Complete the statements.
I agree with Shaquana. Jason. I know that relation B is is not a function because each input output does does not correspond with only 1 input. output.
2. A relation is given as a set of ordered pairs.
{(2, 4), (1, 1), (−1, 4), (−3, 1), (0, −3)}
a. Determine with your partner who will be partner A and who will be partner B. Represent the relation using the method indicated in the table.
Mapping Diagram (Partner A) Graph (Partner B)
b. Check your partner’s representation. Once you both agree that each representation is correct, complete the other representation in your book.
c. Complete the statements to explain how each representation shows whether the relation is a function.
The mapping diagram has
only 1 arrow to only 1 arrow from more than 1 arrow to more than 1 arrow from each input output to its corresponding input. output. Therefore, the relation is is not a function.
The graph demonstrates that the relation is is not a function, because
each ��-value at least 1 ��-value corresponds to exactly 1 ��-value more than 1 ��-value on the graph.
Collaborative Activity: Relations and Functions
A relation or function can be represented using a mapping diagram, a table of values, a set of ordered pairs, or a graph.
The table shows relations that are and are not functions, in different representations.
Set of Ordered Pairs {(6, 5), (5, −6), (−4, 1), (−4, 5)} {(−6, 5), (5, 5), (−2, 5), (−4, 5)}
1. Complete the statement.
For each function represented, each input output corresponds to only 1 input. output.
2. For each relation represented that is not a function, circle the inputs that correspond to more than 1 output.
3. Complete the table by identifying the domain and range of each relation.
Relation That Is Not a Function
Mapping Diagram
Table of Values
Set of Ordered Pairs
Domain: Range:
Domain: Range:
Domain: Range:
Relation That Is a Function
Domain: Range:
Domain: Range:
Domain: Range: Graph
Domain: Range:
Domain: Range:
4. Discuss with your partner which relation(s) has (have) a domain and range that must be expressed as an inequality. Summarize your discussion.
5. Explain which input-output rules could describe the same function, if any.
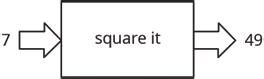
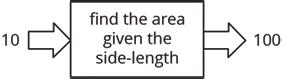
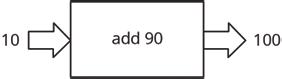
Lesson Summary
In some cases of an input-output rule, each allowable input gives exactly 1 output. In such cases, the output depends on the input, or the output is a function of the input.
A function is a mathematical relation for which each element of the domain corresponds to exactly one element in the range.
For example, the area of a square is a function of the side length because you can find the area from the side length by squaring it. So, when the input is 10 centimeters (cm), the output is 100 square centimeters (sq. cm).
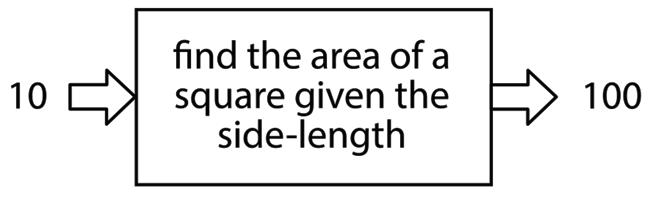
Sometimes there may be different rules that describe the same function. As long as each input corresponds to the same output, the rules describe the same function.
Practice Problems
1. Determine whether each relation is a function. Then, explain your reasoning.
{(3, 7), � 1 3 , 2�, (−4, 0.6), (0, 2)}
Function Not a function
Function Not a function
2. These tables correspond to inputs and outputs. Which of these input and output tables could represent a function rule, and which ones could not? Explain or show your reasoning.
A: Table B:
Table
Table C: Table D:
3. A group of students is timed while sprinting 100 meters (m). Each student’s speed can be found by dividing 100 m by their time. Is each statement true or false? Explain your reasoning.
a. Speed is a function of time.
b. Time is a function of distance.
c. Speed is a function of number of students racing.
d. Time is a function of speed.
Review Problem
4. Diego’s history teacher writes a test for the class with 26 questions. The test is worth 123 points and has two types of questions: multiple choice worth 3 points each, and essays worth 8 points each. How many essay questions are on the test? Explain or show your reasoning.
Unit 5, Lesson 5: Equations for Functions
Warm-Up: A Square’s Area
Fill in the table of input-output pairs for the given rule. Write an algebraic expression for the rule in the box in the diagram.
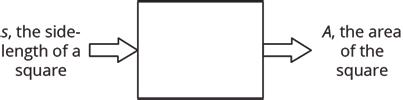
Exploration Activity: Diagrams, Equations, and Descriptions
Record your answers to these questions in the table provided.
1. Match each of these descriptions with a diagram.
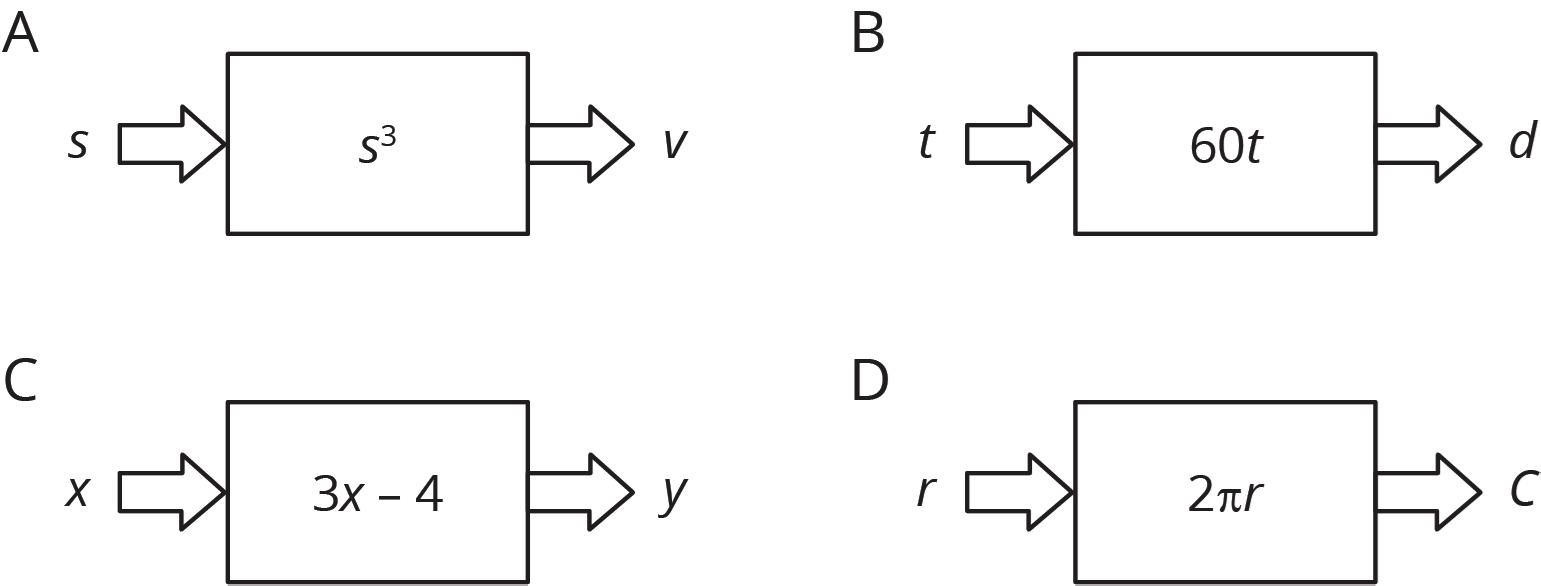
a. the circumference, ��, of a circle with radius, ��
b. the distance in miles (mi.), ��, that you would travel in �� hours (hr.) if you drive at 60 miles per hour (mph)
c. the output when you triple the input and subtract 4
d. the volume of a cube, �� given its edge length, ��
2. Write an equation for each description that expresses the output as a function of the input.
3. Find the output when the input is 5 for each equation.
4. Name the independent and dependent variables of each equation.
Collaborative Activity: Dimes and Quarters
Jada had some dimes and quarters that had a total value of $12.50. The relationship between the number of dimes, ��, and the number of quarters, ��, can be expressed by the equation 0.1�� + 0.25�� = 12.5.
1. If Jada has 4 quarters, how many dimes does she have?
2. If Jada has 10 quarters, how many dimes does she have?
3. Is the number of dimes a function of the number of quarters? If yes, write a rule (that starts with �� =...) that you can use to determine the output, ��, from a given input, ��. If no, explain why not.
4. If Jada has 25 dimes, how many quarters does she have?
5. If Jada has 30 dimes, how many quarters does she have?
6. Is the number of quarters a function of the number of dimes? If yes, write a rule (that starts with �� =...) that you can use to determine the output, ��, from a given input, ��. If no, explain why not.
Lesson Summary
Functions can be represented with equations. For example, the area, ��, of a circle is a function of the radius, ��, and can be expressed as the equation �� = ����2. This function can also be represented with an input- output diagram, as shown.
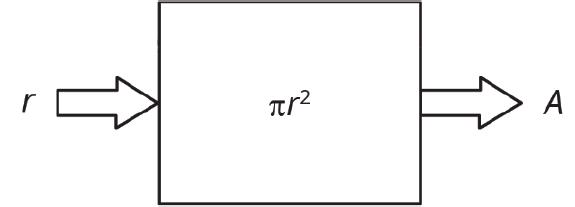
In this case, the radius, ��, is the input, and the area of the circle, ��, is the output. For example, if the input is a radius of 10 centimeters (cm), then the output is an area of 100�� square centimeters (sq. cm), or about 314 sq. cm. Because this is a function, the area, ��, can be determined for any given radius, ��.
Since it is the input, the radius is the independent variable, and since it is the output, area is the dependent variable.
The independent variable is used to calculate the value of another variable.
The dependent variable is a variable representing the output of a function.
Sometimes, when a function is given in equation form, either variable could be the independent variable. For example, in the equation 10�� − 4�� = 120, either �� or �� can be used as the independent variable by isolating either variable on one side of the equal sign.
The equation where �� is written as a function of �� is �� = 0.4�� + 12. The equation where �� is written as a function of �� is �� = 2.5�� − 30.
Practice Problems
1. Here is an equation that represents a function: 72�� + 12�� = 60. Select all the different equations that describe the same function.
□ 120�� + 720�� = 600
□ �� = 5 − 6��
□ 2�� + 12�� = 10
□ �� = 5 + 6��
□ �� = 5 6 − �� 6
□ 7�� + 2�� = 6
□ �� = 5 6 + �� 6
2. Brown rice costs $2 per pound (lb.), and beans cost $1.60 per lb. Lin has $10 to spend on these items to make a large meal of beans and rice for a potluck dinner. Let �� be the number of lb. of beans Lin buys and �� be the number of lb. of rice she buys when she spends all her money on this meal.
a. Write an equation relating the two variables.
b. Rearrange the equation so �� is the independent variable.
c. Rearrange the equation so �� is the independent variable.
3. Solve each equation and check your answer.
a. 2�� + 4(3 − 2��) = 3(2�� + 2) 6 + 4
b. 4�� + 5 = −3�� − 8
Unit 5, Lesson 6: Tables, Equations, and Graphs of Functions
Warm-Up: Doubling Back
What do you notice? What do you wonder?
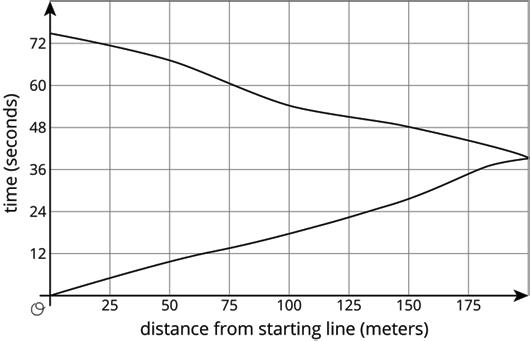
Exploration Activity: Running around a Track
1. Kiran was running around the track.
The graph shows the time, ��, he took to run various distances, ��. The table shows his time in seconds (sec.) after every three meters (m).
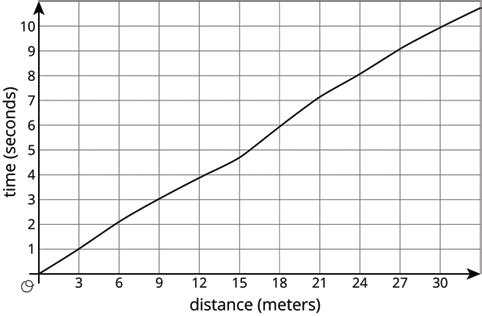
a. How long did it take Kiran to run 6 m?
b. How far had he gone after 6 sec.?
c. Estimate when he had run 19.5 m.
d. Estimate how far he ran in 4 sec.
e. Is Kiran’s time a function of the distance he has run? Explain how you know.
2. Priya is running once around the track. The graph shows her time given how far she is from her starting point.

a. What was her farthest distance from her starting point?
b. Estimate how long it took her to run around the track.
c. Estimate when she was 100 m from her starting point.
d. Estimate how far she was from the starting line after 60 sec.
e. Is Priya’s time a function of her distance from her starting point? Explain how you know.
Collaborative Activity: Function Representations
In a function, each input value corresponds to exactly 1 output value. A graph or a list of ordered pairs can be used to verify whether a relation can be classified as a function.
Several relations are shown, represented as graphs and ordered pairs.
{(2, 7), (3, 7), (2, −1), (7, 3)}
{(1, 9), (−2, 8), (0, 12), (−6, 0)}
{(−5, −1), (9, 3), (4, −1), (−2, 6)}
{(−5, 8), (6, −4), (2, 11), (−5, −7)}
1. Complete the table by sorting the relations (labeled by letter) into functions and non-functions.
Functions
Non-functions
2. Discuss with your partner how you decided which relations were functions. Summarize your discussion.
3. Complete the table by identifying the domain and range of each relation.
Lesson Summary
The graph of the amount of time, in sec., that it takes Noah to run a distance, in m, is shown on the coordinate plane.
The time since he started running is a function of the distance he has run. The point (18, 6) on the graph indicates that it takes Noah 6 sec. to run 18 m. The input is 18, and the output is 6.
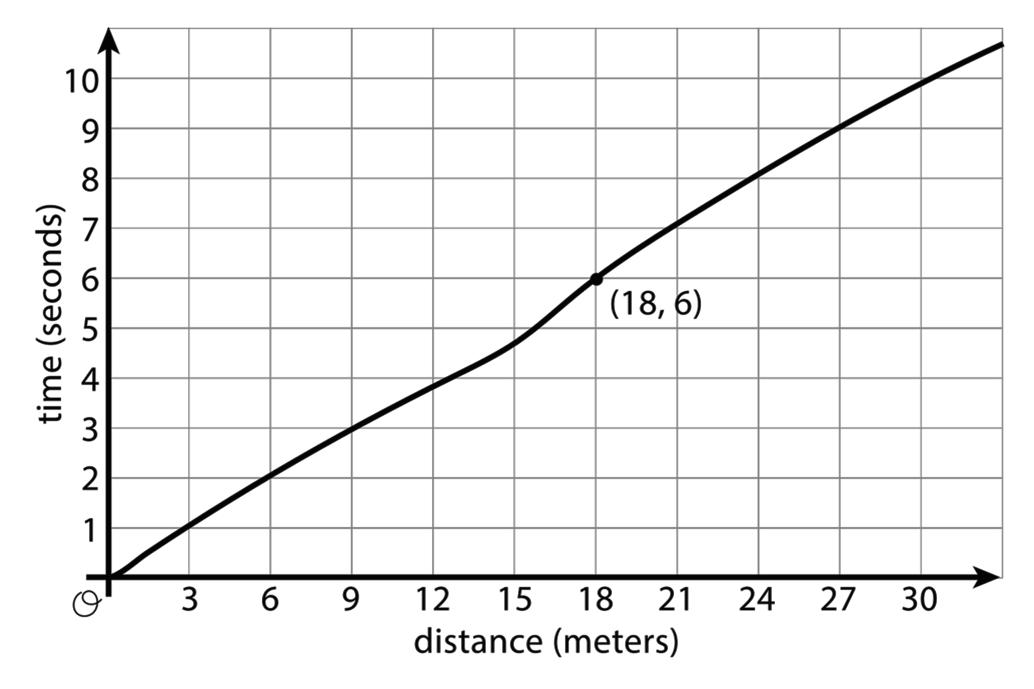
The graph of a function is all the coordinate pairs (input, output) plotted on the coordinate plane. By convention, the input is always the first coordinate, which means that the inputs are represented on the horizontal axis and the outputs are represented on the vertical axis.
Practice Problems
1. The amount Lin’s sister earns at her part-time job is proportional to the number of hours she works. She earns $9.60 per hour (hr.).
a. Write an equation in the form �� = ���� to describe this situation, where �� represents the hr. she works and �� represents the dollars she earns.
b. Is �� a function of ��? Explain how you know.
c. Write an equation describing �� as a function of ��.
2. The graph and the table show the high temperatures in a city over a 10-day period.
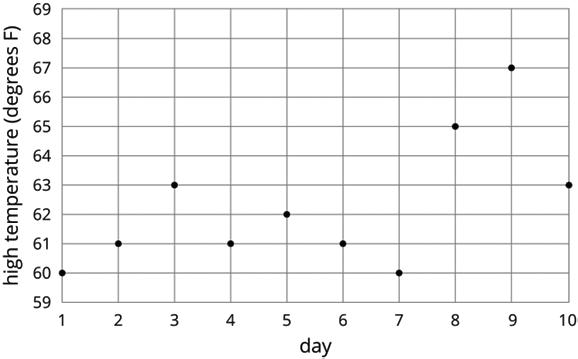
a. What was the high temperature on Day 7?
b. On which days was the high temperature 61 degrees?
c. Is the high temperature a function of the day? Explain how you know.
d. Is the day a function of the high temperature? Explain how you know.
3. Use the equation 2�� + 4�� = 16 to complete the table, then graph the line using �� as the dependent variable.
Review Problem
4. Select all the relations that are functions.
□
{(1, 3), (3, 7), (5, 11), (7, 15), (9, 19)}
□ {(1, 3), (1, 7), (5, 11), (5, 15), (9, 19)}
□ {(−2, 4), (−1, 1), (0, 0), (1, 1), (2, 4)}
□ {(2, 4), (1, 1), (0, 0), (1, −1), (2, −4)}
□
{(6, 3), (4, 1), (2, 1), (0, −1), (−2, −3)}
□ {(1, 3), (3, 7), (3, 11), (7, 15), (9, 19)}
□
{(1, 3), (3, 7), (5, 11), (9, 15), (9, 19)}
Unit 5, Lesson 7: Key Features of Functions
Warm-Up: Multiple Representations of a Line
1. The equation of a line is given. Use the equation to complete the table of values. Then, plot the ordered pairs and connect the points to create a rough sketch of the graph.
Guided Activity: Key Features of Functions
1. The graph of a line segment is shown on the coordinate plane.
a. Explain whether the line segment is a function.
(–3, 3)
(0, 1)
(1.5, 0)
b. Identify the intercept(s) of the line segment.
c. Determine the domain and range of the line segment.
(5, –2.333)
d. Complete the statements.
Since the domain of the line segment can be written using a list, an inequality, the domain type is discrete. continuous.
e. Explain whether the graph is increasing, decreasing, or constant.
2. The graph of a relation is shown on the coordinate plane.
a. Explain whether the relation is a function.
b. Complete the table of key features.
Key Features
��-intercept(s) Domain Type Continuous Discrete ��-intercept
3. Six relations are shown.
Complete the table to identify which relations are functions and whether each is discrete or continuous.
Collaborative Activity: More Key Features of Functions
1. The graph of a relation is shown on the coordinate plane.
a. Explain whether the relation is a function.
b. Complete the table of key features.
Key Features
��-intercept(s)
Domain Type Continuous Discrete
��-intercept Increasing interval(s)
Domain Decreasing interval(s)
Range
Constant interval(s)
2. The graph of a relation is shown on the coordinate plane.
a. Explain whether the relation is a function.
b. Complete the table of key features.
Key Features
��-intercept(s)
-intercept
Lesson Summary
A domain is considered discrete when the input values consist of a set of values that are distinct and separate on a finite or infinite interval. A domain is considered continuous when the input values consist of a set of values and can take on any value within a finite or infinite interval.
Some of the key features of a function that can be determined from a graph are summarized in the table.
Key Feature Description
��-intercept(s)
��-intercept
Domain
Range
Domain type
Increasing interval
Decreasing interval
Constant interval
Determine where the function intersects the ��-axis.
Determine where the function intersects the ��-axis.
Determine all the possible inputs, or ��-values, for the given function.
Determine all the possible outputs, or ��-values, for the given function.
Determine whether the function is discrete or continuous.
An interval of the domain, written as an inequality, where the ��-values of the function increase from left to right
An interval of the domain, written as an inequality, where the ��-values of the function decrease from left to right
An interval of the domain, written as an inequality, where the ��-values of the function do not change
Practice Problems
1. A table of values for a relation is shown.
a. Explain whether the relation is a function.
b. Determine the domain, and explain whether it is discrete or continuous.
2. The graph of a relation is shown.
Complete the table of key features.
Key Features ��-intercept(s) Domain Type Continuous Discrete
3. Here are two points: (−3, 4), (1, 7). What is the slope of the line between them? A. 4 3 B. 3 4 C. 1 6
D. 2 3
4. Match each graph to its equation. a. �� = 2�� + 3
b. �� = −2�� + 3
c. �� = 2�� − 3 d. �� = −2�� − 3
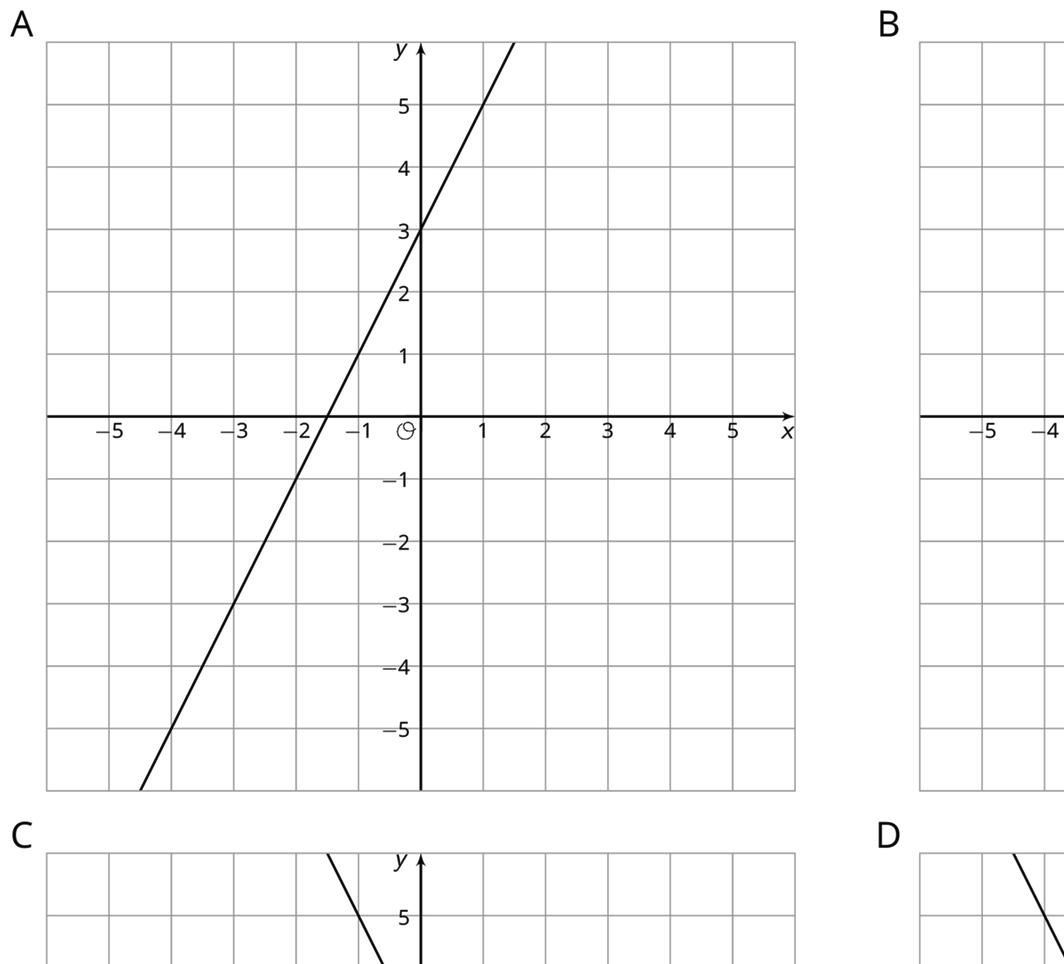
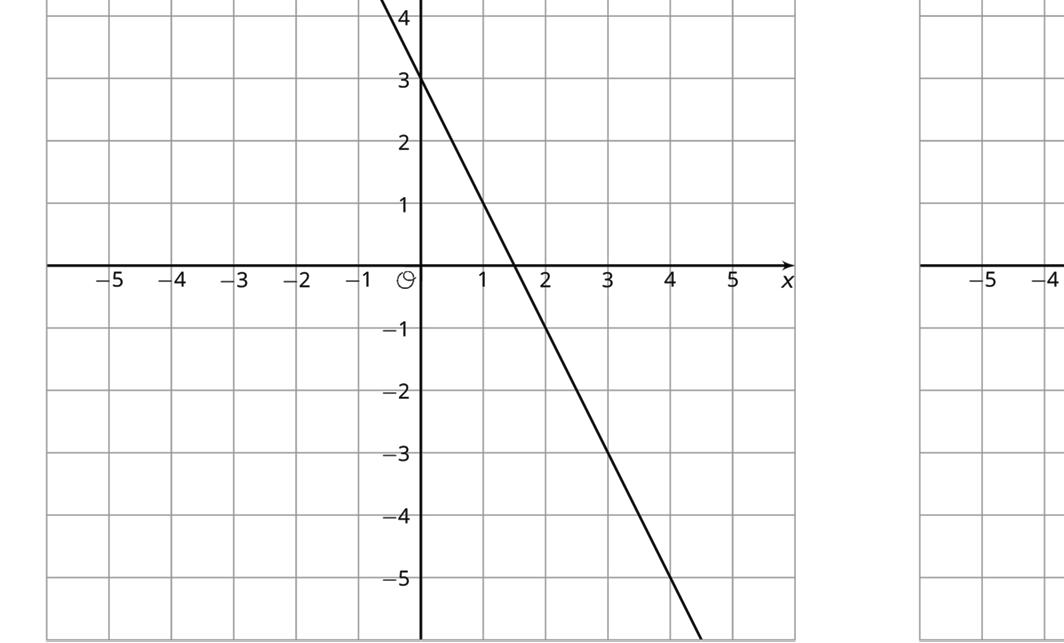
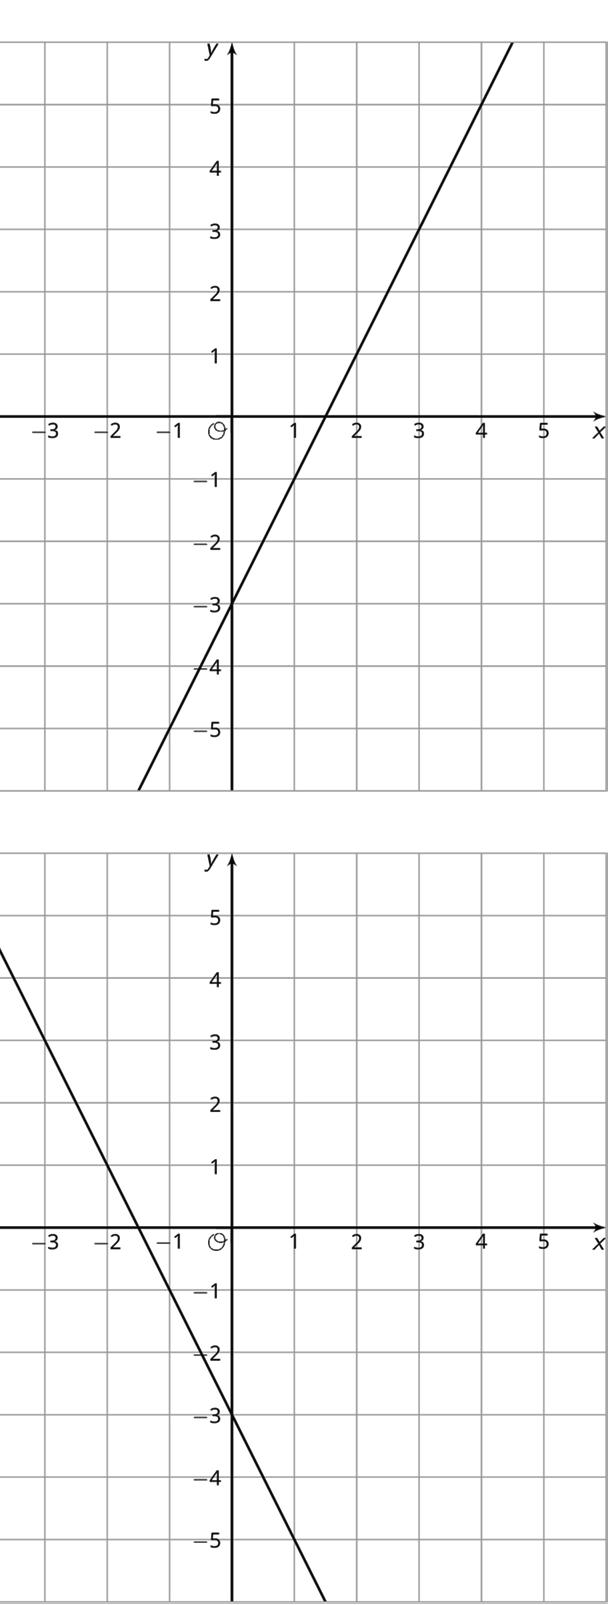
Unit 5, Lesson 8: More Graphs of Functions
Warm-Up: Which One Doesn’t Belong: Graphs
1. Which graph doesn’t belong?
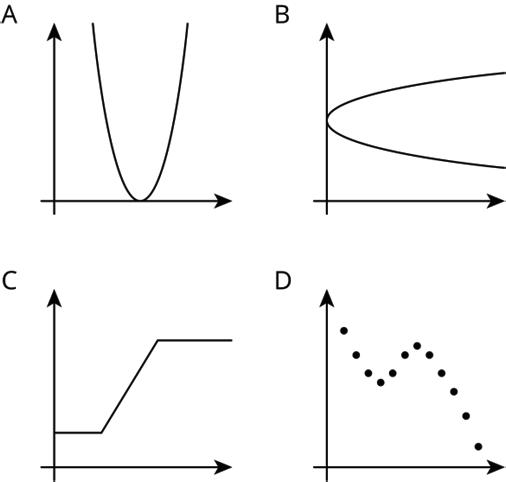
Exploration Activity: Time and Temperature
The graph shows the temperature between noon and midnight in one day in a certain city.
1. Was it warmer at 3:00 p.m. or 9:00 p.m.?
2. Approximately when was the temperature highest?
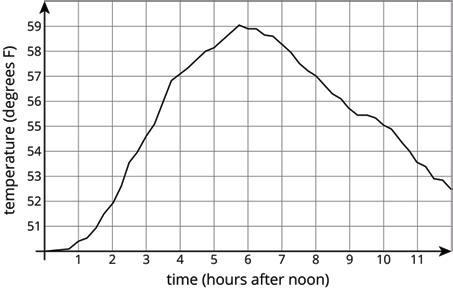
3. Find another time that the temperature was the same as it was at 4:00 p.m.
4. Did the temperature change more between 1:00 p.m. and 3:00 p.m. or between 3:00 p.m. and 5:00 p.m.?
5. Does this graph show that temperature is a function of time, or time is a function of temperature?
6. When the input for the function is 8, what is the output? What does that tell you about the time and temperature?
Collaborative Activity: Garbage
1. The graph shows the amount of garbage produced in the US each year between 1991 and 2013.
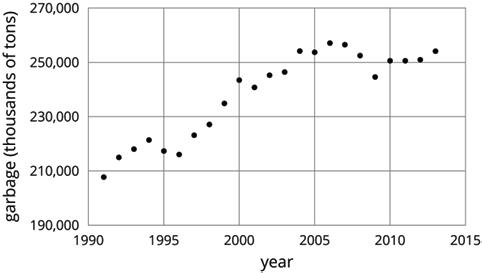
a. Did the amount of garbage increase or decrease between 1999 and 2000?
b. Did the amount of garbage increase or decrease between 2005 and 2009?
c. Between 1991 and 1995, the garbage increased for three years, and then it decreased in the fourth year. Describe how the amount of garbage changed in the years between 1995 and 2000.
2. The graph shows the percentage of garbage that was recycled between 1991 and 2013.
a. When was it increasing?
b. When was it decreasing?

c. Tell the story of the change in the percentage of garbage recycled in the US over this time period.
Lesson Summary
A graph showing a town’s temperature, in degrees Fahrenheit (℉), as a function of time after 8:00 p.m., in hours (hr.), is shown on the coordinate plane.

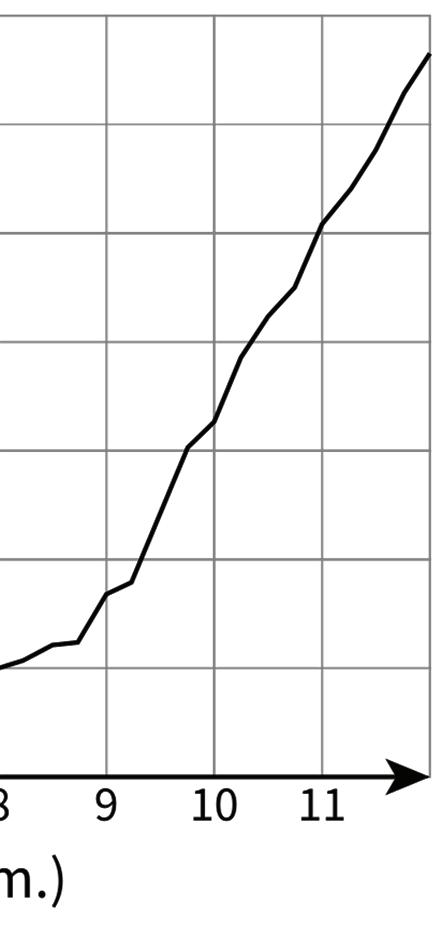
The graph of a function describes what is happening in the context that the function represents. In this example, the temperature starts out at 60℉ at 8:00 p.m. It decreases during the night, reaching its lowest point at 8 hr. after 8:00 p.m., or 4:00 a.m. Then, it starts to increase again.
Practice Problems
1. A car is traveling on a small highway and is either going 55 miles per hour (mph) or 35 mph, depending on the speed limits, until it reaches its destination 200 miles (mi.) away. Letting �� represent the amount of time in hours that the car is going 55 mph, and �� being the time in hr. that the car is going 35 mph, an equation describing the relationship is 55�� + 35�� = 200.
a. If the car spends 2.5 hr. going 35 mph on the trip, how long does it spend going 55 mph?
b. If the car spends 3 hr. going 55 mph on the trip, how long does it spend going 35 mph?
c. If the car spends no time going 35 mph, how long would the trip take? Explain your reasoning.
2. The graph represents an object that is shot upwards from a tower and then falls to the ground. The independent variable is time in seconds (sec.) and the dependent variable is the object’s height above the ground in meters (m).
a. How tall is the tower from which the object was shot?
b. When did the object hit the ground?
c. Estimate the greatest height the object reached and the time it took to reach that height. Indicate this situation on the graph.
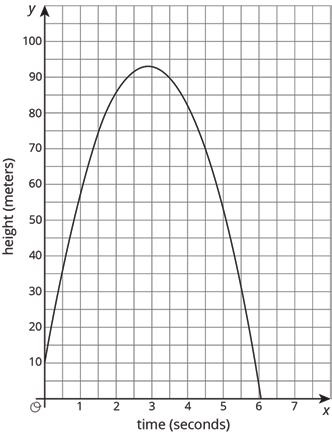
Unit 5, Lesson 9: Even More Graphs of Functions
Warm-Up: Dog Run
Here are five pictures of a dog taken at equal intervals of time. Diego and Lin drew different graphs to represent this situation.


They both used time as the independent variable. What do you think each one used for the dependent variable? Explain your reasoning.
Exploration Activity: Which Graph Is It?
For each situation,
• name the independent and dependent variables
• pick the graph that best fits the situation, or sketch the graph if one isn’t provided
• label the axes
• answer the question: which quantity is a function of which? Be prepared to explain your reasoning.
1. Jada is training for a swimming race. The more she practices, the less time it takes for her to swim one lap.
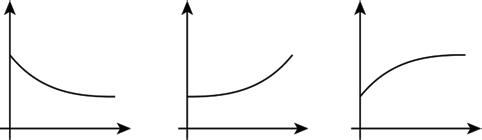
2. Andre adds some money to a jar in his room each week for 3 weeks and then takes some out in week 4.
Guided Activity: Sketching a Story about a Boy and a Bike
Noah was at home. He got on his bike and rode to his friend’s house and stayed there for a while. Then, he rode home again. Then, he rode to the park. Then, he rode home again.
1. Create a set of axes, and sketch a graph of this story.
2. What are the 2 quantities? Label the axes with their names and units of measure.
3. Which quantity is a function of which? Explain your reasoning.
4. Based on your graph, is his friend’s house or the park closer to Noah’s home? Explain how you know.
5. Reread the story and all your responses. Does everything make sense? If not, make changes to your work.
Collaborative Activity: Card Sort
1. Work with your partner to match the cards. Write the number of the description that matches the graph.
2. For the graph that matches Interpretation Card 6, write a story that matches this graph.
3. A graph that shows the distance from home versus time is shown.
Alexandra says the relationship represented by the graph is not possible. Explain why.
Lesson Summary
The graph shown represents Nynan’s distance as a function of time.
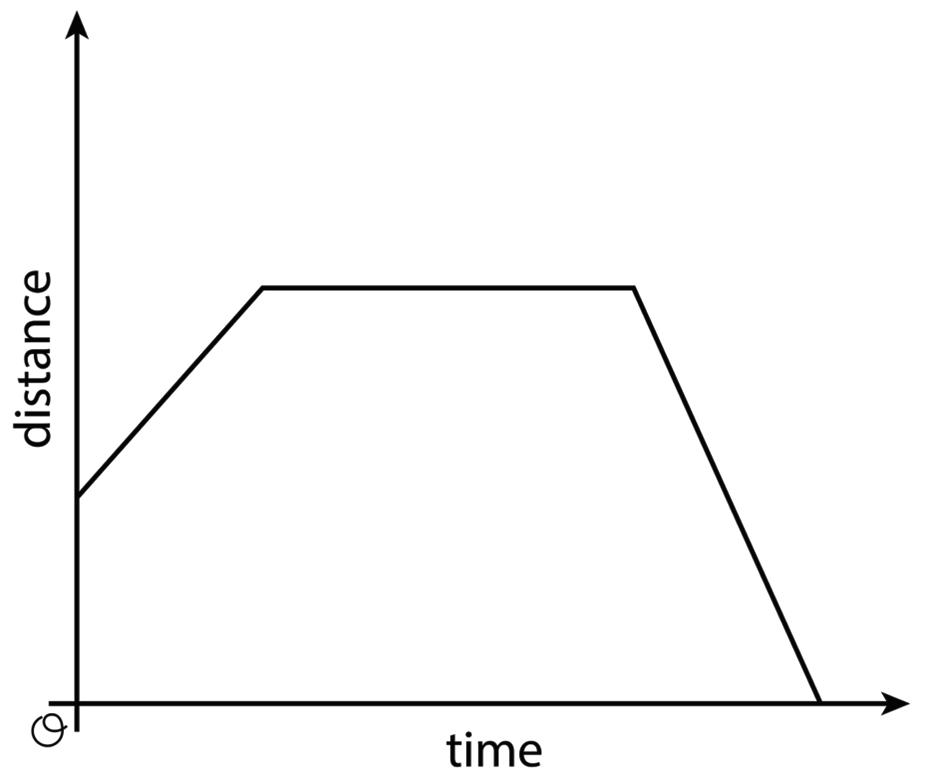
For a graph representing a context, it’s important to specify the quantities represented on each axis. For example, if this is showing distance from home, then Nynan starts at some distance from home (maybe at his friend’s house), moves farther away (maybe to a park), and then returns home. If instead the graph is showing distance from school, the story may be that Nynan starts out at home, moves farther away (maybe to a friend’s house), and then goes to school. What could the story be if the graph is showing distance from a park?
Practice Problems
1. Match the graph to the following situations (you can use a graph multiple times). For each match, name possible independent and dependent variables and how you would label the axes.
A. i. Tyler pours the same amount of milk from a bottle every morning.
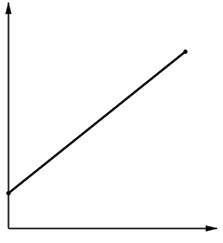
B. ii. A plant grows the same amount every week.
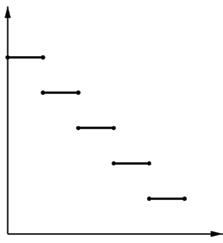
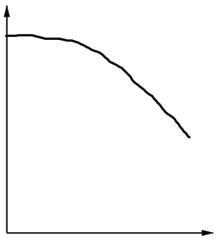
iii. The day started very warm but then it got colder.
iv. A carnival has an entry fee of $5 and tickets for rides cost $1 each.
2. Jada fills her aquarium with water. The graph shows the height of the water, in centimeters (cm), as a function of time, in minutes (min.).
a. Invent a story about how Jada fills the aquarium that fits the graph.

b. What are the domain and range of the function?
Review
Problems
3. Recall the formula for area of a circle.
a. Write an equation relating a circle’s radius, ��, and area, ��.
b. Is area a function of the radius? Is radius a function of the area?
c. Fill in the missing parts of the table.
4. The points with coordinates (4, 8), (2, 10), and (5, 7) all lie on the line 2�� + 2�� = 24.
a. Create a graph, plot the points, and sketch the line.
b. What is the slope of the line you graphed?
c. What does this slope tell you about the relationship between lengths and widths of rectangles with perimeter 24?
Unit 5, Lesson 10: Connecting Representations of Functions
Warm-Up: Which Are the Same? Which Are Different?
Here are three different ways of representing functions. How are they alike? How are they different?
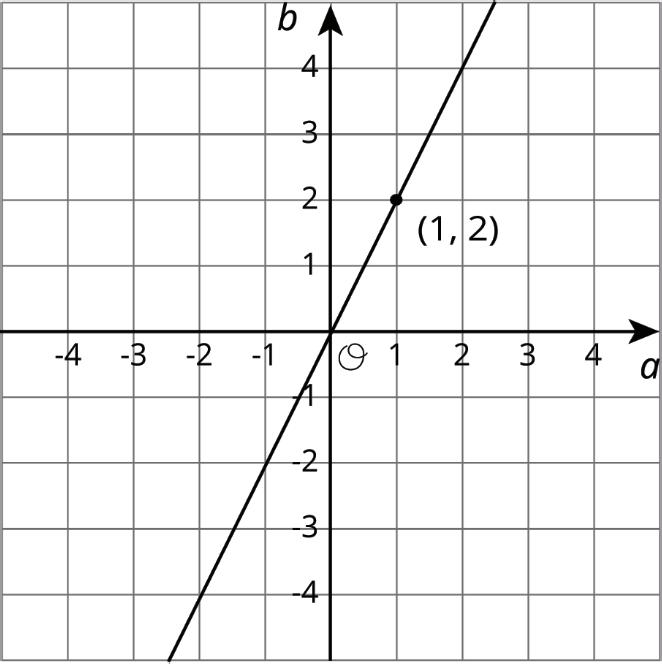
Exploration Activity: Comparing Temperatures
The graph shows the temperature between noon and midnight in City A on a certain day.
The table shows the temperature, ��, in degrees Fahrenheit (℉), for ℎ hours (hr.) after noon, in City B.
1. Which city was warmer at 4:00 p.m.?
2. Which city had a bigger change in temperature between 1:00 p.m. and 5:00 p.m.?
3. How much greater was the highest recorded temperature in City B than the highest recorded temperature in City A during this time?
4. Compare the outputs of the functions when the input is 3.
Guided Activity: Comparing Volumes
The volume, ��, of a cube with edge length �� centimeters (cm) is given by the equation �� = ��3.
The volume of a sphere is a function of its radius, in cm, and the graph of this relationship is shown here.
1. Is the volume of a cube with edge length �� = 3 greater or less than the volume of a sphere with radius 3?
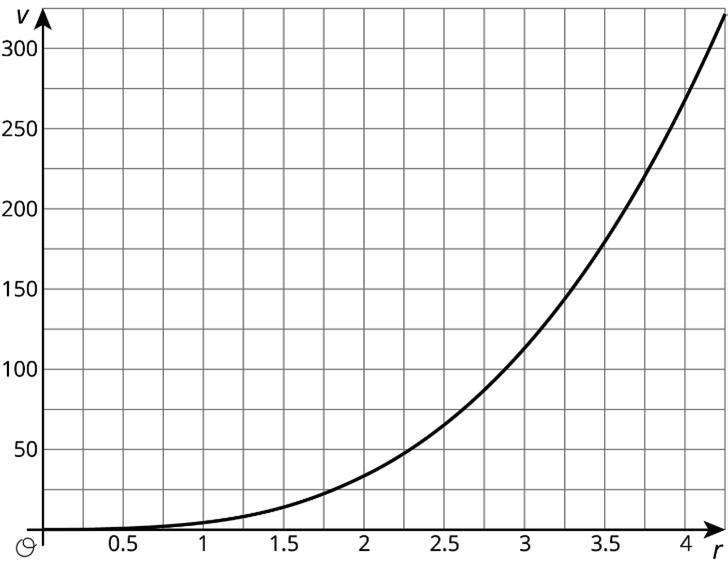
2. If a sphere has the same volume as a cube with edge length 5, estimate the radius of the sphere.
3. Compare the outputs of the two volume functions when the inputs are 2.
Collaborative Activity: It’s Not a Race
Elena’s family is driving on the freeway at 55 miles per hour (mph).
Andre’s family is driving on the same freeway, but not at a constant speed. The table shows how far Andre’s family has traveled, ��, in miles (mi.), every minute (min.) for 10 min.
1. How many mi. per min. is 55 mph?
2. Who had traveled farther after 5 min.? After 10 min.?
3. How long did it take Elena’s family to travel as far as Andre’s family had traveled after 8 min.?
4. For both families, the distance in mi. is a function of time in min.. Compare the outputs of these functions when the input is 3.
Lesson Summary
Functions are relationships that are used to determine outputs from inputs. For each way of representing a function (equation, graph, table, mapping diagram, or written description), the output can be determined for a given input.
Consider a function represented by the equation �� = 3�� + 2, where �� is the dependent variable and �� is the independent variable. To determine the output from the input value 2, substitute 2 into the equation for ��, and determine the corresponding value of ��. In this case, when �� is 2, �� is 8, since 3 ⋅ 2 + 2 = 8.
When instead using a graph of the function, the coordinates of points on the graph are the input- output pairs. Determine the ��-coordinate of the point on the graph that corresponds to a value of 2 for ��. The graph of the function modeled by the equation �� = 3�� + 2 is shown on the coordinate plane. The ��-coordinate of the point with an ��-coordinate of 2 is 8.
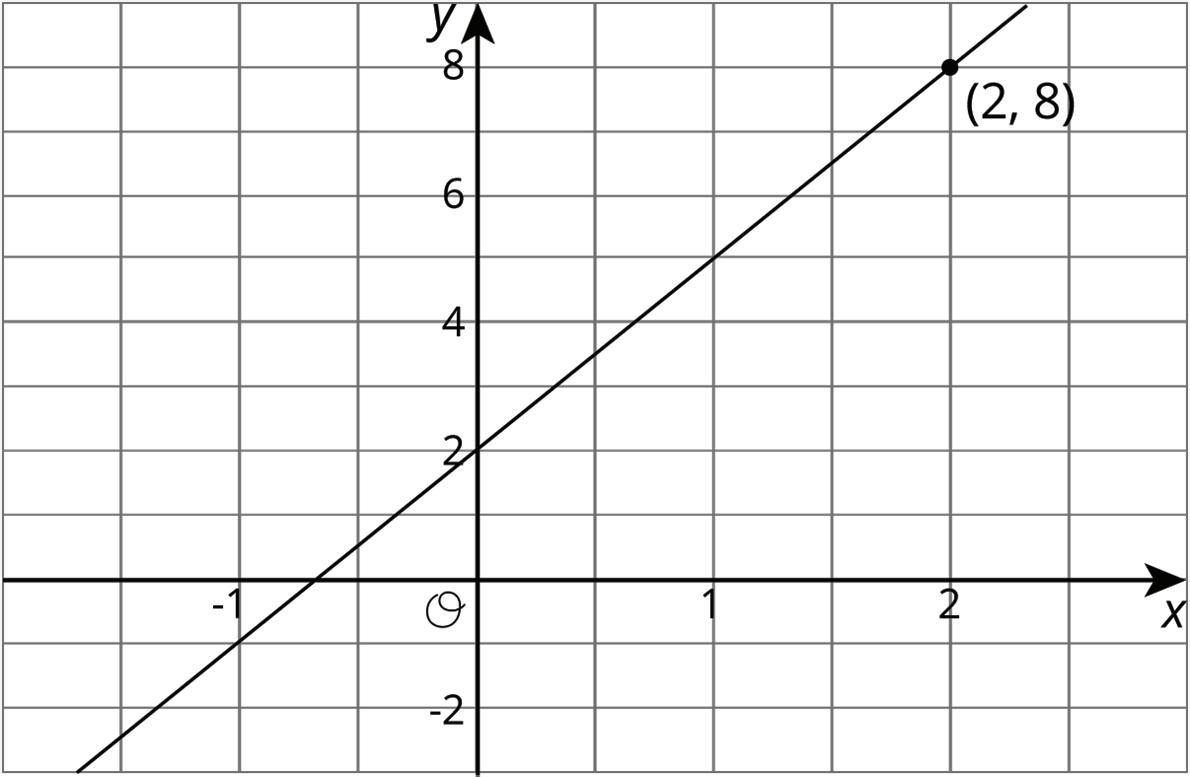
A table of values and a mapping diagram representing this function show the inputoutput pairs directly, although only for select inputs.
Again, the table and mapping diagram show that when the input is 2, the output is 8.
Practice Problems
1. The equation and the tables represent two different functions. Use the equation �� = 4�� − 5 and the table to answer the questions. This table represents �� as a function of ��.
a. When �� is −3, is �� or �� greater?
b. When �� is 21, what is the value of ��? What is the value of �� that goes with this value of ��?
c. When �� is 6, is �� or �� greater?
d. For what values of �� do we know that �� is greater than ��?
2. Elena and Lin are training for a race. Elena runs her mile, mi., at a constant speed of 7.5 mph.
Lin’s times are recorded every min.
a. Who finished their mile first?
b. This is a graph of Lin’s progress. Draw a graph to represent Elena’s mile on the same axes.
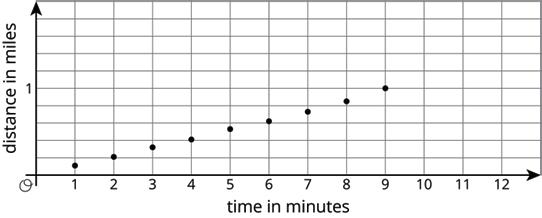
c. For these models, is distance a function of time? Is time a function of distance? Explain how you know.
3. Match each function rule with the value that could not be a possible input for that function.
A. 3 divided by the input
B. Add 4 to the input, then divide this value into 3
C. Subtract 3 from the input, then divide this value into 1
4. Find a value of �� that makes the equation true. Explain your reasoning, and check that your answer is correct.
Unit 5, Lesson 11: Linear Functions
Warm-Up: Bigger and Smaller
Diego said that these graphs are ordered from smallest to largest. Mai said they are ordered from largest to smallest. But these are graphs, not numbers! What do you think Diego and Mai are thinking?
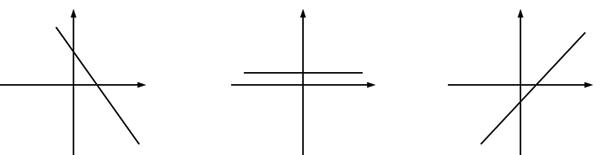
Exploration Activity: Proportional Relationships Define
Linear Functions
1. Jada earns $7 per hour mowing her neighbors’ lawns.
a. Name the two quantities in this situation that are in a functional relationship. Which did you choose to be the independent variable? What is the variable that depends on it?
b. Write an equation that represents the function.
c. Here is a graph of the function. Label the axes. Label at least two points with input-output pairs.
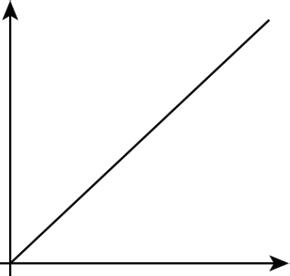
2. To convert feet to yards, you multiply the number of feet by 1 3 .
a. Name the two quantities in this situation that are in a functional relationship. Which did you choose to be the independent variable? What is the variable that depends on it?
b. Write an equation that represents the function.
c. Draw the graph of the function. Label at least two points with input-output pairs.
Guided Activity: Is It Filling Up or Draining Out?
There are four tanks of water.
• The amount of water in gallons (gal.), ��, in Tank A is given by the function �� = 200 + 8��, where �� is in minutes (min.).
• The amount of water in gal., ��, in Tank B starts at 400 gal. and is decreasing at 5 gal. per min. These functions work when �� ≥ 0 and �� ≤ 80.
1. Which tank started out with more water?
2. Write an equation representing the relationship between �� and ��.
3. One tank is filling up. The other is draining out. Which is which? How can you tell?
4. The amount of water in gal., ��, in Tank C is given by the function �� = 800 − 7��. Is it filling up or draining out? Can you tell just by looking at the equation?
5. The graph of the function for the amount of water in gal., ��, in Tank D at time �� is shown. Is it filling up or draining out? How do you know?
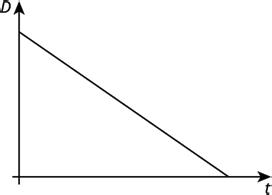
Collaborative Activity: Which Is Growing Faster?
Noah is depositing money in his account every week to save money. The graph shows the amount he has saved as a function of time since he opened his account.
Elena opened an account the same day as Noah. The amount of money in her account, ��, is given by the function �� = 8�� + 60, where �� is the number of weeks since the account was opened.
1. Who started out with more money in their account? Explain how you know.
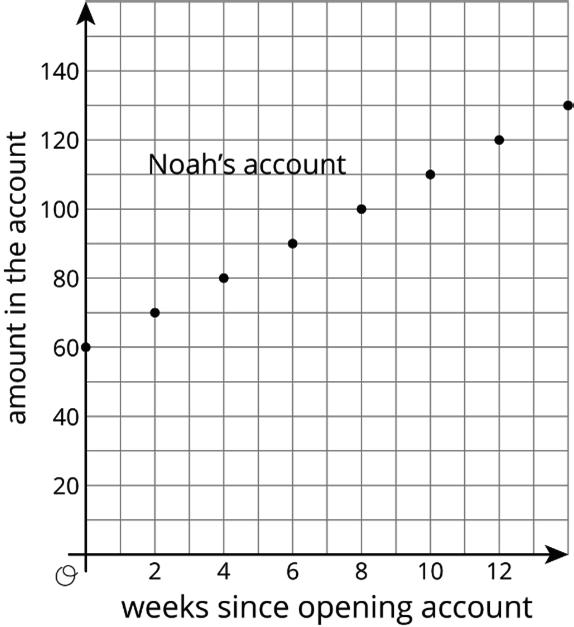
2. Who is saving money at a faster rate? Explain how you know.
3. How much will Noah save over the course of a year if he does not make any withdrawals? How long will it take Elena to save that much?
Lesson Summary
Suppose a car is traveling at 30 miles per hour (mph). The relationship between time, in hours (hr.), and distance, in miles (mi.), is a proportional relationship. The relationship can be represented by the equation �� = 30��, where distance is a function of time, since each input of time has exactly 1 output of distance. The equation could also be �� = 1 30 ��, where time is a function of distance, since each input of distance has exactly 1 output of time.
More generally, a linear function can be represented by an equation in the form �� = ���� + ��, where �� is the initial value (which is 0 for proportional relationships) and �� is the rate of change, or slope, of the function. When �� is positive, the function is increasing. When �� is negative, the function is decreasing.
When a linear function is presented in a graph, the values of �� and �� can be determined by using some points on the line. The value of �� is the ��-intercept. The value of �� is the slope of the line between any 2 points on the line.
Practice Problems
1. Two cars drive on the same highway in the same direction. The graphs show the distance, ��, of each one as a function of time, ��. Which car drives faster? Explain how you know.
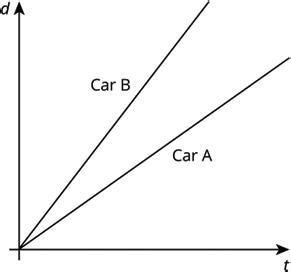
2. Two car services offer to pick you up and take you to your destination. Service A charges 40 cents to pick you up and 30 cents for each mile of your trip. Service B charges $1.10 to pick you up and charges �� cents for each mile of your trip.
a. Match the services to the Lines �� and ��.
b. For Service B, is the additional charge per mile greater or less than 30 cents per mile of the trip? Explain your reasoning.
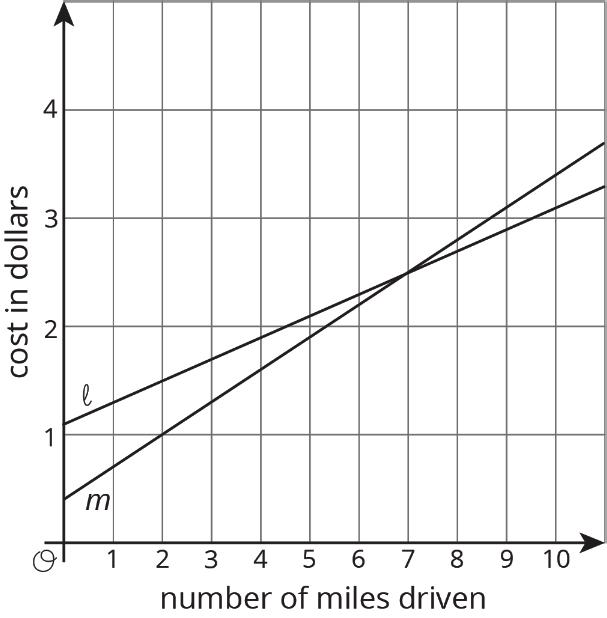
3. Kiran and Clare like to race each other home from school. They run at the same speed, but Kiran’s house is slightly closer to school than Clare’s house. On a graph, their distance from their homes in meters is a function of the time from when they begin the race in seconds.
a. As you read the graphs left to right, would the lines go up or down?
b. What is different about the lines representing Kiran’s run and Clare’s run?
c. What is the same about the lines representing Kiran’s run and Clare’s run?
4. Write an equation for each line.
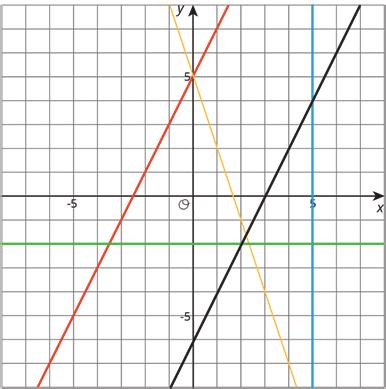
Unit 5, Lesson 12: Linear Models
Warm-Up: Candlelight
A candle is burning. It starts out 12 inches (in.) long. After 1 hour (hr.), it is 10 in. long. After 3 hr., it is 5.5 in. long.
1. When do you think the candle will burn out completely?
2. Is the height of the candle a function of time? If yes, is it a linear function? Explain your thinking.
Exploration Activity: Shadows
When the sun was directly overhead, the stick had no shadow. After 20 minutes (min.), the shadow was 10.5 centimeters (cm) long. After 60 min., it was 26 cm long.
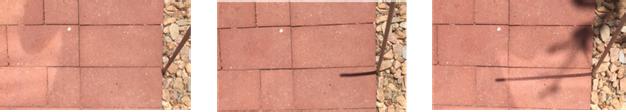
1. Based on this information, estimate how long it will be after 95 min.
2. After 95 min., the shadow measured 38.5 cm. How does this compare to your estimate?
3. Is the length of the shadow a function of time? If so, is it linear? Explain your reasoning.
Collaborative Activity: Recycling
In an earlier lesson, we saw this graph that shows the percentage of all garbage in the U.S. that was recycled between 1991 and 2013.

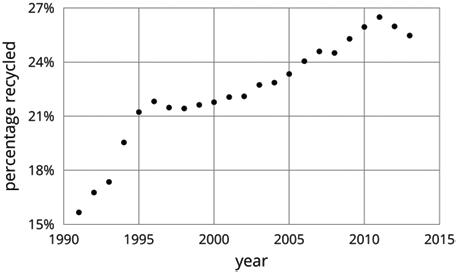
1. Sketch a linear function that models the change in the percentage of garbage that was recycled between 1991 and 1995. For which years is the model good at predicting the percentage of garbage that is produced? For which years is it not as good?
2. Pick another time period to model with a sketch of a linear function. For which years is the model good at making predictions? For which years is it not very good?
Lesson Summary
Water has different boiling points at different elevations. At 0 meters (m) above sea level, the boiling point is 100 degrees Celcius (℃). At 2,500 m above sea level, the boiling point is 91.3℃. Assuming the boiling point of water is a linear function based on elevation, these 2 data points can be used to calculate the slope of the line, as shown.
= 91.3 − 100 2,500 − 0 = −8.7 2,500
This slope means that for each increase of 2,500 m in elevation, the boiling point of water decreases by 8.7℃. The ��-intercept is given at 100℃ from the first point, so a linear equation to represent this scenario is �� = −8.7 2,500�� + 100.
This equation is an example of a mathematical model.
A mathematical model is a representation of a problem from science, technology, engineering, work, or everyday life, used to solve problems and make decisions.
Sometimes a situation can be modeled by a linear function.
A linear function is a function that has a constant rate of change.
Mathematicians use judgment about whether the model is reasonable to use based on the information given. Be aware that a model may make imprecise predictions, or may only be appropriate for certain ranges of values.
Testing the model for the boiling point of water, it accurately predicts that at an elevation of 1,000 m above sea level, when �� = 1,000, water will boil at 96.5℃, since �� = −8.7 2,500 (1,000) + 100 = 96.5. For higher elevations, the model is not as accurate, but it is still close. At 5,000 m above sea level, it predicts 82.6℃, which is 0.6℃ off from the actual value of 83.2℃. At 9,000 m above sea level, it predicts 68.7℃, which is about 3℃ less than the actual value of 71.5℃. The model continues to be less accurate at even higher elevations, since the relationship between the boiling point of water and elevation isn’t perfectly linear, but for the elevations at which most people live, the model is pretty good.
Practice Problems
1. On the first day after the new moon, 2% of the moon’s surface is illuminated. On the second day, 6% is illuminated.
a. Based on this information, predict the day on which the moon’s surface is 50% illuminated and 100% illuminated.
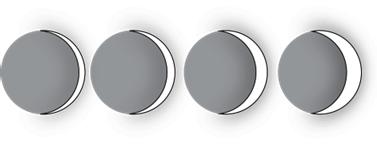
b. The moon’s surface is 100% illuminated on day 14. Does this agree with the prediction you made?
c. Is the percentage illumination of the moon’s surface a linear function of the day?
2. In science class, Jada uses a graduated cylinder with water in it to measure the volume of some marbles. After dropping in 4 marbles so they are all under water, the water in the cylinder is at a height of 10 milliliters (mm). After dropping in 6 marbles so they are all under water, the water in the cylinder is at a height of 11 mm.
a. What is the volume of 1 marble?
b. How much water was in the cylinder before any marbles were dropped in?
c. What should be the height of the water after 13 marbles are dropped in?
d. Is the volume of water a linear relationship with the number of marbles dropped in the graduated cylinder? If so, what does the slope of the line mean? If not, explain your reasoning.
Review Problems
3. Solve each of these equations. Explain or show your reasoning.
28
a. 2(3�� + 2) = 2�� +
b. 5�� + 13 = −43 − 3��
c. 4(2�� + 2) = 8(2 − 3��)
4. For a certain city, the high temperatures (in ℃) are plotted against the number of days after the new year.
Based on this information, is the high temperature in this city a linear function of the number of days after the new year?
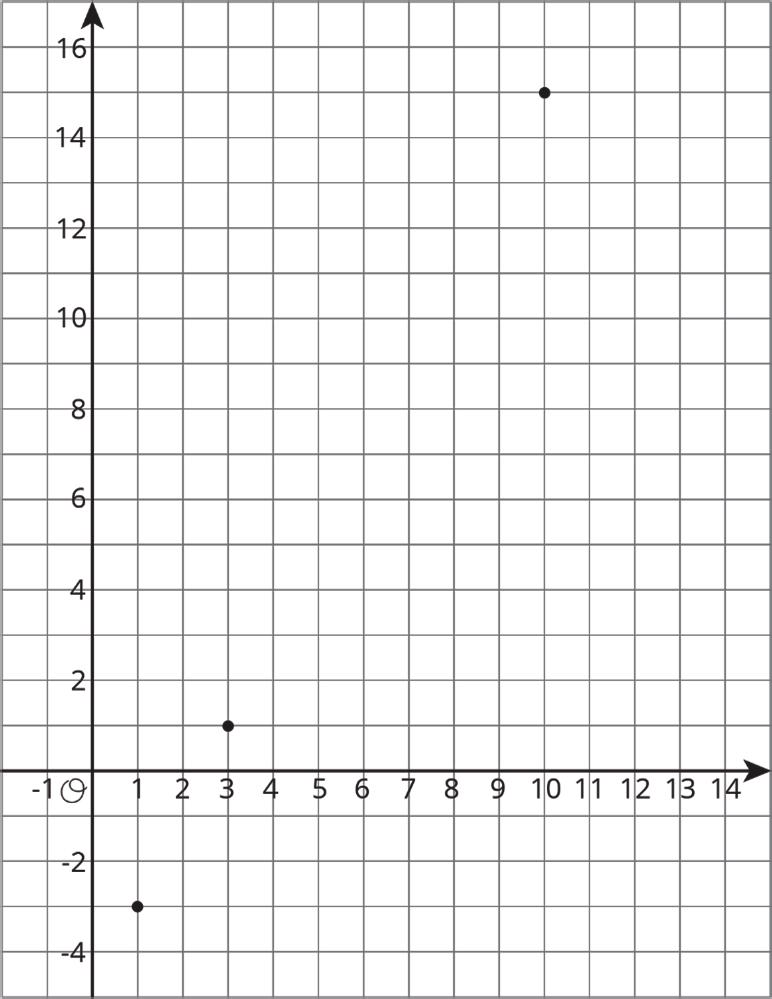
Unit 5, Lesson 13: Comparing Functions
Warm-Up: Linear Functions in Context
1. Mark has been monitoring the water levels in his hydroponic garden towers and identified that tower A has a leak. It started with 10 liters (L) of water and is losing 0.25 L of water per minute (min.). Mark identified the leak in tower A at the same time that he began filling tower B. Tower B started with 3 L of water and is being filled at a rate of 2 L per min. This situation can be represented by the 2 equations shown, where �� is the amount of time, in min., since Mark identified the leak, and �� is the amount of water in the tower, in L.
+ 10
a. Complete the table by determining which equation represents each tower.
b. Determine how much water will be in each tower 8 min. after Mark identified the leak.
Tower
Volume (L) after �� Min.
Guided Activity: Comparing Linear Functions
Mapping diagrams representing functions A and B are shown.
1. Complete the statements.
a. The slope of function A is less than greater than the slope of function B.
b. The slope of function A is steeper less steep than the slope of function B.
c. When �� = −2, the value of �� for function A is less than greater than the value of �� for function B.
2. Which function(s) is (are) increasing for all real numbers?
A. Function A
B. Function B
C. Both functions A and function B
D. Neither function A nor function B
Function A is represented by the equation �� = −5�� + 3. Function B is represented by the equation �� = 3�� − 5.
3. Complete the table by identifying whether only function A, only function B, both functions, or neither function satisfies each key feature described.
Key Feature
Function has the larger ��-intercept.
Function has a range of all real numbers.
Function has a decreasing interval for all real numbers.
Function has a constant interval.
Function is continuous.
Collaborative Activity: Comparing Representations of Linear Functions
Work with your partner to complete the following.
1. Linear Functions A and B are shown on the coordinate plane.
Complete the statements.
a. The ��-intercept of Function A is less than greater than the ��-intercept of Function B.
b. The slope of Function A is less than greater than the slope of Function B.
c. When �� = 5, the value of �� for Function A is less than greater than the value of �� for Function B.
2. The table shows other ways the same linear functions could be represented.
Equation Table of Values
A line with a slope of 3 4 that passes through the point �2, 9 2 �
A line that passes through the points (0,−1) and � 1 2 , 0�
a. With your partner, discuss which of the given representations of the functions can be used to determine the ��-intercept of each function.
b. Circle where you can determine the ��-intercept of the function from each of the given representations.
c. From which of the given representations is it easiest to determine which of the functions has a greater value of �� when �� = 5?
d. Complete the statement.
The slope of each function can be most easily identified from the given graph, equation, table of values, written description, but the slope can also be determined from the graph equation table of values written description by finding the change in �� change in �� for any 2 points.
Lesson Summary
Linear functions can be compared using several key features, including intercept(s), slope, domain, range, and intervals that are increasing, decreasing, or constant.
When comparing the slopes of 2 linear functions, consider the value of the slope to identify which slope is larger or smaller. The steepness of linear functions can be compared using the absolute value of each slope; the larger the slope’s absolute value, the steeper the line.
For example, function A has an equation of �� = −5�� + 3, and function B has an equation of �� = 3�� − 5. The slope of function B is larger than the slope of function A because −5 < 3, but the slope of function A is steeper than the slope of function B because |−5| > |3|.
Practice Problems
1. Tables of values are shown for function A and function B.
a. Explain which function has the steeper slope.
b. Explain which function has the smaller ��-intercept.
2. Linear functions A and B are shown on the coordinate plane.
a. Which function is decreasing for all real numbers?
b. Compare the ��-values of the functions when �� = 3.
3. The equations for 2 linear functions are shown. Function A
a. Explain which function has a larger ��-intercept.
b. Determine which function is increasing for all real numbers. Explain your reasoning.
Review Problem
4. Here are several function rules. Calculate the output for each rule when you use −6 as the input.
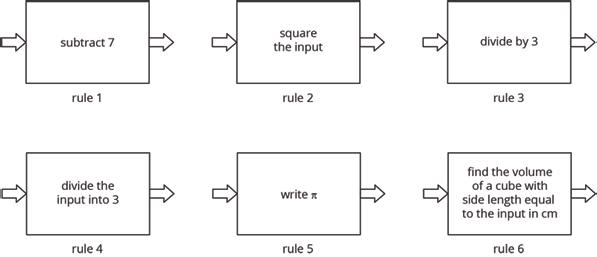
Unit 5, Lesson 14: Comparing Functions Represented in Different Ways
Warm-Up: Interpreting Linear Functions
1. The graph shows the height, ℎ, in inches (in.), of a bamboo plant �� months after it has been planted.
a. What is the slope of the line?
b. Interpret the meaning of the slope in this context.
c. The ��-intercept of the line is 12. Interpret the meaning of the ��-intercept in context.
Exploration Activity: Increasing, Decreasing, and Constant Functions
1. Ava runs a dog-washing service. Each time she gives a dog a bath, she fills up the tub, washes the dog, and then drains the tub. The function of the height of the water, ��, in inches (in.), over �� minutes (min.) is shown for 2 different dogs, Diva and Bubbles.
a. Complete the table defining the intervals where each function is increasing, decreasing, and constant.
b. Over which interval are both functions changing the same way?
c. Explain what the interval described in part B represents in context.
d. Explain why the intervals where each function is constant are not the same.
Guided Activity: Comparing Properties of Functions
1. Two different linear functions are shown using different representations.
a. Which linear function has the larger ��-intercept?
b. Which linear function has the smaller slope?
c. Which linear function has a larger value of �� when �� = −2?
2. Ruthie is charging her phone and laptop before taking a flight.
Ruthie’s phone had a 45% charge when she plugged it in, and it has been increasing by 4% every 5 min.
The table represents the charge on Ruthie’s laptop since she plugged it in.
The graphs of the linear functions representing Ruthie’s phone and laptop charging are shown.
Charge (%)
Time charging (minutes)
a. Explain how to use the ��-intercepts of the lines to determine which line represents Ruthie’s phone charging.
b. Explain how to use the slopes of the lines to determine which line represents Ruthie’s phone charging.
c. Label each line with the device that it represents.
Collaborative Activity: Card Sort
Four functions represented in different ways are shown.
Your teacher will give you some cards. Each card includes a key feature of 1 of the functions. Match each function with the 4 key features that describe it.
Lesson Summary
Identifying and interpreting key features of functions represented in different ways is a useful strategy in comparing 2 functions.
When a function is represented using a mapping diagram, a table of values, or a graph that includes only distinct points, the function is discrete. The domain and range of a discrete function are represented using a list of values. The same representations can be used to determine whether the function is increasing, decreasing, or constant by examining the pattern of the coordinate points and the intercepts of the function.
When a linear function is represented using an equation or a graph of a line or curve, the function is continuous. In a continuous function, the domain and range are represented using an inequality such as �� ≥ 4 or a compound inequality such as −1 < �� < 4. Inequalities can also be used to represent the intervals of the domain where a function is increasing, decreasing, or constant.
Practice Problems
1. Four functions are shown. Which function has the greatest ��-value when �� = 2?
2. Two different linear functions are shown.
a. Which linear function has the smaller slope?
b. Which linear function has the larger ��-intercept?
c. Which linear function has a smaller value of �� when �� = 1?
3. The graph shows a trip on a bike trail. The trail has markers every 0.5 kilometers (km) showing the distance from the beginning of the trail.
a. When was the bike rider going the fastest?
b. When was the bike rider going the slowest?
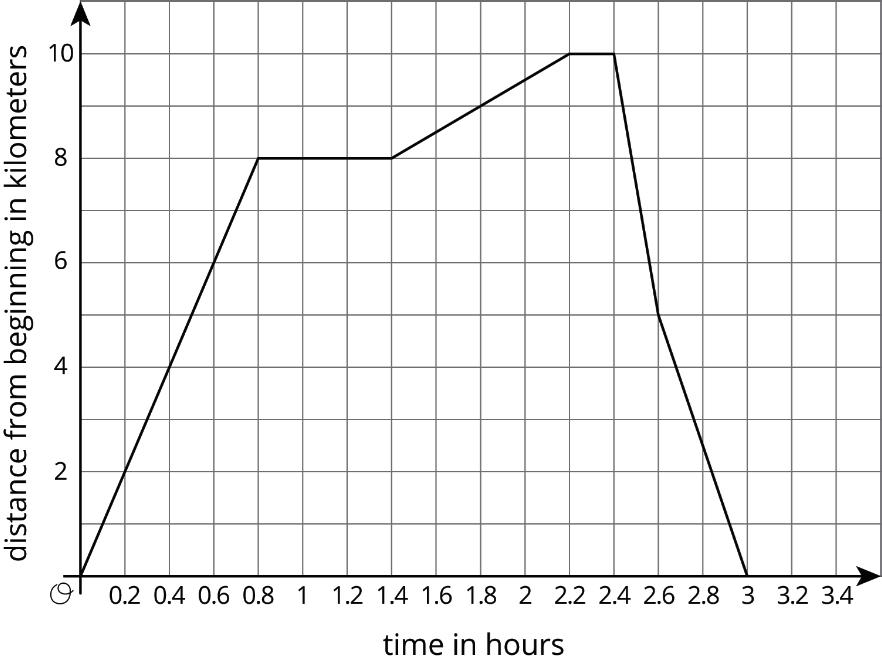
c. During what times was the rider going away from the beginning of the trail?
d. During what times was the rider going back towards the beginning of the trail?
e. During what times did the rider stop?
4. The expression −25�� + 1250 represents the volume of liquid of a container after �� seconds (sec.). The expression 50�� + 250 represents the volume of liquid of another container after �� sec. What does the equation −25�� + 1250 = 50�� + 250 mean in this situation?