
Grade 7 SOUTH
CAROLINA
ISBN: 979-8-893539-06-6
Math Nation 6-8 was originally developed by Illustrative Mathematics®, and is copyright 2019 by Illustrative Mathematics. It is licensed under Creative Commons Attribution 4.0 International License (CCBY 4.0).
The online curriculum resource platform offered at "mathnation.com", including the videos and practice questions are additions to the original Illustrative Mathematics content is copyright 2023 by Accelerate Learning, Inc.
The trademark "Math Nation" is owned by Accelerate Learning, Inc. All other trademarks and product names referred to in the Math Nation AGA curriculum are the property of their respective owners and used solely for educational purposes. Unless otherwise stated, Math Nation has no relationship with any of the companies or brands mentioned in the curriculum and does not endorse or have a preference for any of those companies or brands.
This curriculum includes public domain images or openly licensed images that are copyright by their respective owners. Openly licensed images remain under the terms of their respective licenses. See the image attribution section for more information. 00820231215
ManuscriptCopy
ManuscriptCopy
ManuscriptCopy
Unit 6, Lesson 1: Exponent Review
Warm-Up: Which One Doesn’t Belong: Twos
Which expression does not belong? Be prepared to share your reasoning.
A. 23
B. 8
C. 32
D. 22 · 21
Exploration Activity: Return of the Genie
Mai and Andre found an old, brass bottle that contained a magical genie. They freed the genie, and it offered them each a magical $1 coin as thanks.
• The magic coin turned into 2 coins on the first day.
• The 2 coins turned into 4 coins on the second day.
• The 4 coins turned into 8 coins on the third day.
This doubling pattern continued for 28 days.
Mai was trying to calculate how many coins she would have and remembered that instead of writing 1

2 for the number of coins on the 6th day, she could just write 26.
1. The number of coins Mai had on the 28th day is very, very large. Write an expression to represent this number without computing its value.
ManuscriptCopy
2. Andre’s coins lost their magic on the 25th day, so Mai has a lot more coins than he does. How many times more coins does Mai have than Andre?
Exploration Activity: Broken Coin
After a while, Jada picks up a coin that seems different than the others. She notices that the next day, only half of the coin is left.
• On the second day, only 1 4 of the coin is left.
• On the third day, 1 8 of the coin remains.
1. What fraction of the coin remains after 6 days?
2. What fraction of the coin remains after 28 days? Write an expression to describe this without computing its value.
3. Does the coin disappear completely? If so, after how many days?
Collaborative Activity: Negatives with Base Values
1. Janelle and Martin were given the expressions (−2)4 and −24 to evaluate. Martin thinks the expressions are equivalent, but Janelle disagrees with him. Their work is shown.
a. Discuss with your partner how the placement of the negative sign differs in each expression.
b. Explain whose answer you agree with.
2. Complete the table. The first row is filled out as an example.
Lesson Summary
Exponents make it easy to show repeated multiplication, such as 26
In expressions like 53 and 82, the 3 and the 2 are called exponents. They tell you how many factors to multiply.
One advantage to writing 26 is it can be seen at a glance that the base of 2 is being taken to the 6th power. When this is written out using multiplication, 2
the number of factors needs to be counted. Imagine writing out 2100 using repeated multiplication.
The base (of an exponent) is the number used as a factor in exponential form.
Suppose there is 1 grain of rice, and each day the number of grains of rice doubles. So, on day 1, there are 2 grains. On day 2, there are 4 grains, and so on. In this scenario, the expression 225 indicates that the amount of rice has doubled 25 times. This notation is not only convenient, but it also helps to see the structure. In this case, it can be seen right away that 225 represents the number of grains of rice after 25 days of doubling.
ManuscriptCopy
When the base in an exponential expression includes a negative, it is important to distinguish whether the negative is being multiplied by the exponential expression or if it is part of the base being taken to a power. Two examples distinguishing the difference are shown. −34 = (−1)(3)4 = −1 · 3 · 3 · 3 · 3 = −81 (−3)4 = (−3) · (−3) · (−3) · (−3) = 81

Practice Problems
1. Write each expression using an exponent.
d. The number of coins Jada will have on the eighth day, if Jada starts with one coin and the number of coins doubles every day. (She has two coins on the first day of the doubling.)
2. Evaluate each expression.
25
a.
3. Clare made $160 babysitting last summer. She put the money in a savings account that pays 3% interest per year (yr.). If Clare doesn’t touch the money in her account, she can find the amount she’ll have the next year by multiplying her current amount by 1.03.
a. How much money will Clare have in her account after 1 yr.? After 2 yr.?
b. How much money will Clare have in her account after 5 yr.? Explain your reasoning.
c. Write an expression for the amount of money Clare would have after 30 yr. if she never withdraws money from the account.
Review Problems
4. Kiran mixes 3 4 cups (c.) of raisins, 1 c. peanuts, and 1 2 c. of chocolate chips to make trail mix. How much of each ingredient would he need to make 10 c. of trail mix? Explain your reasoning.
ManuscriptCopy
5. Find the value of each expression.
a. 1.74 + (−9.68)
b. �5 2 7 � − �8 3 14�
c. �− 9 5 � ⋅ �−2 1 10�
ManuscriptCopy
Unit 6, Lesson 2: Multiplying Powers of Ten
Warm-Up: ������, ��, or ��
Clare said she sees 100.
Tyler says he sees 1.
Mai says she sees 1 100 .
Who do you agree with? Explain.
ManuscriptCopy

Exploration Activity: Picture a Power of 10
In the diagram, the medium rectangle is made up of 10 small squares. The large square is made up of 10 medium rectangles.


1. How could you represent the large square as a power of 10?
2. If each small square represents 102, then what does the medium rectangle represent? The large square?
3. If the medium rectangle represents 105, then what does the large square represent? The small square?
4. If the large square represents 10100, then what does the medium rectangle represent? The small square?
Exploration Activity: Multiplying Powers of 10
1.
a. Complete the table to explore patterns in the exponents when multiplying powers of 10. You may skip a single box in the table, but if you do, be prepared to explain why you skipped it.
b. If you chose to skip one entry in the table, which entry did you skip? Why?
2.
a. Use the patterns you found in the table to rewrite 10�� ⋅ 10�� as an equivalent expression with a single exponent, like 10 .
b. Use your rule to write 104 ⋅ 100 with a single exponent. What does this tell you about the value of 100
ManuscriptCopy
3. The state of Georgia has roughly 107 human residents. Each human has roughly 1013 bacteria cells in his or her digestive tract. How many bacteria cells are there in the digestive tracts of all the humans in Georgia?
Lesson Summary
This lesson explored a rule for multiplying powers of 10. Multiplying powers of 10 corresponds to adding the exponents together. To see this, multiply 105 and 102. The term 105 has 5 factors that are 10, and 102 has 2 factors that are 10. That means that 105 ⋅ 102 has 7 factors that are 10. The example shown represents this thinking.
105 ⋅ 102 = (10 ⋅ 10 ⋅ 10 ⋅ 10 ⋅ 10) ⋅ (10 ⋅ 10) = 107
This will also work for other powers of 10. For example, 1014 ⋅ 1047 = 1061.
This rule makes it easier to understand and work with expressions that have exponents.
Practice Problems
1. Write each expression with a single exponent.
2. A large rectangular swimming pool is 1,000 feet (ft.) long, 100 ft. wide, and 10 ft. deep. The pool is filled to the top with water.
a. What is the area of the surface of the water in the pool?
b. How much water does the pool hold?
c. Express your answers to the previous two questions as powers of 10.
Review Problems
3. A taxi service charges $1.00 for the first 1 10 mile (mi.) then $0.10 for each additional 1 10 mi. after that.
Fill in the table with the missing information then determine if this relationship between distance traveled and price of the trip is a proportional relationship.
ManuscriptCopy
4. Here is a shape with some measurements in centimeters (cm).
a. Complete the table showing the area, in square centimeters (sq. cm) of different scaled copies of the triangle.

b. Is the relationship between the scale factor and the area of the scaled copy proportional?
Unit 6, Lesson 3: Powers of Powers of 10
Warm-Up: Big Cube
What is the volume of a giant cube that measures 10,000 kilometers (km) on each side?
Exploration Activity: Raising Powers of 10 to Another Power
1.
a. Complete the table to explore patterns in the exponents when raising a power of 10 to a power. You may skip a single box in the table, but if you do, be prepared to explain why you skipped it.
b. If you chose to skip one entry in the table, which entry did you skip? Why?
2. Use the patterns you found in the table to rewrite (10��)�� as an equivalent expression with a single exponent, like 10 .
3. If you took the amount of oil consumed in 2 months in 2013 worldwide, you could make a cube of oil that measures 103 meters (m) on each side. How many cubic meters (cu. m) of oil is this? Do you think this would be enough to fill a pond, a lake, or an ocean?
Collaborative Activity: How Do the Rules Work?
Andre and Elena want to write 102 ⋅ 102 ⋅ 102 with a single exponent.
• Andre says, “When you multiply powers with the same base, it just means you add the exponents, so 102 ⋅ 102 ⋅ 102 = 102+2+2 = 106.”
• Elena says, “102 is multiplied by itself 3 times, so 102 ⋅ 102 ⋅ 102 = (102)3 = 102+3 = 105.” Do you agree with either of them? Explain your reasoning.
Lesson Summary
This lesson explored a rule for taking a power of 10 to another power. Taking a power of 10 and raising it to another power is the same as multiplying the exponents.
An example demonstrating this rule when raising 104 to the power of 3 is shown.
(104)3 = 104 ⋅ 104 ⋅ 104 = 1012
This works for any power of a power of 10. For example, (106)11 = 1066. This is another rule that will make it easier to work with and make sense of expressions with exponents.
Practice Problems
1. Write each expression with a single exponent.
a. (107)2
b. (109)3
c. (−106)3
d. (102)3
e. (103)2
f. (105)7
2. You have 1,000,000 number cubes, each measuring one inch (in.) on a side.
a. If you stacked the cubes on top of one another to make an enormous tower, how high would they reach? Explain your reasoning.
b. If you arranged the cubes on the floor to make a square, would the square fit in your classroom? What would its dimensions be? Explain your reasoning.
c. If you layered the cubes to make one big cube, what would be the dimensions of the big cube? Explain your reasoning.
3. An amoeba divides to form two amoebas after one hour (hr.). One hr. later, each of the two amoebas divides to form two more. Every hr., each amoeba divides to form two more.
a. How many amoebas are there after 1 hr.?
b. How many amoebas are there after 2 hr.?
c. Write an expression for the number of amoebas after 6 hr.
d. Write an expression for the number of amoebas after 24 hr.
e. Why might exponential notation be preferable to answer these questions?
ManuscriptCopy
4. A shopper bought a watermelon, a pack of napkins, and some paper plates. In his state, there is no tax on food. The tax rate on non-food items is 5%. The total for the three items he bought was $8.25 before tax, and he paid $0.19 in tax. How much did the watermelon cost?
Unit 6, Lesson 4: Dividing Powers of 10
Warm-Up: A Surprising One
What is the value of the expression?
Exploration Activity: Dividing Powers of 10
a. Complete the table to explore patterns in the exponents when dividing powers of 10. Use the “expanded” column to show why the given expression is equal to the single power of 10. You may skip a single box in the table, but if you do, be prepared to explain why you skipped it.
b. If you chose to skip one entry in the table, which entry did you skip? Why?
2. Use the patterns you found in the table to rewrite 10�� 10�� as an equivalent expression of the form 10 .
3. It is predicted that by 2050, there will be 1010 people living on Earth. At that time, it is predicted there will be approximately 1012 trees. How many trees will there be for each person?
Exploration Activity: Zero Exponent
So far we have looked at powers of 10 with exponents greater than 0. What would happen to our patterns if we included 0 as a possible exponent?
1.
a. Write 1012 ⋅ 100 with a power of 10 with a single exponent using the appropriate exponent rule. Explain or show your reasoning.
b. What number could you multiply 1012 by to get this same answer?
2.
a. Write 108 100 with a single power of 10 using the appropriate exponent rule. Explain or show your reasoning.
b. What number could you divide 108 by to get this same answer?
3. If we want the exponent rules we found to work even when the exponent is 0, then what does the value of 100 have to be?
4. Noah says, “If I try to write 100 expanded, it should have zero factors that are 10, so it must be equal to 0” Do you agree? Discuss with your partner.
Collaborative Activity: Making Millions
Write as many expressions as you can that have the same value as 106. Focus on using exponents, multiplication, and division. What patterns do you notice with the exponents?
ManuscriptCopy
Lesson Summary
In an earlier lesson, it was discovered that when multiplying powers of 10, the exponents can be added together. For example, 106 ⋅ 103 = 109 because 6 factors that are 10 multiplied by 3 factors that are 10 makes 9 total factors that are 10. A multiplication equation can also be thought of as division. An example is shown.
106 = 109 103
When dividing powers of 10, the exponent in the denominator is subtracted from the exponent in the numerator. Example reasoning is shown.
This rule also works for other powers of 10. For example, 1056 1023 = 1033 because 23 factors that are 10 in the numerator and in the denominator are used to make 1, leaving 33 factors remaining.
This is a new exponent rule that can be represented using the expression 10�� 10�� = 10��−��.
So far, this only makes sense when �� and �� are positive exponents and �� > ��, but this rule can be extended to include a new power of 10, 100. In the expression 106 100 , the exponent rule gives 106−0, which is equal to 106. Therefore, dividing 106 by 100 doesn’t change its value. So, if the rule works when the exponent is 0, then it must be true that 100 = 1. In fact, any number to a power of 0 is equal to 1.
Practice Problems
1. Evaluate.
ManuscriptCopy
2. Write each expression as a single power of 10.
a. 103 · 104 105
b. (104) ⋅ 1012 107
c. � 105 103 �4
d. 104 · 105 · 106 103 · 107
e. (105)2 (102)3
3. The Sun is roughly 102 times as wide as Earth. The star KW Sagittarii is roughly 105 times as wide as Earth. About how many times as wide as the Sun is KW Sagittarii? Explain how you know.
Review Problem
4. A restaurant bill is $59 and you pay $72. What percentage gratuity did you pay?
ManuscriptCopy
Unit 6, Lesson 5: Negative Exponents with Powers of 10
Warm-Up: Number Talk: What’s That Exponent?
Solve each equation mentally.
100 1 =10��
Exploration Activity: Negative Exponent Table
Complete the table to explore what negative exponents mean.

1. As you move toward the left, each number is being multiplied by 10. What is the multiplier as you move right?
2. How does a multiplier of 10 affect the placement of the decimal in the product? How does the other multiplier affect the placement of the decimal in the product?
3. Use the patterns you found in the table to write 10−7 as a fraction.
4. Use the patterns you found in the table to write 10−5 as a decimal.
5. Write 1 100,000,000 using a single exponent.
ManuscriptCopy
6. Use the patterns in the table to write 10−�� as a fraction.
Collaborative Activity: Follow the Exponent Rules 1.
a. Match each exponential expression with an equivalent multiplication expression. (102)3 (102)−3 (10−2)3 (10−2)−3
b. Write (10−2)−3 as a power of 10 with a single exponent. Be prepared to explain your reasoning.
ManuscriptCopy
a. Match each exponential expression with an equivalent multiplication expression.
b. Write 10−2 10−5 as a power of 10 with a single exponent. Be prepared to explain your reasoning. 3.
a. Match each exponential expression with an equivalent multiplication expression.
b. Write 10−4 ⋅ 103 as a power of 10 with a single exponent. Be prepared to explain your reasoning.
Lesson Summary
When a positive power of 10 is multiplied by 1 10, the exponent decreases by 1. An example is shown.
108 ⋅ 1 10 = 107
This is true for any positive power of 10. In a similar way, multiplying by 2 factors that are 1 10 decreases the exponent by 2, as shown. � 1 10�2 ⋅ 108 = 106
That means the rules to use negative exponents can be extended if 10− 2 = � 1 10�2. Just as 102 is 2 factors that are 10, 10−2 is 2 factors that are 1 10. More generally, the negative exponent rule shown is true for any integers �� and ��. 10−�� = � 1 10��� = 1 10��
An example of extending the rule 10�� 10�� = 10��−�� to use negative exponents is shown.
= 103−5 = 10−2
Shown in more detail,
, which is equal to 10−2.
As demonstrated in the previous example, rules about exponents can be combined or applied together. An example of extending the rule (10��)�� = 10�� �� to use negative exponents is shown. (10−2)3 = 10(−2)(3) = 10−6
To see why, notice that 10−2 = 1 10 ⋅ 1 10 This means (10−2)3 =
Practice Problems
1. Write each with a single exponent (ex: 1 10 · 1 10 = 10−2).
a. 1 10 · 1 10 · 1 10 b. 1 10 · 1 10 · 1 10 · 1 10 · 1 10 · 1 10 · 1 10 c. � 1 10 · 1 10 · 1 10 · 1 10 �2 d. � 1 10 · 1 10 · 1 10�3
e. ((−10) ⋅ (−10) ⋅ (−10))−2
2. Select all of the following that are equivalent to 1 10,000 :
□ (10,000)−1
□ (−10,000)
□ (100)−2
□ (10)−4
□ (−10)2
3. Write each expression as a single power of 10.
a. 10−3 ⋅ 10−2
b. 104 ⋅ 10−1
c. 105 107
d. (10−4)5
e. 10−3 ⋅ 102
f. 10 9 105
Review Problems
4. Add.
5. Which is a scaled copy of Polygon A? Identify a pair of corresponding sides and a pair of corresponding angles. Compare the areas of the scaled copies.

ManuscriptCopy

Unit 6, Lesson 6: What About Other Bases?
Warm-Up: True or False: Comparing Expressions with Exponents
Is each statement true or false? Be prepared to explain your reasoning. 1. 1. 35 < 46 2. (−3)2 < 32 3. (−3)3 = 33 4. (−5)2 > −52
ManuscriptCopy
Exploration Activity: What Happens with Zero and Negative Exponents?
Complete the table to show what it means to have an exponent of zero or a negative exponent.

1. As you move toward the left, each number is being multiplied by 2. What is the multiplier as you move toward the right?
2. Use the patterns you found in the table to write 2−6 as a fraction.
3. Write 1 32 as a power of 2 with a single exponent.
4. What is the value of 20?
5. From the work you have done with negative exponents, how would you write 5−3 as a fraction?
6. How would you write 3−4 as a fraction?
Collaborative Activity: Exponent Rules with Bases other than 10
Lin, Noah, Diego, and Elena decide to test each other’s knowledge of exponents with bases other than 10. They each chose an expression to start with and then came up with a new list of expressions, some of which are equivalent to the original and some of which are not.
Choose 2 of the 4 lists to analyze. For each list of expressions you choose to analyze, decide which expressions are not equivalent to the original. Be prepared to explain your reasoning.
1. Lin’s original expression is 5−9 and her list is shown.
2. Noah’s original expression is 310 and his list is shown.
3. Diego’s original expression is ��4 and his list is shown.
4. Elena’s original expression is 80 and her list is shown.
Lesson Summary
Powers of 10 play a special role in the decimal number system, but the exponent rules for 10 explored in previous lessons also work for other bases.
For example, if 20 = 1 and 2−�� = 1 2�� , then each of the following rules is also true.
These rules also work for powers of bases less than 1.
Practice Problems
1. Priya says “I can figure out 50 by looking at other powers of 5 . 53 is 125, 52 is 25, then 51 is 5.”
a. What pattern do you notice?
b. If this pattern continues, what should be the value of 50? Explain how you know.
c. If this pattern continues, what should be the value of 5−3? Explain how you know.
2. Select all the expressions that are equivalent to 4−3.
□ −12
□ 2−6
□ 1 43
□ � 1 4 � ⋅ � 1 4 � ⋅ � 1 4 �
□ 12
□ (−4) ⋅ (−4) ⋅ (−4)
□ 8 1 22
3. Write each expression using a single exponent.
53 56
ManuscriptCopy
166 163
a.
b. (143)6
c. (−8)3 ⋅ (−8)6
d.
e. (213)−6
4. A type of green paint is made by mixing 2 cups of yellow with 3.5 cups of blue.
a. Find a mixture that will make the same shade of green but a smaller amount.
b. Find a mixture that will make the same shade of green but a larger amount.
c. Find a mixture that will make a different shade of green that is bluer.
d. Find a mixture that will make a different shade of green that is more yellow.
5. Add.
a. 14.7 + 28.9
b. −9.2 + 4.4
c. −81.4 + (−12)
ManuscriptCopy
d. 51.8 + (−0.8)
Unit 6, Lesson 7: Practice with Rational Bases
Warm-Up: Which One Doesn’t Belong: Exponents
Which expression doesn’t belong?
Collaborative Activity: Exponent Rule Practice
1. Choose 6 of the expressions to write using a single exponent.
2. Which problems did you want to skip in the previous question? Explain your thinking.
3. Choose 3 of the following to write using a single, positive exponent.
4. Choose 3 of the following to evaluate.
ManuscriptCopy
Exploration Activity: Inconsistent Bases
Mark each equation as true or false. What could you change about the false equations to make them true?
32 ⋅ 53 = 155
3. 54 + 55 = 59
32 ⋅ 52 = 152
ManuscriptCopy
2.
5.
Lesson Summary
Rules to keep track of repeated factors when using exponents were developed more easily in previous lessons. These rules were extended to make sense of negative exponents as repeated factors of the reciprocal of the base, as well as defining a number to the power of 0 to have a value of 1.
If �� is a rational number that is not zero, then the reciprocal of �� is 1 �� .
Exponent Law
Product of Powers
Power of a Power
Quotient of Powers
Negative Exponent
Power
Symbolic Representation
As seen in this lesson, these exponent laws can be applied to different bases and exponents.
ManuscriptCopy
Practice Problems
1. Rewrite each expression with a single exponent.
a. 76 72
c. 42 ⋅ 46
e. (−122)7
g. (0.173)9 ⋅ (0.173)2
i. � 5 2 �8 � 5 2 �6
b. (114)5
d. (−5) ⋅ (−5)8 f. 310 3
h. 0.875 0.873
2. Noah says that 24 ⋅ 32 = 66. Tyler says that 24 ⋅ 42 = 162.
a. Do you agree with Noah? Explain or show your reasoning.
b. Do you agree with Tyler? Explain or show your reasoning.
ManuscriptCopy
3. Decide whether each table could represent a proportional relationship. If the relationship could be proportional, what would be the constant of proportionality?
a. Annie’s Attic is giving away $5 off coupons.
b. Bettie's Boutique is having a 20% off sale.
ManuscriptCopy
Unit 6, Lesson 8: Combining Bases
Warm-Up: Same Exponent, Different Base
1. Evaluate 53 ⋅ 23
2. Evaluate 103
ManuscriptCopy
Exploration Activity: Power of a Product
1. The table contains products of expressions with different bases and the same exponent. Complete the table to see how we can rewrite them. Use the “expanded” column to work out how to combine the factors into a new base.
ManuscriptCopy
2. Can you write 23 ∙ 34 with a single exponent? What happens if neither the exponents nor the bases are the same? Explain or show your reasoning.
Exploration Activity: Power of a Quotient
1. The table contains quotients of expressions with different bases and the same exponent. Complete the table to see how we can rewrite them. Use the Expanded column to work out how to combine the factors into a new base.
2. Explain whether 53 32 with a single exponent.
Collaborative Activity: How Many Ways Can You Make 3,600?
Your teacher will give your group tools for creating a visual display to play a game. Divide the display into 4 columns, with the headers shown.
How to play:
When the time starts, your group will write as many expressions as you can that equal a specific value, using 1 of the exponent rules on your board. When time is up, compare your expressions with another group’s to see how many points you earn.
• Your group earns 1 point for every unique expression you write that is equal to the value and follows the exponent rule you claimed.
• For an expression that uses negative exponents, you earn 2 points rather than 1.
• You can challenge the other group’s expression if you think it is not equal to the value or if it doesn’t follow 1 of the 4 exponent rules.
ManuscriptCopy
Lesson Summary
Before this lesson, rules for multiplying and dividing expressions with exponents only worked when the expressions had the same base.
• For example, 103 ⋅ 102 = 105 or 26 ÷ 22 = 24.
In this lesson, expressions with the same exponent but different bases were combined.
• For example, 23 ⋅ 53 can be rewritten as 2 ⋅
. Regrouping this as (2 ⋅ 5) ⋅ (2 ⋅ 5) ⋅ (2 ⋅ 5) shows that 23 ∙ 53 = (2 ∙ 5)3 = 103.
• Additionally, 43 73 can be rewritten as 4⋅4⋅4 7⋅7⋅7 . Regrouping this as
4 7
shows that 43 73 = � 4 7 �3.
Notice that the 2 and 5 or the 4 and 7 in the examples could be replaced with different numbers or even variables. For example, if �� and �� are variables, then ��3 ⋅ ��3 = (�� ⋅ ��)3, or ��3 ��3 = ��� �� �3
More generally, for any positive number ��, ���� ⋅ ���� = (�� ⋅ ��)�� because both sides of the equation have exactly �� factors that are �� and �� factors that are ��. This is another exponent law often referred to as the Power of a Product. For any positive number ��, ���� ���� = ��� �� ��� because both sides of the equation have exactly �� factors of �� in the numerator and �� factors of �� in the denominator. This is another exponent law often referred to as the Power of a Quotient.
Practice Problems
1. Select all the true statements.
□ 28 ⋅ 29 = 217
□ 82 ⋅ 92 = 722
□ 82 ⋅ 92 = 724
□ 28 ⋅ 29 = 417
2. Find ��, ��, and �� if (3 ⋅ 5)4 ⋅ (2 ⋅ 3)5 ⋅ (2 ⋅ 5)7 = 2�� ⋅ 3�� ⋅ 5��.
3. Rewrite each expression with a single base and exponent.
a. 54 304
b. 37 ⋅ (−2)7
c. (−12)3 (−4)3
4. Han found a way to compute complicated expressions more easily. Since 2 ⋅ 5 = 10, he looks for pairings of 2s and 5s that he knows equal 10. For example, 3 ⋅ 24 ⋅ 55 = 3 ⋅ 24 ⋅ 54 ⋅ 5 = (3 ⋅ 5) ⋅ (2 ⋅ 5)4 = 15 ⋅ 104 = 150,000. Use Han’s technique to compute the following. a. 24 ⋅ 5 ⋅ (3 ⋅ 5)3
b. 23 52 (2 3)2 (3 5)2 32
5. Lin has a scale model of a modern train. The model is created at a scale of 1 to 48.
a. The height of the model train is 102 millimeters (mm). What is the actual height of the train in meters (m)? Explain your reasoning.
b. On the scale model, the distance between the wheels on the left and the wheels on the right is 1 1 4 inches (in.). The state of Wyoming has old railroad tracks that are 4.5 feet (ft.) apart. Can the modern train travel on those tracks? Explain your reasoning.
6. On the grid, draw a scaled copy of quadrilateral �������� with a scale factor 2 3 .
ManuscriptCopy


ManuscriptCopy
ManuscriptCopy
Unit 7, Lesson 1: Equivalent Numerical Expressions
Warm-Up: Number Talk: Additive Inverses
Find each sum or difference mentally.
1. −30 + (−10)
2. −10 + (−30)
3. −30 − 10
4. 10 − (−3)
Collaborative Activity: Equivalent Numerical Expressions
Work with your partner to complete the following.
1. Is 14 − 3 4 (12) equivalent to 47
−
2�? Explain how you determined your answer.
2. Consider the expression − 3 4 (12).
a. What is the value of − 3 4 (12)?
b. Explain whether or not − 3 4 (12) can be rewritten as 0.75(−12).
c. Does −3(12) 4 have the same value as the expressions in parts A and B?
The expressions in problem 2 all have the same value, but they are written differently.
3. What similarities and differences do you notice between the expressions − 3 4 (12), 0.75(−12), and −3(12) 4 ?
Similarities
Differences
Numerical expressions are equivalent if their values, when simplified, are the same.
4. Determine if the expressions shown are equivalent. Show your work, or explain your thinking.

Guided Activity: Generating Equivalent Expressions
1. Consider the expressions 18 + 12(30 + 7) and 18 + 12(7 + 30).
a. Describe what is different about the expressions.
b. Evaluate 18 + 12(30 + 7) and 18 + 12(7 + 30) in the space provided.
18 + 12(30 + 7)
c. Complete the statement.
18 + 12(7 + 30)
The expressions 18 + 12(30 + 7) and 18 + 12(7 + 30) are are not equivalent.
It was not necessary to evaluate the expressions to determine if they were equivalent or not. Properties of operations could be used to justify their equivalence.
The expressions were the same except for the order of the values in parentheses.
d. Complete the statements.
The commutative distributive commutative property of addition states that the order in which numbers are added does not matter. This property can be used to justify that 18 + 12(30 + 7) is equivalent to 18 + 12(7 + 30).
2. For which mathematical operations does the commutative property hold true?
□ Addition
□ Subtraction
□ Multiplication
□ Division
3. Three numerical expressions are shown. 18 + 12(30 + 7) 18 + 360 + 84 30(30 + 7)
Without evaluating the expressions, complete the statements. The associative distributive commutative property of operations can be used to show that
18 + 12(30 + 7)
18 + 360 + 84
30(30 + 7) is equivalent to 18 + 12(30 + 7). 18 + 360 + 84. 30(30 + 7). The expression
18 + 12(30 + 7)
18 + 360 + 84
30(30 + 7) is not equivalent to the other expressions. When performing the order of operations, addition multiplication must be applied before addition. multiplication.
ManuscriptCopy
Lesson Summary
Equivalent expressions can be rewritten in different forms using the properties of operations. Examples of some properties of operations and properties of equality learned in prior grades are included in the table shown.
Properties of Operations
Associative property of addition
Associative property of multiplication
Commutative property of addition
Commutative property of multiplication
property
inverse property
Multiplicative inverse
Zero product property If ���� = 0, then �� = 0 and/or �� = 0. 10 × 0 = 0
Practice Problems
1. Write an equivalent expression to 5 − 6.2 using the commutative property.
2. Write an equivalent expression to 6 − 1 2 (5 − 6) using the distributive property.
3. Rewrite the following expression in 2 ways using properties of operations.
Review Problem
4. The output from a coal power plant is shown in the table.
Similarly, the output from a solar power plant is shown in the table.
Number of Days 1 4 7 10
Based on the tables, is the energy output in proportion to the number of days for either plant? If so, write an equation showing the relationship. If not, explain your reasoning.
ManuscriptCopy
Unit 7, Lesson 2: Equivalent Linear Expressions
Warm-Up: Notice and Wonder: Tape Diagrams
What do you notice? What do you wonder?
ManuscriptCopy

Collaborative Activity: Evaluating Equivalent Expressions Using Substitution
1. With your partner, determine who will be partner A and who will be partner B.
a. Complete the table for the values assigned to determine if the expressions are equivalent using substitution.
b. Compare your work with your partner’s. Once you have come to a consensus, copy each other’s answers into your books.
2. Complete the statements.
Depending on the value being substituted into the expressions in question 1, the evaluated expressions always sometimes never have the same value as each other.
ManuscriptCopy
Therefore, 8�� + 4�� − 2 and 2(6�� − 1) are are not equivalent expressions.
3. Rewrite 8�� + 4�� − 2 by combining the variable terms.
4. Use the distributive property to rewrite 2(6�� − 1).
5. Discuss with your partner how your answers to problems 3–4 verify the results from the table.
Guided Activity: Determining Equivalent Expressions
1. Complete each statement.
a. The associative distributive commutative property can be used to show that 5(�� + 2) − 3�� is equivalent to 5�� + 10 − 3��.
b. The associative distributive commutative property can be used to show that 2 3 �� + � 3 8 + 5 6 ��� is equivalent to 2 3 �� + � 5 6 �� + 3 8 �.
2. Which properties can be used to show that 2(�� − 4) + 5(3 + 6��) is equivalent to 2�� + 30�� − 8 + 15?
3. For each given expression, write an equivalent expression using a property of operations. Then, state the property used.
−6(2 − 3��) + 1 − �� 2
12�� + 10 + 4�� − 17
5�� + (3�� + 9) + 2
4. Several expressions are shown. Determine which expressions are equivalent using properties of operations. Then, complete the table by writing the expressions that are equivalent based on the property indicated.
+ 7) ∙ 5
Associative property
Commutative property
Distributive property
Lesson Summary
The expressions 8�� + 4�� − 2 and 2(6�� − 1) are equivalent, but not equal. The expressions 12�� − 2 and 12�� − 2 are equal. Algebraic expressions are equal if they have the same terms and operations.
Algebraic expressions are considered equivalent if, when evaluating the expression by substituting values in for variables, the resulting values are the same regardless of the variable used.
Algebraic expressions are also considered equivalent when an expression is rewritten using 1 or more of the properties of operations, similar to equivalent numerical expressions.
Practice Problems
1. For each given expression, write an equivalent expression using the associative, commutative, or distributive property. State the property used for each expression.
2. Consider the 3 expressions given in the table.
a. Find the value of each expression for each given value of ��. Select any value for the last row in the table.
b. What conclusions can you draw about the expressions from the information gathered in the table?
Review Problems
3. Han wants to buy a $30 ticket to a game, but the pre-order tickets are sold out. He knows there will be more tickets sold the day of the game, with a markup of 200%. How much should Han expect to pay for the ticket if he buys it the day of the game?
4. Evaluate each expression. When the answer is not a whole number, write your answer as a fraction.
Unit 7, Lesson 3: Factoring Linear Expressions
Warm-Up: Number Talk: Parentheses
Find the value of each expression mentally. 1. 2 + 3 ⋅ 4 2. (2 + 3)(4) 3. 2 − 3 ⋅ 4 4. 2 − (3 + 4)
ManuscriptCopy
Collaborative Activity: Exploring Equivalent Expressions Using Common Factors
Review with your partner what you learned about common factors in prior grades. Then, work together to complete the problems that follow.
In multiplication expressions, the numbers being multiplied are called factors, and the result is called the product.
Numbers can have common factors. A common factor of 2 numbers is a number that divides evenly into both numbers.
• For example, 1, 3, 5, 9, 15, and 45 are factors of 45, and 1, 2, 3, 4, 5, 6, 10, 12, 15, 20, 30, and 60 are factors of 60.
• The common factors of 45 and 60 are 1, 3, 5, and 15.
The greatest common factor (GCF) is the largest factor that the values share.
• For example, 15 is the GCF of 45 and 60.
Common factors can be used to rewrite numerical expressions.
1. Consider the expression 24 + 32.
a. List all the common factors of 24 and 32.
b. Complete the steps to rewrite the sum of 24 and 32 using their GCF.
24 + 32
(8 × ) + (8 × )
8( + )
c. Choose another common factor of 24 and 32 to write a different expression equivalent to 24 + 32.
24 + 32
( × ) + ( × )
( ) + )
Common factors can also be used to rewrite equivalent algebraic expressions.
2. Use your understanding of common factors to complete the area models shown. In each area model, the factors are along the dotted lines, and their products are in the rectangular area. The first model has been completed as an example.
An area model can be used to show the relationship between equivalent forms of algebraic expressions.
In the area models in the previous problem, the factored form of an expression is the (width) × (length) of the larger rectangle. An equivalent expression in expanded form can be represented by the sum of the areas of the smaller rectangles.
3. Complete the table using the area models from the previous problem.
4. Compare your work with your partner’s. Discuss any differences, and make any corrections, if needed.
Guided Activity: Applying Properties of Operations to Factor and Expand Linear Expressions
Using an area model to rewrite a linear expression in an equivalent factored form is a method of factoring an expression. Factoring is another way of applying the distributive property of multiplication over addition.
1. Without using area models, complete the table so that each row includes equivalent linear expressions.
2. Consider the expression 24�� − 8.
For the expression 24�� − 8, Pao and Camiya wrote different factored forms of the expression, as shown.
a. Explain who wrote a correct equivalent expression in factored form.
ManuscriptCopy
b. What is another equivalent expression using a different common factor?
c. Which expression is equivalent to 24�� − 8, using the GCF of 24�� and −8?
Properties of operations can be used in different ways to create equivalent expressions.
• The distributive property can be used to expand an expression. For example, the expression 3(�� + 5) can be rewritten as 3(��) + 3(5) or 3�� + 15.
• The distributive property can also be used to factor an expression. For example, the expression 8�� + 12 can be rewritten as 2(4�� + 6) or 4(2�� + 3).
Equivalent expressions can also be generated using the commutative property of addition or multiplication as well as the distributive property. An example is shown.
+ 6)2 4(3 + 2��)
3. Complete the following to factor the expression 12�� − 36.
a. Choose a common factor of the terms 12�� and −36. Circle your choice.
b. What is the result of dividing 12�� by the common factor selected?
c. What is the result of dividing −36 by the common factor selected?
d. Use your answers to parts A–C to rewrite an expression equivalent to 12�� − 36 in factored form.
12�� − 36 = ( + )
e. Choose a different common factor from part A, and use it to write a different equivalent expression
12�� − 36 = ( + )
4. Several expressions are shown.
8(3 + ��)
(2�� + 8)3
2(8�� + 12)
(1 + 3)8��
a. Circle the expressions equivalent to 8�� + 24.
4(2�� + 6)
(12 + 4��)2
b. Put an asterisk (*) next to the equivalent expression that has the GCF of 8�� and 24 as 1 of its factors.
c. Put a smiley face () next to an expression where more than 1 property of operations can be used to show it is equivalent to 8�� + 24.
ManuscriptCopy
Lesson Summary
Properties of operations can be used in different ways to generate equivalent expressions. The distributive property can be used to expand an expression. For example, 3(�� + 5) = 3�� + 15. The distributive property can also be used in the other direction to factor an expression. For example, 8�� + 12 = 4(2�� + 3).
The work of using the distributive property to factor the expression 12�� − 8 can be represented by an area model.
• The terms of the product go inside the area of the rectangle, as shown.
• Use the expression to find the greatest common factor of both terms.

The greatest common factor (GCF) of 2 or more whole numbers is the largest whole number that evenly divides the given whole numbers.
The terms 12�� and −8 each have a GCF of 4. The GCF is placed on one side of the large rectangle to represent one dimension of the rectangle, as shown.
• To determine the other dimension of the rectangle using the area model, think “4 times what is 12��?” and “4 times what is −8?” and write the other factors along the top dimension of the rectangle, as shown.


The factors resulting in a product of 12�� − 8 are 4 and (3�� − 2). So, 12�� − 8 is equivalent to 4(3�� − 2).
ManuscriptCopy
Practice Problems
1. Fill in the blanks of the equation to make it true.
75�� + 25�� = ( �� + ��)
2. Rewrite each expression in an equivalent factored form.
a. −15�� + 20 =
b. 4�� − 32 =
c. −27 − 12�� =
d. 35 + 28�� =
3.
a. Expand to write an equivalent expression: −1 4 (−8�� + 12��)
b. Factor to write an equivalent expression: 36�� − 16
Review Problem
4. Elena makes her favorite shade of purple paint by mixing 3 cups (c.) of blue paint, 1 1 2 c. of red paint, and 1 2 of a c. of white paint. Elena has 2 3 of a c. of white paint.
a. Assuming she has enough red paint and blue paint, how much purple paint can Elena make?
b. How much blue paint and red paint will Elena need to use with the 2 3 of a c. of white paint?
ManuscriptCopy
Unit 7, Lesson 4: Combining Like Terms
Warm-Up: Why Is it True?
Explain why each statement is true.
1. 5 + 2 + 3 = 5 + (2 + 3)
2. 9�� is equivalent to 11�� − 2��.
3. 7�� + 4 − 2�� is equivalent to 7�� + −2�� + 4.
4. 8�� − (8�� − 8) is equivalent to 8.
Exploration Activity: A’s and B’s
Diego and Jada are both trying to write an expression with fewer terms that is equivalent to 7�� + 5�� − 3�� + 4��
• Jada thinks 10�� + 1�� is equivalent to the original expression.
• Diego thinks 4�� + 9�� is equivalent to the original expression.
1. We can show expressions are equivalent by writing out all the variables. Explain why the expression on each row (after the first row) is equivalent to the expression on the row before it.
2. Here is another way we can rewrite the expressions. Explain why the expression on each row (after the first row) is equivalent to the expression on the row before it.
Collaborative Activity: Seeing It Differently
Some students are trying to write an expression with fewer terms that is equivalent to 8 − 3(4 − 9��).
Noah says, “I worked the problem from left to right and ended up with 20 − 45��.”
Lin says, “I started inside the parentheses and ended up with 23��.”
Jada says, “I used the distributive property and ended up with 27�� − 4.”
Andre says, “I also used the distributive property, but I ended up with −4 − 27��.”
1. Do you agree with any of them? Explain your reasoning.
− 3(4 − 9��)
− (12 − 27��)
2. For each strategy that you disagree with, find and describe the errors.
Collaborative Activity: X’s and Y’s
Match each expression in column A with an equivalent expression from column B. Be prepared to explain your reasoning.
A. (9�� + 5��) + (3�� + 7��)
B. (9�� + 5��) − (3�� + 7��)
C. (9�� + 5��) − (3�� − 7��)
D. 9�� − 7�� + 3�� + 5��
E. 9�� − 7�� + 3�� − 5��
F. 9�� − 7�� − 3�� − 5��
1. 12(�� + ��)
2. 12(�� − ��)
3. 6(�� − 2��) 4. 9�� + 5�� + 3�� − 7�� 5. 9�� + 5�� − 3�� + 7��
9�� − 3�� + 5�� − 7��
A. B.
C. D. E. F.
Lesson Summary
There are many ways to write equivalent expressions that may look different from each other. As explored in previous lessons, if 2 expressions result in equal values when different values are substituted for the variable(s), then the expressions may be equivalent. However, it’s impossible to compare 2 expressions for all possible values of the variable(s), so to be sure they are equivalent, properties of operations are used to determine equivalence.
Expressions can often be rewritten more simply with fewer terms by combining like terms.
• Combining like terms is an application of the distributive property. An example demonstrating this is shown.
+ 9�� (2 + 9) ⋅ �� 11��
• Combining like terms often also involves using the commutative and associative properties to change the order or grouping of addition. An example demonstrating this is shown.
The order or grouping can’t change when subtracting, so in order to apply the commutative or associative property to expressions that involve subtraction, the subtraction needs to be rewritten as addition, as shown.
Since combining like terms uses properties of operations, it results in expressions that are equivalent.
• The like terms that are combined do not have to be a single number or variable. They may be longer expressions as well. Terms can be combined in any sum where there is a common factor in all the terms.
• For example, each term in the expression 5(�� + 3) − 0.5(�� + 3) + 2(�� + 3) has a factor of (�� + 3). The expression can be rewritten with fewer terms by using the distributive property, as shown.
5(�� + 3) − 0.5(�� + 3) + 2(�� + 3) (5 − 0.5 + 2)(�� + 3) 6.5(�� + 3)
Practice Problems
1. Identify the error in generating an expression equivalent to 4 + 2�� −1 2 (10 − 4��). Then correct the error.
2. Select all expressions that are equivalent to 5�� − 15 − 20�� + 10.
□ 5�� − (15 + 20��) + 10
□ 5�� + −15 + −20�� + 10
□ 5(�� − 3 − 4�� + 2)
□ −5(−�� + 3 + 4�� + −2)
□ −15�� − 5
□ −5(3�� + 1)
3. In each row, decide whether the expression in column A is equivalent to the expression in column B. If they are not equivalent, show how to change one expression to make them equivalent.
A B
a. a. 3�� − 2�� + 0.5�� 1.5��
b. b. 3(�� + 4) − 2(�� + 4) �� + 3
c. c. 6(�� + 4) − 2(�� + 5) 2(2�� + 7)
d. d. 3(�� + 4) − 2(�� + 4) + 0.5(�� + 4) 1.5
Review Problems
4. A certain shade of blue paint is made by mixing 1 1 2 quarts (qt.) of blue paint with 5 qt. of white paint. If you need a total of 16.25 gallons (gal.) of this shade of blue paint, how much of each color should you mix?
5. A rectangle has a height to width ratio of 3 ∶ 4.5. Give two examples of dimensions for rectangles that could be scaled versions of this rectangle.
ManuscriptCopy
Unit 7, Lesson 5: Reasoning about Contexts with Tape Diagrams
Warm-Up: Notice and Wonder
1. What do you notice? What do you wonder?

2. What are some possible values for ��, ��, and �� in the first diagram?
ManuscriptCopy
3. What are some possible values for ��, ��, and �� in the second diagram? How did you decide on those values?
Exploration Activity: Every Picture Tells a Story
Here are three stories with a diagram that represents it. With your group, decide who will go first. That person explains why the diagram represents the story. Work together to find any unknown amounts in the story. Then, switch roles for the second diagram and switch again for the third.
1. Mai made 50 flyers for five volunteers in her club to hang up around school. She gave 5 flyers to the first volunteer, 18 flyers to the second volunteer, and divided the remaining flyers equally among the three remaining volunteers.

2. To thank her five volunteers, Mai gave each of them the same number of stickers. Then she gave them each two more stickers. Altogether, she gave them a total of 30 stickers.

ManuscriptCopy
3. Mai distributed another group of flyers equally among the five volunteers. Then she remembered that she needed some flyers to give to teachers, so she took 2 flyers from each volunteer. Then, the volunteers had a total of 40 flyers to hang up.

Collaborative Activity: Every Story Needs a Picture
Here are three more stories. Draw a tape diagram to represent each story. Then describe how you would find any unknown amounts in the stories.
1. Noah and his sister are making gift bags for a birthday party. Noah puts 3 pencil erasers in each bag. His sister puts �� stickers in each bag. After filling 4 bags, they have used a total of 44 items.
2. Noah’s family also wants to blow up a total of 60 balloons for the party. Yesterday they blew up 24 balloons. Today they want to split the remaining balloons equally between four family members.
3. Noah’s family bought some fruit bars to put in the gift bags. They bought one box each of four flavors: apple, strawberry, blueberry, and peach. The boxes all had the same number of bars. Noah wanted to taste the flavors and ate one bar from each box. There were 28 bars left for the gift bags.
ManuscriptCopy
Collaborative Activity: Matching Equations to Tape Diagrams
1. Match each equation to one of the tape diagrams. Be prepared to explain how the equation matches the diagram.
• 2�� + 5 = 19
• 2 + 5�� = 19
• 2(�� + 5) = 19
• 5(�� + 2) = 19
• 19 = 5 + 2��
• (�� + 5) ∙ 2 = 19
• 19 = (�� + 2) ⋅ 5
• 19 ÷ 2 = �� + 5
• 19 − 2 = 5��

2. Sort the equations into categories of your choosing. Explain the criteria for each category.
Lesson Summary
Tape diagrams are useful for representing how quantities are related and can help answer questions about a situation.
Suppose a school receives 46 copies of a popular book. The library takes 26 copies, and the remainder are split evenly among 4 teachers. How many books does each teacher receive?
This situation involves 4 equal parts and 1 other part. The situation can be represented with a rectangle by labeling 1 part 26 (books given to the library) along with 4 equalsized parts (books split among 4 teachers). Label the total 46 to show how many books the rectangle represents in all. A letter can be used to represent the unknown amount, which is the number of books that each teacher receives. Using the same letter, ��, means that the same number is represented 4 times.

Based on the properties of operations, more than one equation can often be used to represent a single tape diagram.
This diagram can be represented with several different equations. Four examples are given and described.
• 26 + 4�� = 46, because the parts add up to the whole.
• 4�� + 26 = 46, because addition is commutative.
• 46 = 4�� + 26, because if 2 quantities are equal, it doesn’t matter how they are arranged around the equal sign.
• 4�� = 46 − 26, because 1 part (the part made up of 4 ��’s) is the difference between the whole and the other part.
ManuscriptCopy
Practice Problems
1. Andre wants to save $40 to buy a gift for his dad. Andre’s neighbor will pay him weekly to mow the lawn, but Andre always gives a $2 donation to the food bank in weeks when he earns money. Andre calculates that it will take him 5 weeks to earn the money for his dad’s gift. He draws a tape diagram to represent the situation.

a. Explain how the parts of the tape diagram represent the story.
b. How much does Andre’s neighbor pay him each week to mow the lawn?
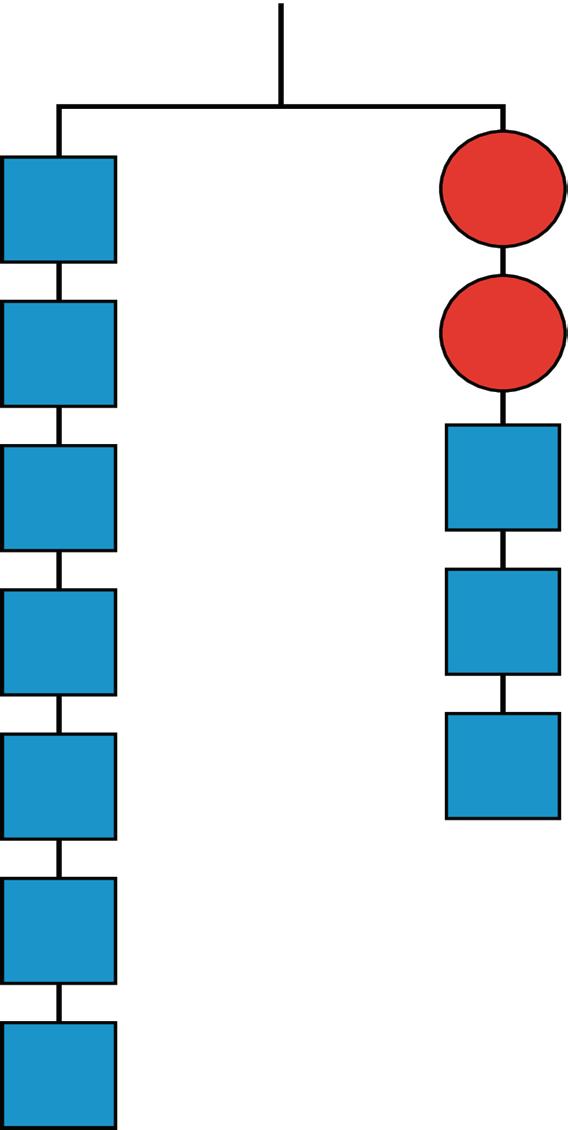
2. Select all stories that the tape diagram can represent.

□ There are 87 children and 39 adults at a show. The seating in the theater is split into 4 equal sections.
□ There are 87 first graders in after-care. After 39 students are picked up, the teacher put the remaining students into 4 groups for an activity.
□ Lin buys a pack of 87 pencils. She gives 39 to her teacher and shared the remaining pencils between herself and 3 friends.
□ Andre buys 4 packs of paper clips with 39 paper clips in each. Then he gives 87 paper clips to his teacher.
□ Diego’s family spends $87 on 4 tickets to the fair and a $39 dinner.
3. Draw a tape diagram to match each equation.
a. 5(�� + 1) = 20
b. 5�� + 1 = 20
4. Select all the equations that match the tape diagram.

□ 35 = 8 + �� + �� + �� + �� + �� + ��
□ 35 = 8 + 6��
□ 6 + 8�� = 35
□ 6�� + 8 = 35
□ 6�� + 8�� = 35��
□ 35 − 8 = 6��
ManuscriptCopy
Review Problem
5. Each car is traveling at a constant speed. Find the number of miles (mi.) each car travels in 1 hour (hr.) at the given rate.
a. 135 mi. in 3 hr.
b. 22 mi. in 1 2 hr.
c. 7.5 mi. in 1 4 hr.
100 3 mi. in 2 3 hr.
e. 97 1 2 mi. in 3 2 hr.
ManuscriptCopy
d.
Unit 7, Lesson 6: Reasoning about Equations and Tape Diagrams
Warm-Up: Algebra Talk: Seeing Structure
Find a solution to each equation without writing anything down.
1. �� + 1 = 5
2. 2(�� + 1) = 10
3. 3(�� + 1) = 15
4. 500 = 100(�� + 1)
Exploration Activity: Situations and Diagrams
Draw a tape diagram to represent each situation. For some of the situations, you need to decide what to represent with a variable.
1. Diego has 7 packs of markers. Each pack has �� markers in it. After Lin gives him 9 more markers, he has a total of 30 markers.
2. Elena is cutting a 30-foot (ft.) piece of ribbon for a craft project. She cuts off 7 ft., and then cuts the remaining piece into 9 equal lengths of �� ft. each.
3. A construction manager weighs a bundle of 9 identical bricks and a 7-pound (lb.) concrete block. The bundle weighs 30 lb.
4. A skating rink charges a group rate of $9 plus a fee to rent each pair of skates. A family rents 7 pairs of skates and pays a total of $30.
5. Andre bakes 9 pans of brownies. He donates 7 pans to the school bake sale and keeps the rest to divide equally among his class of 30 students.
ManuscriptCopy
Exploration Activity: More Situations and Diagrams
Draw a tape diagram to represent each situation. For some of the situations, you need to decide what to represent with a variable.
1. Each of 5 gift bags contains �� pencils. Tyler adds 3 more pencils to each bag. Altogether, the gift bags contain 20 pencils.
2. Noah drew an equilateral triangle with sides of length 5 inches (in.). He wants to increase the length of each side by �� in. so the triangle is still equilateral and has a perimeter of 20 in.
3. An art class charges each student $3 to attend plus a fee for supplies. Today, $20 was collected for the 5 students attending the class.
4. Elena ran 20 miles (mi.) this week, which was three times as far as Clare ran this week. Clare ran 5 more mi. this week than she did last week.
ManuscriptCopy
Collaborative Activity: Situations, Diagrams, and Equations
Each situation in the previous 2 exploration activities is represented by 1 of the equations shown in the table.
1. Match each situation to an equation.
Diego’s Markers
Elena’s Craft Project
Construction Manager
Skating Rink
Andre’s Brownies
Tyler’s Gift Bags
Noah’s Triangle
Art Class
Elena’s Run
ManuscriptCopy
2. Find the solution to each equation. Use your diagrams to help you reason.
Situation Solution
Diego’s Markers
Elena’s Craft Project
Construction Manager
Skating Rink
Andre’s Brownies
Tyler’s Gift Bags
Noah’s Triangle
Art Class
Elena’s Run
ManuscriptCopy
3. Choose 1 of the situations, and explain what the solution tells you about its situation.
Lesson Summary
Many situations can be represented by equations. Writing an equation to represent a situation can help express how quantities in the situation are related to each other. It can also be used to reason about unknown quantities.
Consider the example shown.
An architect is drafting plans for a new supermarket. There will be a space 144 in. long for rows of nested shopping carts. The first cart is 34 in. long, and each nested cart adds another 10 in. The architect wants to know how many shopping carts will fit in each row.
• In this situation, there is 1 shopping cart with length 34 and then an unknown number of carts with length 10.
• The situation has 1 part of 34 and then equal parts of size 10 that altogether sum to 144.
• Therefore, the equation 34 + 10�� = 144 represents this situation.
• Since it takes 11 groups of 10 to get from 34 to 144, the value of �� in the situation is (144 − 34) ÷ 10, or 11. There will be 11 shopping carts in each row.
Equations with parentheses can also be used to represent situations. Consider another example.
Lin volunteers at a children’s hospital and is preparing toy baskets for the patients. She adds 2 items to each basket, after which the supervisor’s list shows that 140 toys have been packed into a group of 10 baskets. Lin wants to know how many toys were in each basket before she added the items.
• Each bag has an unknown number of toys, ��, that is increased by 2.
• Then, 10 groups of �� + 2 give a total of 140 toys.
• An equation representing this situation is 10(�� + 2) = 140.
• Since 10 times a number is 140, that number is 14, which is the total number of items in each bag. Before Lin added the 2 items, there were 14 − 2, or 12, toys in each bag.
Practice Problems
1. Here are three stories:
• A family buys 6 tickets to a show. They also pay a $3 parking fee. They spend $27 to see the show.
• Diego has 27 ounces of juice. He pours equal amounts for each of his 3 friends and has 6 ounces left for himself.
• Jada works for 6 hours preparing for the art fair. She spends 3 hours on a sculpture and then paints 27 picture frames.
Here are three equations:
• 3�� + 6 = 27
• 6�� + 3 = 27
• 27�� + 3 = 6
a. Decide which equation represents each story. What does �� represent in each equation?
b. Find the solution to each equation. Explain or show your reasoning.
c. What does each solution tell you about its situation?
2. Here is a diagram and its corresponding equation. Find the solution to the equation and explain your reasoning.

6(�� + 1) = 24
3. Here is a diagram and its corresponding equation. Find the solution to the equation and explain your reasoning.

6�� + 11 = 21
Review Problem
4. A store is having a 25% off sale on all shirts. Show two different ways to calculate the sale price for a shirt that normally costs $24.
Unit 7, Lesson 7: Distinguishing between Two Types of Situations
Warm-Up: Which One Doesn’t Belong: Seeing Structure
1. Which equation doesn’t belong?
A. 4(�� + 3) = 9
B. 4 ⋅ �� + 12 = 9
C. 4 + 3�� = 9
D. 9 = 12 + 4��
Exploration Activity: Categories of Equations Card Sort
Your teacher will give you a set of cards that show equations. Sort the cards into 2 categories of your choosing. Be prepared to explain the meaning of your categories.
Then, sort the cards into 2 categories in a different way. Be prepared to explain the meaning of your new categories.
ManuscriptCopy
Collaborative Activity: Even More Situations, Diagrams, and Equations
Story 1: Lin had 90 flyers to hang up around the school. She gave 12 flyers to each of three volunteers. Then she took the remaining flyers and divided them up equally between the three volunteers.
Story 2: Lin had 90 flyers to hang up around the school. After giving the same number of flyers to each of three volunteers, she had 12 left to hang up by herself.

1. Which diagram goes with which story? Be prepared to explain your reasoning.
2. In each diagram, what part of the story does the variable represent?
Diagram A:
Diagram B:
3. Write an equation corresponding to each story. If you get stuck, use the diagram.
Story 1:
Story 2:
4. Find the value of the variable in the story.
Story 1:
Story 2:
Lesson Summary
In this unit, there are 2 main types of situations that can be represented with equations. An example of each type is given.
• After adding 8 students to each of 6 same-sized teams, there were 72 students altogether.
• After adding an 8-pound (lb.) box of tennis rackets to a crate with 6 identical boxes of ping pong paddles, the crate weighed 72 lb.
The first situation has all equal parts, since additions are made to each team. An equation that represents this situation is 6(�� + 8) = 72, where �� represents the original number of students on each team. Eight students were added to each group, there are 6 groups, and there are 72 students in total.
In the second situation, there are 6 equal parts added to 1 other part. An equation that represents this situation is 6�� + 8 = 72, where �� represents the weight of a box of ping pong paddles. There are 6 boxes of ping pong paddles, there is an additional box that weighs 8 lb., and the crate weighs 72 lb. altogether.
In the first situation, there were 6 equal groups and 8 students added to each group.
6(�� + 8) = 72
In the second situation, there were 6 equal groups, but 8 more lb. in addition to that.
6�� + 8 = 72
Practice Problems
1. Elena walked 20 minutes (min.) more than Lin. Jada walked twice as long as Elena. Jada walked for 90 min. The equation 2(�� + 20) = 90 describes this situation. Match each amount in the story with the expression that represents it.
A. The number of min. that Jada walked
B. The number of min. that Elena walked
C. The number of min. that Lin walked 1. �� 2. �� + 20
3. 2(�� + 20)
4. 90
2. Match each equation to a story. (Two of the stories match the same equation.)
A. 3(�� + 5) = 17
B. 3�� + 5 = 17
C. 5(�� + 3) = 17
1. Jada’s teacher fills a travel bag with 5 copies of a textbook. The weight of the bag and books is 17 lb. The empty travel bag weighs 3 lb. How much does each book weigh?
2. A piece of scenery for the school play is in the shape of a 5-foot (ft.)-long rectangle. The designer decides to increase the length. There will be 3 identical rectangles with a total length of 17 ft. By how much did the designer increase the length of each rectangle?
D. 5�� + 3 = 17
Review Problems
3. Elena spends $17 and buys a $3 book and a bookmark for each of her 5 cousins. How much does each bookmark cost?
4. Noah packs up bags at the food pantry to deliver to families. He packs 5 bags that weigh a total of 17 lb. Each bag contains 3 lb. of groceries and a packet of papers with health-related information. How much does each packet of papers weigh?
5. Andre has 3 times as many pencils as Noah and 5 pens. He has 17 pens and pencils all together. How many pencils does Noah have?
3. A school ordered 3 large boxes of board markers. After giving 15 markers to each of 3 teachers, there were 90 markers left. The diagram represents the situation. How many markers were originally in each box?
ManuscriptCopy
4. The diagram can be represented by the equation 25 = 2 + 6��. Explain where you can see the 6 in the diagram.


Unit 7, Lesson 8: Reasoning about Solving Equations
Warm-Up: Hanger Diagrams
In the two diagrams, all the triangles weigh the same and all the squares weigh the same.

For each diagram, come up with . . .
1. One thing that must be true
Diagram 1:
Diagram 2:
2. One thing that could be true
Diagram 1:
Diagram 2:
3. One thing that cannot possibly be true
Diagram 1:
Diagram 2:
Exploration Activity: Use Hangers to Understand Equation Solving
Here are some balanced hangers where each piece is labeled with its weight.

For each diagram:
1. Write an equation.
Diagram A: Diagram B: Diagram C: Diagram D:
2. Explain how to figure out the weight of a piece labeled with a letter by reasoning about the diagram.
ManuscriptCopy
3. Explain how to figure out the weight of a piece labeled with a letter by reasoning about the equation.
Exploration Activity: Use Hangers to Understand Equation Solving, Again
Here are some balanced hangers. Each piece is labeled with its weight.


For each diagram:
1. Assign one of these equations to each hanger.
a. 2(�� + 5) = 16
ManuscriptCopy
b. 3(�� + 200) = 3,000
c. 20.8 = 4(�� + 1.1)
d. 20 2 = 2��� + 2 3 �

2. Explain how to figure out the weight of a piece labeled with a letter by reasoning about the diagram.
3. Explain how to figure out the weight of a piece labeled with a letter by reasoning about the equation.
ManuscriptCopy
Lesson Summary
The balanced hanger shows 3 equal, unknown weights: three 2-unit weights on the left, and one 18-unit weight on the right.
There are 3 unknown weights plus 6 units of weight on the left. The balanced hanger can be represented with an equation, and the equation can be solved, as shown.
3�� + 6 = 18 (Original hanger)
3�� = 12 (Remove 6 units of weight from both sides.)
�� = 4 (Divide the remaining weight into 3 groups.)
Since there are 3 groups of �� + 2 on the left, this hanger can also be represented with a different equation, 3(�� + 2) = 18.
The 2 sides of the hanger balance with these weights: 3 groups of (�� + 2) on 1 side, and 18, or 3 groups of 6, on the other side.

The 2 sides of the hanger will remain balanced with only 1 3 of the weight on each side, as shown.
If 2 units of weight are removed from each side, the hanger will stay balanced. This is the same as subtracting 2 from each side of the equation.
ManuscriptCopy
An equation for the new balanced hanger is �� = 4. This gives the solution to the original equation.


Practice Problems
1. Explain how the parts of the balanced hanger compare to the parts of the equation.
7 = 2�� + 3
2. A hanger diagram is shown.
a. Write an equation to represent the hanger.
b. Solve the equation by reasoning about the equation or the hanger. Explain your reasoning.
ManuscriptCopy

3. A hanger diagram is shown.
a. Write an equation to represent the hanger.
b. Draw more hangers to show each step you would take to find ��. Explain your reasoning.

c. Write an equation to describe each hanger you drew. Describe how each equation matches its hanger.
4. Explain how each part of the equation 9 = 3(�� + 2) is represented in the hanger.
a. ��
b. 9
c. 3
d. �� + 2
e. 3(�� + 2)
f. the equal sign

Review Problem
5. Clare drew this diagram to match the equation 2�� + 16 = 50, but she got the wrong solution as a result of using this diagram.

a. What value for �� can be found using the diagram?
b. Show how to fix Clare’s diagram to correctly match the equation.
c. Use the new diagram to find a correct value for ��.
d. Explain the mistake Clare made when she drew her diagram.
ManuscriptCopy
Unit 7, Lesson 9: Solving Equations
Warm-Up: Which One Doesn’t Belong: Rational Number Arithmetic
1. Which equation doesn’t belong?
A. 15 = −5 ⋅ −3
B. 2 + −5 = −3
C. 4 − −2 = 6
D. −3 ⋅ −4 = −12
Collaborative Activity: Solving Equations
With your partner, determine who will be partner A and who will be partner B.
1. Solve each equation in your column.
3 =−6 8(�� − 4) − 17 = 21 4 = 1 2 (�� − 12) + (−7) �� + (−13) = 21
5�� + 11 − 7�� = −12 −9 = −2��−22 5
2. The solutions to the equations in each row are the same. Compare your solutions with your partner’s. Resolve any differences in your solutions, if necessary.
ManuscriptCopy
Exploration Activity: Keeping It True
Here are some equations that all have the same solution.
�� = −6
�� − 3 = −9
−9 = �� − 3
900 = −100(�� − 3)
900 = (�� − 3) · (−100)
900 = −100�� + 300
1. Explain how you know that each equation has the same solution as the previous equation.
Pause for discussion before moving to the next question.
2. Keep your work secret from your partner. Start with the equation −5 = ��. Do the same thing to each side at least three times to create an equation that has the same solution as the starting equation. Write the equation you ended up with on a slip of paper, and trade equations with your partner.
ManuscriptCopy
3. See if you can figure out what steps they used to transform −5 = �� into their equation. When you think you know, check with them to see if you are right.
Lesson Summary
When solving equations, the goal is to isolate the variable to find the value(s) of the variable that make(s) the equation true.
The balanced hangers used in prior lessons demonstrated that doing the same thing to each side of an equation keeps the equation true. Properties of equality can be applied to create equivalent equations, making moves toward isolating the variable.
Two examples are shown.
Equivalent Equation Description 2(�� − 5) = 6 Given
− 5 + 5 = −3 + 5 �� = 2 Add 5 to each side. Equivalent Equation Description
Multiply each side by 4.
Divide each side by
Doing the same thing to each side of an equation maintains equality, even if it is not helpful for solving for the unknown amount. For example, given the equation −3�� + 7 = −8, add −2 to each side. The results are shown.
−3�� + 7 + (−2) = −8 + (−2)
−3�� + 5 = −10
If −3�� + 7 = −8 is true, then −3�� + 5 = −10 is also true. However, the solution is no closer than before adding −2. Moves can help maintain equality to make new equations that all have the same solution. Helpful combinations of moves will eventually lead to an equation where the variable is isolated, like �� = 5, which gives the solution to the original equation and every equation in the process of solving.
Note there are also times when writing an expression on 1 side of an equation in fewer terms is also a helpful step in solving the equation. For example, consider the equation 3�� + 12 − 5�� = −15. Combining like terms in the expression on the left side of the equation is a move that helps get closer to the solution, resulting in the equivalent equation −2�� + 12 = −15. ManuscriptCopy
Practice Problems
1. Solve each equation.
a. 4�� = −28
b. �� − (−6) = −2
c. −�� + 4 = −9
d. −3�� + 16 − 9 = 1
e. 13�� + −11 − (−12��) = −86
2. Here is an equation: 2�� + 9 = −15. Write three different equations that have the same solution as 2�� + 9 = −15. Show or explain how you found them.
ManuscriptCopy
Review Problems
3. Select all the equations that match the diagram.
□ �� + 5 = 18
□ 18 ÷ 3 = �� + 5
□ 3(�� + 5) = 18
□ �� + 5 = 1 3 ⋅ 18
□ 3�� + 5 = 18
4. Match each story to an equation.

A. A stack of nested paper cups is 8 inches (in.) tall. The first cup is 4 in. tall and each of the rest of the cups in the stack adds 1 4 in. to the height of the stack
B. A baker uses 4 cups (c.) of flour. She uses 1 4 c. to flour the counters and the rest to make 8 identical muffins.
C. Elena has an 8-foot (ft.) piece of ribbon. She cuts off a piece that is 1 4 of a foot long and cuts the remainder into four pieces of equal length.
4. There are 88 seats in a theater. The seating in the theater is split into 4 identical sections. Each section has 14 red seats and some blue seats.
a. Draw a tape diagram to represent the situation.
ManuscriptCopy
b. What unknown amounts can be found by using the diagram or reasoning about the situation?
Unit 7, Lesson 10: Different Options for Solving the Same Equation
Warm-Up: Algebra Talk: Solve Each Equation
1. 100(�� − 3) = 1,000
500(�� − 3) = 5,000
0.03(�� − 3) = 0.3
4. 0.72(�� + 2) = 7.2
5. 1 7 (�� + 2) = 10 7
ManuscriptCopy
2.
3.
Exploration Activity: Analyzing Solution Methods
Three students each attempted to solve the equation 2(�� − 9) = 10, but they got different solutions. Each student’s method and their solution are shown. For each solution method, explain whether you agree with their method and why.
Method
Nic’s method
2(�� − 9) = 10
2(�� − 9) + 9 = 10 + 9 Add 9 to each side.
2�� = 19
2�� ÷ 2 = 19 ÷ 2 Divide each side by 2.
�� = 19 2
Morgan’s method
2(�� − 9) = 10
2�� − 18 = 10 Apply the distributive property.
2�� − 18 − 18 = 10 − 18 Subtract 18 from each side.
2�� = −8
2�� ÷ 2 = −8 ÷ 2 Divide each side by 2.
�� = −4
Jared’s method
2(�� − 9) = 10
�� − 9 = 5 Divide each side by 2.
�� − 9 + 9 = 5 + 9 Add 9 to each side.
ManuscriptCopy
�� = 14
Explain whether you agree with their method and why.
Collaborative Activity: Solution Pathways
For each equation, try to solve the equation using each method (dividing each side first, or applying the distributive property first). Some equations are easier to solve by one method than the other. When that is the case, stop doing the harder method and write down the reason you stopped.
1. 2,000(�� − 0.03) = 6,000
2. 2(�� + 1.25) = 3.5 3. 1 4 (4 + ��) = 4 3
4. −10(�� − 1.7) = −3
5. 5.4 = 0.3(�� + 8)
Lesson Summary
Equations can be solved in many ways. In this lesson, the focus was on equations with a specific structure, and 2 specific ways to solve them.
When trying to solve the equation 4 5 (�� + 27) = 16, there are 2 useful first steps possible.
• Divide each side by 4 5 .
• Apply the distributive property.
To decide which approach is better, consider the numbers, and think about which would be easier to compute. Notice that 4 5 ⋅ 27 will be complicated, because 27 isn’t divisible by 5. However, 16 ÷ 4 5 is the same as 16 ⋅ 5 4 , and 16 is divisible by 4. Dividing each side by 4 5 results in the following equivalent equations.
4 5 (�� + 27) = 16
Use the structure of an equation and the values included within the equation to determine an efficient solution method. ManuscriptCopy
In other cases, the solution pathway is simpler if the distributive property is used first. Consider the equation 100(�� + 0.06) = 21. If each side of the equation is divided by 100, then 21 100 , or 0.21, is on the right side of the equation. But if the distributive property is used first, the resulting equation only contains whole numbers, as shown.
100(�� + 0.06) = 21 100�� + 6 = 21
= 15
= 15 100
Practice Problems
1. Solve each equation.
a. 2(�� − 3) = 14
b. −5(�� − 1) = 40
c. 12(�� + 10) = 24
d. 1 6 (�� + 6) = 11
e. 5 7 (�� − 9) = 25
ManuscriptCopy
2. Select all expressions that represent a correct solution to the equation 6(�� + 4) = 20.
□ (20 − 4) ÷ 6
□ 1 6 (20 − 4)
□ 20 − 6 − 4
□ 20 ÷ 6 − 4
□ 1 6 (20 − 24)
□ (20 − 24) ÷ 6
3. Lin and Noah are solving the equation 7(�� + 2) = 91.
Lin starts by using the distributive property. Noah starts by dividing each side by 7.
a. Show what Lin’s and Noah’s full solution methods might look like.
b. What is the same and what is different about their methods?
Review Problems
4. Andre wants to buy a backpack. The normal price of the backpack is $40. He notices that a store that sells the backpack is having a 30% off sale. What is the sale price of the backpack?
5. On the first math exam, 16 students received an A grade. On the second math exam, 12 students received an A grade. What percentage decrease is that?
Unit 7, Lesson 11: Using Equations to Solve Problems
Warm-Up: Remember Tape Diagrams
1. Write a story that could be represented by this tape diagram.

2. Write an equation that could be represented by this tape diagram.
ManuscriptCopy
Exploration Activity: At the Fair
1. Tyler is making invitations to the fair. He has already made some of the invitations, and he wants to finish the rest of them within a week. He is trying to spread out the remaining work, to make the same number of invitations each day. Tyler draws a diagram to represent the situation.

a. Explain how each part of the situation is represented in Tyler’s diagram.
How many total invitations Tyler is trying to make
How many invitations he has made already
How many days he has to finish the invitations
b. How many invitations should Tyler make each day to finish his goal within a week? Explain or show your reasoning.
c. Use Tyler’s diagram to write an equation that represents the situation. Explain how each part of the situation is represented in your equation.
ManuscriptCopy
d. Show how to solve your equation.
2. Noah and his sister are making prize bags for a game at the fair. Noah is putting 7 pencil erasers in each bag. His sister is putting in some number of stickers. After filling 3 of the bags, they have used a total of 57 items.

a. Explain how the diagram represents the situation.
b. Noah writes the equation 3(�� + 7) = 57 to represent the situation. Do you agree with him? Explain your reasoning.
c. How many stickers is Noah’s sister putting in each prize bag? Explain or show your reasoning.
3. A family of 6 is going to the fair. They have a coupon for $1.50 off each ticket. If they pay $46.50 for all their tickets, how much does a ticket cost without the coupon? Explain or show your reasoning. If you get stuck, consider drawing a diagram or writing an equation.
ManuscriptCopy
Collaborative Activity: Walking More Each Day
1. Mai started a new exercise program. On the second day, she walked 5 minutes (min.) more than on the first day. On the third day, she increased her walking time from day 2 by 20% and walked for 42 min. Mai drew a diagram to show her progress.
Explain how the diagram represents the situation.

2. Noah said the equation 1.20(�� + 5) = 42 also represents the situation. Do you agree with Noah? Explain your reasoning.
3. Find the number of minutes Mai walked on the first day. Did you use the diagram, the equation, or another strategy? Explain or show your reasoning.
4. Mai has been walking indoors because of cold temperatures. On Day 4 at noon, Mai hears a report that the temperature is only 9 degrees Fahrenheit (℉). She remembers the morning news reporting that the temperature had doubled since midnight and was expected to rise 15℉ by noon. Mai is pretty sure she can draw a diagram to represent this situation but isn’t sure if the equation is 9 = 15 + 2�� or 2(�� + 15) = 9. What would you tell Mai about the diagram and the equation and how they might be useful to find the temperature, ��, at midnight?
Lesson Summary
Many problems can be solved by writing and solving an equation.
For example, Clare ran 4 mi. on Monday. Then, for the next 6 days, she ran an equal distance each day. She ran a total of 22 miles (mi.) over the course of the week. How many mi. did she run on each of the 6 days?
One way to solve this problem is to represent the situation with an equation, 4 + 6�� = 22, where �� represents the distance, in mi., that she ran on each of the 6 days. Solving the equation gives the solution to this problem.
4 + 6�� = 22
6�� = 18
�� = 3
Clare ran 3 mi. each of the 6 days.
Problems with percent increase or decrease can also be solved by writing and solving equations.
For example, a camping store increases the price of a tent by 25%. A customer then uses a $10 coupon for the tent and pays $152.50. A diagram can be drawn to show the 25% increase and then the $10 coupon.

The price after the 25% increase is �� + 0.25��, or 1.25��. An equation that represents the situation could be 1.25�� − 10 = 152.50. To find the original price before the increase and discount, 10 can be added to each side of the equation, and then each side can be divided by 1.25, resulting in �� = 130. The original price of the tent was $130.
Practice Problems
1. The baby giraffe weighed 132 pounds (lb.) at birth. He gained weight at a steady rate for the first 7 months until his weight reached 538 lb. How much did he gain each month?
2. Match each equation to its solution and to the story it describes.
Equations:
A. 5�� − 7 = 3
B. 7 = 3(5 + ��)
C. 3�� + 5 = −7
D. 1 3 (�� + 7) = 5
Stories:
a. The temperature is −7. Since midnight the temperature tripled and then rose 5 degrees. What was temperature at midnight?
b. Jada has 7 pink roses and some white roses. She gives all of them away: 5 roses to each of her 3 favorite teachers. How many white roses did she give away?
c. A musical instrument company reduced the time it takes for a worker to build a guitar. Before the reduction it took 5 hours (hr.). Now in 7 hr. they can build 3 guitars. By how much did they reduce the time it takes to build each guitar?
d. A club puts its members into 5 groups for an activity. After 7 students have to leave early, there are only 3 students left to finish the activity. How many students were in each group?
ManuscriptCopy
3. Here are two stories.
a. The initial freshman class at a college is 10% smaller than last year’s class. But then during the first week of classes, 20 more students enroll. There are then 830 students in the freshman class.
b. A store reduces the price of a computer by $20. Then during a 10% off sale, a customer pays $830.
Here are two equations:
• 0.9�� + 20 = 830
• 0.9(�� − 20) = 830
a. Decide which equation represents each story.
Story A:
Story B:
b. Explain why one equation has parentheses and the other doesn’t.
c. Solve each equation, and explain what the solution means in the situation.
ManuscriptCopy
4. A small town had a population of 960 people last year. The population grew to 1,200 people this year. By what percentage did the population grow?
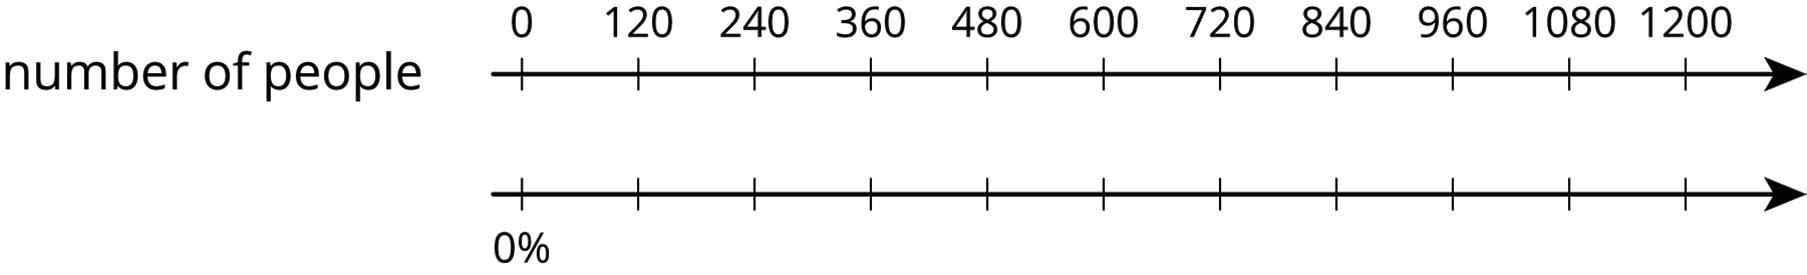
5. The gas tank of a truck holds 30 gallons (gal.). The gas tank of a passenger car holds 50% less. How many gal. does it hold?

6. Find the value of each variable.
a. �� ⋅ 3 = −30
b. −9 ⋅ �� = 45
c. −89 ⋅ 12 = ��
d. �� ⋅ 88 = −88,000
Unit 7, Lesson 12: Reintroducing Inequalities
Warm-Up: Greater Than One
The number line shows values of �� that make the inequality �� > 1 true.
1. Select all the values of �� from this list that make the inequality �� > 1 true.
2. Name two more values of �� that are solutions to the inequality.
ManuscriptCopy
Exploration Activity: The Roller Coaster
A sign next to a roller coaster at an amusement park says, “You must be at least 60 inches (in.) tall to ride.” Noah is happy to know that he is tall enough to ride.
1. Noah is �� in. tall. Which of the following can be true: �� > 60, �� = 60, or �� < 60? Explain how you know.

2. Noah’s friend is 2 in. shorter than Noah. Can you tell if Noah’s friend is tall enough to go on the ride? Explain or show your reasoning.
3. List one possible height for Noah that means that his friend is tall enough to go on the ride, and another that means that his friend is too short for the ride.
Tall enough: Too short:
4. On the number line below, show all the possible heights that Noah’s friend could be.
5. Noah’s friend is �� in. tall. Use �� and any of the symbols <, = , > to express this height.
Exploration Activity: Is the Inequality True or False?
1. The table shows four inequalities and four possible values for ��. Decide whether each value makes each inequality true, and complete the table with “true” or “false.” Discuss your thinking with your partner. If you disagree, work to reach an agreement.
ManuscriptCopy
Guided Activity: Solving Two-Step Inequalities
Inequalities can be solved using strategies similar to those used for solving equations.
1. The work for solving the equation 17 = 5�� + 9 and the work for solving the inequality 17 < 5�� + 9 are shown.
a. Complete the table with the justification of each step used for solving the equation and the inequality.
The solution for the equation and the solution set for the inequality are shown.
b. Discuss with your partner the similarities and differences between solving and graphing the solutions for equations and inequalities. Summarize your discussion.
2. The work for solving the equation 13 = −5�� − 7 and the inequality 13 ≥ −5�� − 7 are shown.
a. Complete the table with the justification of each step used for solving the equation and the inequality.
b. How did the final steps of solving the inequality 13 ≥ −5�� − 7 differ from the final steps of solving the inequality 17 < 5�� + 9?
3. Solve each inequality, and graph the solution.
ManuscriptCopy
a. 2 − �� 6 ≥ −4
b. 13 ≥ −5�� − 7
Lesson Summary
An inequality is a mathematical relationship between 2 expressions that are not equal (>, <, or ≠) or are not always equal (≤ or ≥). Inequalities use these symbols to describe a range of numbers.
In many places, people are allowed to get a driver’s license when they are at least 16 years old. When checking if someone is old enough to get their license, it needs to be determined if their age is at least 16.
Symbol Meaning
> is greater than
< is less than
≠ is not equal to
≥ is greater than or equal to
≤ is less than or equal to
• If ℎ is a person’s age, then the inequality ℎ > 16 or the equation ℎ = 16 must be true. The symbol ≥, read, “is greater than or equal to,” combines these 2 cases. The inequality ℎ ≥ 16 can be used to represent the age of a person who is old enough to get their license.
The solution to the inequality ℎ ≥ 16 is any age of a person that makes the inequality true. For example, 18 is a solution to the inequality because 18 ≥ 16.
A solution to an inequality is a number that can be used in place of the variable to make the inequality true.
An inequality has infinite solutions, called a solution set, which can be represented on a number line.
• The inequality ℎ ≥ 16 can be represented on a number line, as shown. The closed circle at 16 indicates this value is included in the solution set along with all values to the right of 16 on the number line, represented by the ray pointing to the right.
The same strategies used to isolate a variable to 1 side of an equation can be used to solve inequalities. However, when the variable term in an inequality is negative, the inequality can be rewritten by multiplying or dividing the entire inequality by −1. In the resulting inequality, each term and the comparison symbol will change to its opposite. An example is shown.
− 3�� ≤ 6
Notice that because the inequality was divided by −3 to arrive at the final statement, each term was divided by −3 and the comparison symbol changed to its opposite.
Practice Problems
1. For each inequality, find two values for �� that make the inequality true and two values that make it false.
a. �� + 3 > 70
b. �� + 3 < 70
c. −5�� < 2
d. 5�� < 2
2. Here is an inequality: −3�� > 18.
a. List some values for �� that would make this inequality true.
ManuscriptCopy
b. How are the solutions to the inequality −3�� ≥ 18 different from the solutions to −3�� > 18? Explain your reasoning.
Review Problems
3. Here are the prices for cheese pizza at a certain pizzeria.
a. You had a coupon that made the price of a large pizza $13.00. For what percent off was the coupon?
b. Your friend purchased a medium pizza for $10.31 with a 30% off coupon. What is the price of a medium pizza without a coupon?
c. Your friend has a 15% off coupon and $10. What is the largest pizza that your friend can afford, and how much money will be left over after the purchase?
4. Select all the stories that can be represented by the diagram.

□ Andre studies 7 hours (hr.) this week for end-of-year exams. He spends 1 hr. on English and an equal number of hours each on math, science, and history.
□ Lin spends $3 on 7 markers and a $1 pen.
ManuscriptCopy
□ Diego spends $1 on 7 stickers and 3 marbles.
□ Noah shares 7 grapes with 3 friends. He eats 1 and gives each friend the same number of grapes.
□ Elena spends $7 on 3 notebooks and a $1 pen.
Unit 7, Lesson 13: Solving Inequalities
Warm-Up: Creating Inequalities
1. Using the integers −8 to 8 no more than once each, create an inequality with solutions of �� > 2 3 There is more than 1 correct answer.
Guided Activity: Solving Two-Step Inequalities
Sadie and Nikhil each solve the inequality
3(�� − 6) ≥ 9. Their work is shown.
1. Compare and contrast Sadie’s and Nikhil’s work.
Sadie’s Work Nikhil’s Work 3(�� − 6) ≥ 9
− 18 ≥ 9
2. Graph the solution to the inequality 3(�� − 6) ≥ 9.
3. Use substitution to verify the solution set.
ManuscriptCopy
4. Solve the inequality 56 < 7(7 − ��) using Sadie’s method and Nikhil’s method.
Method
56 < 7(7 − ��)
5. Graph the solution to the inequality 56 < 7(7 − ��).
6. Use substitution to verify the solution set.
Method
56 < 7(7 − ��)
7. Explain whether you prefer Sadie’s method or Nikhil’s method.
ManuscriptCopy
Collaborative Activity: Card Match
1. Work with your partner to match the provided inequality and solution cards to each graph in the table.
Lesson Summary
The solution set for an inequality includes all of the values that, when substituted for the variable, make the inequality statement true. Inequalities can be solved using strategies similar to those used for solving equations.
For example, the work for solving the equation 11 = −2�� − 7 and the work for solving the inequality 11 > −2�� − 7 are shown.
A key difference between solving equations and solving inequalities occurs when multiplying or dividing by a negative value. Recall from the prior lesson that when multiplying or dividing an inequality by a negative, each term and the comparison symbol in the resulting inequality will change to its opposite to maintain a true statement. For example, in the solution method for 11 > −2�� − 7, when 18 and −2�� are divided by −2 to isolate �� to 1 side of the inequality, the signs of the resulting terms, −9 and ��, flip, as does the inequality symbol.
Similarly to equations, inequalities can be read in both directions. The solution to the equation 11 = −2�� − 7 shown above can be read as “−9 is equal to ��” or “�� is equal to −9.” The solution set for the inequality 11 > −2�� − 7 can be read as “−9 is less than ��” or “�� is greater than −9.” This can be helpful when considering the values included in a solution set.
Practice Problems
1. Solve the inequality 5(�� − 1) > −40, and graph the solution set on a number line.
2. Describe how to solve the inequality 32 ≥ −4(�� − 10).
3. Solve each inequality, and represent the solution set on the number line.
a. − 1 2 (−3�� + 8) ≤ −15 b. −1.2 < �� − 4 5
Review Problems
4. A backpack normally costs $25 but it is on sale for $21. What percentage is the discount?
ManuscriptCopy
5. Find each product.
ManuscriptCopy
Unit 7, Lesson 14: Finding Solutions to Inequalities in Context
Warm-Up: Solutions to Equations and Solutions to Inequalities
1. Solve −�� = 10.
2. Find 2 solutions to −�� > 10.
3. Solve 2�� = −20.
4. Find 2 solutions to 2�� > −20.
Guided Activity: Earning Money for Soccer Gear
1. Andre has a summer job selling magazine subscriptions. He earns $25 per week plus $3 for every subscription he sells. Andre hopes to make at least enough money this week to buy a new pair of soccer cleats.
a. Let �� represent the number of magazine subscriptions Andre sells this week. Write an expression for the amount of money he makes this week.
b. The least expensive pair of cleats Andre wants costs $68. Write and solve an equation to find out how many magazine subscriptions Andre needs to sell to buy the cleats.
c. If Andre sold 16 magazine subscriptions this week, would he reach his goal? Explain your reasoning.
d. What are some other numbers of magazine subscriptions Andre could have sold and still reached his goal?
e. Write an inequality expressing that Andre wants to make at least $68.
f. Write an inequality to describe the number of subscriptions Andre must sell to reach his goal.
2. Diego has budgeted $35 from his summer job earnings to buy shorts and socks for soccer. He needs 5 pairs of socks and a pair of shorts. The socks cost different amounts in different stores. The shorts he wants cost $19.95.
a. Let �� represent the price of one pair of socks. Write an expression for the total cost of the socks and shorts.
b. Write and solve an equation that says that Diego spent exactly $35 on the socks and shorts.
c. List some other possible prices for the socks that would still allow Diego to stay within his budget.
d. Write an inequality to represent the amount Diego can spend on a single pair of socks.
Collaborative Activity: Granola Bars and Savings
1. Kiran has $100 saved in a bank account. (The account doesn’t earn interest.) He asked Clare to help him figure out how much he could take out each month if he needs to have at least $25 in the account a year from now.
a. Clare wrote the inequality −12�� + 100 ≥ 25, where �� represents the amount Kiran takes out each month. What does −12�� represent?
b. Find some values of �� that would work for Kiran.
c. We could express all the values that would work using either �� ≤ or �� ≥ Which one should we use?
d. Write the answer to Kiran’s question using mathematical notation.
2. A teacher wants to buy 9 boxes of granola bars for a school trip. Each box usually costs $7, but many grocery stores are having a sale on granola bars this week. Different stores are selling boxes of granola bars at different discounts.
a. If �� represents the dollar amount of the discount, then the amount the teacher will pay can be expressed as 9(7 − ��). In this expression, what does the quantity 7 − �� represent?
b. The teacher has $36 to spend on the granola bars. The equation 9(7 − ��) = 36 represents a situation where she spends all $36. Solve this equation.
c. What does the solution mean in this situation?
d. The teacher does not have to spend all $36. Write an inequality relating 36 and 9(7 − ��) representing this situation.
e. The solution to this inequality must either look like �� ≥ 3 or �� ≤ 3. Which do you think it is? Explain your reasoning.
Lesson Summary
Suppose that Elena has $5 and sells pens for $1.50 each. Her goal is to save $20. The equation 1.5�� + 5 = 20 could be solved to find the number of pens, ��, that Elena needs to sell in order to save exactly $20.
1.5�� + 5 = 20
1.5�� = 15 �� = 10 pens
ManuscriptCopy
However, what if Elena wants to have more money saved? The inequality 1.5�� + 5 > 20 can be used to find the number of pens that Elena needs to sell to have at least or more than $20 saved. The solution to the previous equation can be used to determine the solutions to the inequality. If she sells 10 pens, she will have $20 saved. Since each pen gives her more money, she needs to sell more than 10 pens to make more than $20. Therefore, the inequality �� > 10 represents the number of pens she needs to sell in order to save more than $20.
Practice Problems
1. The solution to 5 − 3�� > 35 is either �� > −10 or −10 > ��. Which solution is correct? Explain how you know.
2. The school band director determined from past experience that if they charge �� dollars for a ticket to the concert, they can expect attendance of 1000 − 50��. The director used this model to figure out that the ticket price needs to be $8 or greater in order for at least 600 to attend. Do you agree with this claim? Why or why not?
Review Problems
3. Which inequality is true when the value of �� is −3?
4. Draw the solution set for each of the following inequalities.
ManuscriptCopy
A. −�� − 6 < −3.5
B. −�� − 6 > 3.5
C. −�� − 6 > −3.5
D. �� − 6 > −3.5
a.
5. Write three different equations that match the tape diagram.

6. A baker wants to reduce the amount of sugar in his cake recipes. He decides to reduce the amount used in 1 cake by 1 2 cup (c.). He then uses 4 1 2 c. of sugar to bake 6 cakes.

a. Describe how the tape diagram represents the story.
b. How much sugar was originally in each cake recipe?
7. One year ago, Clare was 4 feet (ft.) 6 inches (in.) tall. Now, Clare is 4 ft. 10 in. tall. By what percentage did Clare’s height increase in the last year?
ManuscriptCopy
Unit 7, Lesson 15: Modeling with Inequalities
Warm-Up: Possible Values
The stage manager of the school musical is trying to figure out how many sandwiches he can order with the $83 he collected from the cast and crew. Sandwiches cost $5.99 each, so he lets �� represent the number of sandwiches he will order and writes 5.99�� ≤ 83. He solves this to 2 decimal places, getting �� ≤ 13.86.
Which of these are valid statements about this situation? (Select all that apply.)
□ He can call the sandwich shop and order exactly 13.86 sandwiches.
□ He can round up and order 14 sandwiches.
□ He can order 12 sandwiches.
□ He can order 9.5 sandwiches.
□ He can order 2 sandwiches.
□ He can order −4 sandwiches.
ManuscriptCopy
Exploration Activity: Elevator
A mover is loading an elevator with many identical 48-pound (lb.) boxes. The mover weighs 185 lb. The elevator can carry at most 2000 lb.
1. Write an inequality that says that the mover will not overload the elevator on a particular ride. Check your inequality with your partner.
2. Solve your inequality and explain what the solution means.
3. Graph the solution to your inequality on a number line.
4. If the mover asked, “How many boxes can I load on this elevator at a time?” what would you tell them?
Collaborative Activity: Giving Advice
Your teacher will give you either a problem card or a data card. Do not show or read your card to your partner.
If your teacher gives you the problem card:
1. Silently read your card and think about what information you need to be able to answer the question.
2. Ask your partner for the specific information that you need.
3. Explain how you are using the information to solve the problem.
Continue to ask questions until you have enough information to solve the problem.
4. Share the problem card and solve the problem independently.
5. Read the data card and discuss your reasoning.
If your teacher gives you the data card:
1. Silently read your card.
2. Ask your partner “What specific information do you need?” and wait for them to ask for information.
If your partner asks for information that is not on the card, do not do the calculations for them. Tell them you don’t have that information.
3. Before sharing the information, ask “Why do you need that information?”
Listen to your partner’s reasoning and ask clarifying questions.
4. Read the problem card and solve the problem independently.
5. Share the data card and discuss your reasoning.
Pause here so your teacher can review your work. Ask your teacher for a new set of cards and repeat the activity, trading roles with your partner.
ManuscriptCopy
Lesson Summary
Many real-world problems can be represented and solved with inequalities. Whenever an inequality is written, it’s important to decide what quantity is represented by the variable. After this has been decided, the quantities in the situation can be connected to write an expression, and finally, the whole inequality.
When solving an inequality or equation to answer a question, it’s important to keep the meaning of each quantity in mind. This will help in deciding if the final answer makes sense in the context of the situation.
Consider the example shown.
Han has 50 centimeters (cm) of wire and wants to make a square picture frame with a loop to hang it. The loop uses 3 cm of wire.
• This situation can be represented by 3 + 4�� = 50, where �� is the length of each side if Han wants to use all of the wire.
• It can also be written as 3 + 4�� ≤ 50 if there are solutions that don’t use all of the wire. In this case, any positive number that is less than or equal to 11.75 cm is a solution to the inequality.
• Each solution represents a possible side length for the picture frame, since Han can bend the wire at any point.
In other situations, the variable may represent a quantity that increases by whole numbers, such as with numbers of magazines, loads of laundry, or students. In those cases, only whole-number solutions make sense. In other contexts, the variable could also represent a negative number, such as feet below sea level, a withdrawal from a bank account, or a floor below ground level.
Practice Problems
1. 28 students travel on a field trip. They bring a van that can seat 12 students. Elena and Kiran’s teacher asks parents to drive cars that seat 3 children each to transport the rest of the students.
Elena wonders if she should use the inequality 12 + 3�� > 28 or 12 + 3�� ≥ 28 to figure out how many cars are needed. Kiran doesn’t think it matters in this case. Do you agree with Kiran? Explain your reasoning.
a. In the cafeteria, there is one large 10-seat table and many smaller 4-seat tables. There are enough tables to fit 200 students. Write an inequality whose solution is the possible number of 4-seat tables in the cafeteria.
b. 5 barrels catch rainwater in the schoolyard. Four barrels are the same size, and the fifth barrel holds 10 liters (L) of water. Combined, the 5 barrels can hold at least 200 L of water. Write an inequality whose solution is the possible size of each of the 4 barrels.
c. How are these two problems similar? How are they different?
Review Problems
3. Select all the inequalities that have the same graph as �� < 4.
□ �� < 2
□ �� + 6 < 10
□ 5�� < 20
□ �� − 2 > 2
□ �� < 8
4. A 200 lb. person weighs 33 lb. on the moon.
a. How much did the person’s weight decrease?
b. By what percentage did the person’s weight decrease?
5. Solve each equation.
ManuscriptCopy
a. 5(�� − 4) = −60
b. −3�� + −8 = 25
c. 7�� − 8 = −22
d. 2 5 (�� + 40) = −4
e. 4(�� + 1) = −6
Unit 7, Lesson 16: Writing and Evaluating Algebraic Expressions
Warm-Up: True or False?
Select all of the equations that are true. Be prepared to explain your reasoning.
□ 4 − 2(3 + 7) = 4 − 2 ⋅ 3 − 2 ⋅ 7
□ 4 − 2(3 + 7) = 4 + −2 ⋅ 3 + −2 ⋅ 7
□ 4 − 2(3 + 7) = 4 − 2 ⋅ 3 + 2 ⋅ 7
□ 4 − 2(3 + 7) = 4 − (2 ⋅ 3 + 2 ⋅ 7)
□ 4 − 2(3 + 7) = 4 − 2 ∙ 3 + 7
Exploration Activity: Matching Algebraic Expressions
1. Match each written description with its corresponding algebraic expression.
Written Description Algebraic Expression
The product of negative five and a number decreased by eight
Five more than the quotient of a number and eight
The sum of eight and the product of a number and five 8 + 5��
The product of negative five and the difference of a number and eight
− 8 The quotient of a number increased by eight and five ��+8 5
2. Discuss with your partner what strategies you used to match each written description with its corresponding algebraic expression.
3. Cole and Kelly each wrote an algebraic expression for the written description of “the difference of four and the product of a number and one-half.” The algebraic expressions they wrote are shown.
Explain whose algebraic expression you agree with.
Collaborative Activity: Writing and Evaluating Algebraic Expressions
Complete the table by writing an algebraic expression to represent each written description. Then, evaluate the expression for the given value of ��.
The sum of the product of 3.2 and a number and 4.8
A number is increased by 4 5 , and then the quantity is divided by 4 7 .
Double the difference of a number and −11 �� = −5
−6 multiplied by the total of a number and −13
5 less than the quotient of a number and 8
Lesson Summary
Algebraic expressions, like numeric expressions, can include sums, differences, products, quotients, or a combination of operations. An algebraic expression is a mathematical statement containing numbers, operators, and at least 1 unknown value represented by a variable. Variables such as �� or �� are often used as placeholders for numbers in expressions.
• When an expression includes addition, the written description may include words such as sum, more than, total, or increased by.
• When an expression includes subtraction, the written description may include words such as difference, subtracted from, less than, or decreased by.
• When an expression includes multiplication, the written description may include words such as multiplied by, product, or times.
• When an expression includes division, the written description may include words such as divided by or quotient.
When writing an expression that includes division or subtraction, the order matters because these operations are not commutative. For example, a number subtracted from 15, 15 − ��, is different from 15 subtracted from a number, �� − 15.
Take care when translating verbal descriptions to algebraic expressions in order to identify quantities that should be grouped together. For example, the description “a third of the sum of a number and 2 5 ” would translate to �� + 2 5 3 , not �� + 2 5 3 .
Practice Problems
1. For each written description, write a corresponding algebraic expression.
a. 17 subtracted from the product of a number and 0.25
ManuscriptCopy
b. Double the sum of a number and 2 2 3
c. The quotient of twice a number and −9
2. A written description is given: “3 1 5 subtracted from the quotient of 10 and a number.”
a. Write the corresponding algebraic expression.
b. If �� = 25, what is the value of the expression?
3. Geri and Owen wrote algebraic expressions for the written description “12 times the sum of −6 and a number decreased by 4,” shown in the table.
Geri’s Algebraic Expression Owen’s Algebraic Expression
a. Explain whose algebraic expression you agree with.
b. If �� = 8.5, determine the value of the expression.
Review Problems
4. Andre says that 10�� + 6 and 5�� + 11 are equivalent because they both equal 16 when �� is 1. Do you agree with Andre? Explain your reasoning.
ManuscriptCopy
5. The school marching band has a budget of up to $750 to cover 15 new uniforms and competition fees that total $300. How much can they spend for one uniform?
a. Write an inequality to represent this situation.
b. Solve the inequality and describe what it means in the situation.
6. For each situation, write an expression for the new balance using as few terms as possible.
a. A checking account has a balance of −$126.89. A customer makes two deposits, one 3 1 2 times the other, and then withdraws $25.
b. A checking account has a balance of $350. A customer makes two withdrawals, one $50 more than the other. Then he makes a deposit of $75.
ManuscriptCopy
ManuscriptCopy
Unit 7, Lesson 17: Writing Expressions Based on Context
Warm-Up: True or False Equations
1. Determine whether each equation is true or false. Equation
ManuscriptCopy
(30 + 8) ∙ 9 = 270 + 72
4 + 5(9 − 15) = 9(9 − 15)
False 2 ∙ (7 + 8) = (2 ∙ 7) + 8
(5 + 4) − 10 = 5 + (4 − 10)
Guided Activity: Interpreting Parts of Equivalent Expressions in Context
1. An equilateral triangle is shown with dimensions given in meters (m).
Three students wrote expressions to represent the perimeter of the triangle.
Student Expression
Max (�� + 2) + (�� + 2) + (�� + 2)
Zora 3�� + 6
Jack 3(�� + 2)
a. Describe the relationship between the 3 expressions.
Each expression can be used to reveal information about the context.
b. Discuss with your partner what each expression reveals about the mathematical context.
c. Complete the table to describe what each quantity reveals about the context.
Quantity
(�� + 2)
3�� + 6
3
Meaning in Context
The perimeter of the triangle
The length of 1 side of the triangle
The number of equal-length sides of the triangle
The perimeter of the triangle
The length of 1 side of the triangle
The number of equal-length sides of the triangle
The perimeter of the triangle
The length of 1 side of the triangle
The number of equal-length sides of the triangle
2. Nayda and her friends are eating at a restaurant for dinner. Their bill is �� dollars before tax. They plan to leave a 20% tip. Sales tax of $3.43 will also be applied to their total. Three expressions that could represent this context are shown.
Expression A
Expression B
Expression C �� + 0.2�� + 3.43 1.2(�� + 3.43) 1.2�� + 3.43
a. Complete the table.
Quantity
3.43
0.2��
1.2��
(�� + 3.48)
Meaning in Context
The amount of the tip
The amount of sales tax
The sum of the pre-tax bill and tip
The sum of the pre-tax bill and sales tax
The amount of the tip
The amount of sales tax
The sum of the pre-tax bill and tip
The sum of the pre-tax bill and sales tax
The amount of the tip
The amount of sales tax
The sum of the pre-tax bill and tip
The sum of the pre-tax bill and sales tax
The amount of the tip
The amount of sales tax
The sum of the pre-tax bill and tip
The sum of the pre-tax bill and sales tax
b. Complete the statement.
ManuscriptCopy
All 3 of the given expressions
Only 1.2(�� + 3.43) and 1.2�� + 3.43
Only 1.2�� + 3.43 and �� + 0.2�� + 3.43 are equivalent expressions.
c. When eating at a restaurant, tips should be determined based on the pre-tax meal price. Which expression(s) should Nayda and her friends use to determine their total bill?
Collaborative Activity: Interpreting Parts of Equivalent Expressions in Context
Work with your partner to complete the following.
1. Luke is playing games with friends at a local arcade. He bought 20 tokens, and each of the games he wants to play requires 2 tokens. Let �� represent the number of games Luke has played since he got to the arcade.
a. The expression 20 − 2�� can be used to represent this context. Determine what each part of the expression reveals about the context.
Quantity
20 − 2��
20
2
Meaning in Context
The number of tokens Luke has to start
The number of tokens Luke uses for each game
The number of tokens Luke has used for the games played
The number of tokens Luke has left after playing any games
The number of tokens Luke has to start
The number of tokens Luke uses for each game
The number of tokens Luke has used for the games played
The number of tokens Luke has left after playing any games
The number of tokens Luke has to start
The number of tokens Luke uses for each game
The number of tokens Luke has used for the games played
The number of tokens Luke has left after playing any games
The number of tokens Luke has to start
The number of tokens Luke uses for each game
The number of tokens Luke has used for the games played
The number of tokens Luke has left after playing any games
b. Rewrite the expression 20 − 2�� by factoring.
ManuscriptCopy
c. Complete the statement. Then, complete the table to interpret each part of the expression.
The factored form of 20 − 2�� is ( − ��).
Meaning in Context
Lesson Summary
Many real-world problems can be represented by expressions involving known and unknown quantities. Writing expressions is very similar to writing equations to represent a situation. For example, Michelle has $40.00 to go to the movies with a friend. Each movie ticket costs $11.75, and each candy bar at the concession stand costs $4.50. Write an expression that represents the amount of money Michelle has left after buying �� candy bars. Each expression shown is equivalent and represents this situation.
40 − 2(11.75) − 4.50��
40 − 23.50 − 4.50��
16.50 − 4.50��
Each expression reveals different information about the context.
• The first expression shows the starting amount Michelle has, that she buys 2 tickets for $11.75 each, and that she plans to buy some amount of candy bars, ��, for $4.50 each.
ManuscriptCopy
• The second expression shows the total cost of the tickets, $23.50.
• The last expression shows the amount of money Michelle has remaining for candy bars at the concession stand, $16.50.
Practice Problems
1. Abby’s bunny weighs �� pounds (lb.). Miren’s bunny weighs 10% more than Abby’s bunny.
Select all the expressions that represent the weight, in lb., of Miren’s bunny. □ 0.1��
0.9��
1.1��
�� + 0.1
�� + 1.1
�� + 0.1��
2. Keri is buying decorative rocks for her garden. She is using a coupon that gives her the first 5 pounds for free. Each pound of decorative rocks costs $0.30. Keri paid $2.10 in sales tax.
a. Three expressions are shown.
Expression T Expression L Expression S
Which expressions are equivalent?
b. Circle the expression that most clearly reveals the 5 pounds of rocks that Keri got for free.
c. Put an asterisk (*) next to the expression that most clearly reveals the amount of money Keri saved with her coupon.
3. A car dealership marks up the manufacturer’s prices, ��, by 20%. A car didn’t sell in a timely manner, so the dealership reduced the price by $3,500.
a. The expression (�� + 0.2��) − 3500 can be used to represent this context. Complete the table by interpreting each part of the expression.
Quantity
Meaning in Context
0.2�� −3,500
b. Which expression is equivalent to (�� + 0.2��) − 3,500?
A. 0.8�� − 3,500
B. 1.2�� − 3,500
C. �� + 1.2 − 3,500
D. 0.8 + �� − 3,500
ManuscriptCopy
4. Solve the inequality that represents each story. Then interpret what the solution means in the story.
a. For every $9 that Elena earns, she gives �� dollars to charity. This happens 7 times this month. Elena wants to be sure she keeps at least $42 from this month’s earnings.
7(9 − ��) ≥ 42
b. Lin buys a candle that is 9 inches (in.) tall and burns down �� in. per minute (min.). She wants to let the candle burn for 7 min. until it is less than 6 in. tall.
9 − 7�� < 6 5.
a. a. If (11 + ��) is positive, but (4 + ��) is negative, what is one number that �� could be?
b. b. If (−3 + ��) is positive, but (−9 + ��) is negative, what is one number that �� could be?
c. If (−5 + ��) is positive, but (−6 + ��) is negative, what is one number that �� could be?
ManuscriptCopy
Unit 8: Angles, Polygons, and Prisms
ManuscriptCopy
Unit 8, Lesson 1: Distances on a Coordinate Plane
Warm-Up: Find Equivalent Expressions
Select all the expressions that are equivalent to 7(2 − 3��). Explain how you know each expression you select is equivalent.
□ 9 − 10�� □ 14 − 3�� □ 14 − 21��
(2 − 3��) ⋅ 7
ManuscriptCopy
Exploration Activity: Signs of Numbers in Coordinates
1. Write the coordinates of each point.

2. Answer these questions for each pair of points.
• How are the coordinates the same? How are they different?
• How far away are they from the ��-axis? To the left or to the right of it?
• How far away are they from the ��-axis? Above or below it?
a. �� and ��
b. �� and ��
c. �� and ��
Pause here for a class discussion.
3. Point �� has the same coordinates as point ��, except its ��-coordinate has the opposite sign.
a. Plot point �� on the coordinate plane and label it with its coordinates.
b. How far away are �� and �� from the ��-axis?
c. What is the distance between �� and ��?
4. Point �� has the same coordinates as point ��, except its ��-coordinate has the opposite sign.
a. Plot point �� on the coordinate plane and label it with its coordinates.
b. How far away are �� and �� from the ��-axis?
c. What is the distance between �� and ��?
ManuscriptCopy
5. Point �� has the same coordinates as point ��, except both its coordinates have the opposite signs. In which quadrant is point ��?
Collaborative
Activity: Finding Distances on a Coordinate Plane
1. Label each point with its coordinates.


2. Find the distance between each of the following pairs of points.
a. Point �� and ��
b. Point �� and ��
c. Point �� and ��
3. Which of the points are 5 units from (−1.5, −3)?
4. Which of the points are 2 units from (0.5, −4.5)?
5. Plot a point that is both 2.5 units from �� and 9 units from ��. Label that point �� and write down its coordinates.
Lesson Summary
The points �� = (5, 2), �� = (−5, 2), �� = (−5, −2), and �� = (5, −2) are shown on the coordinate plane. Notice that they all have almost the same coordinates, except the signs are different. They are all the same distance from each axis but are in different quadrants.

A quadrant is any of the four regions separated by the axes in a coordinate plane.
There is a relationship between the signs of the coordinates of any point and the quadrant it’s located in. This relationship is summarized in the image.
In general, the following is true.
• If 2 points have ��-coordinates that are opposites (like 5 and −5), they are the same distance away from the ��-axis, but on either side.
• If 2 points have ��-coordinates that are opposites (like 2 and −2), they are the same distance away from the ��-axis, but on either side.

When 2 points have the same value for the first or second coordinate, subtract the coordinates that are different to find the distance between them. Two examples are shown in the table.
Points
(1, 3) and (5, 3)
(2, 4) and (2, −3)
Distance between the Points
They have the same ��-coordinate. Subtract the ��-coordinates to find the horizontal distance between the points, 5 − 1 = 4 units.
They have the same ��-coordinate. Subtract the ��-coordinates to find the vertical distance between the points, 4 − (−3) = 7 units.
Practice Problems
1. Here are 4 points on a coordinate plane.
a. Label each point with its coordinates.
b. Plot a point that is 3 units from point ��. Label it ��.
c. Plot a point that is 2 units from point ��. Label it ��.


2. Each set of points are connected to form a line segment. What is the length of each?
�� = (3, 5) and �� = (3, 6)
�� = (−2, − 3) and �� = (−2, − 6)
�� = (−3, 1) and �� = (−3, − 1)
ManuscriptCopy
a.
b.
c.
3. On the coordinate plane, plot four points that are each 3 units away from point �� = (−2, − 1). Write the coordinates of each point.


Review Problem
4. Without evaluating each expression, determine which value is the greatest. Explain how you know.
ManuscriptCopy
Unit 8, Lesson 2: Area and Perimeter of Polygons on a Coordinate Plane
Warm-Up: Algebra Talk: Seeing Structure
Solve each equation mentally.
1. �� − 1 = 5
2. 2(�� − 1) = 10
3. 3(�� − 1) = 15
4. 500 = 100(�� − 1)
ManuscriptCopy
Guided Activity: Determining the Dimensions and Perimeters of Polygons
1. Sonja’s family installed a new pool in their backyard. Sonja’s dad wants to put up a fence, shown as a blue rectangle, around the pool for safety. He needs to know how much fencing he will need. The scale of the grid is represented in meters (m).
The rectangle that represents the fence has vertices at �� (−5, −1), �� (−5, 3), �� (5, 3), and �� (5, −1).
a. What is the length of the line segment that connects points �� and ��?
b. What is the length of the line segment that connects points �� and ��?
c. Explain how to calculate the perimeter of the fence.
d. What is the perimeter of the fence in meters?
Sonja’s father plans to put another fence around the entire yard. The black rectangle represents the second fence. The black rectangle has vertices at �� (−6.8, −5.7), �� (−6.8, 5.2), �� (9.2, 5.2), and �� (9.2, −5.7).
e. What is the length of the line segment that connects point �� to point ��?
f. What is the length of line segment that connects point �� to point ��?
g. Determine the perimeter of the fence around the yard.
2. A polygon has vertices at points �� (−2, 6), �� (7, 6), �� (7, 4), �� (0, 4), �� (0, 1), and ��(−2, 1), as shown.
a. Determine the length of each line segment.
b. Find the perimeter of the polygon.
ManuscriptCopy

Collaborative Activity: Finding the Area of Polygons on the Coordinate Plane
1. Henry wants to install new carpet in his living room. A drawing of his living room is shown. The scale of the grid is in feet (ft.).
a. Determine the length and width of the carpet.
b. What is the area of the living room?
2. A triangle has vertices at points ��(−8, 4), �� (−2, −2), and �� (−8, −6), as shown. Line segment ���� represents the height of the triangle, where point �� is located at (−8, −2).
a. Complete the statement.
The height of the triangle is units, and the base of the triangle is units.
b. What is the area of the triangle?
3. A polygon is shown on the coordinate plane.
a. Discuss with your partner a strategy you can use to find the area of the polygon. Summarize your discussion.
b. Find the area of the polygon.
ManuscriptCopy
Lesson Summary
The coordinate plane can be used to find the distance between vertices to determine the dimensions of a polygon. In 8th grade, you will learn to determine diagonal distances on the coordinate plane. Using the strategies covered in this course so far, however, only horizontal and vertical distances can be determined when solving problems involving the perimeter or area of a polygon on the coordinate plane.
The perimeter (of a polygon) is the sum of the side lengths of a polygon.
Area is the measure, in square units, of the inside region of a closed two-dimensional figure.
Some polygons have formulas that can be used to find the area.
• The formula �� = �� ∙ �� can be used to find the area of a rectangle, where �� is the length of the rectangle and �� is the width of the rectangle.
• The formula �� = 1 2 ∙ �� ∙ ℎ can be used to find the area of a triangle, where �� is the base length of the triangle and ℎ is the height of the triangle.
Other polygons can be broken down, or decomposed, into familiar figures such as rectangles and triangles. For these situations, the area of the polygon is the sum of all the areas of the decomposed figures that make up the polygon.
ManuscriptCopy
Practice Problems
1. A polygon is shown on the coordinate plane.
a. What is the perimeter of the polygon, in units?
b. What is the area of the polygon, in square units (sq. units)?

2. Titus wants to put a border around the outside of his garden.
If the scale of the grid is in feet (ft.), how many ft. of border will he need to buy to completely fence in the garden?
ManuscriptCopy

3. A rectangle is shown.
What is the area of the rectangle?
Review Problems
4. Find the products.
2 3 ⋅ �−4 5 �
�−5 7 � ⋅ � 7 5 �
5. Diego is solving the inequality
−
≥ −50. He solves the equation
and gets �� = 50. What is the solution to the inequality?
Unit 8, Lesson 3: Angle Relationships
Warm-Up: Visualizing Angles
1. Which angle is bigger, �� or ��?

2. Identify an obtuse angle in the diagram.
Guided Activity: Adjacent Angles

Angles are formed when lines, line segments, or rays intersect. Two angles that share a side and vertex are called adjacent angles.
The figure shows an example of adjacent angles ������ and ������.
Point �� is the common vertex.
Ray ���� is the common side that both angles share.
1. The measure of ∠������ is 68°, and the measure of ∠������ is 41°.
ManuscriptCopy
a. What is the measure of ∠������?
b. Discuss with your partner how you know the measure of ∠������ from the definition of adjacent angles and the given information.
2. Line ����, ����, and ���� intersect to form angles, as shown.
Complete the table to identify whether each pair of angles given is adjacent.
Angle Pair
∠������ and ∠������
ManuscriptCopy
∠������ and ∠������
∠������ and ∠������
∠������ and ∠������
∠������ and ∠������
Angle Relationship
Adjacent angles Not adjacent angles
Adjacent angles Not adjacent angles
Adjacent angles Not adjacent angles
Adjacent angles Not adjacent angles
Adjacent angles Not adjacent angles
Exploration Activity: Exploring Angle Relationships
1. Several angle names and measures are given in the bank shown.
Work with your partner to complete the table by matching the angle name and measure from the bank to each type of angle shown. Some words and angle measures from the bank will not be used.
Your teacher will give you 3 rectangular pieces of paper to use for the remainder of the Collaborative Activity.
2. Use the first rectangular piece of paper to complete the following steps.
a. Draw a small half-circle in the middle of 1 side, as shown.
b. Use a straightedge to draw a line starting from the center of the half-circle, all the way across the paper. The line can go in any direction or at any angle across the paper. Two possible examples are shown.
c. Cut your paper along the line you drew.
d. On each of the 2 pieces created, use a protractor to measure the angle that is marked by part of the circle. Then, label the angle measure on the paper.
e. Write 2 observations about the 2 angles.
f. Clare measured the angle on 1 of her pieces to be 70°. Discuss with your partner how to predict the angle measure of her other piece. Then, write your prediction.
3. Use a second rectangular piece of paper to complete the following steps.
a. Draw a small quarter-circle in 1 of the corners, as shown.
ManuscriptCopy
b. Use a straightedge to draw a line starting from the vertex with the quarter-circle, all the way across the paper. The line can go in any direction or at any angle across the paper.
c. Cut your paper along the line you drew.
d. On each of the 2 pieces created, use a protractor to measure the angle that is marked by part of the circle. Then, label the angle measure on the paper.
e. Add your 2 angle measures together. What do you notice?
f. Priyanka measured the angle of 1 of her pieces to be 53°. Discuss with your partner how to predict the angle measure of her other piece. Then, write your prediction.
4. Use the third rectangular piece of paper to complete the following steps.
a. Use a straightedge to draw 2 intersecting lines across the paper. Then, label the angles created with 1, 2, 3, and 4. Three possible examples are shown.
b. Cut across the straight lines you drew, creating 4 separate pieces.
c. Rotate and flip the angles to determine how they compare with each other. This could include laying angles on top of one another to compare their size. Summarize your observations of how the angles compare to each other.
d. Compare your findings with your partner. Make a conjecture about the relationship between angle measures when 2 lines intersect.
Guided Activity: Angle Relationships
Three different angle relationships were explored in the Collaborative Activity. Their definitions are shown in the Lesson Summary.
1. Complete the statements using the definitions of each angle relationship.
a. The angles created in question 2 of the Collaborative Activity are angles.
b. The angles created in question 3 of the Collaborative Activity are angles.
c. The angles created in question 4 of the Collaborative Activity are angles.
2. Supplementary angles can be adjacent or nonadjacent. Three examples of supplementary angles are shown, with the angles in each pair marked.
Complete the statement.
When supplementary angles are adjacent, they form a right an acute a straight an obtuse angle together.
3. Three examples of complementary angles are shown. Complementary angles can be adjacent or nonadjacent.
a. Circle the example that shows an adjacent pair of complementary angles.
b. Complete the statement.
When complementary angles are adjacent, they form a right an acute a straight an obtuse angle together.
4. Each pair of vertical angles formed by the intersecting lines below are shown in a different color.
a. Discuss with your partner the angle relationship between adjacent angles when 2 lines intersect.
b. Complete the statements.
Vertical angles sometimes always have equal measures. Pairs of adjacent angles created when 2 lines intersect are complementary. supplementary.
Lesson Summary
This lesson explored relationships between adjacent angles, complementary angles, supplementary angles, and vertical angles.
Two angles that share a side and vertex are called adjacent angles.
Two angles whose measures add up to 90° are complementary angles.
Two angles with measures that add up to exactly 180° are supplementary angles.
Vertical angles are opposite angles that share the same vertex. They are formed by a pair of intersecting lines. Their angle measures are equal.
Vertical angles always have equal measures because each vertical angle is supplementary with the same angle. For example, consider the figures showing vertical angles. Both angles that measure 30° are supplementary to 150°.

This is true for any angles formed by intersecting lines.

�� + �� = 180, so �� = 180 − ��.
�� + �� = 180, so �� = 180 − ��.
In the previous diagrams, the angle opposite �� has the same measure as ��.
Practice Problems
1. Angles �� and �� are supplementary. Find the measure of angle ��. 2.
a. List two pairs of angles in square �������� that are complementary.

b. Name three angles that sum to 180∘.
ManuscriptCopy

3. If two angles are both vertical and supplementary, can we determine the angles? Is it possible to be both vertical and complementary? If so, can you determine the angles? Explain how you know.
Review Problems
4. Use the distributive property to write an expression that is equivalent to each given expression.
a. −3(2�� − 4)
b. 0.1(−90 + 50��)
c. −7(−�� − 9)
d. 4 5 (10�� + −�� + −15)
ManuscriptCopy
5. A small dog gets fed 3 4 cup (c.) of dog food twice a day. Using �� for the number of days and �� for the amount of food in cups, write an equation relating the variables. Use the equation to find how many days a large bag of dog food will last if it contains 210 c. of food.
Unit 8, Lesson 4: Solving for Unknown Angles
Warm-Up: True or False: Length Relationships
Here are some line segments.
1. Decide if each of these equations is true or false. Be prepared to explain your reasoning.
ManuscriptCopy
Guided Activity: Applying Relationships and Equations to Find Missing Angles
Algebraic equations can be written to express the relationships between complementary, supplementary, and vertical angles. The equations can then be solved to find the measures of unknown angles.
1. Angles ������ and ������ are supplementary, and the measure of ∠������ is 74°.
F E
A
D BC
a. Discuss with your partner what equation could be used to find the measure of ∠������. Summarize your discussion.
b. Use your equation to find the measure of ∠������.
ManuscriptCopy
2. In the figure, ∠������ and ∠������ are complementary.
Find the measure of ∠������.
3. Two line segments intersect, as shown.
a. Discuss with your partner the relationships between the angles marked in the diagram and how those relationships can be used to determine the missing angle measures.
b. Complete the statements.
ManuscriptCopy
The value of �� is 42° 48° 138° because vertical supplementary complementary angles have a sum of 90°. a sum of 180°. the same measure.
The value of �� is 42° 48° 138° because vertical supplementary complementary angles have a sum of 90°. a sum of 180°. the same measure.
4. Two angles formed by intersecting lines are labeled. 3x° 57°
a. The angles marked are vertical angles, supplementary angles, complementary angles, so they have a sum of 90°. a sum of 180°. the same measure.
b. The equation 3�� = 57 3�� + 57 = 90 3�� + 57 = 180 can be used to find the value of ��.
c. Solve for ��.
d. Find the value of 3�� using the solution to part C.
ManuscriptCopy
Collaborative Activity: Applying Relationships to Find Missing Angles
1. With your partner, determine who will be partner A and who will be partner B.
a. Complete the problems in the appropriate column independently.
Partner A
Find the value of ��.
Angles ������ and ������ are supplementary. Find the measure of ∠������
Partner B
Find the value of ��.
Partner A Partner B
Find the value of ��.
Find the measure of ∠������.
b. The problems in each row have the same result. Check your work with your partner. If there are discrepancies in your answers, work together to find and correct any errors.
Lesson Summary
To find an unknown angle measure, it’s sometimes helpful to write and solve an equation using the angle relationships observed. For example, an equation can be used to find the value of �� in the diagram shown.
Using knowledge of vertical angles, the equation 3�� + 90 = 144 can be written to represent this situation. Solve the equation to find the value of ��.
3�� + 90 = 144 3�� + 90 − 90 = 144 − 90
ManuscriptCopy
= 54

Practice Problems
1. Three figures are shown with angles measuring ��° and ℎ° marked in each figure.
Complete the following table by matching each figure to the equation that represents the relationships between the angles in the figure. For each match, explain how you know it is a match.
Equation Figure Explanation
Figure A
Figure B
Figure C
2. Angle ������ is a right angle.
a. Write an equation that can be used to find the value of ��.
b. Solve the equation.
c. Use the solution to find the measure of each angle.
d. Explain whether the angle measures determined in part C make sense based on the relationship between ∠������ and ∠������.
3. Line ℓ is perpendicular to line ��. Find the value of �� and ��.
ManuscriptCopy

Unit 8, Lesson 5: Building Triangles
Warm-Up: True or False: Signed Numbers
Decide whether each equation is true or false. Be prepared to explain your reasoning.
ManuscriptCopy
1. 4 ⋅ (−6) = (−6) + (−6) + (−6) + (−6)
2. −8 ⋅ 4 = (−8 ⋅ 3) + 4
3. 6 ⋅ (−7) = 7 ⋅ (−7) + 7
4. −10 − 6 = −10 − (−6)
Exploration Activity: How Long Is the Third Side?
Your teacher will give you some strips of different lengths and fasteners you can use to attach the corners.
1. Build as many different triangles as you can that have one side length of 5 inches (in.) and one of 4 in. Record the side lengths of each triangle you build.
2. Are there any other lengths that could be used for the third side of the triangle but weren’t in your set?
3. Are there any lengths that were in your set but could not be used as the third side of the triangle?
Collaborative Activity: Creating Triangles
1. Line segments ����, ����, ����, ����, ����, and ���� are given.
a. Trace each line segment on to a piece of tracing paper. Cut around each line segment so that you have 6 separate pieces of tracing paper.
b. Complete the table by manipulating the given set of line segments to determine if they can be used to create a triangle.
Set of Line Segments
and
Can the set of line segments create a triangle?
c. Compare your results from the table with your partner. If there are any differences, work together to resolve them, and make revisions, if necessary.
d. Discuss with your partner how you determined when the set of line segments could not be used to create a triangle. Summarize your discussion.
2. Miguel and Divya are attempting to construct a triangle with line segments shown, where ���� = 4 units, ���� = 9 units, and ���� = 3 units.
Miguel and Divya’s attempt to create a triangle is shown.
Their explanations of why a triangle could not be created from the line segments are shown in the table.
Miguel’s Response
The line segments were not placed in the correct spot to construct a triangle.
Divya’s Response
Two of the line segments are too short and will not touch.
a. Whose response do you agree with? Explain your choice.
b. Based on what you’ve explored so far in problems 1 and 2, discuss with your partner any observations about the circumstances under which 3 line segments cannot be used to create a triangle.
c. Write a conjecture about what must be true of the side lengths of any triangle.
Guided Activity: Forming Triangles from 3 Side Lengths
1. Complete the statements to summarize your conclusions from the previous activities.
a. If the sum of any 2 line segments is less than the third line segment, then a triangle can cannot be formed from the 3 line segments. cannot
b. If the sum of any 2 line segments is equal to the third line segment, then a triangle can cannot be formed from the 3 line segments. cannot
c. If the sum of any 2 line segments is greater than the third line segment, then a triangle can cannot be formed from the 3 line segments. cannot
Lesson Summary
Sometimes it’s not possible to build a triangle from a given a set of lengths. For example, if there’s 1 really long segment and 2 short segments, the shorter segments may not be able to connect. An example is shown to demonstrate what happens when side lengths of 21, 4, and 2 units are used to try to make a triangle.

The short sides don’t seem like they can meet up because they are too far away from each other.
In general, the longest side length must be less than the sum of the other 2 side lengths. If not, a triangle cannot be created.
Practice Problems
1. Select all the sets of three side lengths that will make a triangle.
□ 3, 4, 8
□ 7, 6, 12
□ 5, 11, 13
□ 4, 6, 12
□ 4, 6, 10
2. Come up with an example of three side lengths that can not possibly make a triangle, and explain how you know.
Review Problems
3. Each row contains the degree measures of two complementary angles. Complete the table.
4. Find ��, ��, and ��.

Unit 8, Lesson 6: Triangle Inequality Theorem
Warm-Up: Is This Enough?
Tyler thinks that this figure has enough information to figure out the values of �� and ��.

Do you agree? Explain your reasoning.
Collaborative Activity: Exploring the Triangle Inequality Theorem
1. Put both of your elbows on your desk. Face your hands toward each other, and then move them down until they are flat on the desk with only your fingertips touching. Slowly raise your hands up without moving your elbows.
a. What do you notice about the length of your arms and the distance between your elbows?
b. What do you wonder about creating a triangle with these lengths?
2. Roll a six-sided number cube to pick 3 random numbers. Record your numbers in the blanks. Then, indicate whether the inequality is true or false.
a. Roll 1 + Roll 2 > Roll 3 True False
b. Roll 2 + Roll 3 > Roll 1 True False
c. Roll 1 + Roll 3 > Roll 2 True False
d. Did you have any false answers?
3. Find a partner who has a different answer for part D. Discuss what you notice about how different values affected the truth of the inequalities. Summarize your discussion.
4. Roll a six-sided number cube to pick 2 random numbers. Record your numbers in the blanks that are labeled for each roll. Leave the other lines blank.
a. Roll 1 + Roll 2 >
b. Roll 2 + > Roll 1
c. + Roll 1 > Roll 2
d. Determine a single value that will satisfy all 3 inequalities based on the values already recorded from rolling the number cube. Use that single value to complete each inequality in parts A–C.
5. Complete the statements.
a. The Triangle Inequality Theorem says any side length angle measure of a triangle is more less than the difference sum of the other 2 side lengths sum
b. In any triangle, 3 true inequalities must be able to be written showing that the sum of any 2 side lengths is than the third length.
ManuscriptCopy
Guided Activity: Forming Triangles from 3 Side Lengths
1. Complete the table to determine if a triangle can be formed from each set of segment lengths.
Segment Lengths Work
12, 25, and 16
7, 15, and 8
a triangle be formed?
17, 26, and 8
21, 18, and 5
2. Two side lengths of a triangle are given. Determine a third side length that could be used to form a triangle.
a. 4, 7, and
b. 13, 24, and
c. 2, 16, and
d. 18, 30, and
e. Explain why more than one correct answer is possible for each part A–D. ManuscriptCopy
Lesson Summary
The Triangle Inequality Theorem states that the sum of the lengths of any 2 sides of a triangle must be greater than the third side in order for a triangle to be formed. Therefore, if any side length is greater than or equal to the sum of the other 2 sides, a triangle will not be formed.
For example, a triangle with side lengths of 6 centimeters (cm), 3 cm, and 5 cm is shown along with the work to verify whether a triangle can be formed using the given side lengths.
Since the sum of any 2 sides is greater than the third side, a triangle can be formed.
Another example is shown with side lengths of 3 cm, 6 cm, and 2 cm along with the work to verify whether a triangle can be formed using the given side lengths.
Since the sum of the side lengths of 2 cm and 3 cm is not greater than the side length of 6 cm, a triangle cannot be formed.
Practice Problems
1. Determine if the following sets of side lengths can be used to create a triangle.
a. 3, 9, and 8
b. 16, 6, and 2
c. 7, 5, and 10
2. Determine a value for the third side that will form a triangle with the 2 given side lengths. 8, 5,
Review Problems
3. Select all values of �� that make the inequality −�� + 6 ≥ 10 true.
4. Jada and Priya are trying to solve the equation 2 3 + �� = 4.
• Jada says, “I think we should multiply each side by 3 2 because that is the reciprocal of 2 3 .
• Priya says, “I think we should add 2 3 to each side because that is the opposite of 2 3 .”
a. Which person’s strategy should they use? Why?
b. Write an equation that can be solved using the other person’s strategy.
ManuscriptCopy
5. Segments ����, ����, and ���� intersect at point ��. Angle ������ is a right angle. Identify any pairs of angles that are complementary.

ManuscriptCopy
Unit 8, Lesson 7: Angle Relationships in Triangles
Warm-Up: Can You Draw It?
1. Complete the table by drawing a triangle in each cell that has the properties listed for its column and row. If you think you cannot draw a triangle with those properties, write “impossible” in the cell.
2. Share your drawings with a partner. Discuss your thinking. If you disagree, work to reach an agreement.
Scalene (side lengths all different)
Isosceles (at least two side lengths are equal)
Equilateral (three side lengths equal)
Exploration Activity: Exploring Interior Angles of a Triangle
1. Complete the following using a piece of rectangular paper.
a. Use a straightedge to draw diagonals from the bottom 2 corners to intersect on the top side of the paper. Two possible examples are shown.
b. Label the angle formed at the intersection of the lines you drew ��. Then, label the other angles in the triangle �� and ��, as shown.
These angles are called the interior angles of the triangle because they are inside the triangle.
c. Cut out the triangle.
d. Cut or tear the triangle so that each angle is separated. An example of where to cut is shown.
e. Rotate and slide the labeled angles to form a set of 3 adjacent angles. The image shows the beginning of this process, with arrows indicating where the angles should continue to slide.
f. What do you notice?
ManuscriptCopy
g. Compare your findings with your partner.
2. Complete the conjecture about the relationship of the 3 interior angles of a triangle.
Adjacent angles that form a straight line have a sum of 90°. 180°. 360°. Based on the findings from the Exploration Activity, the 3 interior angles of a triangle sum to 90°. 180°. 360°.
Guided Activity: Interior Angles of Triangles
The relationship of the interior angles of a triangle can be used to solve for unknown angle measures in a triangle.
1. Triangle ������ is shown, where ��∠������ = 57° and ��∠������ = 29°.
a. Write an equation that can be used to find the measure of the unknown angle in the triangle.
b. Solve the equation to find the measure of ∠������.
ManuscriptCopy
2. Triangle ������ is shown. ��∠������ = (2�� + 9)°, ��∠������ = (3�� − 4)°, and ��∠������ =36°.
a. Write an equation that can be used to find the value of ��.
b. Solve the equation.
c. Find the measure of ∠������.
Lesson Summary
A 180° angle is called a straight angle because when it is made with 2 rays, they point in opposite directions and form a straight line.
A straight angle is an angle measuring exactly 180°.
During the lesson, you experimented with angles in a triangle to find that the sum of the measures of the 3 angles in each triangle is 180°, the same as a straight angle. When the 3 angles of a triangle are cut off and their vertices are lined up, the 3 angles form a straight angle, as shown.

The Triangle Sum Theorem states that the sum of the interior angles of a triangle will always measure 180°.
Practice Problems
1. In triangle ������, the measure of angle �� is 40°.
a. Give possible measures for angles �� and �� if triangle ������ is isosceles.
b. Give possible measures for angles �� and �� if triangle ������ is right.
2. For each set of angles, decide if there is a triangle whose angles have these measures in degrees.
a. 60, 60, 60
b. 90, 90, 45
c. 30, 40, 50
d. 90, 45, 45
e. 120, 30, 30
If you get stuck, consider making a line segment. Then, use a protractor to measure angles with the first two angle measures.
3. Angle �� in triangle ������ is obtuse. Can angle �� or angle �� be obtuse? Explain your reasoning.
ManuscriptCopy
Practice Problems
4. Apples cost $1.99 per pound (lb.).
a. How much do 3 1 4 lb. of apples cost?
b. How much do �� lb. of apples cost?
c. Clare spent $5.17 on apples. How many lb. of apples did Clare buy?
5. Diego has a glue stick with a diameter of 0.7 inches (in.). He sets it down 3.5 in. away from the edge of the table, but it rolls onto the floor. How many rotations did the glue stick make before it fell off of the table?
6. On the grid, draw a scaled copy of quadrilateral ������D using a scale factor of 1 2
ManuscriptCopy


Unit 8, Lesson 8: Volume of Right Prisms
Warm-Up: Three Prisms with Same Volume
Rectangles A, B, and C represent bases of three prisms.

1. If each prism has the same height, which one will have the greatest volume, and which will have the least? Explain your reasoning.
2. If each prism has the same volume, which one will have the tallest height, and which will have the shortest? Explain your reasoning.
ManuscriptCopy
Guided Activity: Finding the Volume of Prisms
Natalya is using the formula �� = �� × �� × ℎ to find the volume of the rectangular prism shown. The dimensions are given in inches (in.).
1. Complete Natalya’s work to find the volume of the prism in cubic inches (cu. in.). �� = �� × �� × ℎ �� = × × �� = cu. in.
2. Discuss with your partner how the formula �� = �� ∙ ℎ is related to the formula �� = �� ∙ �� ∙ ℎ.
3. Complete the statements based on your discussion.
The product of the length, ��, and the width, ��, is equal to of the prism. Therefore, �� = × .
Both formulas can be used to determine the volume of a rectangular prism.
4. A triangular prism and a rectangular prism are shown with dimensions given in feet (ft.).
a. What do you notice or wonder about the relationship between the triangular prism and the rectangular prism?
b. Discuss with your partner the relationship between the volumes of the 2 prisms.
c. Complete the statement.
When the dimensions of a triangular prism and a rectangular prism are the
same, the area of the base of the triangular prism will be the same as. half double
the area of the base of the rectangular prism. The height of the prisms is the same. Therefore, the volume of the triangular prism is the same as. half double the volume of the rectangular prism.
5. Misha and Jamal are finding the volume of the triangular prism shown. Dimensions are given in centimeters (cm), and both students found the volume in cubic centimeters (cu. cm). Their work is shown.
a. Discuss with your partner why Misha and Jamal found different volumes for the same shape.
b. Which student correctly found the volume of the prism?
c. Write a note to the person whose work is incorrect. Explain the error they made so they can learn from the mistake.
Misha’s Work
Jamal’s Work
Collaborative Activity: Finding the Volume of Prisms
Work with your partner to complete the following.
1. A cube is shown with side lengths of 6.5 in.
What is the volume of the cube?
2. The volume of the trapezoidal prism shown is 36 cubic feet (cu. ft.). The height of the prism is 8 ft.
What is the area of the base of the trapezoidal prism?
in.
3. A rectangular prism has a height of 7 units and a base with a length of 12 units. If the volume of the rectangular prism is 504 cubic units (cu. units), what is the width of the prism?
8 ft.
Lesson Summary
Any cross section of a prism that is parallel to the base will be identical to the base. This means prisms can be sliced up to help find their volume. For example, if a rectangular prism is 3 units tall and has a base that is 4 units by 5 units, it can be thought of as 3 layers that are each 4 ⋅ 5 cu. units.

That means the volume of the original rectangular prism is 3(4 ⋅ 5) cu. units.
This works with any prism. If a prism with a height of 3 cm has a base area of 20 cu. cm, then the volume is 3 ⋅ 20 cu. cm, regardless of the shape of the base. In general, the volume, ��, of any right prism is �� = �� × ℎ, where �� represents the base area, and ℎ represents the height.
Practice Problems
ManuscriptCopy
1. The volume of both of these trapezoidal prisms is 24 cu. units. Their heights are 6 and 8 units, as labeled. What is the area of a trapezoidal base of each prism?

2. For each given figure, determine the equation that can be used to find the volume. Then, calculate the volume of the prism.
Area of base = 6 square units
Review Problems
3. Two angles are complementary. One has a measure of 19 degrees. What is the measure of the other?
4. Two angles are supplementary. One has a measure that is twice as large as the other. Find the two angle measures.
5. Match each expression in the first list with an equivalent expression from the second list.
A. 7(�� + 2) − �� + 3
B. 6�� + 3 + 4�� + 5
C. 2 5 �� − 7 + 3 5 �� − 3
D. 8�� − 5 + 4 − 9
ManuscriptCopy
2. 6�� + 17
E. 24�� + 36 1. 1 5 �� − 10
3. 2(5�� + 4) 4. 12(2�� + 3) 5. 8�� + (−5) + 4 + (−9)
ManuscriptCopy
Unit 8, Lesson 9: Volume of Right Pyramids
Warm-Up: Which One Doesn’t Belong?
Four figures are shown.
1. Circle the figure that does not belong.
2. Explain why that figure does not belong.
ManuscriptCopy
Guided Activity: Finding the Volume of Pyramids
1. The rectangular pyramid and rectangular prism shown have congruent bases, and each figure has the same height.
a. Suppose the rectangular pyramid is filled with water. Discuss with your partner how many rectangular pyramids’ worth of water you think you would need in order to fill the rectangular prism. Write your estimate.
b. Given the volume of a prism is �� = �� ∙ ℎ, discuss with your partner how to use the formula to find the volume of the pyramid based on your estimate in part A.
c. Complete the statement.
The volume formula for a right pyramid is �� = .
It takes 3 pyramids of the same size to have the same volume, or capacity, as a prism with the same base and height.
d. Complete the statements.
If the volume of the prism is 84 cubic units (cu. units), then the volume of a pyramid with the same height and a congruent base is cu. units.
If the volume of the pyramid is 23.4 cu. units, then the volume of a prism with the same height and a congruent base is cu. units.
The volume, ��, of any right pyramid is �� = 1 3 × �� × ℎ, where �� represents the base area and ℎ represents the height.
2. A triangular pyramid is shown. The base is a triangle with a length of 4 units and a height of 3.5 units. The height of the pyramid is 5 units.
Determine the volume of the pyramid. Round to the nearest thousandth if necessary.
4 3.5 5
Collaborative Activity: Finding the Volume of Pyramids
1. A rectangular pyramid is shown. The base is a rectangle with dimensions of 10 centimeters (cm) by 14 cm. The height of the pyramid is 17 cm.
Determine the volume of the pyramid. Round to the nearest thousandth if necessary.
2. The volume of a triangular pyramid is 70 cubic inches (cu. in.). The area of the base is 35 square inches (sq. in.).
Determine the height of the pyramid.
3. The Louvre is a museum located in Paris, France. The main entrance to the museum lies under a glass pyramid that stands 21.6 meters (m) tall and has a square base with side lengths of 34 m.
What is the volume of the pyramid?
4. Chantelle is finding the base length of a triangular pyramid whose volume is 112 cubic centimeters (cu. cm). The height of the pyramid is 12 centimeters, and the base height is 8 cm. Her work is shown.
a. Write a note to Chantelle explaining the error she made.
b. Determine the base length of the triangular pyramid.
Lesson Summary
A pyramid is a solid figure that has 1 special face called the base. All the other faces are triangles that meet at a single vertex called the apex. A pyramid is named for the shape of its base.
An apex is the single point on a cone or pyramid that is farthest from the base. For a pyramid, the apex is where all the triangular faces meet.
For example, a triangular pyramid has a base in the shape of a triangle, whereas a rectangular pyramid has a base in the shape of a rectangle.
It takes 3 pyramids of the same size to have the same volume as a prism with a congruent base and height.
Congruent is having exactly the same shape and size.
The volume, ��, of any right prism is �� = �� × ℎ, where �� represents the base area and ℎ is the height. Therefore, the volume, ��, of any right pyramid is �� = 1 3 × �� × ℎ.
The formula �� = 1 2 × �� × ℎ is used to find the area of a triangle, where �� is the base length of the triangle and ℎ is the height of the triangle. The formula �� = �� × �� is used to find the area of a rectangle, where �� is the length of the rectangle and �� is the width of the rectangle.
Practice Problems
1. Determine the volume of a pyramid whose base is a triangle with a base length of 22 inches (in.) and a base height of 18 in. The height of the pyramid is 15 in.
2. A rectangular pyramid is shown with a height of 6 feet (ft.). The dimensions of the base are 2.5 ft. by 5 ft.
What is the volume of the pyramid?
3. Two months ago, the price, in dollars, of a cell phone was ��.
a. Last month, the price of the phone increased by 10%. Write an expression for the price of the phone last month.
b. This month, the price of the phone decreased by 10%. Write an expression for the price of the phone this month.
c. Is the price of the phone this month the same as it was two months ago? Explain your reasoning.
4. Each row contains the degree measures of two supplementary angles. Complete the table.
ManuscriptCopy
5. Select all equations that represent a relationship between angles in the figure.
□ 90 − 30 = ��
□ 30 + �� = �� + ��
□ �� + �� + 30 + �� = 180
□ �� = 30
□ �� = �� = 30
□ 90 + �� + �� = 180
ManuscriptCopy

ManuscriptCopy
Unit 8, Lesson 10: Surface Area of Right Prisms
Warm-Up: Multifaceted
Your teacher will show you a prism.
1. What are some things you could measure about the object?
2. What units would you use for these measurements?
ManuscriptCopy
Exploration Activity: Finding the Surface Area of Prisms
1. The net of a rectangular prism is shown, where each face is labeled with a letter.
C E F A
a. Complete the table by using a ruler to find the area of each face, in square centimeters (sq. cm). Round your initial measurements to the nearest tenth.
The surface area of a figure is the total area of the two-dimensional surfaces that make up the three- dimensional solid.
b. What is the surface area of this rectangular prism?
2. A triangular prism is shown with dimensions given in inches (in.).
a. Sketch a net or individual faces of the prism.
b. Label the dimensions of each face in your sketch.
c. Find the area of each face of the prism. Include units.
ManuscriptCopy
d. Add the areas of the faces to find the surface area of the triangular prism.
3. A prism with a base in the shape of an isosceles trapezoid is shown.
a. Find the area of each face of the prism.
b. Find the surface area of the prism.
Collaborative Activity: Finding the Surface Area of Prisms
1. Mateo is designing a tent for his next camping trip. A drawing of his tent is shown with dimensions given in feet (ft.).
How much fabric does Mateo need to buy to create the tent?
2. Alana is painting a dresser that is 7 ft. long, 2 ft. wide, and 4 ft. tall, as shown. Alana does not want to paint the bottom of the dresser or the back of the dresser because those sides of the dresser will not be seen.
What is the surface area of the dresser Alana is painting?
3. A carpenter is staining planks of wood to build the top of a long picnic table. The carpenter needs to determine the surface area of each plank in order to purchase the right amount of stain. Each plank is 3 4 in. thick, 5 1 2 in. wide, and 72 in. long.
a. What is the surface area of each plank?
ManuscriptCopy
b. If the carpenter needs to stain 5 planks of wood, what is the total surface area of all of the planks he needs to stain?
Lesson Summary
A net of a three-dimensional figure is formed when the faces of the figure are arranged to create a two- dimensional composite figure that can be folded up to create the solid figure.
A net is a two-dimensional diagram that can be folded or made into a three-dimensional figure.
To find the surface area of a three-dimensional figure, use the net or the individual faces of the figure to find the area of each face. The surface area of a threedimensional solid is the total area of the two-dimensional surfaces that make up the figure.
The surfacearea of a polyhedron is the number of square units that covers all the faces of the polyhedron, without any gaps or overlaps.
Practice Problems
ManuscriptCopy
1. Edge lengths are given in units. Find the surface area of each prism in square units (sq. units).

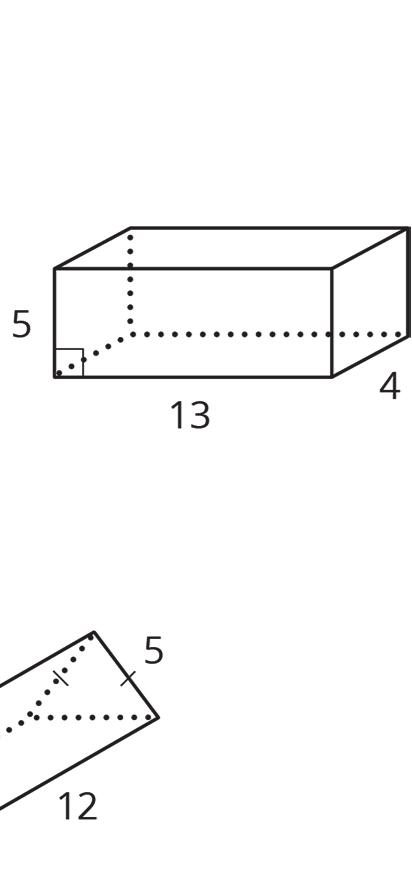
2. A triangular prism is shown with base side lengths of 6 centimeters (cm), 10 cm, and 11.6 cm. The prism has a height of 9.5 cm. What is the surface area of the triangular prism?
Review Problems
3. Write each expression with fewer terms.
ManuscriptCopy
a. 12�� − 4��
b. 12�� − 5�� + ��
c. 9�� + ��
4. Point �� is the intersection of line ���� and line ����. Find the measure of each of the angles.
a. The measure of angle ������
b. The measure of angle ������

c. The measure of angle ������
d. The measure of angle ������
e. The measure of angle ������
ManuscriptCopy
Unit 8, Lesson 11: Surface Area of Right Pyramids
Warm-Up: Prisms, Pyramids, and Polyhedra
Describe each shape as precisely as you can.
ManuscriptCopy


Guided Activity: Finding the Surface Area of Pyramids
A square pyramid is shown with base dimensions of 4 inches (in.). The height of the pyramid is 4.2 in., and the slant height is 4.6 in.
1. Discuss with your partner the difference between the measurements of height and slant height. Summarize your discussion.
2. Sketch the net or the individual faces of the square pyramid. Label the dimensions of each face.
3. Discuss with your partner why the height of the pyramid is not included in the net of the figure, but the slant height is.
The slant height of the pyramid represents the height of each triangular face. When finding the surface area of a pyramid, use the slant height of find the area of the faces.
4. Determine the area of each face of the triangular pyramid. Include units.
5. Add the area of the faces to find the surface area of the pyramid.
ManuscriptCopy
Collaborative Activity: Finding the Surface Area of Pyramids
1. A pyramid is shown, with the dimensions labeled. What is the surface area of the rectangular pyramid?
2. A pyramid has an equilateral triangle base with side lengths of 10 centimeters (cm) and an area of 43.3 square centimeters (sq. cm). The slant height is 14 cm. Find the surface area, in sq. cm, of the pyramid.
3. The roof of Isaiah’s garage is in the shape of a square pyramid. The garage is shown, with dimensions given in feet (ft.). Isaiah is replacing the roof with new tiles and needs to find the surface area.
a. What is the surface area of the roof of the garage?
b. Discuss with your partner why the area of the base of the pyramid does not need to be included in Isaiah’s calculations. Summarize your discussion.
Lesson Summary
The height of a pyramid represents the distance from the very tip of the pyramid to the center of its base. The slant height is the height of each triangular face.
When finding the surface area of a pyramid, use the slant height to find the area of the triangular faces.
For example, in the pyramid shown, the height of the pyramid is455 ft., whereas the 2 triangular faces with base lengths of 600 ft. have a slant height of 545 ft., and the 2 triangular faces with base lengths of 756 ft. have a slant height of 591.5 ft. To find the area of each triangular face, use the slant height.
• Area of the pyramid’s base: (600)(756) = 453,600 sq. ft.
• Area of the front and back triangular faces: 2� 1 2 (600)(545)� = 327,000 sq. ft.
• Area of the right and left triangular faces: 2� 1 2 (756)(591.5)� = 447,174 sq. ft.
• Total surface area of the pyramid: 453,600 + 327,000 + 447,174 = 1,227,774 sq. ft.
Practice Problems
1. The city needs to cover the cell towers with wiring to keep animals out of the towers. A cell tower is shown, with dimensions in ft.
a. What is the surface area of the cell tower?
b. If there are 3 cell towers within the city’s limits, how much wiring is needed for all the towers?
ManuscriptCopy
2. A pyramid has an equilateral triangular base with side lengths of 6 in. and an area of 15.6 square inches (sq. in.). The slant height is 5.2 in. Find the surface area of the pyramid, in sq. in.
175 ft.
26 ft.
3. Jonathan is calculating the surface area of the square pyramid shown. His work is shown in the table.
Jonathan’s Work
Area of square base �� = 4 × 4 �� = 16 16 sq. in. Area of triangle faces
= 4� 1 2 × 4 × 4.2�
= 4(8.4)
in.
in.
a. Write a note to Jonathan explaining the mistake he made in his work.
b. Find the surface area of the square pyramid.
ManuscriptCopy
in.
in.
4. A mixture of punch contains 1 quart (qt.) of lemonade, 2 cups (c.) of grape juice, 4 tablespoons (tbsp.) of honey, and 1 2 gallon (gal.) of sparkling water. Find the percentage of the punch mixture that comes from each ingredient. Round your answers to the nearest tenth of a percent. (Hint: 1 c. = 16 tbsp.)
a. Find 44% of 625 using the facts that 40% of 625 is 250 and 4% of 625 is 25.
b. What is 4.4% of 625?
c. What is 0.44% of 625?
ManuscriptCopy
Unit 8, Lesson 12: Distinguishing Volume and Surface Area
Warm-Up: The Science Fair
Mai’s science teacher told her that when there is more ice touching the water in a glass, the ice melts faster. She wants to test this statement so she designs her science fair project to determine if crushed ice or ice cubes will melt faster in a drink.
ManuscriptCopy
She begins with two cups of warm water. In one cup, she puts a cube of ice. In a second cup, she puts crushed ice with the same volume as the cube. What is your hypothesis? Will the ice cube or crushed ice melt faster, or will they melt at the same rate? Explain your reasoning.
Exploration Activity: Surface Area and Volume
Your teacher will give your group 3 three-dimensional (3-D) figures.
1. Complete the table by finding the volume, in cubic centimeters (cu. cm), and the surface area, in square centimeters (sq. cm), of each figure.
1
2
3
2. Pick one of the 3-D figures.
a. Describe a real-world scenario where you would need to find the volume of the 3-D figure.
b. Describe a real-world scenario where you would need to find the surface area of the 3-D figure.
3-D Figure Volume
Figure
Figure
Figure
Collaborative Activity: Surface Area or Volume
Your teacher will give you cards with different figures and questions on them.
1. Sort the cards into two groups based on whether it would make more sense to think about the surface area or the volume of the figure when answering the question.
Pause here so your teacher can review your work.
2. Your teacher will assign you a card to examine more closely. What additional information would you need to be able to answer the question on your card?
3. Estimate reasonable measurements for the figure on your card.
4. Use your estimated measurements to calculate the answer to the question.
Lesson Summary
Depending on the context, it may be necessary to find the volume or surface area of a figure in order to solve a problem.
Some examples of quantities related to volume are listed.
• How much water a container can hold
• How much material it took to build a solid object
Volume is measured in cubic units, like cubic inches (cu. in.) or cubic meters (cu. m).
Some examples of quantities related to surface area are listed.
ManuscriptCopy
• How much fabric is needed to cover a surface
• How much of an object needs to be painted
Surface area is measured in square units, like square inches (sq. in.) or square meters (sq. m).
Practice Problems
1. Select all the situations where knowing the volume of an object would be more useful than knowing its surface area.
□ Determining the amount of paint needed to paint a barn.
□ Determining the monetary value of a piece of gold jewelry.
□ Filling an aquarium with buckets of water.
□ Deciding how much wrapping paper a gift will need.
□ Packing a box with watermelons for shipping.
□ Charging a company for ad space on your race car.
□ Measuring the amount of gasoline left in the tank of a tractor.
Review Problems
2. Angle �� is half as large as angle ��. Angle �� is one fourth as large as angle ��. Angle �� has measure 240°. What is the measure of angle ��?
3. The Colorado state flag consists of three horizontal stripes of equal height. The side lengths of the flag are in the ratio 2 ∶ 3. The diameter of the gold-colored disk is equal to the height of the center stripe. What percentage of the flag is gold?
ManuscriptCopy

4. Solve each equation.
a. 1 7 �� + 3 4 = 9 8
b. 2 3 + 1 5 �� = 5 6
c. 3 2 = 4 3 �� + 2 3
d. 0.3�� + 7.9 = 9.1
e. 11.03 = 8.78 + 0.02��
ManuscriptCopy
Unit 8, Lesson 13: Applying Volume and Surface Area
Warm-Up: You Decide
For each situation, decide if it requires Noah to calculate surface area or volume. Explain your reasoning.
1. Noah is planning to paint the bird house he built. He is unsure if he has enough paint.
2. Noah is planning to use a box with a trapezoid base to hold modeling clay. He is unsure if the clay will all fit in the box.
Collaborative Activity: Gallery Walk
Complete each problem by recording your work and answer in the spaces provided.
Problem Work
Problem A
Answer
ManuscriptCopy
Problem B
Problem C
Problem D
Problem E
Problem F
ManuscriptCopy
Lesson Summary
When constructing a concrete bench like the one shown, it is helpful to know information such as the volume or the surface area of the bench. Knowing that the bench has a volume of 10 cubic feet (cu. ft.) and a surface area of 44 square feet (sq. ft.) can help in solving problems about the bench.
Consider the following examples.
• How much does the bench weigh?
• How long does it take to wipe the whole bench clean?

The volume of the bench, 10 cu. ft., can be used to determine how much it weighs. Concrete weighs about 150 pounds (lb.) per cu. ft., so this bench weighs about 1,500 lb. because 10 ⋅ 150 = 1, 500.
The surface area of the bench, 44 sq. ft., can be used to determine how long it takes to wipe clean. If it takes a person about 2 seconds (sec.) per sq. ft. to wipe a surface clean, then it would take about 88 sec. to clean this bench, because 44 ⋅ 2 = 88. It may take a little less than 88 sec., since the surfaces where the bench is touching the ground do not need to be wiped.
Practice Problems
1. Charlotte is filling her pool with water for the summer. The pool is 18 ft. long, 10 ft. wide, and 6 ft. deep. Charlotte is only filling the pool 9 10 of the way with water. What is the volume of the water in the pool?
2. Diego constructed a model log cabin. He needs to put a paint sealer on all sides of the log cabin so the wood does not decay. Diego’s log cabin is shown, with dimensions in inches (in.).
What is the surface area of the log cabin?
3. The Walter Pyramid is a pyramid-shaped multipurpose indoor arena on the campus of Long Beach State University. The arena has a square base with side lengths of 345 ft., stands 192 ft. tall, and has a slant height of 258 ft.
a. Determine the volume of the Walter Pyramid.
b. Determine the surface area of the Walter Pyramid.
Review Problems
4. Shade in a base of the trapezoidal prism. (The base is not the same as the bottom.)
a. Find the area of the base you shaded.

b. Find the volume of this trapezoidal prism.
5. For each diagram, decide if �� is an increase or a decrease of ��. Then determine the percentage that �� increased or decreased to result in ��.


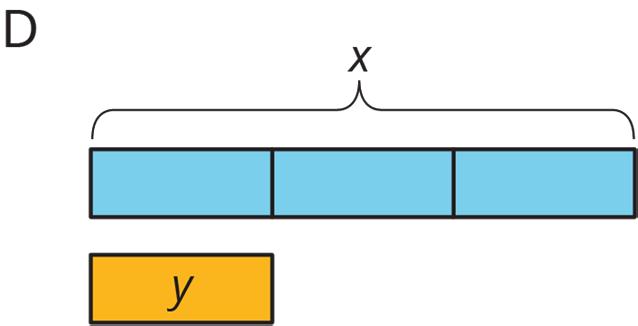
6. Noah is visiting his aunt in Texas. He wants to buy a belt buckle whose price is $25. He knows that the sales tax in Texas is 6.25%.
a. How much will the tax be on the belt buckle?
b. How much will Noah spend for the belt buckle including the tax?
c. Write an equation that represents the total cost, ��, of an item whose price is ��.
ManuscriptCopy
ManuscriptCopy
Unit 9, Lesson 1: Stem-and-Leaf Plots
Warm-Up: Notice and Wonder
A data display called a stem-and-leaf plot is shown.
1. What do you notice?
2. What do you wonder?
Exploration Activity: Graphical Representations
1. Dante and Lorraine recorded the highest temperature from each month over the past year in Charleston, South Carolina. They are trying to decide which graphical representation to use to represent the data shown.
{57, 60, 66, 73, 79, 85, 88, 87, 85, 75, 66, 61}
Lorraine created the box plot shown.
Dante created the dot plot shown.
a. Discuss similarities and differences between each of their graphical representations.
b. Complete the statements.
Highest Temperature each Month
5560657075808590
5560657075808590
Highest Temperature each Month over the Year
The box plot provides the individual data values five-number summary of the data, while the
dot plot provides the individual data values five-number summary.
Only the box plot
Only the dot plot
Both the box plot and the dot plot
can be used to determine the shape of the distribution.
Only the box plot
Only the dot plot
Both the box plot and the dot plot
Only the box plot
Only the dot plot
Both the box plot and the dot plot
can be used to determine the median.
can be used to determine the mode.
Annabelle used the same data to create the stem-and-leaf plot shown.
c. Discuss with your partner how the stem-and-leaf plot displays the data. Summarize your discussion.
2. Consider the stem-and-leaf plot representing the data set shown.
{17, 23, 41, 11, 28, 23, 37, 30, 29, 32, 23, 21, 40, 19, 39}
a. Complete the statement.
The data point 32 is represented in the first second third fourth
the
b. Complete the statements.
ManuscriptCopy
The median of the data is _________.
The mode of the data is _________.
The range of the data is _________.
Guided Activity: Creating Stem-and-Leaf Plots
1. A local restaurant hosted a holiday party for a local business. The ages of the 21 employees who attended the event are shown.
27, 28, 39, 18, 18, 21, 32, 25, 46, 40, 40, 22, 23, 24, 28, 30, 33, 35, 38, 42, 57
a. Create a stem-and-leaf plot using the data.
b. Find the median of the data.
c. Find the range of the data.
d. How many of the people who attended the holiday party were over 37 years old?
Collaborative Activity: More Stem-and-Leaf Plots
1. The dot plot shown represents the weights, in pounds (lb.), of 14 dogs that visited the local veterinary clinic yesterday.
Weight of Dogs
Create a stem-and-leaf plot to represent the data.
2. Marilyn started creating a stem-and-leaf plot to represent the data shown.
Marilyn’s partial stem-and-leaf plot is shown.
Lesson Summary
Stem-and-leaf plots can be used to represent numerical data sets.
A stem-and-leaf plot is a table that organizes data by place value to compare data frequencies.
Stem-and-leaf plots can be helpful in visualizing the shape of a distribution, while also allowing us to see the individual values of the data set. The stem-and-leaf plots display the data as an interval for each row, using place value. Each stem, identified by the first digit or digits for each number in the data set, is listed vertically and represents an interval in base ten. The leaf is the last digit for each data value and is listed horizontally from the stems.
An example is shown of a data set and its corresponding stem-and-leaf plot.
{57, 56, 70, 79, 83, 85, 81, 83, 59, 72, 104}
• Stems are listed in order, without skipping any intervals, even if no data values with that stem are included in the set. For example, there are no data values in the 60s or 90s, but 6 and 9 are both still included as stems.
• The last digit in each data value is separated by a space. For example, there are 4 data values in the 80s in the data set, which can be seen in the 4 values in the leaf for the corresponding stem.
ManuscriptCopy
Practice Problems
1. A high school basketball player organized his rebounds per game into the dot plot shown.
Rebounds per Game 8910 11 12131415161718192021
Create a stem-and-leaf plot to represent the data.
2. The prices for a dozen eggs at different grocery stores are shown. {5.01, 4.83, 4.79, 4.92, 5.02, 4.70, 5.00, 4.96, 4.91, 4.87}
a. Complete the stem-and-leaf plot representing the data.
Complete the statements.
ManuscriptCopy
a. The median of the data is _________.
b. The range of the data is _________.
3. Tasha made a stem-and-leaf plot from the data shown, but she made an error.
{84, 56, 67, 81, 60, 58, 51, 62, 88, 64}
Tasha’s stem-and-leaf plot is shown.
Explain the error Tasha made, and correct the stem-andleaf plot.
Key: 5|1 = 51
Review Problem
4. Here are questions about two types of angles.
a. Draw a right angle. How do you know it’s a right angle? What is its measure in degrees?
b. Draw a straight angle. How do you know it’s a straight angle? What is its measure in degrees?
ManuscriptCopy
Unit 9, Lesson 2: Exploring Histograms
Warm-Up: Why Statistics?
Eric Newburger relates the need for studying statistics to the need for using a microscope. He discusses how a microscope is used to study really small things. It’s also needed to study things like food poisoning to aid in understanding diseases and how viruses spread.
In Newburger’s work, he explains how you can take a big thing and shrink it down small enough to study and to understand it. That’s the study of statistics. And when you want to understand something that is too small to see, you can use a tool (like a microscope), which is “why statistics.”
1. List 2 reasons why statistics are important.
ManuscriptCopy
Guided Activity: Interpreting Data in Histograms
One-variable numerical data can be displayed graphically using another type of graph called a histogram.
1. The histogram summarizes the lengths, in feet (ft.), of a group of adult female sharks.
a. With your partner, discuss any features that you notice about the histogram. Summarize your discussion.

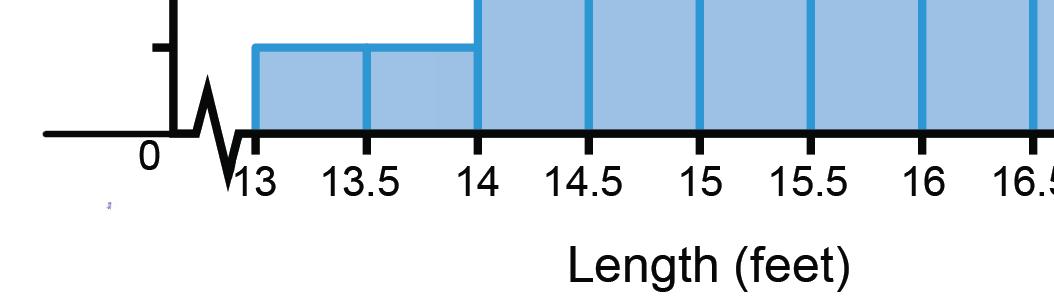
b. How many sharks were between 15.5 ft. and 16 ft. long?
c. How many total sharks were measured to create the histogram?

2. Each bar of a histogram includes the left-end value, but not the right-end value. For example, the first bar could include sharks that are 13 ft. and 13.25 ft., but not 13.5 ft.
a. What do you notice about the width of each bar?
ManuscriptCopy
b. Discuss with your partner whether or not you can determine the exact length of each shark measured from the histogram. Summarize your discussion.
Collaborative Activity: Interpreting Histograms
An earthworm farmer set up several containers of a certain species of earthworm so he could learn about their lengths. Lengths of earthworms provide information about their ages. The farmer measured the lengths of the earthworms in a container.
The farmer recorded the earthworms’ lengths, in millimeters (mm), in a table and then created a histogram to display the data.
Earthworm Lengths in Millimeters (mm)
1. How many earthworms were measured?
Complete the statements.
2. The number of earthworms measured can be determined from the data set only. the histogram only. the data set and the histogram.
Earthworm Lengths
4. Place an asterisk (*) above the bar that contains the data value for the shortest earthworm.
3. The length of the shortest earthworm can be determined from the data set only. the histogram only. the data set and the histogram.
5. Determine the length of the longest earthworm. Then, place a “+” above the bar that contains the data value for the longest earthworm.
6. Complete the statement.
Half of the earthworms are longer than ________ mm.
7. Discuss with your partner how the histogram would change if an earthworm that is 100 mm long was added to the data set. Summarize your discussion.
8. The farmer created the stem-and-leaf plot shown for the same set of data.
a. Discuss with your partner how the bars of the histogram relate the to the rows of numbers for each stem.
b. Rotate the stem-and-leaf plot 90° counterclockwise. What do you notice about the length of bars in the histogram compared to the number of values in the leaf column of the stem-and-leaf plot?
ManuscriptCopy
Collaborative Activity: Revisiting the Shape of Distributions
Work with your partner to describe the shape of each distribution.
Data Distribution Description of the Shape
ManuscriptCopy
Skewed
Skewed
Lesson Summary
In addition to dot plots, box plots, and stem-and-leaf plots, histograms can be used to represent distributions of numerical data.
A histogram is a visual display of numerical data using bars along a number line with no spaces between the bars. The height of each bar represents either the frequency or relative frequency of data within that interval.
In a histogram, data values are placed in groups, or bins, of a certain size, and each group is represented with a bar. The height of the bar indicates the frequency of data values for that group.
The frequency of a data value is how many times it occurs in the data set.
The histogram shown represents the weights, in kilograms (kg), of 40 dogs.
The height of the tallest bar is 12, and that bar represents weights from 20 kg to less than 25 kg, so there are 12 dogs whose weights fall in that interval. Similarly, there are 5 dogs that weigh anywhere from 25 kg to less than 30 kg.
ManuscriptCopy

Histograms can be used to describe the shape and features of a data distribution. Two distributions with very different shapes and features are shown.

• Histogram A is approximately symmetrical and has a peak near 21. Histogram B is not symmetrical and is bimodal with 2 peaks, one near 11 and one near 25.
• Histogram B has 2 clusters of data. A cluster forms when many data points are near a particular value or group of values on a number line.
• Histogram B also has a gap between 20 and 22. A gap shows an interval with no data values.
Practice Problems
1. In a study of wild bears, researchers measured the weights, in pounds (lb.), of 143 wild bears that ranged in age from newborn to 15 years old. The data was used to make the histogram shown.
a. Based on the histogram, explain whether or not this sample could contain a bear weighing 250 lb.
Wild Bear Weight
b. Mark an asterisk (*) above the bar that would contain a 250 lb. bear.
c. Based on the histogram, what can be concluded about the weight of the heaviest bear?
d. Describe the typical weight for the bears in the sample based on the data display. Include units.
e. Explain whether there is enough information to conclude that more than half of the bears in the study weigh less than 250 lb.
ManuscriptCopy
2. The histogram summarizes the data on the body lengths of the same 143 wild bears in inches (in.).
a. Does this sample contain a bear that is 85 in. long? Explain your reasoning.
b. Describe the typical length for the bears in the sample based on the data display. Include units.
c. Which is larger—the spread for the weight of bears or the length of bears?
Review Problem
1. One rectangle measures 2 units by 7 units. A second rectangle measures 11 units by 37 units. Are these two figures scaled versions of each other? If so, find the scale factor. If not, briefly explain why.
ManuscriptCopy
ManuscriptCopy
Unit 9, Lesson 3: Creating Histograms
Warm-Up: Which One Doesn’t Belong?
Which histogram does not belong? Be prepared to explain your reasoning.


ManuscriptCopy
Guided Activity: Creating Histograms
There are several steps when creating a histogram, including determining an appropriate interval width and the frequencies of data within each interval.
1. An earthworm farmer set up several containers of a certain species of earthworm so he could learn about their lengths. The farmer measured the lengths of 24 earthworms in 1 of the containers. Each length was measured in millimeters (mm) and recorded in the table.
Complete the statement.
a. The range of the data is ___________.
When creating a histogram, determine the interval width by dividing the range by the number of intervals desired.
range number of intervals ≈ interval width
b. Discuss with your partner 3 possible numbers of intervals you could use, and how using a different number of intervals would affect the histogram.
For this histogram, use 6 intervals. Complete the statements.
c. Divide the range by _____, and round up to the nearest whole number. This gives an interval width of _______.
Create a frequency table to represent the data by completing the following steps.
d. Complete the statements.
ManuscriptCopy
The minimum value is _______, so create the first interval that starts at 6 (or less). To get the highest value in the interval, add the interval width of ____.
The first interval is 6 − 18, and the second interval is 18 − ____.
e. With your partner, discuss if the value of 18 can be included in both intervals. Explain your conclusion.
f. Complete the frequency table for the data.
In a histogram, the bars touch. The variable measured is placed along the horizontal axis, and frequency is placed along the vertical axis.
g. Label the horizontal and vertical axes provided. Then, use the axes to create a histogram to display the lengths of earthworms in mm.
ManuscriptCopy
2. The same data could be displayed in the histogram shown.
a. With your partner, discuss the differences you notice about this histogram compared to the one you created.
b. Explain which histogram better displays the data.
Collaborative Activity: Creating Histograms
1. The data shows the number of messages sent by 12 seventh-grade students in 1 day.
99, 97, 94, 88, 84, 81, 80, 77, 71, 63, 60, 54
Complete the following to create a frequency table and a histogram to represent the data.
a. How many intervals are appropriate to use for this histogram?
b. List 3 possible interval widths.
c. Using 1 of the possible interval widths, create a frequency table and histogram for the data. Be sure to label both the horizontal and vertical axes of the histogram.
Number of Messages Frequency
d. Find a classmate who used a different interval width, and compare your histograms. Summarize your discussion on what you notice about the 2 different graphs.
ManuscriptCopy
2. Raisa used data she collected about the resting heart rates of 22 classmates, in beats per minute (bpm), to create a histogram. The heart rates are shown.
She created a frequency table and used it to make a histogram. The frequency table and histogram Raisa created are shown. Unfortunately, Raisa noticed that the data she collected was not accurately displayed.
a. Explain what Raisa did wrong.
b. Correct Raisa’s mistake by creating a frequency table and histogram that correctly display the data she collected.
Heart Rate (bpm) Frequency
ManuscriptCopy
Lesson Summary
The weights of 30 dogs, in kilograms (kg), are shown.
Before a histogram can be drawn, a couple of questions need to be considered.
• What are the smallest and largest values in the data set? This helps give an idea of the distance on the number line that the histogram will cover. In this case, the minimum value is 10 and the maximum value is 34, so the number line needs to extend from 10 to 35 at the very least. Remember to include the left boundary of a bar but exclude the right boundary. If 34 is the right boundary of the last bar, it won't be included in that bar, so the number line needs to go a little greater than the maximum value.
• What interval size, or bin size, seems reasonable here? The weights can be organized into bins of 2 kg (10, 12, 14, . . .), 5 kg, (10, 15, 20, 25, . . .), 10 kg (10, 20, 30, . . .), or any other size. The smaller the bins, the more bars the histogram will have, and vice versa.
If bins of 5 kg are used for the dog weights, the boundaries of the bins will be 10, 15, 20, 25, 30, 35. It would stop at 35 because 35 is greater than the maximum value.
Next, find the frequency for the values in each interval. It’s helpful to organize the values in a frequency table. A frequency table is a table that shows how often each item, number, or range of numbers occurs in a set of data.
Practice Problems
1. Sergio noticed that a bag of chips advertised that the serving size was 15 chips and that the bag contained approximately 4 servings. He counted the number of chips in a sample of 12 bags and recorded the total number of chips per bag shown.
48, 51, 52, 55, 56, 58, 59, 60, 61, 62, 65, 67
Create a frequency table and histogram for the number of chips in a bag.
Number of Chips
ManuscriptCopy
Frequency
2. This table shows the times, in minutes (min.), it took 40 sixth-grade students to run 1 mile (mi.).
Draw a histogram for the information in the table.
Review Problem
3. Here is a histogram that summarizes the lengths, in feet (ft.), of a group of adult female sharks.
Select all the statements that are true, according to the histogram.
□ A total of 9 sharks were measured.
□ A total of 50 sharks were measured.
□ The longest shark that was measured was 10 ft. long.
ManuscriptCopy


□ Most of the sharks that were measured were over 16 ft. long.
□ Two of the sharks that were measured were less than 14 ft. long.

Unit 9, Lesson 4: Interpreting Histograms
Warm-Up: Notice and Wonder
1. The histogram shown represents the number of TVs a store has in stock based on the TV size, in inches.
a. What do you notice?
b. What do you wonder?
Exploration Activity: Population of States
Every 10 years, the United States conducts a census, which is an effort to count the entire population. The dot plot shows the population data from the 2010 census for each of the 50 states and the District of Columbia (DC).

1. Some questions about the populations of the 50 states and DC are shown in the table.
a. Complete the middle column of the table to indicate how difficult it would be to answer each question using the dot plot.
How many states have populations greater than 15 million?
Which states have populations greater than 15 million?
How many states have populations less than 5 million?
What is a typical state population?
Are there more states with fewer than 5 million people, or more states with between 5 and 10 million people?
How would you describe the distribution of state populations?
2. The population data for all states and DC from the 2010 census is shown. Use the information to complete the frequency table.
3. Use the grid and the information from your frequency table to create a histogram.


4. Return to the questions at the beginning of the activity and complete the last column for the histogram.
ManuscriptCopy
Collaborative Activity: Tall and Taller Players
Professional basketball players tend to be taller than professional baseball players.
Here are two histograms that show height distributions of 50 male professional baseball players and 50 male professional basketball players.
1. Decide which histogram shows the heights of baseball players and which shows the heights of basketball players. Be prepared to explain your reasoning.

2. Write 2–3 sentences that describe the distribution of the heights of the basketball players. Comment on the center and spread of the data.
3. Write 2–3 sentences that describe the distribution of the heights of the baseball players. Comment on the center and spread of the data.
ManuscriptCopy
Lesson Summary
Data is often collected to answer questions. In doing so, it’s helpful to consider which representation is best for answering the question.
A dot plot showing the weight distribution of 40 dogs is shown. The weights were measured to the nearest 0.1 kilogram (kg).

A histogram showing the same distribution is shown.

With this data, it’s difficult to make sense of the distribution from the dot plot because the dots are so close together and all in 1 line. The histogram for the same data set does a better job showing the distribution of weights, even though the individual data values cannot be observed.
When interpreting histograms, it can be helpful to consider the shape, center, and spread of the distribution, as you learned in prior grades with other types of displays.
The center of a set of numerical data is a value in the middle of the distribution. It represents a typical value for the data set.
ManuscriptCopy
The spread of a set of numerical data tells how far apart the values are.
In upcoming lessons, you will revisit measures of center and spread explored previously and learn additional measures that can be used to describe data distributions.
Practice Problems
1. The histograms show the number of text messages sent in a week by a group of 100 sixth-grade and 100 seventh-grade students.
a. Describe the shape of the histogram for the number of text messages sent in a week by 6th-grade students.
b. Which group of students has the larger spread?
c. Explain whether 6th graders or 7th graders tend to be more similar to each other in terms of the number of text messages they send.
2. Factor each expression.
a. 15�� − 13��
b. −6�� − 18��
c. 36������ + 54����
3. Which equation represents the relationship between the angles in the figure?

ManuscriptCopy
A. 88 + �� = 90
B. 88 + �� = 180
C. 2�� + 88 = 90
D. 2�� + 88 = 180
Unit 9, Lesson 5: Introducing Mean
Warm-Up: Close to Four
1. Use the digits 0–9 to write an expression with a value as close as possible to 4. Each digit can be used only one time in the expression.
Restaurant Capacity
1. The kittens in a room at an animal shelter are arranged in five crates, as shown.
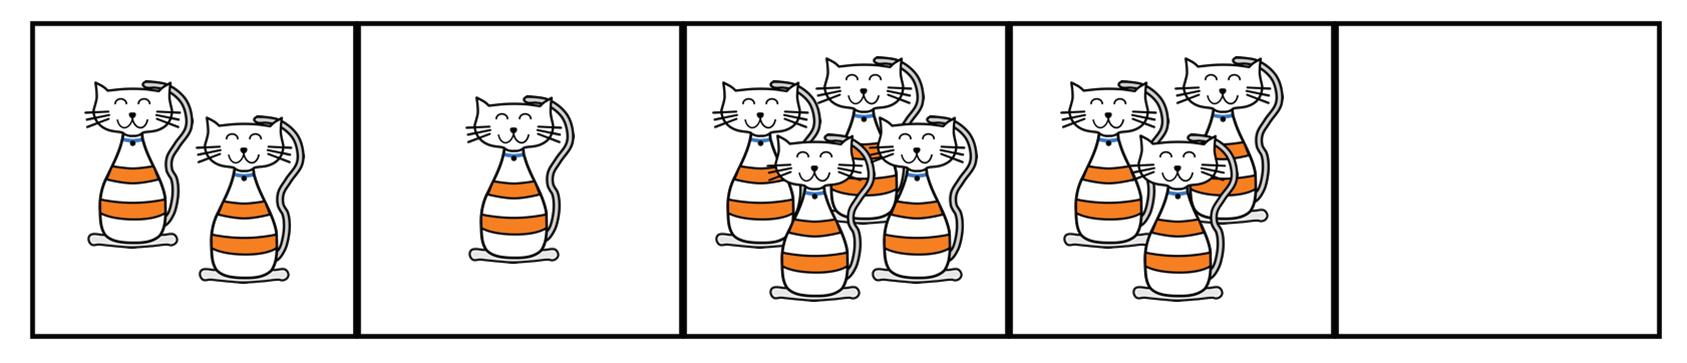
a. The manager of the shelter wants the kittens distributed equally among the crates. How might that be done? How many kittens will end up in each crate?
The number of kittens in each crate after they are equally distributed is called the mean number of kittens per crate, or the average number of kittens per crate.
b. Explain how the expression 10 ÷ 5 is related to the average.
c. Another room in the shelter has 6 crates. No two crates contain the same number of kittens, and there is an average of 3 kittens per crate. Draw or describe at least two different arrangements of kittens that match this description. You may choose to use the applet to help.
2. Five servers were scheduled to work the number of hours shown. They decided to share the workload, so each one would work equal hours.
a. On the grid on the left, draw 5 bars whose heights represent the hours worked by servers A, B, C, D, and E.

b. Think about how you would rearrange the hours so that each server gets a fair share. Then, on the grid on the right, draw a new graph to represent the rearranged hours. Be prepared to explain your reasoning.
c. Based on your second drawing, what is the average or mean number of hours that the servers will work?
d. Explain why we can also find the mean by finding the value of 31 ÷ 5.
e. Which server will see the biggest change to work hours? Which server will see the least change?
Guided Activity: Finding and Interpreting the Mean of a Data Set
Data in a numerical data set is summarized using different measures that are interpreted to describe the data. One such measure used to describe quantitative data sets is the mean.
To calculate the mean, add all the values in the data set, and then divide by the total number of data values.
1. A marine biologist is studying turtles and wants to calculate the average length of time a red-eared slider, a popular breed of turtle, can remain underwater. The time, in minutes (min.), that 10 red-eared sliders remain underwater are 75, 300, 225, 400, 250, 195, 320, 45, 165, and 410.
a. Find the mean by following the steps described. Step Work
Find the sum of the data values.
Divide the sum by 10 because there are 10 turtles in the set.
b. Complete the statement.
In this sample, red-eared slider turtles remain underwater for an average of _________ min.
2. Data from a research study on the percentage of adults in the US who use a particular social media platform is shown in the table.
a. Describe, in words, how to find the mean percentage of adults in the US who use the platform.
Step 1:
Step 2:
b. Find the mean percentage of adults in the US who use the platform.
c. Interpret the mean based on the data. Specifically address what the value of the mean states about the number of adults who use the social media platform.
d. Explain why the mean does not give information about the percentage of adults in the US using this platform today.
The mean of a data set is a way to describe the center of a data set by generalizing the data. In other words, it describes a typical value of the data set.
ManuscriptCopy
e. Complete the statement to interpret the mean of the data set.
Typically, about ___________ of adults in the US used the social media platform during the years 2012–2016.
Lesson Summary
Sometimes a general description of a distribution does not give enough information, in which case a more precise way to talk about center or spread would be more useful. The mean, or average, is a number that can be used to summarize a distribution.
The mean is the arithmetic average of a set of numbers. It is a measure of central tendency.
The average is another name for the mean of a data set.
The mean can be thought of as a “fair share” or “leveling out.” That is, mean can be thought of as a number that each member of a group would have if all the data values were combined and distributed equally among the members.
The table and diagram show how many liters (L) of water are in each of 5 bottles.

• To find the mean, first add up all of the values. In this context, this can be thought of as putting all of the water together into 1 container: 1 + 4 + 2 + 3 + 0 = 10.
• To find the “fair share,” divide the 10 L equally into the 5 containers: 10 ÷ 5 = 2. The mean of this data set is 2 L.
ManuscriptCopy

In general, to find the mean of a data set with �� values, add all of the values, and then divide the sum by ��.
Practice Problems
1. A preschool teacher is rearranging four boxes of playing blocks so that each box contains an equal number of blocks. Currently Box 1 has 32 blocks, Box 2 has 18, Box 3 has 41, and Box 4 has 9.
Select all the ways he could make each box have the same number of blocks.
□ Remove all the blocks and make four equal piles of 25, then put each pile in one of the boxes.
□ Remove 7 blocks from Box 1 and place them in Box 2.
□ Remove 21 blocks from Box 3 and place them in Box 4.
□ Remove 7 blocks from Box 1 and place them in Box 2, and remove 21 blocks from Box 3 and place them in Box 4.
□ Remove 7 blocks from Box 1 and place them in Box 2, and remove 16 blocks from Box 3 and place them in Box 4.
2. In a round of mini-golf, Clare records the number of strokes it takes to hit the ball into the hole of each green.
She said that, if she redistributed the strokes on different greens, she could tell that her average number of strokes per hole is 3. Explain how Clare is correct.
ManuscriptCopy
3. Three sixth-grade classes raised $25.50, $49.75, and $37.25 for their classroom libraries. They agreed to share the money raised equally. What is each class’s equal share? Explain or show your reasoning.
4. In her English class, Mai’s teacher gives 4 quizzes, each worth 5 points. After 3 quizzes, she has the scores 4, 3, and 4. What does she need to get on the last quiz to have a mean score of 4? Explain or show your reasoning.
Review Problem
5. An earthworm farmer examined two containers of a certain species of earthworms so that he could learn about their lengths. He measured 25 earthworms in each container and recorded their lengths in millimeters (mm).
Here are histograms of the lengths for each container.


a. Which container tends to have longer worms than the other container?
b. For which container would 15 mm be a reasonable description of a typical length of the worms in the container?
c. If length is related to age, which container had the most young worms?
a. If you deposit $300 in an account with a 6% interest rate, how much will be in your account after 1 year?
b. If you leave this money in the account, how much will be in your account after 2 years?
ManuscriptCopy
Unit
9,
Lesson
6: Finding and Interpreting the Mean as the Balance Point
Warm-Up: Which One Doesn’t Belong: Division
Which expression does not belong? Be prepared to explain your reasoning.
Exploration Activity: Travel Times – Part 1
A data set showing how long it takes for Diego to walk to school, in minutes (min.), over 5 days is shown. The mean time is 11 min.
1. Represent Diego’s data on a dot plot.
2. Mark the location of the mean with a triangle (∆) under the number line.
The mean can also be seen as a measure of center that balances the points in a data set.
3. Find the distance between every point and the mean, add the distances on each side of the mean, and compare the 2 sums to see this balancing.
a. Record the distance between each point and 11, and the point’s location relative to 11
b. Complete the statements.
The sum of distances left of 11 is _______.
The sum of distances right of 11 is _______.
c. What do you notice about the 2 sums?
Consider whether another point that is not the mean could produce similar sums of distances.
4. Investigate whether 10 can produce similar sums as those of 11.
a. Complete the table with the distance of each data point from 10, and the point’s location relative to 10.
b. Complete the statements.
The sum of distances left of 10 is _______.
The sum of distances right of 10 is _______.
c. What do you notice about the 2 sums?
5. Based on your work so far, explain why the mean can be considered a balance point for the data set.
Collaborative Activity: Travel Times – Part 2
1. Here are dot plots showing how long Diego’s trips to school took in min., which you studied earlier, and how long Andre’s trips to school took in min. The dot plots include the means for each data set, marked by triangles.

a. Which of the two data sets has a larger mean? In this context, what does a larger mean tell us?
b. Which of the two data sets has larger sums of distances to the left and right of the mean? What do these sums tell us about the variation in Diego’s and Andre’s travel times?
2. Here is a dot plot showing lengths of Lin’s trips to school.

a. Calculate the mean of Lin’s travel times.
b. Complete the table with the distance between each point and the mean as well whether the point is to the left or right of the mean.
c. Find the sum of distances to the left of the mean and the sum of distances to the right of the mean.
d. Use your work to compare Lin’s travel times to Andre’s. What can you say about their average travel times? What about the variability in their travel times?
ManuscriptCopy
Lesson Summary
The mean is a measure of center for a data distribution. This is because the mean of a distribution can be seen as the “balance point” for the distribution.
A measure of center is a numerical value used to describe the overall clustering of data in a set, or the overall central value of a set of data. The 3 most common measures of central tendency are the mean, median, and mode.
A set of data on the number of cookies that each of 8 friends baked is shown in the table and dot plot.

The distribution shown is completely symmetrical. The mean number of cookies is 21 because (19 + 20 + 20 + 21 + 21 + 22 + 22 + 23) ÷ 8 = 21. If the location of the mean is marked on the dot plot, it could be seen that the data points balance at 21.
In this plot, each point on either side of the mean has a mirror image. For example, the 2 points at 20 and the 2 points at 22 are the same distance from 21, but the pairs are located on either side of 21. This is thought of as balancing each other around 21.

ManuscriptCopy

Similarly, the points at 19 and 23 are the same distance from 21 but are on either side of it. They, too, can be seen as balancing each other around 21.
The distribution of the cookies has a center at 21 because that is its balance point. The 8 friends, on average, each baked 21 cookies.
Even when a distribution is not completely symmetrical, the distances of values below the mean, on the whole, balance the distances of values above the mean. 19 20 20 21 21 22
Practice Problems
1. On school days, Kiran walks to school. Here are the lengths of time, in min., for Kiran’s walks on 5 school days.
a. Create a dot plot for Kiran’s data.
b. Without calculating, decide if 15 min. would be a good estimate of the mean. If you think it is a good estimate, explain your reasoning. If not, give a better estimate and explain your reasoning.
c. Calculate the mean for Kiran’s data.
d. In the table, record the distance of each data point from the mean and its location relative to the mean.
e. Calculate the sum of all distances to the left of the mean, then calculate the sum of distances to the right of the mean. Explain how these sums show that the mean is a balance point for the values in the data set.
ManuscriptCopy
2. Noah scored 20 points in a game. Mai’s score was 30 points. The mean score for Noah, Mai, and Clare was 40 points. What was Clare’s score? Explain or show your reasoning.
Review Problems
3. Find the products.
4. Solve the inequality −5(�� − 1) > −40, and graph the solution on a number line.
a. (100) ⋅ (−0.09)
b. (−7) ⋅ (−1.1)
c. (−7.3) ⋅ (5)
d. (−0.2) ⋅ (−0.3)
Unit 9, Lesson 7: Variability and Mean Absolute Deviation
Warm-Up: Shooting Hoops (Part 1)
Elena, Jada, and Lin enjoy playing basketball during recess. Lately, they have been practicing free throws. They record the number of baskets they make out of 10 attempts. Here are their data sets for 12 school days.
1. Calculate the mean number of baskets each player made, and compare the means. What do you notice?
2. What do the means tell us in this context?
Exploration Activity: Shooting Hoops (Part 2)
Here are the dot plots showing the number of baskets Elena, Jada, and Lin each made over 12 school days.


1. On each dot plot, mark the location of the mean with a triangle (∆). Then, contrast the dot plot distributions. Write 2–3 sentences to describe the shape and spread of each distribution.
2. Discuss the following questions with your group. Explain your reasoning.
a. Would you say that all three students play equally well?
b. Would you say that all three students play equally consistently?
c. If you could choose one player to be on your basketball team based on their records, who would you choose?
Collaborative Activity: Shooting Hoops (Part 3)
The tables show Elena, Jada, and Lin’s basketball data from an earlier activity. Recall that the mean of Elena’s data, as well as that of Jada and Lin’s data, was 5.
1. Record the distance between each of Elena’s scores and the mean.
Now find the average of the distances in the table. Show your reasoning and round your answer to the nearest tenth.
This value is the mean absolute deviation (MAD) of Elena’s data.
Elena’s MAD: _________
2. Find the mean absolute deviation of Jada’s data. Round it to the nearest tenth.
Jada’s MAD: _________
3. Find the mean absolute deviation of Lin’s data. Round it to the nearest tenth.
Distance from 5
Lin’s MAD: _________
4. Compare the MADs and dot plots of the three students’ data. Do you see a relationship between each student’s MAD and the distribution on her dot plot? Explain your reasoning.


ManuscriptCopy
Lesson Summary
The mean of a data set is used as a measure of center of its distribution, but 2 data sets with the same mean could have very different distributions.
This dot plot shows the weights, in grams (g), of 22 cookies.
The mean weight is 21 g. All the weights are within 3 g of the mean, and most of them are even closer. These cookies are all fairly close in weight.
This dot plot shows the weights, in g, of a different set of 30 cookies.

The mean weight for this set of cookies is also 21 g, but some cookies are half that weight, and others are one-and-a-half times that weight. There is a lot more variability in the weight.

There is a number to describe how far away, or how spread out, data points generally are from the mean. This measure of variability, or spread, is called the mean absolute deviation (MAD).
A measure of variability is a numerical value that measures how much a data set varies from a central value.
The mean absolute deviation (MAD) is one way to measure how spread out a data set is.
Using the previous example, the MAD indicates how far cookie weights typically are from 21 g. To find the MAD, find the distance between each data value and the mean, and then calculate the mean of those distances.
ManuscriptCopy
For example, the point that represents 18 g is 3 units away from the mean of 21 g.

The distance between each point and the mean of 21 g can be found and organized into a table, as shown for the first set of data.
The values in the first column of the table are the cookie weights for the first set of cookies. Their mean, 21 g, is the mean of the cookie weights.
The values in the second column of the table are the distances between the values in the first column and 21. The mean of these distances is the MAD of the cookie weights.
What can be learned from the averages of these distances once they are calculated?
• In the first set of cookies, the distances are all between 0 and 3. The MAD is 1.2 g, which means the cookie weights are typically within 1.2 g of 21 g. Therefore, a typical cookie from this batch weighs between 19.8 and 22.2 g.
• In the second set of cookies, the distances are all between 0 and 13. The MAD is 5.6 g, which means the cookie weights are typically within 5.6 g of 21 g. Therefore, a typical cookie from this batch weighs between 15.4 and 26.6 g.
In these examples, it’s easy to see that a higher MAD suggests a distribution that is more spread out, showing more variability. This variability is also visible on the original dot plot.
Practice Problems
1. Han recorded the number of pages that he read each day for five days. The dot plot shows his data.

a. Is 30 pages a good estimate of the mean number of pages that Han read each day? Explain your reasoning.
b. Find the mean number of pages that Han read during the five days. Draw a triangle to mark the mean on the dot plot.
c. Use the dot plot and the mean to complete the table.
d. Calculate the mean absolute deviation (MAD) of the data. Explain or show your reasoning.
2. Ten sixth-grade students recorded the amounts of time each took to travel to school. The dot plot shows their travel times.

The mean travel time for these students is approximately 9 minutes (min.). The MAD is approximately 4.2 min.
a. Which number of min., 9 or 4.2, is a typical amount of time for the ten sixthgrade students to travel to school? Explain your reasoning.
b. Based on the mean and MAD, Jada believes that travel times between 5 and 13 min. are common for this group. Do you agree? Explain your reasoning.
ManuscriptCopy
c. A different group of ten sixth-grade students also recorded their travel times to school. Their mean travel time was also 9 min., but the MAD was about 7 min. What could the dot plot of this second data set be? Describe or draw how it might look.
3. In an archery competition, scores for each round are calculated by averaging the distance of 3 arrows from the center of the target.
An archer has a mean distance of 1.6 inches (in.) and a MAD distance of 1.3 in. in the first round. In the second round, the archer’s arrows are farther from the center but are more consistent. What values for the mean and MAD would fit this description for the second round? Explain your reasoning.
Review Problems
4. A factory produces 3 bottles of sparkling water for every 7 bottles of plain water. If those are the only two products they produce, what percentage of their production is sparkling water? What percentage is plain?
ManuscriptCopy
5. Match each table with the equation that represents the same proportional relationship.
ManuscriptCopy
Unit 9, Lesson 8: Calculating Median and Interquartile Range
Warm-Up: Number Talk: Decimal Division Find the value of each expression mentally.
ManuscriptCopy
Guided Activity: Marine Life
1. The stem-and-leaf plot shown displays the length, in inches (in.), of 15 great white sharks that were last tracked in the Gulf of Mexico.
Lengths of Great White Sharks
a. Complete the statements.
The shortest great white shark in this data set is ______ in. The longest great white shark in this data set is ______ in.
b. Circle the median of the data set in the stem-and-leaf plot.
c. Describe what the median represents in this data set.
d. Find and mark the middle value of the lower half of the data, excluding the median. Label this value Quartile 1 (Q1).
e. Find and mark the middle value of the upper half of the data, excluding the median. Label this value Quartile 3 (Q3).
The interquartile range (IQR) of a data set is the difference between Q1 and Q3.
f. Determine the IQR of this data set.
2. The table shows the weight, in pounds (lb.), of 12 olive ridley sea turtles found in the South Pacific Ocean.
a. Describe steps to find the median of the data set.
b. Find and interpret the median of the data set.
c. Find and interpret the lower extreme value and upper extreme value of the data set.
d. Find and interpret the range of the data set.
e. Complete the table to find the IQR.
f. What does the IQR indicate about the data?
Collaborative Activity: Median and IQR
Two stem-and-leaf plots are shown.
Data Set A Data Set B
Key: 1|5 = 15
1. Complete the statements.
Key: 1|9 = 19
a. The median for data set A is _________. The median for data set B is _________.
b. The IQR for data set A is ________. The IQR for data set B is ________.
c. The range for data set A is ________. The range for data set B is ________.
ManuscriptCopy
Lesson Summary
The median is a measure of center of a distribution. Half of the values in a data set are less than or equal to the median, and half of the values are greater than or equal to the median.
The median is the middle of an ordered list of the values. If the list has an odd number of values, it is the middle value of that list. If the list has an even number of values, it is the average of the two middle values. It is a measure of central tendency.
Recall that the mean is a measure of the center of a distribution and the MAD is a measure of the variability (or spread) that is used with the mean. There is also a measure of spread that is used with the median called the interquartile range (IQR).
A measure of variation in a set of numerical data, the interquartile range (IQR) is the distance between the first and third quartiles of the data set.
Finding the IQR involves partitioning a data set into fourths. Each of the 3 values that cut the data into fourths is called a quartile.
• The median, which divides the data into a lower half and an upper half, is the second quartile (Q2).
• The first quartile (Q1) is the middle value of the lower half of the data.
• The third quartile (Q3) is the middle value of the upper half of the data.
A set of data with 11 values is shown.
• The median (Q2) is 33.
• The first quartile (Q1), the median of the numbers less than 33, is 20.
• The third quartile (Q3), the median of the numbers greater than 33, is 40.
The difference between the lower extreme value and upper extreme value of a data set is the range
The range (of a data set) is the difference between the highest data value and the lowest data value in a data set.
The difference between Q1 and Q3 is the interquartile range (IQR). Because the distance between Q1 and Q3 includes the middle two-fourths, or 50%, of the distribution, the values between those 2 quartiles are sometimes called the middle half of the data.
The bigger the IQR, the more spread out the middle half of the data is. The smaller the IQR, the closer together the middle half of the data is.
A five-number summary, which includes the lower extreme, Q1, median (Q2), Q3, and upper extreme, can be used to summarize a distribution.
Practice Problems
1. Michael and 12 of his friends listed how far, in miles (mi.), they live from the school and then used the data to create the histogram shown.
0.4, 0.5, 1, 1, 2.4, 2.7, 3, 3.2, 4, 4.2, 4.4, 5, 9.5
Distance from School
a. Complete the five-number summary of the data.
b. Interpret the five-number summary in the context of the data.
2. Malinda and Danny recorded the total number of points they had in their hands during each round of a card game. Malinda created a stem-and-leaf plot to represent her data, and Danny created a box plot to represent his data. Their data displays are shown.
Malinda’s Total Number of Points
a. What is the IQR of Malinda’s data?
b. What is the median of Danny’s data?
c. What is the range of Danny’s data?
Review Problems
3. Select all expressions that can be subtracted from 9�� to result in the expression 3�� + 5.
□ −5 + 6��
□ 5 − 6��
□ 6�� + 5
□ 6�� − 5
□ −6�� + 5
4. Priya looks at the inequality 12 − �� > 5 and says, “I subtract a number from 12 and want a result that is bigger than 5. That means that the solutions should be values of �� that are smaller than something.”
Do you agree with Priya? Explain your reasoning and include solutions to the inequality in your explanation.
ManuscriptCopy
Unit 9, Lesson 9: Comparing Mean and Median
Warm-Up: Heights of Presidents
Two dot plots are shown. The first dot plot shows the heights, in centimeters (cm), of the first 22 U.S. presidents. The second dot plot shows the heights of the next 22 presidents.


Based on the 2 dot plots, decide whether you agree or disagree with each of the following statements. Be prepared to explain your reasoning.
1. The median height of the first 22 presidents is 178 cm.
Agree
Disagree
2. The mean height of the first 22 presidents is about 183 cm.
Agree
Disagree
3. A typical height for a president in the second group is about 182 cm.
Agree
Disagree
4. U.S. presidents have become taller over time.
ManuscriptCopy
Agree
Disagree
5. The heights of the first 22 presidents are more alike than the heights of the following 22 presidents.
Agree
Disagree
Exploration Activity: The Tallest and Smallest in the World
Your teacher will provide the height data for your class. Use the data to complete the following questions.
1. Find the mean height of your class in centimeters (cm).
2. Find the median height in cm. Show your reasoning.
3. Suppose that the world’s tallest adult, who is 251 cm tall, joined your class.
a. Discuss the following questions with your group and explain your reasoning.
• How would the mean height of the class change?
• How would the median height change?
b. Find the new mean.
c. Find the new median.
d. Which measure of center, the mean or the median, changed more when this new person joined the class? Explain why the value of one measure changed more than the other.
4. The world’s smallest adult is 63 cm tall. Suppose that the world’s tallest and smallest adults both joined your class.
a. Discuss the following questions with your group and explain your reasoning.
• How would the mean height of the class change from the original mean?
• How would the median height change from the original median?
b. Find the new mean.
c. Find the new median.
ManuscriptCopy
d. How did the measures of center, the mean and the median, change when these two people joined the class? Explain why the values of the mean and median changed the way they did.
Collaborative Activity: Mean or Median
1. Your teacher will give you 6 cards. Each card has a dot plot, stem-and-leaf plot, or a histogram. Sort the cards into 2 piles based on the distributions shown. Be prepared to explain your reasoning.
2. Discuss your sorting decisions with another group. Use the questions shown to guide your discussion.
• Did you have the same cards in each pile?
• If so, did you use the same sorting categories?
• If not, how are your categories different?
Pause here for a class discussion.
3. Use the information on the card indicated to answer each question.
a. Card A: What is a typical age of the dogs being treated at the animal clinic?
b. Card B: What is a typical number of people in an Irish household?
c. Card C: What is a typical travel time for the New Zealand students?
ManuscriptCopy
d. Card D: Would 15 years old be a good description of a typical age of the people who attended the birthday party?
e. Card E: Is 15 minutes (min.) or 24 min. a better description of a typical time it takes the students in South Africa to get to school?
f. Card F: Would 21.3 years old be a good description of a typical age of the people who went on a field trip to Washington, D.C.?
4. Explain how you decided which measure of center to use for each set of dot plots.
a. Cards A–C
b. Cards D–F
ManuscriptCopy
Lesson Summary
Both the mean and the median are ways of measuring the center of a distribution. However, they describe slightly different things.
The dot plot shows the weights of 30 cookies. The mean weight, marked with a triangle, is 21 grams (g). The median weight, marked with a diamond, is 20.5 g.

The mean shows that if the weights of all cookies were distributed such that each one weighed the same, that weight would be 21 grams. This could be thought of as a balance point for the weights of all the cookies in the set.
The median shows that half of the cookies weigh more than 20.5 g and half weigh less than 20.5 g. In this case, both the mean and the median could describe a typical cookie weight because they are fairly close to each other and to the center of the data.
A different set of 30 cookies is shown. It has the same mean weight as the first set, but the median weight is 23 g.

ManuscriptCopy
In this case, the median is closer to where most of the data points are clustered and is, therefore, a better measure of center for this distribution. That is, it is a better description of a typical cookie weight. The mean weight is influenced (in this case, pulled down) by a handful of much smaller cookies, so it is farther away from most of the data points.
In general, when a distribution is symmetrical or approximately symmetrical, the mean and median values are close. But when a distribution is not roughly symmetrical, the 2 values tend to be farther apart.
Practice Problems
1. The stem-and-leaf plot shown represents the ages of the teachers at a school. Ages of
Teachers in Years
Key: 3|0 = 30 years old
Which of these statements is true of the data set shown in the dot plot?
A. The mean is less than the median.
B. The mean is approximately equal to the median.
C. The mean is greater than the median.
D. The mean cannot be determined.
2. Priya asked each of five friends to attempt to throw a ball in a trash can until they succeeded. She recorded the number of unsuccessful attempts made by each friend as: 1, 8, 6, 2, 4. Priya made a mistake: The 8 in the data set should have been 18.
How would changing the 8 to 18 affect the mean and median of the data set?
A. The mean would decrease and the median would not change.
B. The mean would increase and the median would not change.
C. The mean would decrease and the median would increase.
D. The mean would increase and the median would increase.
3. In his history class, Han’s homework scores are as follows.
The history teacher uses the mean to calculate the grade for homework. Write an argument for Han to explain why median would be a better measure to use for his homework grades.
ManuscriptCopy
4. The dot plots show how much time, in minutes, students in a class took to complete each of five different tasks. Select all the dot plots of tasks for which the mean time is approximately equal to the median time.


Review Problems
5. Complete the equation with a number that makes the expression on the right side of the equal sign equivalent to the expression on the left side.
5�� − 2.5 + 6�� − 3 = ____(2�� − 1)
6. �� is a point on line segment ����. ���� is a line segment. Select all the equations that represent the relationship between the measures of the angles in the figure.

□ �� = ��
□ �� + �� = 90
□ �� = 90 − ��
□ �� + �� = 180
□ 180 − �� = ��
□ 180 = �� − ��
ManuscriptCopy
ManuscriptCopy
Unit 9, Lesson 10: Relating Shape to Measures of Center and Spread
Warm-Up: Notice and Wonder
The dot plot, histogram, and box plot summarize the hours (hr.) of battery life for 26 cell phones that are constantly streaming video.
1. What do you notice?
BatteryLife(hr.)
BatteryLife(hr.)
2. What do you wonder?
Exploration Activity: Measures of Center and Spread
1. Twenty students timed how long it took each of them to solve a puzzle. A list of their solution times, in minutes (min.), and a dot plot displaying the data are shown.
a. Describe the distribution of the data.
b. Determine the mean of the data set. Then, below the number line, draw an arrow (↑) that points to this value.
c. Determine the median of the data set. Then, circle the number on the number line that represents this value.
ManuscriptCopy
d. Discuss with your partner what you notice about the mean and the median of the data. Summarize your discussion.
2, 6, 7, 7, 8, 8, 8, 9, 9, 9, 9, 9, 9, 9, 10, 10, 11, 11, 11, 12
e. Which of the following values could be the mean absolute deviation (MAD) of the data set?
f. Find the interquartile range (IQR).
Q1
Q3
IQR
g. Discuss with your partner which measures most accurately describe the center and spread of the dot plot.
2. Each member of the track team recorded the total distance that they ran in 1 week. A list of each member’s total distance, in miles (mi.), and a histogram displaying the data are shown.
{3, 3, 3, 4, 4, 4, 4, 4, 5, 5, 6, 7, 7, 8, 8, 8, 8, 8, 9, 9}
a. Describe the distribution of the data.
b. Complete the table.
c. Discuss with your partner which measures most accurately describe the center and spread of the histogram.
3. A group of seventh graders were asked how many states in the U.S. they have visited. A list of the number of states and a dot plot representing the data are shown.
{2, 2, 3, 3, 5, 5, 5, 5, 6, 6, 6, 7, 7, 9, 9, 10, 17} 0123456789101112131415161718
NumberofStatesVisited
a. Describe the distribution of the data.
b. Complete the table. Round to the nearest tenth if necessary.
c. Complete the statement.
The outlier in this data is _________.
d. Discuss with your partner which measures most accurately describe the center and spread of the dot plot.
Guided Activity: Summarizing Data Distributions with Measures of Center and Spread
1. Consider the histogram of the lengths of female sharks, in feet (ft.).
a. Describe the shape of the histogram.


b. Circle the value on the horizontal axis of the graph that shows the approximate location of the median of the data.
ManuscriptCopy
c. Draw an arrow () on the graph to indicate the approximate location of the mean of the data.
The mean and the median of this histogram are located between 15 and 15.5 ft.
d. Select the measures that would best describe the center and spread of the data.
Mean
2. The histogram displays the number of points per game scored by a college basketball player during the 2008 season.
a. Describe the shape of the distribution.
b. Circle the value on the horizontal axis of the graph that shows the approximate location of the median.
c. Draw an arrow () on the graph to indicate the approximate location of the mean of the data.
d. Select the measures that would best describe the center and spread of the data.
Lesson Summary
When summarizing a data distribution, both the center and spread should be used in the description. The shape of a data distribution can be used to determine which measures would be best.
• In a symmetric distribution, the mean and the median are located in the middle of the graph, in approximately the same location. While these values are close to each other, in statistics the mean and MAD are typically used to describe a symmetric distribution.
• In a skewed distribution or a distribution with outliers, the median and IQR are the preferred measures for describing the data.
An outlier is a value that is much higher or much lower than the other values in a set of data.
When outliers are present or a distribution is skewed, the mean and MAD tend to be more affected because the outlier or skew can pull the mean away from the center, in 1 direction or the other. For this reason, they’re not the best measures to use for such distributions.
• In a bimodal distribution, the mode may be used as the preferred measure of center and the range may be used to describe the spread.
ManuscriptCopy
Practice Problems
1. Determine which measures of center and variation best describe each data set.
Data
Weekly biking times, in hours (hr.) 1, 2, 2, 3, 3, 3, 4, 4, 4, 4, 5, 5, 6, 6, 7
Daily high temperatures, in degrees Fahrenheit (℉): 61, 61, 62, 64, 66, 67, 67, 67, 68, 69, 70, 70, 70, 71, 71, 72, 74, 74,74, 75, 75, 75, 76, 76, 77, 78, 78, 79, 79, 95
2019–2020 NCAA Women’s Division 1 Soccer Top Scorers
Measure
2. Nelson is interested in how much storage space his downloaded music takes up. The sizes of 17 randomly selected files are listed, in megabytes (MB), and displayed in a histogram.
1, 1.3, 1.3, 1.9, 1.9, 2.1, 2.2, 2.4, 2.5, 2.7, 3, 4.4, 4.7, 5, 5.6, 6, 7.5
a. Describe the shape of the data distribution.
b. Which measure of center and variation should best describe the data distribution? Explain your choices.
Review Problem
3. What are the missing operations?
a. 48 ? (−8) = (−6)
b. (−40) ? 8 = ( −5)
c. 12 ? (−2) = 14
d. 18 ? (−12) = 6
e. 18 ? (−20) = −2
f. 22 ? (−0.5) = −11
ManuscriptCopy
ManuscriptCopy
Unit 10, Lesson 1: Exploring Sample Space
Warm-Up: Carolyn Beatrice Parker
Carolyn Beatrice Parker, born in 1917 in Gainesville, Florida, was the first African American woman known to receive a postgraduate degree in physics, and she went on to work on the top-secret government project known as the Manhattan Project. Before earning her master’s degree in physics, Parker earned a master’s degree in mathematics and was also a teacher in Florida.
In 2020, an elementary school in Gainesville was renamed in Parker’s honor. As of 2020, 11 of the 21 elementary schools in the Alachua County Public School District were named after people.

1. Without performing any calculations, select the statement that best describes the percentage of the elementary schools in Alachua County named after people as of 2020.
significantly less than 50%
slightly less than 50%
exactly 50%
slightly more than 50%
significantly more than 50%
2. Explain your reasoning.
Exploration Activity: Determining Outcomes
An outcome is a possible result of a chance experiment.
1. A spinner divided into 4 equal areas is shown.
a. How many outcomes are possible from spinning the spinner once?
b. With your partner, discuss the sample space for the spinner. Write a list of the possible outcomes for spinning the spinner once.
c. How many outcomes are included in the event that the spinner lands on blue?
d. Yellow, blue, and red are classified as primary colors. How many outcomes are included in the event that the spinner lands on a primary color?
2. Use the word bank to complete the statements.
event outcomes sample space set
a. To determine the ______________________ of a chance experiment, find all the ______________________ that are possible and write them as a
b. An ______________________ is a subset of the sample space, such as rolling an even number on a six-sided number cube.
3. Two spinners are shown.
a. Work with your partner to compare and contrast the features of the 2 spinners.
Spinner A Spinner B
b. One of the spinners is considered a fair spinner. Complete the statement.
Spinner A Spinner B is the fair spinner because ____________________________
ManuscriptCopy
Collaborative Activity: Chance Experiments
Two games are described.
Game 1: A player flips a coin and wins if it lands on heads.
Game 2: A player rolls a standard six-sided number cube and wins if it lands on a number that is divisible by 3.
1. Work with your partner to complete the following.
a. Discuss the sample space for both games with your partner.
b. Write the sample space for each in the table.
Random Process
Flipping a coin
Rolling a standard number cube
Sample Space
c. What are the possible outcomes in the event of landing on heads in game 1?
d. What fraction of the possible outcomes from game 1 results in a win?
e. What are the possible outcomes in the event of rolling a number divisible by 3 in game 2?
f. What fraction of the possible outcomes from game 2 results in a win?
g. Based on your answers to parts B–E, complete the statement.
A player has a greater likelihood of winning game 1 game 2 because ˃ .
2. Describe how game 2 could be modified so the likelihood of winning either game is the same.
Guided Activity: Defining Chance Experiments
Many carnival, card, and board games are considered games of chance because they model chance experiments.
In a chance experiment, each outcome in the sample space is equally likely to happen. However, events, which are subsets of the sample space, may have different likelihoods of happening. This is called probability.
1. For each chance experiment in the table, determine the sample space.
Chance Experiment Sample Space
Spinning the spinner
ManuscriptCopy
Rolling a fair twelve-sided die
2. Complete the following.
a. Given a sample space of {chocolate, potato chips, popcorn, fruit snacks}, label the game wheel so there is a fair chance of winning each snack as a prize.
b. Explain how you determined the labels for the game board.
Lesson Summary
A chance experiment is something that happens where the outcome is unknown. For example, if a coin is flipped, it is unknown whether the result will be heads or tails.
A chance experiment is an event that has a definite outcome that cannot be predicted with certainty.
An outcome of a chance experiment is something that can happen when the chance experiment occurs. For example, when a coin is flipped, one possible outcome is heads.
An outcome of a chance experiment is one of the things that can happen when you do the experiment.
An event is a set of one or more outcomes.
ManuscriptCopy
An event is a set of possible outcomes resulting from an experiment. In general, an event is any subset of a sample space.
When all the outcomes of a chance experiment are listed, this is called the sample space of that experiment.
In a probability model for a random process, the sample space is a list of the individual outcomes that are to be considered.
For example, the sample space for rolling a standard number cube includes 6 outcomes: 1, 2, 3, 4, 5, and 6.

Practice Problems
1. For each chance experiment in the table, identify the sample space.
Chance Experiment
Choosing one letter from the word
Choosing an even number from 1 to 12 at random
2. The spinner shown is used for a chance experiment.
a. What is the sample space?
b. Explain whether the spinner is fair. If the spinner is not fair, explain how you could change it to make it fair.
Sample Space
Review Problems
3. Which question cannot be answered by the solution to the equation 3�� = 27?
A. Elena read three times as many pages as Noah. She read 27 pages. How many pages did Noah read?
B. Lin has 27 stickers. She gives 3 stickers to each of her friends. With how many friends did Lin share her stickers?
C. Diego paid $27 to have 3 pizzas delivered and $35 to have 4 pizzas delivered. What is the price of one pizza?
D. The coach splits a team of 27 students into 3 groups to practice skills. How many students are in each group?
4. Below is a set of data about temperatures. The range of a set of data is the distance between the lowest and highest value in the set. What is the range of these temperatures? 9°C, − 3°C, 22°C, − 5°C, 11°C, 15°C
5. If two angles are both vertical and supplementary, can we determine the angles? Is it possible to be both vertical and complementary? If so, can you determine the angles? Explain how you know.
ManuscriptCopy
Unit 10, Lesson 2: Theoretical Probability
Warm-Up: Sample Space
A bag containing blue (B), yellow (Y), green (G), and red (R) marbles is shown.
1. Determine the sample space.
2. Which outcome is most likely when pulling a marble from this bag?


ManuscriptCopy


3. Each outcome takes up a portion of the marbles. The portions are shown in the table, each represented as a percentage, decimal, or fraction. Match each portion to the corresponding outcome.
Exploration Activity: Relating Probability and Sample Space
A spinner with 2 green, 2 yellow, and 4 red sections of equal size is shown .
1. Julio is conducting a chance experiment where he spins the spinner.
a. Create a sample space for the chance experiment.
b. How many different outcomes are in the sample space?
c. How many different outcomes include a red section? =
The ratio of the number of times an event occurs to the total number of outcomes in the sample space is the probability of that event occurring.
d. Determine the probability of Julio randomly landing on a red section by completing the equation.
probability of red = number of outcomes that are red number of outcomes in the sample space =
e. Determine the probability of Julio landing on a yellow section expressed as a fraction.
f. Determine the probability of Julio landing on a green section expressed as a decimal.
ManuscriptCopy
g. What is the sum of the probabilities of landing on a red, yellow, or green section?
h. What is the probability of landing on a blue section?
2. Chanel and her friend are playing a game in which they pull a lettered tile from a bag without looking.
The notation ��(A) in this context means “the probability of pulling a tile with the letter A on it.”
The lettered tiles remaining in the bag are shown.
a. How many different outcomes are in the sample space?
b. Shade all the outcomes that include a vowel.
c. Find ��(vowel).
Chanel recalls from English that while the letter Y is more often considered a consonant, it is sometimes considered a vowel.
d. With your partner, discuss how ��(vowel) would change depending on whether the letter Y is considered a consonant or a vowel. Summarize your discussion.
Collaborative Activity: Theoretical Probability
1. Neha is conducting a simple experiment where she flips a fair coin.
a. Neha said the probability of the coin landing on heads is 1 2 and the probability of the coin landing on tails is also 1 2 . Explain whether you agree with Neha based on your understanding of how probability relates to sample space.
b. Neha told her friend Darius, “Since the probability of the coin landing on heads is 1 2 , if I flip the coin twice, it will land on heads 1 out of 2 times and on tails 1 out of 2 times.” Discuss with your partner whether you agree with Neha. Summarize your discussion.
Darius responded to Neha saying, “The theoretical probability of the coin landing on heads is 1 2 , but that doesn’t mean it will always land on heads once out of every 2 flips. Every time you flip the coin, it has a 50% chance of landing on heads, so it could land on heads twice in a row.”
c. What do you think Darius means by theoretical probability?
2. The theoretical probabilities of 5 events are given .
a. Order the values of the probabilities from greatest to least.
b. Match the theoretical probabilities with the events described in the table.
Event
Landing on a primary color (red, blue, or yellow) on the spinner shown
Pulling a blue marble from a bag containing 1 blue, 3 red, 2 orange, and 4 green marbles
Landing on a factor of 6 when rolling a fair twelve-sided die
Theoretical Probability
Picking a card with a vowel on it from a set of cards with each letter in the word GREENVILLE on them
Landing on a number greater than 1 on a standard six-sided number cube
c. Explain which event is the least likely to occur based on the probabilities.
Lesson Summary
The probability of an event is a measure of the likelihood that the event will occur. Probabilities are expressed using numbers from 0 to 1.
The probability of a chance event is a number from 0 to 1 that expresses the likelihood of the event occurring, with 0 meaning it will never occur and 1 meaning it will always occur.
• If the probability is 0, that means the event is impossible. The closer the probability of an event is to 0, the less likely it is.
• If the probability is 1, that means the event is certain. The closer the probability of an event is to 1, the more likely it is.
• A game is considered fair if all the outcomes have an equal chance of occurring. For example, when a coin is flipped, there is an equal chance of the coin landing on heads or on tails.
Probability can be used to better understand random processes. One way to analyze a random process is by calculating the theoretical probability of the events in the sample space.
Theoretical probability is a number between 0 and 1 that represents the likelihood of an event in a theoretical model based on a sample space. If all outcomes in the sample space are equally likely, then the theoretical probability of an event is the ratio of the number of outcomes in the event to the number of outcomes in the sample space.
The probability of an event occurring, notated as ��(event), is determined by dividing the number of outcomes in the event by the total possible outcomes in the sample space.
��(event) = number of outcomes in the event total possible outcomes
Probabilities can be represented by decimals, percentages, or fractions with equivalent values between 0 and 1.
For example, when rolling a fair six-sided number cube, the probability of the number cube landing on 5 is ��(5) = 1 6 , which can also be expressed as 16. 6% or 0.16.
Practice Problems
1. The probability that Lawrence makes a free throw when playing basketball is 60%. The likelihood that he makes a three-point shot is 0.345.
Explain which event is more likely, Lawrence making a free throw or making a three-point shot.
2. The probabilities of 5 events are shown.
List the probabilities in order from least to greatest.
Review Problems
4. The graph shows that while it was being filled, the amount of water in gallons (gal.) in a swimming pool was approximately proportional to the time that has passed in minutes (min.).

a. About how much water was in the pool after 25 min.?
b. Approximately when were there 500 gal. of water in the pool?
ManuscriptCopy
c. Estimate the constant of proportionality for the number of gal. of water per min. going into the pool.
Unit 10, Lesson 3: Exploring Experimental Probability
Warm-Up: Decimals on the Number Line
1. Locate and label these numbers on the number line.
a. 0.5
b. 0.75
c. 0.33
d. 0.67
e. 0.25
2. Choose one of the numbers from the previous question. Describe a game in which that number represents your probability of winning.
Exploration Activity: In the Long Run
Mai plays a game in which she only wins if she rolls a 1 or a 2 with a standard number cube.
1. List the outcomes in the sample space for rolling the number cube.
2. What is the probability Mai will win the game? Explain your reasoning.
3. If Mai is given the option to flip a coin and win if it comes up heads, is that a better option for her to win?
4. With your group, follow these instructions 10 times to create the graph.
• One person rolls the number cube. Everyone records the outcome.
• Calculate the fraction of rolls that are a win for Mai so far. Approximate the fraction with a decimal value rounded to the hundredths place. Record both the fraction and the decimal in the last column of the table.
• On the graph, plot the number of rolls and the fraction that were wins.
• Pass the number cube to the next person in the group.


5. What appears to be happening with the points on the graph? 6.
a. After 10 rolls, what fraction of the total rolls were a win?
b. How close is this fraction to the probability that Mai will win?
ManuscriptCopy
7. Roll the number cube 10 more times. Record your results in this table and on the graph from earlier.
8.
a. After 20 rolls, what fraction of the total rolls were a win?
b. How close is this fraction to the probability that Mai will win?
Guided Activity: Bringing It Together
The previous activity explored experimental probability.
1. Complete the statements.
a. Based on the rules of the game, the theoretical probability experimental probability of Mai winning was 1 3 .
b. The fraction of the total rolls that your group determined were a win was the theoretical probability experimental probability
2. Consider what fraction of the total rolls were a win after 10 rolls versus 20 rolls.
a. What did you notice about how this value compared with the theoretical probability that the roll would be a win?
ManuscriptCopy
b. If all the groups’ rolls were combined to find the fraction of the total rolls for the class that were a win, explain whether you would expect the value to be closer to or farther from the theoretical probability.
Collaborative Activity: Calculating Experimental Probability
A standard deck of 52 playing cards is shown. Half of the cards are red (hearts and diamonds), half are black (spades and clubs), and 12 are "face" cards (jacks, queens, and kings). Aces have a value of 1.


1. Complete the statements.


Asad performed an experiment where he drew a random card from a standard deck. He recorded the frequency for each suit based on the cards he pulled.
a. The experimental probability Asad draws a card of clubs is _________.
b. The experimental probability Asad draws a card of diamonds is _________.
ManuscriptCopy
c. The experimental probability Asad draws a card of hearts is _________.
d. The experimental probability Asad draws a card of spades is _________.
Lesson Summary
The theoretical probability for an event represents the proportion of what the expected outcome could be. The experimental probability of an event represents the proportion of outcomes based on what actually happened during an experiment.
An experimental probability is the ratio of the number of times an event occurs to the total number of trials or times the activity is performed.
For example, the theoretical probability of a coin landing heads up after a flip is 1 2 , which means that the coin is expected to land heads up half of the time. Suppose a coin is flipped 6 times with the outcomes shown.
{H, H, T, H, T, H}
The experimental probability that the coin will land heads up based on these first 6 trials is 4 6 , or 2 3 . As more trials are repeated, the experimental probability will get closer to the theoretical probability.
Practice Problems
1. A carnival game has 160 rubber ducks floating in a pool. The person playing the game takes out one duck and looks at it.
• If there’s a red mark on the bottom of the duck, the person wins a small prize.
• If there’s a blue mark on the bottom of the duck, the person wins a large prize.
• Many ducks do not have a mark.
After 50 people have played the game, only 3 of them have won a small prize, and none of them have won a large prize.
Estimate the number of the 160 ducks that you think have red marks on the bottom. Then estimate the number of ducks you think have blue marks. Explain your reasoning.
2. Lin wants to know if flipping a quarter really does have a probability of 1 2 of landing heads up, so she flips a quarter 10 times. It lands heads up 3 times and tails up 7 times. Has she proven that the probability is not 1 2 ? Explain your reasoning.
3. A spinner has 4 equal sections, with 1 letter from the word MATH in each section. After spinning the spinner 80 times, Brandi reported that her experimental probability of landing on A was 31 80.
Complete the statement.
Brandi should have expected to land on A _____ times, but she actually landed on A _____ times.
Review Problems
4. Which event is more likely: rolling a standard number cube and getting an even number, or flipping a coin and having it land heads up?
5. Noah will select a letter at random from the word “FLUTE.” Lin will select a letter at random from the word “CLARINET.”
Which person is more likely to pick the letter “E?” Explain your reasoning.
Unit 10, Lesson 4: Estimating Probabilities
Warm-Up: Is It Likely?
1. If the weather forecast calls for a 20% chance of light rain tomorrow, would you say that it is likely to rain tomorrow?
2. If the probability of a tornado today is 1 10, would you say that there will likely be a tornado today?
3. If the probability of snow this week is 0.85, would you say that it is likely to snow this week?
Exploration Activity: Activity: Making My Head Spin
Your teacher will give you 4 spinners. Make sure each person in your group uses a different spinner.
1. Spin your spinner 10 times, and record your outcomes.
2. Did you get all of the different possible outcomes in your 10 spins?
ManuscriptCopy
3. What fraction of your 10 spins landed on 3?
4. Next, share your outcomes with your group, and record their outcomes.
a. Outcomes for spinner A:
b. Outcomes for spinner B:
c. Outcomes for spinner C:
d. Outcomes for spinner D:
ManuscriptCopy
5. Do any of the spinners have the same sample space? If so, do they have the same probabilities for each number to result?
6. For each spinner, what is the probability that it lands on the number 3? Explain or show your reasoning.
7. For each spinner, what is the probability that it lands on something other than the number 3? Explain or show your reasoning.
8. Noah put spinner D on top of his closed binder and spun it 10 times. It never landed on the number 1. How might you explain why this happened?
9. Han put spinner C on the floor and spun it 10 times. It never landed on the number 3, so he says that the probability of getting a 3 is 0. How might you explain why this happened?
Collaborative Activity: How Much Green?
Your teacher will give you a bag of blocks that are different colors. Do not look into the bag or take out more than 1 block at a time. Repeat these steps until everyone in your group has had 4 turns.
• Take one block out of the bag and record whether or not it is green.
• Put the block back into the bag, and shake the bag to mix up the blocks.
• Pass the bag to the next person in the group.
1. What do you think is the probability of taking out a green block from this bag? Explain or show your reasoning.
2. How could you get a better estimate without opening the bag?
ManuscriptCopy
Lesson Summary
Suppose a bag contains 5 blocks. If a block were selected at random from the bag, then the probability of getting any one of the blocks would be 1 5 .

Now, suppose a bag contains 5 blocks where some of the blocks have a star and some have a moon. If a block were selected from the bag, then it would either be a star block or a moon block. The probability of getting a star block would depend on how many there are in the bag. Two example bags are shown.

• The probability of selecting a star block at random from the first bag is 1 5 because it contains only 1 star block. The probability of selecting a moon block from this bag is 4 5.
• The probability of selecting a star block at random from the second bag is 3 5 because it contains 3 star blocks. The probability of selecting a moon block from this bag is 2 5.
This shows that 2 experiments can have the same sample space but different probabilities for each outcome.
Practice Problems
1. What is the same about these two experiments? What is different?
• Selecting a letter at random from the word “ALABAMA”
• Selecting a letter at random from the word “LAMB”
ManuscriptCopy
2. Andre picks a block out of a bag 60 times and notes that 43 of them were green.
a. What should Andre estimate for the probability of picking out a green block from this bag?
b. Mai looks in the bag and sees that there are 6 blocks in the bag. Should Andre change his estimate based on this information? If so, what should the new estimate be? If not, explain your reasoning.
3. Han has a number cube that he suspects is not so standard .
• Han rolls the cube 100 times, and it lands on a six 40 times.
• Kiran rolls the cube 50 times, and it lands on a six 21 times.
• Lin rolls the cube 30 times, and it lands on a six 11 times.
ManuscriptCopy
Based on these results, is there evidence to help prove that this cube is not a standard number cube? Explain your reasoning.
Review Problems
4. A textbook has 428 pages numbered in order starting with 1. You flip to a random page in the book in a way that it is equally likely to stop at any of the pages.
a. What is the sample space for this experiment?
b. What is the probability that you turn to page 45?
c. What is the probability that you turn to an even numbered page?
d. If you repeat this experiment 50 times, about how many times do you expect you will turn to an even numbered page?
5. A rectangular prism is cut along a diagonal on each face to create two triangular prisms. The distance between �� and �� is 5 inches.
What is the surface area of the original rectangular prism? What is the total surface area of the two triangular prisms together?
ManuscriptCopy

ManuscriptCopy
Unit 10, Lesson 5: Comparing Theoretical and Experimental Probabilities
Warm-Up: Statisticians Careers
Statisticians turn data into understandable and useful information. In industries like healthcare, government, sports news, and business, statisticians analyze data to predict trends and help people make better-informed decisions.
1. What are some real-world examples where you’ve seen statistics used?
2. Consider an industry you’re interested in working in someday.
a. What industry are you considering?
b. What’s at least 1 way you could see data trends and statistical analysis being used in this industry?
Collaborative Activity: Experimental and Theoretical Probability
1. Deepa wants to know if rolling an even number on a standard die really does have a probability of 1 2 , so she rolls a standard die 10 times. It lands on an even number 3 times and on an odd number 7 times. Explain whether or not she has disproven that the probability of landing on an even number is 1 2 .
2. A spinner is spun 40 times for a game. The graph shows the fraction of spins that are wins.
Fraction of spins that are wins
Number of spins y x
a. Estimate the probability of a spin winning this game based on the graph.
b. What type of probability is your estimate?
Collaborative Activity: Comparing Experimental Results to Expected Results
Work with your partner to complete the following.
1. Imagine that each of the resulting situations listed in the table occurs when performing the simple experiment of flipping a coin over repeated trials.
a. Complete the table to describe the results.
Situation
You flip the coin once and it lands heads up.
You flip the coin twice and it lands heads up both times.
You flip the coin 100 times and it lands heads up all 100 times.
Is the result surprising? Is the result possible?
Yes No Yes No
b. If you flipped the coin 100 times, explain how many times you would expect the coin to land heads up.
c. With your partner, discuss some other results that would not be surprising if you flipped the coin 100 times.
ManuscriptCopy
2. A spinner with 6 sections is shown.
a. Find the theoretical probability of landing on each color as a percentage rounded to the nearest tenth.
Color Red Purple Orange Blue Yellow Green
Theoretical Probability
b. Sara used a computer-simulated spinner to perform different numbers of trials. The results show the percentage of times that the spinner landed on each color in each simulation.
Circle the experimental probabilities that are more than 1% different from the theoretical probability.
D
c. Discuss with your partner what you notice when comparing the experimental probabilities to the theoretical probabilities.
d. In which simulation(s) were the experimental probabilities the most different from the theoretical probabilities?
e. In which simulation(s) were the experimental probabilities the most similar to the theoretical probabilities?
f. Imagine Sara used the computer-simulated spinner to perform 600,000 spins. Describe how you think the experimental probabilities of landing on each color would compare to the theoretical probabilities.
Lesson Summary
One way to evaluate the accuracy of theoretical probabilities is to compare them with experimental probabilities.
When performing simple experiments, the experimental probabilities may differ from theoretical probabilities due to random variation. However, as the number of repetitions increases, experimental probabilities will typically better approximate the theoretical probabilities.
ManuscriptCopy
For example, the theoretical probability of pulling a face card from a standard deck of cards is 12 52 . If this experiment were repeated multiple times, the experimental probability would be expected to be closer to 12 52 after 10,000 trials than after 10 trials.
Practice Problems
1. Jackson picks a card at random from a stack of 7 cards that are labeled with each day of the week.
a. Determine the theoretical probability of each event.
��(Monday) = _____________
��(weekend day) = _____________
��(Friday) = _____________
��(weekday) = _____________
b. Jackson randomly picked a card and replaced it 25 times. He picked a weekend day (Saturday or Sunday) 15 times. Describe how the theoretical probability compares to the experimental probability in this situation.
2. A fair ten-sided die is rolled 40 times for an experiment. Rolling a multiple of 5 results in a win. Out of the 40 times the die was rolled, 24 times resulted in a win.
a. How does the experimental probability compare to the theoretical probability of rolling a multiple of 5?
b. Explain what will happen to the experimental probability if the die is rolled 400,000 times.
3. Select all expressions that show �� increased by 35%.
□ 1.35��
□ 35 100 ��
□ �� + 35 100 ��
□ (1�� + 0.35) ��
□ 100+35 100 ��
□ (100 + 35)��
4. In this figure, angles �� and �� are complementary. Find the measure of angle ��.
ManuscriptCopy
