
Grade 7 SOUTH
CAROLINA
ISBN: 979-8-893539-05-9
Math Nation 6-8 was originally developed by Illustrative Mathematics®, and is copyright 2019 by Illustrative Mathematics. It is licensed under Creative Commons Attribution 4.0 International License (CCBY 4.0).
The online curriculum resource platform offered at "mathnation.com", including the videos and practice questions are additions to the original Illustrative Mathematics content is copyright 2023 by Accelerate Learning, Inc.
The trademark "Math Nation" is owned by Accelerate Learning, Inc. All other trademarks and product names referred to in the Math Nation AGA curriculum are the property of their respective owners and used solely for educational purposes. Unless otherwise stated, Math Nation has no relationship with any of the companies or brands mentioned in the curriculum and does not endorse or have a preference for any of those companies or brands.
This curriculum includes public domain images or openly licensed images that are copyright by their respective owners. Openly licensed images remain under the terms of their respective licenses. See the image attribution section for more information. 00820231215
ManuscriptCopy
ManuscriptCopy
ManuscriptCopy
Unit 1, Lesson 1: What Are Scaled Copies?
Warm-Up: Printing Portraits
Here is a portrait of a student.

1. Look at Portraits A–E. How is each one the same as or different from the original portrait of the student?


2. Some of the Portraits A–E are scaled copies of the original portrait. Which ones do you think are scaled copies? Explain your reasoning.
ManuscriptCopy
3. What do you think “scaled copy” means?
Exploration Activity: Scaling F
Here is an original drawing of the letter F and some other drawings.
1. Identify all the drawings that are scaled copies of the original letter F. Explain how you know.
2. Examine all the scaled copies more closely, specifically the lengths of each part of the letter F. How do they compare to the original? What do you notice?


3. On the grid, draw a different scaled copy of the original letter F.
ManuscriptCopy


Collaborative Activity: Pairs of Scaled Polygons
Your teacher will give you a set of cards that have polygons drawn on a grid. Mix up the cards and place them all face up.
1. Take turns with your partner to match a pair of polygons that are scaled copies of one another.
a. For each match you find, explain to your partner how you know it’s a match.
b. For each match your partner finds, listen carefully to their explanation, and if you disagree, explain your thinking.
2. When you agree on all of the matches, check your answers with the answer key. If there are any errors, discuss why and revise your matches.
3. Select one pair of polygons to examine further. Draw both polygons on the grid. Explain or show how you know that one polygon is a scaled copy of the other.
ManuscriptCopy


Lesson Summary
This lesson explored scaled copies of given figures.
A scaled copy is a figure where every length in the original figure is multiplied by the same number.
Examples and nonexamples of scaled copies are shown in the table.
Description
The second and third drawings are both scaled copies of the original Y.
The second drawing is a scaled enlargement of the original image, while the third drawing is a scaled reduction of the original image.
Examples
or Nonexamples

The second and third drawings are not scaled copies of the original W.
The second drawing is more spread out (wider and shorter) than the original image, while the third drawing is squished in (narrower but the same height) compared to the original.

ManuscriptCopy
What it means for one figure to be a scaled copy of another will be further explored in upcoming lessons.

Practice Problems
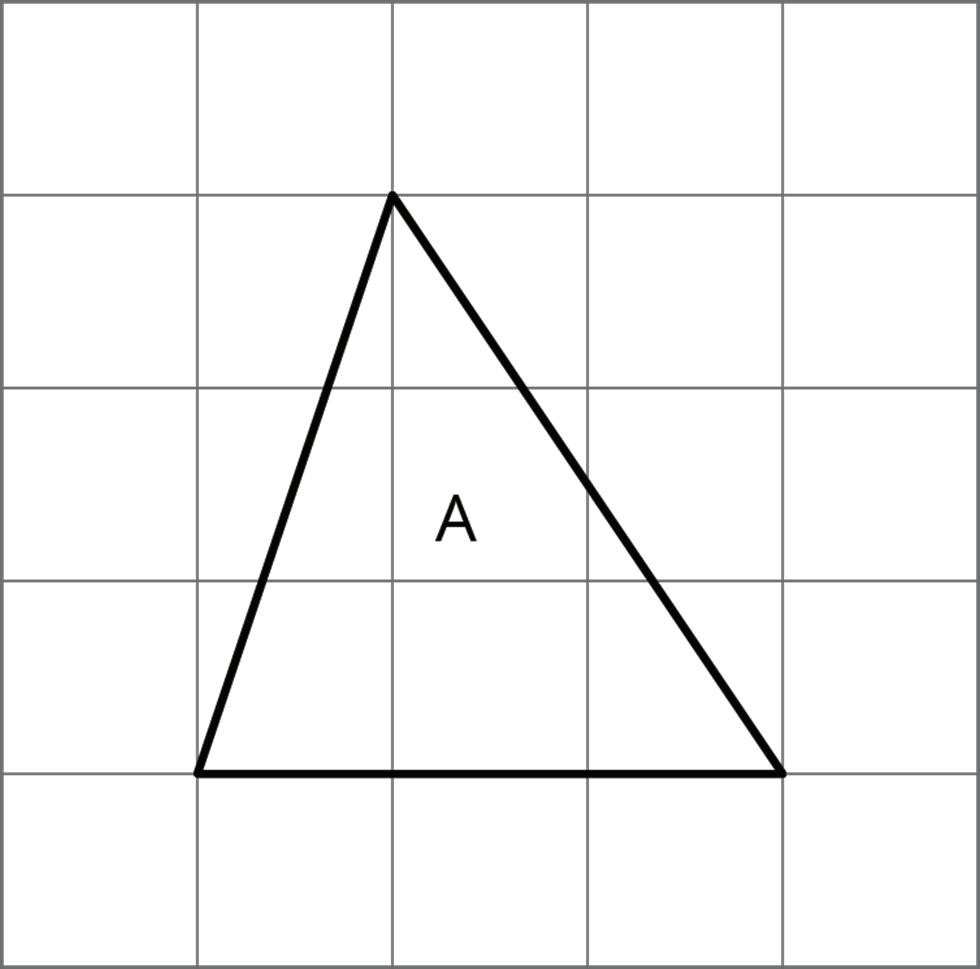
1. Here is a figure that looks like the letter A, along with several other figures. Which figures are scaled copies of the original A? Explain how you know.

2. Tyler says that Figure B is a scaled copy of Figure A because all of the peaks are half as tall.
Do you agree with Tyler? Explain your reasoning.
ManuscriptCopy

3. Here is a picture of the Rose Bowl Stadium in Pasadena, CA.

Here are some copies of the picture. Select all the pictures that are scaled copies of the original picture.

Review Problem
4. Complete each equation with a number that makes it true.
5 · = 15
ManuscriptCopy
4 · = 32
6 · = 9
Unit 1, Lesson 2: Corresponding Parts and Scale Factors
Warm-Up: Multiplying by a Unit Fraction
Find each product mentally.
Exploration Activity: Corresponding Parts
Here is a figure and two copies, each with some points labeled.

1. Complete this table to show corresponding parts in the three figures.

2. Is either copy a scaled copy of the original figure? Explain your reasoning.
3. Use tracing paper to compare angle ������ with its corresponding angles in Copy 1 and Copy 2. What do you notice?
4. Use tracing paper to compare angle ������ with its corresponding angles in Copy 1 and Copy 2. What do you notice?
Collaborative Activity: Scaled Triangles
Here is Triangle O, followed by a number of other triangles.


ManuscriptCopy
Your teacher will assign you two of the triangles to look at.
1. For each of your assigned triangles, is it a scaled copy of Triangle O? Be prepared to explain your reasoning.
2. As a group, identify all the scaled copies of Triangle O in the collection. Discuss your thinking. If you disagree, work to reach an agreement.
3. List all the triangles that are scaled copies in the table. Record the side lengths that correspond to the side lengths of Triangle O listed in each column.
Side Lengths
Triangle O
4. Explain or show how each copy has been scaled from the original (Triangle O).
ManuscriptCopy
Lesson Summary
A figure and its scaled copy have corresponding parts, or parts that are in the same position in relation to the rest of the figure.
For example, polygon 2 is a scaled copy of polygon 1.
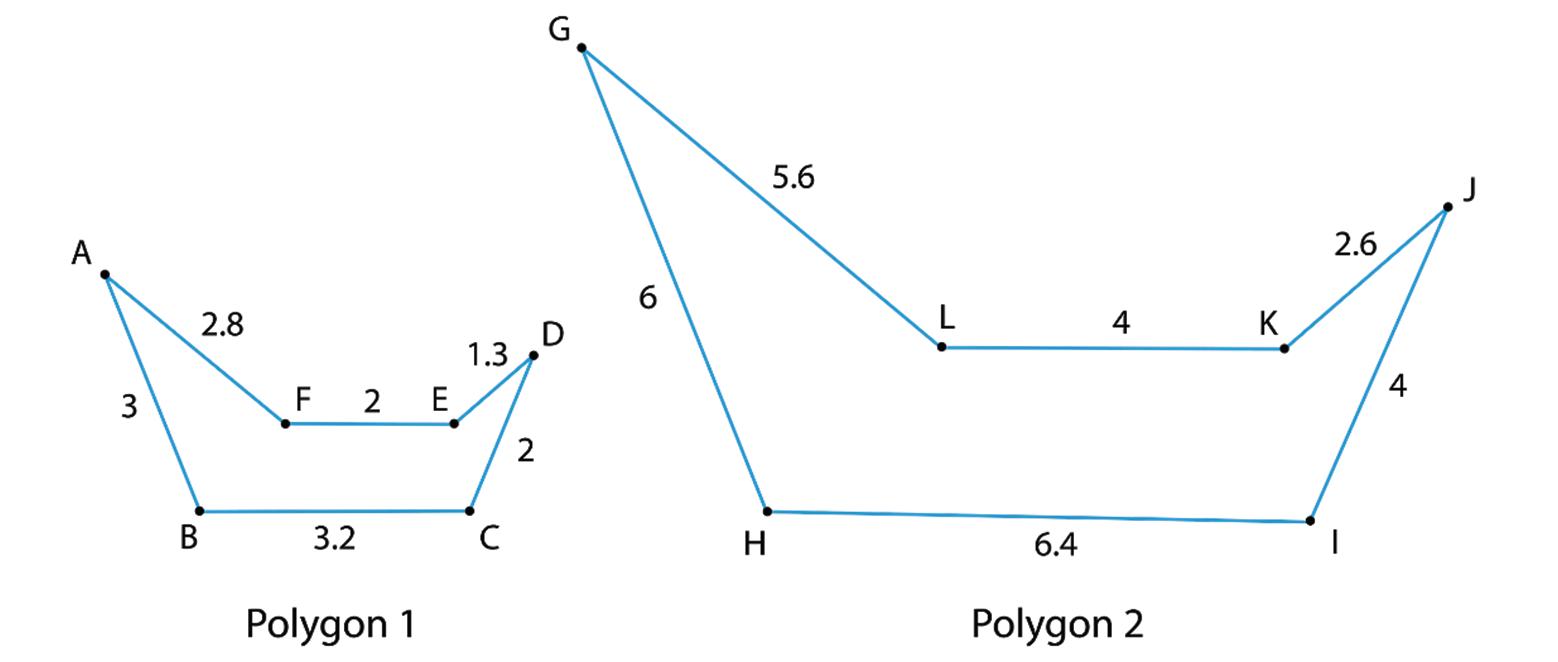
• Each point in polygon 1 has a corresponding point in polygon 2. For example, point �� corresponds to point �� and point �� corresponds to point ��.
• Each segment in polygon 1 has a corresponding segment in polygon 2. For example, segment ���� corresponds to segment ����.
• Each angle in polygon 1 also has a corresponding angle in polygon 2. For example, angle ������ corresponds to angle ������.
A scale factor is used to make a scaled copy.
To create a scaled copy, we multiply all the lengths of the original figure by the same number. This number is called the scale factor.
The scale factor between polygon 1 and polygon 2 is 2 because all of the lengths in polygon 2 are 2 times the corresponding lengths in polygon 1. The angle measures in polygon 2 are the same as the corresponding angle measures in polygon 1. For example, the measure of angle ������ is the same as the measure of angle ������.
Practice Problems
1. The second H-shaped polygon is a scaled copy of the first.

a. Show one pair of corresponding points and two pairs of corresponding sides in the original polygon and its copy. Consider using colored pencils to highlight corresponding parts or labeling some of the vertices.
b. What scale factor takes the original polygon to its smaller copy? Explain or show your reasoning.
2. Figure B is a scaled copy of Figure A. Select all of the statements that must be true.
□ Figure B is larger than Figure A.
□ Figure B has the same number of edges as Figure A.
□ Figure B has the same perimeter as Figure A.
ManuscriptCopy
□ Figure B has the same number of angles as Figure A.
□ Figure B has angles with the same measures as Figure A.
3. Polygon B is a scaled copy of Polygon A.
a. What is the scale factor from Polygon A to Polygon B? Explain your reasoning.
b. Find the missing length of each side marked with ? in Polygon B.

c. Determine the measure of each angle marked with ? in Polygon A.
Review Problem
4. Complete each equation with a number that makes it true.
8 · = 40
8 + = 40
21 ÷ = 7
21 − = 7
21 · = 7
a.
b.
c.
d.
e.
Unit 1, Lesson 3: Making Scaled Copies
Warm-Up: More or Less?
For each problem, select the answer from the two choices.
1. The value of 25 ⋅ (8.5) is more than 205. less than 205.
2. The value of (9.93) ⋅ (0.984) is more than 10. less than 10.
3. The value of (0.24) ⋅ (0.67) is more than 0.2. less than 0.2.
ManuscriptCopy
Collaborative Activity: Drawing Scaled Copies
Four figures are shown.


1. Draw a scaled copy of either Figure A or B using a scale factor of 3.
2. Draw a scaled copy of either Figure C or D using a scale factor of 1 2 .
ManuscriptCopy
Exploration Activity: Which Operations? (Part 1)
Diego and Jada want to scale this polygon so the side that corresponds to 15 units in the original is 5 units in the scaled copy.


Diego and Jada each use a different operation to find the new side lengths. Here are their finished drawings.


1. What operation do you think Diego used to calculate the lengths for his drawing?
2. What operation do you think Jada used to calculate the lengths for her drawing?
3. Did each method produce a scaled copy of the polygon? Explain your reasoning.
Exploration Activity: Which Operations? (Part 2)
Andre wants to make a scaled copy of Jada’s drawing so the side that corresponds to 4 units in Jada’s polygon is 8 units in his scaled copy.
1. Andre says, “I wonder if I should add 4 units to the lengths of all of the segments?” What would you say in response to Andre? Explain or show your reasoning.

2. Create the scaled copy that Andre wants. If you get stuck, consider using the edge of an index card or paper to measure the lengths needed to draw the copy.
Lesson Summary
Creating a scaled copy involves multiplying the lengths in the original figure by a scale factor.
For example, to make a scaled copy of triangle ABC where the base is 8 units, a scale factor of 4 would be used. This means multiplying all the side lengths by 4, so in triangle DEF, each side is 4 times as long as the corresponding side in triangle ABC.
ManuscriptCopy

Practice Problems
1. Here are 3 polygons.

Draw a scaled copy of Polygon A using a scale factor of 2.

Draw a scaled copy of Polygon B using a scale factor of 1 2 .

Draw a scaled copy of Polygon C using a scale factor of 3 2 .
ManuscriptCopy
2. Quadrilateral A has side lengths 6, 9, 9, and 12. Quadrilateral B is a scaled copy of Quadrilateral A, with its shortest side of length 2. What is the perimeter of Quadrilateral B?
3. Here is a polygon on a grid.

Draw a scaled copy of this polygon that has a perimeter of 30 units. What is the scale factor? Explain how you know.
Review Problem
4. Priya and Tyler are discussing the figures shown below. Priya thinks that B, C, and D are scaled copies of A. Tyler says B and D are scaled copies of A. Do you agree with Priya, or do you agree with Tyler? Explain your reasoning.
ManuscriptCopy

Unit 1, Lesson 4: Scaled Relationships
Warm-Up: Three Quadrilaterals (Part 1)
Each of these polygons is a scaled copy of the others.


1. Name two pairs of corresponding angles. What can you say about the sizes of these angles?
ManuscriptCopy
2. Check your prediction by measuring at least one pair of corresponding angles using a protractor. Record your measurements to the nearest 5°.
Exploration Activity: Three Quadrilaterals (Part 2)
Each of these polygons is a scaled copy of the others. You already checked their corresponding angles.


1. The side lengths of the polygons are hard to tell from the grid, but there are other corresponding distances that are easier to compare. Identify the distances in the other two polygons that correspond to ���� and ����, and record them in the table.
2. Look at the values in the table. What do you notice?
Pause here so your teacher can review your work.
3. The larger figure is a scaled copy of the smaller figure.
a. If ���� = 4, how long is the corresponding distance in the second figure? Explain or show your reasoning.

b. If ���� = 5, how long is the corresponding distance in the first figure? Explain or show your reasoning.
Exploration Activity: Scaled or Not Scaled?
Here are two quadrilaterals.
1. Mai says that Polygon �������� is a scaled copy of Polygon ��������, but Noah disagrees. Do you agree with either of them? Explain or show your reasoning.
ManuscriptCopy

2. Record thew corresponding distances in the table.
What do you notice?
3. Measure at least three pairs of corresponding angles in �������� and �������� using a protractor. Record your measurements to the nearest 5°. What do you notice?
4. Do these results change your answer to the first question? Explain.
ManuscriptCopy
5. Here are two more quadrilaterals.

ManuscriptCopy
Kiran says that Polygon �������� is a scaled copy of ��������, but Lin disagrees. Do you agree with either of them? Explain or show your reasoning.
Lesson Summary
When a figure is a scaled copy of another figure, the following characteristics are true.
• All distances in the copy can be found by multiplying the corresponding distances in the original figure by the same scale factor, whether or not the endpoints are connected by a segment.
For example, polygon STUVWX is a scaled copy of polygon ABCDEF. The scale factor is 3. The distance from T to X is 6 units, which is 3 times the distance from B to F.

• All angles in the copy have the same measure as the corresponding angles in the original figure, as in the triangles shown.

These characteristics can also be used to explain why one figure is not a scaled copy of another.
For example, even though their corresponding angles have the same measure, the second rectangle is not a scaled copy of the first rectangle because different pairs of corresponding lengths have different scale factors 2 ⋅ 1 2 = 1, but 3 ⋅ 2 3 = 2.
ManuscriptCopy

Practice Problems
1. Select all the statements that must be true for any scaled copy Q of Polygon P.
□ The side lengths are all whole numbers.
□ The angle measures are all whole numbers.
□ Q has exactly 1 right angle.
□ If the scale factor between P and Q is 1 5 , then each side length of P is multiplied by 1 5 to get the corresponding side length of Q.
□ If the scale factor is 2, each angle in P is multiplied by 2 to get the corresponding angle in Q.
□ Q has 2 acute angles and 3 obtuse angles.
2. Here is Quadrilateral ��������.
Quadrilateral �������� is a scaled copy of Quadrilateral ��������. Point �� corresponds to ��, �� to ��, �� to ��, and �� to ��.
If the distance from �� to �� is 3 units, what is the distance from �� to ��? Explain your reasoning.

ManuscriptCopy

3. Figure 2 is a scaled copy of Figure 1.
a. Identify the points in Figure 2 that correspond to the points �� and �� in Figure 1. Label them �� and ��. What is the distance between �� and ��?
b. Identify the points in Figure 1 that correspond to the points �� and �� in Figure 2. Label them �� and ��. What is the distance between �� and ��?

c. What is the scale factor that takes Figure 1 to Figure 2?
d. �� and �� are two points on Figure 1, but they are not shown. The distance between �� and �� is 1. What is the distance between the corresponding points on Figure 2?
Review Problem
4. To make 1 batch of lavender paint, the ratio of cups of pink paint to cups of blue paint is 6 to 5. Find two more ratios of cups of pink paint to cups of blue paint that are equivalent to this ratio.
ManuscriptCopy
Unit 1, Lesson 5: The Size of the Scale Factor
Warm-Up: Number Talk – Missing Factor
Solve each equation mentally.
1. 16�� = 176
2. 16�� = 8
3. 16�� = 1
4. 1 5 �� = 1
5. 2 5 �� = 1
Exploration Activity: Scaled Copies
Your teacher will give you a set of cards. On each card, Figure A is the original and Figure B is a scaled copy.
1. Sort the cards based on their scale factors. Be prepared to explain your reasoning.
2. Examine cards 10 and 13 more closely. What do you notice about the shapes and sizes of the figures? What do you notice about the scale factors?
3. Examine cards 8 and 12 more closely. What do you notice about the figures? What do you notice about the scale factors?
ManuscriptCopy
Collaborative Activity: Scaling a Puzzle
Your teacher will give you 2 pieces of a 6-piece puzzle.
1. If you drew scaled copies of your puzzle pieces using a scale factor of 1 2 , would they be larger or smaller than the original pieces? How do you know?
2. Create a scaled copy of each puzzle piece on a blank square, with a scale factor of 1 2 .
3. When everyone in your group is finished, put all 6 of the original puzzle pieces together as shown.
Next, put all 6 of your scaled copies together. Compare your scaled puzzle with the original puzzle. Which parts seem to be scaled correctly and which seem off? What might have caused those parts to be off?
4. Revise any of the scaled copies that may have been drawn incorrectly.
5. If you were to lose one of the pieces of the original puzzle, but still had the scaled copy, how could you recreate the lost piece?
ManuscriptCopy
Guided Activity: Missing Figure, Factor, or Copy
1. What is the scale factor from the original triangle to its copy? Explain or show your reasoning.

2. The scale factor from the original trapezoid to its copy is 2. Draw the scaled copy.
3. The scale factor from the original figure to its copy is 3 2 . Draw the original figure.
ManuscriptCopy


4. What is the scale factor from the original figure to the copy? Explain how you know.

5. The scale factor from the original figure to its scaled copy is 3. Draw the scaled copy.

ManuscriptCopy
Lesson Summary
The size of the scale factor affects the size of the copy.
• When a figure is scaled by a scale factor greater than 1, the copy is larger than the original.
• When the scale factor is less than 1, the copy is smaller than the original.
• When the scale factor is exactly 1, the copy is the same size as the original.
Triangle DEF is a larger scaled copy of triangle ABC because the scale factor from ABC to DEF is 3 2 . Triangle ABC is a smaller scaled copy of triangle DEF because the scale factor from DEF to ABC is 2 3 .

This means that triangles ABC and DEF are scaled copies of each other. It also shows that scaling can be reversed using reciprocal scale factors, such as 2 3 and 3 2 .
If p is a rational number that is not zero, then the reciprocal of p is the number 1 p .
ManuscriptCopy
Using another example, if figure A is a scaled copy of figure B using a scale factor of 4, the reciprocal scale factor, 1 4 , can be used to create figure A from figure B.
Practice Problems
1. Rectangles P, Q, R, and S are scaled copies of one another. For each pair, decide if the scale factor from one to the other is greater than 1, equal to 1, or less than 1.
a. from P to Q
b. from P to R
c. from Q to S
d. from Q to R
e. from S to P
f. from R to P
g. from P to S

2. Triangle S and Triangle L are scaled copies of one another.
a. What is the scale factor from S to L?
b. What is the scale factor from L to S?

c. Triangle M is also a scaled copy of S. The scale factor from S to M is 3 2 . What is the scale factor from M to S?
ManuscriptCopy
3. Are two squares with the same side lengths scaled copies of one another? Explain your reasoning.
4. Quadrilateral A has side lengths 2, 3, 5, and 6. Quadrilateral B has side lengths 4, 5, 8, and 10. Could one of the quadrilaterals be a scaled copy of the other? Explain.
5. Select all the ratios that are equivalent to the ratio 12: 3.
□ 6: 1
□ 1: 4
□ 4: 1
□ 24: 6
□ 15: 6
□ 1,200: 300
□ 112: 13
ManuscriptCopy
ManuscriptCopy
Unit 1, Lesson 6: Scaling and Area
Warm-Up: Scaling a Pattern Block
Three pattern blocks are shown.

1. How many blue rhombus blocks do you think it will take to build a scaled copy of figure A . . .
a. . . . where each side is twice as long?
b. . . . where each side is 3 times as long?
c. . . . where each side is 4 times as long?
2. How many green triangle blocks do you think it will take to build a scaled copy of figure B . . .
a. . . . where each side is twice as long?
b. . . . where each side is 3 times as long?
c. . . . using a scale factor of 4?
3. How many red trapezoid blocks do you think it will take to build a scaled copy of figure C . . .
a. . . . using a scale factor of 2?
b. . . . using a scale factor of 3?
c. . . . using a scale factor of 4?
Exploration Activity: Scaling More Pattern Blocks
Your teacher will assign your group one of these figures.

1. Build a scaled copy of your assigned shape using a scale factor of 2. Use the same shape blocks as in the original figure. How many blocks did it take?
2. Your classmate thinks that the scaled copies in the previous problem will each take 4 blocks to build. Do you agree or disagree? Explain your reasoning.
3. Start building a scaled copy of your assigned figure using a scale factor of 3. Stop when you can tell for sure how many blocks it would take. Record your answer.
4. How many blocks would it take to build scaled copies of your figure using scale factors 4, 5, and 6? Explain or show your reasoning.
5. How is the pattern in this activity the same as the pattern you saw in the previous activity? How is it different?
Collaborative Activity: Area of Scaled Parallelograms and Triangles
1. Your teacher will give you a figure with measurements in centimeters (cm). What is the area of your figure, in square centimeters (sq. cm)? How do you know?
2. Work with your partner to draw scaled copies of your figure, using each scale factor in the table. Complete the table with the measurements of your scaled copies.
3. Compare your results with a group that worked with a different figure. What is the same about your answers? What is different?
4. If you drew scaled copies of your figure with the following scale factors, what would their areas be? Discuss your thinking. If you disagree, work to reach an agreement. Be prepared to explain your reasoning.
ManuscriptCopy
Lesson Summary
Scaling affects lengths and areas differently. To create a scaled copy, all original lengths are multiplied by the scale factor.
If a copy of a rectangle with side lengths 2 units and 4 units is created using a scale factor of 3, the side lengths of the copy will be 6 units and 12 units, as shown, because 2 ⋅ 3 = 6 and 4 ⋅ 3 = 12.

The area of the copy, however, changes by a factor of the square of the scale factor. If each side length of the copy is 3 times longer than the original side length, then the area of the copy will be 9 times the area of the original, because 3 ⋅ 3, or 32, equals 9.

In this example, the area of the original rectangle is 8 square units (sq. units) and the area of the scaled copy is 72 sq. units, because 9 ⋅ 8 = 72. The large rectangle is covered by 9 copies of the small rectangle, without gaps or overlaps. This can be verified by multiplying the side lengths of the large rectangle to find the area, 6 ⋅ 12 = 72.
Lengths are one-dimensional, so in a scaled copy, they change by the scale factor. Area is two-dimensional, so it changes by the square of the scale factor. Consider a rectangle with length l and width w. If the rectangle is scaled by a scale factor of s, the resulting rectangle will have a length s ⋅ l and width s ⋅ w. The area of the scaled rectangle is A = (s ⋅ l) ⋅ (s ⋅ w), so A = (s2) ⋅ (l ⋅ w). The fact that the area is multiplied by the square of the scale factor is true for scaled copies of other two-dimensional figures, not just for rectangles.

Practice Problems
1. On the grid, draw a scaled copy of Polygon Q using a scale factor of 2. Compare the perimeter and area of the new polygon to those of Q.

2. A right triangle has an area of 36 square units (sq. units).
If you draw scaled copies of this triangle using the scale factors in the table, what will the areas of these scaled copies be?
Explain or show your reasoning.

3. Diego drew a scaled version of a Polygon P and labeled it Q.
If the area of Polygon P is 72 sq. units, what scale factor did Diego use to go from P to Q? Explain your reasoning.

Review
Problems
4. Here is an unlabeled polygon, along with its scaled copies Polygons A–D. For each copy, determine the scale factor. Explain how you know.


5. Solve each equation mentally.
Unit 1, Lesson 7: Scale Drawings
Warm-Up: What Is a Scale Drawing?
Here are some drawings of a school bus, a quarter, and the subway lines around Boston, Massachusetts.
The first three drawings are scale drawings of these objects.

The next three drawings are not scale drawings of these objects.
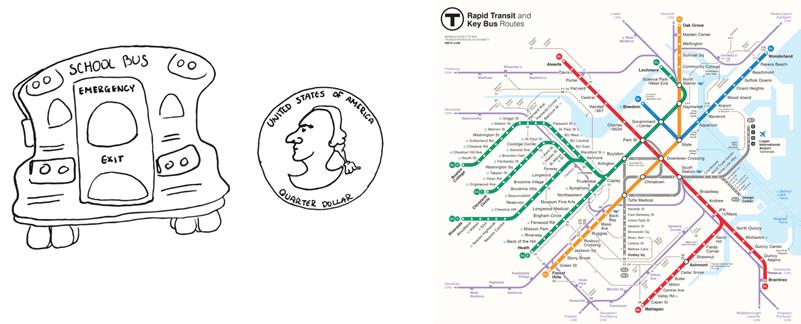
Discuss with your partner what a scale drawing is.
ManuscriptCopy
Exploration Activity: Sizing Up a Basketball Court
Your teacher will give you a scale drawing of a basketball court. The drawing does not have any measurements labeled, but it says that 1 centimeter (cm) represents 2 meters (m).
1. Measure the distances on the scale drawing that are labeled a–d to the nearest tenth of a centimeter. Record your results in the first row of the table.
2. The statement, “1 cm represents 2 m” is the scale of the drawing. It can also be expressed as, “1 cm to 2 m,” or “1 cm for every 2 m.” What do you think the scale tells us?
3. How long would each measurement from the first question be on an actual basketball court? Explain or show your reasoning.
4. On an actual basketball court, the bench area is typically 9 m long.
a. Without measuring, determine how long the bench area should be on the scale drawing.
b. Check your answer by measuring the bench area on the scale drawing. Did your prediction match your measurement?
Collaborative Activity: Tall Structures
Here is a scale drawing of some of the world’s tallest structures.
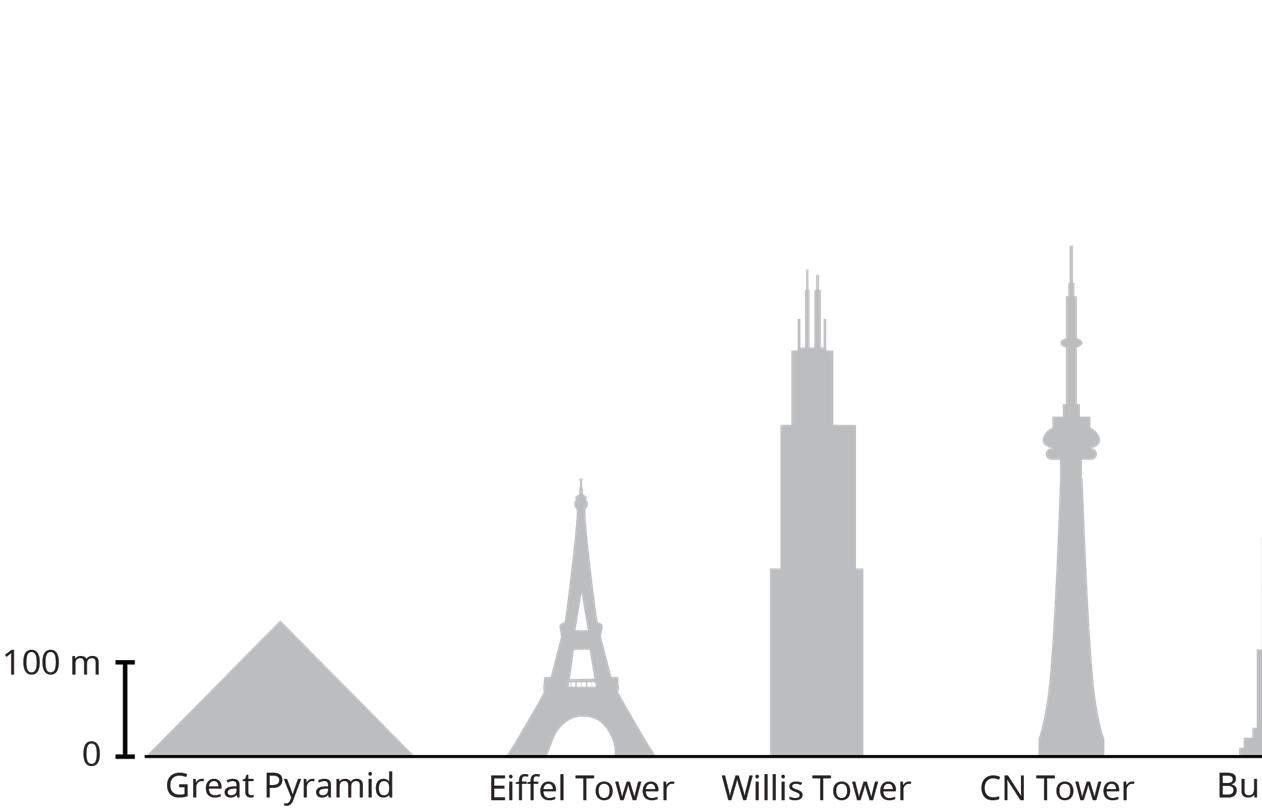

1. About how tall is the actual Willis Tower? About how tall is the actual Great Pyramid? Be prepared to explain your reasoning.
Willis Tower:
Great Pyramid:
2. About how much taller is the Burj Khalifa than the Eiffel Tower? Explain or show your reasoning.
ManuscriptCopy
3. Measure the line segment that shows the scale to the nearest tenth of a centimeter. Express the scale of the drawing using numbers and words.
Lesson Summary
Scale drawings are two-dimensional representations of actual objects or places. Floor plans and maps are some examples of scale drawings.
A scale drawing represents an actual place or object. All the measurements in the drawing correspond to the measurements of the actual object by the same scale.
The characteristics of a scale drawing are listed.
• Every part of the drawing corresponds to something in the actual object.
• Lengths on the drawing are enlarged or reduced by the same scale factor.
• A scale specifies how actual measurements are represented on the drawing. For example, if a map has a scale of 1 inch (in.) to 5 miles (mi.), then a 1 2 in. line segment on the map would represent an actual distance of 2.5 mi.
Sometimes the scale is shown as a segment on the drawing itself. For example, a scale drawing of a stop sign with a line segment that represents 25 cm of actual length is shown.
The width of the octagon in the drawing is about 3 times the length of this segment, so the actual width of the sign is about 3 ⋅ 25, or 75 cm.
Because a scale drawing is two-dimensional, some aspects of three-dimensional objects are not represented. For example, this scale drawing does not show the thickness of the stop sign.
A scale drawing may not show every detail of the actual object. However, the features that are shown correspond to the actual object and follow the specified scale.
ManuscriptCopy

Practice Problems
1. The Westland Lysander was an aircraft used by the Royal Air Force in the 1930s. Here are some scale drawings that show the top, side, and front views of the Lysander.

Use the scales and scale drawings to approximate the actual lengths of:
a. the wingspan of the plane, to the nearest foot (ft.)
b. the height of the plane, to the nearest ft.
c. the length of the Lysander Mk. I, to the nearest m.
2. A blueprint for a building includes a rectangular room that measures 3 in. long and 5.5 in. wide. The scale for the blueprint says that 1 in. on the blueprint is equivalent to 10 ft. in the actual building. What are the dimensions of this rectangular room in the actual building?
3. Here is a scale map of Lafayette Square, a rectangular garden north of the White House.
a. The scale is shown in the lower right corner. Find the actual side lengths of Lafayette Square in ft.

b. Use an inch ruler to measure the line segment of the graphic scale. About how many ft. does 1 in. represent on this map?
Review Problems
4. Here is Triangle A. Lin created a scaled copy of Triangle A with an area of 72 sq. units.
a. How many times larger is the area of the scaled copy compared to that of Triangle A?
b. What scale factor did Lin apply to the Triangle A to create the copy?
ManuscriptCopy
c. What is the length of the bottom side of the scaled copy?
Unit 1, Lesson 8: Creating Scale Drawings
Warm-Up: Appropriate Measurements
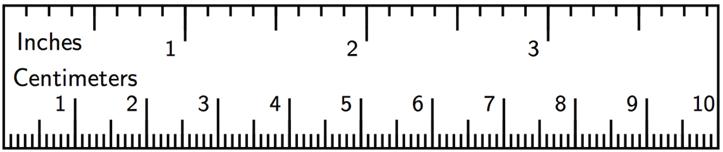
1. If a student uses a ruler like this to measure the length of their foot, which choices would be appropriate measurements? Select all that apply. Be prepared to explain your reasoning.
□ 9 1 4 inches (in.)
□ 9 5 64 in.
□ 23.47659 centimeters (cm)
□ 23.5 cm
□ 23.48 cm
ManuscriptCopy
2. Here is a scale drawing of an average seventh-grade student’s foot next to a scale drawing of a foot belonging to the person with the largest feet in the world. Estimate the length of the larger foot.

Exploration Activity: Bedroom Floor Plan
Here is a rough sketch of Noah’s bedroom (not a scale drawing).
Noah wants to create a floor plan that is a scale drawing.
1. The actual length of Wall C is 4 meters (m). To represent Wall C, Noah draws a segment 16 cm long. What scale is he using? Explain or show your reasoning

2. Find another way to express the scale.
3. Discuss your thinking with your partner. How do your scales compare?
ManuscriptCopy
4. The actual lengths of Wall A and Wall D are 2.5 m and 3.75 m. Determine how long these walls will be on Noah’s scale floor plan. Explain or show your reasoning.
Guided Activity: Two Maps of Utah
A rectangle around Utah is about 270 miles (mi.) wide and about 350 mi. tall. The upper right corner that is missing is about 110 mi. wide and about 70 mi. tall.
1. Make a scale drawing of Utah where 1 cm represents 50 mi.
Make a scale drawing of Utah where 1 cm represents 75 mi.
2. How do the two drawings compare? How does the choice of scale influence the drawing?
ManuscriptCopy
Lesson Summary
If a scale drawing is created of a room’s floor plan using the scale 1 in. to 4 feet (ft.), the actual lengths in the room, in ft., are divided by 4 to find the corresponding lengths, in in., for the drawing.
For example, if the longest wall is 15 ft. long, a line that is 3.75 in. long is used to represent this wall in the scale drawing, as shown, because 15 ÷ 4 = 3.75.


There is more than 1 way to express this scale. The 3 scales shown are all equivalent since they represent the same relationship between lengths on the drawing and the actual lengths.
• 1 in. to 4 ft.
• 1 2 in. to 2 ft.
• 1 4 in. to 1 ft.
Any of these scales can be used to find actual lengths and scaled lengths. For instance, any of the equivalent scales can be used to determine a wall that is 8 ft. long should be 2 in. long on the drawing because 1 4 ÷ 8 = 2.
The size of a scale drawing is influenced by the choice of scale. For example, another scale drawing of the same room is shown using the scale 1 in. to 8 ft.
Notice this drawing is smaller than the previous one. Since 1 in. on this drawing represents twice as much actual distance, each side length only needs to be half as long as it was in the first scale drawing.

Practice Problems
1. An image of a book shown on a website is 1.5 in. wide and 3 in. tall on a computer monitor. The actual book is 9 in. wide.
a. What scale is being used for the image?
b. How tall is the actual book?
2. The flag of Colombia is a rectangle that is 6 ft. long with three horizontal strips.
• The top stripe is 2 ft. tall and is yellow.
• The middle stripe is 1 ft. tall and is blue.
• The bottom stripe is also 1 ft. tall and is red.

a. Create a scale drawing of the Colombian flag with a scale of 1 cm to 2 ft.
b. Create a scale drawing of the Colombian flag with a scale of 2 cm to 1 ft.
ManuscriptCopy
3. A map of a park has a scale of 1 in. to 1,000 ft. Another map of the same park has a scale of 1 in. to 500 ft. Which map is larger? Explain or show your reasoning.
Review Problems
4. Triangle DEF is a scaled copy of triangle ABC.
For each of the following parts of triangle ABC, identify the corresponding part of triangle DEF.

a. Angle ������:
b. Angle ������:
c. Segment ����:
d. Segment ����:
5. A local park is in the shape of a square. A map of the local park is made with the scale 1 in. to 200 ft.
a. If the park is shown as a square on the map, each side of which is one foot long, how long is each side of the square park?
b. If a straight path in the park is 900 feet long, how long would the path be when represented on the map?
Unit 1, Lesson 9: Scales without Units
Warm-Up: One to One Hundred
A map of a park says its scale is 1 to 100.
1. What do you think that means?
2. Give an example of how this scale could tell us about measurements in the park.
Exploration Activity: Apollo Lunar Module
Your teacher will give you a drawing of the Apollo Lunar Module. It is drawn at a scale of 1 to 50.
1. The “legs” of the spacecraft are its landing gear. Use the drawing to estimate the actual length of each leg on the sides. Write your answer to the nearest 10 centimeters (cm). Explain or show your reasoning.
2. Use the drawing to estimate the actual height of the Apollo Lunar Module to the nearest 10 cm. Explain or show your reasoning.
3. Neil Armstrong was 71 inches (in.) tall when he went to the surface of the moon in the Apollo Lunar Module. How tall would he be in the drawing if he were drawn with his height to scale? Show your reasoning.
4. Sketch a stick figure to represent yourself standing next to the Apollo Lunar Module. Make sure the height of your stick figure is to scale. Show how you determined your height on the drawing.
Guided Activity: Same Drawing, Different Scales
A rectangular parking lot is 120 feet (ft.) long and 75 ft. wide.
• Lin made a scale drawing of the parking lot at a scale of 1 in. to 15 ft. The drawing she produced is 8 in. by 5 in.
• Diego made another scale drawing of the parking lot at a scale of 1 to 180. The drawing he produced is also 8 in. by 5 in.
1. Explain or show how each scale would produce an 8 in. by 5 in. drawing.
ManuscriptCopy
2. Make another scale drawing of the same parking lot at a scale of 1 in. to 20 ft. Be prepared to explain your reasoning.
3. Express the scale of 1 in. to 20 ft. as a scale without units. Explain your reasoning.
Lesson Summary
In some scale drawings, the scale specifies 1 unit for the distances on the drawing and a different unit for the actual distances represented. For example, a drawing could have a scale of 1 cm to 10 kilometers (km).
In other scale drawings, the scale does not specify any units at all. For example, a map may simply say the scale is 1 to 1,000. In this case, the units for the scaled measurements and actual measurements can be any unit, so long as the same unit is being used for both. So if a map of a park has a scale of 1 to 1,000, then 1 in. on the map represents 1,000 in. in the park, and 12 cm on the map represents 12,000 cm in the park. In other words, 1,000 is the scale factor that relates distances on the drawing to actual distances, and 1 1,000 is the scale factor that relates an actual distance to its corresponding distance on the drawing.
A scale with units can be expressed as a scale without units by converting 1 measurement in the scale into the same unit as the other. In such cases, usually the unit used in the drawing is used. For example, the 3 scales listed are equivalent.
• 1 in. to 200 ft.
• 1 in. to 2,400 in. (because there are 12 in. in 1 ft., and 200 ⋅ 12 = 2,400)
• 1 to 2,400
The last scale communicates that all the actual distances are 2,400 times their corresponding distances on the drawing, and distances on the drawing are 1 2,400 times the actual distances they represent.
Practice Problems
1. A scale drawing of a car is presented in the following three scales. Order the scale drawings from smallest to largest. Explain your reasoning. (There are about 1.1 yards (yd.) in a meter (m), and 2.54 cm in an in.)
• 1 in. to 1 ft.
• 1 in. to 1 m
• 1 in. to 1 yd.
2. Which scales are equivalent to 1 in. to 1 ft.? Select all that apply.
□ 1 to 12
□ 1 12 to 1
□ 100 to 0.12
□ 5 to 60
□ 36 to 3
□ 9 to 108
3. A model airplane is built at a scale of 1 to 72. If the model plane is 8 in. long, how many ft. long is the actual airplane?
Review Problems
4. Quadrilateral A has side lengths 3, 6, 6, and 9. Quadrilateral B is a scaled copy of A with a shortest side length equal to 2. Jada says, “Since the side lengths go down by 1 in this scaling, the perimeter goes down by 4 in total.” Do you agree with Jada? Explain your reasoning.
5. Polygon B is a scaled copy of Polygon A using a scale factor of 5. Polygon A’s area is what fraction of Polygon B’s area?
6. Figures R, S, and T are all scaled copies of one another. Figure S is a scaled copy of R using a scale factor of 3. Figure T is a scaled copy of S using a scale factor of 2. Find the scale factors for each of the following:
a. From T to S:
b. From S to R:
c. From R to T:
d. From T to R:
ManuscriptCopy
Unit 1, Lesson 10: Units in Scale Drawings
Warm-Up: Centimeters in a Mile
1. There are 2.54 centimeters (cm) in an inch (in.), 12 in. in a foot (ft.), and 5,280 ft. in a mile (mi.).
a. Circle the expression that represents the number of cm in a mi.
b. Explain your reasoning.
Exploration Activity: Scaled Card Sort
Your teacher will give you some cards with a scale on each card.
1. Sort the cards into sets of equivalent scales. Be prepared to explain how you know that the scales in each set are equivalent. Each set should have at least two cards.
2. Trade places with another group and check each other’s work. If you disagree about how the scales should be sorted, work to reach an agreement.
Pause here so your teacher can review your work.
3. Next, record one of the sets with three equivalent scales and explain why they are equivalent.
Guided Activity: The World’s Largest Flag
As of 2016, Tunisia holds the world record for the largest version of a national flag. It was almost as long as four soccer fields. The flag has a circle in the center, a crescent moon inside the circle, and a star inside the crescent moon.
1. Complete the table. Explain or show your reasoning.
2. Complete each scale with the value that makes it equivalent to the scale of 1 to 2,000. Explain or show your reasoning.
a. 1 cm to cm
b. 1 cm to m
c. 1 cm to kilometers (km)
d. 2 m to m e. 5 cm to m
cm to 1,000 m g. millimeters (mm) to 20 m
a. What is the area of the large flag?
b. What is the area of the smaller flag?
c. The area of the large flag is how many times the area of the smaller flag?
Collaborative Activity: Pondering Pools
Your teacher will give you a floor plan of a recreation center.
1. What is the scale of the floor plan if the actual side length of the square pool is 15 m? Express your answer both as a scale with units and without units.
2. Find the actual area of the large rectangular pool. Show your reasoning.
3. The kidney-shaped pool has an area of 3.2 square centimeters (sq. cm) on the drawing. What is its actual area? Explain or show your reasoning.
Lesson Summary
Sometimes scales come with units, and sometimes they don't. For example, a map of Nebraska may have a scale of 1 mm to 1 km. This means that each mm of distance on the map represents 1 km of distance in Nebraska. Notice that there are 1,000 mm in 1 m and 1,000 m in 1 km. This means there are 1,000 · 1,000, or 1,000,000 mm in 1 km. So, the same scale without units is 1 to 1,000,000, which means that each unit of distance on the map represents 1,000,000 units of distance in Nebraska. This is true for any choice of unit to express the scale of this map.
Sometimes when a scale comes with units, it is useful to rewrite it without units. For example, suppose a different map of Rhode Island is being used to compare the size of Nebraska and Rhode Island. It is important to know if the maps are at the same scale. The scale of the map of Rhode Island is 1 in. to 10 mi. There are 5,280 ft. in 1 mi., and 12 in. in 1 ft., so there are 63,360 in. in 1 mi. because 5,280 ⋅ 12 = 63,360. Therefore, there are 633,600 in. in 10 mi. The scale of the map of Rhode Island without units is 1 to 633,600. The two maps are not at the same scale, so they should not be used to compare the size of Nebraska to the size of Rhode Island.
Unit conversions will be revisited later in this course. In the meantime, some helpful information about equal lengths in both the customary and metric systems are shown.
Customary Units
1 ft. = 12 in.
1 yard (yd.) = 36 in.
1 yd. = 3 ft.
ManuscriptCopy
Metric Units
1 mi. = 5,280 ft. 1 m = 1,000 mm 1 m = 100 cm 1 km = 1,000 m
Equal Lengths in Different Systems
1 in. ≈ 2.54 cm
1 ft. ≈ 0.305 m
1 mi. ≈ 1.61 km
Practice Problems
1. The Empire State Building in New York City is about 1,450 ft. high (including the antenna at the top) and 400 ft. wide. Andre wants to make a scale drawing of the front view of the Empire State Building on an 8 1 2 in. by 11 in. piece of paper.
a. Circle a scale that you think is the most appropriate for the scale drawing.
b. Explain your reasoning.
2. Elena finds that the area of a house on a scale drawing is 25 square inches (sq. in.). The actual area of the house is 2,025 square feet (sq. ft.). What is the scale of the drawing?
3. Which of these scales are equivalent to 3 cm to 4 km? Select all that apply. Recall that 1 in. is 2.54 cm.
□ 0.75 cm to 1 km
□ 1 cm to 12 km
□ 6 mm to 2 km
□ 0.3 mm to 40 m
□ 1 inch to 7.62 km
Review Problems
4. These two triangles are scaled copies of one another. The area of the smaller triangle is 9 square units. What is the area of the larger triangle? Explain or show how you know.

5. Water costs $1.25 per bottle. At this rate, what is the cost of:
a. 10 bottles?
b. 20 bottles?
c. 50 bottles?
6. The first row of the table shows the amount of dish detergent and water needed to make a soap solution.
a. Complete the table for 2, 3, and 4 batches.
Batches
ManuscriptCopy
b. How much water and detergent are needed for 8 batches? Explain your reasoning.
ManuscriptCopy
ManuscriptCopy
Unit 2, Lesson 1: Introducing Proportional Relationships with
Tables
Warm-Up: Paper Towels by the Case
Here is a table that shows how many rolls of paper towels a store receives when they order different numbers of cases.

What do you notice about the table? What do you wonder?
ManuscriptCopy

Exploration Activity: Proportional Relationships
1. A recipe says that 2 cups (c.) of dry rice will serve 6 people. Complete the table as you answer the questions. Be prepared to explain your reasoning.
a. How many people will 10 c. of rice serve?
b. How many c. of rice are needed to serve 45 people?
2. A recipe says that 6 spring rolls will serve 3 people.
a. Complete the table.
b. Describe the method(s) you used to complete the table.
ManuscriptCopy
3. A bakery uses 8 tablespoons (tbsp.) of honey for every 10 c. of flour to make bread dough. Some days they bake bigger batches, and some days they bake smaller batches, but they always use the same ratio of honey to flour. Complete the table as you answer the questions. Be prepared to explain your reasoning.
a. How many c. of flour do they use with 20 tbsp. of honey?
b. How many c. of flour do they use with 13 tbsp. of honey?
c. How many tbsp. of honey do they use with 20 c. of flour?
Two ratios are equivalent if you can multiply each of the numbers in the first ratio by the same factor to get the numbers in the second ratio. A proportional relationship is a collection of pairs of numbers that are in equivalent ratios.
d. Explain why the table represents a proportional relationship.
ManuscriptCopy
Collaborative Activity: Quarters and Dimes
Four quarters are equal in value to 10 dimes.
1. How many dimes equal the value of 6 quarters?
2. How many dimes equal the value of 14 quarters?
3. What value belongs next to the 1 in the table? What does it mean in this context?
ManuscriptCopy
Lesson Summary
If the ratios between 2 corresponding quantities are always equivalent, the relationship between the quantities is called a proportional relationship.
Two ratios are equivalent if you can multiply each of the numbers in the first ratio by the same factor to get the numbers in the second ratio.
A proportional relationship is a collection of pairs of numbers that are in equivalent ratios.
This table shows different amounts of milk, in c., and chocolate syrup, in tbsp. The ingredients in each row, when mixed together, would make a different total amount of chocolate milk, but these mixtures would all taste the same.
Notice that each row in the table shows a ratio of tbsp. of chocolate syrup to c. of milk that is equivalent to 4 ∶ 1.
The relationship between the quantities represented by the table can be described in multiple ways.
• The relationship between the amount of chocolate syrup and the amount of milk is proportional.
• The relationship between the amount of chocolate syrup and the amount of milk is a proportional relationship.
• The table represents a proportional relationship between the amount of chocolate syrup and the amount of milk.
• The amount of milk is proportional to the amount of chocolate syrup.
Any value in the chocolate syrup column can be multiplied by 1 4 , to get the corresponding value in the milk column. In prior courses, 1 4 , was referred to as a unit rate because 1 4 , c. of milk is needed per 1 tbsp. of chocolate syrup. The value 1 4 , can
also be referred to as the constant of proportionality for this relationship. It indicates how many cups of milk need to be mixed with 1 tbsp. of chocolate syrup to make chocolate milk with the same taste.
In a proportional relationship, the values of one quantity are each multiplied by the same number to get the values of the other quantity. This number is called the constant of proportionality.
Practice Problems
1. When Shawn makes chocolate milk, he mixes 2 c. of milk with 3 tbsp. of chocolate syrup. The table shows how to make batches of different sizes of his recipe.


Use the information in the table and the bank provided to complete each statement. Some phrases or values are used more than once.
a. The table shows a proportional relationship between and .
b. The scale factor shown is .
ManuscriptCopy
c. The constant of proportionality for this relationship is .
d. The units for the constant of proportionality are per
2. A certain shade of pink is created by adding 3 c. of red paint to 7 c. of white paint.
a. How many cups of red paint should be added to 1 c. of white paint?
b. What is the constant of proportionality?
Review Problems
a. What is the actual area of the park? Show how you know.
b. The map needs to be reproduced at a different scale so that it has an area of 6 square inches (sq. in.) and can fit in a brochure. At what scale should the map be reproduced so that it fits on the brochure? Show your reasoning. Cups of White Paint Cups of Red Paint 1 7 3
ManuscriptCopy
3. A map of a rectangular park has a length of 4 inches (in.) and a width of 6 in. It uses a scale of 1 in. for every 30 miles (mi.).
4. Noah drew a scaled copy of Polygon P and labeled it Polygon Q.
If the area of Polygon P is 5 square units (sq. units), what scale factor did Noah apply to Polygon P to create Polygon Q? Explain or show how you know.

5. Select all the ratios that are equivalent to each other.
ManuscriptCopy
Unit 2, Lesson 2: More about Constant of Proportionality
Warm-Up: Equal Measures
Use the numbers and units from the list to find as many equivalent measurements as you can. For example, you might write “30 minutes is 1 2 hour.”
You can use the numbers and units more than once.
ManuscriptCopy
Exploration Activity: Centimeters and Millimeters
There is a proportional relationship between any length measured in centimeters and the same length measured in millimeters.

There are two ways of thinking about this proportional relationship.
1. If you know the length of something in cm, you can calculate its length in mm.
a. Complete the table.
b. What is the constant of proportionality?
2. If you know the length of something in mm, you can calculate its length in cm.
a. Complete the table.
b. What is the constant of proportionality?
ManuscriptCopy
3. How are these two constants of proportionality related to each other?
4. Complete each sentence.
a. To convert from cm to mm, you can multiply by .
b. To convert from mm to cm, you can divide by or multiply by .

Guided Activity: Pittsburgh to Phoenix
As a plane traveled from New York to San Diego, it flew over Pittsburgh, Saint Louis, Albuquerque, and Phoenix, traveling at a constant speed.
The table shows the time elapsed and distance covered as the plane traveled between cities.

1. Complete each statement.
a. The ratio of distance to time from Pittsburgh to Saint Louis is : .
b. The ratio of distance to time from Saint Louis to Albuquerque is : , which is equivalent to : 1.
c. The ratio of distance to time from Albuquerque to Phoenix is : , which is equivalent to : 1.
d. Therefore, the constant of proportionality is . hr. per mi. mi. per hr.
2. Describe the proportional relationship represented by this table.
The speed of an object can be determined by the ratio of distance to time.
3. Describe how the constant of proportionality calculated in problem 1 relates to speed.
4. Oliver says that 1 550 is also a constant of proportionality for the relationship.
a. Explain why Oliver is correct.
b. Complete the statements.
The constant of proportionality 550 mi. 1 hr. can be used to determine the time distance the plane travels given time. distance.
The constant of proportionality 1 hr 550 mi. can be used to determine the time distance the plane travels given time. distance.
Lesson Summary
When something is traveling at a constant speed, there is a proportional relationship between the distance it travels and the time it takes. The table shows the distance traveled, in cm, and elapsed time, in seconds (sec.), for a bug crawling on a sidewalk.
• Each value in the first column can be multiplied by 2 3 to get the corresponding number in the second column. This means that the elapsed time is proportional to the distance traveled, and the constant of proportionality is 2 3 . The bug’s pace is 2 3 sec. per cm.
• Alternatively, each value in the second column can be multiplied by 3 2 to get the corresponding number in the first column. This means that the distance traveled is proportional to the elapsed time, and the constant of proportionality is 3 2 . The bug’s speed is 3 2 cm per sec.
Notice that 3 2 is the reciprocal of 2 3 . When 2 quantities are in a proportional relationship, there are 2 constants of proportionality, and they are always reciprocals of each other. Both constants can be used to describe the relationship in terms of the quantities.
The constant of proportionality is a unit rate. It can be determined using the ratio of �� �� or �� �� for the 2 quantities in the relationship, �� and ��. Typically, when a proportional
relationship is represented by a table of values, the quantity in the second column (or row, if it is a horizontal table) is described as proportional to the quantity in the first column (or row, if it is a horizontal table), and the corresponding constant of proportionality is the number that each value in the first column must be multiplied by in order to get the value in the second column.


Practice Problems
1. Noah is running a portion of a marathon at a constant speed of 6 miles per hour (mph).
Complete the table to predict how long it would take him to run different distances at that speed, and how far he would run in different time intervals.
2. One kilometer is 1,000 m.
a. Complete the tables. What is the interpretation of the constant of proportionality in each case?
The constant of proportionality tells us:
of proportionality tells us:
b. What is the relationship between the two constants of proportionality?
3. Jada and Lin are comparing inches and feet. Jada says that the constant of proportionality is 12. Lin says it is 1 12 . Do you agree with either of them? Explain your reasoning.
Review Problems
4. The area of the Mojave Desert is 25,000 square miles (sq. mi.). A scale drawing of the Mojave Desert has an area of 10 square inches (sq. in.). What is the scale of the map?
5. Which of these scales is equivalent to the scale 1 cm to 5 km? Select all that apply.
□ 3 cm to 15 km
□ 1 mm to 150 km
□ 5 cm to 1 km
□ 5 mm to 2.5 km
□ 1 mm to 500 m
6. Which one of these pictures is not like the others? Explain what makes it different using ratios.
ManuscriptCopy


ManuscriptCopy
Unit 2, Lesson 3: Proportional Relationships and Equations
Warm-Up: Division
Find each quotient mentally.
ManuscriptCopy
Exploration Activity: Feeding a Crowd, Revisited
1. A recipe says that 2 cups (c.) of dry rice will serve 6 people. Complete the table as you answer the questions. Be prepared to explain your reasoning.
a. How many people will 1 c. of rice serve?
b. How many people will 3 c. of rice serve? 12 c.? 43 c.?
c. How many people will �� c. of rice serve?
2. A recipe says that 6 spring rolls will serve 3 people. Complete the table as you answer the questions. Be prepared to explain your reasoning.
a. How many people will 1 spring roll serve?
b. How many people will 10 spring rolls serve? 16 spring rolls? 25 spring rolls?
c. How many people will �� spring rolls serve?
3. How was completing this table different from the previous table? How was it the same?
Guided Activity: Denver to Chicago
A plane flew at a constant speed, in miles per hour (mph), between Denver, Colorado, and Chicago, Illinois. It took the plane 1.5 hours (hr.) to fly 915 miles (mi.).

1. Complete the table.
2. How far does the plane fly in 1 hr.?
3. How far would the plane fly in �� hr. at this speed?
4. If �� represents the distance that the plane flies at this speed for �� hr., write an equation that relates �� and ��.
5. Use the equation written in problem 4 to answer each question. Show your work.
a. How far would the plane fly in 3 hr. at this speed?
ManuscriptCopy
b. How far would the plane fly in 3.5 hr. at this speed?
Collaborative Activity: Revisiting Bread Dough
A bakery uses 8 tablespoons (tbsp.) of honey for every 10 c. of flour to make bread dough. Some days they bake bigger batches, and some days they bake smaller batches, but they always use the same ratio of honey to flour.
1. Complete the table.
2. If �� is the number of cups of flour needed for ℎ tbsp. of honey, write an equation that relates �� and ℎ.
3. How much flour is needed for 15 tbsp. of honey? 17 tbsp.? Explain or show your reasoning.
Lesson Summary
The table shows the amount of red paint and blue paint needed to make a certain shade of purple paint called Venusian Sunset.
Note that “parts” can be any unit for volume. Mixing 3 c. of red with 12 c. of blue will result in the same shade as mixing 3 teaspoons (tsp.) of red with 12 tsp. of blue.
The last row in the table shows that if the amount of red paint needed, ��, is known, it can be multiplied by 4 to find the amount of blue paint needed, ��, to mix with it to make Venusian Sunset. This relationship can be represented by the equation �� = 4��. So, the amount of blue paint is proportional to the amount of red paint, and the constant of proportionality is 4.
The same relationship can be described in the reverse.
The amount of blue paint needed, ��, can be multiplied by 1 4 to find the amount of red paint needed, ��, to mix with it to make Venusian Sunset. Therefore, �� = 1 4 ��, which means the amount of blue paint is proportional to the amount of red paint, and the constant of proportionality is 1 4 .
In general, when �� is proportional to ��, the value of �� can always be multiplied by the same number, ��, to get ��. The equation �� = ���� represents any proportional relationship, where �� is the constant of proportionality.
Practice Problems
1. A certain ceiling is made up of tiles. Every square meter of ceiling requires 10.75 tiles. Fill in the table with the missing values.
2. On a flight from New York to London, an airplane travels at a constant speed. An equation relating the distance traveled in mi., ��, to the number of hr. flying, ��, is �� = 1
500 ��. How long will it take the airplane to travel 800 mi.?
3. Each table represents a proportional relationship. For each, find the constant of proportionality, and write an equation that represents the relationship.
Constant of proportionality:
Constant of proportionality:
Equation: �� =
Review Problems
Equation: �� =
4. A map of Colorado says that the scale is 1 in. to 20 mi. or 1 to 1,267,200. Are these two ways of reporting the scale the same? Explain your reasoning.
5. Here is a polygon on a grid.
a. Draw a scaled copy of the polygon using a scale factor 3. Label the copy A.
b. Draw a scaled copy of the polygon with a scale factor 1 2 . Label it B.
c. Is Polygon A a scaled copy of Polygon B? If so, what is the scale factor that takes B to A?
ManuscriptCopy

Unit 2, Lesson 4: Two Equations for Each Relationship
Warm-Up: Missing Figures
Here are the second and fourth figures in a pattern.

1. What do you think the first and third figures in the pattern look like?
2. Describe the 10th figure in the pattern.
ManuscriptCopy
Exploration Activity: Meters and Centimeters
There are 100 centimeters (cm) in every meter (m).
1. Complete each of the tables.
Table 1
2
2. For each table, find the constant of proportionality.
Table 1:
Table 2:
3. What is the relationship between these constants of proportionality?
4. For each table, write an equation for the proportional relationship. Let �� represent a length measured in m and �� represent the same length measured in cm.
Table 1:
Table 2:
Collaborative Activity: Filling a Water Cooler
It took Priya 5 minutes (min.) to fill a cooler with 8 gallons (gal.) of water from a faucet that was flowing at a steady rate. Let �� be the number of gal. of water in the cooler after �� min.
1. Which of the following equations represent the relationship between �� and ��? Select all that apply.
□ �� = 1.6��
□ �� = 0.625��
□ �� = 1.6��
□ �� = 0.625��
2. What does 1.6 tell you about the situation?
3. What does 0.625 tell you about the situation?
4. Priya changed the rate at which water flowed through the faucet. Write an equation that represents the relationship of �� and �� when it takes 3 min. to fill the cooler with 1 gal. of water.
5. Was the cooler filling faster before or after Priya changed the rate of water flow? Explain how you know.
Guided Activity: Feeding Shrimp
At an aquarium, a shrimp is fed 1 5 gram (g) of food each feeding and is fed 3 times each day.
1. How much food does a shrimp get fed in one day?
2. Complete the table to show how many g of food the shrimp is fed over different numbers of days.

3. What is the constant of proportionality? What does it tell us about the situation?
4. If we switched the columns in the table, what would be the constant of proportionality? Explain your reasoning.
5. Use �� for number of days and �� for amount of food in g that a shrimp eats to write two equations that represent the relationship between �� and ��.
Equation 1:
Equation 2:
6. If a tank has 10 shrimp in it, how much food is added to the tank each day?
7. If the aquarium manager has 300 g of shrimp food for this tank of 10 shrimp, how many days will it last? Explain or show your reasoning.
Lesson Summary
If Asher rides his bike at a constant speed of 10 miles per hour (mph), his distance in miles (mi.), ��, is proportional to the number of hours (hr.), ��, that he biked for. This relationship can be represented by the equation shown.
�� = 10��
With this equation, it’s easy to find the distance Asher biked when given how long it took him, because the time, in hours, can just be multiplied by 10.
The equation can also be rewritten in terms of ��, as shown.
= 10��
This version of the equation shows that the amount of time he spent biking is proportional to the distance he traveled, with a constant of proportionality of 1 10 hr. per mi. This form is easier to use when given the distance traveled and needing to find the time it took because the distance, in miles, can just be multiplied by 1 10 .
When 2 quantities �� and �� are in a proportional relationship, the equation �� = ���� can be used to say “�� is proportional to ��.” In this case, the number �� is the corresponding constant of proportionality. The equation can also be written in the form �� = 1 �� �� to say “ �� is proportional to ��.” In this case, 1 �� is the corresponding constant of proportionality. Each equation can be useful depending on the given information and the unknown quantity that needs to be determined.
While 2 equations can be written to represent any proportional relationship, equations are most commonly written in terms of �� in the form �� = ����, where �� is the independent variable, �� is the dependent variable, and �� is the constant of proportionality, �� �� .
Practice Problems
1. The table represents the relationship between a length measured in m and the same length measured in kilometers (km).
a. Complete the table.
b. Write an equation for converting the number of m to km. Use �� for number of m and �� for number of km.
2. Concrete building blocks weigh 28 pounds (lb.) each. Using �� for the number of concrete blocks and �� for the weight, write two equations that relate the two variables. One equation should begin with �� = and the other should begin with �� =.
Equation 1:
Equation 2:
3. A store sells rope by the meter. The equation �� = 0.8�� represents the price ��, in dollars, of a piece of nylon rope that is �� m long.
a. How much does the nylon rope cost per m?
ManuscriptCopy
b. How long is a piece of nylon rope that costs $1.00?
4. The table represents a proportional relationship. Find the constant of proportionality and write an equation to represent the relationship.
Constant of proportionality:
Equation: �� =
5. On a map of Chicago, 1 cm represents 100 m. Select all the statements that express the same scale.
□ 5 cm on the map represents 50 m in Chicago.
□ 1 millimeter (mm) on the map represents 10 m in Chicago.
□ 1 km in Chicago is represented by 10 cm the map.
□ 100 cm in Chicago is represented by 1 m on the map.
ManuscriptCopy
Unit 2, Lesson 5: Using Equations to Solve Problems
Warm-Up: Quotients with Decimal Points
1. Without calculating, order the quotients of these expressions from least to greatest.
2. Place the decimal point in the appropriate location in the quotient: 42.6 ÷ 7 = 608571
3. Use this answer to find the quotient of one of the previous expressions.
Exploration Activity: Concert Ticket Sale
A performer expects to sell 5,000 tickets for an upcoming concert. They want to make a total of $311,000 in sales from these tickets.
1. Assuming that all tickets have the same price, what is the price for one ticket?
2. How much will they make if they sell 7,000 tickets?
3. How much will they make if they sell 10,000 tickets? 50,000? 120,000? a million? �� tickets?
4. If they make $404,300, how many tickets have they sold?
5. How many tickets will they have to sell to make $5,000,000?
Collaborative Activity: Recycling
Aluminum cans can be recycled instead of being thrown in the garbage. The weight of 10 aluminum cans is 0.16 kilograms (kg). The aluminum in 10 cans that are recycled has a value of $0.14.
1. If a family threw away 2.4 kg of aluminum in a month, how many cans did they throw away? Explain or show your reasoning.
2. What would be the recycled value of those same cans? Explain or show your reasoning.
3. Write an equation to represent the number of cans �� given their weight ��.
4. Write an equation to represent the recycled value �� of �� cans.
5. Write an equation to represent the recycled value �� of �� kg of aluminum.
Lesson Summary
Remember that if there is a proportional relationship between 2 quantities, the relationship can be represented by an equation in the form �� = ����. Sometimes, writing an equation is the easiest way to solve a problem.
For example, Denali, the highest mountain peak in North America, is 20,300 feet (ft.) above sea level. How many miles (mi.) is that?
There are 5,280 ft. in 1 mi. This relationship can be represented by the equation �� = 5,280��, where �� represents a distance measured in ft. and �� represents the same distance measured in mi. The equation can then be used to determine the distance of Denali above sea level, in mi., as shown.
20,310 = 5,280��
So �� = 20,310 5,280 , which is approximately 3.85 mi.
Practice Problems
1. A car is traveling down a highway at a constant speed, described by the equation �� = 65��, where �� represents the distance, in mi., that the car travels at this speed in �� hours (hr).
a. What does the 65 tell us in this situation?
b. How many mi. does the car travel in 1.5 hr.?
c. How long does it take the car to travel 26 mi. at this speed?
2. Elena has some bottles of water that each hold 17 fluid ounces (fl. oz.).
a. Write an equation that relates the number of bottles of water, ��, to the total volume of water, ��, in fluid ounces.
b. How much water is in 51 bottles?
c. How many bottles does it take to hold 51 fl. oz. of water?
Review Problems
3. There are about 1.61 kilometers (km) in 1 mi. Let �� represent a distance measured in km and �� represent the same distance measured in mi. Write two equations that relate a distance measured in km and the same distance measured in mi.
Equation 1:
Equation 2:
4. In Canadian coins, 16 quarters are equal in value to 2 toonies.
a. Complete the table.
b. What does the value next to 1 mean in this situation?
5. Each table represents a proportional relationship. For each table:
a. Fill in the missing parts of the table.
b. Draw a circle around the constant of proportionality.
ManuscriptCopy
6. Describe some things you could notice in two polygons that would help you decide that they were not scaled copies.
Unit 2, Lesson 6: Solving Problems about Proportional Relationships
Warm-Up: What Do You Want to Know?
Consider the problem: A person is running a distance race at a constant rate. What time will they finish the race?
What information would you need to be able to solve the problem?
Collaborative Activity: Info Gap: Biking and Rain
Your teacher will give you either a problem card or a data card. Do not show or read your card to your partner.
If your teacher gives you the problem card:
1. Silently read your card and think about what information you need to be able to answer the question.
2. Ask your partner for the specific information that you need.
3. Explain how you are using the information to solve the problem. Continue to ask questions until you have enough information to solve the problem.
4. Share the problem card and solve the problem independently.
5. Read the data card and discuss your reasoning.
If your teacher gives you the data card:
1. Silently read your card.
2. Ask your partner “What specific information do you need?” and wait for your partner to ask for information.
If your partner asks for information that is not on the card, do not do the calculations for them. Tell them you don’t have that information.
3. Before sharing the information, ask “Why do you need that information?” Listen to your partner’s reasoning and ask clarifying questions.
4. Read the problem card and solve the problem independently.
5. Share the data card and discuss your reasoning.
Pause here so your teacher can review your work. Ask your teacher for a new set of cards and repeat the activity, trading roles with your partner.
Exploration Activity: Moderating Comments
A company is hiring people to read through all the comments posted on their website to make sure they are appropriate. Four people applied for the job and were given one day to show how quickly they could check comments.
• Person 1 worked for 210 minutes (min.) and checked a total of 50,000 comments.
• Person 2 worked for 200 min. and checked 1,325 comments every 5 min.
• Person 3 worked for 120 min., at a rate represented by �� = 331��, where �� is the number of comments checked and �� is the time in min.
• Person 4 worked for 150 min., at a rate represented by �� = � 3 800
1. Order the people from greatest to least in terms of total number of comments checked.
2. Order the people from greatest to least in terms of how fast they checked the comments.
ManuscriptCopy
Lesson Summary
A situation involving constant rates often indicates there is a proportional relationship between the quantities of interest.
• When a bird is flying at a constant speed, there is a proportional relationship between the flying time and distance flown.
• If water is filling an empty tub at a constant rate, then there is a proportional relationship between the amount of water in the tub and the time the tub has been filling for.
• If an aardvark is eating termites at a constant rate, then there is a proportional relationship between the number of termites the aardvark has eaten and the time since it started eating.
Sometimes, when presented with a situation, it’s not so clear whether a proportional relationship is a good model. Use the tips shown to help decide if a proportional relationship is a good representation for the situation.
• If you aren’t sure where to start, look at the quotients of corresponding values. If they aren’t always the same, then the relationship is not a proportional relationship.
• If you can see that there is a single value that 1 quantity is always multiplied by to get the other quantity, then it is a proportional relationship.
After establishing that it is a proportional relationship, setting up an equation is often the most efficient way to solve problems related to the situation.
Practice Problems
1. For each situation, explain whether you think the relationship is proportional or not. Explain your reasoning.
a. The weight of a stack of standard 8.5 × 11 copier paper vs. number of sheets of paper
ManuscriptCopy

b. The weight of a stack of different-sized books vs. the number of books in the stack.

2. Every package of a certain toy also includes 2 batteries.
a. Are the number of toys and number of batteries in a proportional relationship? If so, what are the two constants of proportionality? If not, explain your reasoning.
b. Use �� for the number of toys and �� for the number of batteries to write two equations relating the two variables.
3. Lin and her brother were born on the same date in different years. Lin was 5 years old when her brother was 2.
a. Find their ages in different years by filling in the table.
b. Is there a proportional relationship between Lin’s age and her brother’s age? Explain your reasoning.
4. A student argues that �� = �� 9 does not represent a proportional relationship between �� and �� because we need to multiply one variable by the same constant to get the other one and not divide it by a constant. Do you agree or disagree with this student?
Review Problem
5. Quadrilateral A has side lengths 3, 4, 5, and 6. Quadrilateral B is a scaled copy of Quadrilateral A with a scale factor of 2. Select all of the following that are side lengths of Quadrilateral B.
5
6
7
8
9
ManuscriptCopy
Unit 2, Lesson 7: Introducing Graphs of Proportional Relationships
Warm-Up: Notice These Points
1. Plot the points (0, 10), (1, 8), (2, 6), (3, 4), (4, 2).
2. What do you notice about the graph? x y
Exploration Activity: T-shirts for Sale
Some T-shirts cost $8 each.
1. Use the table to answer these questions.
a. What does �� represent?
b. What does �� represent?
c. Is there a proportional relationship between �� and ��?
2. Plot the pairs in the table on the coordinate plane.


3. What do you notice about the graph?
Collaborative Activity: Matching Tables and Graphs
Your teacher will give you papers showing tables and graphs.
1. Examine the graphs closely. What is the same and what is different about the graphs?
2. Sort the graphs into categories of your choosing. Label each category. Be prepared to explain why you sorted the graphs the way you did.
3. Take turns with a partner to match a table with a graph.
a. For each match you find, explain to your partner how you know it is a match.
b. For each match your partner finds, listen carefully to their explanation. If you disagree, work to reach an agreement.
Pause here so your teacher can review your work.
4. Trade places with another group. How are their categories the same as your group’s categories? How are they different?
5. Return to your original place. Discuss any changes you may wish to make to your categories based on what the other group did.
6. Which of the relationships are proportional?
7. What have you noticed about the graphs of proportional relationships? Do you think this will hold true for all graphs of proportional relationships?
Lesson Summary
One way to represent a proportional relationship is with a graph. The graph shown represents different amounts that fit the situation of “blueberries cost $6 per pound (lb.).”
Different points on the graph indicate, for example, that 2 lb. of blueberries cost $12, and 4.5 lb. of blueberries cost $27.
Sometimes it makes sense to connect the points with a line, and sometimes it doesn’t. It is possible to buy 4.5 lb. of blueberries or 1.875 lb. of blueberries, so all the points in between the whole numbers make sense in the situation. Therefore, any point on the line is meaningful.

If the graph represented the cost for different numbers of sandwiches instead of lb. of blueberries, it might not make sense to connect the points with a line because it is typically not possible to buy 4.5 sandwiches or 1.875 sandwiches.
Graphs that represent proportional relationships have certain characteristics in common:
• Points that satisfy the relationship lie on a straight line.
• The line that they lie on passes through the origin, (0, 0).
ManuscriptCopy
The origin is the point (0, 0) in the coordinate plane. This is where the horizontal and vertical axes cross.
Two graphs that do not represent proportional relationships are shown.


The points do not lie on a line. It is a line, but it doesn’t go through the origin.
Practice Problems
1. Which graph(s) could represent a proportional relationship? Explain how you decided.
ManuscriptCopy

2. A lemonade recipe calls for 1 4 cup (c.) of lemon juice for every c. of water.
Use the table to answer these questions.
a. What does �� represent?
b. What does �� represent?
c. Is there a proportional relationship between �� and ��?
d. Plot the pairs in the table on the coordinate plane.
y
3. Select all the pieces of information that would tell you �� and �� have a proportional relationship. Let �� represent the distance in feet (ft.) between a rock and a turtle’s current position, and let �� represent the time in minutes (min.) the turtle has been moving for.
□ �� = 3��
□ The turtle walks in a circle around the rock.
□ The turtle walks away from the rock at a constant rate.
□ After 4 min., the turtle has walked 12 ft. away from the rock.
□ The turtle walks for a bit, and then stops for 1 min. before walking again.
4. Decide whether each table could represent a proportional relationship. If the relationship could be proportional, what would be the constant of proportionality?
a. The sizes you can print a photo
b. The distance from which a lighthouse is visible
ManuscriptCopy
Unit 2, Lesson 8: Interpreting Graphs of Proportional Relationships
Warm-Up: What Could the Graph Represent?
Here is a graph that represents a proportional relationship.
1. Invent a situation that could be represented by this graph.
2. Label the axes with the quantities in your situation.
3. Give the graph a title.
ManuscriptCopy

4. There is a point on the graph. What are its coordinates? What does it represent in your situation?
Exploration Activity: Tyler’s Walk
Tyler was at the amusement park. He walked at a steady pace from the ticket booth to the bumper cars.
1. The point on the graph shows his arrival at the bumper cars. What do the coordinates of the point tell us about the situation?

2. The table representing Tyler’s walk shows other values of time and distance. Complete the table. Next, plot the pairs of values on the grid.
3. What does the point (0, 0) mean in this situation?
4. How far away from the ticket booth was Tyler after 1 second? Label the point on the graph that shows this information with its coordinates.
ManuscriptCopy
5. What is the constant of proportionality for the relationship between time and distance? What does it tell you about Tyler's walk? Where do you see it in the graph?
Guided Activity: Seagulls Eat What?
Four seagulls ate 10 pounds (lb.) of garbage. Assume this information describes a proportional relationship.
1. Plot a point that shows the number of seagulls and the amount of garbage they ate.


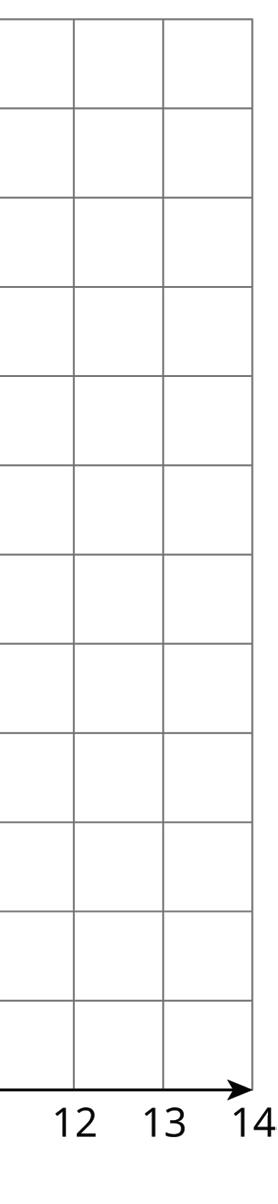
2. Use a straight edge to draw a line through this point and (0, 0).
3. Plot the point (1, ��) on the line. What is the value of ��? What does the value of �� tell you about this context?
ManuscriptCopy
Lesson Summary
For the relationship represented in the table shown, �� is proportional to ��. The constant of proportionality, 5 4 , can be determined from the table because it is the ��-value when �� = 1.
The relationship can also be represented by the equation �� = 5 4 �� and the graph shown.

If �� represents the distance, in feet (ft.), that a snail crawls in �� minutes (min.), then the point (4, 5) means that the snail can crawl 5 ft. in 4 min.
If �� represents the number of cups (c.) of yogurt and �� represents the number of teaspoons (tsp.) of cinnamon in a recipe for fruit dip, then the point (4, 5) means that 4 tsp. of cinnamon and 5 c. of yogurt can be combined to make the fruit dip.
The constant of proportionality can be identified from the graph using the point (1, ��), where �� is the constant of proportionality. When �� = 1, the ��-coordinate is 5
, so �� = 5
.
In the previous contexts described, this means either the snail is traveling 5 4 ft. per min. or that the recipe calls for 1 1 4 c. of yogurt for every tsp. of cinnamon.
In general, when �� is proportional to ��, the corresponding constant of proportionality used is the ��-value when �� = 1.
Practice Problems
1. There is a proportional relationship between the number of months a person has had a streaming movie subscription and the total amount of money they have paid for the subscription. The cost for 6 months is $47.94. The point (6, 47.94) is shown on the graph below.


a. What is the constant of proportionality in this relationship?
b. What does the constant of proportionality tell us about the situation?
c. Add at least three more points to the graph and label them with their coordinates.
d. Write an equation that represents the relationship between ��, the total cost of the subscription, and ��, the number of months.
2. The graph shows the amounts of almonds, in grams (g), for different amounts of oats, in c., in a granola mix. Label the point (1, ��) on the graph, find the value of ��, and explain its meaning.

Review Problems

3. To make a friendship bracelet, some long strings are lined up, and then 1 string is taken and tied in a knot with each of the other strings, creating a row of knots. A new string is then chosen and knotted with all the other strings to create a second row of knots. This process is repeated until there are enough rows to form a bracelet that fits around your friend’s wrist.
Is the number of knots proportional to the number of rows? Explain your reasoning.
4. What information do you need to know to write an equation relating two quantities that have a proportional relationship?
ManuscriptCopy
Unit 2, Lesson 9: Comparing Proportional Relationships
and Their Representations
Warm-Up: Number Talk: Fraction Multiplication and Division
1. Find each product or quotient mentally.
ManuscriptCopy
Exploration Activity: Modeling Running Paces
1. Nazir and Margot were running laps around the track. The coach recorded their times, in minutes (min.), at the end of laps 2, 4, 6, and 8, as shown in the tables.
a. Complete the tables to determine each runner’s pace for each row.
b. Who is running at a constant pace? Explain your reasoning.
c. Write an equation representing the relationship between distance and time for anyone who is running at a constant pace.
ManuscriptCopy
2. Diego and Jillian also ran 8 laps around the track at a constant speed, but they only recorded their times at the end of the 8 laps. Diego finished the 8 laps in 24 min., and Jillian finished the 8 laps in 28 min.
a. Determine each runner’s average pace.
Diego: laps per min.
Jillian: laps per min.
b. Complete the tables, using each runner’s average pace as the constant of proportionality.
c. Draw a graph to represent Diego’s and Jillian’s runs on the coordinate plane.
ManuscriptCopy
d. Explain how to determine which person was running faster using either the tables of values or the graphs.
e. Write an equation to represent the relationship between time, ��, and distance, ��, for Diego’s and Jillian’s runs.
Diego: Jillian:
Guided Activity: Space Rocks and the Price of Rope
1. Meteoroid Perseid 245 and asteroid x travel through the solar system. The graph shows the distance each traveled after a given point in time.
Is asteroid x traveling faster or slower than Perseid 245? Explain how you know.
asteroid x
Perseid 245
2. The graph shows the price of different lengths of two types of rope.
If you buy $1.00 of each kind of rope, which one will be longer? Explain how you know.
Price (dollars)
Length (meters)
Lesson Summary
The graphs shown on the coordinate plane represent the price of blueberries at 2 different stores. Which store has a better price?
To answer this question, compare points that have the same ��-value or the same ��-value.
• For example, the points (2, 12) and (3, 12) indicate that $12 corresponds to a greater quantity of blueberries from store B than from store A.
• Similarly, the points (3, 12) and (3, 18) indicate that 3 lb. of blueberries will cost more at store A than at store B.
Cost (dollars)
(1, 6) (1, 4) (2, 12) (3, 18)
12) nylon
ManuscriptCopy
(4.5, 27) (4.5, 18)
Weight (lb.)
Both example points demonstrate that store B has the better price.
The graphs can also be used to compare the constants of proportionality. The line representing store B goes through the point (1, 4), so the constant of proportionality is 4. This means that blueberries cost $4 per lb. at store B. This is cheaper than at store A, where the unit price is $6 per lb., represented by the point (1, 6).
cotton
Practice Problems
1. Six equations are given. Match each equation to its graph.
Low-res after increasing size


Low-res after increasing size
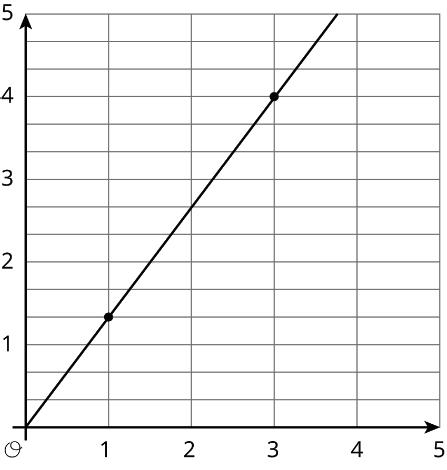
Low-res after increasing size

Low-res after increasing size
ManuscriptCopy
Low-res after increasing size


Low-res after increasing size
2. The graphs below show some data from a coffee shop menu. One of the graphs shows cost, in dollars, vs. drink volume, in ounces (oz.), and one of the graphs shows calories vs. drink volume, in oz.
a. Which graph is which? Give them the correct titles.
b. Which quantities appear to be in a proportional relationship? Explain how you know.
c. For the proportional relationship, find the constant of proportionality. What does that number mean?
ManuscriptCopy
3. Lin and Andre biked home from school at a steady pace. Lin biked 1.5 kilometers (km) and it took her 5 min. Andre biked 2 km and it took him 8 min.
a. Draw a graph with two lines that represent the bike rides of Lin and Andre.
b. For each line, highlight the point with coordinates (1, ��) and find ��.
c. Who was biking faster?
Review Problem
4. For each table, what is the constant of proportionality?
ManuscriptCopy
Unit 2, Lesson 10:
Two Graphs for Each Relationship
Warm-Up: True or False: Fractions and Decimals
Decide whether each equation is true or false. Be prepared to explain your reasoning.
Exploration Activity: Tables, Graphs, and Equations
Your teacher will assign you one of these three points.
�� = (10, 4), �� = (4, 5), �� = (8, 5)
1. On the graph, plot and label only your assigned point.
2. Use a ruler to line up your point with the origin, (0, 0). Draw a line that starts at the origin, goes through your point, and continues to the edge of the graph.
3. Complete the table with the coordinates of points on your graph. Use a fraction to represent any value that is not a whole number.
4. Write an equation that represents the relationship between �� and �� defined by your point.

5. Compare your graph and table with the rest of your group. What is the same and what is different about:
a. your tables?
b. your equations?
c. your graphs?
6. What is the ��-coordinate of your graph when the ��-coordinate is 1? Plot and label this point on your graph. Where do you see this value in the table? Where do you see this value in your equation?
7. Describe any connections you see between the table, characteristics of the graph, and the equation.
ManuscriptCopy
Guided Activity: Hot Dog Eating Contest
Abby and Trey were in a hot dog eating contest. Abby ate 10 hot dogs in 3 minutes (min.), while Trey ate 12 hot dogs in 5 min.
Two different coordinate planes that can be used to represent this situation are shown.
Number of hot dogs
Time(min.)
1. Use the first graph to complete the following.
Time (min.)
Numberofhotdogs
a. Each point on the graph represents either Abby’s or Trey’s consumption. Label the points accordingly.
b. Complete the graphs by drawing 2 lines, one through the origin and Abby’s point, and one through the origin and Trey’s point.
c. Write an equation for each line. Use �� to represent time, in min., and ℎ to represent the number of hot dogs consumed.
Abby’s consumption:
Trey’s consumption:
d. Complete each statement.
The constant of proportionality in the equation representing Abby’s consumption is , which means Abby ate the hot dogs at a rate of hot dogs per min. min. per hot dog.
The constant of proportionality in the equation representing Trey’s consumption is , which means Trey ate the hot dogs at a rate of
hot dogs per min. min. per hot dog.
2. Use the second graph to complete the following.
a. Each point on the graph represents either Abby’s or Trey’s consumption. Label the points accordingly.
b. Complete the graphs by drawing 2 lines, one through the origin and Abby’s point, and one through the origin and Trey’s point.
c. Write an equation for each line. Use �� to represent time, in min., and ℎ to represent the number of hot dogs consumed.
Abby’s consumption:
Trey’s consumption:
d. Complete each statement.
The constant of proportionality in the equation representing Abby’s consumption is , which means Abby ate the hot dogs at a rate of
hot dogs per min. min. per hot dog.
The constant of proportionality in the equation representing Trey’s consumption is , which means Trey ate the hot dogs at a rate of
hot dogs per min. min. per hot dog.
Lesson Summary
Imagine that a faucet is leaking at a constant rate. Every 2 min., 10 milliliters (mL) of water leaks from the faucet. There is a proportional relationship between the volume of leaked water, in mL, and elapsed time, in min. This relationship can be described in 2 different ways.
• The elapsed time is proportional to the volume of water. The corresponding constant of proportionality indicates that the faucet is leaking at a rate of 1 5 of a min. per mL.
• The volume of water is proportional to the elapsed time. The corresponding constant of proportionality indicates that the faucet is leaking at a rate of 5 mL per min.
Two graphs and their corresponding equations representing this relationship are shown, where �� represents the volume, in mL, and �� represents the elapsed time, in min.

Even though the relationship between time and volume is the same, a different choice is made in each case about which variable to view as the independent variable. The graph on the left has �� as the independent variable, while the graph on the right has �� as the independent variable.
ManuscriptCopy
Practice Problems
1. At the supermarket you can fill your own honey bear container. A customer buys 12 ounces (oz.) of honey for $5.40.
a. How much does honey cost per oz.?
b. How much honey can you buy per dollar?
c. Write two different equations that represent this situation. Use ℎ for oz. of honey and �� for cost in dollars.
d. Choose one of your equations and sketch its graph. Be sure to label the axes.
ManuscriptCopy

2. The point �3, 6 5 � lies on the graph representing a proportional relationship. Which of the following points also lie on the same graph? Select all that apply.
□ (1, 0.4)
□ �1.5, 6 10�
□ � 6 5 , 3�
□ �4, 11 5 �
□ (15, 6)
Review Problem
3. Here is a graph that represents a proportional relationship.
a. Come up with a situation that could be represented by this graph.

b. Label the axes with the quantities in your situation.
c. Give the graph a title.
d. Choose a point on the graph. What do the coordinates represent in your situation?
ManuscriptCopy
Unit 3, Lesson 1: Exploring Circles
Warm-Up: How Do You Figure?
Here are two figures.
Figure C looks more like Figure A than like Figure B. Sketch what Figure C might look like. Explain your reasoning.

Exploration Activity: Sorting Round Objects
Your teacher will give you some pictures of different objects.
1. How could you sort these pictures into two groups? Be prepared to share your reasoning.
2. Work with your partner to sort the pictures into the categories that your class has agreed on.
Pause here so your teacher can review your work.
3. What are some characteristics that all circles have in common?
4. Put the circular objects in order from smallest to largest.
5. Select one of the pictures of a circular object. What are some ways you could measure the actual size of your circle?
Collaborative Activity: Measuring Circles
Rodrigo, Isaac, and Mariella each measured one of the circular objects from earlier.
□ Rodrigo says that the bike wheel is 24 inches (in.).
□ Isaac says that the yo-yo trick is 24 in.
□ Mariella says that the glow necklace is 24 in.
1. Explain whether you think that all these circles are the same size.
A circle with center R is shown.
The purple line segment is a diameter of the circle. The pink line segment is a radius of the circle. The center of a circle is the point that is the same distance from all points on the circle.
The plural of radius is radii. Circles have radii and diameters, both of which include the center of the circle. The length of a diameter is equal to the length of 2 radii.
The green part of the circle is called the circumference.
2. Explain which part of the circle you think each person measured.
3. Circle W is shown. Points R, G, K, and H lie on the circle.
a. What similarities do you notice between RH and GK ?
b. What differences do you notice between RH and GK ?

A chord of a circle is a line segment with both endpoints on the circle.
c. Complete the statements.
Line segment RH is a diameter a chord both a diameter and a chord of the circle.
ManuscriptCopy
Line segment GK is a diameter a chord both a diameter and a chord of the circle.
Guided Activity: Drawing Circles
Draw and label each circle on a separate sheet of paper.
1. Circle A, with a diameter of 6 centimeters (cm)
2. Circle B, with a radius of 5 cm.
Pause here so your teacher can review your work.
3. Circle C, with a radius that is equal to Circle A’s diameter.
4. Circle D, with a diameter that is equal to Circle B’s radius.
5. Use a compass to recreate one of these designs.

Lesson Summary
A circle consists of all of the points that are the same distance away from a particular point called the center of the circle.
ManuscriptCopy
A circle is a perfectly round two-dimensional figure, where all points on the circle are equidistant from the center.
A segment that connects the center with any point on the circle is called a radius.
A radius is a line segment extending from the center of a circle or sphere to a point on the circle or sphere.
For example, QG, QH, QI, and QJ are all radii of circle 2. The length of any radius is always the same for a given circle. For this reason, people also refer to this distance as the radius of the circle.

A segment that connects opposite points on a circle is called a chord. When such a segment passes through the circle’s center, it is called a diameter.
A chord of a circle is a line segment both of whose endpoints are on the circle.
A diameter is a line segment from any point on the circle passing through the center to another point on the circle.
For example, AB, CD, and EF are all diameters of circle 1. All diameters in a given circle have the same length because they are composed of 2 radii. For this reason, people also refer to the length of such a segment as the diameter of the circle.
The circumference of a circle is the distance around it. If a circle were made of a piece of string that could be cut and straightened out, the circumference would be the length of that string.
ManuscriptCopy
The circumference is the distance around a circle.
A circle always encloses a circular region. The region enclosed by circle 2 is shaded, but the region enclosed by circle 1 is not. When we refer to the area of a circle, we mean the area of the enclosed circular region.
Practice Problems
1. Here is a circle with center �� and some line segments and curves joining points on the circle.
Identify examples of the following. Explain your reasoning.
a. Diameter
b. Radius

2. Lin measured the diameter of a circle in two different directions. Measuring vertically, she got 3.5 cm, and measuring horizontally, she got 3.6 cm. Explain some possible reasons why these measurements differ.
Review Problems
3. A small, test batch of lemonade used 1 4 cup (c.) of sugar added to 1 c. of water and 1 4 c. of lemon juice. After confirming it tasted good, a larger batch is going to be made with the same ratios using 10 c. of water. How much sugar should be added so that the large batch tastes the same as the test batch?
ManuscriptCopy
4. The graph of a proportional relationship contains the point with coordinates (3, 12). What is the constant of proportionality of the relationship?
Unit 3, Lesson 2: Exploring Circumference
Warm-Up: Which Is Greater?
Clare wonders if the height of the toilet paper tube or the distance around the tube is greater. What information would she need in order to solve the problem? How could she find this out?

Exploration Activity: Finding Circumference
1. In the table, record the name of the 5 different circular objects your group is using.
2. Using a ruler, measure and record the diameter of each circle in centimeters (cm).
3. Wrap the circular object with string, and mark the circumference of the circle with your finger. Straighten out the string, and use it to measure the length of the circumference, in cm, with a ruler. Then, record it in the table.
Object
ManuscriptCopy
4. A coordinate plane is shown with the horizontal axis representing the diameter of a circle and the vertical axis representing the circumference of a circle.
a. Plot the measurements found for each object in problem 3 on the coordinate plane.
b. Discuss with your partner what you notice about the graph.
5. Using circumference, ��, and diameter, ��, find the value of the expressions listed in the table for each of the circular objects measured in problem 3.
6. What do you notice about the table?
7. Complete the statement.
The value of
is approximately equivalent for each circular object.
The value is approximately
Collaborative Activity: Finding Circumference and Diameter
Five circles are shown. One measurement for each circle is given in the table.

Use the constant of proportionality estimated in the previous activity to complete the table.
ManuscriptCopy
Lesson Summary
There is a proportional relationship between the diameter and circumference of any circle. Therefore, the relationship between circumference, ��, and diameter, ��, can be represented by the equation �� = ����, where �� is the constant of proportionality.
A graph representing this proportional relationship is shown with the point (1, ��) marked on the line.
The exact value for the constant of proportionality is called pi, represented by the symbol ��. Two frequently used approximations for �� are 22 7 and 3.14, but neither of these is exactly the value of ��.

Pi (��) is the symbol designating the ratio of the circumference of a circle to its diameter. Common approximations are 3.14 and 22 7 .
Approximations for �� can be used to estimate the circumference given the diameter of a circle, and vice versa. For example, using 3.14 as an approximation for ��, a circle with a diameter of 4 cm has a circumference of about 12.56 cm, because (3.14) ⋅ 4 = 12.56.
The relationship between the circumference and the diameter can be written as �� = ����.
Practice Problems
1. Diego measured the diameter and circumference of several circular objects and recorded his measurements in the table.
One of his measurements is inaccurate. Which measurement is it? Explain how you know.
2. Complete the table. Use one of the approximate values for �� discussed in class (for example 3.14 or 22 7 ). Explain or show your reasoning.
ManuscriptCopy
Hula Hoop
Magnifying Glass
3. �� is the center of the circle, and the length of CD is 15 cm.
a. Name a segment that is a radius. How long is it?
b. Name a segment that is a diameter. How long is it?

4. Consider the equation �� = 1.5�� + 2.
a. Find four pairs of ��- and ��-values that make the equation true. Plot the points (��, ��) on the coordinate plane.
b. Based on the graph, can this be a proportional relationship? Why or why not?
ManuscriptCopy

Unit 3, Lesson 3: Applying Circumference
Warm-Up: What Do We Know? What Can We Estimate?
Here are some pictures of circular objects, with measurement tools shown. The measurement tool on each picture reads as follows:
• Wagon wheel: 3 feet (ft.)
• Plane propeller: 24 inches (in.)
• Sliced Orange: 20 centimeters (cm)


1. For each picture, which measurement is shown?
2. Based on this information, what measurement(s) could you estimate for each picture?
ManuscriptCopy
Exploration Activity: Using Pi
In the previous activity, we looked at pictures of circular objects. One measurement for each object is listed in the table.
Your teacher will assign you an approximation of �� to use for this activity.
1. Complete the table.
Wagon Wheel 3 ft.
Airplane Propeller 24 in.
Orange Slice
ManuscriptCopy
2. A bug was sitting on the tip of the propeller blade when the propeller started to rotate. The bug held on for 5 rotations before flying away. How far did the bug travel before it flew off?
Collaborative Activity: Around the Running Track
The field inside a running track is made up of a rectangle that is 84.39 meters (m) long and 73 m wide, together with a half-circle at each end.


1. What is the distance around the inside of the track? Explain or show your reasoning.
2. The track is 9.76 m wide all the way around. What is the distance around the outside of the track? Explain or show your reasoning.
ManuscriptCopy
Guided Activity: Measuring a Picture Frame
Kiran bent some wire around a rectangle to make a picture frame. The rectangle is 8 in. by 10 in.
1. Find the perimeter of the wire picture frame. Explain or show your reasoning.
2. If the wire picture frame were stretched out to make one complete circle, what would its radius be?

Lesson Summary
The circumference of a circle, ��, is �� times the diameter, ��. The diameter is twice the radius, ��. These relationships can be used to find the radius, diameter, or circumference of a circle, given only 1 of the 3 measures. The equations shown represent these relationships.
= 2��
= ����
= 2����
Here are 3 examples of how to use these relationships:
• If the diameter of a car tire is 60 cm, that means the radius is 30 cm, and the circumference is 60 ⋅ ��, or about 188 cm.
ManuscriptCopy
• If the radius of a circular clock is 5 in., that means the diameter is 10 in., and the circumference is 10 ⋅ ��, or about 31 in.
• If a ring has a circumference of 44 millimeters (mm), that means the diameter is 44 �� , which is about 14 mm, and the radius is about 7 mm.
Practice Problems
1. Here is a picture of a Ferris wheel. It has a diameter of 80 m.
a. On the picture, draw and label a diameter.
b. How far does a rider travel in one complete rotation around the Ferris wheel?

2. Identify each measurement as the diameter, radius, or circumference of the circular object. Then, estimate the other two measurements for the circle.
a. The length of the minute hand on a clock is 5 in.
b. The distance across a sink drain is 3.8 cm.
c. The tires on a mining truck are 14 ft. tall.
d. The fence around a circular pool is 75 ft. long.
e. The distance from the tip of a slice of pizza to the crust is 7 in.
f. Breaking a cookie in half creates a straight side 10 cm long.
ManuscriptCopy
g. The length of the metal rim around a glass lens is 190 mm.
h. From the center to the edge of a DVD measures 60 mm.
3. A half circle is joined to an equilateral triangle with side lengths of 12 units. What is the perimeter of the resulting shape?

4. Circle A has a diameter of 1 ft. Circle B has a circumference of 1 m. Which circle is bigger? Explain your reasoning. (1 in. ≈ 2.54 cm)
5. The circumference of Tyler’s bike tire is 72 in. What is the diameter of the tire?
ManuscriptCopy
Unit 3, Lesson 4: Circumference and Wheels
Warm-Up: A Rope and a Wheel
Han says that you can wrap a 5-foot (ft.) rope around a wheel with a 2-ft. diameter because 5 2 is less than ��. Do you agree with Han? Explain your reasoning.
Exploration Activity: Rolling, Rolling, Rolling
Your teacher will give you a circular object.
1. Follow these instructions to create the drawing:
• On a separate piece of paper, use a ruler to draw a line all the way across the page.
• Roll your object along the line and mark where it completes one rotation.
• Use your object to draw tick marks along the line that are spaced as far apart as the diameter of your object.
2. What do you notice?
3. Use your ruler to measure each distance. Record these values in the first row of the table.
• the diameter of your object
• how far your object rolled in one complete rotation
• the quotient of how far your object rolled divided by the diameter of your object
4. If you wanted to trace two complete rotations of your object, how long of a line would you need?
5. Share your results with your group and record their measurements in the table.
6. If each person in your group rolled their object along the entire length of the classroom, which object would complete the most rotations? Explain or show your reasoning.
ManuscriptCopy
Collaborative Activity: Rotations and Distance
1. A car wheel has a diameter of 20.8 inches (in.).
a. About how far does the car wheel travel in 1 rotation? 5 rotations? 30 rotations?
1 rotation:
5 rotations:
30 rotations:
b. Write an equation relating the distance the car travels in inches, ��, to the number of wheel rotations, ��.
c. About how many rotations does the car wheel make when the car travels 1 mile (mi.)? Explain or show your reasoning.
2. A bike wheel has a radius of 13 in.
a. About how far does the bike wheel travel in 1 rotation? 5 rotations? 30 rotations?
1 rotation:
5 rotations:
30 rotations:
b. Write an equation relating the distance the bike travels in in., ��, to the number of wheel rotations, ��.
c. About how many rotations does the bike wheel make when the bike travels 1 mi.? Explain or show your reasoning.
Guided Activity: Rotations and Speed
The circumference of a car wheel is about 65 in.
1. If the car wheel rotates once per second (sec.), how far does the car travel in one minute (min.)?
2. If the car wheel rotates once per sec., about how many mi. does the car travel in one hour (hr.)?
3. If the car wheel rotates 5 times per sec., about how many mi. does the car travel in one hr.?
4. If the car is traveling 65 miles per hour (mph), about how many times per sec. does the wheel rotate?
Lesson Summary
The circumference of a circle is the distance around the circle. This is also how far the circle rolls in 1 complete rotation on flat ground. For example, a bicycle wheel with a diameter of 24 in. has a circumference of 24�� in. and will roll 24�� in., or 2�� ft., in 1 complete rotation. There is an equation relating the number of rotations the wheel makes to the distance it travels. A table is given showing how far the bike travels when the wheel makes different numbers of rotations.
The table shows that the relationship between the distance traveled and the number of wheel rotations is a proportional relationship. The constant of proportionality is 2��. To find the missing value in the last row of the table, note that each rotation of the wheel contributes 2�� ft. of distance traveled. So, after �� rotations, the bike will have traveled 2���� ft.
The relationship between distance traveled, ��, in ft., and the number of rotations the wheel has made, ��, can be represented by the equation �� = 2����.
Practice Problems
1. The diameter of a bike wheel is 27 in. If the wheel makes 15 complete rotations, how far does the bike travel?
2. The wheels on Kiran’s bike are 64 inches in circumference. How many times do the wheels rotate if Kiran rides 300 yards (yd.)?
3. The numbers are measurements of radius, diameter, and circumference of circles A and B. Circle A is smaller than circle B. Which number belongs to which quantity?
,
4. Circle A has circumference 2 2 3 m. Circle B has a diameter that is 1 1 2 times as long as Circle A’s diameter. What is the circumference of Circle B?
Review Problem
5. The length of segment ���� is 5 cm.
a. What is the length of segment ����?
b. What is the length of segment ����?
ManuscriptCopy
c. Name a segment that has the same length as segment ����.

Unit 3, Lesson 5: Exploring the Area of a Circle
Warm-Up: Estimating Areas
Your teacher will show you some figures. Decide which figure has the largest area. Be prepared to explain your reasoning.
Guided Activity: Area of a Circle
A closed figure is an enclosed shape that occupies space. A circle is an example of a closed figure.
1. Draw a picture of a figure that is not closed.
Area is the measure, in square units (sq. units), of the inside region of a closed two-dimensional figure.
2. Discuss with your partner why a closed figure can have an area, but a figure that is open cannot have an area. Summarize your discussion.
The measure of the space inside the circle is the circle’s area.
Collaborative Activity: Estimating Areas of Circles
Your teacher will give your group 2 circles of different sizes.
1. For each circle, use the squares on the graph paper to measure the diameter in centimeters (cm), and estimate the area of the circle in square centimeters (sq. cm). Record your measurements in the table.
2. Plot the values from the table on the class coordinate plane. Then, plot the class’s data points on your coordinate plane.
3. In a previous lesson, you graphed the relationship between the diameter and circumference of a circle.
a. How is this graph the same?
b. How is it different?
Exploration Activity: Covering a Circle
Here is a square whose side length is the same as the radius of the circle.

How many of these squares do you think it would take to cover the circle exactly?
ManuscriptCopy
Lesson Summary
The circumference, ��, of a circle is proportional to the diameter, ��. This relationship can be expressed as �� = ����. The circumference is also proportional to the radius of the circle, and the constant of proportionality is 2 ⋅ �� because the diameter is twice as long as the radius. This proportional relationship can be written as �� = 2����.
The area of a circle, however, is not proportional to the diameter or the radius. The area of a circle with radius �� is a little more than 3 times the area of a square with side length ��, so the area of a circle with radius �� is approximately 3��2).
Future lessons will investigate and refine the relationship between the area and the radius of a circle.
Practice Problems
1. The ��-axis of each graph has the diameter of a circle in meters (m). Label the ��-axis on each graph with the appropriate measurement of a circle: radius (m), circumference (m), or area (sq. m).


2. Circle A has area 500 square inches (sq. in.) The diameter of circle B is three times the diameter of circle A. Estimate the area of circle B.
3. Lin’s bike travels 100 m when her wheels rotate 55 times. What is the circumference of her wheels?
4. Priya drew a circle whose circumference is 25 cm. Clare drew a circle whose diameter is 3 times the diameter of Priya’s circle. What is the circumference of Clare’s circle? 5.
a. Here is a picture of two squares and a circle. Use the picture to explain why the area of this circle is more than 2 sq. units but less than 4 sq. units.
b. Here is another picture of two squares and a circle. Use the picture to explain why the area of this circle is more than 18 sq. units and less than 36 sq. units.
ManuscriptCopy


6. Point �� is the center of the circle, and the length of ���� of is 15 cm. Find the circumference of this circle.
ManuscriptCopy

Unit 3, Lesson 6: Relating Area to Circumference
Warm-Up: Irrigating a Field
A circular field is set into a square with an 800 meter (m) side length.
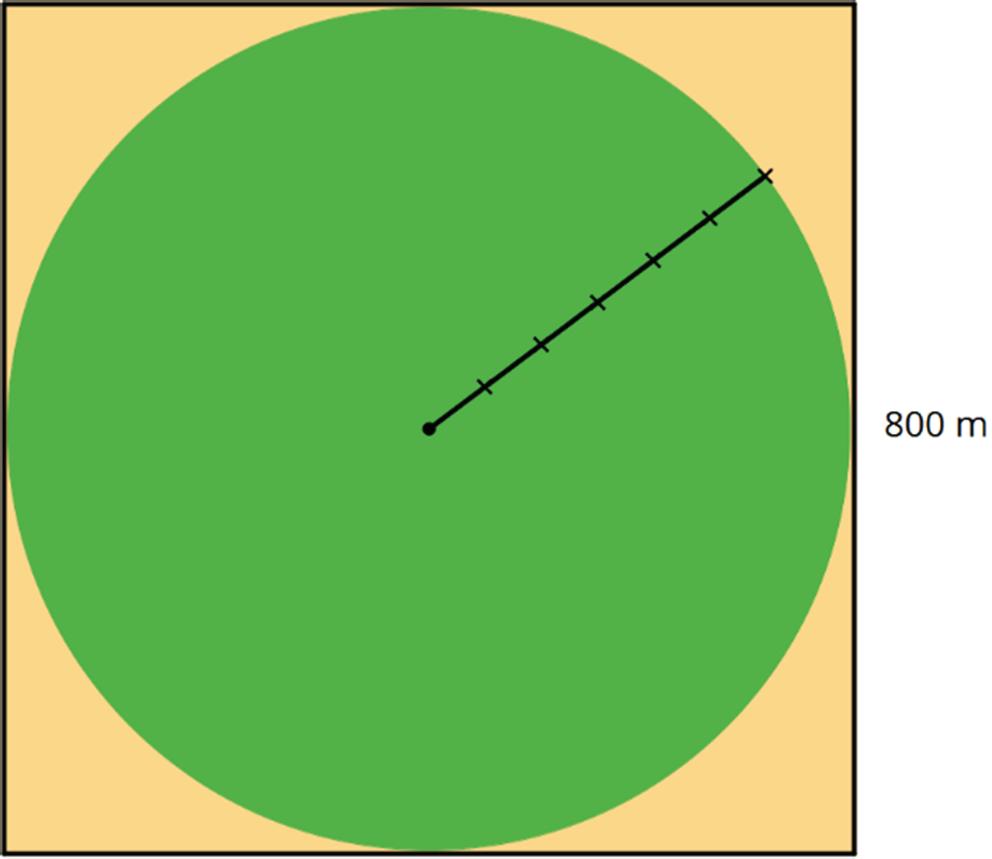
1. Which is the best estimate of the field’s area?
A. About 5,000 square meters (sq. m)
B. About 50,000 sq. m
C. About 500,000 sq. m
D. About 5,000,000 sq. m
ManuscriptCopy
Exploration Activity: Making a Polygon out of a Circle
Your teacher will give you a circular object, a marker, and two pieces of paper of different colors. Follow these instructions to create a visual display:
1. Using a thick marker, trace your circle in two separate places on the same piece of paper.
2. Cut out both circles, cutting around the marker line.
3. Fold and cut one of the circles into fourths.
4. Arrange the fourths so that straight sides are next to each other, but the curved edges are alternately on top and on bottom.
Pause here so your teacher can review your work.
5. Fold and cut the fourths in half to make eighths. Arrange the eighths next to each other, like you did with the fourths.
6. If your pieces are still large enough, repeat the previous step to make sixteenths.
7. Glue the remaining circle and the new shape onto a piece of paper that is a different color.
8. After you finish gluing your shapes, answer the following questions.
a. How do the areas of the two shapes compare?
b. What polygon does the shape made of the circle pieces most resemble?
c. How could you find the area of this polygon?
Collaborative Activity: Making Another Polygon out of a Circle
Imagine a circle made of rings that can bend, but not stretch.

1. What polygon does the new shape resemble?
2. How does the area of the polygon compare to the area of the circle?
3. How can you find the area of the polygon?
4. Show, in detailed steps, how you could find the polygon’s area in terms of the circle’s measurements. Show your thinking. Organize it so it can be followed by others.
5. After you finish, trade papers with a partner and check each other’s work. If you disagree, work to reach an agreement. Discuss:
• Do you agree or disagree with each step?
• Is there a way they can make the explanation clearer?
Return your partner’s work, and revise your explanation based on the feedback you received.
Guided Activity: Tiling a Table
Elena wants to tile the top of a circular table. The diameter of the table top is 28 inches (in.). What is its area?
Lesson Summary
If �� is a circle’s circumference and �� is its radius, then �� = 2����. The area of a circle can be found by taking the product of half the circumference and the radius.
If �� is the area of the circle, this gives the equation shown.
This equation can be rewritten as shown.
If the radius of a circle is r units, then the area of the circle is ����2 square units (sq. units).
This means that the area of a circle can be found using the radius. For example, if a circle has a radius of 10 centimeters (cm), then the area is about (3.14) ⋅ 100, which is 314 square centimeters (sq. cm).
ManuscriptCopy
The area of a circle can also be found from the diameter, using the relationship between radius and diameter. For example, if a circle has a diameter of 30 feet (ft.), then the radius is 15 ft., and the area is about (3.14) ⋅ 225, which is approximately 707 square feet (sq. ft.).
Practice Problems
1. The picture shows a circle divided into 8 equal wedges which are rearranged.

The radius of the circle is �� and its circumference is 2����. How does the picture help to explain why the area of the circle is ����2?
2. A circle’s circumference is approximately 76 cm. Estimate the radius, diameter, and area of the circle.
3. Jada paints a circular table that has a diameter of 37 in. What is the area of the table?
ManuscriptCopy
4. The Carousel on the National Mall has 4 rings of horses. Kiran is riding on the inner ring, which has a radius of 9 ft. Mai is riding on the outer ring, which is 8 ft. farther out from the center than the inner ring is.
a. In one rotation of the carousel, how much farther does Mai travel than Kiran?
b. One rotation of the carousel takes 12 seconds (sec.). How much faster does Mai travel than Kiran?
5. The diameters of four coins are shown.
a. A coin rolls a distance of 33 cm in 5 rotations. Which coin is it?
b. A quarter makes 8 rotations. How far did it roll?
ManuscriptCopy
c. A dime rolls 41.8 cm. How many rotations did it make?
Unit 3, Lesson 7: Applying Area of Circles
Warm-Up: Still Irrigating the Field
The area of this field is about 500,000 square meters (sq. m).

1. What is the field’s area to the nearest sq. m? Assume that the side length of the square is exactly 800 meters (m).
A. 480,000 sq. m
B. 502,400 sq. m
C. 502,655 sq. m
D. 502,857 sq. m
ManuscriptCopy
Exploration Activity: Comparing Areas Made of Circles
1. Each square has a side length of 12 units. Compare the areas of the shaded regions in the 3 figures. Which figure has the largest shaded region? Explain or show your reasoning.

ManuscriptCopy
2. Each square in Figures D and E has a side length of 1 unit. Compare the area of the two figures. Which figure has more area? How much more? Explain or show your reasoning.

Guided Activity: The Running Track Revisited
The field inside a running track is made up of a rectangle 84.39 m long and 73 m wide, together with a half- circle at each end. The running lanes are 9.76 m wide all the way around.


What is the area of the running track that goes around the field? Explain or show your reasoning.
Lesson Summary
The relationship between ��, the area of a circle, and ��, its radius, is �� = ����2. This equation can be used to find the area of a circle given the radius. For example, if a circle has a radius of 10 centimeters (cm), then the area is �� ⋅ 102, or 100��, square centimeters (sq. cm).
Sometimes, instead of leaving �� in expressions for the area, a numerical approximation can be helpful. For the example above, a circle with a 10 cm radius has an area of about 314 sq. cm using the approximation �� ≈ 3.14.
ManuscriptCopy
This formula can also be used to find the area of a fraction of a circle. For example, the figure shows a circle divided into 3 pieces of equal area. The shaded part has an area of 1 3 ����2.

Practice Problems
1. A circle with a 12 inch (in.) diameter is folded in half and then folded in half again. What is the area of the resulting shape?
2. Find the area of the shaded region. Express your answer in terms of ��.
Review Problems
3. The face of a clock has a circumference of 63 in. What is the area of the face of the clock?
ManuscriptCopy

4. Which of these pairs of quantities are proportional to each other? For the quantities that are proportional, what is the constant of proportionality?
a. Radius and diameter of a circle
b. Radius and circumference of a circle
c. Radius and area of a circle
d. Diameter and circumference of a circle
e. Diameter and area of a circle
5. Find the area of this shape in two different ways.
Method 1:
Method 2:

6. Elena and Jada both read at a constant rate, but Elena reads more slowly. For every 4 pages that Elena can read, Jada can read 5.
a. Complete the table.
b. Here is an equation for the table: �� = 1.25��. What does the 1.25 mean?
c. Write an equation for this relationship that starts �� =.
ManuscriptCopy
Unit 3, Lesson 8: Distinguishing Circumference and Area
Warm-Up: Filling the Plate
About how many cheese puffs can fit on the plate in a single layer? Be prepared to explain your reasoning.
ManuscriptCopy

Exploration Activity: Card Sort: Circle Problems
Your teacher will give you cards with questions about circles.
1. Sort the cards into two groups based on whether you would use the circumference or the area of the circle to answer the question.
Pause here so your teacher can review your work.
2. Your teacher will assign you a card to examine more closely. What additional information would you need in order to answer the question on your card?
3. Estimate measurements for the circle on your card.
4. Use your estimates to calculate the answer to the question.
ManuscriptCopy
Collaborative Activity: Analyzing Circle Claims
Here are two students’ answers for each question. Do you agree with either of them? Explain or show your reasoning.
1. How many feet (ft.) are traveled by a person riding once around the merry-go-round?
• Clare says, “The radius of the merry-goround is about 4 ft., so the distance around the edge is about 8�� ft.”
• Andre says, “The diameter of the merry-goround is about 4 ft., so the distance around the edge is about 4�� ft.”

2. How much room is there to spread frosting on the cookie?
• Clare says, “The radius of the cookie is about 3 centimeters (cm), so the space for frosting is about 6�� square centimeters (sq. cm).”
• Andre says, “The diameter of the cookie is about 3 inches (in.), so the space for frosting is about 2.25�� square inches (sq. in.).”
ManuscriptCopy

3. How far does the unicycle move when the wheel makes 5 full rotations?
• Clare says, “The diameter of the unicycle wheel is about 0.5 meters (m). In 5 complete rotations it will go about 5 2 �� square meters (sq. m).”
• Andre says, “I agree with Clare’s estimate of the diameter, but that means the unicycle will go about 5 4 �� m.”

Collaborative Activity: Circumference to Area
1. Mariella built a circular table out of wood. She wants to stain the top of the table.
a. The circumference of the circle is 5.5�� ft. Explain how Mariella can use the circumference to determine how much stain she will need.
b. Mariella calculated the radius of the circle, but she made an error. Mariella’s work is shown. Describe the error she made in her work.
ManuscriptCopy
c. Determine the area of the top of the table. Use 22 7 for ��, and round to the nearest hundredth.
Mariella’s Work
2. Yvonne’s company wants to put its logo on flying disks to give away at a convention. Each flying disk has a circumference of 39.25 in.
a. Determine the radius of the flying disk. Use 3.14 for ��.
b. If the logo can cover the entire top of the disk, then how much space is available for the logo on each disk? Use 3.14 for ��, and round to the nearest hundredth.
Lesson Summary
• The length of a circular path


• The length of a piece of rope coiled in a circle


• The distance that a wheel will travel after 1 complete rotation
Some examples of values related to the area of a circle are listed.
• The amount of land that is cultivated on a circular field
• The amount of frosting needed to cover the top of a round cake
• The number of tiles needed to cover a circular table
ManuscriptCopy


A problem’s context can be used to determine whether the circumference or the area of a circle is needed. Some examples of values related to the circumference of a circle are listed.
In both cases, the radius or diameter of the circle is all that is needed to make the calculation. The circumference of a circle with radius �� is 2����, while its area is ����2. The circumference is measured in linear units, such as cm, in., or kilometers (km), while the area is measured in square units, such as sq. cm, sq. in., or square kilometers (sq. km).
The area of a circle can be found given the circumference by first solving for the radius. For example, if a circle has a circumference of 12.4�� units, then the diameter is 12.4 units and the radius is 6.2 units. The area can then be determined using the radius.
Practice Problems
1. For each problem, decide whether the circumference of the circle or the area of the circle is most useful for finding a solution. Explain your reasoning.
a. A car’s wheels spin at 1,000 revolutions per minute (min.). The diameter of the wheels is 23 in. You want to know how fast the car is traveling.
b. A circular kitchen table has a diameter of 60 in. You want to know how much fabric is needed to cover the table top.
c. A circular puzzle is 20 in. in diameter. All of the pieces are about the same size. You want to know about how many pieces there are in the puzzle.
d. You want to know about how long it takes to walk around a circular pond.
2. The city of Paris, France, is completely contained within an almost circular road that goes around the edge. The circumference of the city is approximately 6�� miles (mi.).
a. What is the approximate diameter of Paris?
b. Determine the approximate area of Paris. Use 3.14 to approximate ��.

3. Here is a diagram of a softball field.
a. About how long is the fence around the field?
b. About how big is the outfield?
ManuscriptCopy

4. While in math class, Priya and Kiran come up with two ways of thinking about the proportional relationship shown in the table.
Both students agree that they can solve the equation 5�� = 1,750 to find the constant of proportionality.
• Priya says, “I can solve this equation by dividing 1,750 by 5.”
• Kiran says, “I can solve this equation by multiplying 1,750 by 1 5 .”
a. What value of �� would each student get using their own method?
b. How are Priya and Kiran’s approaches related?
c. Explain how each student might approach solving the equation 2 3 �� = 50.
ManuscriptCopy
Unit 4: Proportional Relationships and Percentages
ManuscriptCopy
Unit 4,
Lesson
1: Ratios and Rates with Fractions
Warm-Up: Number Talk: Division Find each quotient mentally.
Exploration Activity: A Train Is Traveling at . . .
A train is traveling at a constant speed and goes 7.5 kilometers (km) in 6 minutes (min.). At that rate:
1. How far does the train go in 1 min.?

How far does the train go in 100 min.?
2.
Collaborative Activity: Comparing Running Speeds
Lin ran 2 3 4 miles (mi.) 2 5 of an hour (hr.). Noah ran 8 2 3 mi. in 4 3 of an hr.
1. Pick one of the questions that was displayed, but don’t tell anyone which question you picked. Find the answer to the question.
2. When you and your partner are both done, share the answer you got (do not share the question) and ask your partner to guess which question you answered. If your partner can’t guess, explain the process you used to answer the question.
3. Switch with your partner and take a turn guessing the question that your partner answered.
Collaborative Activity: Scaling the Mona Lisa
In real life, the Mona Lisa measures 2 1 2 feet (ft.) by 1 3 4 ft. A company that makes office supplies wants to print a scaled copy of the Mona Lisa on the cover of a notebook that measures 11 inches (in.) by 9 in.
1. What size should they use for the scaled copy of the Mona Lisa on the notebook cover?
2. What is the scale factor from the real painting to its copy on the notebook cover?
3. Discuss your thinking with your partner. Did you use the same scale factor? If not, is one more reasonable than the other?
Lesson Summary
Ratios are often expressed in the real world as an amount of “something per something.” A rate is a comparison of 2 numbers, so all rates can be expressed using ratios.
There are 12 in. in a ft., which can be restated as “for every 1 ft., there are 12 in.” or “the ratio of feet to inches is 1 ∶ 12.” Recall that there are 2 unit rates for every ratio. Find the unit rates by dividing the numbers in the ratio.
• 1 ÷ 12 = 1 12 , so there is 1 12 of a ft. per in.
• 12 ÷ 1 = 12, so there are 12 in. per ft.
A complex fraction, also called a compound fraction, is a fraction that has one or more fractions in the numerator, the denominator, or both.
Unit rates for ratios with fractions can be calculated the same way, by dividing the numbers in the ratio.
For example, if someone runs 3 4 of a mi. in 11 2 min., then the ratio of time to distance is
, so the person’s speed is 3 22 of a mi. per min.
Practice Problems
1. A cyclist rode 3.75 mi. in 0.3 hr.
a. How fast was she going in mi. per hr.?
b. At that rate, how long will it take her to go 4.5 mi.?
2. A recipe for sparkling grape juice calls for 1 1 2 quarts (qt.) of sparkling water and 3 4 qt. of grape juice.
a. How much sparkling water would you need to mix with 9 qt. of grape juice?
b. How much grape juice would you need to mix with 15 4 qt. of sparkling water?
c. How much of each ingredient would you need to make 100 qt. of punch?
3. At a deli counter,
• Someone bought 1 3 4 pounds (lb.) of ham for $14.50.
• Someone bought 2 1 2 lb. of turkey for $26.25.
• Someone bought 3 8 lb. of roast beef for $5.50.
Which meat is the least expensive per lb.? Which meat is the most expensive per lb.? Explain how you know.
ManuscriptCopy
4.
a. Draw a scaled copy of the circle using a scale factor of 2.
b. How does the circumference of the scaled copy compare to the circumference of the original circle?

c. How does the area of the scaled copy compare to the area of the original circle?
5. Jada has a scale map of Kansas that fits on a page in her book. The page is 5 in. by 8 in. Kansas is about 210 mi. by 410 mi. Select all scales that could be a scale of the map. (There are approximately 2.54 centimeters (cm) in an inch.)
□ 1 in. to 1 mi.
□ 1 cm to 1 km
□ 1 in. to 10 mi.
□ 1 ft. to 100 mi
□ 1 cm to 200 km
□ 1 in. to 100 mi.
□ 1 cm to 1000 km
ManuscriptCopy
Unit 4, Lesson 2: Revisiting Proportional Relationships
Warm-Up: Recipe Ratios
A recipe calls for 1 2 cup (c.) sugar and 1 c. flour. Complete the table to show how much sugar and flour to use in different numbers of batches of the recipe.
ManuscriptCopy
Exploration Activity: The Price of Rope
Two students are solving the same problem: At a hardware store, they can cut a length of rope off of a big roll, so you can buy any length you like. The cost for 6 feet (ft.) of rope is $7.50. How much would you pay for 50 ft. of rope, at this rate?
1. Kiran knows he can solve the problem this way.

What would be Kiran’s answer?

2. Kiran wants to know if there is a more efficient way of solving the problem. Priya says she can solve the problem with only 2 rows in the table.
What do you think Priya’s method is?
ManuscriptCopy
Guided Activity: Swimming, Manufacturing, and Painting
1. Tyler swims at a constant speed, 5 meters (m) every 4 seconds (sec.). How long does it take him to swim 114 m?
2. A factory produces 3 bottles of sparkling water for every 8 bottles of plain water. How many bottles of sparkling water does the company produce when it produces 600 bottles of plain water?
Number of Bottles of Sparkling Water
Number of Bottles of Plain Water
3. A certain shade of light blue paint is made by mixing 1 1 2 quarts (qt.) of blue paint with 5 qt. of white paint. How much white paint would you need to mix with 4 qt. of blue paint?
4. For each of the previous three situations, write an equation to represent the proportional relationship.
Situation 1:
Situation 2:
Situation 3:
Collaborative Activity: Finishing the Race and More Orange Juice
1. Lin runs 2 3 4 miles (mi.) in 2 5 of an hour (hr.). Tyler runs 8 2 3 mi. in 4 3 of an hr. How long does it take each of them to run 10 mi. at that rate?
2. Priya mixes 2 1 2 c. of water with 1 3 c. of orange juice concentrate. Diego mixes 1 2 3 c. of water with 1 4 c. orange juice concentrate. How much concentrate should each of them mix with 100 c. of water to make juice that tastes the same as their original recipe? Explain or show your reasoning.
Lesson Summary
Given 2 quantities in a problem where one is proportional to the other, the constant of proportionality can be calculated and used to answer other questions about the situation. For example, Andre runs at a constant speed of 5 m every 2 sec. How long does it take him to run 91 m at this rate?
In this problem, there are 2 quantities: time, in sec., and distance, in m. Since Andre is running at a constant speed, time is proportional to distance. The table shown with distance and time as column headers can be used to fill in the given information.
To find the missing value in the right column, multiply the value in the left column by 2 5 , because 2 5 ⋅ 5 = 2. This means that it takes Andre 2 5 of a sec. to run 1 m.
At this rate, it would take Andre 2 5 ⋅ 91 = 182 5 or 36.4 sec. to walk 91 m. In general, if �� is the time it takes to walk �� m at that pace, then �� = 2 5 ��.
Practice Problems
1. It takes an ant farm 3 days to consume 1 2 of an apple. At that rate, in how many days will the ant farm consume 3 apples?
2. To make a shade of paint called jasper green, mix 4 qt. of green paint with 2 3 c. of black paint. How much green paint should be mixed with 4 c. of black paint to make jasper green?
3. An airplane is flying from New York City to Los Angeles. The distance it travels in mi., ��, is related to the time in sec., ��, by the equation �� = 0.15��.
a. How fast is it flying? Be sure to include the units.
b. How far will it travel in 30 sec.?
c. How long will it take to go 12.75 mi.?
ManuscriptCopy
4. A grocer can buy strawberries for $1.38 per pound (lb.).
a. Write an equation relating ��, the cost, and ��, the lb. of strawberries.
b. A strawberry order cost $241.50. How many lb. did the grocer order?
Review Problems
5. Crater Lake in Oregon is shaped like a circle with a diameter of about 5.5 mi.
a. How far is it around the perimeter of Crater Lake?
b. What is the area of the surface of Crater Lake?
6. A 50-centimeter (cm) piece of wire is bent into a circle. What is the area of this circle?
7. Suppose Quadrilaterals A and B are both squares. Are A and B necessarily scale copies of one another? Explain.
Unit 4, Lesson 3: Converting Lengths Using Dimensional Analysis
Warm-Up: A Closer Look at Rulers
A screenshot of a ruler with inches (in.) and centimeters (cm) is shown. The image is not to scale.
Look closely at the markings and labels on the ruler.
1. Write 3 observations about the markings and labels on the ruler.
2. Compare observations with your partner. Add any additional observations your partner made to your list.
ManuscriptCopy
Exploration Activity: Measuring Objects to Determine Conversion Rates
1. With your partner, choose 3 classroom objects that can be measured with a standard ruler. Measure each object’s length in in. and in cm. Use the measurements to complete the table, being as precise as possible.
Object Length
Conversion rates can be used to convert measurements.
To convert the length from in. to cm, multiply the length in in. by a conversion rate. The result is the length in cm.
2. Use the 2 measurements for each object you measured to estimate a conversion rate for converting in. to cm.
3. What is an estimate for the conversion rate of in. to cm?
To convert the length from cm to in., multiply the length in cm by a conversion rate. The result is the length in inches.
4. For each object, use the 2 measurements to estimate a conversion rate for converting cm to in.
5. What is an estimate for the conversion rate of cm to in.?
Guided Activity: Using Conversion Tables
Two systems of measurement used around the world are the metric system and the customary system. Most countries use the metric system of measurement. In fact, only 3 countries still use the customary system: the United States, Liberia, and Myanmar.
The symbol ≈ means “is approximately equal to.” This is the symbol often used to show the relationship between units across different systems of measure instead of an equal sign, =. Because each system uses different base measures, the conversion rates across systems are approximations.
Several conversion rates for measures of length between the customary system and metric system are shown in the table. Customary System to Metric System
System to Customary System
1 inch (in.) ≈ 25.4 millimeters (mm) 1 millimeter (mm) ≈
(in.)
1 yard (yd.) ≈ 0.914 meters (m) 1 meter (m) ≈ 1.094 yards (yd.)
1 mile (mi.) ≈ 1.61 kilometers (km) 1 kilometer (km) ≈ 0.62 miles (mi.)
1. Complete the statements.
a. To convert ft. to cm, multiply the number of ft. by to find the equivalent number of cm.
b. To convert cm to ft., multiply the number of cm by to find the equivalent number of ft.
c. To convert m to yd., multiply the number of m by to find the equivalent number of yd.
d. To convert yd. to m, multiply the number of yd. by to find the equivalent number of m.
2. Use the conversion rates to convert each measure of length. Round to the nearest thousandth when necessary.
ManuscriptCopy
a. 30 mi. ≈ km
b. 65 km ≈ mi.
c. 10 ft. ≈ mm
d. 450 mm ≈ ft.
Collaborative Activity: Digging Deeper into Conversion Rates
The calculation shown demonstrates how 5 ft. can be converted to cm using dimensional analysis.
Koji said the factor 30.48 cm. 1 ft. is equivalent to 1 because the numerator and denominator are equivalent values.
1. With your partner, discuss how Koji determined that 30.48 cm. 1 ft. is equivalent to 1.
2. Explain how this shows that 5 ft. is equal to 152.4 cm.
3. Eva noticed that in the calculation of the conversion, the unit ft. was in the numerator and the denominator. How does this eliminate the units of ft. in the calculation?
4. Complete the statements below. When multiplying a measurement by a conversion factor, the value of the measurement does does not change because theOcondvoeerssion factor is equivalent to 1.
ManuscriptCopy
The units do do not change because when the same units appear in the numerator and denominator, it is similar to having the same value in the numerator and denominator, so these factors become 1.
Lesson Summary
Conversion tables are a useful tool for converting from one measurement system to another.
The table shows the conversion rates for common units of length in the customary and metric systems.
Customary System to Metric System
1 inch (in.)
25.4 millimeters (mm) 1 inch (in.)
1 foot (ft.)
2.54 centimeters (cm)
30.48 centimeters (cm) 1 foot (ft.)
1 yard (yd.)
1 yard (yd.)
0.305 meters (m)
91.44 centimeters (cm)
0.914 meters (m)
1 mile (mi.) ≈ 1609.34 meters (m) 1 mile (mi.) ≈ 1.61 kilometers (km)
Metric System to Customary System 1 millimeter (mm) ≈ 0.039 inches (in.) 1 centimeter (cm) ≈ 0.39 inches (in.)
centimeter (cm)
0.033 feet (ft.) 1 meter (m)
39.37 inches (in.)
meter (m)
3.28 feet (ft.) 1 meter (m)
1.094 yards (yd.) 1 kilometer (km) ≈ 1093.613 yards (yd.)
1 kilometer (km) ≈ 0.62 miles (mi.)
When converting units using dimensional analysis, multiply the given measurement by the conversion factor(s) to determine its equivalent value in terms of another unit of measure. Be sure to use the conversion factor(s) that correctly eliminate(s) the original unit of measure and leave(s) the new unit of measure. It can be helpful to write the original measurement as a fraction.
For example, to determine how many yd. are equivalent to 8,800 cm, use the conversion rates 1 cm ≈ 0.033 ft. and 3 ft. = 1 yd.
With the units “cm” and “ft.” appearing in both the numerator and denominator, both units can be eliminated because cm cm and ft. ft.. are each equivalent to 1. After completing the multiplication, this leaves only yd. as the remaining unit of measure.
Practice Problems
1. Raphael measures the height of a plant each week using an in. ruler. At week 5, he cannot find the in. ruler, so he uses a cm ruler instead. His measurements are shown.
How much taller, in in., is the plant in week 5 than in week 4?
2. Maya visits her friend in Europe and rides in an electric car. The electric vehicle can travel 200 km on 1 charge. If their destination is 130 mi. away, will they be able to make it there without having to stop to charge the car? Explain or show work to justify your answer.
3. Use the conversion rates to convert the given lengths. Round to the nearest thousandth when necessary.
a. 25 mi. ≈ km
b. 25 cm ≈ yd.
c. 3 yd. ≈ m
d. 470 mm ≈ ft.
Review Problems
4. An image of a book shown on a website is 1.5 in. wide and 3 in. tall on a computer monitor. The actual book is 9 in. wide.
a. What scale is being used for the image?
ManuscriptCopy
b. How tall is the actual book?
5. Jada’s bike wheels have a diameter of 20 in. How far does she travel if the wheels rotate 37 times?
ManuscriptCopy
Unit 4, Lesson 4: Converting Weight Using Dimensional Analysis
Warm-Up: Orca vs. Human
Echolocation is the use of sound waves and echoes to navigate and find food, as seen in bats and whales.
An orca can “see” objects via echolocation from 150 meters (m) away.


A human with 20/20 vision can see objects clearly from 20 feet (ft.) away.


1. How many times farther can an orca “see” than a human with 20/20 vision?
ManuscriptCopy

Guided Activity: Conversions of Mass and Weight
In the metric system of measurement, the most common units for measuring mass include milligrams (mg), grams (g), and kilograms (kg). In the customary system, the most common units for measuring weight include ounces (oz.), pounds (lb.), and tons (t.).
1. With your partner, discuss some real-world examples of measuring mass.
Several common conversion factors for weight and mass are shown.
1 oz. ≈ 28.35 g
1 lb. ≈ 454 g
1 kg ≈ 2.204 lb.
1 lb. = 16 oz.
Each conversion factor can be expressed as a ratio or unit rate. For example, 454g 1 lb is a unit rate of g to lb.
2. Dr. Corlett, a veterinarian, uses weight, in kg, to determine safe dosages of medicine to prescribe for animals. One of her patients, Opie, is a golden retriever that weighs 85 lb.
Complete the calculation to convert Opie’s weight to kg. Round to the nearest tenth.
3. Explain why it’s important to include the units in conversion calculations.
4. The table includes information about several of Dr. Corlett’s patients.
A certain medication Dr. Corlett uses cannot be prescribed to dogs that weigh less than 10 kg. For which dogs does Dr. Corlett need to be careful not to prescribe this medication?
5. Rosey, a new patient of Dr. Corlett’s, weighs 340 oz. Explain whether Dr. Corlett can prescribe the medication to Rosey.
ManuscriptCopy
Collaborative Activity: Conversions within and between Systems
Conversion factors that can be used to convert mass between and within measurement systems are shown.
Converting from Customary to Metric
Converting from Metric to Customary
1. The weights and masses of 4 objects are given in the table. Work with your partner to complete the table by using the conversion factors listed. Round to the nearest thousandth when necessary.
2. Marleigh is making sourdough bread, and the recipe calls for 250 g of flour. At the store, she bought a bag of flour that weighs 0.50 lb. Explain whether Marleigh has enough flour to make the sourdough bread.
ManuscriptCopy
Lesson Summary
Weight and mass are often used interchangeably, but they are not quite the same, as you’ll learn in science. The mass of an object never changes, but the weight changes depending on gravity.
For example, your weight on Earth and your weight on the Moon would be different, while your mass would remain the same. Since you’re in math class here on Earth, mass and weight will be used interchangeably.
Customary System to Metric System
1 ounce (oz.) ≈ 28.35 grams (g)
1 ounce (oz.) ≈ 2.54 kilograms (kg)
1 pound (lb.) ≈ 454 grams (g)
1 pound (lb.) ≈ 0.305 kilograms (kg)
Practice Problems
Metric System to Customary System
1 gram (g) ≈ 0.035 ounces (oz.) 1 kilogram (kg) ≈ 35.274 ounces (oz.) 1 gram (g) ≈ 0.0022 pounds (lb.) 1 kilogram (kg) ≈ 2.204 pounds (lb.)
1. Leah lives in Wales. In Wales, body weight is measured using a unit called a stone. The stone has been a measurement of mass since before the Romans. Leah is packing to go on vacation and is allowed 25 kg of luggage on the flight. Leah uses her bathroom scale to measure the weight of her luggage. The luggage weighs 3 stone and 3 lb. Determine whether Leah’s luggage is over the weight limit if 1 stone ≈ 14 lb.
2. The US Department of Transportation regulates the size and weight of commercial vehicles for safety and road maintenance. The limit for tractor trailers is 40 t. Determine the maximum amount of kg a tractor trailer can weigh to meet the regulations if 1 t. = 2,000 lb. Round to the nearest hundredth.
3. Sheila is baking brownies, and the recipe calls for 113 g of butter. Sheila’s scale only measures in oz. How many oz. of butter does Sheila need? Round to the nearest hundredth.
Review Problems
4. The relationship between a distance, in yards (yd.), ��, and the same distance in miles (mi.), ��, is described by the equation �� = 1760��.
a. Find measurements in yd. and mi. for distances by completing the table.
b. Is there a proportional relationship between a measurement in yards and a measurement in miles for the same distance? Explain why or why not.
5. Estimate the side length of a square that has a 9 centimeters (cm) long diagonal.
Unit 4, Lesson 5: Converting Units of Volume Using Dimensional Analysis
Warm-Up: Mayan Currency
The ancient Maya used cacao beans, the main ingredient in chocolate, as a form of currency.
They didn’t use coins as money, but instead mostly bartered and traded items such as tobacco, maize (corn), and clothing. Archeologists have found that chocolate was used as currency by the 8th century CE, in the form of fermented and dried cacao beans. Maya artwork indicates that cacao beans could be exchanged for goods and services, including payment for labor and taxes.
Just like any other currency, cacao could be converted to other kinds of money, including Spanish gold and silver coins, such as the real. 200 cacao beans were worth 1 Spanish real.
1. If 24,000 cacao beans were worth 15 pesos, what was the rate of cacao beans for 1 peso?
2. How many pesos were equal to 1 Spanish real?
Exploration Activity: Pouring Liquids to Find Conversion Rates
All of us use containers that have volume. Most of those containers are labeled with both liquid customary measurements and liquid metric measurements.
1. List some liquid customary measurements and liquid metric measurements.
Many soft drinks come in 2-liter (L) bottles, while milk is often sold by the gallon (gal.).
2. Which container do you think holds more liquid? Explain your reasoning.
Both L and gal. are units used to measure liquid volume. Liters are units within the metric system, while gallons are part of the customary system.
3. What do you predict is the relationship between L and gal., based on the size of the containers? Write your initial prediction in the table.
Watch the short video of liquid being poured from one container into another.
4. Based on your initial prediction and the amount of liquid in each container now, discuss the relationship between L and gal. Then, write a revised prediction in the previous table.
Continue watching the remainder of the video.
5. Based on the video, what is your final estimate for the relationship between L and gal.?
Your teacher will give you the actual conversion rate.
6. How close is your estimate to the actual conversion rate?
Collaborative Activity: Converting Liquid Volume Measurements
1. Aleah is mixing concrete for a home improvement project. According to the directions on the bag, she needs 6 gal. of water to mix the amount of concrete she needs. The mixing bucket only has markings in L. How many L of water does she need to measure out for mixing the concrete? Round to the nearest tenth.
ManuscriptCopy
2. Most cars have a fuel tank that can hold between 45 L and 65 L of gasoline. What is the range of gasoline that a typical fuel tank can hold in terms of gal.? Round to the nearest hundredth.
Guided Activity: Converting Liquid Volume Measurements
1. Use the conversion rates to find each value. Round to the nearest hundredth.
ManuscriptCopy
2. There are 100 centiliters (cL) in a L and 4 quarts (qt.) in a gal. How many cL are in 2.75 qt.?
a. 240 milliliters (mL) ≈ cups (c.)
b. 100 fluid ounces (fl. oz.) ≈ L
Lesson Summary
The units commonly used for liquid capacity within each system are shown, listed from smallest to largest.
Customary System Metric System
fluid ounces (fl. oz.)
cups (c.) pints (p.)
quarts (qt.)
gallons (gal.)
milliliters (mL) liters (L)
The table shows the conversion rates across systems for common units of liquid capacity in the customary and metric systems. Customary System to Metric System
Practice Problems
ManuscriptCopy
1. Mateo buys a package of 12 water bottles. Each bottle holds 500 mL of water. How many qt. are in the package if 1 qt. = 4 c.? Round to the nearest thousandth.
2. Use conversion rates to find each value. Round to the nearest thousandth.
a. 6 c. ≈ mL
b. 300 mL ≈ fl. oz.
c. 2 L ≈ qt.
d. 10 gal. ≈ L
3. Determine how many mL are in 2.2 gal if 1 gal. = 16 c. Round to the nearest thousandth.
Review Problems
4. On a map with a scale of 1 inch to 12 feet, the area of a restaurant is 60 square inches. Han says that the actual area of the restaurant is 720 square feet. Do you agree or disagree? Explain your reasoning.
5. Find the area of the polygon.
ManuscriptCopy

Unit 4, Lesson 6: Increasing and Decreasing
Warm-Up: Improving Their Game
Here are the scores from 3 different sports teams from their last 2 games.
1. What do you notice about the teams’ scores? What do you wonder?
2. Which team improved the most? Explain your reasoning.
Exploration Activity: Increasing and Decreasing
1. A cereal box says that now it contains 20% more. Originally, it came with 18.5 ounces (oz.) of cereal. How much cereal does the box come with now?

2. The price of a shirt is $18.50, but you have a coupon that lowers the price by 20%. What is the price of the shirt after using the coupon?
ManuscriptCopy

Collaborative Activity: Using Diagrams to Represent Percent Increase or Decrease
1. Two diagrams are shown.


Match each situation to a diagram. Be prepared to explain your reasoning.
Compared with last year’s strawberry harvest, this year’s strawberry harvest is a 25% increase. A B
This year’s blueberry harvest is 75% of last year’s. A B
Compared with last year, this year’s peach harvest decreased 25%. A B
This year’s plum harvest is 125% of last year’s plum harvest. A B
2. Draw a tape diagram to represent each situation.
a. The number of ducks living at a pond increased by 40%.
b. The number of mosquitoes decreased by 80%.
A double number line can also be used to model percent increase or percent decrease. 3. A movie theater decreased the size of their popcorn bags by 20%. The old bags each held 15 cups (c.) of popcorn. The double number line models this context.


a. On the top number line, plot the 15 c. of popcorn as the initial value of 100%.
b. On the second line, plot 20% less than the initial 100%.
c. Use the double number line to find the number of c. in the smaller bag.
d. Discuss with your partner how the double number line is helpful for determining the impact of a 20% decrease in the size of the popcorn bag. Summarize your discussion.
Lesson Summary
Imagine that it takes Andre 3 4 , more time than it takes Jada to get to school. This means Andre’s time is 1 3 4 , or 1.75 times Jada’s time. This situation can also be described in terms of percentages.
The diagram shows that Andre’s time is 75% more than Jada’s time. It also shows that Andre’s time is 175% of Jada’s time. In general, the terms percent increase and percent decrease describe an increase or decrease in a quantity as a percentage of the starting amount.
ManuscriptCopy

A percentage decrease tells how much a quantity went down, expressed as a percentage of the starting amount.
A percentage increase tells how much a quantity went up, expressed as a percentage of the starting amount.
For example, if there were 500 grams (g) of cereal in the original package, then “20% more” means that 20% of 500 g has been added to the initial amount: 500 + (0.2) ⋅ 500 = 600. So, there are 600 g of cereal in the new package.
A tape diagram representing the situation shows that the new amount is 120% of the initial amount because 500 + (0.2) ⋅ 500 = (1 + 0.2)500.
A double number line also shows information about percent increase and percent decrease.
The double number line shows that 600 g corresponds to 120%.


If the initial amount of 500 g is decreased by 40%, then the new amount of cereal can be found by subtracting 40% of the 500 g, as shown.
500 − (0.4) ⋅ 500 = (0.6) ⋅ 500 = 300
Notice that a 40% decrease is the same as 60% of the initial amount. The diagram shows that 300 g is lined up with 60%.
ManuscriptCopy
Practice Problems
1. For each diagram, decide if �� is an increase or a decrease relative to ��. Then determine the percent increase or decrease.

2. Write each percent increase or decrease as a percentage of the initial amount. The first one is done for you.
a. This year, there was 40% more snow than last year.
The amount of snow this year is 140% of the amount of snow last year.
b. This year, there were 25% fewer sunny days than last year.
ManuscriptCopy
c. Compared to last month, there was a 50% increase in the number of houses sold this month.
d. The runner’s time to complete the marathon was a 10% less than the time to complete the last marathon.
3. A bakery used 25% more butter this month than last month. If the bakery used 240 kilograms (kg) of butter last month, how much did it use this month?
4. Last week, the price of oranges at the farmer’s market was $1.75 per pound (lb.). This week, the price has decreased by 20%. What is the price of oranges this week?
Review Problem
5. The equation �� = 3�� represents the relationship between the distance, ��, in inches (in.), that a snail is from a certain rock and the time, ��, in minutes (min.).
a. What does the number 3 represent?
b. How many min. does it take the snail to get 9 in. from the rock?
c. How far will the snail be from the rock after 9 min.?
ManuscriptCopy
ManuscriptCopy
Unit 4, Lesson 7: Percent Increase and Decrease with Equations
Warm-Up: Number Talk from 100 to 106
1. How do you get from one number to the next using multiplication or division?
a. From 100 to 106
b. From 100 to 90
c. From 90 to 100
d. From 106 to 100
Exploration Activity: Interest and Depreciation
1. Money in a particular savings account increases by about 6% after a year. How much money will be in the account after one year if the initial amount is $100? $50? $200? $125? �� dollars? If you get stuck, consider using diagrams or a table to organize your work.
ManuscriptCopy
2. The value of a new car decreases by about 15% in the first year. How much will a car be worth after one year if its initial value was $1,000? $5,000? $5,020? �� dollars? If you get stuck, consider using diagrams or a table to organize your work.

Collaborative Activity: Matching Equation
Match an equation to each of these situations. Be prepared to share your reasoning.
1. The water level in a reservoir is now 52 meters (m). If this was a 23% increase, what was the initial depth?
2. The snow is now 52 inches (in.) deep. If this was a 77% decrease, what was the initial depth?
ManuscriptCopy
Guided Activity: Representing Percent Increase and Decrease with Equations
1. The gas tank in dad’s car holds 12 gallons (gal.). The gas tank in mom’s truck holds 50% more than that. How much gas does the truck’s tank hold? Explain why this situation can be represented by the equation (1.5) ⋅ 12 = ��. Make sure that you explain what �� represents.
2. Write an equation to represent each of the following situations.
a. A movie theater decreased the size of its popcorn bags by 20%. If the old bags held 15 cups (c.) of popcorn, how much do the new bags hold?
b. After a 25% discount, the price of a T-shirt was $12. What was the price before the discount?
c. Compared to last year, the population of Boom Town has increased by 25%.The population is now 6,600. What was the population last year?
ManuscriptCopy
Lesson Summary
Equations can be used to express percent increase and percent decrease.
For example, the diagram shows that �� is 15% more than ��.
The same relationship can be represented using any of the equations shown.
�� = �� + 0.15��
�� = (1 + 0.15)��
�� = 1.15��

Therefore, if someone makes an investment of �� dollars, and its value increases by 15% to $1,250, then the equation 1.15�� = 1,250 can be used to find the value of the initial investment.
Consider another example: The diagram shows that the value �� is 7% less than ��.
The relationship can be represented using any of the equations shown.
�� = �� − 0.07��
�� = (1 − 0.07)��
�� = 0.93��

If the amount of water in a tank decreased 7% from its starting value of �� to its ending value of 348 gal., then the equation 0.93�� = 348 can be used to find the number of gal. the tank held at the beginning.
Often, an equation is the most efficient way to solve a problem involving percent increase or percent decrease.
Practice Problems
1. A pair of designer sneakers was purchased for $120. Since they were purchased, their price has increased by 15%. What is the new price?
2. Elena’s aunt bought her a $150 savings bond when she was born. When Elena is 20 years old, the bond will have earned 105% in interest. How much will the bond be worth when Elena is 20 years old?
3. In a video game, Clare scored 50% more points than Tyler. If �� is the number of points that Clare scored and �� is the number of points that Tyler scored, which equations are correct? Select all that apply.
□ �� = 1.5��
□ �� = �� + 0.5
□ �� = �� + 0.5��
□ �� = �� + 50
□ �� = (1 + 0.5)��
Review Problems
4. Draw a diagram to represent each situation.
a. The number of miles (mi.) driven this month was a 30% decrease of the number of mi. driven last month.
b. The amount of paper that the copy shop used this month was a 25% increase of the amount of paper they used last month.
5. Could 7.2 in. and 28 in. be the diameter and circumference of the same circle? Explain why or why not.
ManuscriptCopy
Unit 4, Lesson 8: More and Less than 1%
Warm-Up: Number Talk: What Percentage?
1. Determine the percentage mentally.
a. 10 is what percentage of 50?
b. 5 is what percentage of 50?
c. 1 is what percentage of 50?
d. 17 is what percentage of 50?
Exploration Activity: Waiting Tables
During one waiter’s shift, he delivered 13 appetizers, 17 entrées, and 10 desserts.
1. What percentage of the dishes he delivered were:
a. desserts?
b. appetizers?
c. entrées?
2. What do your percentages add up to?
Exploration Activity: Fractions of a Percent
1. Find each percentage of 60. What do you notice about your answers?
a. 30% of 60
b. 3% of 60
c. 0.3% of 60
d. 0.03% of 60
2. 20% of 5,000 is 1,000 and 21% of 5,000 is 1,050. Find each percentage of 5,000 and be prepared to explain your reasoning. If you get stuck, consider using the double number line diagram.
a. 1% of 5,000
b. 0.1% of 5,000
c. 20.1% of 5,000
d. 20.4% of 5,000
ManuscriptCopy
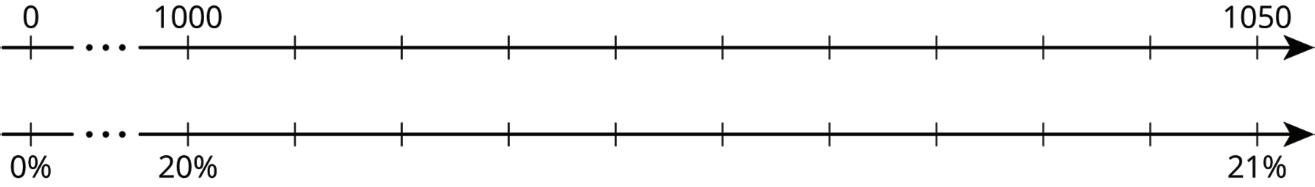
3. 15% of 80 is 12 and 16% of 80 is 12.8. Find each percentage of 80 and be prepared to explain your reasoning.
a. 15.1% of 80
b. 15.7% of 80
Collaborative Activity: Population Growth
1. The population of City A was approximately 243,000 people, and it increased by 8% in one year. What was the new population?
2. The population of City B was approximately 7,150,000, and it increased by 0.8% in one year. What was the new population?
ManuscriptCopy
Lesson Summary
A percentage, such as 30%, is a rate per 100. To find 30% of a quantity, multiply it by 30 100 ? or 0.3.
The same method works for percentages that are not whole numbers, like 7.8% or 2.5%. To find 2.5% of a quantity, we multiply it by 2.5 100 or 0.025.
In the square shown, 2.5% of the area is shaded.
• For example, to calculate 2.5% interest on a bank balance of $80, multiply (0.025) ⋅ 80 = 2; the interest earned is $2.
Sometimes, it’s possible to find percentages like 2.5% mentally by using convenient whole-number percentages. For example, 25% of 80 is 1 4 of 80, which is 20. Since 2.5 is 1 10 of 25, 2.5% of 80 is 1 10 of 20, which is 2. Patterns such as these can be used to calculate percentages mentally.
Practice Problems
1. The student government snack shop sold 32 items this week. For each snack type, what percentage of all snacks sold were of that type?
ManuscriptCopy

2. Select all the options that have the same value as 3 1 2 % of 20.
□ 3.5% of 20 □ 3 1 2 ⋅ 20
□ (0.35) ⋅ 20
□ (0.035) ⋅ 20 □ 7% of 10
3. 22% of 65 is 14.3. What is 22.6% of 65? Explain your reasoning.
Review Problems
4. A bakery used 30% more sugar this month than last month. If the bakery used 560 kilograms of sugar last month, how much did it use this month?
5. Two diagrams are shown.


ManuscriptCopy
Match each diagram to a situation. The diagrams can be used more than once.
Situation Diagram
The amount of apples this year decreased by 15% compared with last year’s amount. A B
The amount of pears this year is 85% of last year’s amount. A B
The amount of cherries this year increased by 15% compared with last year’s amount. A B
The amount of oranges this year is 115% of last year’s amount. A B
6. A certain type of car has room for 4 passengers.
a. Write an equation relating the number of cars, ��, to the number of passengers, ��.
b. How many passengers could fit in 78 cars?
c. How many cars would be needed to fit 78 passengers?
ManuscriptCopy
Unit 4, Lesson 9: Tax and Tip
Warm-Up: Notice and Wonder: The Price of Sunglasses
You are on vacation and want to buy a pair of sunglasses for $10 or less. You find a pair with a price tag of $10. The cashier says the total cost will be $10.45.
What do you notice? What do you wonder?
ManuscriptCopy

Exploration Activity: Shopping in Two Different Cities
Different cities have different sales tax rates. Here are the sales tax charges on the same items in two different cities. Complete the tables.
City 1
City 2
ManuscriptCopy
Exploration Activity: Shopping in a Third City
Here is the sales tax on the same items in City 3.
1. What is the tax rate in this city?
2. For the sales tax on the laundry soap, Kiran says it should be $0.84. Lin says it should be $0.87. Do you agree with either of them? Explain your reasoning.
Guided Activity: Dining at a Restaurant
1. Jada has a meal in a restaurant. She adds up the prices listed on the menu for everything they ordered and gets a subtotal of $42.00.
a. When the check comes, it says they also need to pay $3.99 in sales tax. What percentage of the subtotal is the sales tax?
b. After tax, the total is $45.99. What percentage of the subtotal is the total?
ManuscriptCopy
c. They actually pay $52.99. The additional $7 is a tip for the server. What percentage of the subtotal is the tip?

Laundry Soap
2. The tax rate at this restaurant is 9.5%.
a. Another person’s subtotal is $24.95. How much will their sales tax be?
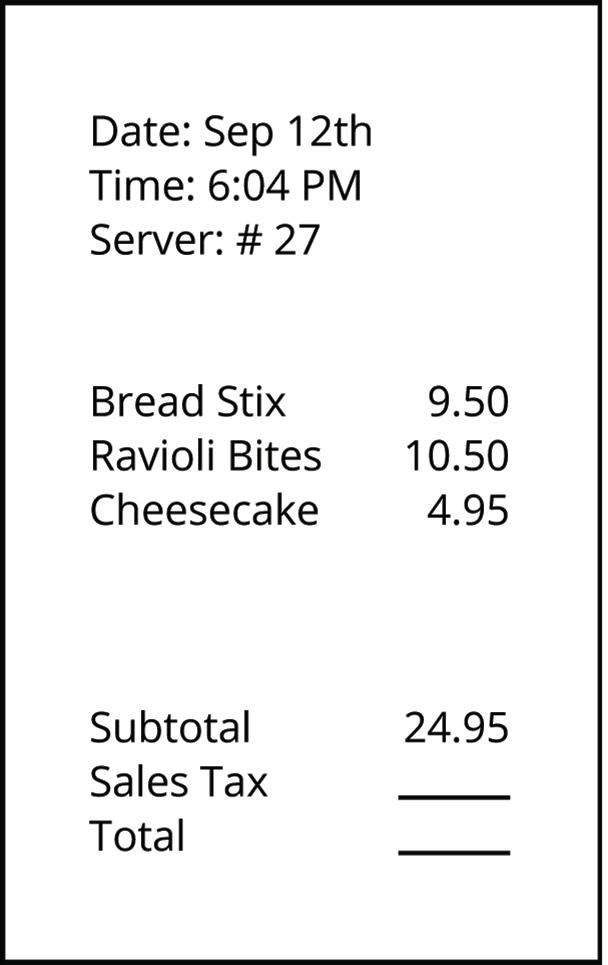
b. Some other person’s sales tax is $1.61. How much was their subtotal?
ManuscriptCopy

Lesson Summary
Many places have sales tax. A sales tax is an amount of money that a government agency collects on the sale of certain items. For example, a state might charge a tax on all cars purchased in the state. Often, the tax rate is given as a percentage of the cost. For example, a state’s tax rate on car sales might be 2%, which would mean that for every car sold in that state, the buyer has to pay a tax that is 2% of the sale price of the car.
Fractional percentages often arise when a state or city charges a sales tax on a purchase. For example, suppose the sales tax in a city in South Carolina is 7.5%. This means that when someone buys something, they have to add 0.075 times the amount on the price tag to determine the total cost of the item. If the price tag on a T-shirt says $11.50, then the sales tax is (0.075) ⋅ 11.5 = 0.8625, which rounds to 86 cents. The customer pays 11.50 + 0.86, or $12.36, for the shirt.
The total cost to the customer is the item price plus the sales tax. This can be thought of as a percent increase. In this example, the total cost to the customer is 107.5% of the price listed on the tag.
A tip is an amount of money that a person gives someone who provides a service. Another word for tip is gratuity. It is customary in many restaurants to give the server a tip that is between 15% and 20% of the cost of the meal. If a person plans to leave a 15% tip on a meal, then the total cost will be 115% of the cost of the meal.
Practice Problems
1. In a city in Ohio, the sales tax rate is 7.25%. Complete the table to show the sales tax and the total price including tax for each item.
2. The sales tax rate in New Mexico is 5.125%. Select all the equations that represent the sales tax, ��, you would pay in New Mexico for an item of cost ��?
□ �� = 5.125��
= 0.5125��
3. Here are the prices of some items and the amount of sales tax charged on each in Nevada.
a. What is the sales tax rate in Nevada?
b. Write an expression for the amount of sales tax charged, in dollars, on an item that costs �� dollars.
4. Find each amount.
ManuscriptCopy
5. On Monday, the high was 60 degrees Fahrenheit. On Tuesday, the high was 18% more. How much did the high increase from Monday to Tuesday?
6. Complete the table. Explain or show your reasoning.
ManuscriptCopy
Ceiling Fan 2.8 feet (ft.) Water
(mm)
ManuscriptCopy
Unit 4, Lesson 10: Percentage Contexts
Warm-Up: Leaving a Tip
Which of these expressions represent a 15% tip on a $20 meal? Which represent the total bill?
15 ⋅ 20
20 + 0.15 ⋅ 20
1.15 ⋅ 20
15 100 ⋅ 20
Exploration Activity: A Car Dealership
A car dealership pays a wholesale price of $12,000 to purchase a vehicle.
1. The car dealership wants to make a 32% profit.
a. By how much will they mark up the price of the vehicle?

b. After the markup, what is the retail price of the vehicle?
ManuscriptCopy
2. During a special sales event, the dealership offers a 10% discount off of the retail price. After the discount, how much will a customer pay for this vehicle?
Collaborative Activity: Commission at a Gym
1. For each gym membership sold, the gym keeps $42 and the employee who sold it gets $8. What is the commission the employee earned as a percentage of the total cost of the gym membership?
2. If an employee sells a family pass for $135, what is the amount of the commission they get to keep?
Guided Activity: Simple Interest
1. Kristina received $100 in a birthday card and wants to put the money into her savings account, where she will earn an additional 2% each year it remains in her account. This is known as simple interest.
a. How much is 2% of $100?
b. How much money will be in Kristina’s savings account after 1 year if she makes no additional transactions after depositing her birthday money?
c. Compare your answers with your partner’s, and discuss how you determined the answer for part B.
2. Suppose an investment of $100 earns $3.50 in interest in 1 year.
a. What percentage of the investment was earned in interest?
b. What investment amount will earn $61.60 in 2 years at the same rate?
When a person makes an investment, they earn interest on their account for investing their money in the account or fund. When a person borrows money through a loan or credit card, they pay interest to the lender for use of the money.
The simple interest formula is �� = �� ∙ �� ∙ ��, where �� is the interest earned, �� is the principal (or starting) amount, �� is the interest rate per year (expressed as a decimal), and �� is time (the length of the investment), in years.
3. Tonio took out a six-year car loan for $15,600, with a 3% simple interest rate over the life of the loan.
a. How much interest, in dollars, will Tonio pay annually?
b. How much will Tonio pay in interest over the course of 6 years?
c. What is the total amount that Tonio will have paid back by the end of his six-year loan?
d. Explain why the total amount that Tonio will have paid back by the end of his loan is more than the loan amount he borrowed.
Lesson Summary
There are many common situations where a percentage of an amount of money is added to or subtracted from that amount in order to be paid to some other person or organization. The table shows different examples that arise in everyday life.
Type of Percentage Change
Sales tax
Gratuity or tip
Interest
Markup
Markdown or discount
Who does the money go to?
The government
The server
The lender or account holder
The seller
The customer
Commission The salesperson
Three examples are described in more detail.
How does this type of percentage change work?
Added to the price of the item
Added to the cost of the meal, usually before any sales tax
Added to the balance of the loan, credit card, or bank account
Added to the price of an item so the seller can make a profit
Subtracted from the price of an item, to encourage the customer to buy it
Subtracted from the payment that is collected after the sale
• If a restaurant bill is $34 before taxes, and the customer pays $40 plus tax, then they left $6 as a tip for the server. That is 18% of $34, so they left an 18% tip. From the customer’s perspective, this is an 18% increase of the restaurant bill.
• If a realtor helps a family sell their home for $200,000 and earns a 3% commission, then the realtor earns $6,000, because (0.03) ⋅ 200, 000 = 6, 000, and the family gets $194,000, because 200, 000 − 6, 000 = 194, 000. From the family’s perspective, this is a 3% decrease on the sale price of the home.
ManuscriptCopy
• If Sanjay puts $750 into a savings account that offers a 2% simple interest rate, then at the end of 5 years, he will have $825 in the account (without any additional transactions). Using the simple interest formula, he earns (750) ∙ (5) ∙ (0.02), or $75, in interest. When the interest earned is added to the initial amount in the savings account, the result is $825 at the end of 5 years.
Simple interest is a method of computing interest. Interest is computed from the (original) principal alone no matter how much money has accrued so far.
Practice Problems
1. A car dealership pays $8,350 for a car. They mark up the price by 17.4% to get the retail price. What is the retail price of the car at this dealership?
2. Quana is researching rates for investing $3,500 over a three-year period. How much money would Quana earn on an investment that offers a 4% simple interest rate?
3. A store has a 20% off sale on pants. With this discount, the price of one pair of pants before tax is $15.20. What was the original price of the pants?
ManuscriptCopy
A. $3.04
B. $12.16
C. $18.24
D. $19.00
4. Lin is shopping for a couch with her dad and hears him ask the salesperson, “How much is your commission?” The salesperson says that her commission is 5 1 2 % of the selling price.
a. How much commission will the salesperson earn by selling a couch for $495?
b. How much money will the store get from the sale of the couch?
Review Problem
5. A college student takes out a $7,500 loan from a bank. What will the balance of the loan be after one year (assuming the student has not made any payments yet):
a. if the bank charges 3.8% interest each year?
b. if the bank charges 5.3% interest each year?
Unit 4, Lesson 11: Finding
the Percentage
Warm-Up: Tax, Tip, and Discount
1. What percentage of the car price is the tax?

2. What percentage of the food cost is the tip?

3. What percentage of the shirt cost is the discount?

Guided Activity: What Is the Percentage?
1. A salesperson sold a car for $18,250 and their commission is $693.50. What percentage of the sale price is their commission?
2. The bill for a meal was $33.75. The customer left $40.00. What percentage of the bill was the tip?
3. The original price of a bicycle was $375. Now it is on sale for $295. What percentage of the original price was the markdown?
Collaborative Activity: Info Gap: Sporting Goods
Your teacher will give you either a problem card or a data card. Do not show or read your card to your partner.
If your teacher gives you the problem card:
1. Silently read your card and think about what information you need to be able to answer the question.
2. Ask your partner for the specific information that you need.
3. Explain how you are using the information to solve the problem.
4. Continue to ask questions until you have enough information to solve the problem.
5. Share the problem card and solve the problem independently.
6. Read the data card and discuss your reasoning.
If your teacher gives you the data card:
1. Silently read your card.
2. Ask your partner “What specific information do you need?” and wait for them to ask for information.
3. If your partner asks for information that is not on the card, do not do the calculations for them. Tell them you don’t have that information.
4. Before sharing the information, ask “Why do you need that information?” Listen to your partner’s reasoning and ask clarifying questions.
5. Read the problem card and solve the problem independently.
6. Share the data card and discuss your reasoning.
Pause here so your teacher can review your work. Ask your teacher for a new set of cards and repeat the activity, trading roles with your partner.
Lesson Summary
When finding a value from a percentage change, determine the increase or decrease from the original value. The original value is 100%. Two examples are shown.
Problem Solution Equation
Find the percent increase or percent decrease using the initial amount and the final amount. Two examples are shown, each with 2 ways to find the percent change.
A plant was 12 inches (in.) tall and grew to be 15 in. tall. What was the percentage increase?
• The plant grew 3 in. because 15 − 12 = 3. Divide this growth by the original height: 3 12 = 0.25. Therefore, the height of the plant increased by 25%.
• The plant’s new height is 125% of the original height because 15 ÷ 12 = 1.25. This means the height increased by 25%, because 125% − 100% = 25%.
A rope was 2.4 meters (m) long. Someone cut it down to 1.9 m. What was the percent decrease?
• The rope is now 2.4 − 1.9, or 0.5 m, shorter. Divide this decrease by the original length: 0.5 2.4 . = 0.2083. So, the length of the rope decreased by approximately 20.8%.
• The rope’s new length is about 79.2% of the original length because 1.9 ÷ 2.4 = 0.7916. The length decreased by approximately 20.8%, because 100% − 79.2% = 20.8%.
Practice Problems
1. A music store marks up the instruments it sells by 30%.
a. If the store bought a guitar for $45, what will be its store price?
b. If the price tag on a trumpet says $104, how much did the store pay for it?
c. If the store paid $75 for a clarinet and sold it for $100, did the store mark up the price by 30%?
2. A family eats at a restaurant. The bill is $42. The family leaves a tip and spends $49.77.
a. How much was the tip in dollars?
b. How much was the tip as a percentage of the bill?
3. The price of gold is often reported per ounce. At the end of 2005, this price was $513. At the end of 2015, it was $1,060. By what percentage did the price per ounce of gold increase?
Review Problem
4. A phone keeps track of the number of steps taken and the distance traveled. Based on the information in the table, is there a proportional relationship between the two quantities? Explain your reasoning.
ManuscriptCopy
Unit 4, Lesson 12: Measurement Error
Warm-Up: Measuring to the Nearest
Your teacher will give you two rulers and three line segments labeled A, B, and C.
1. Use the centimeter (cm) ruler to measure each line segment to the nearest cm. Record these lengths in the first column of the table.
2. Use the millimeter (mm) ruler to measure each line segment to the nearest tenth of a centimeter. Record these lengths in the second column of the table. Line Segment
Exploration Activity: Measuring a Soccer Field
A soccer field is 120 yards (yd.) long. Han measures the length of the field using a 30-foot-long tape measure and gets a measurement of 358 feet (ft.), 10 inches (in.).
1. What is the amount of the error?
ManuscriptCopy
2. Express the error as a percentage of the actual length of the field.
Lesson Summary
When measuring a length using a ruler or measuring tape, it’s possible to get a measurement that is different from the actual measure. This could be because the ruler is positioned incorrectly, or it could be because the ruler is not very precise. There is always at least a small difference between the actual length and a measured length, even if it is a microscopic difference.
Two rulers with different markings are shown.

The second ruler is marked in mm, so it is easier to get a measurement to the nearest tenth of a cm with this ruler than with the first. For example, a line that is actually 6.2 cm long might be measured as 6 cm long by the first ruler because it measures to the nearest cm. This is called measurement error.
Measurement error is the positive difference between a measured amount and the actual amount.
Measurement error is often expressed as a percentage of the actual value. A positive number is always used to express measurement error, and when appropriate, words are used to describe whether the measurement is greater than or less than the actual value.
For example, if a line is measured as 6 cm when it is actually 6.2 cm long, then the measurement error is 0.2 cm, or about 3.2%, because 0.2 ÷ 6.2 ≈ 0.032. The measurement error was 3.2% less than the actual measure.
ManuscriptCopy
Practice Problems
1. A watermelon weighs 8,475 grams (g). A scale measured the weight with an error of 12% under the actual weight. What was the measured weight?
2. The depth of a lake is 15.8 meter (m).
a. Jada accurately measured the depth of the lake to the nearest m. What measurement did Jada get?
b. By how many meters does the measured depth differ from the actual depth?
c. Express the measurement error as a percentage of the actual depth.
3. Noah’s oven thermometer gives a reading that is 2% greater than the actual temperature.
a. If the actual temperature is 325∘F, what will the thermometer reading be?
b. If the thermometer reading is 76∘F, what is the actual temperature?
Review Problem
4.
a. Fill in the table for side length and area of different squares.
b. Is the relationship between the side length of a square and the area of a square proportional?
Unit 4, Lesson 13: Percent Error
Warm-Up: Number Talk: Estimating a Percentage of a Number
Estimate each.
1. 25% of 15.8
2. 9% of 38 3. 1.2% of 127 4. 0.53% of 6 5. 0.06% of 202
Guided Activity: Plants, Bicycles, and Crowds
1. Instructions to care for a plant say to water it with 3 4 cup (c.) of water every day. The plant has been getting 25% too much water. How much water has the plant been getting?
ManuscriptCopy
2. The pressure on a bicycle tire is 63 pounds per square inch (psi). This is 5% higher than what the manual says is the correct pressure. What is the correct pressure?
3. The crowd at a sporting event is estimated to be 2,500 people. The exact attendance is 2,486 people. What is the percent error?
Collaborative Activity: Measuring in the Heat
A metal measuring tape expands when the temperature goes above 50℉. For every degree Fahrenheit (℉) above 50, its length increases by 0.00064%.
1. The temperature is 100℉. How much longer is a 30-foot (ft.) measuring tape than its correct length?
2. What is the percent error?
Lesson Summary
Percent error can be used to describe any situation where there is a correct value and an incorrect value. The percent error describes the relative difference between them.
The percent error is the difference between the estimated number and the actual number as a percentage of the actual value.
For example, if a milk carton is supposed to contain 16 fluid ounces (fl. oz.) but it only contains 15 fl. oz., then each statement shown is true.
• The measurement error is 1 fl. oz.
• The percent error is 6.25%, because 1 ÷ 16 = 0.0625.
Percent error is also used when talking about estimates. For example, a teacher estimates there are about 600 students at their school. If there are actually 625 students, then the percent error for this estimate was 4%, because 625 − 600 = 25 and 25 ÷ 625 = 0.04.
Notice that, when finding the percent error, the denominator, or divisor, is always the actual value.
Practice Problems
1. A student estimated that it would take 3 hours (hr.) to write a book report, but it actually took her 5 hr. What is the percent error for her estimate?
2. A radar gun measured the speed of a baseball at 103 miles per hour (mph). If the baseball was actually going 102.8 mph, what was the percent error in this measurement?
3. It took 48 minutes (min.) to drive downtown. An app estimated it would be less than that. If the error was 20%, what was the app’s estimate?
4. A farmer estimated that there were 25 gallons (gal.) of water left in a tank. If this is an underestimate by 16%, how much water was actually in the tank?
Review Problems
5. For each diagram, decide if �� is an increase or a decrease of ��. Then determine the percentage.

6. Lin is making a window covering for a window that has the shape of a half circle on top of a square of side length 3 ft. How much fabric does she need?
ManuscriptCopy
Unit 5: Rational Number Arithmetic
ManuscriptCopy
Unit 5, Lesson 1: Equivalent Forms of Rational Numbers
Warm-Up: Estimating a Percentage
A student got 16 out of 21 questions correct on a quiz. Use mental estimation to answer these questions.
1. Did the student answer less than or more than 80% of the questions correctly?
2. Did the student answer less than or more than 75% of the questions correctly?
Exploration Activity: Fraction and Decimal Conversions

1. Use the original number to fill in the missing digits and place values.
2. Consider the number 0.08.
a. In the number 0.08, what is the place value of the final digit?
b. What is the written description of the fraction 8 100 ?
c. Discuss with your partner any similarities or differences between the decimal 0.08 and the fraction 8 100 .
3. Complete each statement.
In the decimal 0.7, the final digit is in the
the equivalent fraction form.
In the decimal −0.037, the final digit is in the tenths hundredths thousandths place, so
is the equivalent fraction form.
A fraction can be converted into its equivalent decimal form by dividing the numerator by the denominator.
4. To convert the fraction 1 4 to a decimal, divide 1 by 4 by completing the diagram shown. 4 1 . 0 0
ManuscriptCopy
Numberofones,ingroupsof4
Amountthatremains
Numberoftenths,ingroupsof4
Amountthatremains
Numberofhundredths,ingroupsof4
Amountthatremains
Guided Activity: Conversions with Percentages
Percentages can also be written as fractions with a denominator of 100, or as a decimal.
1. Write 66% as a fraction and as a decimal.
To convert a decimal to a percentage, multiply the decimal by 100.
2. Convert the decimal 0.16 to a percentage.
To convert a percentage to a decimal, divide the percentage by 100 or multiply it by 1 100 .
3. Convert 16.2% to a decimal.
When converting fractions to percentages, generate an equivalent fraction with a denominator of 100 when possible.
4. Complete the table.
Collaborative Activity: Conversions with Percentages
1. Complete the table by converting each value to the equivalent form indicated.
2. Complete the table by converting each value to the equivalent form indicated. Simplify where applicable.
ManuscriptCopy
Lesson Summary
The place value of a number provides the numerical value that each digit has based on its position within a number.
For example, in the number 278.493, the 8 is in the ones place, the 4 is in the tenths place, the 9 is in the hundredths place, and the 3 is in the thousandths place.
This lesson reviewed various strategies for converting rational numbers into different but equivalent forms.
• When rewriting a decimal that is greater than 0 but less than 1 as an equivalent fraction, use the place value of the final digit to determine the denominator of the fraction. For example, in the number 0.12, the final place value is the hundredths place, so the equivalent fraction form of 0.12 is 12 100 = 3 25.
• Recall that a percentage is a ratio expressed as a fraction of 100. Percent means “for each 100.” For example, 40% means “40 out of 100,” so 40% is equivalent to the fraction 40 100 = 2 5 .
• A fraction can be rewritten as an equivalent decimal by dividing the numerator by the denominator.
Practice Problems
1. Rewrite each value as a decimal.
2. Convert each value to an equivalent percentage.
ManuscriptCopy
3. Rewrite each value as an equivalent fraction. Simplify where applicable.
a. −0.94 b. 1.7 c. 86% d. 167%
Review Problems
4. Here are several recipes for sparkling lemonade. For each recipe describe how many tablespoons (tbsp.) of lemonade mix it takes per cup (c.) of sparkling water.
a. 4 tbsp. of lemonade mix and 12 c. of sparkling water
b. 4 tbsp. of lemonade mix and 6 c. of sparkling water
c. 3 tbsp. of lemonade mix and 5 c. of sparkling water
d. 1 2 tbsp. of lemonade mix and 3 4 c. of sparkling water
5. Solve each equation mentally.
a. 5 2 ⋅ �� = 1
b. �� ⋅ 7 3 = 1
c. 1 ÷ 11 2 = ��
Unit 5, Lesson 2: Rewriting Rational Numbers
Warm-Up: Notice and Wonder: Fractions to Decimals
A calculator gives the following decimal expansions for some unit fractions.
1 2 = 0.5 1 3 = 0.3333333 1 4 = 0.25 1 5 = 0.2 1 6 = 0.1666667
What do you notice? What do you wonder?
Guided Activity: Rewriting Rational Numbers
1. Consider the fractions in the table shown.
a. Rewrite each fraction in its equivalent decimal form by dividing the numerator by the denominator. Then, indicate whether each decimal is terminating or repeating. If a decimal repeats digits in a pattern, use an ellipsis (. . .).
b. Circle the fractions in the table that are greater than 1 or less than −1. Then, rewrite each as a mixed number.
c. Based on your work in part A, explain whether it is possible for a repeating decimal to ever terminate.
d. Discuss with your partner any patterns you notice about the denominators of fractions whose decimal equivalents are repeating.
Repeating decimals are written with a bar over the digits that repeat. For example, the fraction 13 6 is expressed as 2.16 when written as a decimal because the 6 is the digit that repeats infinitely.
2. Isabel divided 85 by 99 to rewrite 85 99 in decimal form. She found the resulting pattern
0.858585 . . . Write 85 99 in its equivalent decimal form.
3. N’iara divided 22 by 7 to rewrite 22 7 in decimal form. She found the resulting pattern
3.142857142857 . . . Write 22 7 in its equivalent decimal form.
4. Complete the table by rewriting each fraction in its equivalent decimal form.
5. What is the equivalent decimal form of 5 8 ?
6. What is 0.625 rewritten as a percentage?
7. What is 5 8 rewritten as a percentage?
8. When rewriting a fraction as a percentage, why might it be helpful to first rewrite it in its equivalent decimal form?
9. Complete the table by converting each value to its equivalent forms.
Collaborative Activity: Strategies for Rewriting Rational Numbers
Working with your partner, use the words in the bank to complete each statement. Words can be used more than once.
Word Bank
1. To convert a to a decimal, divide the by the .
2. Multiply the by 100 to convert a to a
ManuscriptCopy
3. To rewrite a as a , divide the by 100.
4. Use the of the final digit to determine the denominator of the decimal when rewriting a as an equivalent .
5. An equivalent fraction with a of 100 can be used to convert a to a percentage.
Lesson Summary
Recall from Lesson 1 that a rational number can be converted into its equivalent decimal form by dividing the numerator by the denominator.
A rational number is a real number that can be expressed as a ratio of two integers.
A rational number can be written as a fraction, �� �� , where �� and �� are integers and �� ≠ 0, or as a decimal. In decimal form, rational numbers either terminate or repeat.
A repeating decimal has digits that keep going in the same pattern over and over. The repeating digits are marked with a line above them.
For example, the fraction − 25 22 is expressed as −1.136, a repeating decimal, because the digits 3 and 6 repeat infinitely. On a calculator, this would appear as −1.136363636.
Rational numbers can also be expressed as percentages by multiplying the decimal form by 100. For example, −1.136 can be expressed as 113.63% because −1.136 × 100 = 113.63. Percentages are often rounded to a specified place value when used in a real-world context.
ManuscriptCopy
Practice Problems
1. Complete the table by rewriting each value in its equivalent forms.
2. Rewrite each rational number as a percentage.
11 50
2.45
38 11
ManuscriptCopy
3. Draw a line connecting each fraction in column A to its equivalent decimal form in column B.
Review Problems
4. Select all quantities that are proportional to the diagonal length of a square.
□ Area of a square
□ Perimeter of a square
□ Side length of a square
ManuscriptCopy
5. Jada is making circular birthday invitations for her friends. The diameter of the circle is 12 centimeters (cm). She bought 180 cm of ribbon to glue around the edge of each invitation. How many invitations can she make?
ManuscriptCopy
Unit 5, Lesson 3: Comparing Rational Numbers
Warm-Up: Remembering Double Number Lines
1. Complete the double number line diagram with the missing numbers.

2. What could each of the number lines represent? Invent a situation and label the diagram.
3. Make sure your labels include appropriate units of measure.
ManuscriptCopy
Exploration Activity: Comparing Numbers
1. A number line is shown with points ��, ��, ��, and �� labeled.
Complete each statement.
a. The value of point �� is greater than less than the value of point ��.
b. The value of point �� is greater than less than the value of point ��.
c. The value of point �� is greater than less than the value of point ��.
d. The value of point �� is equal to not equal to the value of point ��.
2. Use >, <, or = to complete each statement.
3. Discuss with your partner strategies you used to compare each pair of values.
4. For which mathematical statements in question 2 could the symbol ≠ also be used?
5. Zaylee wrote the mathematical statement −4 3 7 ≠ −4.5.
a. Rewrite the mathematical statement to create another true mathematical statement using either > or <.
b. Explain why both mathematical statements are true.
Collaborative Activity: Comparing Rational Numbers
1. The value �� can be approximated using the values 3.14 and 22 7 .
a. Complete the statement using >, <, or = . 3.14 22 7
b. Explain which value would be a more precise approximation for the value of ��.
2. The table shows the lowest temperature, in degrees Celsius (℃), for 6 consecutive days in January in Greenville, South Carolina.
a. Write a mathematical statement comparing Monday’s lowest temperature to Tuesday’s lowest temperature.
b. Find someone who wrote a different mathematical statement. Compare your mathematical statement to theirs. Discuss any similarities or differences.
c. On Sunday, the lowest temperature was −2.2℃. Select all of the statements that are true.
□ The lowest temperature on Sunday was greater than the lowest temperature on Thursday.
□ The lowest temperature on Sunday was less than the lowest temperature on Tuesday.
□ The lowest temperature on Sunday was equal to the lowest temperature on Friday.
□ The lowest temperature on Sunday was equal to the lowest temperature on Tuesday.
□ The lowest temperature on Sunday was greater than or equal to the lowest temperature every day except Monday.
□ The lowest temperature on Sunday was less than or equal to the lowest temperature every day except Monday.
3. Juliette and Anton each wrote a mathematical statement comparing the values −7 2 5 and −7.4. Their mathematical statements and reasoning are shown.
Juliette’s Statement and Reasoning
Since −7 2 5 is greater than or equal to −7.4, the statement −7 2 5 ≥ −7.4 correctly compares the values.
Anton’s Statement and Reasoning
Since −7 2 5 is equal to −7.4, the statement −7 2 5 = −7.4 correctly compares the values.
a. Explain which student(s) wrote a correct mathematical statement.
b. Write another mathematical statement that is true for the 2 values.
ManuscriptCopy
c. Chris reasons that the statement −7 2 5 > −7.4 must also be correct. Explain whether you agree with Chris.
Lesson Summary
Different symbols can be used to compare rational numbers. Several symbols and their meanings are shown in the table.
Symbol Meaning Symbol Meaning Symbol Meaning
> “is greater than” ≥ “is greater than or equal to” = “is equal to”
< “is less than” ≤ “is less than or equal to” ≠ “is not equal to”
Number lines can be helpful for making comparisons. For example, the locations of 1 4 7 and − 1 6 are shown on a number line. Because − 1 6 is to the left of 1 4 7 on a number line, − 1 6 is less than 1 4 7 . Since − 1 6 is not at the same location on the number line as 1 4 7 , they are not equal to each other. The values can correctly be compared using the statements shown.
Each statement can also be written in the reverse order, with the reverse symbol being used in the first and second statements.
Practice Problems
1. Use >, <, or = to compare each pair of values.
a. −4.6 − 23 5
b. 1 3 7 12%
c. −9.65 17 8
d. −3 3 5 −32
2. Select all of the statements that are true.
□ 33% ≠ 1 2
□ − 18 4 ≤ −4.5
□ −1.47 ≥ 0.42%
□ 4 7 13 > 97%
□ −1.65 = −2 1 7
□ 2.75 ≥ 275%
Review Problems
3. Noah picked 3 kilograms (kg) of cherries. Jada picked half as many cherries as Noah. How many total kg of cherries did Jada and Noah pick?
A. 3 + 0.5
B. 3 − 0.5
C. (1 + 0.5) ⋅ 3
D. 1 + 0.5 ⋅ 3
4.
a. Use the equation �� = 5 2 �� to complete the table. Is �� proportional to �� and ��? Explain why or why not.
b. Use the equation �� = 3.2�� + 5 to complete the table. Is
�� and ��? Explain
Unit 5, Lesson 4: Locating Rational Numbers on a Number Line
Warm-Up: Which Is Greater?
Without calculating, decide which quotient is larger.
11 ÷ 23 or 7 ÷ 13
0.63 ÷ 2 or 0.55 ÷ 3
15 ÷ 1 3 or 15 ÷ 1 4
Exporation Activity: Plotting Rational Numbers on a Number Line
1. Use the number line shown to complete the following.
a. Make a tick mark halfway between each value marked on the number line. Label each tick mark with the value of its location.
b. Make another tick mark halfway between each value and the tick marks that you already made. Label each tick mark with the value of its location.
c. Plot and label the values −1 1 3 and 0.8 on the number line.
d. Discuss with your partner how the tick marks helped you plot each value.
ManuscriptCopy
2. Four values are shown. 1 1 4 , −1.2, 30%, −0.17
a. Plot and label each value on the number line.
b. Complete the inequality statement to show the relationship between the values.
Complete the statements.
c. When moving from left to right (→) on the number line, the values increases. decreases.
This can be described as moving in a positive negative direction.
d. When moving from right to left (←) on the number line, the values increases. decreases.
This can be described as moving in a positive negative direction.
ManuscriptCopy
1. Six values are shown.
Plot and label each value on the number line. -2-1012
2. Point �� is shown on the number line.
0-1-2-3321 M
Explain how to estimate the value ��.
3. Plot and label the rational
Lesson Summary
When plotting rational numbers on a number line, the sign of the number indicates which direction from 0 to move on the number line.
• Positive numbers are to the right of 0 on a horizontal number line.
• Negative numbers are to the left of 0 on a horizontal number line.
Rational numbers can be converted into equivalent forms to assist with comparing values. For example, − 18 4 can be rewritten as −4.5 to determine its relative position between −4 and −5 on a number line.
Practice Problems
1. Plot and label the rational numbers − 7 8 , 21 7 , 4.3, −3.45, and 1.67 on the number line. -6-50123456 -4-3-2-1
2. Points ��, ��, ��, and �� are shown on the number line. -6-50123456 -4-3-2-1
Complete each statement with a rational number from the list shown. One value will not be used.
a. Point �� is located at on the number line.
b. Point �� is located at on the number line.
c. Point �� is located at on the number line.
d. Point �� is located at on the number line.
3. Students were asked to plot the value − 9 2 on a number line. The points that Luther and Jasmine plotted to represent this value are shown.
-12-11-10-9-8-7-6-5-4-3-2-10123
Explain whether you agree with Luther or Jasmine about the location of the value − 9 2 .
Review Problems
4. At the beginning of the month, there were 80 ounces (oz.) of peanut butter in the pantry. Since then, the family ate 0.3 of the peanut butter. How many oz. of peanut butter are in the pantry now?
A. 0.7 ⋅ 80
B. 0.3 ⋅ 80
C. 80 − 0.3
D. (1 + 0.3) ⋅ 80
5.
a. Find 3 different ratios that are equivalent to 7 ∶ 3.
b. Explain why these ratios are equivalent.
6. Water is running into a bathtub at a constant rate. After 2 minutes (min.), the tub is filled with 2.5 gallons (gal.) of water. Write two equations for this proportional relationship. Use �� for the amount of water, in gal., and �� for time, in min. In each case, what does the constant of proportionality tell you about the situation?
ManuscriptCopy
Unit 5, Lesson 5: Adding Rational Numbers
Warm-Up: Mental Calculations
Find a strategy to make each calculation mentally.
1. 599 + 87
2. 254 − 88 3. 99 ⋅ 75
Exploration Activity: Adding Positive Rational Numbers
1. Adrian added 5.25 and 6.4. His work is shown.
a. Write an explanation to Adrian detailing any mistakes he made and how he can correct his work.
b. What is the sum of 5.25 and 6.4?
ManuscriptCopy
2. Johannes added 1 8 and 3 4 . Part of her work is shown.
a. Complete Johannes’s work by filling in the blank boxes.
Johannes’s Work
b. Complete the statements by choosing a word or number from the bank. Not all words and numbers may be used, and some may be used more than once.
numerators
common denominator
To find the sum of 1 8 and 3 4 , Johannes first rewrote each fraction using a . The of 8 and 4 that Johannes used was . Then, she added the . together to find the sum of .
3. Work with your partner to match pairs of expressions that have the same sum. Then, write the equivalent expressions on the lines provided to create 3 true equations.
Collaborative Activity: Reviewing Operations with Integers
Work with your partner to complete the following.
1. Four addition expressions are shown in the table.
a. Complete the table. The first row has been completed as an example.
b. How did the size of the absolute value for each addend determine the sign of the sum?
c. Explain how finding the sum for the first 2 expressions was different from finding the sum for the last 2 expressions.
d. How are the sums for 10 + (−6) and (−10) + 6 similar?
ManuscriptCopy
e. How are the sums for (−10) + (−6) and 10 + 6 different?
2. Complete the statements.
a. When 2 addends have different the same sign(s), the sum will have the sign of the addends.
b. When 2 addends have different the same sign(s), the sum will have the sign of the addend with the greater absolute value.
3. Apply the statements made in problem 2 to expressions with rational numbers in the table. Find the sum of each expression. Then, verify your answer using a calculator.
ManuscriptCopy
4. Complete the statement. The sign rules for adding integers are the same not the same as the rules for adding rational numbers.
Guided Activity: Applying Signed Number Rules to Rational Numbers
1. Find the sum for each addition expression without using a calculator.
2. The blanks in the addition equation represent missing digits in the values.
a. Fill in the blanks for the addition equation shown to create a true equation.
ManuscriptCopy
b. Describe the process you used to determine the values for each of the blanks above.
Lesson Summary
When adding rational numbers, it’s helpful to keep in mind the strategies you learned from prior courses.
• When finding the sum of decimals, add digits with the same place value.
• When finding the sum of fractions, rewrite each fraction using a common denominator. Then, add the numerators, and write their sum over the common denominator.
• When adding a mixture of fractions and decimals, it’s helpful to first rewrite all addends into the same form of rational numbers by converting decimals to fractions or vice versa.
Strategies used for adding integers in 6th grade can be applied to signed rational numbers.
• When rational numbers have the same sign, their sum will have the same sign. It will be the sum of the absolute values of the addends with the same sign.
For example, −0.74 + (−1.59) = −2.33.
• When rational numbers have different signs, their sum will have the sign of the rational number with the greater absolute value. It will be the difference of the absolute values of the addends with the sign of the addend that has the greater absolute value.
For example, when adding 7 9 + �− 2 9 �, 7 9 has the greater absolute value, so the sum of the values will be positive. The difference of � 7 9 � and �− 2 9
Practice Problems
1. Find the sum of each expression. Show your work.
2. Find the sum of each expression. Show your work.
a. −4.48 + 9.366 b. −12.37 + 18.161
3. Find the sum of each expression. Show your work.
a. −0.4 + �− 7 1 4 � b. −233.24 + 25 4 5
4. Select all of the expressions that result in a positive rational number.
□ −7 2 3 + 5 7 9
□ 0.89 + (−0.15)
□ 113.42 + 97.01
□ 7 4 + (−0.6)
□ −48.21 + (−12.76)
□ 3 4 9 + �− 1 7 11�
5. Elena walked 12 miles. Then she walked 0.25 that distance. How far did she walk all together? Select all that apply.
□ 12 + 0.25 ⋅ 12
□ 12(1 + 0.25)
□ 12 ⋅ 1.25
□ 12 ⋅ 0.25
□ 12 + 0.25
6. A circle’s circumference is 600 meters (m). What is a good approximation of the circle’s area?
A. 300 square meters (sq. m)
B. 3,000 sq. m
C. 30,000 sq. m
D. 300,000 sq. m
ManuscriptCopy
Unit 5, Lesson 6: Subtracting Rational Numbers
Warm-Up: Math Talk
Several students discussed which fraction was greater, 13 19 or 2 3 . A summary of the discussion is shown.
Amy I changed 13 19 to 13 18 , and since 2 3 is equal to 12 18, I’m about 70% confident that 13 19 is greater than 2 3 .
Brandon
The fractions were small enough that I could do mental math and change them into common denominators, so 13 19 = 39 57 , and 2 3 = 38 57. Therefore, 13 19 is greater than 2 3 .
Carlos I changed 13 19 to 14 20. Then, I thought of a pizza, and that’s a lot of little pieces. So, I’m about 70% confident that 2 3 is bigger than 13 19 .
Dimitri I know 2 3 is 12 18 if I multiply the top and bottom by 6. 12 18 is bigger than 13 19 . I’m 90% confident.
1. Explain which student’s reasoning you agree with.
2. Choose 1 student you don’t agree with, and explain why you don’t agree.
Exploration Activity: Understanding Differences Using Number Lines
Finding the difference of 2 numbers means to subtract the numbers. When finding the difference between 2 numbers, subtract the numbers in the order they are named. For example, the difference of 3.5 and −1.5 is represented by the subtraction expression 3.5 − (−1.5).
The difference of 2 numbers is how far apart the numbers are on a number line. -5-4.5-4-3.5-3-2-1.5-1-0.500.511.522.533.544.55 +5
Complete the statements.
1. The numbers 3.5 and −1.5 are units apart. The direction to move from the second number (−1.5) to the first number (3.5) is to the left, right, or in the positive negative direction. Therefore, 3.5− (−1.5) = + 5.
2. Suppose the numbers are subtracted in the opposite order, (−1.5 ) − 3.5. The numbers 3.5 and −1.5 are still units apart, but the direction of the move has changed. To move from the second number (3.5) to the first number (−1.5) is to move to the left, right, or in the positive negative direction. Therefore, (−1.5) − 3.5 = −5.
-5-4.5-4-3.5-3-2-1.5-1-0.500.511.522.533.544.55 -5
Collaborative Activity: Understanding Differences Using Number Lines
1. Work with your partner to complete the table. Write each phrase as a subtraction expression. Then, draw a number line representation to find the value of the expression. The first row has been completed as an example.
2. Work with your partner to complete the table to find each difference. The first row has been completed as an example.
− (−6.2)
Right/positive
Left/negative
− (−6.2) = (−9.9) − 6.2
Right/positive
Left/negative
− 6.2 = (−9.9) − (−6.2)
Right/positive
Left/negative
− (−6.2) = 6.2 − 9.9
Right/positive
Left/negative
− 9.9 = 6.2 − (−9.9)
Right/positive
Left/negative
− (−9.9) =
− 9.9
− (−9.9)
Right/positive Left/negative
Right/positive
Left/negative
− 9.9 =
− (−9.9) =
Guided Activity: Finding Differences
Recall from 6th grade that adding a negative value has the same result as subtracting a positive value. This is because addition and subtraction have an inverse relationship.
For example, 5 + (−6) is equivalent to 5 − 6. Both expressions have a value of −1.
This relationship can be used to subtract rational numbers. The difference of 2 numbers can be rewritten as an equivalent addition expression. Then, the rules for addition can be used.
1. Fill in the blanks to complete the table.
Process
Start with the original expression.
Rewrite as an equivalent addition problem by keeping the first term, changing subtraction to addition, and then changing the second term to its opposite.
ManuscriptCopy
Find the value of the expression using the rules of addition.
Collaborative Activity: Does the Order Matter?
1. With your partner, determine who will be partner A and who will be partner B. partner A will work on the problems in Column A, while partner B works on the problems in Column B. Then, work together to answer the questions that follow.
2. Explain the difference between the expressions in Column A and the expressions in Column B
3. Explain the relationship between the values of the expressions in Column A and the value of the expressions in Column B
Lesson Summary
The term difference indicates subtraction. The difference between 2 numbers is how far apart the numbers are on a number line.
For example, 4.5 and −1.5 are 6 units apart on a number line, so 4.5 − (−1.5) = 6.
-2-1.5-1-1.5-0.500.511.522.533.544.5
Notice that when subtraction is performed in the opposite order, the difference is the opposite. For example, (−1.5) − 4.5 = −6.
-2-1.5-1-1.5-0.500.511.522.533.544.5 -6
While distance cannot be negative, the sign in this case indicates direction. Subtraction can be thought of as asking, “How far is the first number from the second number?” To find the distance to 4.5 from −1.5, or 4.5 − (−1.5), would mean moving 6 units to the right on a number line, a move represented with a positive value. To find the distance to −1.5 from 4.5, or (−1.5) − 4.5, would mean moving 6 units to the left on a number line, a move represented with a negative value.
Practice Problems
1. What is the difference of 9 14 and − 13 20 ?
2. Find the difference for each expression.
a. 5 7 8 (−2 2 5 )
b. −45.6 − (−1.772)
3. Select all of the expressions that have a difference of −0.3.
□ −12.9 − (−13.2)
□ −6.4 − (−6.1)
□ −0.7 − 0.4
□ 4.8 − (5.1)
□ 7.7 − 8
□ 5 − 4.7
Review Problems
4. If Quadrilateral Q is a scaled copy of Quadrilateral P created with a scale factor of 3, what is the perimeter of Q?

5. In one version of a trail mix, there are 3 cups (c.) of peanuts mixed with 2 c. of raisins. In another version of trail mix, there are 4.5 c. of peanuts mixed with 3 c. of raisins. Are the ratios equivalent for the two mixes? Explain your reasoning.
Unit 5, Lesson 7: Adding
and
Subtracting to Solve Problems
Warm-Up: Equivalent Equations
1. Using the digits 1 to 6 no more than once each, fill in the boxes so that the top 2 equations are equivalent and the bottom equation has the greatest value.
ManuscriptCopy
Guided Activity: Adding and Subtracting Rational Numbers in Real-World Contexts
1. Alexis has a subscription to a video streaming service for $7.20 per month. For her birthday, she received a gift card for the streaming service in the amount of $55.00.
a. Write a numeric expression using addition to represent the balance on the card after 1 month if the only charge on the gift card is the monthly subscription.
b. Complete the table by filling in values on each blank line to record the activity on the account each month. Continue filling in the table to determine how many months it will take before Alexis does not have enough money to pay the monthly fee using the gift card.
c. How many months will it take before Alexis does not have enough money left on the gift card to pay the monthly charge?
2. The departure from the average is the difference between the actual amount of rain and the average amount of rain for a given month. The departure from the average rainfall, in inches (in.), for Mobile, Alabama, for June, July, and August in a particular year is shown in the table.
a. If the average rainfall for June was 7 29 50 in., what was the actual rainfall in June?
b. What is the difference in the departure from the average rainfall from July to August?
ManuscriptCopy
and
Contexts
1. The table shows transactions for 4 different checking accounts. A negative number represents a debit, or removing money from the account. A positive number represents a credit, or adding money to the account.
a. Each checking account had the same starting balance. Without performing any calculations, discuss with your partner which account will have the most money in it after completing the transactions shown. Summarize your discussion.
b. With your partner, decide who will calculate the overall change in the account balance for accounts 1 and 2, and who will calculate them for accounts 3 and 4. Then, find the overall change in balance for each account after applying the transactions.
c. Discuss with your partner which strategies you used to find the overall change in balance for each account. Then, check your work and make revisions, if necessary.
d. Which account will have the greatest final balance?
e. Which account will have the smallest final balance?
2. Sasha spends fall break backpacking through the beginning part of the Badwater Basin Trail in Death Valley, California. Her journey includes climbing up and down the hills and mountains. Sasha’s changes in elevation, in feet (ft.), between each checkpoint of her trip are shown in the table.
a. Complete the table to determine Sasha’s change in elevation for each checkpoint. The first row has been completed to show that the change in elevation is determined by subtracting the beginning elevation from the final elevation.
b. Which checkpoint had the greatest change in elevation from the previous checkpoint?
ManuscriptCopy
c. What do the signs of the change in elevation mean in this context?
Lesson Summary
Positive and negative rational numbers can be used to represent quantities in context.
For example, elevations and account balances can be represented by positive and negative rational numbers. Operations on positive and negative rational numbers can be used to help understand and analyze situations.
To solve problems in these situations, first determine the meaning of 0 in the context to understand whether the quantities should be identified as positive or negative. Then, determine which operation(s) should be performed to solve the problem.
Practice Problems
1. The table shows the change in value for a share of stock in a company at the end of each of the first 4 weeks during the month of December. A negative value represents the amount the share decreased, and a positive value represents the amount the share increased.
If the value of the stock began at $75.37 at the start of the month, what is the final value of the share at the end of the month?
2. Samuel is practicing for his town’s annual high school quarterback football-throwing competition. Last year’s champion threw the football 40 1 4 yards (yd.). A summary of Samuel’s throws in relation to the throws of last year’s champion is shown. Complete the table to determine how far Samuel threw the football during each of his 3 tries.
3. Scientists studying climate variations in Antarctica record the temperature, in degrees Celsius (℃), at multiple points throughout the day. The table shows the temperatures recorded on Wednesday. Complete the table to determine the changes in temperature throughout the day.
12:00 AM–5:30 AM
6:00 AM–11:30 AM
12:00 PM–5:30 PM
6:00 PM–11:30 PM
Review Problems
4. The radius of Earth is approximately 6,400 kilometers (km). The equator is the circle around Earth dividing it into the northern and southern hemispheres (The center of Earth is also the center of the equator.) What is the length of the equator?
5. Ants have 6 legs. Elena and Andre write equations showing the proportional relationship between the number of ants, ��, and the number of ant legs, ��. Elena writes �� = 6 ⋅ �� and Andre writes �� = 1 6 ⋅ ��. Do you agree with either of the equations?
Explain your reasoning.
ManuscriptCopy
ManuscriptCopy
Unit 5, Lesson 8: Multiplying Rational Numbers
Warm-Up: Would You Rather?
1. Explain whether you would rather have a stack of quarters that stands from the floor to the top of your head, or $225.
2. Explain whether you would change your mind if the quarters were stacked to the top of your desk.
Guided Activity: Multiplying Rational Numbers
Recall what you learned about multiplying integers in 6th grade.
1. Complete the statements to describe the rules for multiplying integers.
a. The product of 2 positive integers is a positive negative integer.
b. The product of 2 negative integers is a positive negative integer.
c. The product of a negative integer and a positive integer is a positive negative integer.
ManuscriptCopy
2. Discuss with your partner whether you think the same rules apply to all rational numbers.
3. Complete the table. Use a calculator to find the product of each expression to verify whether the same rules for signs apply when multiplying rational numbers. Expression Sign of Product Using the Rules
21.285 · (−3.8)
(−91.09)(−6.4)
4. Complete the statement.
The rules for multiplying rational numbers are the same as different from the integer rules for multiplication.
5. Find the product of each expression without using a calculator. a. (−6.4)(−2.51) b. � 3 4
Collaborative Activity: Multiplying Rational Numbers
1. With your partner, decide who will be partner A and who will be partner B. Then, find the product of the expression in the column that matches your letter. Show your work in the space provided for each problem in your column.
ManuscriptCopy
The expressions in each row have the same product. Check your work with your partner, and if necessary, resolve any differences.
2. Choose a value from Row A and a value from Row B that, when multiplied, will result in a negative answer. Then, calculate the product. Show your work in the space provided.
Value from Row A Value from Row B Product × =
Lesson Summary
Generalizations made for multiplying integers in 6th grade apply for all rational numbers.
• When multiplying 2 positive rational numbers, the result is a positive rational number. For example, 7.2 · (1.6) = 11.52.
• When multiplying 2 negative rational numbers, the result is also a positive rational number. For example, �−5 1
• When multiplying 1 positive and 1 negative rational number, the result is a negative rational number. For example, (4.5) · �− 2 3
ManuscriptCopy
Practice Problems
1. Determine each product.
a. (−3.4)(2.7)
2. Determine each product.
a. �− 6 7 ��− 3 4 �
3. Determine each product.
a. −6 1 2 · �3 2 5 �
b. 20(−8.6)
c. �− 1 4 � · ( 14.8)
b. 70.62 · (−16)
b. −4.8�− 5 8 �
4. Draw a line connecting each expression in column A to an equivalent expression in column B.
Review Problem
5. These triangles are scaled copies of each other.


For each pair of triangles listed, the area of the second triangle is how many times larger than the area of the first?
a. Triangle G and Triangle F
b. Triangle G and Triangle B
c. Triangle B and Triangle F
ManuscriptCopy
d. Triangle F and Triangle H
e. Triangle G and Triangle H
f. Triangle H and Triangle B
Unit 5, Lesson 9: More Multiplying Rational Numbers
Warm-Up: Which One Doesn’t Belong: Expressions
1. Which expression doesn’t belong?
A. 7.9��
B. 7.9 ⋅ (−10)
C. 7.9 + ��
D. −79
Collaborative Activity: Matching Expressions
Your teacher will give you cards with multiplication expressions on them. Match the expressions that are equal to each other. There will be 3 cards in each group.
ManuscriptCopy
Collaborative Activity: Multiplying Rational Numbers
Evaluate the expressions in one of the columns. Your partner will work on the other column. Check in with your partner after you finish each row. Your answers in each row should be the same. If your answers aren’t the same, work together to find the error.
ManuscriptCopy
Column A
Column B
Lesson Summary
When multiplying 2 values, the following rules can be used.
• A positive number times a positive number is always positive.
• A negative number times a negative number is also always positive.
• A negative number times a positive number (or a positive number times a negative number) is always negative. For example, 3
When multiplying more than 2 values, the factors can be multiplied in pairs until the product is reached. There are also patterns that emerge when multiplying multiple factors. Several examples are shown in the table, where the negative factors are shown in blue.
• When there are an odd number of negative factors, the product is negative.
• When there are an even number of negative factors, the product is positive.
Practice Problems
1. Evaluate each expression.
2. Evaluate each expression.
a. �− 1 5 � ⋅ 2 ⋅ � 3 7 �
b. �− 1 5 � ⋅ (−2) ⋅ � 3 7 �
c. �− 1 5 � ⋅ (−2) ⋅ � 3 7 �
Review Problems
3. Order each set of numbers from least to greatest.
a. 4, 8, −2, −6, 0 b. −5, −5.2, 5.5,
4. 30 + −30 = 0.
a. Write another sum of two numbers that equals 0.
b. Write a sum of three numbers that equals 0.
c. Write a sum of four numbers that equals 0, none of which are opposites.
5. A submarine is searching for underwater features. It is accompanied by a small aircraft and an underwater robotic vehicle.
At one time the aircraft is 200 meters (m) above the surface, the submarine is 55 m below the surface, and the underwater robotic vehicle is 227 m below the surface.
a. What is the difference in height between the submarine and the aircraft?
b. What is the distance between the underwater robotic vehicle and the submarine?
6. Fill in the missing numbers in these equations.
a. (−7) ⋅ ? = −14
b. ? ⋅ 3 = −15
c. ? ⋅ 4 = 32
d. −49 ⋅ 3 = ?
ManuscriptCopy
Unit 5, Lesson 10: Dividing Rational Numbers
Warm-Up: Notice and Wonder
Several division equations are shown.
1. What do you notice about the equations?
2. What do you wonder about the pattern?
3. Use the pattern of the equations to determine the quotients of the first 2 equations.
Guided Activity: Dividing Positive Rational Numbers
1. Ren found the quotient of 12.636 ÷ 3.12, making at least 1 error in her work.
a. Circle the error(s) in Ren’s work, and write an explanation of the error(s). Then, find the correct quotient.
b. What advice do you have for Ren that could help her with dividing decimals in the future?
2. Trevor found the quotient of �38 13
, making at least 1 error in his work. Circle the error(s) in Trevor’s work. Write an explanation of the error(s). Then, find the correct quotient.
Collaborative Activity: Dividing Rational Numbers
Recall what you learned about dividing integers in 6th grade.
1. Complete the statements to describe the rules for dividing integers.
a. The quotient of 2 positive integers is a positive negative integer.
b. The quotient of 2 negative integers is a positive negative integer.
c. The quotient of a negative integer divided by a positive integer is a positive negative integer.
d. The quotient of a positive integer divided by a negative integer is a positive negative integer.
2. Discuss with your partner whether you think the same rules apply to rational numbers. Write a summary of your reasoning.
3. Complete the table. Use a calculator to find the quotient of each expression to verify whether the same rules for signs apply when dividing rational numbers.
4. Complete the statement. The rules for dividing rational numbers are the same as different from the integer rules for division.
5. Circle the expressions that will result in a positive quotient.
6. Write a division sentence in the form of �� ÷ ��, where the value of �� is a number between 15.1 and 16.2, and �� is a number between −4.6 and −3.
7. What is the value of the quotient to the sentence you wrote in question 6?
Lesson Summary
Division problems can be rewritten as multiplication problems.
For example, 8 9 ÷ 2 3 = 4 3 can be rewritten as 2 3 · 4 3 = 8 9
This means that the sign rules for multiplying positive and negative rational numbers also apply to dividing positive and negative rational numbers.
• The sign of a positive number divided by a negative number is always negative.
• The sign of a negative number divided by a positive number is always negative.
• The sign of a negative number divided by a negative number is always positive.
• The sign of a positive number divided by a positive number is always positive.
Practice Problems
1. Find the value of each expression.
�−3 5 9 � ÷ �3 1 3 �
�−1 6 7 � ÷ �5 3 4 �
2. Find the value of each expression.
70.62 ÷ (−160.5)
−44.64 ÷ (−2.88)
8 1 5 ÷ 3 2
3. Determine each quotient.
−31.68 ÷ (−1.2)
7 2 5 ÷ � 3 4 �
−45.018 ÷ (−7.32)
4. Determine each quotient.
112.53 ÷ (−9.3)
Review Problems
5. Which one of these shapes is not like the others? Explain what makes it different by representing each width and height pair with a ratio.
ManuscriptCopy

6. Diego made a graph of two quantities that he measured and said, “The points all lie on a line except one, which is a little bit above the line. This means that the quantities can’t be proportional.” Do you agree with Diego? Explain.
ManuscriptCopy
Unit 5, Lesson 11: Expressions with Rational Numbers
Warm-Up:
Rational Numbers
Decide if each statement is true or false. Be prepared to explain your reasoning.
1. (−38.76)(−15.6) is negative
2. 10,000 − 99,999 < 0 3. � 3 4
4. (30)(−80) − 50 = 50 − (30)(−80)
Collaborative Activity: The Same but Different
Your teacher will give you a set of cards. Group them into pairs of expressions that have the same value.
Exploration Activity: Near and Far from Zero
1. For each set of values for �� and ��, evaluate the given expressions and record your answers in the table.
2. When �� = − 1 2 and �� = 6, which expression: has the largest value? has the smallest value? is the closest to zero?
3. When �� = 1 2 and �� = −6, which expression: has the largest value? has the smallest value? is the closest to zero?
4. When �� = −6 and �� = − 1 2 , which expression: has the largest value? has the smallest value? is the closest to zero?
Collaborative Activity: Seagulls and Sharks
A seagull has a vertical position ��, and a shark has a vertical position ��. Draw and label a point on the vertical axis to show the vertical position of each new animal.
ManuscriptCopy

Low-res after increasing size
1. A dragonfly at ��, where �� = −��
2. A jellyfish at ��, where �� = 2��
3. An eagle at ��, where �� = 1 4 ��
4. A clownfish at ��, where �� = − �� 4
5. A vulture at ��, where �� = �� + ��
6. A goose at ��, where �� = �� − ��
Lesson Summary
Sums, differences, products, and quotients of rational numbers, and combinations of these, can be represented using numeric and algebraic expressions.
The product of 2 numbers can be written algebraically in different ways.
• By putting a little dot between the factors, such as −8.5 ⋅ ��
• By putting the factors in parentheses, such as (−8.5)(��), −8.5(��), or (−8.5)��
• By putting the factors next to each other without any symbol between them, such as −8.5��
The quotient of 2 numbers can be written in different ways as well.
• By writing the division symbol between the numbers, such as −8.5 ÷ ��
• By writing a fraction bar between the numbers, such as −8.5 ��
An algebraic expression like −8.5 �� and a given a value for the variable can be used to find the value of the expression. For example, if �� = 2, then the value of the expression is −4.25 because − 8.5 2 = −8.5 ÷ 2 = −4.25.
Practice Problems
1. The value of �� is −1 4 . Order these expressions from least to greatest.
2. Here are four expressions that have the value −1 2 .
Write five expressions: a sum, a difference, a product, a quotient, and one that involves at least two operations that have the value −3 4 .
Sum:
Difference:
Product:
Quotient:
At least two operations:
3. Find the value of each expression.
a. −22 + 5
b. −22 − (−5)
c. (−22)(−5)
d. −22 ÷ 5 Review Problems
4. The price of an ice cream cone is $3.25, but it costs $3.51 with tax. What is the sales tax rate?
5. Two students are both working on the same problem: A box of laundry soap has 25% more soap in its new box. The new box holds 2 kilograms (kg). How much soap did the old box hold?
• Here is how Jada set up her double number line.

• Here is how Lin set up her double number line.

Do you agree with either of them? Explain or show your reasoning.
a. A coffee maker’s directions say to use 2 tablespoons (tbsp.) of ground coffee for every 6 ounces (oz.) of water. How much coffee should you use for 33 oz. of water?
ManuscriptCopy
b. A runner is running a 10 kilometers (km) race. It takes her 17.5 minutes (min.) to reach the 2.5 km mark. At that rate, how long will it take her to run the whole race?
Unit 5, Lesson 12: Solving Problems with Rational Numbers
Warm-Up: Which One Doesn’t Belong: Equations
Which equation doesn’t belong? 1 2 �� = −50 −60�� = 30
+ 90 = −100
= −0.001��
Exploration Activity: Draining and Filling a Tank
A tank of water is being drained. Due to a technical problem, the sensor does not start working until some time into the draining process. The sensor starts its recording at time 0, when there are 770 liters (L) in the tank. The drain empties the tank at a constant rate of 14 L per minute (min.).
1. Complete the table.
2. Later, someone wants to use the data to determine how long the tank had been draining before the sensor started recording. Complete the table.
3. If the sensor started working 15 min. into the tank draining, how much water was in the tank to begin with?
Collaborative Activity: Buying and Selling Power
A utility company charges $0.12 per kilowatt-hour (kWh) for energy a customer uses. They give a credit of $0.025 for every kWh of electricity a customer with a solar panel generates that they don’t use themselves.
A customer has a charge of $82.04 and a credit of −$4.10 on this month’s bill.
1. What is the amount due this month?
2. How many kWh did they use?
3. How many kWh did they generate that they didn’t use themselves?
Lesson Summary
General rules for arithmetic can be applied to solve problems involving rational numbers. When adding and subtracting rational numbers �� and ��, �� − �� = �� + (−��).
• The equation �� − �� = �� can be used to demonstrate this algebraically. If �� − �� = ��, then �� = �� + �� by adding �� to both sides of the equation. The value −�� can be added to both sides of the new equation to result in �� + (−��) = ��. Therefore, �� − �� = �� + (−��), because both are equivalent to ��.
• Remember that the distance between 2 numbers is independent of the order, but the difference between them does depend on the order.
When multiplying or dividing rational numbers:
• The sign of a positive number multiplied or divided by a negative number is always negative.
ManuscriptCopy
• The sign of a negative number multiplied or divided by a positive number is always negative.
• The sign of a negative number multiplied or divided by a negative number is always positive.
Practice Problems
1. A bank charges a service fee of $7.50 per month for a checking account.
A bank account has $85.00. If no money is deposited or withdrawn except the service charge, how many months until the account balance is negative?
2. The table shows transactions in a checking account. January February March April
a. Find the total of the transactions for each month.
b. Find the mean total for the four months.
3. A large aquarium of water is being filled by a hose. Due to a technical problem, the sensor does not start working until some time into the filling process. The sensor starts its recording at the time 0 min. The sensor initially detects that the tank has 225 L of water in it. The hose fills the aquarium at a constant rate of 15 L per min.
a. What will the sensor read at the time 5 1 8 min.?
b. Later, someone wants to use the data to determine the amount of water in the aquarium before the sensor started recording. What should the sensor have read at the time −7.2 min.?
Review Problems
4. A furniture store pays a wholesale price for a mattress. Then, the store marks up the retail price to 150% of the wholesale price. Later, they put the mattress on sale for 50% off of the retail price. A customer just bought the mattress on sale and paid $1,200.
a. What was the retail price of the mattress before the discount?
b. What was the wholesale price before the markup?
a. A restaurant bill is $21. You leave a 15% tip. How much do you pay including the tip?
b. Which of the following represents the amount a customer pays including the tip of 15% if the bill was �� dollars? Select all that apply.
1.15��