
Grade 6 SOUTH
CAROLINA
ISBN: 979-8-893539-04-2
Math Nation 6-8 was originally developed by Illustrative Mathematics®, and is copyright 2019 by Illustrative Mathematics. It is licensed under Creative Commons Attribution 4.0 International License (CCBY 4.0).
The online curriculum resource platform offered at "mathnation.com", including the videos and practice questions are additions to the original Illustrative Mathematics content is copyright 2023 by Accelerate Learning, Inc.
The trademark "Math Nation" is owned by Accelerate Learning, Inc. All other trademarks and product names referred to in the Math Nation AGA curriculum are the property of their respective owners and used solely for educational purposes. Unless otherwise stated, Math Nation has no relationship with any of the companies or brands mentioned in the curriculum and does not endorse or have a preference for any of those companies or brands.
This curriculum includes public domain images or openly licensed images that are copyright by their respective owners. Openly licensed images remain under the terms of their respective licenses. See the image attribution section for more information. 00820231215
ManuscriptCopy
ManuscriptCopy
ManuscriptCopy
Unit 6, Lesson 1: Diagrams and Equations
Warm-Up: Exploring Diagrams
1. Two diagrams are shown. One represents 2 + 5 = 7. The other represents 5 ⋅ 2 = 10. Which is which? Label the length of each diagram.

2. A diagram is shown.
Using the diagram, identify:
a. One thing that must be true.
b. One thing that could be true or false.
c. One thing that cannot possibly be true.
Exploration Activity: Match Equations and Tape Diagrams
Here are two tape diagrams. Match each equation to one of the tape diagrams.
1. 4 + �� = 12
2. 12 ÷ 4 = ��
3. 4 ⋅ �� = 12
4. 12 = 4 + ��
5. 12 – �� = 4
6. 12 = 4 ⋅ �� 7. 12 – 4 = �� 8. �� = 12 – 4
9. �� + �� + �� + �� = 12

Collaborative Activity: Draw Tape Diagrams for Equations
For each equation, draw a diagram and find the value of the unknown that makes the equation true.
18 = 3 + ��
18 = 3 ⋅ ��
1.
2.
Collaborative Activity: Match Equations and Hanger Diagrams


1. Match each hanger to an equation. Complete the equation by writing ��, ��, ��, or �� in the empty box.
a. + 3 = 6
b. 3 ⋅ = 6
c. 6 = + 1
d. 6 = 3 ⋅
2. Find a solution to each equation. Use the hangers to explain what each solution means.
ManuscriptCopy
Lesson Summary
Diagrams can help with understanding relationships between quantities and how operations describe those relationships.
One such diagram is a tape diagram.

• Diagram A has 3 parts that sum to 21. Each part is labeled with the same letter, indicating the 3 parts are equal. The equations shown represent diagram A.
Notice that the number 3 is not seen in the diagram. The 3 comes from counting 3 boxes representing 3 equal parts in 21. Either the diagram or any of the equations can be used to reason that �� = 7.
• Diagram B has 2 parts that sum to 21. The equations shown represent diagram B. �� + 3 = 21 �� = 21 – 3 3 = 21 – ��
Either the diagram or any of the equations can be used to reason that �� = 18.
Another diagram that can be used to understand relationships in equations is a hanger diagram.
A hanger diagram stays balanced when the weights on both sides are equal. The weights can be changed and the hanger will stay balanced as long as both sides are changed in the same way. For example, adding 2 pounds (lb.) to each side of a balanced hanger will keep it balanced. Removing half of the weight from each side will also keep it balanced. This way of thinking can be used to find solutions to equations. Instead of checking different values, think about subtracting the same amount from each side or dividing each side by the same number.
• Diagram A can be represented by the equation 3�� = 12. When 12 breaks into 3 equal parts, each part will have the same weight as a block with an ��. Splitting each side of the hanger into 3 equal parts is the same as dividing each side of the equation by 3, resulting in the solution �� = 4.
• Diagram B can be represented by the equation 12 = �� + 5. A weight of 5 can be removed from each side of the hanger to keep it in balance. Removing 5 from each side of the hanger is the same as subtracting 5 from each side of the equation, resulting in the solution �� = 7.

Practice Problems
1. Diego is trying to find the value of �� in 5 ⋅ �� = 35. He draws this diagram but is not certain how to proceed.
a. Complete the tape diagram so it represents the equation 5 ⋅ �� = 35.
b. Find the value of ��.
2. Match each equation to one of the two tape diagrams.
a. �� + 3 = 9
b. 3 ⋅ �� = 9
c. 9 = 3 ⋅ ��
d. 3 + �� = 9
e. �� = 9 – 3
f. �� = 9 ÷ 3
g. �� + �� + �� = 9

3. Select all the equations that represent the hanger.
□ �� + �� + �� = 1 + 1 + 1 + 1 + 1 + 1
□ �� ⋅ �� ⋅�� = 6
□ 3�� = 6
�� + 3 = 6

4. Write an equation to represent each hanger.

5. Andre says that �� is 7 because he can move the two 1s with the �� to the other side.
Do you agree with Andre? Explain your reasoning.
Review Problem
ManuscriptCopy

6. The daily recommended allowance of calcium for a sixth grader is 1,200 milligrams (mg). One cup of milk has 25% of the recommended daily allowance of calcium. How many mg of calcium are in a cup of milk? If you get stuck, consider using the double number line.

Unit 6, Lesson 2: Truth and Equations
Warm-Up: Three Letters
1. The equation �� + �� = �� could be true or false.
a. If �� is 3, �� is 4, and �� is 5, is the equation true or false?
b. Find new values of ��, ��, and �� that make the equation true.
c. Find new values of ��, ��, and �� that make the equation false.
2. The equation �� ⋅ �� = �� could be true or false.
a. If �� is 3, �� is 4, and �� is 12, is the equation true or false?
b. Find new values of ��, ��, and �� that make the equation true.
c. Find new values of ��, ��, and �� that make the equation false.
Exploration Activity: Story Time
Here are three situations and six equations. Which equation best represents each situation? If you get stuck, consider drawing a diagram.
1. After Elena ran 5 miles (mi.) on Friday, she had run a total of 20 mi. for the week. She ran �� mi. before Friday.
2. Andre’s school has 20 clubs, which is five times as many as his cousin’s school. His cousin’s school has �� clubs.
3. Jada volunteers at the animal shelter. She divided 5 cups (c.) of cat food equally to feed 20 cats. Each cat received �� c. of food.
+ 5 = 20
ManuscriptCopy
+ 20 = 5
= 20 + 5
= 20
= 5
Collaborative Activity: Using Structure to Find Solutions
Several equations that contain a variable are shown alongside a list of values. Think about what each equation means, and find a solution in the list of values. If you get stuck, consider drawing a diagram. Be prepared to explain why your solution is correct.
Equation
1.
List of Values
Lesson Summary
An equation can be true or false. An example of a true equation is 7 + 1 = 4 ⋅ 2. An example of a false equation is 7 + 1 = 9.
An equation can have a letter in it, such as �� + 1 = 8. This equation is false if �� is 3, because 3 + 1 does not equal 8. This equation is true if �� is 7, because 7 + 1 = 8.
In �� + 1 = 8, the variable is ��. In �� + 1 = 8, the solution is 7.
A variable is a letter that represents a number.
A solution to an equation is a number that can be used in place of the variable to make the equation true.
When a number is written next to a variable, the number and the variable are being multiplied. For example, 7�� = 21 means the same thing as 7 ⋅ �� = 21. In this case, 7 is called the coefficient of ��.
A coefficient is the number or constant that multiplies a variable in an algebraic expression.
If no coefficient is written, the coefficient is 1. For example, in the equation �� + 3 = 5, the coefficient of �� is 1.
Practice Problems
1. Select all the equations that are true.
5 + 0 = 0
2. Mai's water bottle had 24 ounces (oz.) in it. After she drank �� oz. of water, there were 10 oz. left. Select all the equations that represent this situation.
□ 24 ÷ 10 = ��
□ 24 + 10 = ��
□ 24 – 10 = ��
□ �� + 10 = 24
□ 10�� = 24
3. Priya has 5 pencils, each �� inches (in.) in length. When she lines up the pencils end to end, they measure 34.5 in. Select all the equations that represent this situation.
□ 5 + �� = 34.5
□ 5�� = 34.5
□ 34.5 ÷ 5 = ��
□ 34.5 – 5 = ��
□ �� = (34.5) ⋅ 5
4. Match each equation with a solution from the list of values.
1 8 �� = 3
�� ÷ 8 5 = 1
5. The daily recommended allowance of vitamin C for a sixth grader is 45 milligrams (mg). 1 orange has about 75% of the recommended daily allowance of vitamin C. How many mg are in 1 orange? If you get stuck, consider using the double number line.

6. There are 90 kids in the band. 20% of the kids own their own instruments, and the rest rent them.
a. How many kids own their own instruments?
b. How many kids rent instruments?
c. What percentage of kids rent their instruments?
ManuscriptCopy
Unit 6, Lesson 3: Practice Solving Equations and Representing Situations with Equations
Warm-Up:
Subtracting
from 5 Find the value of each expression mentally.
ManuscriptCopy
Collaborative Activity: Solving Equations Practice
With your partner, determine who will be partner A and who will be partner B. Solve the equations in your column only.
Check in with your partner after you finish each row. Your answers in each row should be the same. If your answers aren’t the same, work together to find the error and correct it.
Collaborative Activity: Choosing Equations to Match Situations
Four scenarios are given. In each scenario, identify the equation which cannot be used to represent the situation. If you get stuck, consider drawing a diagram. Then, find the solution for each situation.
1. Olivia has 8 fewer books than Mia. If Mia has 26 books, how many books does Olivia have?
Which equation cannot represent the situation?
A. 26 – �� = 8
B. �� = 26 +8
C. �� + 8 = 26
What is the solution?
D. 26 – 8 = �� �� = ___________
2. A coach formed teams of 8 from all the players in a soccer league. There are 14 teams. How many players are in the league?
Which equation cannot represent the situation?
A. �� = 14 ÷ 8
B. �� 8 = 14
C. 1 8 �� = 14
What is the solution?
D. �� = 14 ⋅ 8 �� = ___________
3. Kylie scored 223 more points in a computer game than Jason did. If Kylie scored 409 points, how many points did Jason score?
Which equation cannot represent the situation?
A. 223 = 409 – ��
B. 409 – 223 = ��
C. 409 + 223 = ��
What is the solution?
D. 409 = 223 + �� �� = ___________
4. Chris ran 28 miles (mi.) last week, which was 4 times as far as Morgan ran. How far did Morgan run?
Which equation cannot represent the situation?
A. 4�� = 28
B. �� = 1 4 ⋅ 28
C. �� = 28 ÷ 4
What is the solution?
D. �� = 4 ⋅ 28 �� = ___________
Lesson Summary
Writing and solving equations can be helpful when answering questions about situations.
Suppose a scientist has 13.68 liters (L) of acid and needs 16.05 L for an experiment. How many more L of acid does she need for the experiment?
• This situation can be represented with the equation 13.68 + �� = 16.05.
• When working with hanger diagrams, it was possible to find the solution by subtracting 13.68 from each side. This results in new equivalent equations that also represent the situation, as shown.
�� =16.05 – 13.68
�� = 2.37
Equations that have the exact same solutions are equivalent equations.
Finding a solution this way leads to a variable on 1 side of the equal sign and a known value on the other side. The solution, 2.37, is easily identified from an equation with a letter on 1 side and a known value on the other. Solutions are often written in this way.
Suppose a food pantry takes a 54 pound (lb.) bag of rice and splits it into portions that each weigh 3 4 of a lb. How many portions can they make from the bag?
• This situation can be represented with the equation 3 4 �� = 54.
• The value of �� can be found by dividing each side of the equation by 3 4 . This results in new equivalent equations that also represent the same situation.
�� = 54 ÷ 3 4
�� = 72
• The solution is 72 portions.
Practice Problems
1. Select all the equations that describe each situation and then find the solution.
a. Kiran’s backpack weighs 3 lb. less than Clare’s backpack. Clare’s backpack weighs 14 lb. How much does Kiran’s backpack weigh?
□ �� + 3 = 14
□ 3�� = 14
□ �� = 14 – 3
□ �� = 14 ÷ 3
b. Each notebook contains 60 sheets of paper. Andre has 5 notebooks. How many sheets of paper do Andre’s notebooks contain?
□ �� = 60 ÷ 5
□ �� = 5 ⋅ 60
□ �� 5 = 60
□ 5�� = 60
2. Solve each equation.
2�� = 5
�� + 1.8 = 14.7
6 = 1 2 ��
3 1 4 = 1 2 + ��
e. 2.5�� = 10
a.
b.
c.
d.
Review Problems
3. For each equation, draw a tape diagram that represents the equation.
a. 3�� = 18
b. 3 + �� = 18
c. 17 – 6 = ��
4. Find the product of (21.2) ∙ (0.02).
5. For a science experiment, students need to find 25% of 60 grams.
• Jada says, “I can find this by calculating 1 4 of 60.”
• Andre says, “25% of 60 means 25 100 ⋅ 60.”
Do you agree with either of them? Explain your reasoning.
ManuscriptCopy
Unit 6, Lesson 4: A New Way to Interpret Fractions
Warm-Up: Recalling Ways of Solving
Solve each equation. Be prepared to explain your reasoning.
1. 0.07 = 10��
10.1 = �� + 7.2
Exploration Activity: Interpreting Fractions
Solve each equation.
ManuscriptCopy
2.
1. 35 = 7��
2. 35 = 11��
Collaborative Activity: Story Time Again
Take turns with your partner telling a story that might be represented by each equation. Then, for each equation, choose one story, state what the quantity �� describes, and solve the equation. If you get stuck, consider drawing a diagram.
1. 0.7 + �� = 12
2. 1 4 �� = 3 2
Lesson Summary
A fraction such as 4 5 can be thought of in a few ways.
• 4 5 is a number that can be located on the number line by dividing the section between 0 and 1 into 5 equal parts and then counting 4 of those parts to the right of 0.
• 4 5 is the share that each person would have if 4 wholes were shared equally among 5 people. This means that 4 5 is the result of dividing 4 by 5.
This meaning of a fraction as a division expression can be extended to fractions whose numerators and denominators are not whole numbers. For example, 4.5 pounds (lb.) of rice divided into portions that each weigh 1.5 lb. can be represented as 4.5 1.5 , which is the same as 4.5 ÷ 1.5 = 3.
Fractions that involve non-whole numbers, written as decimals or fractions, can also be used when solving equations.
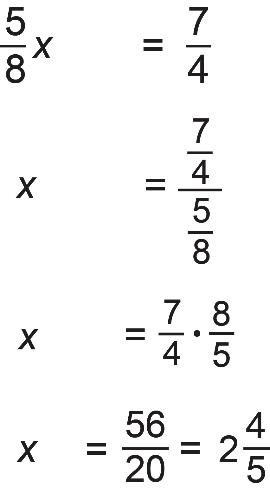
Suppose a road under construction is 5 8 finished and the length of the completed part is 7 4 miles (mi.). How long will the road be when it’s fully completed?
ManuscriptCopy
• Write the equation 5 8 �� = 7 4 to represent the situation, and solve the equation. This work is shown.
• The completed road will be 2 4 5 or about 2.8 mi. long.
Practice Problems
1. Select all the expressions that equal 3.15 0.45 .
□ (3.15) ⋅ (0.45)
□ (3.15) ÷ (0.45)
□ (3.15) ⋅ 1 0.45
□ (3.15) ÷ 45 100
□ (3.15) ⋅ 100 45 □ 0.45 3.15
2. Which expressions are solutions to the equation 3 4 �� = 15? Select all that apply.
3. Solve each equation.
a. 4�� = 32
b. 4 = 32��
c. 10�� = 26
d. 26 = 100��
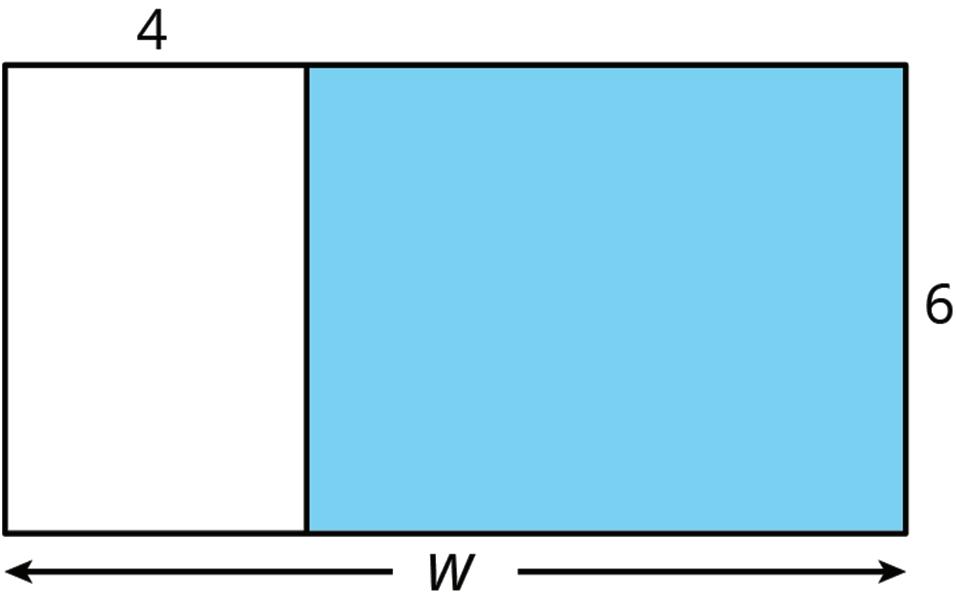
4. Write as many mathematical expressions or equations as you can about the image. Include a fraction, a decimal number, or a percentage in each.

5. In a lilac paint mixture, 40% of the mixture is white paint, 20% is blue, and the rest is red. There are 4 cups (c.) of blue paint used in a batch of lilac paint.
a. How many c. of white paint are used?
b. How many c. of red paint are used?
c. How many c. of lilac paint will this batch yield?
If you get stuck, consider using a tape diagram.
ManuscriptCopy
6. Triangle P has a base of 12 inches (in.) and a corresponding height of 8 in. Triangle Q has a base of 15 in. and a corresponding height of 6.5 in. Which triangle has a greater area? Show your reasoning.
Unit 6, Lesson 5: Writing Algebraic Expressions
Warm-Up: Sum, Product, Quotient, or Difference
Complete each statement.
1. The sum product quotient difference of 4 and 6 is 10 because 4 + 6 = 10.
2. The sum product quotient difference of 8 and 3 is 5 because 8 – 3 = 5.
3. The sum product quotient difference of 32 and 2 is 16 because 32 2 = 16.
4. The sum product quotient difference of 7 and 9 is 63 because 7 × 9 = 63.
Guided Activity: Making Sense of Algebraic Expressions Using Models
Algebraic expressions, like numeric expressions, can include sums, differences, products, and quotients.
An algebraic expression is a mathematical statement containing numbers, operators, and at least 1 unknown value represented by a variable.
1. Complete the statement.
An expression does does not include an equal sign or inequality symbol.
Bar models can be used to connect the action of a problem to an algebraic expression.
Part-Part-Whole Bar Model
The part-part-whole model can be used to represent the following actions. Action Equation
Combining or joining
Taking away or separating
Part A + Part B = Whole
Whole – Part A = Part B
Whole – Part B = Part A
2. “ The sum of a number and three” can be shown as the length of the whole bar where one part is �� and the other part is 3.
The sum of a number and three
ManuscriptCopy
Write an algebraic expression for “the sum of a number and three.”
3. “ The difference of ten and a number ” can be shown where the whole bar is 10 and one part is a number represented by a variable, ��. The difference is the other part.
The difference of ten and number x 10
Write an algebraic expression for “the difference of ten and a number.”
4. “Five subtracted from a number ” is shown with the whole bar as a number represented by a variable, ��, and one part is 5. The other part is the result of 5 being subtracted from the unknown number, ��.
The result of five subtracted from a number 5 m
Complete the statement. The algebraic expression for “five subtracted from a number, ��,” is _____________.
Addition or Subtraction Comparison Bar Model
Comparison models are much like part-part-whole models. They show how much more or less a value is than another.
ManuscriptCopy
This model can be used to show how much more Value A is than Value B or how much less Value B is than Value A.
5. A comparison bar model is shown.
Eight less than a number
Write an algebraic expression for the comparison bar model.
Equal Parts–Whole Bar Model
The equal parts–whole bar model shows the whole sectioned into equal parts.
The equal parts–whole model can be used to show the actions described in the table.
Action
Equation
Repeated addition (multiplication) (Equal part) + . . . + (equal part) = whole (Equal part) × (number of parts) = whole
Equal sharing Whole ÷ (number of parts) = equal part
Partitioning Whole ÷ (equal part) = number of parts
6. “The product of nine and a number” can be shown as 9 equal parts with size of “a number” represented with the variable ��.
ManuscriptCopy
Write an algebraic expression for “the product of nine and a number.”
7. “The quotient of a number and two” could be shown as “a number ” represented by the variable �� sectioned off into 2 equal parts. The quotient is the size of each part.
A number, p Quotient
What is the algebraic expression for “the quotient of a number and two”?
Collaborative Activity: Identifying Parts of an Algebraic Expression
Use terms from the word bank to complete the statements. Words may be used more than once, in singular or plural form.
Word Bank
term(s)
sum(s) difference(s) product(s) factor(s) quotient(s) variable(s) coefficient(s) constant(s)
1. The result of 99 + �� is the __________, where 99 is the __________.
2. The expression 3.12 – �� contains two __________. The result of 3.12 – �� is the __________.
3. The result of �� 13.5 is the __________, where �� is the __________.
4. In the expression 5��, 5 and �� are the __________, where the result of 5�� is the __________.
ManuscriptCopy
5. In the expression 1 2 ��, 1 2 is the __________ of ��, and �� is the __________.
Collaborative Activity: Relating Models and Expressions
1. Four bar models are shown.
Work with your partner to match each written description given in the table to the appropriate bar model, where the pink portion is the result of the written description.
Write the letter of the appropriate bar model. Then, write the algebraic expression that matches the word description. Some models will be used more than once.
The difference of a number and four
Four decreased by a number
Four more than a number
A number subtracted from four
A number increased by four
ManuscriptCopy
Four less than a number
The sum of four and a number
2. Three bar models are shown.
Work with your partner to match each written description given in the table to the appropriate bar model, where the pink portion is the result of the written description.
Write the letter of the appropriate bar model. Then, write the algebraic expression that matches the word description. Some models will be used more than once.
Written Description
A number tripled
A number equally shared into three parts
Three times a number
The quotient of three and a number
The product of three and a number
A number divided by three
Bar Model Algebraic Expression
Bar Model H
Bar Model T
Lesson Summary
When working with algebraic expressions, it is helpful to know some key definitions. Algebraic expressions, equations, and inequalities are made up of terms.
A term is a part of an expression. It can be a single number, a variable, or a number and a variable that are multiplied together.
The expression 6.5 + 4�� has 2 terms.
• The first term is 6.5.
• The second term is 4��.
An expression is a mathematical statement containing numerals, operators, grouping symbols, and symbols or variables for unknown values. An expression does not contain an equal sign or inequality symbol.
The expression 6.5 + 4�� contains a variable term and a constant term.
In an expression like 5�� + 2, the number 2 is called the constant term because it doesn’t change when �� changes.
In the expression 6.5 + 4��, 4�� is the variable term, and 6.5 is the constant term.
Variable terms have coefficients, while constant terms do not.
• In the expression 4��, 4 is the coefficient.
• In the expression ��, 1 is the coefficient.
• In the expression 8��, 8 is the coefficient.
ManuscriptCopy
Practice Problems
For questions 1-4, sketch a bar model and write an algebraic expression for each written description.
1. The product of a number and five
Algebraic Expression Bar Model
2. The quotient of a number and twelve
Algebraic Expression
Model
3. A number doubled Algebraic Expression
Model
4. The difference of fifteen and a number Algebraic Expression
ManuscriptCopy
Model
5. Use the algebraic expression �� + 5 4 to answer the following questions.
a. How many terms are in the expression?
b. Identify the variable term(s), contant term(s), and coefficient(s), if any.
Variable term(s): _________
Constant term(s): _________
Coefficient(s): _________
Review Problem
6. Lin needs to save up $20 for a new game. How much money does she have if she has saved the following percentages of her goal. Explain your reasoning.
a. 25%
b. 75%
c. 125%
ManuscriptCopy
Unit 6, Lesson 6: Writing and Evaluating Algebraic Expressions
Warm-Up: Algebra Talk: When the Unknown Is 6
Determine the value of each expression if �� is 6.
Exploration Activity: Lemonade Sales and Heights
1. Lin set up a lemonade stand. She sells the lemonade for $0.50 per cup.
a. Complete the table to show how much money she would collect if she sold each number of cups.
Lemonade Sold (Number of Cups) 12 183 ��
Money Collected (Dollars)
b. How many cups did she sell if she collected $127.50? Be prepared to explain your reasoning.
2. Elena is 59 inches (in.) tall. Some other people are taller than Elena.
a. Complete the table to show the height of each person.
Person's Height (in.)
b. If Noah is 64 3 4 in. tall, how much taller is he than Elena?
ManuscriptCopy
Collaborative Activity: Building Expressions
1. Clare is 5 years older than her cousin.
a. How old would Clare be if her cousin is:
i. 10 years old?
ii. 2 years old?
iii. �� years old?
b. Clare is 12 years old. How old is Clare’s cousin?
2. Diego has 3 times as many comic books as Han.
a. How many comic books does Diego have if Han has:
i. 6 comic books?
ii. �� books?
b. Diego has 27 comic books. How many comic books does Han have?
3. Two fifths of the vegetables in Priya’s garden are tomatoes.
a. How many tomatoes are there if Priya’s garden has:
i. 20 vegetables?
ii. �� vegetables?
b. Priya’s garden has 6 tomatoes. How many total vegetables are there?
4. A school paid $31.25 for each calculator.
a. If the school bought �� calculators, how much did they pay?
b. The school spent $500 on calculators. How many did the school buy?
Lesson Summary
Samari shares a birthday with her neighbor, but her neighbor is 3 years older than her. When Samari was 1, her neighbor was 4. When Samari was 9, her neighbor was 12. When Samari is 42, her neighbor will be 45.
If �� represents Samari’s age at any time, her neighbor’s age can be expressed as �� + 3.
Often, a letter such as �� or �� is used as a placeholder for a number in expressions. These letters are called variables, just like the letters used in equations. Variables make it possible to write an expression that represents a calculation even when not all of the numbers in the calculation are known.
How old will Samari be when her neighbor is 32? Since her neighbor’s age is calculated with the expression �� + 3, write the equation �� + 3 = 32. When her neighbor is 32, Samari will be 29 because �� + 3 = 32 is true when �� is 29.
Practice Problems
1. Instructions for a craft project say that the length of a piece of red ribbon should be 7 in. less than the length of a piece of blue ribbon.
a. How long is the red ribbon if the length of the blue ribbon is:
i. 10 in.?
ii. 27 in.?
iii. �� in.?
b. How long is the blue ribbon if the red ribbon is 12 in.?
2. Tyler has 3 times as many books as Mai.
a. How many books does Mai have if Tyler has:
i. 15 books?
ii. 21 books?
iii. �� books?
b. Tyler has 18 books. How many books does Mai have?
3. A bottle holds 24 ounces (oz.) of water. It has �� oz. of water in it.
a. What does 24 – �� represent in this situation?
b. Write a question about this situation that has 24 – �� for the answer.
Review Problems
4. Write an equation represented by this tape diagram using each of the following operations.
a. Addition
b. Subtraction
c. Multiplication
d. Division

5. Select all the equations that describe each situation and then find the solution.
a. Han's house is 450 meters (m) from school. Lin’s house is 135 m closer to school. How far is Lin’s house from school?
□ �� = 450 + 135
□ �� = 450 – 135
□ �� – 135 = 450
□ �� + 135 = 450
b. Tyler's playlist has 36 songs. Noah’s playlist has one quarter as many songs as Tyler's playlist. How many songs are on Noah’s playlist?
□ �� = 4 ⋅ 36
□ �� = 36 ÷ 4
□ 4�� = 36
□ �� 4 = 36
6. You had $50. You spent 10% of the money on clothes, 20% on games, and the rest on books. How much money was spent on books?
ManuscriptCopy
7. A trash bin has a capacity of 50 gallons (gal.). What percentage of its capacity is each amount? Show your reasoning.
a. 5 gal.
b. 30 gal.
c. 45 gal.
d. 100 gal.
ManuscriptCopy
Unit 6, Lesson 7: Revisit Percentages
Warm-Up: Percentages
Solve each problem mentally.
1. Bottle A contains 4 ounces (oz.) of water, which is 25% of the amount of water in Bottle B. How much water is there in Bottle B?
2. Bottle C contains 150% of the water in Bottle B. How much water is there in Bottle C?
3. Bottle D contains 12 oz. of water. What percentage of the amount of water in Bottle B is this?
Guided Activity: Representing a Percentage Problem with an Equation
1. Answer each question and show your reasoning.
a. Is 60% of 400 equal to 87?
b. Is 60% of 200 equal to 87?
c. Is 60% of 120 equal to 87?
2. 60% of �� is equal to 87. Write an equation that expresses the relationship between 60%, ��, and 87. Solve your equation.
3. Write an equation to help you find the value of each variable. Solve the equation.
a. 60% of �� is 43.2.
b. 38% of �� is 190.
Collaborative Activity: Puppies Grow Up, Revisited
1. Puppy A weighs 8 pounds (lb.), which is about 25% of its adult weight. What will be the adult weight of Puppy A?
2. Puppy B weighs 8 lb., which is about 75% of its adult weight. What will be the adult weight of Puppy B?
3. If you haven’t already, write an equation for each situation. Then, show how you could find the adult weight of each puppy by solving the equation.
Lesson Summary
If 455 students are in school today and that number represents 70% attendance, an equation can be written to figure out how many students are enrolled at the school.
The number of students in school today can be summarized in the 2 ways shown.
• 70% of the students in the school
• 455 students
If �� represents the total number of students who are enrolled at the school, then 70% of ��, or 70 100 ��, represents the number of students who are in school today, which is 455.
Therefore, the equation 70 100 �� = 455 represents this situation. The equation can be solved as shown.
There are 650 students enrolled at the school.
In general, equations can help solve problems in which 1 amount is a percentage of another amount.
The equivalent equation 0.7�� = 455 could have also been used.
Practice Problems
1. A crew has paved 3 4 of a mile (mi.) of road. If they have completed 50% of the work, how long is the road they are paving?
2. 40% of �� is 35.
ManuscriptCopy
a. Write an equation that shows the relationship of 40%, ��, and 35.
b. Use your equation to find ��. Show your reasoning.
3. Priya has completed 9 exam questions. This is 60% of the questions on the exam.
a. Write an equation representing this situation. Explain the meaning of any variables you use.
b. How many questions are on the exam? Show your reasoning.
4. Answer each question. Show your reasoning.
a. 20% of �� is 11. What is ��?
b. 75% of �� is 12. What is ��?
c. 80% of �� is 20. What is ��?
d. 200% of �� is 18. What is ��?
Review Problems
5. For the equation 2�� – 3 = 7
a. What is the variable?
b. What is the coefficient of the variable?
ManuscriptCopy
c. Which of these is the solution to the equation? 2, 3, 5, 7, ��
6. Which of these is a solution to the equation 1 8 = 2 5 ⋅ ��?
A. 2 40
B. 5 16
C. 11 40
D. 17 40
7. Find the quotients.
a. 0.009 ÷ 0.001
b. 0.009 ÷ 0.002
ManuscriptCopy
ManuscriptCopy
Unit 6, Lesson 8: Equal and Equivalent
Warm-Up: Tape Diagrams
1. Two diagrams are shown. One represents 3 + �� = 8. The other represents �� ⋅ 3 = 15.
Complete the table by writing the equation that matches each diagram in the space provided and then labeling the length of each diagram.
Equation
Diagram


Exploration Activity: Using Diagrams to Show That Expressions Are Equivalent
Here is a diagram of �� + 2 and 3�� when �� is 4. Notice that the two diagrams are lined up on their left sides.

In each of your drawings below, line up the diagrams on one side.
1. Draw a diagram of �� + 2, and a separate diagram of 3��, when �� is 3.

2. Draw a diagram of �� + 2, and a separate diagram of 3��, when �� is 2.
3. Draw a diagram of �� + 2, and a separate diagram of 3��, when �� is 1.
4. Draw a diagram of �� + 2, and a separate diagram of 3��, when �� is 0.
5. When are �� + 2 and 3�� equal? When are they not equal? Use your diagrams to explain.
ManuscriptCopy
6. Draw a diagram of �� + 3, and a separate diagram of 3 + ��.
7. When are �� + 3 and 3 + �� equal? When are they not equal? Use your diagrams to explain.
Collaborative Activity: Identifying Equivalent Expressions
A list of expressions is shown. Determine any pairs of expressions that are equivalent. If you get stuck, try reasoning with diagrams.
Guided Activity: Identity and Inverse Properties of Operations
Two properties of operations that can be used to generate equivalent expressions are the identity property and the inverse property.
The identity property states that when any number, ��, is combined with an identity, the end result is ��.
Complete each statement.
1. The number 0 1 is the addition identity of �� because �� + 0 1 = ��.
2. The number 0 1 is the multiplicative identity of �� because �� × 0 1 = ��.
The inverse property states that when any number, ��, is multiplied by its inverse, or reciprocal, the end result is 1.
Complete the statement.
3. The multiplicative inverse of �� is –�� 1 �� because �� × –�� 1 �� = 1.
4. Complete the table by identifying a pair of expressions from the Collaborative Activity that illustrates each property of operations indicated.
ManuscriptCopy
Lesson Summary
Diagrams showing lengths of rectangles can be used to see when expressions are equal. For example, the expressions �� + 9 and 4�� are equal when �� is 3, but are not equal for other values of ��.
Sometimes 2 expressions are equal for only 1 particular value of the variable. Other times, they seem to be equal no matter what the value of the variable.

Expressions that are always equal regardless of the value of their variable(s) are called equivalent expressions.
Equivalent expressions are always equal to each other. If the expessions have variables, they are equal whenever the same value is used for the variable in each expression.
However, it would be impossible to test every possible value of the variable. Properties of operations can be applied to determine whether expressions are equivalent. Some example properties are listed.
• �� + 3 is equivalent to 3 + �� by the commutative property of addition.
• 0 + �� is equivalent to �� by the identity property of addition.
• �� ∙ 1 �� is equivalent to 1 by the inverse property of multiplication.
ManuscriptCopy
• �� + �� + �� + �� + �� is equivalent to 5 ⋅ �� because adding 5 of something is the same as multiplying it by 5.
• �� ÷ 3 is equivalent to �� ⋅ 1 3 because dividing by a number is the same as multiplying by its reciprocal.
In the coming lessons, the distributive property of multiplication over addition will be explored. This property can also be used to show that expressions are equivalent.
Practice Problems
a. Draw a diagram of �� + 3 and a diagram of 2�� when �� is 1.

b. Draw a diagram of �� + 3 and of 2�� when �� is 2.
c. Draw a diagram of �� + 3 and of 2�� when �� is 3.
d. Draw a diagram of �� + 3 and of 2�� when �� is 4.
e. When are �� + 3 and 2�� equal? When are they not equal? Use your diagrams to explain.
3.
a. Do 4�� and 15 + �� have the same value when �� is 5?
b. Are 4�� and 15 + �� equivalent expressions? Explain your reasoning.
a. Check that 2�� + �� and 3�� have the same value when �� is 1, 2, and 3.
b. Do 2�� + �� and 3�� have the same value for all values of ��? Explain your reasoning.
c. Are 2�� + �� and 3�� equivalent expressions?
4. Complete each statement.
a. The identity property of mulitplication justifies that �� is equivalent to ________.
b. The inverse property of multiplication justifies that �� · _____ = 1.
c. The identity property of addition justifies that �� is equivalent to ________.
Review Problems
5. 80% of �� is equal to 100.
a. Write an equation that shows the relationship of 80%, ��, and 100.
b. Use your equation to find ��.
6. For each story problem, write an equation to represent the problem and then solve the equation. Be sure to explain the meaning of any variables you use.
a. Jada’s dog was 5 1 2 inches (in.) tall when it was a puppy. Now her dog is 14 1 2 in. taller than that. How tall is Jada’s dog now?
b. Lin picked 9 3 4 pounds (lb.) of apples, which was 3 times the weight of the apples Andre picked. How many lb. of apples did Andre pick?
7. Calculate 141.75 ÷ 2.5 using a method of your choice. Show or explain your reasoning.
ManuscriptCopy
Unit 6, Lesson 9: The Distributive Property – Part 1
Warm-Up: Ways to Represent Area of a Rectangle
1. Select all of the expressions that represent the area of the large, outer rectangle in the figure shown. Explain your reasoning.
Exploration Activity: Distributive Practice
Complete the table. If you get stuck, skip an entry and come back to it, or consider drawing a diagram of two rectangles that share a side.
Exploration Activity: Partitioned Rectangles When Lengths Are Unknown
1. Here are two rectangles. The length and width of one rectangle are 8 and 5. The width of the other rectangle is 5, but its length is unknown so we labeled it ��. Write an expression for the sum of the areas of the two rectangles.

2. The two rectangles can be composed into one larger rectangle as shown. What are the width and length of the new, large rectangle?

3. Write an expression for the total area of the large rectangle as the product of its width and its length.
ManuscriptCopy
Collaborative Activity: Areas of Partitioned Rectangles
For each rectangle, write expressions for the length and width and two expressions for the total area. Record them in the table. Check your expressions in each row with your group and discuss any disagreements.

Area as a Product of Width Times Length
Area as a Sum of the Areas of the Smaller Rectangles
Rectangle Width Length
Lesson Summary
When performing calculations mentally, it’s common to break up the calculations to make them easier to do.
For example, when grocery shopping, to mentally calculate how much it will cost to buy 5 cans of beans at 79 cents per can, the mental calculation might be as shown to the right.
In general, when multiplying 2 numbers, or factors, 1 of the factors can be broken into parts. Multiply each part by the other factor, and then add the partial products. The result will be the same as the product of the 2 original factors.
When 1 factor is broken up and the parts are multipled, the distributive property of multiplication over addition is being used.
Distributive property of multiplication over addition �� × (�� + ��) = (�� × ��) + (�� × ��)
The distributive property also works with subtraction. Another way of finding 5 ⋅ 79 is shown.
Rectangles can be used to illustrate the distributive property. A rectangle composed of 2 smaller rectangles, A and B, is shown.
The following information can be observed about the area of the large rectangle.
• One side length of the large rectangle is 3, and the other is (2 + ��), so its area is 3(2 + ��).

• Since the large rectangle can be decomposed into 2 smaller rectangles, A and B, with no overlap, the area of the large rectangle is also the sum of the areas of rectangles A and B: 3(2) + 3(��) or 6 + 3��.
• Since both expressions represent the area of the large rectangle, they are equivalent to each other. 3(2 + ��) is equivalent to 6 + 3��.
This shows that multiplying 3 by the quantity (2 + ��) is equivalent to multiplying 3 by 2 and then multiplying 3 by �� and adding the two products. This relationship is an example of the distributive property.
3(2 + ��) = 3 ⋅ 2 + 3 ⋅ ��
Practice Problems
1. Draw and label diagrams that show these two methods for calculating 19 ⋅ 50.
a. First find 10 ⋅ 50 and then add 9 ⋅ 50.
b. First find 20 ⋅ 50 and then take away 50.
2. Complete each calculation using the distributive property.
a. 98 ⋅ 24
(100 – 2) ⋅ 24
b. 21 ⋅ 15
(20 + 1) ⋅ 15
c. 0.51 ⋅ 40
(0.5 + 0.01) ⋅ 40
3. Here is a rectangle.
a. Explain why the area of the large rectangle is 2�� + 3�� + 4��.

b. Explain why the area of the large rectangle is (2 + 3 + 4)��.
4. Is the area of the shaded rectangle 6(2 – ��) or 6(�� – 2)?
Explain how you know.
Review Problems

5. Andre ran 5 1 2 laps of a track in 8 minutes (min.) at a constant speed. It took Andre �� min. to run each lap. Select all the equations that represent this situation.
�5 1 2 ��� = 8
5 1 2 + �� = 8
5 1 2 – �� = 8
5 1 2 ÷ �� = 8
�� = 8 ÷ �5 1 2 �
�� = �5 1 2 � ÷ 8
Unit 6, Lesson 10: The Distributive Property – Part 2
Warm-Up: The Shaded Region
A rectangle with dimensions 6 centimeters (cm) and �� cm is partitioned into two smaller rectangles.
Explain why each of these expressions represents the area, in square centimeters (sq. cm), of the shaded portion.
6�� – 24
6(�� – 4)
ManuscriptCopy
Collaborative Activity: Matching to Practice Distributive Property
Match each expression in column 1 to an equivalent expression in column 2. If you get stuck, consider drawing a diagram.
Column 1
+ 2 + 3) 2(12 – 4)
+ 3��
3 (15�� – 18)
+ 10�� 0.4(5 – 2.5��)
Column 2
+ ��)
+ 5��)
+ 3)��
Collaborative Activity: Writing Equivalent Expressions Using the Distributive Property
The distributive property can be used to write equivalent expressions. In each row, use the distributive property to write an equivalent expression. If you get stuck, consider drawing a diagram.
Lesson Summary
The distributive property can be used to write a sum as a product, or to write a product as a sum. A partitioned rectangle can be used to help reason about it, but with enough practice, you should be able to apply the distributive property without making a drawing.
Some examples of expressions that are equivalent due to the distributive property are shown.
+ 18 = 9(1 + 2)
+ 4) = 6�� + 8
Practice Problems
1. For each expression, use the distributive property to write an equivalent expression.
a. 4(�� + 2)
b. (6 + 8) ⋅ ��
c. 4(2�� + 3)
d. 6(�� + �� + ��)
2. Priya rewrites the expression 8�� – 24 as 8(�� – 3). Han rewrites 8�� – 24 as 2(4y – 12). Are Priya's and Han's expressions each equivalent to 8y – 24? Explain your reasoning.
3. Select all the expressions that are equivalent to 16�� + 36.
□ 16(�� + 20)
□ ��(16 + 36)
□ 4(4�� + 9)
□ 2(8�� + 18)
□ 2(8�� + 36)
4. The area of a rectangle is 30 + 12��. List at least 3 possibilities for the length and width of the rectangle.
ManuscriptCopy
Review Problems
5. Select all the expressions that are equivalent to 1 2 ��.
a. What is the perimeter of a square with side length: 3 cm? 7 cm? 8 cm?
b. If the perimeter of a square is 360 cm, what is its side length?
7. Solve each equation.
a. 10 = 4��
b. 5�� = 17.5
c. 1.036 = 10��
d. 0.6�� = 1.8
e. 15 = 0.1��
ManuscriptCopy
Unit 6, Lesson 11: Applying Properties of Operations
Warm-Up: Mental Math
Ulrich finds the product of 5 ∙ 107 in his head. Ulrich wrote the following explanation of his thinking:
Because 107 is equal to 100 + 7, I can write 5 ∙ 107 as 5(100 + 7). I know that 5 ∙ 100 is 500 and that 5 ∙ 7 is 35. Then, I add 500 and 35 to get 535.
1. Use Ulrich’s reasoning to rewrite each expression in the form ��(�� + ��). Then, use that form to find the product.
Exploration Activity: Commutative
and Associative Properties of Operations
In addition to the identity, inverse, and distributive properties explored in previous lessons, there are more properties of operations that can be used to generate equivalent expressions.
The commutative property states that the order in which an operation is performed does not change the value of the expression.
1. Use the pairs of expressions shown in the table to determine the operations for which the commutative property is true.
2. Complete the statement.
The commutative property only applies to _____________________________ and
ManuscriptCopy
commutative property.
3. Rewrite �� + 9 using the
4. Rewrite 7�� using the commutative property.
The associative property states that the way in which numbers in an expression are grouped does not change the value of the expression.
5. Use the pairs of expressions below to determine the operations for which the associative property is true.
Operation Example Expressions Equivalent?
6. Complete the statement.
The associative property only applies to _____________________________ and _____________________________.
7. Rewrite (�� + 15) + 11 using the associative property.
8. Rewrite (2)(8 ∙ ��) using the associative property.
ManuscriptCopy
Collaborative Activity: Using Properties of Operations to Justify Equivalence
1. Work with your partner to complete the table by selecting the property that justifies the two expressions in each row are equivalent. Expression A Expression B
Associative property
Distributive property
Commutative property
Associative property
Distributive property
Commutative property
Associative property
Distributive property Commutative property
Associative property
Distributive property
Commutative property
Associative property
Distributive property
Commutative property
2. Two equivalent expressions are shown.
Taylor states that the distributive property justifies the expressions are equivalent. Pablo states that the commutative property justifies the expressions are equivalent. Discuss with a partner which student is correct, if either. Write a summary of your discussion.
Lesson Summary
Sets A and B show pairs of equivalent expressions.
These pairs of equivalent expressions demonstrate the distributive property of multiplication over addition (or subtraction), which is a property that applies to all rational numbers. The distributive property “distributes” a factor to all terms within a set of parentheses.
Sets C and D also show pairs of equivalent expressions.
These pairs of equivalent expressions demonstrate the commutative property of addition and the commutative property of multiplication, which is another property that applies to all rational numbers. The commutative property states that the order in which operations are performed does not change the value of the expression. Because the order matters in subtraction and division expressions, the commutative property only applies to addition and multiplication.
Commutative Property of Addition
Sets E and F show more pairs of equivalent expressions.
These pairs of equivalent expressions demonstrate the associative property of addition and the associative property of multiplication, which is another property that applies to all rational numbers. The associative property states that the way in which values are grouped does not change the value of the expression. Because the grouping of values matters in subtraction and division expressions, the associative property only applies to addition and multiplication.
Associative Property of Addition
Practice Problems
1. For each equivalent expression, select the property that justifies it is equivalent to 4(�� + 7).
Equivalent Expression Property That Justifies Equivalence to 4(�� + 7)
Associative property
(�� + 7) ∙ 4
4�� + 4 ∙ 7
28 + 4��
Distributive property Commutative property
Associative property
Distributive property Commutative property
Associative property
Distributive property Commutative property
2. Write an expression equivalent to 6(�� + 5) using the commutative property.
3. Write an expression equivalent to 3.5(�� ∙ 6.4) using the associative property.
4. Write an expression equivalent to 2 5 (10 – ��) using the distributive property.
Review Problem
5. A shopper paid $2.52 for 4.5 pounds (lb.) of potatoes, $7.75 for 2.5 lb. of broccoli, and $2.45 for 2.5 lb. of pears. What is the unit price of each item she bought? Show your reasoning.
ManuscriptCopy
Unit 6, Lesson 12: Expressions with Exponents
Warm-Up: Notice and Wonder: Dots and Lines
What do you notice? What do you wonder?


ManuscriptCopy

Guided Activity: The Genie’s Offer
You find a brass bottle that looks really old. When you rub some dirt off of the bottle, a genie appears! The genie offers you a reward. You must choose one: $50,000, or a magical $1 coin.
The coin will turn into two coins on the first day. The two coins will turn into four coins on the second day. The four coins will double to 8 coins on the third day. The genie explains the doubling will continue for 28 days.
1. The number of coins on the third day will be 2 ⋅ 2 ⋅ 2. Write an equivalent expression using exponents.
2. What do 25 and 26 represent in this situation? Evaluate 25 and 26 without a calculator.
3. How many days would it take for the number of magical coins to exceed $50,000?
4. Will the value of the magical coins exceed a million dollars within the 28 days? Explain or show your reasoning.
Collaborative Activity: Make 81
1. Here are some expressions. All but one of them equals 16. Find the one that is not equal to 16 and explain how you know.
A. 23 ⋅ 2
B. 42
C. 25 2
D. 82
ManuscriptCopy
2. Write three expressions containing exponents so that each expression equals 81.
Collaborative Activity: Is the Equation True?
Decide whether each equation is true or false and explain how you know.
24 = 2 ⋅ 4
3 + 3 + 3 + 3 + 3 = 35
53 = 5 ⋅ 5 ⋅ 5
1.
2.
3.
4. 23 = 32
5. 161 = 82
6. 82 = 43
Lesson Summary
In an expression like 2��, 2 is called the base and �� is called the exponent.
In expressions like 53 and 82, the 3 and the 2 are called exponents. They tell you how many factors to multiply.
The base (of an exponent) is the number used as a factor in exponential form.
If �� is a positive whole number, it indicates how many factors of 2 should be multiplied to find the value of the expression. For example, 21 = 2, and 25 = 2
32.
There are different ways to read the expression 25. “Two raised to a power of five,” “two to the fifth power,” or “two to the fifth” are all acceptable ways to verbalize the expression 25.
1.
Practice Problems
3. 45 is equal to 1,024. Evaluate each expression.
43 ⋅ 42
Review Problems
4. Find two different ways to rewrite 3���� + 6���� using the distributive property.
5. Select all the expressions that represent the area of the shaded rectangle.
□ 3(10 – ��)
□ 3(�� – 10)
□ 10(�� – 3)
ManuscriptCopy
□ 10(3 – ��)
□ 30 – 3��
□ 30 – 10��

a. 46
b. 44
c.
Unit 6, Lesson 13: Evaluating Expressions with Exponents
Warm-Up: Revisiting the Cube
Based on the given information, what other measurements of the square and cube could we find?

Exploration Activity: Calculating Surface Area
A cube has side length 10 inches (in.). Jada says the surface area of the cube is 600 square inches (sq. in.), and Noah says the surface area of the cube is 3,600 sq. in. Here is how each of them reasoned: Jada’s Method:
Do you agree with either of them? Explain your reasoning.
ManuscriptCopy
Collaborative Activity: Expression Explosion
Evaluate the expressions in one of the columns. Your partner will work on the other column. Check with your partner after you finish each row. Your answers in each row should be the same. If your answers aren’t the same, work together to find the error(s).
Column A
Column B
Lesson Summary
Exponents provide a new way to describe operations with numbers, so it is important to understand how exponents work with the other operations.
There needs to be a consistent way to evaluate 6 ⋅ 42, because otherwise, some people might multiply first and others might evaluate the exponent first. This would result in different values for the same expression.
In the Exploration Activity, the expression 6 ⋅ 42 represented the surface area of a cube with side length 4 units. When calculating the surface area, evaluate 42 first to find the area of 1 face of the cube, and then multiply the result by 6.
In expressions like 6 ⋅ 42, the convention is to evaluate the part of the expression with the exponent first. Two examples are shown.
To communicate that 6 and 4 should be multiplied first and then squared, parentheses or other grouping symbols are used to group parts together.
Practice Problems
1. Lin says, “I took the number 8, and then multiplied it by the square of 3.” Select all expressions that equal Lin’s answer.
2. Evaluate each expression. a. 7 + 23 b. 9 ⋅ 31 c. 20 – 24
2 ⋅ 62
�8 ∙ 1 4 �2
1 2 ⋅ 23
3. Andre says, “I multiplied 4 by 5, then cubed the result.” Select all expressions that equal Andre’s answer.
(4 ⋅ 5)3
(4 ⋅ 5)2
8,000
4. Han has 10 cubes, each 5 in. on a side.
a. Find the total volume of Han’s cubes. Express your answer as an expression using an exponent.
b. Find the total surface area of Han’s cubes. Express your answer as an expression using an exponent.
Review Problems
5. Answer each question. Show your reasoning.
a. 125% of �� is 30. What is ��?
b. 35% of �� is 14. What is ��?
6. Which expressions are solutions to the equation 2.4�� = 13.75? Select all that apply.
□ 13.75 – 1.4
□ 13.75 ⋅ 2.4
□ 13.75 ÷ 2.4 □ 13.75 2.4
□ 2.4 ÷ 13.75
ManuscriptCopy
7. Jada explains how she finds 15 ⋅ 23:
“I know that ten 23s is 230, so five 23s will be half of 230, which is 115. 15 is 10 plus 5, so 15 ⋅ 23 is 230 plus 115, which is 345.”
a. Do you agree with Jada? Explain.
b. Draw a 15 by 23 rectangle. Partition the rectangle into two rectangles and label them to show Jada’s reasoning.
ManuscriptCopy
Unit 6, Lesson 14: Evaluating Multistep Expressions
Warm-Up: Evaluating Numeric Expressions
The question shown is dividing the internet.
What is the value of 8 ÷ 2(2 + 2)?
Alex @XanderTheGreat - 2h Ms. B Replying to @Warm-up_Math
Anything other than 1 is absolutely wrong hth
1. Do you agree with Alex or Ms. B? Explain or show why.
2. Find the value of the expression. Show your work. 4 – 2 × 6 ÷ 3 + 7
Exploration Activity: Modeling the Meaning of Expressions
1. Determine which mathematical model matches each numerical expression. Use arrows to indicate matches. Be prepared to explain your thinking. Numerical Expression
3 × 5 + 4
3 × 5 + 4
(3 + 5) × 4
3 + (5 × 4)
ManuscriptCopy
2. How did you use the grouping symbols to help you determine which model matched each expression?
3. With the grouping symbols removed, which model matches each expression? Use arrows to indicate matches.
Numerical Expression
(3 × 5) + 4
Mathematical Model
ManuscriptCopy
3 + (5 × 4)
Guided Activity: Applying Order of Operations
Grouping symbols such as parentheses, ( ), and brackets, [ ], are used to indicate which operations should be performed first. The following order is used:
Step 1: Perform operations within grouping symbols.
Step 2: Multiply and divide in order from left to right.
Step 3: Add and subtract in order from left to right.
1. Three students completed the warm-up. The steps in each student’s work are shown.
a. Complete the statements.
Leila Farah Jaylah evaluated the numerical expression correctly. She first performed all multiplication and division addition and subtraction in order from left to right and then performed all multiplication and division addition and subtraction in order from left to right.
b. With your partner, discuss the work of each student: Leila, Farah, and Jaylah. Two of these students made a mistake somewhere. Circle the mistakes that you and your partner found.
2. Omari evaluated expression A and expression B. His work is shown.
Expression A Expression B
+ 24 ÷ 6 – 2 × 2
+ 4 – 2 × 2
+ 4 – 4
– 4
12 + 24 ÷ [(6 – 2) × 2] 12 + 24 ÷ [4 × 2]
+ 24 ÷ 8
a. With your partner, discuss the 2 original expressions that Omari evaluated and his corresponding answers.
b. Omari’s partner agreed with both of his answers. Explain why Omari arrived at 2 different values when evaluating these expressions.
Lesson Summary
The agreed upon order of operations for performing computations is to first work within grouping symbols. Then, simplify terms with exponents, which will be practiced in the next lesson. Next, perform multiplication and division in the order in which they appear, from left to right. Finally, perform addition and subtraction in the order in which they appear, from left to right.
Two expressions are shown, each evaluated using the order of operations.
The values and operations in both expressions are the same. The addition of the grouping symbols in expression B changes the value of the expression because it changes the order in which the operations are performed.
Practice Problems
1. Evaluate 4 + 3 × [15 – (12 ÷ 3)].
2. Evaluate 1 5 + 3 × 12 4 ÷ 9.
ManuscriptCopy
3. Evaluate 3 2 + [(25 – 7) ÷ 4] – 6.
4. Two expressions are shown.
Expression A
(4 + 6) ÷ 0.5 – 2
Expression B
4 + 6 ÷ 0.5 – 2
Henrie evaluated expression A and expression B and determined the answer is the same for both expressions. Evaluate the expressions, and explain whether you agree with Henrie.
Review Problems
5. Which shape has a larger area: a rectangle that is 7 inches (in.) by 3 4 in., or a square with side length of 2 1 2 in.? Show your reasoning.
ManuscriptCopy
6. Diego has 90 songs on his playlist. How many songs are there for each genre?
a. 40% rock
b. 10% country
c. 30% hip-hop
d. The rest is electronica
ManuscriptCopy
Unit 6, Lesson 15: Order of Operations
Warm-Up: Error Analysis
Joshua incorrectly evaluated the expression 8(2) + 3(6)[2(2) – 4]. His work is shown. 8(2) + 3(6)[2(2) – 4]
Describe Joshua’s error.
Guided Activity: Evaluating Numerical Expressions with Exponents
Writing out exponential expressions as repeated multiplication can get cumbersome and complicated, as shown.
In the rewritten expression, notice that both 33 and 26 were expressed as repeated multiplication, grouped inside parentheses.
1. Complete the statements.
In the order of operations, grouping symbols indicate that the operations inside should be done ___________ other steps. Therefore, evaluating exponents is done __________ other multiplication and division when following the order of operations.
2. Evaluate (3)3 + 26 ÷ 16 + 5.
3. Elizabeth incorrectly evaluated 17 + (4)3 ∙ 7 – 9. Her work is shown. 17 + (4)3 ∙ 7 – 9 17 + (64) ∙ 7 – 9 (81) ∙ 7 – 9 567 – 9
a. Explain the error in Elizabeth’s work.
b. Correctly evaluate 17 + (4)3 ∙ 7 – 9.
c. Compare Elizabeth’s work to the expression [17 + (4)3] ∙ 7 – 9. What do you notice?
Collaborative Activity: The Importance of Left to Right
1. Sabrina is evaluating the expression 43 ÷ 8 ∙ (32 – 5). Her first few steps are shown.
÷ 8 ∙ (32 – 5)
÷ 8 ∙ (9 – 5)
a. Sabrina thinks that she could finish her work by finding either 64 ÷ 8 or 8 ∙ 4 first. Show the work for both possibilities.
b. Was Sabrina correct when she stated that both methods would work? Use the steps of the order of operations to justify whether Sabrina is correct.
2. Complete the following.
a. Evaluate 4 ∙ 60 ÷ 10 ÷ 2.
b. Evaluate (4 ∙ 60) ÷ (10 ÷ 2).
c. Explain how the use of parentheses affected the answers to parts A and B.
3. Complete the following .
a. Evaluate 72 ÷ 6 ∙ 9 + 32 .
b. Evaluate 72 ∙ 6 ÷ 9 + 32 .
c. Explain how rearranging the operations affected the answers to parts A and B.
Lesson Summary
This lesson explored how results can vary when the agreed upon order of operations is not followed, which illustrates the necessity of following the order of operations.
The agreed upon order of operations is shown.
Step 1: Perform operations inside grouping symbols.
Step 2: Evaluate expressions with exponents.
Step 3: Perform multiplication and division in order from left to right (→).
Step 4: Perform addition and subtraction in order from left to right (→).
Practice Problems
1. Evaluate 16 ÷ 24 – 1.
2. Evaluate each expression.
62 ÷ 4 ∙ 10 – 32
62 ÷ [4 ∙ (10 – 32)]
3. Evaluate 10 + 2 ∙ (52 – 6 ∙ 3).
ManuscriptCopy
a.
b.
4. Jayce evaluated the expression 72 – 32 + 10 ÷ 2 in two different ways. His work is shown.
1st Answer
– 32 + 10 ÷ 2
Explain to Jayce which answer is correct and why.
2nd Answer
Review Problems
5. Compare using >, =, or <.
0.7 ______ 0.70
0.03 + 6 10 _______ 0.30 + 6 100
0.9 ______ 0.12
ManuscriptCopy
6. Tulip bulbs are on sale at store A, at 5 for $11.00, and the regular price at store B is 6 for $13. Is each store pricing tulip bulbs at the same rate? Explain how you know.
a.
b.
c.
Unit 6, Lesson 16: Two Related Quantities – Part 1
Warm-Up: Which One Would You Choose?
Which one would you choose? Be prepared to explain your reasoning.
• A 5 pound (lb.) jug of honey for $15.35
• Three 1.5 lb. jars of honey for $13.05


Guided Activity: Painting the Set
Lin needs to mix a specific shade of orange paint for the set of the school play. The color uses 3 parts yellow for every 2 parts red.
1. Complete the table to show different combinations of red and yellow paint that will make the shade of orange Lin needs.
2. Lin notices that the number of cups of red paint is always 2 5 of the total number of cups. She writes the equation �� = 2 5 �� to describe the relationship. Which is the independent variable? Which is the dependent variable? Explain how you know.
3. Write an equation that describes the relationship between �� and ��, where �� is the independent variable.
4. Write an equation that describes the relationship between �� and ��, where �� is the independent variable.
5. Use the points in the table to create two graphs that show the relationship between �� and ��. Match each relationship to one of the equations you wrote.


Lesson Summary
Equations are useful for describing sets of equivalent ratios. An example is shown.
A pie recipe calls for 4 green apples, ��, for every 5 red apples, ��. An input-output, or function, table shows some equivalent ratios in this scenario.
The table shows that �� is always 5 4 as large as �� and that �� is always 4 5 as large as ��. Equations can be written to describe the relationship between �� and ��.
When the number of green apples is known and the number of red apples is needed, the equation �� = 5 4 �� can be used.
• In this equation, if �� changes, �� is affected by the change, so the input value, ��, is the independent variable, and the output value, ��, is the dependent variable.
The independent variable is used to calculate the value of another variable.
The dependent variable represents the output of a function.
• This equation can be used with any value of �� to find ��. For example, if 272 green apples are used, then � 5 4 ∙ 272� or 340 red apples are used.
When the number of red apples is known and the number of green apples is needed, the equation �� = 4 5 �� can be used.
• In this equation, if �� changes, �� is affected by the change, so now �� is the independent variable, and �� is the dependent variable.
• Use this equation with any value of �� to find ��. If 275 red apples are used, then 4 5 ⋅ (275) or 220 green apples are used.
The 2 equations can also be graphed on the coordinate plane for a visual representation of the relationship between the 2 quantities.
Practice Problems
1. Here is a graph that shows some values for the number of cups of sugar, ��, required to make �� batches of brownies.


a. Complete the table so that the pair of numbers in each column represents the coordinates of a point on the graph.
b. What does the point (8, 4) mean in terms of the amount of sugar and number of batches of brownies?
c. Write an equation that shows the amount of sugar in terms of the number of batches.
2. Each serving of a certain fruit snack contains 90 calories.
a. Han wants to know how many calories he gets from the fruit snacks. Write an equation that shows the number of calories, ��, in terms of the number of servings, ��.
ManuscriptCopy
b. Tyler needs some extra calories each day during his sports season. He wants to know how many servings he can have each day if all the extra calories come from the fruit snack. Write an equation that shows the number of servings, ��, in terms of the number of calories, ��.
3. Kiran shops for books during a 20% off sale.
a. What percent of the original price of a book does Kiran pay during the sale?
b. Complete the table to show how much Kiran pays for books during the sale.
c. Write an equation that relates the sale price, ��, to the original price ��.
Review Problems
4. Use the algebraic expression 1.4�� + 6.18 to answer the following questions.
a. How many terms are in the expression?
b. Identify the coefficient(s) and constant term(s), if any.
ManuscriptCopy
5. Find (12.34) ∙ (0.7). Show your reasoning.
ManuscriptCopy
6. For each expression, write another division expression that has the same value and that can be used to help find the quotient. Then, find each quotient.
a. 302.1 ÷ 0.5
b. 12.15 ÷ 0.02
c. 1.375 ÷ 0.11
Unit 6, Lesson 17: Two Related Quantities – Part 2
Warm-Up: Walking to the Library
Lin and Jada each walk at a steady rate from school to the library. Lin can walk 13 miles (mi.) in 5 hours (hr.), and Jada can walk 25 mi. in 10 hr. They each leave school at 3:00 and walk 3 1 4 mi. to the library. What time do they each arrive?
Collaborative Activity: The Walk-a-thon
Diego, Elena, and Andre participated in a walk-a-thon to raise money for cancer research. They each walked at a constant rate, but their rates were different.
1. Complete the table to show how far each participant walked during the walk-a-thon.
2. How fast was each participant walking in miles per hour (mph)?
3. How long did it take each participant to walk one mi.?
4. Graph the progress of each person in the coordinate plane. Use a different color for each participant.
5. Diego says that �� = 3�� represents his walk, where �� is the distance walked in mi. and �� is the time in hr.
a. Explain why �� = 3�� relates the distance Diego walked to the time it took.
b. Write two equations that relate distance and time: one for Elena and one for Andre.

6. Use the equations you wrote to predict how far each participant would walk, at their same rate, in 8 hr.
7. For Diego’s equation and the equations you wrote, which is the dependent variable and which is the independent variable?
Lesson Summary
Equations are very useful for solving problems with constant speeds. Consider the example shown.
A boat is traveling at a constant speed of 25 mph.
How far can the boat travel in 3.25 hr.?
How long does it take for the boat to travel 60 mi.?
Let �� represent the time the boat travels, in hr., and let �� represent the distance the boat travels, in mi.
When the time is known and the distance is needed, the equation �� = 25�� can be used.
• In this equation, if �� changes, �� is affected by the change, so �� is the independent variable, and �� is the dependent variable.
• This equation can be used to find �� for any value of ��. In 3.25 hr., the boat can travel 25(3.25) = 81.25 mi.
When distance is known and the time is needed, the equation �� = �� 25 can be used.
• In this equation, if �� changes, �� is affected by the change, so �� is the independent variable and �� is the dependent variable.
• This equation can be used to find �� for any value of ��. To travel 60 mi., it will take 60 25 = 2 2 5 hr.
These problems can also be solved using important ratio techniques such as a table of equivalent ratios. The equations are particularly valuable in this case because the answers are not round numbers or easy to quickly evaluate.
The equations can also be graphed to illustrate the relationship between the quantities, as shown.
ManuscriptCopy


Practice Problems
1. A car is traveling down a road at a constant speed of 50 mph.
a. Complete the table with the amounts of time it takes the car to travel certain distances, or the distances traveled for certain amounts of time.
b. Write an equation that represents the distance traveled by the car, ��, for an amount of time, ��.
c. In your equation, which is the dependent variable and which is the independent variable?
2. The graph represents the amount of time in hr. it takes a ship to travel various distances in mi.
a. Write the coordinates of one point on the graph. What does the point represent?

b. What is the speed of the ship in mph?
c. Write an equation that relates the time, ��, it takes to travel a given distance, ��.
Review Problems
3. Find a solution to each equation, choosing from the list of values shown. Not all values will be used.
a. 2�� = 8
b. 2�� = 2
c. ��2 = 100
d. ��1 = 7
e. ��3 = 125
f. 2�� ⋅ 23 = 27
4. Select all the expressions that are equivalent to 5�� + 30�� – 15��.
□ 5(�� + 6�� – 3��)
□ (5 + 30 – 15) ⋅ ��
□ ��(5 + 30�� – 15��)
□ 5��(1 + 6 – 3)
□ 5(�� + 30�� – 15��)
ManuscriptCopy
ManuscriptCopy
Unit 7, Lesson 1: Positive and Negative Numbers
Warm-Up: Memphis and Bangor

What do you notice? What do you wonder?
ManuscriptCopy
Exploration Activity: Above and Below Zero
1. Here are three situations involving changes in temperature and three number lines. Represent each change on a number line. Then, answer the question.
a. At noon, the temperature was 5 degrees Celsius (℃). By late afternoon, it has risen 6℃. What was the temperature late in the afternoon?
b. The temperature was 8℃ at midnight. By dawn, it has dropped 12℃. What was the temperature at dawn?
ManuscriptCopy
c. Water freezes at 0℃, but the freezing temperature can be lowered by adding salt to the water. A student discovered that adding half a cup of salt to a gallon of water lowers its freezing temperature by 7℃. What is the freezing temperature of the gallon of salt water?


2. Discuss with a partner:
a. How did each of you name the resulting temperature in each situation?
b. What does it mean when the temperature is above 0? Below 0?
c. Do numbers less than 0 make sense in other contexts? Give some specific examples to show how they do or do not make sense.
Exploration Activity: High Places, Low Places
1. Here is a table that shows elevations, in feet (ft.), of various cities.
a. On the list of cities, which city has the second highest elevation?
b. How would you describe the elevation of Coachella, CA, in relation to sea level?
c. How would you describe the elevation of Death Valley, CA, in relation to sea level?
d. If you are standing on a beach right next to the ocean, what is your elevation?
e. How would you describe the elevation of Miami, FL?
f. A city has a higher elevation than Coachella, CA. Select all numbers that could represent the city’s elevation. Be prepared to explain your reasoning.
2. Here are two tables that show the elevations of highest points on land and lowest points in the ocean. Distances are measured from sea level, in meters (m).
a. Which point in the ocean is the lowest in the world? What is its elevation?
b. Which mountain is the highest in the world? What is its elevation?
c. If you plot the elevations of the mountains and trenches on a vertical number line, what would 0 represent? What would points above 0 represent? What about points below 0?
d. Which is farther from sea level: the deepest point in the ocean, or the top of the highest mountain in the world? Explain.
Lesson Summary
Positive numbers and negative numbers can be used to represent various real-world contexts.
A positive number is a number that is greater than zero. On a horizontal number line, positive numbers are usually shown to the right of 0.
A negative number is a number that is less than zero. On a horizontal number line, negative numbers are usually shown to the left of 0.
The meaning of a negative number in a given context depends on the meaning of zero in that context. For example, when measuring temperatures in ℃, 0℃ corresponds to the temperature at which water freezes.

ManuscriptCopy
In this situation, positive temperatures are warmer than the freezing point, and negative temperatures are colder than the freezing point. A temperature of –6℃ means that the temperature is 6℃ away from 0 and it is less than 0.
The thermometer shows a temperature of –6℃.
If the temperature rises a few degrees and gets very close to 0℃ without reaching it, the temperature is still a negative number.
Another example is elevation, which is a distance above or below sea level. An elevation of 0 refers to sea level, as shown on the vertical number line. Positive elevations are higher than sea level, and negative elevations are lower than sea level.

1.
Practice Problems
a. Is a temperature of –11° warmer or colder than a temperature of –15°?
b. Is an elevation of –10 feet (ft.) closer or farther from the surface of the ocean than an elevation of –8 ft.?
c. It was 8° at nightfall. The temperature dropped 10° by midnight. What was the temperature at midnight?
d. A diver is 25 ft. below sea level. After he swims up 15 ft. toward the surface, what is his elevation?
2.
a. A whale is at the surface of the ocean to breathe. What is the whale’s elevation?
b. The whale swims down 300 ft. to feed. What is the whale’s elevation now?
c. The whale swims down 150 more ft. more. What is the whale’s elevation now?
ManuscriptCopy
d. Plot each of the three elevations as a point on a vertical number line. Label each point with its numeric value.
3. Explain how to calculate a number that is equal to 2.1 1.5 .
4. Write an equation to represent each situation and then solve the equation.
a. Andre drinks 15 ounces (oz.) of water, which is 3 5 of a bottle. How much does the bottle hold? Use �� for the number of oz. of water the bottle holds.
b. A bottle holds 15 oz. of water. Jada drank 8.5 oz. of water. How many oz. of water are left in the bottle? Use �� for the number of ounces of water left in the bottle.
c. A bottle holds �� oz. of water. A second bottle holds 16 oz., which is 8 5 times as much water. How much does the first bottle hold?
5. A rectangle has an area of 24 square units (sq. units) and a side length of 2 3 4 units. Find the other side length of the rectangle. Show your reasoning.
ManuscriptCopy
ManuscriptCopy
Unit 7, Lesson 2: Points on the Number Line
Warm-Up: A Point on the Number Line

Collaborative Activity: What’s the Temperature?
1. Here are five thermometers. The first four thermometers show temperatures in degrees Celsius, (℃). Write the temperatures in the blanks. a. _____ b. _____ c. _____ d. _____ e. _____

The last thermometer is missing some numbers. Write them in the boxes.
2. Elena says that the thermometer shown here reads –2.5 ℃ because the line of the liquid is above –2℃. Jada says that it is –1.5℃. Do you agree with either one of them? Explain your reasoning.
3. One morning, the temperature in Phoenix, Arizona, was 8℃ and the temperature in Portland, Maine, was 12℃ cooler. What was the temperature in Portland?

Exploration Activity: Folded Number Lines
Your teacher will give you a sheet of tracing paper on which to draw a number line.
1. Follow the steps to make your own number line.
• Use a straightedge or a ruler to draw a horizontal line. Mark the middle point of the line and label it 0.
• To the right of 0, draw tick marks that are 1 centimeter (cm) apart. Label the tick marks 1, 2 ,3 . . .10. This represents the positive side of your number line.
• Fold your paper so that a vertical crease goes through 0 and the two sides of the number line match up perfectly.
ManuscriptCopy
• Use the fold to help you trace the tick marks that you already drew onto the opposite side of the number line. Unfold and label the tick marks –1, –2, –3 . . . –10. This represents the negative side of your number line.
2. Use your number line to answer these questions.
a. Which number is the same distance away from zero as is the number 4?
b. Which number is the same distance away from zero as is the number –7?
c. Two numbers that are the same distance from zero on the number line are called opposites. Find another pair of opposites on the number line.
d. Determine how far away the number 5 is from 0. Then, choose a positive number and a negative number that is each farther away from zero than is the number 5.
e. Determine how far away the number –2 is from 0. Then, choose a positive number and a negative number that is each farther away from zero than is the number –2.
Pause here so your teacher can review your work.
3. Here is a number line with some points labeled with letters. Determine the location of points P, X , and Y.

If you get stuck, trace the number line and points onto a sheet of tracing paper, fold it so that a vertical crease goes through 0, and use the folded number line to help you find the unknown values.
ManuscriptCopy
Lesson Summary
The number line shown is labeled with positive and negative numbers. The number 4 is positive, so its location is 4 units to the right of 0 on the number line. The number –1.1 is negative, so its location is 1.1 units to the left of 0 on the number line.

The opposite of 8.3 is –8.3, and the opposite of –3 2 is 3 2 .
Two numbers are opposites if they are the same distance from 0 and on different sides of the number line.
Points A and B are opposites because they are both 2.5 units away from 0 and A is to the left of 0 while B is to the right of 0.

A positive number has a negative number for its opposite. A negative number has a positive number for its opposite. The opposite of 0 is itself.
All of the familiar positive numbers, both whole and non-whole, can be thought of as fractions and can be located on a number line.
To locate a non-whole number on a number line, divide the distance between 2 whole numbers into fractional parts, and then count the number of parts. For example, 2.7 can be written as 2 7 10 . The segment between 2 and 3 can be partitioned into 10 equal parts, or 10 tenths. From 2, count 7 of the tenths to locate 2.7 on the number line.
All of the fractions and their opposites are rational numbers. For example, 4, –1.1, 8.3, –8.3, – 3 2 , and 3 2 are all rational numbers.
A rational number is a real number that can be expressed as the ratio of two integers.
In addition to whole numbers and natural numbers, another subset of rational numbers is integers.
Integers are whole numbers and their opposites.
Practice Problems
1. For each number, name its opposite.
a. –5
b. 28
c. –10.4
d. 0.875
e. 0
f. –8,003
2. Plot the numbers –1.5, 3 2 , –3 2 , and –5 4 on the number line. Label each point with its numeric value.
3. Plot the following points on a number line.
• –1.5
• the opposite of –2
• the opposite of 0.5
• –2
4.
a. Represent each of these temperatures in degrees Fahrenheit (℉) with a positive or negative number.
i. 5℉ above zero
ii. 3℉ below zero
iii. 6℉ above zero
iv. 2 3 4 ℉ below zero
b. Order the temperatures above from the coldest to the warmest.
5. Solve each equation.
a. 8�� = 2 5
b. 1 1 2 = 2��
c. 5�� = 2 15
d. 1 4 �� = 5
e. 1 5 = 2 50 ��
6. Write the solution to each equation as a fraction and as a decimal.
a. 2�� = 3
b. 5 �� = 3
c. 0.3�� = 0.009
Unit 7, Lesson 3: Comparing Positive and Negative Numbers
Warm-Up: Which One Doesn’t Belong: Inequalities
Which inequality doesn’t belong?
A. 5 4 < 2
B. 8.5 > 0.95
C. 8.5 < 7
D. 10.00 < 100
Exploration Activity: Comparing Temperatures
The low temperatures, in degrees Celsius (℃), for a week in Anchorage, Alaska, are shown in the table.
1. Plot the temperatures on a number line.
2. Which day of the week had the lowest low temperature?
3. The lowest temperature ever recorded in the US was –62℃, in Prospect Creek Camp, Alaska. The average temperature on Mars is about –55℃.
a. Which is warmer, the coldest temperature ever recorded in the US or the average temperature on Mars? Explain how you know.
b. Write an inequality to represent your answer to part A.
4. On a winter day, the low temperature in Anchorage, Alaska, was –21℃, and the low temperature in Minneapolis, Minnesota, was –14℃.
Karyna said, “I know that 14 is less than 21, so –14 is also less than –21. This means that it was colder in Minneapolis than in Anchorage.”
Explain whether you agree with Karyna’s reasoning.
ManuscriptCopy
Collaborative Activity: Rational Numbers on a Number Line
1. Plot the numbers –2, 4, –7, and 10 on the number line. Label each point with its numeric value.
2. Decide whether each inequality statement is true or false. Be prepared to explain your reasoning.
a. –2 < 4
b. –2 < –7
c. 4 > –7
d. –7 > 10
3. Andre says that 1 4 is less than –3 4 because, of the two numbers, 1 4 is closer to 0. Do you agree? Explain your reasoning.
4. Answer each question. Be prepared to explain how you know.
a. Which number is greater: 1 4 or 5 4 ?
b. Which number is farther from 0: 1 4 or 5 4 ?
c. Which number is greater: –3 4 or 5 8 ?
d. Which number is farther from 0: –3 4 or 5 8 ?
e. Is the number that is farther from 0 always the greater number? Explain your reasoning.
Lesson Summary
The phrases “is greater than” and “is less than” are used to compare numbers on a number line. For example, the integers –7, –3, 1, and 9 are shown on the number line.
Because –7 is to the left of –3, this is stated as “–7 is less than –3” and written as –7 < –3.
In general, any number that is to the left of a number n on a horiztonal number line (or below a number n on a vertical number line) is less than n.
The number line illustrates that –3 is greater than –7 because –3 is to the right of –7. This is written as –3 > –7.
In general, any number that is to the right of a number n on a horiztonal number line (or above a number n on a vertical number line) is greater than n.
The number line also shows that 1 > – 3 and 9 > – 7. In general, any positive number is greater than any negative number.
Practice Problems
1. Decide whether each inequality statement is true or false. Explain your reasoning.
a. – 5 > 2
b. 3 > –8
c. –12 > –15
2. The statement –8 < – 6 is true. Select all of the statements that are equivalent to –8 < –6.
□ –8 is farther to the right on the number line than –6.
□ –8 is farther to the left on the number line than –6.
□ –8 is less than –6.
□ –8 is greater than –6.
□ –6 is less than –8.
□ –6 is greater than –8.
Review Problems
3. Plot each of the following numbers on the number line. Label each point with its numeric value.
4. The table shows five states and the lowest point in each state.
ManuscriptCopy
Put the states in order by their lowest elevation, from least to greatest.
5. Each lap around the track is 400 meters (m).
a. How many m does someone run if they run: 2 laps? 5 laps? �� laps?
b. If Noah ran 14 laps, how many m did he run?
c. If Noah ran 7,600 m, how many laps did he run?
6. A stadium can seat 16,000 people at full capacity.
a. If there are 13,920 people in the stadium, what percentage of the capacity is filled? Explain or show your reasoning.
b. What percentage of the capacity is not filled?
ManuscriptCopy
Unit 7, Lesson 4: Ordering Rational Numbers
Warm-Up: How Do They Compare?
Use the symbols >, <, or = to compare each pair of numbers. Be prepared to explain your reasoning.
12 _________ 19
Collaborative Activity: Ordering Rational Number Cards
Your teacher will give you a set of number cards. Order them from least to greatest.
Your teacher will give you a second set of number cards. Add these to the correct places in the ordered set.
ManuscriptCopy
Collaborative Activity: Comparing Points on a Line
A number line is shown with points M, N, P, and R.
1. Use each of the following terms at least once to describe or compare the values of points M, N, P, R. • greater than • less than • opposite of (or opposites)
• negative number
2. Tell what the value of each point would be if:
ManuscriptCopy
Lesson Summary
To order rational numbers from least to greatest, list them in the order they appear on the number line, from left to right on a horizontal number line or from bottom to top on a vertical number line.
For example, the number line shows that the numbers –7, –3, 1, and 9 are listed from least to greatest because of the order they appear on the number line. 0
-7-319
To list numbers from greatest to least, list them in the opposite direction. For example, the values plotted on the number line listed from greatest to least are 9, 1, –3, and –7.
Comparison symbols such as < or > can also be used when listing a set of numbers being compared. For example, both inequalities shown are true.
Practice Problems
1. Select all of the numbers that are greater than –5.
2. The boiling points of certain elements are shown, rounded to the nearest integer, in degrees Celsius (℃).
List the elements from lowest to highest boiling point.
3. Order numbers shown from greatest to least.
Review Problems
4. Explain why zero is considered its own opposite.
5. Find the quotients.
Warm-Up: Notice and Wonder: It Comes and Goes
ManuscriptCopy
Exploration Activity: The Concession Stand
The manager of a concession stand keeps records of all the supplies she buys and all the items she sells. The table shows some of her records for Tuesday.
1. Which items did she sell? Explain your reasoning.
2. Interpret –58 in this situation.
3. Interpret –10.00 in this situation.
4. Which item did she spend the most money on? Explain your reasoning.
Collaborative Activity: Drinks for Sale
A vending machine in an office building sells bottled beverages. The machine keeps track of all changes in the number of bottles from sales and from machine refills and maintenance. This record shows the changes for every 5 minute (min.) period over 1 hour (hr.).
1. What might a positive number mean in this context? What about a negative number?
2. What would a “0” in the second column mean in this context?
3. Which numbers, positive or negative, result in fewer bottles in the machine?
4. At what time was there the greatest change to the number of bottles in the machine? How did that change affect the number of remaining bottles in the machine?
5. At which time period, 8:05–8:09 or 8:25–8:29, was there a greater change to the number of bottles in the machine? Explain your reasoning.
6. The machine must be emptied to be serviced. If there are 40 bottles in the machine when it is to be serviced, what number will go in the second column in the table?
Lesson Summary
Sometimes, changes in a quantity are represented with positive and negative numbers. If the quantity increases, the change is positive. If it decreases, the change is negative.
• Suppose 5 gallons (gal.) of water are put in a washing machine. The change in the number of gal. is represented as + 5. If 3 gal. are emptied from the machine, the change is represented as –3.
It’s common to represent money received with positive numbers and money spent with negative numbers.
• Suppose Cristal gets $30.00 for her birthday and spends $18.00 buying lunch for herself and a friend. To her, the value of the gift can be represented as +30.00 and the value of the lunch can be represented as –18.00.
Whether a value is considered positive or negative depends on a person’s perspective. If Cristal’s grandmother gives her $20 for her birthday, Cristal might see this as +20, because to her, the amount of money in her wallet has increased. But her grandmother might see it as –20, because to her, the amount of money in her wallet has decreased.
In general, when using positive and negative numbers to represent changes, be very clear about what it means when the change is positive and what it means when the change is negative.
Practice Problems
1. Write a positive or negative number to represent each change in the high temperature, in degrees (°).
a. Tuesday’s high temperature was 4° less than Monday’s high temperature.
b. Wednesday’s high temperature was 3° less than Tuesday’s high temperature.
c. Thursday’s high temperature was 6° greater than Wednesday’s high temperature.
d. Friday’s high temperature was 2° less than Thursday’s high temperature.
2. Decide which of the following quantities can be represented by a positive number and which can be represented by a negative number. Give an example of a quantity with the opposite sign in the same situation.
a. Tyler’s puppy gained 5 pounds (lb.).
b. The aquarium leaked 2 gal. of water.
c. Andre received a gift of $10.
d. Kiran gave a gift of $10.
e. A climber descended 550 feet (ft.).
3. Make up a situation where a quantity is changing.
a. Explain what it means to have a negative change.
b. Explain what it means to have a positive change.
c. Give an example of each.
4.
a. On the number line, label the points that are 4 units away from 0.

b. If you fold the number line so that a vertical crease goes through 0, the points you label would match up. Explain why this happens.
c. On the number line, label the points that are 5 2 units from 0. What is the distance between these points?
5. Evaluate each expression.
a. 23 ⋅ 3 b. 42 2
c. 31
d. 62 ÷ 4
e. 23 –2
f. 102 + 52
ManuscriptCopy
Unit 7, Lesson 6: Absolute Value of Numbers
Warm-Up: Number Talk: Closer to Zero
For each pair of expressions, decide mentally which one has a value that is closer to 0.
1. 9 10 or 15 10
2. 1 5 or 1 8
3. 1.25 or 5 4
4. 0.01 or 0.001
ManuscriptCopy
Exploration Activity: Jumping Flea
1. A flea is jumping around on a number line.

a. If the flea starts at 1 and jumps 4 units to the right, where does it end up? How far away from 0 is this?
b. If the flea starts at 1 and jumps 4 units to the left, where does it end up? How far away from 0 is this?
c. If the flea starts at 0 and jumps 3 units away, where might it land?
d. If the flea jumps 7 units and lands at 0, where could it have started?
e. The absolute value of a number is the distance it is from 0. The flea is currently to the left of 0 and the absolute value of its location is 4. Where on the number line is it?
f. If the flea is to the left of 0 and the absolute value of its location is 5, where on the number line is it?
g. If the flea is to the right of 0 and the absolute value of its location is 2.5, where on the number line is it?
2. We use the notation |–2| to say “the absolute value of –2,” which means ”the distance of –2 from 0 on the number line.”
a. What does |–7| mean and what is its value?
b. What does |1.8| mean and what is its value?
Collaborative Activity: Absolute Elevation and Temperature
1. A part of the city of New Orleans is 6 feet (ft.) below sea level. We can use “–6 ft.” to describe its elevation, and “|–6| ft.” to describe its vertical distance from sea level. In the context of elevation, what would each of the following numbers describe?
a. 25 ft.
b. |25| ft.
c. –8 ft.
ManuscriptCopy
d. |–8| ft.
2. The elevation of a city is different from sea level by 10 ft. Name the two elevations that the city could have.
3. We write “–5 degrees Celsius (℃)” to describe a temperature that is 5℃ below freezing point and “5℃” for a temperature that is 5° above freezing. In this context, what do each of the following numbers describe?
a. Which temperature is colder: –6∘C or 3∘C?
b. Which temperature is closer to freezing temperature: –6∘C or 3∘C?
c. Which temperature has a smaller absolute value? Explain how you know.
ManuscriptCopy
a.
c.
Lesson Summary
Numbers are compared by comparing their positions on the number line. The number farther to the right is greater, and the one farther to the left is less.
Sometimes, the comparison is made to determine which value is closer to or farther from 0. For example, there may be a desire to know how far away a temperature is from the freezing point of 0∘C, regardless of whether it is above or below freezing. The absolute value of the number can be used in this case.
The absolute value of a number is its distance from 0 on the number line.
The absolute value of –4 is 4 because –4 is 4 units to the left of 0. The absolute value of 4 is also 4 because 4 is 4 units to the right of 0. Opposites always have the same absolute value because they are both the same distance from 0.

The distance from 0 to itself is 0, so the absolute value of 0 is 0. Zero is the only number whose distance to 0 is 0. For all other absolute values, there are always 2 numbers (a positive number and a negative number) that are that same distance from 0.
The notation |4| is used to express “the absolute value of 4.”
The true equation |–8| = 8 reads, “The absolute value of –8 is 8.”
Practice Problems
1. On the number line, plot and label all numbers with an absolute value of 3 2 .

2. The temperature at dawn is 6∘C away from 0. Select all the temperatures that are possible.
3. Put these numbers in order, from least to greatest.
Review
Problems
4. Lin’s family needs to travel 325 miles (mi.) to reach her grandmother’s house.
a. At 26 mi., what percentage of the trip’s distance have they completed?
b. How far have they traveled when they have completed 72% of the trip’s distance?
c. At 377 mi., what percentage of the trip’s distance have they completed?
5. Elena donates some money to charity whenever she earns money as a babysitter. The table shows how much money, ��, she donates for different amounts of money, ��, that she earns.
a. What percent of her income does Elena donate to charity? Explain or show your work.
b. Which quantity, m or d, would be the better choice for the dependent variable in an equation describing the relationship between m and d? Explain your reasoning.
c. Use your choice from the second question to write an equation that relates m and d.
6. How many times larger is the first number in the pair than the second?
a. 34 is _______ times larger than 33.
b. 53 is _______ times larger than 52.
c. 710 is _______ times larger than 78.
d. 176 is _______ times larger than 174.
e. 510 is _______ times larger than 54.
ManuscriptCopy
ManuscriptCopy
Unit 7, Lesson 7: Comparing Numbers and Distance from Zero
Warm-Up: Opposites
1. �� is a rational number. Choose a value for �� and plot it on the number line.
2.
a. Based on where you plotted ��, plot −�� on the same number line.
b. What is the value of −�� that you plotted?
3. Noah said, “If �� is a rational number, −�� will always be a negative number.” Do you agree with Noah? Explain your reasoning.
ManuscriptCopy
Exploration Activity: Submarine
A submarine is at an elevation of –100 feet (ft.) (100 ft. below sea level). Let’s compare the elevations of these four people to that of the submarine.
• Clare’s elevation is greater than the elevation of the submarine. Clare is farther from sea level than the submarine.
• Andre’s elevation is less than the elevation of the submarine. Andre is farther away from sea level than the submarine.
• Han’s elevation is greater than the elevation of the submarine. Han is closer to sea level than is the submarine.
• Lin’s elevation is the same distance away from sea level as the submarine’s.
1. Complete the table as follows.
a. Write a possible elevation for each person.
b. Use <, >, or = to compare the elevation of that person to that of the submarine.
c. Use absolute value to tell how far away the person is from sea level (elevation 0).
As an example, the first row has been filled with a possible elevation for Clare.
2. Priya says her elevation is less than the submarine’s and she is closer to sea level. Is this possible? Explain your reasoning.
Collaborative Activity: Info Gap: Points on the Number Line
Your teacher will give you either a problem card or a data card. Do not show or read your card to your partner.
If your teacher gives you the problem card:
1. Silently read your card and think about what information you need to be able to answer the question.
2. Ask your partner for the specific information that you need.
3. Explain how you are using the information to solve the problem.
4. Continue to ask questions until you have enough information to solve the problem.
5. Share the problem card and solve the problem independently.
6. Read the data card and discuss your reasoning.
If your teacher gives you the data card:
1. Silently read your card.
ManuscriptCopy
2. Ask your partner “What specific information do you need?” and wait for them to ask for information.
3. If your partner asks for information that is not on the card, do not do the calculations for them. Tell them you don’t have that information.
4. Before sharing the information, ask “Why do you need that information?” Listen to your partner’s reasoning and ask clarifying questions.
5. Read the problem card and solve the problem independently.
6. Share the data card and discuss your reasoning.
Collaborative Activity: Inequality Mix and Match
Here are some numbers and inequality symbols. Work with your partner to write true comparison statements.
One partner should select two numbers and one comparison symbol and use them to write a true statement using symbols. The other partner should write a sentence in words with the same meaning, using the following phrases:
• is equal to
• is the absolute value of
• is greater than
• is less than
For example, one partner could write 4 < 8 and the other would write, “4 is less than 8.” Switch roles until each partner has three true mathematical statements and three sentences written down.
ManuscriptCopy
Lesson Summary
Elevation can be used to compare 2 rational numbers or 2 absolute values.
• Suppose an anchor has an elevation of –10 meters (m) and a house has an elevation of 12 m. To describe the anchor as having a lower elevation than the house, write –10 < 12, and say, “–10 is less than 12.”
• The anchor is closer to sea level than the house is to sea level, which has an elevation of 0 m. To describe this, write |–10| < |12|, and say, “The distance between –10 and 0 is less than the distance between 12 and 0.”
Similar descriptions can be used to compare rational numbers and their absolute values outside of the context of elevation.
• Absolute value can be used to compare the distances of –47.5 and 5.2 from 0. |–47.5| is 47.5 units away from 0, and |5.2| is 5.2 units away from 0, so |–47.5| > |5.2|.
• | –18| > 4 means that the absolute value of –18 is greater than 4. This is true because 18 is a greater distance from 0 than 4. To compare the values, though, –18 < 4.
Practice Problems
1. In the context of elevation, what would | –7| ft. mean?
2. Compare each pair of expressions using >, <, or =.
15
3. Match the statements written in English with the mathematical statements.
a. The number –4 is a distance of 4 units away from 0 on the number line.
b. The number –63 is more than 4 units away from 0 on the number line.
c. The number 4 is greater than the number –4.
d. The numbers 4 and –4 are the same distance away from 0 on the number line.
e. The number –63 is less than the number 4.
f. The number –63 is further away from 0 than the number 4 on the number line.
Review Problems
i. | – 63| > 4
ii. –63 < 4
iii. | –63| > |4|
iv. | –4| = 4
v. 4 > –4
vi. |4| = |–4|
4. Mai received and spent money in the following ways last month. For each example, write a signed number to represent the change in money from her perspective.
a. Her grandmother gave her $25 in a birthday card.
b. She earned $14 dollars babysitting.
c. She spent $10 on a ticket to the concert.
d. She donated $3 to a local charity.
e. She got $2 interest on money that was in her savings account.
5. Here are the lowest temperatures recorded in the last 2 centuries for some US cities. Temperatures are in degrees Fahrenheit (℉).
• Death Valley, CA was –45℉ in January of 1937.
• Danbury, CT was –37℉ in February of 1943.
• Monticello, FL was –2℉ in February of 1899.
• East Saint Louis, IL was –36℉ in January of 1999.
• Greenville, GA was –17℉ in January of 1940.
a. Which of these states has the lowest record temperature?
b. Which state has a lower record temperature, FL or GA?
c. Which state has a lower record temperature, CT or IL?
d. How many more degrees colder is the record temperature for GA than for FL?
6. Find the quotients.
a. 0.024 ÷ 0.015
b. 0.24 ÷ 0.015
c. 0.024 ÷ 0.15
d. 24 ÷ 15
ManuscriptCopy
ManuscriptCopy
Unit 7, Lesson 8: Writing and Graphing Inequalities
Warm-Up: Estimate Heights of People
1. Here is a picture of a man.
a. Name a number, in feet (ft.), that is clearly too high for this man’s height.
b. Name a number, in ft., that is clearly too low for his height.
c. Make an estimate of his height.
Pause here for a class discussion.
2. Here is a picture of the same man standing next to a child.
If the man’s actual height is 5 ft. 10 inches (in.), what can you say about the height of the child in this picture?
Be prepared to explain your reasoning.
ManuscriptCopy


Collaborative Activity: Stories about 9
1. Your teacher will give you a set of paper slips with four stories and questions involving the number 9. Match each question to three representations of the solution: a description or a list, a number line, or an inequality statement.
2. Compare your matching decisions with another group’s. If there are disagreements, discuss until both groups come to an agreement. Then, record your final matching decisions here.
a. A fishing boat can hold fewer than 9 people. How many people, ��, can it hold?
• Description or list:
• Number line:
• Inequality:
b. Lin needs more than 9 ounces (oz.) of butter to make cookies for her party. How many oz. of butter, ��, would be enough?
• Description or list:
• Number line:
• Inequality:
c. A magician will perform her magic tricks only if there are at least 9 people in the audience. For how many people, ��, will she perform her magic tricks?
• Description or list:
• Number line:
• Inequality:
ManuscriptCopy
d. A food scale can measure up to 9 kilograms (kg) of weight. What weights, ��, can the scale measure?
• Description or list:
• Number line:
• Inequality:
Exploration Activity: How High and How Low Can It Be?
Here is a picture of a person and a basketball hoop. Based on the picture, what do you think are reasonable estimates for the maximum and minimum heights of the basketball hoop?
1. Complete the first blank in each sentence with an estimate, and the second blank with ”taller” or “shorter.”
a. I estimate the minimum height of the basketball hoop to be _________ ft. This means the hoop cannot be _____________ than this height.
b. I estimate the maximum height of the basketball hoop to be _________ ft. This means the hoop cannot be _____________ than this height.
2. Write two inequalities—one to show your estimate for the minimum height of the basketball hoop, and another for the maximum height. Use an inequality symbol and the variable ℎ to represent the unknown height.


3. Plot each estimate for minimum or maximum value on a number line.
Minimum:

Maximum:
4. Suppose a classmate estimated the value of ℎ to be 19 ft. Does this estimate agree with your inequality for the maximum height? Does it agree with your inequality for the minimum height? Explain or show how you know.
5. Ask a partner for an estimate of ℎ. Record the estimate and check if it agrees with your inequalities for maximum and minimum heights.
Lesson Summary
Inequalities are used to communicate that a value is less than or is greater than another value.
Suppose the temperature is less than 3 degrees Fahrenheit (℉), but the exact temperature is unknown. To represent what is known about the temperature, ��, in ℉, the inequality �� < 3 can be used.
The possible temperatures can also be graphed on a number line. Any point to the left of 3 is a possible value for ��. The open circle at 3 means that �� cannot be equal to 3, because the temperature is less than 3.
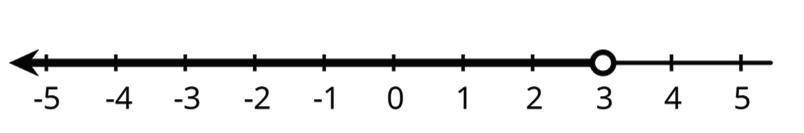
Suppose a young traveler has to be at least 16 years old to fly on an airplane without an accompanying adult.
If �� represents the age of the traveler, then any number greater than 16 is �� possible value of ��, and 16 itself is also a possible value of ��. This can be represented on a number line by drawing a closed circle at 16 to show that it meets the requirement, because a 16-year-old person can travel alone. From there, a line can be drawn pointing to the right to represent that all of the values greater than 16 are also included.
ManuscriptCopy

Both an inequality and an equation can be used together to represent all the possible values of ��, �� > 16 and �� = 16.
Practice Problems
1. At the book sale, all books cost less than $5.
a. What is the most expensive a book could be?
b. Write an inequality to represent costs of books at the sale.
c. Draw a number line to represent the inequality.
2. Kiran started his homework before 7:00 p.m. and finished his homework after 8:00 p.m. Let ℎ represent the number of hours (hr.) Kiran worked on his homework.
Decide if each statement is definitely true, definitely not true, or possibly true. Explain your reasoning.
a. ℎ > 1
b. ℎ > 2
c. ℎ < 1
d. ℎ < 2
ManuscriptCopy
3. Consider a rectangular prism with length 4 and width and height ��.
a. Find an expression for the volume of the prism in terms of ��.
b. Compute the volume of the prism when �� = 1, when �� = 2, and when �� = 1 2 .

4. Match the statements written in English with the mathematical statements. All of these statements are true.
a. The number –15 is further away from 0 than the number –12 on the number line.
b. The number –12 is a distance of 12 units away from 0 on the number line.
c. The distance between –12 and 0 on the number line is greater than –15.
d. The numbers 12 and –12 are the same distance away from 0 on the number line.
e. The number –15 is less than the number –12.
f. The number 12 is greater than the number –12.
ManuscriptCopy
i. |–12| > –15
ii. –15 < –12
iii. | –15| > | –12|
iv. | –12| = 12
v. 12 > –12
vi. |12| = | –12|
5. Here are five sums. Use the distributive property to write each sum as a product with two factors.
Unit 7, Lesson 9: Solutions of Inequalities
Warm-Up: Unknowns on a Number Line
The number line shows several points, each labeled with a letter.

1. Fill in each blank with a letter so that the inequality statements are true.
a. _______ > _______
b. _______ < _______
2. Jada says that she found three different ways to complete the first question correctly. Do you think this is possible? Explain your reasoning.
3. List a possible value for each letter on the number line based on its location.
ManuscriptCopy
Exploration Activity: Amusement Park Rides
Priya finds these height requirements for some of the rides at an amusement park.
To ride the . . . you must be . . .
High Bounce between 55 and 72 inches (in.) tall
Climb-A-Thon under 60 in. tall
Twirl-O-Coaster 58 in. minimum
1. Write an inequality for each of the three height requirements. Use ℎ for the unknown height. Then, represent each height requirement on a number line.
• High Bounce _____________________
• Climb-A-Thon _____________________
• Twirl-O-Coaster _____________________

Pause here for additional instructions from your teacher.
ManuscriptCopy
2. Han’s cousin is 55 in. tall. Han doesn’t think she is tall enough to ride the High Bounce, but Kiran believes that she is tall enough. Do you agree with Han or Kiran? Be prepared to explain your reasoning.
3. Priya can ride the Climb-A-Thon, but she cannot ride the High Bounce or the Twirl-O-Coaster. Which, if any, of the following could be Priya’s height? Be prepared to explain your reasoning.
• 59 in.
• 53 in.
• 56 in.
4. Jada is 56 in. tall. Which rides can she go on?
5. Kiran is 60 in. tall. Which rides can he go on?
ManuscriptCopy
6. The inequalities ℎ < 75 and ℎ > 64 represent the height restrictions, in inches, of another ride. Write three values that are solutions to both of these inequalities.
Guided Activity: More Fun at the Amusement Park
Hector was happy to realize that he is not too tall to go on the Climb-A-Thon ride. Hector’s friend, Daisy, is 2 in. taller than him.
1. Explain whether Daisy is too tall to go on the ride with Hector.
2. Complete the statements.
If Hector is �� in. tall, then Daisy is �� + 2 �� – 2 in. tall. For Daisy to meet the height restriction for the Climb-A-Thon, the value of �� + 2 �� – 2 must be less than greater than
58. 60. Therefore, the solutions to the inequality �� + 2 < �� + 2 > �� – 2 < �� – 2 > 58 60 represent
Hector’s height if Daisy can also ride the Climb-A-Thon.
3. On the number line, show all the possible heights that Hector could be if Daisy also meets the ride’s height restriction.
4. What is the maximum height Hector can be in order for Daisy to be able to go on the ride as well?
5. Franny noticed the graph also represents the solutions to the inequality �� < 58. Work with your partner to explain why the solutions to �� + 2 < 60 and �� < 58 are represented the same way on a number line.
Collaborative Activity: Inequalities in Mathematical and Real-World Contexts
The solution set of an inequality includes the values that make the inequality true. An inequality has an infinite number of values in the solution set. However, some parts of a solution set may not make sense, given a real-world context.
For example, to ride the the Twirl-O-Coaster at an amusement park, guests must be a minimum of 58 in. tall.
1. What does 58 represent in this situation?
2. Graph the inequality that represents this situation. 40424446485052545658606264666870
3. Explain what the arrow on your graph represents.
4. Provide 2 values that are part of the solution set but do not make sense in this context. Explain your reasoning.
ManuscriptCopy
Lesson Summary
To beat the school record for the 50 yard (yd.) dash would take a time under 10 seconds (sec.). If �� represents the time it takes to run the 50 yd. dash, then �� < 10 represents the time needed to break the school record.
Any value of �� that makes the inequality true is called a solution to the inequality.
A solution to an inequality is a number that can be used in place of the variable to make the inequality true.
For example, 5 is a solution to the inequality �� < 10 because 5 < 10 is a true statement, but 12 is not a solution because 12 < 10 is not a true statement. There are an infinite number of solutions that make this inequality true, such as 7 sec., 8.29 sec., 9.245 sec., and an endless list of other values. All of these values are part of the solution set of the inequality �� < 10.
Sometimes, there are values that are part of the mathematical solution set that do not make sense in the context. In those cases, the variable may have a constraint placed on it so that the solutions are realistic.
A constraint is a limitation on the possible values of variables in a model, often expressed by an equation or inequality.
If a situation involves more than one boundary or limit, more than one inequality is needed to express it.
For example, to ride the High Bounce at an amusement park, guests have to be more than 55 in. tall but less than 72 in. tall. The height restriction can be represented by the inequalities and number lines shown.
48505254565860626466687072747678
> 55
48505254565860626466687072747678
< 72
Any number greater than 55 is a solution to �� > 55, and any number less than 72 is a solution to �� < 72. But to meet the condition of “more than 55 but less than 72,” the solutions are limited to the numbers between 55 in. and 72 in., not including 55 and 72.
This solution set can be shown visually by graphing the 2 inequalities on a single number line, as shown.
48505254565860626466687072747678
1.
Practice Problems
a. Select all numbers that are solutions to the inequality �� > 5.
□ 4
□ 5
□ 6
□ 5.2
□ 5.01
□ 0.5
b. Draw a number line to represent this inequality.
2. One day in Boston, MA, the high temperature was 60 degrees Fahrenheit (℉), and the low temperature was 52℉.
a. Write one or more inequalities to describe the temperatures, ��, that are between the high and low temperature on that day.
b. Show the possible temperatures on a number line.
3. The graph of an inequality is shown.
-8-7-6-5-4-3-2-1012345678
Circle the inequalities that can be represented by the graph.
Review Problems
4. Select all the true statements.
–5 < | –5|
| –6 | < 3
4 < | – 7|
| –7| < | –8|
a. The price of a cell phone is usually $250. Elena’s mom buys one of these cell phones for $150. What percentage of the usual price did she pay?
b. Elena’s dad buys another type of cell phone that also usually sells for $250. He pays 75% of the usual price. How much did he pay?
ManuscriptCopy
Unit 7, Lesson 10: Solving One-Variable Inequalities
Warm-Up: Visual Models
An unbalanced hanger diagram is shown. It shows that the weight of 1 circle is greater than the weight of 1 pentagon.
1. Complete the table.

Hanger Diagram Description Inequality


The weight of 1 circle, ��, is greater than the weight of 1 pentagon, ��.
The weight of 1 square, ��, is __________ than the weight of 1 circle and 1 pentagon.
Exploration Activity: Is the New Inequality True?
1. Four true inequalities are given in the table. Work with your partner to complete the table by following the steps indicated for each inequality and then answering the questions.
2. Use your work from the table to compete the statements.
a. When the same value is added to both sides of a true inequality, the new inequality is true. false.
b. When the same value is subtracted from both sides of a true inequality, the new inequality is true. false.
c. When both sides of a true inequality are multiplied by the same positive value, the new inequality is true. false.
ManuscriptCopy
d. When both sides of a true inequality are divided by the same positive value, the new inequality is true. false.
Collaborative Activity: Solving One-Step Inequalities with Positive Rational Numbers
The process for solving one-variable inequalities is similar to the process for solving one-variable equations.
1. Complete the table to determine the value of �� – 3 for each value of ��.
2. For which value of �� is �� – 3 = 2.2 true?
3. For which values of �� is �� – 3 > 2.2 true?
4. Represent the values from question 3 on the number line.
-8-7-6-5-4-3-2-1012345678
5. Discuss with a partner whether the solution set of �� – 3 > 2.2 includes more values than are represented in the table and on the number line.
6. Graph the solution set for �� – 3 > 2.2.
-8-7-6-5-4-3-2-1012345678
7. Complete the mathematical statement by writing a comparison symbol and a constant value to create an inequality equivalent to the inequality graphed in question 6.
8. What value can be added to both sides of the inequality �� – 3 > 2.2 to result in the inequality written in question 7?
Guided Activity: Solving and Checking One-Step Inequalities
1. Use the inequality 10 > 5 4 �� to complete the following.
a. Solve the inequality. Show your work.
b. Graph the solution set on the number line.
c. Choose a value from the solution set. Substitute the value for �� into the original inequality to verify your solution and graph. Show your work.
2. Use the inequality �� 4 > 1.25 to complete the following.
a. Solve the inequality. Show your work.
b. Graph the solution set on the number line.
ManuscriptCopy
c. Choose a value from the solution set. Substitute the value for �� into the original inequality to verify your solution and graph. Show your work.
3. Michael got an estimate on the cost to repair his mountain bike. The parts will cost $16.38, and he was told that the repair will be less than $40.50 total, including labor.
The inequality 16.38 + �� < 40.50 represents this situation, where �� is the cost of labor.
a. Solve the inequality to determine the maximum amount that the labor will cost.
b. Graph the solution set on the number line.
c. Explain which solutions, if any, do not make sense for this context.
Lesson Summary
Unit 6 explored solving one-step equations. One-step inequalities are solved in the same way, by performing the same operations on both sides of the inequality to maintain the original relationship between the quantities. When solving one-step equations, there was only 1 value of the variable that made the equation true. With inequalities, however, there are an infinite number of solutions that make the inequality true.
Just like with equations, performing the same operation on both sides of a true inequality results in an equivalent inequality that is also true. To solve a given inequality, choose an operation that, when applied to both sides of the inequality, will isolate the variable on one side of the comparison symbol. When the variable is isolated and compared to a constant term, the inequality describes the solution set, which can then be graphed on a number line.
ManuscriptCopy
Solutions can be verified by choosing values that are in the solution set, substituting the value(s) into the original inequality, and evaluating the statement. If the statement is not true with the substituted value, there is an error in the solution. Revisit the question, correct any errors, and verify the revised solution.
Practice Problems
1. Use the inequality 7 2 5 + �� < 9 9 10 to complete the following.
a. Solve the inequality. Show your work.
b. Graph the solution set on the number line.
2. Gabriel and Lauren made errors when solving the inequality 14.8 < 3.7��. Their work is shown.
a. Explain the error(s) each student made.
b. Correctly solve the inequality 14.8 < 3.7��.
ManuscriptCopy
3. To go on a water slide at a water park, a rider must be more than 48 inches (in.) tall. Brent is tall enough to go on the slide, but his friend, Sheri, is 3 1 4 in. shorter than him. The inequality �� – 3 1 4 > 48, represents Brent’s height if Sheri is also tall enough to go on the slide.
a. Solve the inequality to determine possible heights for Brent that would mean he and Sheri both get to ride the water slide.
b. Explain whether there are any values that do not make sense in this context.
Review Problems
4. A sign on the road says, “Speed limit, 60 miles per hour (mph).”
a. Let �� be the speed of a car. Write an inequality that matches the information on the sign.
b. Draw a number line to represent the solutions to the inequality.
c. Could 60 be a value of ��? Explain your reasoning.
ManuscriptCopy
5. Solve each equation.
a. �� – 2.01 = 5.5
b. �� + 2.01 = 5.5
ManuscriptCopy
c. 10�� = 13.71
d. 100�� = 13.71
Unit 7, Lesson 11: Writing and Interpreting One-Step Inequalities
Warm-Up: True or False: Fraction and Decimals
ManuscriptCopy
State whether each equation is true or false. Be prepared to explain your reasoning.
1. 3(12 + 5) = (3 ⋅ 12) ⋅ (3 ⋅ 5)
Collaborative Activity: Basketball Game
Noah scored �� points in a basketball game.
1. What does 15 < �� mean in the context of the basketball game?
2. What does �� < 25 mean in the context of the basketball game?
3. Draw two number lines to represent the solutions to the two inequalities.
4. Name a possible value for �� that is a solution to both inequalities.
5. Name a possible value for �� that is a solution to 15 < ��, but not a solution to �� < 25.
6. Can –8 be a solution to �� in this context? Explain your reasoning.
Collaborative Activity: Relating Real-World Context to Inequalities
1. Four inequalities are shown. �� + 4 < 32 32 – �� > 4 �� 32 < 4 �� 4 > 32
Discuss with your partner which inequality correctly represents each situation, where �� represents the unknown quantity. Then, write the matching inequality in the space provided.
Situation 1
At a restaurant, the bill had to be split among 4 friends.
If each person paid more than $32, which inequality represents this context?
Inequality:
Situation 2
There are fewer than 32 objects to find in a hidden picture puzzle.
If Martell has found 4 of the hidden objects, which inequality represents this context?
Inequality:
2. Solve the inequalities selected to answer the questions for each situation.
Situation 1
If each person paid more than $32, what was the amount of the total bill?
Solution:
Situation 2
If Martell has found 4 of the hidden objects, how many remain for Martell to find?
Solution:
3. Interpret the solution set for each situation.
Situation 1
Intepretation:
Situation 2
Interpretation:
Collaborative Activity: Writing and Solving Inequalities for Real-World Contexts
1. Keegan collected 7 more items than his cousin Joel did for the annual toy drive. Joel collected more than 12 items.
a. Which inequality could be used to represent the number of items Keegan collected?
A. �� – 7 < 12
B. �� – 7 > 12
C. �� + 7 < 12
D. �� + 12 > 7
b. Explain what the variable �� represents in this situation.
c. How many items did Keegan collect for the toy drive?
d. Explain whether there any values in the solution set that may not make sense in this context.
2. Drake is selling candy bars for a school fundraiser. Each candy bar sells for $2.75.
a. Write an inequality using multiplication that can be used to determine how many candy bars Drake sold, ��, if he raised less than $352.
b. Compare your inequality with a partner’s. Discuss any differences in your inequalities, and make revisions if needed.
c. Solve the inequality.
d. Interpret the solution set in context.
ManuscriptCopy
Lesson Summary
When representing a real-world situation with an inequality, use key words from the context to determine the comparison symbol that should be used in the inequality. Some common key words are shown.
Is Greater Than (>) Is Less Than (<)
exceeds more than over below fewer than under
When finding the solutions to an inequality, consider the context carefully. A number that is a solution to an inequality mathematically may not make sense when considered in context. Consider the 2 examples shown.
• Suppose a basketball player scored more than 11 points in a game and the number of points she scored, ��, is represented by the inequality �� > 11. Judging only by looking at �� > 11, numbers such as 12, 14 1 2 , and 130.25 are all solutions to the inequality because they each make the inequality true.
In a basketball game, however, it is only possible to score a whole number of points, so fractional and decimal scores are not possible. It is also highly unlikely that one person would score more than 130 points in a single game. In other words, the context of an inequality may limit its solutions.
• The solutions to �� < 30 can include numbers such as 27 3 4 , 18.5, 0, and –7. But if �� represents the number of minutes (min.) of rain yesterday, assuming it did rain, then the solutions are limited to positive numbers. Zero min. or negative numbers of min. would not make sense in this context.
Practice Problems
1. There is a closed carton of eggs in Mai’s refrigerator. The carton contains �� eggs and it can hold 12 eggs.
a. What does the inequality �� < 12 mean in this context?
b. What does the inequality �� > 0 mean in this context?
c. What are some possible values of �� that will make both �� < 12 and �� > 0 true?
2. One orange tree can produce more than 275 oranges. A crate holds 25 oranges.
a. Which inequality represents this situation?
A. 275 �� < 25
B. �� 275 > 25
C. 25�� < 275
D. 25�� > 275
b. Solve the inequality, and interpret the solution in context.
3. Karen’s cat weighs 5 2 5 pounds (lb.) less than Corey’s puppy. Corey’s puppy weighs less than 15 lb.
a. Write an inequality using addition that can be used to represent the weight of Karen’s cat, ��.
b. What is the possible weight range for Karen’s cat? Explain your reasoning.
ManuscriptCopy
Review Problems
4. Tyler has more than $10. Elena has more money than Tyler. Mai has more money than Elena. Let �� be the amount of money that Tyler has, let �� be the amount of money that Elena has, and let �� be the amount of money that Mai has. Select all statements that are true.
5. Which is greater, –9 or –5? Explain how you know. If you get stuck, consider plotting the numbers on a number line.
Unit 7, Lesson 12: Points on the Coordinate Plane
Warm-Up: Guess My Line
1. Choose a horizontal or a vertical line on the grid. Draw 4 points on the line and label each point with its coordinates.


2. Tell your partner whether your line is horizontal or vertical, and have your partner guess the locations of your points by naming coordinates.
If a guess is correct, put an X through the point. If your partner guessed a point that is on your line but not the point that you plotted, say, “That point is on my line, but is not one of my points.”
Take turns guessing each other’s points, 3 guesses per turn.
Guided Activity: The Coordinate Plane
1. Label each point on the coordinate plane with an ordered pair.


2. What do you notice about the locations and ordered pairs of ��, ��, and ��? How are they different from those for point ��?
3. Plot a point at (–2, 5). Label it ��. Plot another point at (3, –4.5). Label it ��.
4. The coordinate plane is divided into four quadrants, I, II, III, and IV, as shown here.
a. In which quadrant is �� located? ��? ��?
�� = (5, 2)
�� = (–1, –5)
�� = (7, –4)

b. A point has a positive ��-coordinate. In which quadrant could it be?
Collaborative Activity: Coordinated Archery
Here is an image of an archery target on a coordinate plane. The scores for landing an arrow in the colored regions are shown.
• Yellow: 10 points
• Red: 8 points
• Blue: 6 points
• Green: 4 points
• White: 2 points

Name the coordinates for a possible landing point to score.
6 points
Lesson Summary
Just as the number line can be extended to the left of 0 or below 0 to include negative numbers, the �� -axis and ��-axis of a coordinate plane can also be extended to include negative values.
The ��-axis is the horizontal axis in the coordinate system. The ��-axis divides positive ��-values from negative ��-values, and the ��-value of any point lying on the ��-axis equals zero.
The ��-axis is the vertical axis in the coordinate system. The ��-axis divides positive ��-values from negative ��-values, and the ��-value of any point lying on the ��-axis equals zero.
The ��- and ��-axes intersect at a point called the origin.
In the coordinate plane, the origin is the location where the ��-axis and ��-axis intersect. The coordinates of the origin are (0,0).
When negative values are included on the coordinate plane, all 4 quadrants are included.
A quadrant is any of the four regions separated by the axes in a coordinate plane.
The ordered pair (��, ��) can have negative ��- and ��-values. For the point �� = (–4, 1), the ��-value of –4 indicates that the point is 4 units to the left of the ��-axis. The ��-value of 1 indicates that the point is 1 unit above the ��-axis.
The same reasoning applies to the points �� and ��. The ��- and ��-coordinates for point �� are positive, so �� is to the right of the ��-axis and above the ��-axis. The ��- and ��-coordinates of point �� are negative, so �� is to the left of the ��-axis and below the ��-axis.
The quadrants are named in counterclockwise (↺) order using the Roman numerals for 1–4, which are I, II, III, and IV. Point �� is in quadrant I, point �� is in quadrant II, point �� is in quadrant III, and there is no labeled point shown in quadrant IV.

1.
Practice Problems
a. Graph these points in the coordinate plane: (–2, 3), (2, 3), (–2, –3), (2, –3).
b. Connect all of the points. Describe the figure.

2. Write the coordinates of each point.
ManuscriptCopy

3. These three points form a horizontal line: (–3.5, 4), (0, 4), and (6.2, 4). Name two additional points that fall on this line.
Review Problems
4. One night, it is 24∘ Celsius (℃) warmer in Tucson than it was in Minneapolis. If the temperatures in Tucson and Minneapolis are opposites, what is the temperature in Tucson?
A. –24∘C
B. –12∘C
C. 12∘C
D. 24∘C
5. Noah is helping his band sell boxes of chocolate to fund a field trip. Each box contains 20 bars and each bar sells for $1.50.
a. Complete the table for values of ��.
b. Write an equation for the amount of money, ��, that will be collected if �� boxes of chocolate bars are sold. Which is the independent variable and which is the dependent variable in your equation?
c. Write an equation for the number of boxes, ��, that were sold if �� dollars were collected. Which is the independent variable and which is the dependent variable in your equation?
Unit 7, Lesson 13: Plotting and Identifying Points on the Coordinate Plane
Warm-Up: Unlabeled Points
Label each point on the coordinate plane with the appropriate letter and ordered pair.
�� (7, –5.5) �� (–8, 4) �� (3, 2)
(–3.5, 0.2)
Collaborative Activity: Signs of Numbers in Coordinates
1. Write the coordinates of each point.
2. Plot and label the points shown.
• �� (–6, –4.5)
• �� (1, 5)
• �� (–5 2, 3)
3. List all the points in each quadrant.
Quadrant I: _____________
Quadrant II: _____________
Quadrant III: _____________
Quadrant IV: _____________
Collaborative Activity: Game Score
A game board is shown on the coordinate plane, along with the number of points earned for landing in each area.
1. Several points are given in the table. Locate each point on the coordinate grid. Complete the table by writing the score value for landing on each point.


2. Calculate the game score by finding the sum of all the points.
Game score:
ManuscriptCopy
Lesson Summary
The 2 numbers that name the location of a point in the coordinate plane are called the coordinates.
A coordinate is a number used to locate a point on a number line. It is one of the numbers in an ordered pair that locates a point on a coordinate plane.
Locations of points in the coordinate plane include 2 coordinates, (��, ��). For this reason, the location is also called a coordinate pair or an ordered pair. The ��-value of the ordered pair represents the location of the point along the horizontal axis (��-axis), and the ��-value of the ordered pair represents the location of the point along the vertical axis (��-axis). Sometimes, points are named with a letter, such as point ��. This is to help identify the point more easily, such as when being asked to locate or identify the coordinates of a point .
• The points in quadrant I have positive ��- and ��-values.
• The points in quadrant II have negative ��-values and positive ��-values.
• The points in quadrant III have negative ��- and ��-values.
• The points in quadrant IV have positive ��-values and negative ��-values.
ManuscriptCopy
Practice Problems
1. Four points are shown on the coordinate plane.
Label each point with its coordinates.
-1-2-3-4-5-6-7-8-9-10
2. Plot and label each point on the coordinate plane based on the characteristics described.
a. Plot point �� with an ��-coordinate of 0.
b. Plot point �� with a ��-coordinate of 0.
c. Plot point �� in quadrant II with an ��-coordinate of –3.
d. Plot point �� in quadrant III with a ��-coordinate of –4.
e. Plot point �� in quadrant I with a ��-coordinate of 2.
f. Plot point �� in quadrant IV with an ��-coordinate of 1.
3. Solve each equation.
a. 3�� = 12
b. �� + 3.3 = 8.9
c. 1 = 1 4 ��
d. 5 1 2 = �� + 1 4
e. 2�� = 6.4
ManuscriptCopy
Unit 7, Lesson 14: Constructing the Coordinate Plane
Warm-Up: English Winter
The following data were collected over one December afternoon in England.
1. Which set of axes would you choose to represent these data? Explain your reasoning.
2. Explain why the other two sets of axes did not seem as appropriate as the one you chose.


ManuscriptCopy

Exploration Activity: Axes Drawing Decisions
1. Here are three sets of coordinates. For each set, draw and label an appropriate pair of axes and plot the points.


ManuscriptCopy
a. (1, 2), (3, –4), (–5, –2), (0, 2.5)
b. (50, 50), (0, 0), (–10, –30), (–35, 40)
2. Discuss with a partner:
• How are the axes and labels of your three drawings different?
• How did the coordinates affect the way you drew the axes and label the numbers?
ManuscriptCopy
Collaborative Activity: Postively A-maze-ing
Here is a maze on a coordinate plane. The black point in the center is (0, 0). The side of each grid square is 2 units long.
1. Enter the above maze at the location marked with a green segment. Draw line segments to show your way through and out of the maze. Label each turning point with a letter. Then, list all the letters and write their coordinates.


2. Choose any 2 turning points that share the same line segment. What is the same about their coordinates? Explain why they share that feature.
ManuscriptCopy
Lesson Summary
The coordinate plane can be used to show information involving pairs of numbers. When using the coordinate plane, pay close attention to what each axis represents and what scale each uses.
The table shows data about the temperatures, in degrees Celsius (℃), in Minneapolis one evening in relation to the time since midnight, in hours (hr.).
To plot the temperature data, let the ��-axis represent time, in hr. since midnight, and let the ��-axis represent temperature, in ℃.
• In this case, ��-values less than 0 represent hr. before midnight, and ��-values greater than 0 represent hr. after midnight.
• On the ��-axis, the values represent temperatures above and below the freezing point, 0℃.
The data involves whole numbers, so it is appropriate that the each square on the grid represents a whole number.
• To the left of the origin, the ��-axis needs to go at least as far as –4. To the right, it needs to go to 3 or greater.
• Below the origin, the ��-axis has to go at least as far as –8. Above the origin, it needs to go to 3 or greater. These ranges will show all the data from the table.
A graph of the data with the axes labeled appropriately is shown.


On this coordinate plane, a point at (0, 0) would mean the temperature is 0℃ at midnight. The point at (–4, 3) means the temperature is 3℃ at 4 hr. before midnight, or 8 p.m.

Practice Problems
1. Draw and label an appropriate pair of axes and plot the points.
• � 1 5 , 4 5 �
• �–3 5 , 2 5 � • �–1 1 5 , –4 5 � • � 1 5 , –3 5 �


2. Diego was asked to plot these points: (–50, 0), (150, 100), (200, –100), (350, 50), (–250, 0). What interval could he use for each axis? Explain your reasoning.
3.
a. Name 4 points that would form a square with the origin at its center.
b. Graph these points to check if they form a square.
ManuscriptCopy
Review Problems
4. Which of the following changes would you represent using a negative number? Explain what a positive number would represent in that situation.
a. A loss of 4 points
b. A gain of 50 yards
c. A loss of $10
d. An elevation above sea level
5. Jada is buying notebooks for school. The cost of each notebook is $1.75.
a. Write an equation that shows the cost of Jada’s notebooks, ��, in terms of the number of notebooks, ��, that she buys.
b. Which of the following could be points on the graph of your equation?
□ (1.75, 1)
□ (2, 3.50)
□ (5, 8.75)
ManuscriptCopy
□ (17.50, 10)
□ (9, 15.35)
6. A corn field has an area of 28.6 acres. It requires about 15,000,000 gallons (gal.) of water. About how many gal. of water per acre is that?
a. 5,000
b. 50,000
c. 500,000
d. 5,000,000
ManuscriptCopy
Unit 7, Lesson 15: Shapes on the Coordinate Plane
Warm-Up: Figuring Out the Coordinate Plane
1. Draw a figure in the coordinate plane with at least three of following properties:
• 6 vertices
• 1 pair of parallel sides
• At least 1 right angle
• 2 sides with the same length
2. Is your figure a polygon? Explain how you know.
Exploration Activity: Find the Polygon
1. The table lists the vertices of a polygon.
a. Without plotting the coordinates, explain what type of polygon you think will be created by plotting and connecting the points in the table.
b. Plot the polygon on the coordinate plane. Connect the points in the order listed, connecting the last coordinate back to the first.
c. Revisit your answer to part A. Explain whether your answer matches the polygon plotted in part B.
ManuscriptCopy
Collaborative Activity: Plotting Polygons
The tables list the coordinates of 4 polygons.
1. Plot each polygon on the coordinate plane, connect the points in the order they are listed, and connect the last point back to the first one. Label each polygon with its letter name.
2. How many sides does each polygon have?
Polygon A
Polygon
Polygon
Lesson Summary
Coordinates can be given in lists, as seen in previous lessons, or in tables, as seen in this lesson. Tables can be represented vertically or horizontally. Each corresponding pair of ��- and ��-values from a table can be represented by an ordered pair, (��, ��).
Coordinates can also be used to graph a polygon in the coordinate plane, given the coordinates of the polygon’s vertices. An example is shown.
ManuscriptCopy
Practice Problems
1. The coordinates of a rectangle are (3, 0), (3, –5), (–4, 0), and (–4, –5). Plot the rectangle on the coordinate plane.
2. Draw a square with one vertex at the point (–3, 5) and another at the point (2, 0). Write the coordinates of the other vertices.
3. Plot and connect the points given in the table to form a polygon.
Review Problem
4. For each situation, select all the equations that represent it. Choose one equation and solve it.
a. Jada’s cat weighs 3.45 kg. Andre’s cat weighs 1.2 kg more than Jada’s cat. How much does Andre’s cat weigh?
□ �� = 3.45 + 1.2
□ �� = 3.45 – 1.2
□ �� + 1.2 = 3.45
□ �� – 1.2 = 3.45
b. Apples cost $1.60 per pound at the farmer’s market. They cost 1.5 times as much at the grocery store. How much do the apples cost per pound at the grocery store?
□ �� = (1.5) ⋅ (1.60)
□ �� = 1.60 ÷ 1.5
□ (1.5)�� = 1.60
□ �� 1.5 = 1.60 y x 0
ManuscriptCopy
Unit 8, Lesson 1: Interpreting Negative Integers
Warm-Up: Using the Thermometer
Here is a weather thermometer. Three of the numbers have been left off.
1. What numbers go in the boxes?
2. What temperature does the thermometer show?
ManuscriptCopy

Exploration Activity: Gauging the Temperature
Four thermometers are shown, each with a different temperature gauged in degrees Celsius (℃).
1. What temperature is shown on each thermometer?
A: __________ B: __________ C: __________
__________
2. Which thermometer shows the highest temperature?
3. Which thermometer shows the lowest temperature?
4. Suppose the temperature outside is –4℃. Explain whether that is colder or warmer than the coldest temperature shown.
Exploration Activity: Using Integers with Elevation
A picture of some sea animals is shown. The number line to the left of the animals shows the vertical position of each animal above or below sea level, in meters (m).
1. To the nearest integer, how far above or below sea level is each animal? Measure to their eye level, and label each animal’s elevation in the image.
2. A mobula ray is 3 m above the surface of the ocean. Describe how its vertical position compares to the height or depth of each of the following.
a. The jumping dolphin

b. The flying seagull

c. The octopus
3. An albatross is 5 m above the surface of the ocean. Describe how its vertical position compares to the height or depth of each of the following.
a. The jumping dolphin
b. The flying seagull
c. The octopus
4. A clownfish is 2 m below the surface of the ocean. Describe how its vertical position compares to the height or depth of each of the following.
a. The jumping dolphin
b. The flying seagull
c. The octopus
5. The vertical distance of another dolphin above the dolphin in the picture is 3 m. What is the new dolphin’s distance from the surface of the ocean?
Lesson Summary
Positive and negative integers can be used to represent temperature and elevation.
When numbers represent temperatures, positive numbers represent temperatures that are warmer than zero, and negative numbers represent temperatures that are colder than zero. This thermometer shows a temperature of –1℃, which is expressed as –1℃.

When numbers represent elevations, positive numbers indicate positions above sea level, and negative numbers indicate positions below sea level. The number line shows the order of integers.
On a horizontal number line, a number is always less than any number to its right. On a vertical number line, a number is always less than any number above it. For example, –7 < –3.
Use absolute value to describe how far a number is from 0. The numbers 15 and –15 are both 15 units from 0, so |15| = 15 and |–15| = 15. These values, 15 and –15, are examples of opposites. They are on opposite sides of 0 on the number line, and they are the same distance from 0.
Practice Problems
1. It was –5℃ in Copenhagen and –12℃ in Oslo. Which city was colder?
2.
a. A fish is 12 m below the surface of the ocean. What is its elevation?
b. A sea bird is 28 m above the surface of the ocean. What is its elevation?
c. If the bird is directly above the fish, how far apart are they?
3. Compare each pair of values using >, =, or <.
a. 3 _____ –3
b. 12 _____ 24
c. –12 _____ –24
d. –5 _____ 5
e. 7 _____ |–7|
f. |–7| _____ –7
4. Find the area of each shape. Show your reasoning.

5. A particular shade of orange paint has 2 cups (c.) of yellow paint for every 3 c. of red paint. On the double number line, circle the numbers of c. of yellow and red paint needed for 3 batches of orange paint.

ManuscriptCopy
Unit 8, Lesson 2: Changing Temperature
Warm-Up:
Which One Doesn’t Belong: Arrows
Which pair of arrows doesn’t belong?
ManuscriptCopy


A.
B.
C.
D.
Exploration Activity: Warmer and Colder
1. Complete the table and draw a number line diagram for each situation.
ManuscriptCopy
A.
B.
C.
D.
E.
2. Complete the table and draw a number line diagram for each situation.
ManuscriptCopy
A.
B.
C.
D.
Collaborative Activity: Winter Temperatures
One winter day, the temperature in Houston is 8° Celsius (℃). Find the temperatures in these other cities. Explain or show your reasoning.
1. In Orlando, it is 10° warmer than it is in Houston.
2. In Salt Lake City, it is 8° colder than it is in Houston.
3. In Minneapolis, it is 20° colder than it is in Houston.
4. In Fairbanks, it is 10° colder than it is in Minneapolis.
5. Write an addition equation that represents the relationship between the temperature in Houston and the temperature in Fairbanks.
Lesson Summary
If it is 42° outside and the temperature increases by 7°, add the initial temperature and the change in temperature to find the final temperature.
42 + 7 = 49
If the temperature decreases by 7°, subtract 42 – 7 to find the final temperature, or think of the change as –7°. Then, add to find the final temperature, as shown.
42 + (–7) = 35
In general, a change in temperature can be represented by a positive number if it increases and a negative number if it decreases. The final temperature can be determined by adding the initial temperature and the change. If it is 3° and the temperature decreases by 7°, then add 3 + (–7) to find the final temperature, which is –4°.
Integers can be represented with arrows on a number line. Positive integers are represented with arrows that start at 0 and point to the right. For example, this arrow represents +10 because it is 10 units long and it points to the right.

Represent negative integers with arrows that start at 0 and point to the left. For example, this arrow represents –4 because it is 4 units long and it points to the left.

To represent addition on a number line, put the arrows “tip to tail” in the order presented. Two examples are shown.
1.
Practice Problems
a. The temperature is –2℃. If the temperature rises by 15℃, what is the new temperature?
b. At midnight, the temperature is –6℃. At midday the temperature is 9℃. By how much did the temperature rise?
2. Draw a diagram to represent each of these situations. Then write an addition expression that represents the final temperature.
a. The temperature was 80° Fahrenheit (℉) and then fell 20℉.
b. The temperature was –13℉ and then rose 9℉.
c. The temperature was –5℉ and then fell 8℉.
Review Problems
3. Han earns $33.00 for babysitting 4 hours (hr.). At this rate, how much will he earn if he babysits for 7 hr.? Explain your reasoning.
4. Without computing, decide whether the value of each expression is much smaller than 1, close to 1, or much greater than 1.
Expression
Description of Value
Much smaller than 1 Close to 1
Much greater than 1
Much smaller than 1 Close to 1
Much greater than 1
Much smaller than 1 Close to 1
Much greater than 1
Much smaller than 1 Close to 1
Much greater than 1
Much smaller than 1 Close to 1
Much greater than 1
Much smaller than 1 Close to 1
Much greater than 1
ManuscriptCopy
Unit 8, Lesson 3: Changing Elevation
Warm-Up: That’s the Opposite
1. Draw arrows on a number line to represent these situations:
a. The temperature was –5°. Then the temperature rose 5°.
b. A climber was 30 feet (ft.) above sea level. Then she descended 30 ft.
2. What’s the opposite?
a. Running 150 ft. east.
b. Jumping down 10 steps.
c. Pouring 8 gallons (gal.) into a fish tank.
ManuscriptCopy
Exploration Activity: Cliffs and Caves
1. A mountaineer is climbing on a cliff. She is 400 ft. above the ground. If she climbs up, this will be a positive change. If she climbs down, this will be a negative change.
a. Complete the table.
b. Write an addition equation and draw a number line diagram for B. Include the starting elevation, change, and final elevation in your diagram.
2. A spelunker is down in a cave next to the cliff. If she climbs down deeper into the cave, this will be a negative change. If she climbs up, whether inside the cave or out of the cave and up the cliff, this will be a positive change.
a. Complete the table.
ManuscriptCopy
b. Write an addition equation and draw a number line diagram for C and D. Include the starting elevation, change, and final elevation in your diagram.
c. What does the expression –75 + 100 tell us about the spelunker? What does the value of the expression tell us?
Collaborative Activity: Adding Integers
Find each sum. Sketch a number line diagram if it is helpful.
ManuscriptCopy
1. –35 + (30 + 5)
2. –1 + (–2) + 12
3. 21 + (–46)
Exploration Activity: School Supply Number Line
Your teacher will give you a long strip of paper.
Follow these instructions to create a number line.
1. Fold the paper in half along its length and along its width.
2. Unfold the paper and draw a line along each crease.
3. Label the line in the middle of the paper 0. Label the right end of the paper + and the left end of the paper –.
4. Select two objects of different lengths, for example a pen and a glue stick. The length of the longer object is �� and the length of the shorter object is ��.
5. Use the objects to measure and label each of the following points on your number line.
6. Complete each statement using <, >, or =. Use your number line to explain your reasoning.
Lesson Summary
The opposite of a number is the same distance from 0 but on the other side of 0. An example of opposites using 9 and –9 is shown on the number line.

When opposites are added, the result is always 0. This diagram shows that 9 + (–9) = 0. The arrows are used to show both the magnitude and the direction of each integer. Both integers have a magnitude of 9, but in opposite directions.

When 2 numbers with the same sign are added, the arrows that represent them point in the same direction. When the arrows are arranged tip to tail, the diagram shows that the resulting sum has the same sign. Two examples are shown. To find the sum, add the magnitudes, and give their sum the correct sign.
For example, the first diagram shows 4 + 3 = + (4 + 3) = 7, and the second diagram shows (–5) + (–4) = –(5 + 4) = –9.

ManuscriptCopy
However, when adding 2 numbers with different signs, because the arrows point in opposite directions, subtract their magnitudes to find the difference of the magnitudes, and give their difference the sign of the number with the larger magnitude. For example, the diagram shows (–5) + 12 = + (12 – 5) = 7.

Practice Problems
1. What is the final elevation if:
a. A bird starts at 20 meters (m) and changes 16 m?
b. A butterfly starts at 20 m and changes –16 m?
c. A diver starts at 5 m and changes –16 m?
d. A whale starts at –9 m and changes 11 m?
e. A fish starts at –9 m and changes –11 m?
2. One of the particles in an atom is called an electron. It has a charge of –1. Another particle in an atom is a proton. It has charge of +1. The charge of an atom is the sum of the charges of the electrons and the protons. A carbon atom has an overall charge of 0, because it has 6 electrons and 6 protons and –6 + 6 = 0. Find the overall charge for the rest of the elements on the list.
3. Compute the following sums. If you get stuck, consider drawing base-ten diagrams.
a. 0.027 + 0.004
b. 0.203 + 0.1
c. 1.2 + 0.145
4. A student said we cannot subtract 1.97 from 20 because 1.97 has two decimal digits and 20 has none. Do you agree with him? Explain or show your reasoning.
5. At a constant speed, a car travels 75 miles (mi.) in 60 minutes (min.). How far does the car travel in 18 min.? If you get stuck, consider using the table.
ManuscriptCopy
Unit 8, Lesson 4: Adding Integers Using Manipulatives
Warm-Up: Below Sea Level
A submarine explorer begins at sea level and descends at a rate of 150 feet (ft.) per minute (min.).
1. Sketch a picture that shows how far below sea level the submarine will be after 3 min.
2. Add a bird that is flying 1,000 ft. above sea level to your picture.
3. What number represents sea level?
4. Complete the statement.
The location of the submarine is represented by a while the location of the bird is represented by a ⃝ positive value, ⃝ negative value,
⃝ positive value.
⃝ negative value.
Guided Activity: Zero Pairs
Positive and negative values are often useful in the contexts of money, banking, and accounting.
1. Complete the statements.
a. In the context of money, numbers can be used to represent money spent or money owed to someone.
b. numbers can be used to represent money earned.
c. A value of +1 means that you ________________ $1.
d. A value of (–1) means that you ________________ $1 or __________ $1.
The table shows a positive integer chip, which represents earning $1, and a negative integer chip, which represents spending $1.
Integer chips can also be used to represent integers.
2. Complete the table. In the last column, sketch the integer chips that represent the phrase and the integer. Place a + sign in a circle to represent +, and place a –sign in a circle to represent +.
3. Complete the table by sketching integer chips for each phrase.
Earned $4 Spent $4
Earned $4 and Then Spent $4
4. Joleen earned $4 and then spent $4. How much money does she have left?
The last column in the previous table represents a zero pair.
5. Complete the table by drawing the negative integer chips that create a zero pair when combined with the positive integer chips shown. In the Sum column, draw all of the chips from both columns.
Each zero pair is the sum of an integer and its additive inverse. To make a zero pair, apply the additive inverse property. An example is shown.
6. Write an equation that represents the Sum column from problem 5.
7. Complete the table by drawing the positive integer chips that create a zero pair when combined with the negative integer chips shown. In the Sum column, draw all of the chips from both columns.
ManuscriptCopy
8. Write an equation that represents the Sum column from problem 7.
Collaborative Activity: Adding Integers with the Same Sign
1. Work with your partner to complete the table.
I earn $5 babysitting and another $2 for cleaning the dishes.
3 + 2
–4 + (–3) (–2) + (–1)
2. With your partner, discuss the patterns you notice about the signs of the sums when adding integers with the same sign.
3. Were any zero pairs created when adding integers with the same sign? Explain.
ManuscriptCopy
4. Complete the visual model of the rule of adding 2 positive integers by writing the sign of the sum.
5. Complete the visual model of the rule of adding 2 negative integers by writing the sign of the sum.
Exploration Activity: Using Zero Pairs to Add Integers with Opposite Signs
It is possible to add a positive number and a negative number. To find the answer using integer chips, represent the addends with integer chips. Make as many zero pairs as possible. Then, determine the number and sign of the chips that remain.
1. Complete the table to represent the sum of 5 + (–4) using integer chips.
Represent the first addend with integer chips.
Represent the second addend with integer chips.
Determine the number of zero pairs created, if any. Cross out the integer chips that represent zero pairs to indicate they are eliminated from the model.
Determine the sum using the number of integer chips remaining. 5 + (–4) = _____________
2. What do you notice about the remaining integer chips and the sign of the sum?
Visual Model
3. Complete the table independently to show how the sum 4 + (–7) can be represented using integer chips. Then, check your work with your partner.
Process
Representation
Represent the first addend with integer chips. ++++
Represent the second addend with integer chips. +++++++
Determine the number of zero pairs created, if any. Cross out the integer chips that represent zero pairs to indicate they are eliminated from the model.
Determine the sum using the number of integer chips remaining. 4 + (–7) = _____________
4. What do you notice about the remaining integer chips and the sign of the sum?
ManuscriptCopy
Lesson Summary
Integer chips can be used as a visual model when adding integers. Another similar visual model is algebra tiles, which can be used just like integer chips. The colors representing positive algebra tiles can vary, but the negative tiles are most commonly red.
An example of a positive unit algebra tile, which represents +1, and a negative unit algebra tile, which represents –1, are shown in the table. Both the integer chip model and the algebra tile model shown represent the same expression, 1 + (–1).
A positive number can be written with a positive sign, +1 or (+1), or it can be written without any sign, 1. A negative number can be written as –1 or (–1).
When adding integers, apply the additive inverse property to create zero pairs.
Additive inverse property
For every value, ��, there exists –�� so that �� + (–��) = 0 and (–��) + �� = 0.
After removing all zero pairs, the remaining integer chips represent the sum.
The table shows visual models of rules for adding integers with opposite signs. In each visual model, the larger circle symbolizes the integer represented by the most integer chips.
In general, when adding integers, the following statements are true.
• The sum will be positive when the positive number in the expression has the greater absolute value.
• The sum will be negative when the negative number in the expression has the greater absolute value.
Practice Problems
1. Complete the table for each expression. The first row is completed as an example.
+ (–2)
3 + (–6)
(–7) + 5
(–1) + 8
2. Complete the table for each expression. The first row is completed as an example.
12 + (–7) (–11) + 4
8 + (–8) (–10) + 3
9 + (–2)
Review Problems
3. Choose the expressions that do not represent the total area of the rectangle. Select all that apply.
□ 5�� + 4��
□ �� + 5 + 4 □ 9�� □ 4 ⋅ 5 ⋅ ��
□ ��(5 + 4)
4. Han is planning to ride his bike 24 miles (mi.).
a. How long will it take if he rides at a rate of:
i. 3 miles per hour (mph)?

ii. 4 mph?
iii. 6 mph?
b. Write an equation that Han can use to find ��, the time it will take to ride 24 mi., if his rate in mph is represented by ��.
c. On graph paper, draw a graph that shows �� in terms of �� for a 24 mi. ride.
ManuscriptCopy
ManuscriptCopy
Unit 8, Lesson 5: Representing Subtraction
Warm-Up: Equivalent Equations
Consider the equation 2 + 3 = 5. Here are some more equations, using the same numbers, that express the same relationship in a different way.
3 + 2 = 5 5 – 3 = 2 5 – 2 = 3
For each equation, write two more equations, using the same numbers, that express the same relationship in a different way.
1. 9 + (–1) = 8
2. –11 + �� = 7
ManuscriptCopy
Exploration Activity: Subtraction with Number Lines
1. Here is an unfinished number line diagram that represents a sum of 8.
a. How long should the other arrow be?
b. For an equation that goes with this diagram, Mai writes 3 + ? = 8. Tyler writes 8 – 3 = ?. Do you agree with either of them?
c. What is the unknown number? How do you know?
2. Here are two more unfinished diagrams that represent sums.
For each diagram:
a. What equation would Mai write if she used the same reasoning as before?
b. What equation would Tyler write if he used the same reasoning as before?
c. How long should the other arrow be?
d. What number would complete each equation? Be prepared to explain your reasoning.
ManuscriptCopy
3. Draw a number line diagram for (–8) – (–3) = ? What is the unknown number? How do you know?
Exploration Activity: We Can Add Instead
1. Match each diagram to one of these expressions. 3 + 7 3 – 7
(–7)


2. Which expressions in the first question have the same value? What do you notice?
ManuscriptCopy
3. Complete each of these tables. What do you notice?
8 + (–8)
8 – 8
8 + (–5)
8 – 5
8 + (–12)
8 – 12
–5 + 5
–5 – (–5)
–5 + 9
ManuscriptCopy
–5 – (–9)
–5 + 2
–5 – (–2)
Lesson Summary
The equation 7 – 5 = ? is equivalent to ? + 5 = 7. The diagram illustrates the second equation.

Notice that the value of 7 + (–5) is 2, as shown in the next diagram.
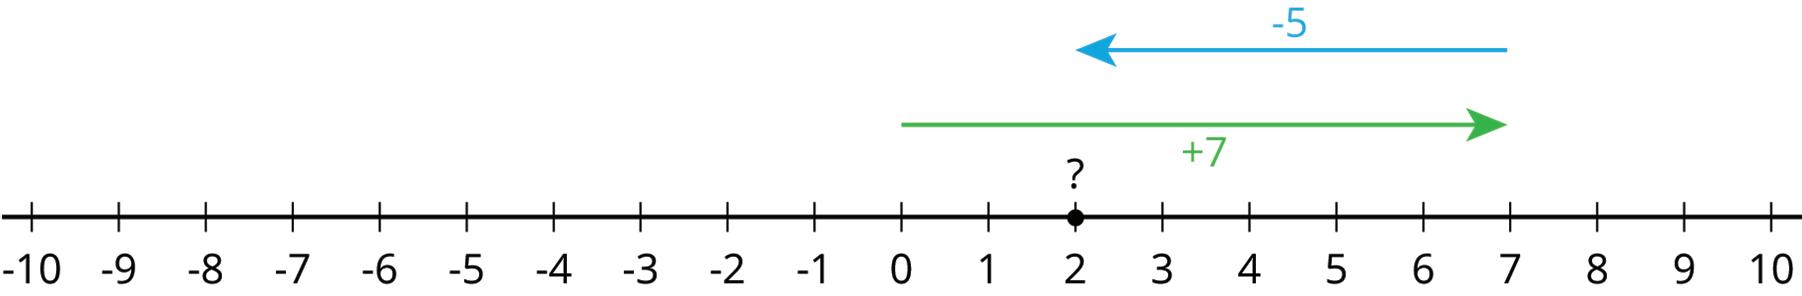
The same diagram can be used to represent the equation 7 – 5 = ?.
In all 3 examples, the value of ? = 2.
Similarly, 3 – 5 = ? is equivalent to ? + 5 = 3. The diagram illustrates the second equation.

Notice that the value of 3 + (–5) is –2, as shown in the next diagram.

The same diagram can be used to represent the equation 3 + (–5) = ?.
In all 3 examples, the value of ? = –2.
In general, �� – �� = �� + (–��) for any integer values of �� and ��.
If �� – �� = ��, then �� + �� = ��. Add –�� to both sides of this second equation to show that �� = �� + (–��).
Practice Problems
1. Write each subtraction equation as an addition equation.
a. �� – 9 = 6
b. �� – 20 = –30
c. �� – (–12) = 15
d. �� – (–7) = –10
2. Find each difference. If you get stuck, consider drawing a number line diagram.
a. 9 – 4
b. 4 – 9
c. 9 – (–4)
d. –9 – (–4)
e. –9 – 4
f. 4 – (–9)
g. –4 – (–9)
h. –4 – 9
Review Problems
3. Find the solution to each equation mentally.
a. 30 + �� = 40
b. 500 + �� = 200
c. –1 + �� = –2
d. �� + 3,567 = 0
4. 63 = 216. Using exponents, write three more expressions whose value is 216.
ManuscriptCopy
Unit 8, Lesson 6: Subtracting Integers Using Manipulatives
Warm-Up: Representing Addition
1. Write the addition expression represented by each model. Then, find the sum.
Exploration Activity: Using Integer Chips to Model Subtraction
Integer chips can also be used to model subtraction.
To find the difference of (–5) – 2 using integer chips, begin by first arranging 5 negative integer chips, as shown.
1. Draw a picture of how you think integer chips can be used to represent subtracting positive 2 from the 5 negative integer chips that are already represented.
Consider using zero pairs. It’s okay if you do not know; just try your best.
ManuscriptCopy
Guided Activity: Using Integer Chips to Model Subtraction
The additive identity property allows for the addition of zero pairs without changing the value of an expression or model. Only the available integer chips are changed.
1. Complete the steps to show how (–3) – 6 can be represented using integer chips. The first step is completed in the model.
a. Begin by representing the first integer, –3, with integer chips.
b. Determine what should be subtracted from the model.
a. For this model, 6 integer chips need to be subtracted.
c. If the chips that need to be removed from the model are not available, add the number of zero pairs needed to be able to do so.
d. Represent the subtraction by crossing out the integer chips that should be removed from the model created in the previous step.
e. Find the value of the expression based on the integer chips remaining. (–3) – 6 = __________
2. Complete the steps to show how 4 – 6 can be represented using integer chips.
a. Begin by representing the first integer, ____, with integer chips.
b. Determine what should be subtracted from the model.
a. For this model, integer chips need to be subtracted.
c. If the chips that need to be removed from the model are not available, add the number of zero pairs needed to be able to do so.
d. Represent the subtraction by crossing out the integer chips that should be removed from the model created in the previous step.
e. Find the value of the expression based on the integer chips remaining. 4 – 6 = __________ positive negative positive negative
Collaborative Activity: Subtraction with Integer Chips
1. Complete the steps to show how (–2) – (–5) can be represented using integer chips.
a. Begin by representing the first integer, ____, with integer chips.
b. Determine what should be subtracted from the model.
2. Use integer chips to show (–4) – (–4) = 0. positive negative
a. For this model, ____ integer chips need to be subtracted.
c. If the chips that need to be removed from the model are not available, add the number of zero pairs needed to be able to do so.
d. Represent the subtraction by crossing out the integer chips that should be removed from the model created in the previous step.
e. Find the value of the expression based on the integer chips remaining. (–2) – (–5) = ______
ManuscriptCopy
Lesson Summary
When subtracting integers, manipulatives such as integer chips or algebra tiles can be used to find the difference by following the steps described.
Step 1: Use integer chips to represent the first value in the expression.
Step 2: Remove the integer chips indicated by the second value in the expression.
Note: Sometimes, there are not enough integer chips to subtract, or remove, from the model. In these cases, apply the additive identity property of zero.
Additive identity property of zero �� + 0 = �� and 0 + �� = ��
This allows for zero pairs to be added until there are enough integer chips to remove.
Step 3: The amount that remains is the difference.
An example is shown following the steps described.
Practice Problems
1. Use integer chips to find the value of each expression.
a. (–11) – 6
b. (–4) – (–7)
c. 5 – (–8)
d. 9 – (–3)
e. (–1) – 2
f. (–12) – 4
ManuscriptCopy
2. At 10:00 p.m., it was 6 degrees Celsius (℃) outside. By 6:00 a.m., the temperature had dropped by 11℃. What was the temperature at 6:00 a.m.? If needed, use integer chips to help model the problem.
3. Diego bought 12 mini muffins for $4.20.
a. At this rate, how much would Diego pay for 4 mini muffins?
b. How many mini muffins could Diego buy with $3.00? Explain or show your reasoning. If you get stuck, consider using the table.
4. A restaurant has 26 tables in its dining room. It takes the waitstaff 10 minutes (min.) to clear and set 4 tables. At this rate, how long will it take the waitstaff to clear and set all the tables in the dining room? Explain or show your reasoning.
5. A sandwich shop serves 4 ounces (oz.) of meat and 3 oz. of cheese on each sandwich. After making sandwiches for an hour, the shop owner has used 91 combined oz. of meat and cheese.
a. How many combined oz. of meat and cheese are used on each sandwich?
b. How many sandwiches were made in the hour?
c. How many oz. of meat were used?
ManuscriptCopy
d. How many oz. of cheese were used?
Unit 8, Lesson 7: Subtracting Integers
Warm-Up: Missing Addend
Solve each equation mentally. Rewrite each addition equation as a subtraction equation.
1. 247 + �� = 458
2. �� + 59 = 44
3. 15 + �� = 51
ManuscriptCopy
Collaborative Activity: Expressions with Altitude
A mountaineer is changing elevations. Write an expression that represents the difference between the final elevation and beginning elevation. Then write the value of the change. The first one is done for you.
ManuscriptCopy

Exploration Activity: Does the Order Matter?
1. Two tables of subtraction expressions are shown. Find the value of each expression.
3 – 2
5 – (–9) (–11) – 2 (–6) – (–3) (–1) – (–4) (–2) – (–3)
2 – 3 (–9) – 5 2 – (–11) (–3) – (–6) (–4) – (–1) (–3) – (–2)
2. What do you notice about the expressions in column A compared to column B?
3. What do you notice about their values?
Lesson Summary
The term difference indicates subtraction. Usually, values are subtracted in the order they are named. For example, the difference of +8 and –6 is expressed as 8 – (–6).
The difference of 2 numbers indicates how far apart they are on a number line. The numbers 8 and –6 are 14 units apart, as shown. Therefore, 8 – (–6) = 14.
Notice that when subtraction is performed in the opposite order, the difference is the opposite. For example, (–6) – 8 = –14.
While distance cannot be negative, the sign in this case indicates direction. Subtraction can be thought of as asking, “How far is the first number from the second number?” To find the distance to 8 from –6, or 8 – (–6), would mean moving 14 units to the right on a number line, a move represented with a positive value. To find the distance to –6 from 8, or (–6) – 8, would mean moving 14 units to the left on a number line, a move represented with a negative value.
Practice Problems
1. Write a sentence to answer each question.
a. How much warmer is 82° than 40°?
ManuscriptCopy
b. How much warmer is 82° than –40°?
a. What is the difference in height between 30 meters (m) up a cliff and 87 m up a cliff? What is the distance between these positions?
b. What is the difference in height between an albatross flying at 100 m above the surface of the ocean and a shark swimming 30 m below the surface? What is the distance between them if the shark is right below the albatross?
3. Find each difference.
a. (–5) – 6
b. 35 – (–8)
c. 42 – 43
d. –14 – (–11)
Review Problems
4. Use each of the numbers 4, 40, and 4,000 once to complete the sentences
a. The value of __________ ÷ 40.01 is close to 1.
b. The value of __________ ÷ 40.01 is much less than 1.
c. The value of __________ ÷ 40.01 is much greater than 1.
ManuscriptCopy
Unit 8, Lesson 8: Adding and Subtracting Integers
Warm-Up: Concert Tickets
Priya wants to buy three tickets for a concert. She has earned $135 and each ticket costs $50. She borrows the rest of the money she needs from a bank and buys the tickets.
1. How can you represent the amount of money that Priya has after buying the tickets?
2. How much more money will Priya need to earn to pay back the money she borrowed from the bank?
3. How much money will she have after she pays back the money she borrowed from the bank?
Collaborative Activity: Integer War
Set Up:
• Remove all jokers and face cards (kings, queens, and jacks) from the deck.
• With your partner, determine who is the dealer. The dealer alternates dealing a card to their partner and to themselves, face down, until all the cards in the deck are dealt.
Rules:
• The black cards (spades and clubs ) represent positive values.
• The red cards (diamonds and hearts ) represent negative values.
• Aces represent either 1 or –1, while the other cards represent the positive or negative value indicated on the card.
How to Play:
• To begin, each player will flip over 1 card from their deck and place it in the center.
• The first player to figure out the sum of the 2 integers keeps both cards and adds them to the bottom of their stack.
Note: If a player says an incorrect sum, the other player responds for a chance to win the hand before the first player can change their answer.
• Repeat this process until time is called or until all of the cards have been used.
ManuscriptCopy
Collaborative Activity: Fluency with Adding
1. Find each sum.
a. –73 + 210
c. –18 + 875
e. 92 + (–100)
b. 143 + (–9)
d. –175 + (–544)
f. –256 + (–301)
2. Write 2 tips to share with someone who is just learning how to add integers.
ManuscriptCopy
Guided Activity: Subtracting Integers
1. Two expressions are shown.
With your partner, discuss whether the expressions are equivalent. Summarize your discussion.
2. Annalise is on a trivia game show. Her score after the first round is –500 points. She misses the first question in the second round, losing an additional 125 points.
Kiersten says she can represent Annalise’s score using subtraction, while Dylan says it can only be represented with addition.
a. Complete the table with the expression each student is referring to. Kiersten’s Subtraction Expression Dylan’s Addition Expression
b. Kiersten says Annalise’s score is –375 after missing the first question in the second round, but Dylan says it is –625. Explain which student is correct.
3. Rewrite each subtraction equation as an equivalent addition equation.
Addition and subtraction are inverse operations, which means they are operations that have the opposite effect of one another.
Understanding this relationship and the additive inverse property can be helpful when subtracting integers.
4. Complete the statement below using this information.
A subtraction expression can be rewritten as an equivalent addition expression by changing the operation from subtraction to _______________________ and changing the second value to its __________________ __________________.
Lesson Summary
So far, this unit has explored number lines, integer chips, algebra tiles, and the relationship between addition and subtraction to add and subtract integers.
These models and patterns observed using integers with smaller absolute values can be used to add and subtract integers with larger absolute values. All of the rules developed so far are summarized in the table, with examples shown.
Generalizations about Adding and Subtracting Integers
Determine the sum of integers with the same sign by adding the absolute values of the integers. The sum will have the same sign as the integers added.
Determine the sum of integers with different signs by subtracting the absolute values of the integers. The sum will have the same sign as the integer with the larger absolute value.
Subtraction can be rewritten as addition by adding the additive inverse rather than subtracting.
Examples
72 + 41 = 113
–72 + (–41) = –113
–45 + 13 = –32
45 + (–13) = 32
17 – 46 = 17 + (–46) = –29
–28 – (–24) = –28 + 24 = –4
Practice Problems
1. Find each sum.
a. 10 + (–204)
c. 904 + (–11)
2. Find each sum.
205 + (–643)
–399 + (–405)
3. Evaluate each expression.
a. 740 – (–171)
b. (–99) + (99)
ManuscriptCopy
–738 – (–212)
d. –1 + 76
b. –151 + (–70)
–80 + 606
b. 569 – 143
333 – (–204)
a.
c.
d.
c.
d.
4. Evaluate each expression.
a. 703 + (–190)
j. –600 + (–78)
c. –877 – 814
d. 157 – (–120)
Review Problems
5.
a. How many 1 5 liter (L) glasses can Lin fill with a 1 1 2 L bottle of water?
b. How many 1 1 2 L bottles of water does it take to fill a 16 L jug?
6. Let the side length of each small square on the grid represent 1 unit.
a. Draw two different triangles, each with base 5 1 2 units and area 19 1 4 square units (sq. units).
b. Why does each of your triangles have area 19 1 4 sq. units? Explain or show your reasoning.

ManuscriptCopy
Unit 8, Lesson 9: Multiplying Integers Using Models
Warm-Up: Representing Multiplication with Integer Chips
1. Complete the statements.
The addition expression 7 + 7 +7 can be written as ______ · 7.
This is because repeated addition of integers can be expressed as
2. Consider the expression 5 × 2.
a. Complete the statement.
division subtraction multiplication
The expression 5 × 2 can be interpreted as adding _____ groups of _____ or adding _____ groups of _____.
b. Use integer chips to represent 1 of these interpretations.
c. Describe how the integer chips represent the value of the expression 5 × 2.
Exploration Activity: Using Integer Chips to Represent Multiplication with Negatives
In the subtraction problem 5 – 2, the –2 indicates that 2 should be taken away from 5. In the expression –2 × 5, the –2 can be interpreted as removing 2 groups of 5.
1. Use the steps below to explore how to represent –2 × 5 using integer chips.
Step 1: First, use your integer chips to create 2 groups of 5 zero pairs. Draw the 2 groups of 5 zero pairs below.
2. Complete the statement.
The value of the integer chips drawn after step 1 is ______.
Step 2: Recall that the expression –2 × 5 can be interpreted as removing 2 groups of 5. From your integer chips, remove 2 groups of 5 positive integer chips. In your drawing, show removing 2 groups of 5 positive integer chips by crossing them out.
3. What is the value of –2 × 5?
4. Complete the statement.
Using the commutative property of multiplication, the value of the expression 5 × (–2) is ________.
Now, work with your partner to consider multiplication with 2 negative values.
5. Complete the statement.
The expression (–5)(–2) indicates that ____ groups of ____ should be removed.
6. Use the steps described to explore how to represent (–5)(–2) using integer chips.
Step 1: First, use your integer chips to create the set of zero pairs that will be needed to find the value of (–5)(–2). Draw the groups of zero pairs in the space provided.
Step 2: Remove 5 groups of 2 negative integer chips.
Step 3: Remove any remaining zero pairs, if needed.
7. Complete the statement.
The value of expression (–5)(–2) is _______.
8. With your partner, discuss any patterns you notice about the sign of the product when multiplying 2 values where 1 value is negative or when multiplying 2 negative values. Summarize your discussion.
ManuscriptCopy
Guided Activity: Multiplying Integers Using the Number Line
Recall that (2)(4) means 2 groups with 4 units in each group. The product is the total number of objects.
This can be represented on the number line as shown.
1. Represent each multiplication expression on the number line. Then, use it to complete the equation.
a. (2)(–4)
-15-14-13-12-11-10-9-8-7-6-5-4-3-2-10123456789101112131415
(2)(–4) =
b. (–2)(4)
-15-14-13-12-11-10-9-8-7-6-5-4-3-2-10123456789101112131415
(–2)(4) = _______
c. (–2)(–4)
-15-14-13-12-11-10-9-8-7-6-5-4-3-2-10123456789101112131415
(–2)(–4) = _______
Collaborative Activity: Multiplying Integers Using Models
Work with your partner to complete the following.
1. Use integer chips to model and evaluate each expression.
a. (3)(–5) =
b. –2 × (–2) =
2. Use a number line model to evaluate each expression.
a. (8)(–1) =
-15-14-13-12-11-10-9-8-7-6-5-4-3-2-10123456789101112131415
b. (–4)(–4) =
ManuscriptCopy
-15-16-17-14-13-12-11-10-9-8-7-6-5-4-3-2-101234567891011121314151617
3. Which model for multiplication of integers do you prefer, integer chips or a number line?
Lesson Summary
To multiply integers using integer chips (or algebra tiles), begin by interpreting the multiplication expression. The first factor indicates the number of groups being added or removed, while the second factor indicates the amount in each group being added or removed. To remove groups, zero pairs may need to be added to the model first.
To multiply integers using a number line, start at 0. Similar to the process illustrated with integer chips, moves along the number line can be thought of as adding or subtracting a certain number of groups of a specific size. With signs involved in both factors, it can be helpful to picture a person or an animal moving along the number line (forward or backward) after starting in one direction or the other.
• Positive values are to the right of 0 on a number line, so if the first term in the expression is positive, begin by “facing” right. If the first term is negative, begin by facing left.
• Then, if the second term in the expression is positive, move “forward” in increments the magnitude of the second value. If the second term is negative, move “backward” in increments the magnitude of the second value.
For example, multiplying 3 × (–4) on a number line can be illustrated as shown.
Because the first term in 3 × (–4) is +3, the bunny faces right and hops 3 times. Because the second term is –4, she hops backward in increments of 4. The illustration shows she will end up on –12, so 3 × (–4) = –12.
Notice how the illustration changes to multiply –4 × 3. Because the first term is –4, the bunny faces left and hops 4 times. The second term, 3, has her moving forward in increments of 3.
The previous examples demonstrate the commutative property of multiplication, showing that both 3 × (–4) and –4 × 3 are equal to –12.
A number line can also be used to multiply 2 negative integers. The illustration uses a number line to show (–3)(–4) = 12.
Practice Problems
1. Complete the table. Expression
6 × (–2)
(4)(–1)
–3 × (–2)
–1 ∙ (–6)
Visual Model Using Integer Chips Product
2. Use the pattern of multiplication in the table to complete the rule by drawing the sign of the product as an integer chip.
Visual Model of Multiplication
3. Multiplication is commutative. Complete the rule based on this fact.
ManuscriptCopy
4. Find the value of each expression using your preferred method.
Review Problem
5. Select all expressions that are equivalent to 64.
a. 2 × (–8)
b. –6 ∙ (–3)
c. (–7)(–6)
d. 5(–3)
e. –9 × (–4)
f. 7 ∙ 5
Unit 8, Lesson 10: Dividing Integers Using Integer Chips
Warm-Up: Choose Your Model
1. Find the value of each expression using your preferred model.
ManuscriptCopy
–3 ∙ (–3)
–2 × 4
(8)(–2)
(3)(–8)
Guided Activity: Using Integer Chips to Represent Division
Recall that division is repeated subtraction.
For example, 24 ÷ 8 can be expressed as 24 – 8 – 8 – 8, because 3 groups of 8 can be subtracted from 24.
This shows that 24 is made up of ____ groups of 8.
The expression 24 ÷ 8 can also be interpreted as dividing 24 into 8 equalsized groups. In the representation shown, 24 positive integer chips are divided into 8 equal-sized groups.
The quotient is the result of the division, or the value of the integer chips in each group.
24 ÷ 8 =
1. Complete the table to describe the division. Then, draw the visual model using integer chips, and determine the quotient.
Divide ___ into ___ equal-sized groups. –6 ÷ 2
Divide ___ into ___ equal-sized groups.
When modeling division with integer chips, the divisor must be positive, as this indicates the number of groups needed. When the divisor is negative, the expression can be rewritten using opposites.
For example, 8 –2 can be rewritten as –8 2 because 8 –2 = –8 2 .
2. Complete the table to describe the division. Then, draw the visual model using integer chips, and determine the quotient. Division
9 –3
–12 ÷ (–2)
Divide ___ into ___ equal-sized groups.
Divide ___ into ___ equal-sized groups.
3. Use the pattern of the division in the tables to complete the rules by drawing the sign of the quotient as an integer chip.
ManuscriptCopy
Collaborative Activity: How Are Integer Multiplication and Division Related?
Lottie and Solimar were discussing the relationship between 5 × (–2) = –10 and (–10) ÷ (–2) = 5.
Solimar said, “The multiplication equation can be interpreted as 5 groups of –2, and the division equation can be interpreted as how many groups of –2 are in –10. Isn’t that basically the same thing?”
Lottie replied, “I agree. I also think it is interesting to see how the rules seem to be related. In the multiplication equation, we are multiplying a positive by a negative and the answer is a negative. In the division equation, we do the reverse of the multiplication problem and find that a negative divided by a negative is a positive.”
Solimar said, “Yeah, that’s a cool connection. Do you think the rules are the same for multiplication and division?”
Lottie said, “I think they might be related to each other.”
1. Discuss Solimar and Lottie’s conversation with your partner.
2. Create 2 integer division equations that can be rewritten with the related multiplication equation.
3. Work with your partner to complete the following.
Write the missing factor in each given equation. Then, complete the related division or multiplication equation.
4. Discuss with your partner how the rules for multiplication of integers are related to the rules for division of integers.
5. Consider the expressions shown on your own.
a. Circle the expression that does not belong with the others.
b. Explain why the expression does not belong.
c. Verify your answers with your partner, and if necessary, resolve any differences.
Quotients can have negative signs in different places.
6. The values 12 –2 , –12 2 , and –�12 2 � are equivalent. Explain why they are equivalent using your understanding of dividing integers.
7. Discuss your explanation with your partner. If necessary, edit your explanation based on your discussion.
8. Create 2 equivalent expressions for 21 ÷ (–7).
9. The value of –40 –8 is not equivalent to –�40 8 �. Explain why not.
Lesson Summary
When dividing integers using integer chips, the dividend can be either positive or negative. However, since it is not possible to have a negative number of groups, the divisor must be positive if the number of groups is to be determined. In cases where the divisor is negative, rewrite the expression using opposites. Then, divide the integer chips into the number of groups indicated by the dividend. The value of one group is the quotient.
ManuscriptCopy
Practice Problems
1. Find each quotient.
a. 12 ÷ (–4) = ____ b. –63 –9 = ____
c. –�28 4 � = ____ d. 60 ÷ 5 = ____
e. –� –30 –5 � = ____
2. Create 2 expressions equivalent to –20 10 .
3. What is the value of the expressions created in problem 2?
Review Problem
4. Here is a diagram of an unbalanced hanger.
a. Write an inequality to represent the relationship of the weights. Use �� to represent the weight of the square in grams and �� to represent the weight of the circle in grams (g).

b. One red circle weighs 12 g. Write an inequality to represent the weight of one blue square.
c. Could 0 be a value of ��? Explain your reasoning.
ManuscriptCopy
Unit 8, Lesson 11: Multiplying and Dividing Integers
Warm-Up: Which One Doesn’t Belong?
1. Four number lines modeling addition are shown.
Explain which one doesn’t belong.
ManuscriptCopy
1. Work with your partner to complete the tables.
ManuscriptCopy
2. The table shows 2 different products. Work with your partner to find 5 different factor pairs that, when multiplied, will result in the product. The factors cannot include 1 or –1.
3. Explain which of the products, (–90) or 42, was the easiest to find factor pairs for and why.
4. The table shows 2 different quotients. Work with your partner to find 4 different pairs of dividends and divisors that result in the given quotient when they are divided. The numbers 1 or –1 cannot be used.
5. Explain which of the quotients, (–8) or 13, was the easiest to find dividends and divisors for and why.
Guided Activity: Finding Missing Factors, Products, or Quotients
1. Fill in the missing values to make each equation true.
a. (–7) ∙ ______ = –14
c. –40 8 =
b. ______ ÷ (–5) = 7
d. ______ × (–9) = 63
2. Consider the equation shown. Phillip said –12 is the missing factor, while Alicia claimed it is 12.
∙ (–2) ∙ ? = 24
Explain which student is correct using rules for multiplying integers.
Lesson Summary
The quotients of division problems can be justified using equivalent multiplication problems, and vice versa.
• 6 ÷ 2 = 3 because 2 ⋅ 3 = 6.
• 6 ÷ –2 = –3 because –2 ⋅ –3 = 6.
• 2 ⋅ –3 = –6 because –6 ÷ 2 = –3.
• –2 ⋅ 3 = –6 because –6 ÷ –2 = 3.
The rules for multiplying and dividing signed numbers are the same.
• The sign of a positive number multiplied or divided by a negative number is always negative.
• The sign of a negative number multiplied or divided by a positive number is always negative.
• The sign of a negative number multiplied or divided by a negative number is always positive.
Practice Problems
1. Find each product or quotient.
2. Find each product or quotient.
3. Find each product or quotient.
ManuscriptCopy
Review Problems
4. For each equation, state whether the value of �� is positive or negative.
5. Find the solution mentally.
a. 2 ⋅ �� = 6
b. –2 ⋅ �� = 6
c. 2 ⋅ �� = –6
d. –2 ⋅ �� = –6
a. 3 ⋅ –4 = ��
b. �� ⋅ (–3) = –12
c. –12 ⋅ �� = 12
d. �� ⋅ 24 = –12
Unit 8, Lesson 12: Operations with Integers
Warm-Up: Tell Me Your Sign
1. Use the equation –7�� = –21 to answer the questions that follow without performing any calculations.
a. Explain whether the solution to the equation is positive or negative.
b. Explain whether either of the expressions shown is the value of ��.
ManuscriptCopy
Exploration Activity: Multiplying Multiple Integers
1. Work with your partner to find the product of each expression.
a. 5(–9)
b. (–6)(–4)
c. 0(–3)
d. (–1)(–1)(3) e. 4 ∙ (–2) ∙ (5)
f. (–2)(–2)(–2)(–2)
g. (–1) × (–2) × 3 × (–2) × (–1) × 2
2. In expressions D–G, more than 2 factors are multiplied.
a. Discuss with your partner how the rules you developed previously for multiplying 2 integers could be extended for multiplying more than 2 integers.
b. Write at least 1 rule that would apply when multiplying more than 2 integers.
ManuscriptCopy
Collaborative Activity: Revisiting Order of Operations
The order of operations applies when evaluating expressions with integers in the same way it applies with positive numbers.
1. Evaluate each expression independently. Then, compare your work with a partner’s work. If your answers do not match, work together to come to a consensus on the correct value of each expression.
a. 4(2 – 7) – (–11)
b. 33 + 4(–5)(–2) ÷ 10
c. [–8 + (–2)] × 42
d. (–3) × 23 × (–4) × (–1) + 16
2. Everett incorrectly evaluated 10 + (–2) ∙ 53 ÷ (–25). His work is shown. 10 + (–2) ∙ 53 ÷ (–25) 8 ∙ 53 ÷ (–25) 8 ∙ 125 ÷ (–25)
1,000 ÷ (–25) –40
a. Explain the error(s) in Everett’s work.
b. Correctly evaluate 10 + (–2) ∙ 53 ÷ (–25).
Collaborative Activity: Solving Problems Involving Integers
1. Find each sum, difference, product or quotient.
a. 109 – (–115)
c. (–21)(–16)
b. –215 + (–434)
d. 208 –16
2. A water well drilling rig, digging at a constant rate, has dug to a depth of –72 feet (ft.) after one full day of continuous use.
a. How much does the drill dig in 1 hour (hr.)?
b. What was the depth of the drill after 15 hr.?
c. If the drilling rig has been running constantly and is currently at a depth of –177 ft., for how long has the rig been running?
d. What will the depth of the drill be after 3 full days of continuous use?
Lesson Summary
When evaluating expressions with integers, care should be taken to apply the integer rules learned in this unit. This can include applying the order of operations to evaluate an expression involving integer operations.
The order of operations starts with evaluating expressions in grouping symbols. Then, simplify terms with exponents. Next, perform multiplication and division in the order in which they appear, reading from left to right. Finally, perform addition and subtraction in the order in which they appear, reading from left to right.
Practice Problems
1. Evaluate [63 + (–5 ∙ 9)]–72.
2. Find each sum or difference.
a. 235 + (–542)
ManuscriptCopy
–73 – (–21)
b. –309 + (–312)
c.
d. –691 – 293
3. Find each product or quotient.
a. 96 ÷ (–6)
b. (–51) × (–31)
c. –175 –5
d. (–17) ∙ 704 ∙ (–1)
4. Nathan mows lawns during his summer break to save money before the next school year. He has some expenses, debts he is paying off, and additional earnings during this 12-week period of time. All of his earnings and expenses are listed.
• He earns $75 every week from mowing lawns.
• He spends an average of $18 per week on gas for his lawn mower.
• He gives his parents $20 per week to pay them back for his new game console.
• He earns $15 per week in allowance for completing all his household chores.
a. Select all of the expressions that can be used to find the amount of money Nathan will have saved by the end of the summer.
□ 12(75 + 15 – 18–20)
□ 12(75 + 15) + (–18 – 20)
□ 12(75 + 15) + 12(–18 + 20)
□ 12 × 75 + (–18) + (–20) + 15
ManuscriptCopy
□ 12(75) + 12(15) + 12(–18) + 12(–20)
b. How much money will Nathan have saved by the end of the summer?
Review Problems
5. Noah said, “When you divide a number by a second number, the result will always be smaller than the first number.”
Jada said, “I think the result could be larger or smaller, depending on the numbers.”
Do you agree with Noah or Jada? Show or explain your reasoning.
6. Find each unknown number.
a. 12 is 150% of what number?
b. 5 is 50% of what number?
c. 10% of what number is 300?
d. 5% of what number is 72?
e. 20 is 80% of what number?
ManuscriptCopy
ManuscriptCopy
ManuscriptCopy
Unit 9, Lesson 1: Revisiting Dot Plots
Warm-Up: Pizza Toppings
Customers in a pizza shop were asked, “How many toppings did you add to your cheese pizza?” Their responses are shown in the table.
Number of Toppings
1. Complete the table to represent the frequency of each response.
2. How many customers were surveyed?
3. What do you notice about the number of toppings that this group of customers ordered? Write 2–3 sentences summarizing your observations.
Collaborative Activity: Creating and Interpreting a Dot Plot
1. Athletes often track their resting heart rate, expressed in beats per minute (BPM). The students on a local middle school track team recorded their resting heart rates to create the data set shown.
84, 82, 84, 83, 82, 86, 83, 83, 85, 85, 81, 84, 88, 86, 85, 83, 80, 84, 85, 87
a. Complete the statements.
The lower extreme of the data set is ______, and the upper extreme is ______. Therefore, the horizontal axis of the dot plot should be numbered from _____ to _____, with a value marked at every _____ unit along the line.
b. Label the scale of the number line based on your answer to part A.
c. Discuss with your partner what values they used to label the horizontal axis in part B. Make adjustments, if necessary.
d. Title the number line to indicate what the values represent.
e. Plot the data values to create the dot plot.
ManuscriptCopy
2. A dot plot is shown.
a. Which of the following scenarios do you think is shown in this dot plot?
Points scored by your favorite team in their last 10 games
Length of your 10 favorite movies, in minutes
Ages of your 10 favorite music artists
Weight, in pounds (lb.), of 10 pets at a park today
b. Discuss with your partner why you selected the scenario you chose in part A. Summarize your discussion.
ManuscriptCopy
Exploration Activity: Homework Time
The dot plot shows the number of hours (hr.) per week that a sample of 6th-grade students reported spending on homework. Time Spent on Homework per Week (hr.)
Use the dot plot to answer the following questions. For each, show or explain your reasoning.
1. What is the sample size of the data represented?
2. What percentage of the students reported spending 1 hr. on homework each week?
3. What percentage of the students reported spending 4 hr. or less on homework each week?
4. Would 6 hr. per week be a good description of the number of hours that this group of students spends on homework per week? What about 1 hr. per week? Explain your reasoning.
ManuscriptCopy
5. What value do you think would be a good description of the time that the students in this group spend on homework? Explain your reasoning.
6. Someone said, “In general, these students spend roughly the same number of hours doing homework.” Do you agree? Explain your reasoning.
Lesson Summary
Data is often collected and analyzed because of an interest in learning what is “typical,” or what is common and can be expected in a group.
Sometimes it’s easy to tell what a typical member of the group is. For example, it’s easy to see that a typical shape in this set is a large circle.


However, just looking at the members of a group doesn’t always reveal what is typical. For example, it isn’t so easy to determine the typical side length of squares in this set just by studying the set visually.
In a situation like this, it is helpful to gather the side lengths of the squares in the sample and look at their distribution.
A sample is a subset of a population.
The distribution of side lengths in the sample of squares is shown in the dot plot.
The dot plot shows that many of the data points are between 2 and 4, so it could be concluded that side lengths between 2 centimeters (cm) and 4 cm or close to these lengths are typical of squares in this set.
ManuscriptCopy
In addition to considering the distribution of a sample, it can also be helpful to consider the sample size. The sample size is the number of observations or individuals included in a study or experiment. For the squares in the sample represented by the dot plot, the sample size is 18 squares.
Side Lengths (cm)
Practice Problems
1. Tyler asked 10 students at his school how much time in minutes it takes them to get from home to school. Determine if each of these dot plots could represent the data Tyler collected. Explain your reasoning for each dot plot.
2. A teacher drew a line segment that was 20 inches (in.) long on the blackboard. She asked each of her students to estimate the length of the segment and used their estimates to draw this dot plot.
18 17
Length (in.) 16
a. How many students were in the class?
b. Were students generally accurate in their estimates of the length of the line? Explain your reasoning.
Review Problems
3. Order these numbers from least to greatest.
4. Find the area of each triangle.

ManuscriptCopy
ManuscriptCopy
Unit 9, Lesson 2: Interpreting Data Representing a Sample
Warm-Up: Packs on Backs
The dot plot shows the weights of backpacks, in kilograms (kg), belonging to 6th-grade students at a school in New Zealand.


1. What sample size is represented by the dot plot?
2. The dot plot shows several dots at 0 kg. What could a value of 0 mean in this context?
3. Clare and Tyler studied the dot plot.
Clare said, “I think we can use 3 kg to describe a typical backpack weight of the group because it represents 20% (or the largest portion) of the data.”
Tyler disagreed and said, “I think 3 kg is too low to describe a typical weight. Half of the dots are for backpacks that are heavier than 3 kg, so I would use a larger value.”
Explain whether you agree with either of them.
Exploration Activity: On the Phone
A sample of 6th-grade students were asked to estimate how many hours a week they spend talking on the phone. The dot plot represents their reported answers.


1. What is the sample size represented by the dot plot?
2. Use the data display to answer the following.
a. How many of the students reported not talking on the phone during the week? Explain how you know.
b. What percentage of the students reported not talking on the phone?
3. Consider the upper extreme of the data set.
a. What is the greatest number of hours a student spends talking on the phone per week?
b. What percentage of the group reported talking on the phone for this amount of time?
4. Consider the distribution of the data displayed.
a. How would you describe the spread of the data? Include in your explanation whether you consider these students’ amounts of time on the phone to be alike or different.
b. The dot plot shows the number of hours per week that the same group of 6th-grade students reported spending on homework.

Overall, explain whether these students are more alike in the amount of time they spend talking on the phone or in the amount of time they spend on homework.
5. Suppose someone claimed that these 6th-grade students spend too much time on the phone. Use your analysis of the dot plot to explain whether you agree or disagree.
ManuscriptCopy
Collaborative Activity: Click-Clack
A keyboarding teacher recorded the number of words that her students could type per minute (min.) at the beginning of a course and again at the end of the course. The 2 dot plots show the 2 data sets.


1. Based on the dot plots, do you agree with each of the following statements about this group of students? Be prepared to explain your reasoning.
a. Overall, the students’ typing speeds did not improve. They typed at the same speeds at the end of the course as they did at the beginning.
Agree
Disagree
b. A good estimate for how fast the students typed at the beginning of the course, in general, is 20 words per min.
Agree
Disagree
c. A good description of the center of the data set at the end of the course is 20 words per min.
Agree Disagree
d. There was more spread in the typing speeds at the beginning of the course than at the end, so the students’ typing speeds were more alike at the end.
Agree Disagree
2. Overall, how fast would you say the students typed after completing the course? Include what you consider the center of the end-of-course data to explain your reasoning.
Guided Activity: Describing Data Sets Using Center and Spread
The high temperature in 2 cities, in degrees Fahrenheit (℉), was recorded each day for 10 days. The dot plots show the 2 data sets.
4045505560657075808590 daily high temperature (°F) for city A
4045505560657075808590 daily high temperature (°F) for city B
1. Discuss with your partner what you notice about the data sets.
2. Describe the center and spread of the high temperature data for city A.
Center: Spread:
3. Describe the center and spread of the high temperature data for city B.
Center: Spread:
Lesson Summary
The sample size of a data set is the number of observations, or data values, in the set. To describe what is typical or characteristic for a data set, consider the center and spread of its distribution.
The center of a set of numerical data is a value in the middle of the distribution. It represents a typical value for the data set.
The spread of a set of numerical data tells how far apart the values are.
Two dot plots of cat weights and dog weights, in kilograms (kg), are shown.


A comparison of the dot plots shows that the collection of points for the cat data is farther to the left on the number line than the dog data. Based on the dot plots, the center of the distribution for cat weights is between 4 kg and 5 kg, and the center for dog weights is between 7 kg and 8 kg.
Values at or near the center of a distribution are considered typical for that group. This means that a weight of 4–5 kg is typical for a cat in the data set, and a weight of 7–8 kg is typical for a dog.
The dot plots also show that the dog weights are more spread out than the cat weights. The difference between the heaviest and lightest cats is only 4 kg, but the difference between the heaviest and lightest dogs is 6 kg.
A distribution with greater spread means the data has greater variability. In this case, the cats are more similar in their weights than the dogs. Future lessons will focus on how to measure the center and spread of a distribution.
Practice Problems
1. Three sets of data about ten sixth-grade students were used to make three dot plots. The person who made the dot plots forgot to label them. Match each dot plot with the appropriate label.
• Ages in years _____
• Numbers of hours of sleep on nights before school days _____
• Numbers of hours of sleep on nights before non-school days


2. The dot plots show the time it takes to get to school for ten sixth-grade students from the United States, Canada, Australia, New Zealand, and South Africa.
a. List the countries in order of typical travel times, from shortest to longest.
b. List the countries in order of variability in travel times, from the least variability to the greatest.


3. Twenty-five students were asked to rate, on a scale of 0 to 10, how important it is to reduce pollution. A rating of 0 means “not at all important” and a rating of 10 means “very important.” Shown is a dot plot of their responses.

Explain why a rating of 6 is not a good description of the center of this data set.
Review Problem
4. Tyler wants to buy some cherries at the farmers’ market. He has $10, and cherries cost $4 per pound (lb.).
a. If �� is the number of lb. of cherries that Tyler can buy, write 1 or more inequalities or equations describing ��.
b. Explain which of these values are reasonable solutions, if any: –1 , 2, 3.
c. If �� is the amount of money, in dollars, that Tyler can spend, write 1 or more inequalities or equations describing ��.
d. Explain which of these values are reasonable solutions, if any: 2, 8, 10.5.
Unit 9, Lesson 3: The Median and Mode of a Data Set
Warm-Up: Data Set Matchup
1. Three dot plots and data set descriptions are shown. Match each dot plot with the description that seems most appropriate based on the distribution.
Dot Plot
Set A
5 6 7 8 9 10 11 12
Set B
Data Set Description
Ages of students in 6th grade
Number of hours of sleep on a school night
Number of hours of sleep on a weekend night
Ages of students in 6th grade
Number of hours of sleep on a school night
Number of hours of sleep on a weekend night
C
2. Explain your strategy to answer problem 1.
Ages of students in 6th grade
Number of hours of sleep on a school night
Number of hours of sleep on a weekend night
Exploration Activity: Sibling in the House
The table shows the numbers of siblings of 10 students in Tyler’s class.
Number of Siblings
The data is also represented on the dot plot shown.
Number of Siblings for Students in Tyler’s Class
1. Without making calculations, estimate the center of the data, based on the dot plot. This should be the typical number of siblings for these 6th-grade students. Mark the location of that number on the dot plot.
2. The term mode is defined in the Lesson Summary. Determine the mode of this data set. Show or explain your reasoning.
3. Explain how the mode compares to the value that you marked on the dot plot as the typical number of siblings.
4. Do you think the mode summarizes this data set well? Explain your reasoning.
Guided Activity: Median and Mode
The table shows the number of pets for 11 students in Jose’s class.
Number of Pets
1. Complete the statements to describe the steps to find the median.
List the values in the data set in order from ______________ to ______________. Then, determine the _______________ value.
2. What is the median number of pets for the 11 students in Jose’s class?
3. What is the mode of the data set?
4. Interpret what the mode of the data set means in context.
5. Compare the median and mode of the data set. Explain which measure better describes the data.
6. Suppose one of the students who said they had 2 pets was removed from the data set.
a. Show how to determine the median of the new data set.
b. Explain whether the mode for the data set would change.
Collaborative Activity: Finding the Middle
1. The data set on numbers of siblings from the Exploration Activity is shown.
Number of Siblings
a. Order the data values from least to greatest, and then find the median.
b. In this situation, explain whether you think the median is a good measure of the typical number of siblings for this group.
2. The dot plot shows the travel time, in minutes (min.), of Elena’s bus rides to school.

a. Find the median travel time. Show or explain your reasoning.
b. Interpret the median in this context.
ManuscriptCopy
Lesson Summary
Two specific measures of center were explored in this lesson: median and mode.
The median is the middle of an ordered list of values.
Half of the values in a data set are less than or equal to the median, and half of the values are greater than or equal to the median. To find the median, order the data values from least to greatest, and find the number in the middle.
• Suppose there are 5 dogs whose weights, in pounds (lb.), are as shown in the table. The median weight for this group of dogs is 32 lb. because 3 dogs’ weights are less than or equal to 32 lb. and 3 dogs’ weights are greater than or equal to 32 lb.
• Now, suppose there are 6 cats whose weights, in lb., are as shown in the table. Notice that there are 2 values in the middle: 7 and 8.
The median weight must be between 7 and 8 lb. because half of the cats’ weights are less or equal to 7 lb. and half of the cats’ weights are greater than or equal to 8 lb. With an even number of values in a data set, the median is the number exactly halfway between the 2 middle values. In this case, the median cat weight is 7.5 lb. because (7 + 8) ÷ 2 = 7.5. The mode is the value found most often in a set of numbers.
In a set of data, there may be no mode, one mode, or more than one mode.
• In the dog weights data, there is no mode because every data value occurs only once.
ManuscriptCopy
• In the cat weights data, the value 10 occurs twice, whereas all other values occur only once in the data set. Therefore, the mode of the cat weights is 10 lb.
• If another cat weighing 6 lb. were added to the cat weights data, there would be 2 modes, 6 lb. and 10 lb., both of which would occur twice.
Practice Problems
1. Here is data that shows a student’s scores for 10 rounds of a video game.
What is the median score?
A. 125
B. 145
C. 147
D. 150
2. When he sorts the class’s scores on the last test, the teacher notices that exactly 12 students scored better than Clare and exactly 12 students scored worse than Clare. Does this mean that Clare’s score on the test is the median? Explain your reasoning.
3. The medians of the following dot plots are 6, 12, 13, and 15, but not in that order. Match each dot plot with its median.
ManuscriptCopy

4. Invent a data set with 5 numbers that has a mode of 10 and a median of 12.
5. Ten 6th-grade students reported the hours (hr.) of sleep they get on nights before a school day. Their responses are recorded in the dot plot.

Looking at the dot plot, Laurie stated that the median is 7 hr., Noah stated that it is 7.5 hr., and Diego stated that it is 8 hr.
Explain which student is correct.
Review Problem
6. Which expressions represent the total area of the large rectangle? Select all that apply.
ManuscriptCopy

Unit 9, Lesson 4: Describing the Shape of a Data Set
Warm-Up: Notice and Wonder
Three dot plots are shown.
Dot Plot A
012345678910
Dot Plot B
012345678910
Dot Plot C 012345678910
1. What do you notice about the dot plots?
2. What do you wonder?
Guided Activity: Describing Distributions of Data
1. Consider the dot plot from a previous lesson showing Elena’s travel time to school, in minutes (min.).
5678910 11 12131415 Travel Time (min.)
a. Sketch an approximate line of symmetry for the dot plot, such that each side is as close to a mirror image of the other side as possible.
b. If the dot plot were folded along the line you drew, would each half line up perfectly with the other?
This data distribution is described as approximately symmetric.
2. The dot plot displays the results of a survey where middle school students were asked how many hours they spent talking on the phone per week.
Discuss with your partner what you notice about the shape of the distribution of hours spent talking on the phone.
Hours Spent on the Phone per Week
This distribution is said to be skewed to the right () because, while most of the data is clustered to the left in a peak, there is a tail of data to the right.
A distribution is said to be skewed to the left () when a tail of data is to the left of where the majority of data is clustered.
3. A dot plot is shown for the survey results of 25 students asked to rate the importance of reducing pollution.
Complete the statement.
The data distribution on the importance of reducing pollution is skewed left. right.
When describing data distributions, it’s important to consider features such as symmetry, peaks, and outliers, in addition to the shape of the distribution.
4. Two dot plots with different shapes and features are shown.
Complete the statements.
910 11 1214131615171820192122
Dot Plot D
910 11 1214131615171820192122
Dot Plot E
a. The distribution of dot plot D is symmetrical not symmetrical and has a mode of _____.
b. The distribution of dot plot E is symmetrical not symmetrical and has 1 mode. more than 1 mode.
ManuscriptCopy
c. If a data value of 10 12 22 were added to the data displayed on dot plot D, it would be considered an outlier.
Collaborative Activity: Describing Distributions
Work with your partner to complete the following.
5. Describe the shape of each distribution shown in the table.
Data Distribution
Description of the Shape 0 1 2 3 4 5 6 7 8 9 10 Hours Spent on Homework per Week
Skewed left
Skewed right
Approximately symmetric
40455055606570758085
Skewed left Skewed right
Approximately symmetric
Skewed left Skewed right
Approximately symmetric
Skewed left
Skewed right
Approximately symmetric
6. Which data distribution(s), if any, appear(s) to have at least 1 outlier?
7. Dot plot F is shown.
Cordell stated that dot plot F has a symmetric distribution. Gianna stated that dot plot F has a uniform distribution.
Explain whether you agree with Cordell and/or Gianna.
4. Sketch a dot plot with a bimodal distribution that is symmetrical.
ManuscriptCopy
Lesson Summary
The shape of data distributions can be described as symmetric, skewed, bimodal, or uniform.
The dot plot shows a data set with a symmetric distribution.
In a symmetric distribution, there is a vertical line of symmetry in the center of the data display. Symmetric distributions can have what is called a bell-shaped distribution, like this example shows, but any distribution where a line of symmetry can be approximated is described as symmetric. It is rare that data distributions are perfectly symmetric, so a distribution described as symmetric is often only approximately symmetric.
A data distribution that can be described as skewed is shown.


In a skewed distribution, one side of the distribution has more values farther from the bulk of the data than the other side. In this example, the data is skewed to the right because most of the data is in the 8–10 interval, but there are some points to the right of the majority of the data. In a data set that is skewed to the left, a similar effect happens but to the other side.
A uniform distribution has data values that are evenly distributed throughout the range of the data. This causes the distribution to look like a rectangle, as shown, where the number of times that each outcome in the data set occurs is the same. A uniform distribution can also be described as symmetric.
A bimodal distribution has 2 frequently occurring data values, or modes, as shown.

Sometimes, a bimodal distribution has most of the data clustered in 2 parts of the distribution. In these cases, the center of the distribution does not describe the data very well. Bimodal distributions are not always symmetric. For example, the peaks may not be equally spaced from the middle of the distribution, or other data values may disrupt the symmetry. The example shown, however, can be described as an approximately symmetric bimodal distribution.
When describing data distributions, it is also important to consider any potential outliers and clusters that could impact what is considered typical of the data set.
An outlier is a value that is much higher or much lower than the other values in a set of data.
A cluster describes data values that are in a close group and are similar to each other. For example, in the data distribution shown, there is a cluster of data between 40 and 45 points. There also appears to be an outlier of about 87 points.
Practice Problems

1. Complete the table by selecting the best description of the shape of each dot plot.
Skewed left
Skewed right
Approximately symmetric
ManuscriptCopy
Skewed left
Skewed right
Approximately symmetric
Skewed left
Skewed right
Approximately symmetric
2. During practice, a swim team recorded the time, in seconds (sec.), that it took each swimmer to complete a 50-meter (m) freestyle race. The times are shown.
28, 29, 30, 31, 32, 29, 31, 32, 28, 29, 33, 31, 40, 30, 33, 27, 27, 28, 29
Explain whether there are any outliers in the data.
3. In a survey conducted at an international airport, 50 people reported the duration of the last flight they took, to the nearest half-hour. The dot plot shown represents the data.
00.511.522.533.544.555.566.577.588.599.51010.5 11 11.51212.513 Flight Duration (hr.)
a. Describe the shape of the distribution.
b. Determine the median.
c. Determine the mode(s).
d. Explain whether the median or the mode(s) better describe(s) the data set.
ManuscriptCopy
Review Problems
4. Students were surveyed about the number of times they ordered pizza in a month. The data is shown in the table.
Number of Times Ordering Pizza
Determine the median and mode of the data.
Median:
Mode:
5. Commuters were surveyed about the time, in min., that it takes them to travel to work by car. The data is shown.
5, 8, 39, 22, 18, 35, 51, 65, 38, 27, 33, 29, 42, 60
a. How many commuters were surveyed?
ManuscriptCopy
b. Using the spread of the data, explain whether the commuters generally live close to their place of work.
ManuscriptCopy
Unit 9, Lesson 5: Quartiles and Interquartile Range
Warm-Up: Two Parties
Two dot plots representing the ages of partygoers at two different parties are shown.
data set A
51015202530354045
data set B age in years
51015202530354045
1. What do you notice and wonder about the distribution of data set A?
2. What do you notice and wonder about the distribution of data set B?
ManuscriptCopy
Guided Activity: The Five-Number Summary
The ages of a group of 20 partygoers from data set B in the Warm-Up are shown in order from least to greatest.
Ages of Partygoers
7 8 9 10 10 11 12 15 16 20 20 22 23 24 28 30 33 35 38 42
1. Use the data to complete the following.
a. Locate the median of the data set in the table, and label it “50th percentile.” This splits the data into an upper half and a lower half.
b. Locate the middle value of the lower half of the data in the table, without including the median. Label this value “25th percentile.”
c. Locate the middle value of the upper half of the data in the table, without including the median. Label this value “75th percentile.”
2. The data set is now split into 4 pieces. Each of the 3 values that “cut” the data is called a quartile.
a. The first, or lower, quartile is the 25th percentile mark. Write “Q1” next to “25th percentile.”
b. The second quartile is the median. Write “Q2” next to that label.
c. The third, or upper, quartile is the 75th percentile mark. Write “Q3” next to that label.
3. Label the least value in the set “lower extreme” and the greatest value “upper extreme.”
4. The values you have identified make up the five-number summary of the data. Record the values.
Lower extreme: _____ Q1: _____ Q2: _____ Q3: _____ Upper extreme: _____
5. The median, or Q2, value of the data set is 20. This indicates that half of the partygoers are 20 or younger and the other half are 20 or older. Intepret the meaning of each value in terms of the ages of the partygoers in this data set.
a. The third quartile
b. The lower extreme
c. The upper extreme
Collaborative Activity: Range and Interquartile Range
1. Revisit the following dot plot that shows the duration, in minutes (min.), of Elena’s bus rides to school over the course of 12 days.

Write the five-number summary for this data set. Show your reasoning.
2. The range is one way to describe the spread of values in a data set. It is the difference between the upper extreme and lower extreme. What is the range of Elena’s travel time?
ManuscriptCopy
3. Another way to describe the spread of values in a data set is the interquartile range (IQR). It is the difference between the upper quartile and the lower quartile.
a. What is the IQR of Elena’s travel times?
b. What fraction of the data values are between the lower and upper quartiles?
4. Two more dot plots are shown.
Predict the answer to each of the following questions without doing any calculations.
a. Which data set has an IQR of 2.5? Explain your reasoning.

b. Which data set has a range of 15? Explain your reasoning.
5. Check your predictions by calculating the IQR and range for the data in each dot plot.
ManuscriptCopy
Lesson Summary
When the typical value of a data set is described using the median, the interquartile range is used to describe the spread of the data.
The interquartile range(IQR) is the distance between the first and third quartiles of the data set.
Finding the IQR involves partitioning the data set into fourths. Each of the 3 values that cut the data into fourths is called a quartile.
For a data set with median M, the first quartile is the median of the data values less than M and the third quartile is the median of the data values greater than M. The second quartile is the median M.
A set of data with 11 values ordered from least to greatest is shown.
• The median (Q2) is 33.
• The first quartile (Q1), the median of the numbers less than 33, is 20.
• The third quartile (Q3), the median of the numbers greater than 33, is 40.
The difference between the upper extreme and lower extreme of a data set is the range.
The range is the distance between the highest data value and the lowest data value.
The difference between Q1 and Q3 is the interquartile range (IQR). Because the distance between Q1 and Q3 includes the middle two-fourths of the distribution, the values between those quartiles are sometimes called the “middle half of the data.”
The bigger the IQR, the more spread out the middle half of the data is. The smaller the IQR, the closer the middle half of the data is to the median. The IQR is considered a measure of spread for this reason.
The range of a data set is heavily affected by any outliers, since these values lie at the extremes of a data set. However, the IQR is much less affected by outliers, since it measures the middle of the data set. This often makes the IQR the preferred measure of spread when outliers exist.
A five-number summary, which includes the lower extreme, Q1, Q2, Q3, and upper extreme, can be used to summarize a data distribution.
The five-number summary in the example shown includes 12, 20, 33, 40, and 49. Their locations are marked with diamonds in the dot plot.
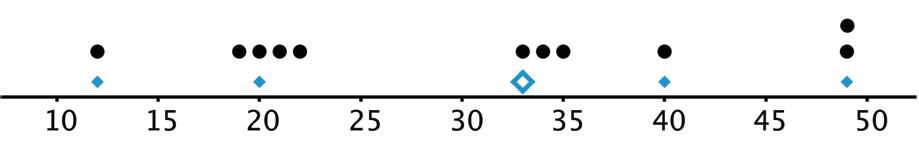
Different data sets could have the same five-number summary. For instance, the following data has the same upper extreme, lower extreme, and quartiles as the previous data set.

Practice Problems
1. Suppose that there are 20 numbers in a data set that are all different.
a. How many of the values in this data set are between the first quartile and the third quartile?
b. How many of the values in this data set are between the first quartile and the median?
2. Percy played 10 games of bowling and recorded his scores. Percy calculated his median score at 118, his IQR at 30, and the first quartile (Q1) at 103.
What was the value of Q3?
3. In a word game, 1 letter is worth 1 point. This dot plot shows the scores for 20 common words.

a. What is the median score?
b. What is the first quartile (Q1)?
c. What is the third quartile (Q3)?
d. What is the interquartile range (IQR)?
4. Here are 5 dot plots that show the amounts of time that 10 sixth-grade students in 5 countries took to get to school. Match each dot plot with the appropriate median and IQR.
a. Median: 17.5, IQR: 11
b. Median: 15, IQR: 30
c. Median: 8, IQR: 4
d. Median: 7, IQR: 10
e. Median: 12.5, IQR: 8
ManuscriptCopy


Review Problems
5. Draw and label an appropriate pair of axes, and plot the points. �� = (10, 50), �� = (30, 25), �� = (0, 30), �� = (20, 35)
ManuscriptCopy
6. There are 20 pennies in a jar. If 16% of the coins in the jar are pennies, how many coins are there in the jar?
Unit 9, Lesson 6: Box Plots
Warm-Up: Puppy Weight
Here are the birth weights, in ounces (oz.), of all the puppies born at a kennel in the past month.
What do you notice and wonder about the distribution of the puppy weights?
Collaborative Activity: Human Box Plot
Your teacher will give you the data on the lengths of names of students in your class. Write the five-number summary by finding the data set’s lower extreme, Q1, Q2, Q3, and the upper extreme.
Pause for additional instructions from your teacher.
Exploration Activity: Studying Blinks
Twenty people participated in a study about blinking. The number of times each person blinked while watching a video for 1 minute (min.) was recorded. The data values are shown in the table, in order from smallest to largest. 3 6 8 11 11 13 14 14 14 14
1. Use the data set to complete the following.
a. Use the grid and axis to create a dot plot of this data set.


b. Find the median (Q2), and mark its location on the dot plot.
c. Find the first quartile (Q1), and the third quartile (Q3). Mark their locations on the dot plot.
d. What are the lower extreme and upper extreme?
2. A box plot can be used to represent the five-number summary graphically. Complete the following to create a box plot for the data on the grid above the dot plot.
a. Draw a box that extends from the first quartile (Q1), to the third quartile (Q3). Label the quartiles.
b. At the median (Q2), draw a vertical line from the top of the box to the bottom of the box. Label the median.
c. From the left side of the box (Q1), draw a horizontal line that extends to the lower extreme of the data set. On the right side of the box (Q3), draw a similar line that extends to the upper extreme of the data set.
3. You have now created a box plot to represent the data. What fraction of the data values are represented by each of these elements of the box plot?
a. The line to the left of the box
b. The box
c. The line to the right of the box
ManuscriptCopy
Lesson Summary
A box plot represents the five-number summary of a data set.
• It shows the first quartile (Q1) and the third quartile (Q3) as the left and right sides of a rectangle or box.
• The median (Q2) is shown as a vertical segment inside the box.
• On the left side, a horizontal line segment extends from Q1 to the lower extreme.
• On the right, a line segment extends from Q3 to the upper extreme.
The rectangle in the middle represents the middle half of the data. Its width is the IQR. The line segments represent the bottom quarter and top quarter of the data set.
Dot plots representing the weights of pugs and beagles, in kilograms (kg), are shown. The box plots for these data sets are shown above the corresponding dot plots.

The box plots show the five-number summary for each data set.
Practice Problems
1. Each student in a class recorded how many books they read during the summer. Here is a box plot that summarizes their data.

a. What is the greatest number of books read by a student in this group?
b. What is the median number of books read by the students?
c. What is the interquartile range (IQR)?
2. Use this five-number summary to draw a box plot. All values are in seconds (sec.).
• Minimum: 40
• First quartile (Q1): 45
• Median: 48
• Third quartile (Q3): 50
• Maximum: 60
ManuscriptCopy
3. The data shows the number of hours per week that each of 13 seventh-grade students spent doing homework. Create a box plot to summarize the data.
4. The box plot displays the data on the response times of 100 mice to seeing a flash of light. How many mice are represented by the rectangle between 0.5 and 1 sec.?

Review Problem
5. Find the quotients.
Unit 9, Lesson 7: Using Data Displays to Solve Problems
Warm-Up: Hours of Slumber
Ten 6th-grade students were asked how much sleep, in hours (hr.), they usually get on a school night. The five-number summary of their responses is shown.
• Lower extreme: 5 hr.
• First quartile: 7 hr.
• Median: 7.5 hr.
• Third quartile: 8 hr.
• Upper extreme: 9 hr.
1. On the grid, draw a box plot using the five-number summary.

2. What questions could be answered by looking at this box plot?
Exploration Activity: Revisiting the Shape of a Data Set
Recall from an earlier lesson how displaying data in a graph more readily reveals the shape and features of the distribution of a data set.
The dot plot shows the list of Peyton Manning’s pass completion percentages, to the nearest whole percentage, from 1998 to 2015.
66656463626160 5958 575655
Percent Pass Completion
1. Describe the shape of the of the distribution.
The box plot shows the same data.
66656463626160 5958 575655
Percent Pass Completion
67686970
67686970
ManuscriptCopy
2. With your partner, discuss how the box plot reveals the same information about the shape of the distribution. Summarize your discussion.
3. Complete the table by selecting which measures of center and spread can be determined from each display.
Dot Plot Box Plot
4. Explain which display you would prefer for finding each of the measures from the table in question 3.
5. Describe the shape of each distribution shown in the table.
ManuscriptCopy
Skewed left
Skewed right
Approximately symmetric
Skewed left
Skewed right
Approximately symmetric
Skewed left
Skewed right
Approximately symmetric
Skewed left
Skewed right
Approximately symmetric
Collaborative Activity: Leading Scorers
1. A dot plot and a box plot are shown for the number of goals scored by the top 12 goal scorers during the 2023–2024 NCAA Division 1 Women’s Soccer season.
23222120191817 1615 141312
2425262728
Number of Goals
23222120191817 1615 141312
2425262728
Number of Goals
a. Using the data displays, explain whether the data appears to contain any outliers.
b. Describe the shape of the data distribution.
Complete the statements.
c. The dot plot box plot dot plot and box plot can be used to determine the mode.
d. The dot plot box plot dot plot and box plot can be used to determine the median.
e. Suppose there was an error in the reported data, and one of the women recorded as scoring 16 goals had actually scored 14 goals for the season. Explain how the mode and median would change.
Collaborative Activity: Info Gap: Sea Turtles
Your teacher will give you either a Problem Card or a Data Card about sea turtles that nest on the Outer Banks of North Carolina. Do not show or read your card to your partner.

If your teacher gives you the problem card:
1. Silently read your card, and think about what information you need to be able to answer the question.
2. Ask your partner for the specific information that you need.
3. Explain to your partner how you are using the information to solve the problem.
4. Solve the problem card, and solve the problem independently.
If your teacher gives you the data card:
1. Silently read your card.
2. Ask your partner, “What specific information do you need?” Wait for your partner to ask for information. Only give information that is on your card. (Do not figure out anything for your partner!)
3. Before sharing the information, ask, “Why do you need that information?” Listen to your partner’s reasoning and ask clarifying questions.
4. Read the problem card and solve the problem independently.
Pause here so your teacher can review your work. Ask your teacher for a new set of cards and repeat the activity, trading roles with your partner.
Lesson Summary
Similar to dot plots, data represented by box plots reveals the shape of the distribution. Box plots can be used to determine if a distribution is approximately symmetric, skewed to the left, or skewed to the right.
• On a box plot, look for a long line segment on either side of the box plot to determine which direction the data is skewed. This indicates there is a smaller number of data values on the extreme ends of the data, away from the majority of the data.
• If there is a long line segment on the left, the data is skewed left.
• If there is a long line segment on the right, the data is skewed right.
• In a symmetric distribution, a box plot will show the median in the center (or approximately the center) of the box, and the line segments on either side will be exactly or roughly the same length.
Whether a distribution is bimodal or uniform cannot be determined easily from a box plot.
• A uniform distribution will appear to be symmetric on a box plot, but whether or not each value in the distribution has the same number of data points cannot be determined from this display.
• A bimodal distribution could appear to be either symmetric or skewed, depending on the values.
Different types of data displays can serve different purposes in representing data. A box plot and a dot plot are shown that represent the distribution of the weights, in grams (g), of some berries.
The box plot more readily reveals the median and the IQR of the berry data, but the dot plot shows the individual data points and the mode, neither of which can be determined from a box plot.
ManuscriptCopy

Practice Problems
1. A movie critic recorded the length, in minutes (min.), of a sample of animated films and then made a dot plot and box plot of the data, as shown.
a. Describe the shape of the data distribution.
b. Which display can be used to determine the range?
c. What is the IQR of the data?
ManuscriptCopy
d. Explain how adding another film that is 70 min. long would affect the shape of the distribution.
2. Pineapples were packed into 3 large crates. For each crate, the weight of every pineapple in the crate was recorded, in pounds (lb.). Box plots that summarize the weights of the pineapples in each crate are shown.
Select all of the statements that are true.

□ All the pineapples in crate 2 are between 0.5 lb. and 3.5 lb.
□ Crate 1 has a pineapple with a weight of approximately 1 lb.
□ Crate 1 has a pineapple with a weight of approximately 6 lb.
□ Crate 1 has an IQR of approximately 3 lb. and a range of approximately 4.5 lb.
□ More than half of the pineapples in crate 1 and crate 3 are heavier than 4 lb.
□ Crate 3 has a median weight of approximately 4 lb. and an IQR of approximately 3 lb.
Review Problem
3. A farmer recorded the total number of eggs that each of her 53 hens laid during the week. A box plot representing the data set is shown.
Number of Eggs Laid
Complete the statements based on the box plot.
a. The range of eggs laid by a hen during the week was ______.
b. The median number of eggs laid by a hen during the week was ______.
c. The IQR for the number of eggs laid by a hen during the week was _____.
ManuscriptCopy
d. The percentage of hens that laid 3 eggs or fewer during the week was _____.
e. The percentage of hens that laid 6 or more eggs during the week was _____.
ManuscriptCopy
Unit 10, Lesson 1: Chance Experiments
Warm-Up: Which Is More Likely?
Which is more likely to happen?
1. When reaching into a dark closet and pulling out one shoe from a pile of 20 pairs of shoes, you pull out a left shoe.
2. When listening to a playlist—which has 5 songs on it—in shuffle mode, the first song on the playlist plays first.
ManuscriptCopy
Exploration Activity: How Likely Is It?
1. Complete the table by describing the likelihood of each event as impossible, unlikely, equally probable, likely, or certain.
Event
a. You will win the grand prize in a raffle if you purchase 2 out of the 100 tickets.
b. You will wait less than 10 minutes before ordering at a fast food restaurant.
c. You will get an even number when you roll a standard six-sided number cube.
d. A 4-year-old child is over 6 feet tall.
e. No one in your class will be late to class next week.
f. The next baby born at a hospital will be a boy.
g. It will snow at our school on July 1.
h. The sun will set before 11:00 p.m. today.

i. Spinning this spinner will result in green.
j. Spinning this spinner will result in yellow.
Likelihood
2. Discuss your answers to question 1 with your partner. If you disagree on the likelihood of any of the events, work together to reach an agreement.
3. Invent another situation for each label, for a total of 5 more events.
a. Impossible
b. Unlikely
c. Equally probable
d. Likely
e. Certain
ManuscriptCopy
Guided Activity: Expressing Probabilities of Events
1. Complete the statements. The probability of an event can be any number between 0 and 1. A probability of 0 means it is certain impossible that the event will occur. A probability of 1 means it is certain impossible that the event will occur. The closer a probability of an event is to 1, the less more likely it is to occur, whereas the closer it is to 0, the less more likely it is to occur. A probability of 0.5 means the event is likely. unlikely. equally probable.
Probabilities can be represented by decimals, percentages, or fractions with equivalent values between 0 and 1.
Collaborative Activity: Card Sort: Likelihood
1. Your teacher will give you some cards that describe events. Order the events from least likely to most likely.
2. After ordering the first set of cards, pause here so your teacher can review your work. Then, your teacher will give you a second set of cards.
ManuscriptCopy
3. Add the new set of cards to the first set so that all of the cards are ordered from least likely to most likely.
Lesson Summary
A chance experiment is something that happens where the outcome is unknown.
A chance experiment is something you can do over and over again, and you don’t know what will happen each time.
For example, in a coin flip, it is unknown whether the result will be heads or tails. An outcome of a chance experiment is something that can result from it. For example, in a coin flip, one possible outcome is that the coin will land on heads.
An outcome of a chance experiment is one of the things that can happen when you do the experiment.
An event is a set of one or more outcomes.
An event is a set of possible outcomes resulting from an experiment.
The likelihood of an event can be described using the phrases shown.
• Impossible
• Unlikely
• Equally probable
• Likely
• Certain For example, consider a coin flip.
• It is impossible that the coin will turn into a bottle of ketchup.
• It is unlikely the coin will land on its edge.
• It is equally probable that the coin will land on tails.
• It is likely that the coin will land on heads or tails.
ManuscriptCopy
• It is certain that the coin will land somewhere.
The measure of the likelihood that a specific outcome will occur is called its probability. Probability can be expressed as a fraction, decimal, or percentage.
Practice Problems
1. The likelihood that Han makes a free throw in basketball is 60%. The likelihood that he makes a 3-point shot is 0.345. Which event is more likely, Han making a free throw or making a 3-point shot? Explain your reasoning.
2. Different events have the following likelihoods. Sort the likelihoods of the events from least to greatest.
• 60%
• 8 out of 10
• 0.37 • 20% • 9 10
3. There are 25 prime numbers between 1 and 100. There are 46 prime numbers between 1 and 200. Which situation is more likely? Explain your reasoning.
A computer produces a random number between 1 and 100 that is prime. A computer produces a random number between 1 and 200 that is prime.
ManuscriptCopy
Review Problems
4. Here is an equation: �� + 4 = 17
a. Draw a tape diagram to represent the equation.
b. Which part of the diagram shows the quantity ��? What about 4? What about 17?
c. How does the diagram show that �� + 4 has the same value as 17?
5. A sports drink bottle contains 16.9 fluid ounces (fl. oz.). Andre drank 80% of the bottle. How many fl. oz. did Andre drink? Show your reasoning.
ManuscriptCopy
Unit 10, Lesson 2: What Are Probabilities?
Warm-Up: What Game Would You Choose?
Which game would you choose to play? Explain your reasoning.
Game 1: You flip a coin and win if it lands showing heads.
Game 2: You roll a standard number cube and win if it lands showing a number that is divisible by 3.
Exploration Activity: What’s Possible?
1. For each situation, identify how many outcomes there are.
a. Hank rolls a standard six-sided number cube once.
b. Clark spins the spinner shown once.
c. Kinley selects a letter at random from the word MATH.
d. Maurice selects a letter at random from the alphabet.
e. Nigel picks a card at random from a stack of cards numbered 5 through 20.
ManuscriptCopy
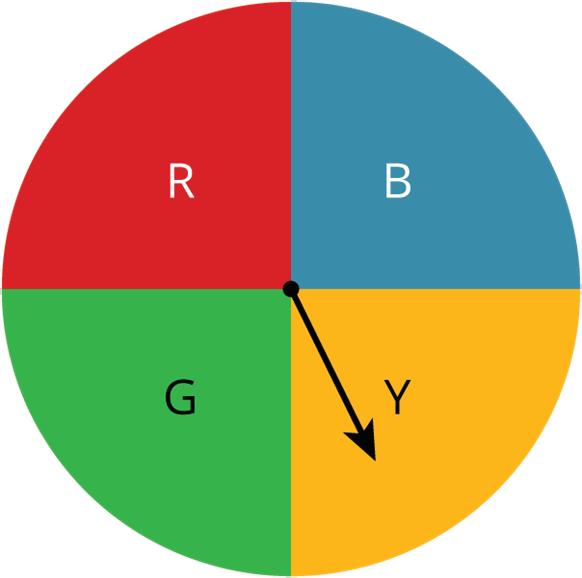
2. Compare the likelihood of these outcomes from the situations explored in question 1. Be prepared to explain your reasoning.
a. Is Clark more likely to have the spinner stop on the red section or the blue section?
b. Is Kinley or Maurice more likely to get the letter T?
c. Is Hank or Nigel more likely to get a number that is greater than 5?
ManuscriptCopy
3. Suppose you have a spinner that is evenly divided showing all the days of the week. You also have a bag of papers that list the months of the year. Explain whether you are more likely to spin the current day of the week or pull out the paper labeled with the current month.
Guided Activity: Interpreting and Comparing Probabilities
1. A spinner is shown with the probabilities of landing on each space given as a decimal.
Use the spinner to complete the table by identifying the missing events, probabilities, and descriptions of the likelihood of the event.
ManuscriptCopy
2. For each scenario, determine which event is more likely or whether the events are equally probable.
a. Alex and Elvis play baseball. Based on their statistics, Alex’s probability of hitting a home run is 0.27. The probability of Elvis hitting a home run is 14%. Which event is more likely on their next at bat?
Alex hits a home run. Elvis hits a home run. Both events are equally probable.
b. A meteorologist states there is a 50% chance of rain tomorrow. Which event is more likely to happen?
It will rain tomorrow. It will not rain tomorrow.
Both events are equally probable.
c. Shawn is calling the coin toss before his football game. Which event is more likely to occur?
The coin will land on its edge. The coin will land on either heads or tails. Both events are equally probable.
ManuscriptCopy
Collaborative Activity: Finding Probabilities
Grant has a bag with 4 different-colored marbles: green, orange, blue, and red. Daniel has a bag with 5 different-colored marbles: green, orange, blue, red, and yellow.
1. With your partner, complete the table by determining the probability that each student randomly pulls a marble of the indicated color from their bag without looking. Assume that all marbles are in the bag for each event.
Event Grant’s Probability
��(green)
��(orange)
��(blue)
��(red)
��(yellow)
2. Complete the statement.
Grant
ManuscriptCopy
Daniel is less likely to pull a blue marble from his bag because the probability of pulling a blue marble for him is closer to 0 1 than the probability of pulling a blue marble is for Grant. Daniel.
3. Using probabilities, explain who is more likely to pull a yellow marble from his bag.
4. If the quantity and colors of marbles in Grant’s and Daniel’s bags doubled, how would the probabilities from the table change? Explain your reasoning.
Lesson Summary
The probability of an event is a measure of the likelihood that the event will occur. Probabilities are expressed using numbers from 0 to 1.
The probability of a chance event is a number from 0 to 1 that expresses the likelihood of the event occurring, with 0 meaning it will never occur and 1 meaning it will always occur.
The closer the probability of an event is to 0, the less likely it is. The closer the probability of an event is to 1, the more likely it is.
• When a coin is flipped, the probability that it will turn into a bottle of ketchup is 0.
• When a coin is flipped, the probability that it will land somewhere is 1.
• Rolling a standard six-sided number cube includes 6 outcomes: 1, 2, 3, 4, 5, and 6. The probability that the number cube will land on an even number is 3 6 or 1 2 . This probability can also be expressed as 0.5 or 50%.
In general, if all outcomes in an experiment are equally likely and there are �� possible outcomes, then the probability of a single outcome is 1 �� .
In probability, there is often one desired outcome to be selected at random from the set of all possible outcomes.
ManuscriptCopy
Outcomes of a chance experiment are random if they are all equally likely to happen.
For example, if 2 people both want to read the same book, they could flip a coin to see who gets to read the book first.
Practice Problems
1. List the outcomes for each chance experiment.
a. Flipping a coin
b. Selecting a random season of the year
c. Selecting a random day of the week
2. A computer randomly selects a letter from A through J.
a. How many different outcomes are possible?
b. What is the probability that the computer selects a vowel?
c. What is the probability that the computer selects a letter from the word CAT?
3. A spinner is shown with 8 equal sections. List the probability of each event.
a. ��(yellow) = _______
b. ��(green) =
c. ��(blue) =
d. ��(red) = _______
4. Describe 2 random events. One should have a probability closer to 0, and the other should have a probability closer to 1.
Review Problem
5. Find the value of 49 50 ÷ 5 2 using any method.
ManuscriptCopy
Unit 10, Lesson 3: Probability
Warm-Up: Spinner Outcomes
1. A spinner is shown.
a. List the possible outcomes.
b. Which outcome is most likely when spinning this spinner?
ManuscriptCopy
c. Each outcome takes up a portion of the spinner. The portions are shown in the table, each represented as a percentage, decimal, or fraction. Match each portion to the corresponding outcome.
Exploration Activity: Exploring Probabilites of Events
Work with your partner to complete the following.
1. Five values are shown.
Complete the table by determining the probability of each event, using the 5 given values.
Event
a. When given 4 doors with only 1 containing a prize behind it, what is the chance of opening the prize-winning door?
b. When reaching into a dark closet with 5 pairs of shoes, what is the chance of pulling out a left shoe?
c. When prompted to randomly select a crayon from a group of red, blue, and yellow crayons, what is the chance of choosing a purple crayon?
d. When pulling from a paper bag with 8 slips of paper numbered 1 through 8, what is the chance of pulling 1?
e. When flipping a coin, what is the chance of it landing on either heads or tails?
Probability can be expressed as a decimal, a percentage, or a fraction.
Probability
2. Plot and label a point to represent the probability of each event from the previous question. Use the corresponding letter to label each event.
3. Consider the event from question 1 that is least likely to occur.
a. Which event is the least likely to happen?
b. Describe the likelihood of this event happening.
c. Discuss with your partner whether it is possible to have a probability less than this.
4. Consider the event from question 1 that is most likely to occur.
a. Which event is the most likely to occur?
b. Describe the likelihood of this event happening.
c. Discuss with your partner whether it is possible to have a probability greater than this.
5. Which event from question 1 has the same likelihood of happening or not happening?
ManuscriptCopy
Collaborative Activity: Determining Probabilities of Events
Harper is playing a game in which she draws a lettered tile from a bag, as shown, without looking.
The notation ��(M) in this context means “the probability of pulling a tile with the letter M on it.”
1. Lettered tiles are pulled at random from the bag. Find the probability of each event, represented as a fraction.
a. ��(I) = ______
b. ��(B) = ______
c. ��(R) =
d. ��(vowel) = ______
e. ��(letter) = ______
2. Complete the table by finding the fraction, decimal, and percentage equivalents of the probability of pulling a tile with a consonant on it.
��(consonant)
3. Order the events in question 1 from least to greatest probability. Use the corresponding letters A–E to label each event.
ManuscriptCopy
Siblings Hezekiah and Magdelena each have a bag of candy of assorted flavors. The table shows the quantity and flavors of the pieces of candy in each sibling’s bag.
4. Complete the table by finding the probabilities of each sibling randomly pulling the flavor indicated from their bag.
5. Sharnae incorrectly states that the siblings have the same likelihood of pulling an orange piece of candy from their bag. Explain the error in Sharnae’s thinking.
6. Determine which sibling, if either, has the higher likelihood of pulling a piece of cherry or lime candy from their bag. Explain your reasoning.
Hezekiah Magdelena
Lesson Summary
A chance experiment can be repeated over and over without knowing what will happen each time. For example, when flipping a fair coin, there are 2 possible outcomes, heads or tails. Each outcome has an equal chance of happening, so the experiment is random. Therefore, the probability of the random event of landing on heads is 1 2 , because this event represents 1 favorable outcome out of 2 possible outcomes. Represented as a decimal or a percentage, the probability of landing on heads is 0.5 or 50%, respectively.
The probability of an event occurring, notated as ��(event), is determined by dividing the number of outcomes in the event by the total possible outcomes.
��(event) = (number of outcomes in the event) (total possible outcomes)
Calculate the probability of events to determine the likelihood that a single event will occur, and to compare the likelihoods of different events.
Practice Problems
1. The probabilities of 5 events are given.
a. Order the values of the probabilities from least to greatest.
b. Match the probabilities with the events described in the table.
Event
Landing on green on the spinner shown
Probability
YG R
Pulling a blue marble from a bag containing an equal number of red, orange, yellow, green, and blue marbles
Landing on a factor of 10 when rolling a fair 10-sided number cube
Picking a card with a vowel on it from a set of cards labeled with each letter in the word PROBABLE
Choosing an odd number from a bag with 50 slips of paper numbered 1–50
c. Explain which event is the least likely to occur, based on the probabilities.
Review Problem
2. Complete the table by rewriting each value in its equivalent forms.
ManuscriptCopy
ManuscriptCopy
Unit 10, Lesson 4: Determining the Probability of the Complement of an Event
Warm-Up: What Song?
There are 50 songs in a playlist set to play on shuffle, so the order of the songs played will be random. Genre-wise, 20 of the songs are pop, 15 songs are hip-hop, 10 songs are rock, and 5 are country.
1. What is the probability that the first song played will be the first song in the playlist?
2. What is the probability that the genre of the first song played will be hip-hop?
3. What is the probability that the first song played won’t be a pop song?
Exploration Activity: Other Outcomes
A game spinner with 5 equal sections is shown.
1. List all of the possible outcomes.
2. Event A is spinning an even number.
a. List all outcomes in event A.
b. ��(A) = __________ The complement of event A is all of the other outcomes not in event A. The complement of event A is notated as “not A.”
c. List all outcomes not in event A.
d. ��(not A) = __________
A bag contains 10 colored marbles. The color distribution is shown in the table.
3. Event M is randomly drawing a pink or green marble from the bag.
a. ��(M) =
b. List all outcomes not in event M.
Green Blue Purple Pink
��(not M) = __________
4. What is the sum of ��(A) and ��(not A)?
5. What is the sum of ��(M) and ��(not M)?
6. Using your answers from questions 5 and 6, what can you conclude about the probabilities of an event and its complement?
Collaborative Activity: Finding Complements of Events
1. Event A is randomly choosing a letter A from the word QUADRANT.
a. Find ��(A).
b. Find ��(not A). Show or explain your thinking.
c. What is another way to determine ��(not A) in addition to the method used to answer the previous question?
ManuscriptCopy
2. The table shows the distribution of chocolate candies in a candy jar .
a. Find ��(milk).
b. Find ��(not milk).
3. If ��(C) = 25%, determine ��(not C).
4. If ��(not D) = 14 25 , determine ��(D).
5. If 1 – ��(B) = 0.99, determine ��(B).
6. When asked to find the complement of ��(E) = 0.06 as a percentage, Ronan incorrectly stated ��(not E) = 40%. Explain the error in Ronan’s thinking.
ManuscriptCopy
Lesson Summary
Recall that an event is the desired outcome in a random experiment. The complement of an event is all of the other (undesired) outcomes that can occur. In some random experiments, like spinning a spinner with 5 sections or rolling a number cube, there may be multiple possible outcomes, but when exploring complements, the events are defined as the desired and undesired outcomes only.
The sum of the probabilities of an event and its complement is always 1. Therefore, the complement of an event, A, can be found using the equation 1 – ��(A) = ��(not A). It is also true that 1 – ��(not A) = ��(A) and ��(A) + ��(not A) = 1.
Practice Problems
1. A playlist contains 25 songs from a variety of artists. The artist distribution is shown in the table.
Event A is randomly playing a Beatles song first. Find ��(not A).
2. Event B is randomly choosing a letter E from the word PRETZELS.
a. List all outcomes of event B.
b. Find ��(B).
c. Find ��(not B). Show or explain your thinking.
ManuscriptCopy
Pink Floyd Bob Marley Elvis The Beatles
3. The table shows the distribution of cookie flavors in a cookie jar.
a. Find ��(sprinkle).
b. Find ��(not oatmeal).
Review Problems
4. Select all the expressions that are equivalent to 4��.
5. Elena is designing a logo in the shape of a parallelogram. She wants the logo to have an area of 12 square inches (sq. in). She draws bases of different lengths and tries to compute the height for each.
a. Write an equation Elena can use to find the height, ℎ, for each value of the base, ��.
b. Use your equation to find the height of a parallelogram with base 1.5 inches (in.).
Chocolate Chip Oatmeal Sprinkle
ManuscriptCopy
Unit 11, Lesson 1: Types of Angles
Warm-Up: Math Chat
Discuss the following questions with a partner. Summarize your discussion for each question.
1. What right angles do you see around you?
2. What straight angles do you see around you?
3. What other types of angles do you see around you?
ManuscriptCopy
Collaborative Activity: Identifying Angle Types
1. Several angles are shown in the table. Identify each angle type.
Acute angle
Obtuse angle
Right angle
Straight angle
Acute angle
Obtuse angle
Right angle
Straight angle
Obtuse angle
Right angle
Straight angle
Obtuse angle
Right angle
Straight angle
Obtuse angle
Right angle
Straight
2. Four angles are identified in the image of the boat shown.
a. Martha incorrectly stated that angle C is an obtuse angle. Explain the error in her thinking.
b. Correctly label the angle types highlighted in the image.
Acute angle
Obtuse angle
Right angle
Straight angle
ManuscriptCopy
Guided Activity: Naming and Measuring Angles
1. Complete the statements using the words ray(s) and vertex.
a. An angle is formed by 2 ___________________ that share a common endpoint. The common endpoint is the ___________________ of the angle.
b. Angles are commonly named using 3 letters, where the letter naming the ___________________ is the middle letter in the angle name. The other 2 letters represent points on each ___________________ of the angle.
2. An angle is shown. Write 2 ways to name the angle using 3 letters.

3. An image of a line segment intersecting a line is shown. Several points are labeled.
a. Identify ∠MRH by shading the inside of the angle.
b. What is another name for ∠MRH?
c. Explain why it can be important to refer to angles using 3-letter names.
4. Complete the statement using the words protractor and degrees.
The size of an angle is measured in _________________________ with a tool called a _________________________.
5. Complete the statements.
a. An acute angle has a larger smaller angle measure than an obtuse angle.
b. A straight angle has a larger smaller angle measure than an obtuse angle.
c. The measure of a right angle is greater less than the measure of an acute angle but greater less than the measure of an obtuse angle.
6. Complete the table by identifying the type of angle for each measure indicated.
Lesson Summary
Angles are measured in degrees, which is notated by the symbol °. The wider an angle is opened from one ray to the other ray, the greater the angle’s measure. An upcoming lesson will explore how to measure angles using a protractor.
Angles can be acute, obtuse, right, or straight.
An acute angle is an angle measuring larger than 0° and smaller than 90°.
An obtuse angle is an angle measuring larger than 90° and smaller than 180°.
A right angle is an angle measuring exactly 90°.
A straight angle is an angle measuring exactly 180°.
A right angle is in the shape of a square corner, like the corner of a rectangle. Images often indicate a right angle with a box at the vertex of the angle.

A straight angle is in the shape of a straight line. Images of straight lines are often labeled with a curve in the center of the image to indicate a straight angle.

Acute and obtuse angles are also often labeled with curved lines. Acute angles open more narrowly than the corner of a rectangle. Obtuse angles open wider than the corner of a rectangle but more narrowly than a straight angle.
Practice Problems
1. Sketch an angle of each type.
a. Right
b. Acute
c. Obtuse
d. Straight
2. Write 2 ways to name the angle shown.
T
3. An image of a line and a ray meeting at point C is shown.
a. Name a straight angle.
b. Name an acute angle.
c. Name an obtuse angle.
Review Problems
4. Here is a box plot that summarizes data for the time, in minutes (min.), that a fire department took to respond to 100 emergency calls.

Select all the statements that are true, according to the box plot.
□ Most of the response times were under 13 min.
□ Fewer than 30 of the response times were over 13 min.
□ More than half of the response times were 11 min. or greater.
□ There were more response times that were greater than 13 min. than those that were less than 9 min.
□ About 75% of the response times were 13 min. or less.
Unit 11, Lesson 2: Complementary and Supplementary Angles
Warm-Up: Drawing Angles
1. Consider what you know about right angles.
a. Draw a right angle.
b. Explain how you know it’s a right angle. What is its measure, in degrees?
2. Consider what you know about straight angles.
a. Draw a straight angle.
b. Explain how you know it’s a straight angle. What is its measure, in degrees?
Exploration Activity: Special Pairs of Angles
A pair of angles is shown.
1. Discuss with a partner what you notice about the pair of angles. Summarize your discussion.

2. What do you think is the sum of the 2 angle measures? Explain your thinking.
3. Complete the statements.
Angle A and angle B together form a right angle. straight line. Since a right angle straight line measures 90°. 180°. the sum of the measures of angle A and angle B must be 90°. 180°.
Another pair of angles is shown.
4. What do you think is the sum of the 2 angle measures? Explain your thinking.
Collaborative Activity: Missing Angle Match
In the previous activity, 2 special pairs of angles were explored.
When the sum of 2 angles is 180°, the angles are called supplementary angles. When the sum of 2 angles is 90°, the angles are called complementary angles.
Your teacher will give you a set of cards. Half of the cards show sets of angles with a missing angle measure, and the other half have degree measures.
1. Work with your partner to pair each angle card with the degree measure card that completes the pair.
2. Sort the pairs into 2 sets, where one set contains the complementary angles and the other set contains the supplementary angles.
Guided Activity: Complementary or Supplementary Angles
1. Desmond stated that ∠DXC, ∠CXW, and ∠WXN are supplementary angles because together they form a straight line. Explain whether you agree with Desmond.
ManuscriptCopy


2. Complete the table by classifying the given sets of angle measures as complementary, supplementary, or neither. Angle
91° and 89° Complementary Supplementary Neither
22° and 78° Complementary Supplementary Neither
ManuscriptCopy
61° and 29° Complementary Supplementary Neither
90° Complementary Supplementary Neither
15° and 75° Complementary Supplementary Neither
13°, 42°, and 35° Complementary Supplementary Neither
149° and 31° Complementary Supplementary Neither
Lesson Summary
Two special pairs of angles, complementary angles and supplementary angles, were explored in this lesson.
Complementary angles are two angles whose measures sum to 90°.
Supplementary angles are two angles whose measures sum to 180°.
A common representation of complementary angles is an image of 2 angles that share a ray within a right angle. Note that complementary angles do not have to share a common side (ray or line segment) to be complementary.
For example, in the pairs of complementary angles shown, neither pair of angles shares a common side.
Similarly, it is common to represent 2 supplementary angles sharing a common ray that together form a straight angle. However, supplementary angles can also be 2 separate angles, as shown.
Because complementary angles and supplementary angles are pairs, they must be a set of 2 angles only. While one angle, or many angles, may have a (combined) measure of 90° or 180°, the classification of complementary angles or supplementary angles would not apply in these cases.
Practice Problems
1. Angle BAC is a right angle.

Complete the statement.
Angles BAD and DAC are _____________________________ angles.
2. A figure is shown.
ManuscriptCopy

Complete the statement.
Angles SOP and POR are _____________________________ angles.
3. Explain whether the angles shown are complementary, supplementary, or neither. 157° 33°
4. Explain whether the angles shown are complementary, supplementary, or neither. 46° 44°
Review Problems
5. A pound (lb.) of ground beef costs $5. At this rate, what is the cost of:
ManuscriptCopy
ManuscriptCopy
Unit 11, Lesson 3: Using a Protractor to Measure Angles
Warm-Up: Pattern Block Angles
If you place 3 hexagon pattern blocks together so that 1 vertex from each hexagon touches the same point, as shown, they fit together without any gaps or overlaps.
1. How many degrees are in the circle at the center of the image?

2. Use the image to determine the degree measure of the angle inside each hexagon pattern block. Explain your reasoning.
Exploration Activity: A Full Turn
A ray that turns all the way around its endpoint and back to its starting place has made a full turn.
We say that the ray has turned 360 degrees (°).

1. How many degrees has each ray turned from where it started? a. b. c.
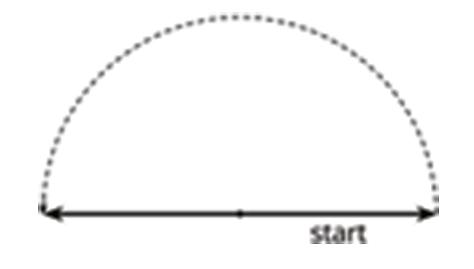

2. Sketch 2 angles.
a. An angle where a ray has turned 50°
b. An angle where a ray has turned 130°
ManuscriptCopy

Exploration Activity: How Large Is a Degree?
1. A ray that turns all the way around its endpoint and back to its starting place is shown.
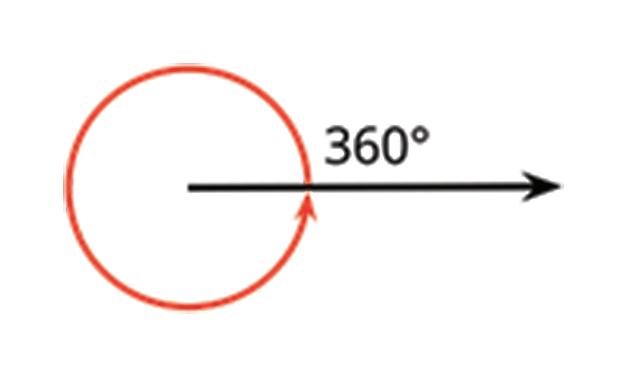
What fraction of a full turn is each of the following angle measurements?
a. 120°
b. 60°
c. 45°
d. 30°
e. 10°
f. 1°
2. Your teacher will give you a protractor, a tool for measuring the number of degrees in an angle.
a. How is 1° shown on the protractor?
b. How many 1° measurements do you see?
ManuscriptCopy
3. A protractor with no numbers has been placed over an angle.

• The center of the protractor is lined up with the vertex of the angle.
• The straight edge of the protractor is lined up with a ray of the angle.
How many degrees is this angle? Explain how you know.
4. An angle contains thirty 1° angles, as shown.
ManuscriptCopy

How many degrees is this angle?
Guided Activity: Use a Protractor
1. Three angles are shown. A protractor has been placed over each angle. Measure the size of each angle in degrees.


ManuscriptCopy

c.
2. Three angles are shown. Use a protractor to measure each angle in degrees.


3. Explain whether you could have determined the measure of the angle in part C of the previous question without a protractor.
ManuscriptCopy
4. An image of 3 rays with a common endpoint is shown. Use a protractor to determine the measure of each angle.
a. ∠ZYU
b. ∠UYX
c. ∠ZYX

5. Elsie and Kayko each used a protractor to measure the angle shown. Elsie says the angle is 80°. Kayko says it’s 100°.

a. Explain why Elsie and Kayko may have ended up with different measurements
b. Explain who is correct.
Lesson Summary
The measure of an angle is a fraction of a circle where the vertex of the angle is at the center of the circle. It is the measure of the space between the rays that form an angle in degrees (°).
To measure the angle, a tool called a protractor is used, according to the steps shown.
1. Line up the vertex of the angle with the center of the protractor. Often, the center of the protractor is indicated by a small hole or a dot.
2. Line up one ray of the angle with a 0° line on the proactractor.
3. Read the angle measure where the other ray of the angle crosses the scale on the protractor. Make sure to read the angle measure from the scale that starts where the first ray is aligned with 0.
Prior to measuring the angle, it can be helpful to consider whether the angle being measured appears to be acute or obtuse, as a second way of checking that the correct scale is being used for measurement
Practice Problems
1. A protractor has been placed over an angle, as shown.
ManuscriptCopy

Measure the size of the angle in degrees.
2. An image of 3 rays with a common endpoint is shown.
3.
Use a protractor to determine the measure of each angle.
a. ∠RSU
b. ∠TSU
c. ∠RST
Measure the size of the angle in degrees.
Review Problems
4. Andre has been practicing his math facts. He can now complete 135 multiplication facts in 90 seconds (sec.).
a. If Andre is answering questions at a constant rate, how many facts can he answer per sec.?
b. Noah also works at a constant rate, and he can complete 75 facts in 1 minute (min.). Who is working faster? Explain or show your reasoning.
5. Select all equations that can represent the question: “How many groups of 4 5 are in 1?”
Unit 11, Lesson 4: Solving Problems Involving Angles
Warm-Up: Angles Here, There, and Everywhere
1. Use a protractor to find the measure of each of the angles shown, in degrees (°).


ManuscriptCopy
Exploration Activity: Is It a Complement or a Supplement?
1. Use the protractor in the picture to find the measure of ∠BCA and ∠BCD.

2. Explain how to find the measure of ∠ACD without repositioning the protractor.
3. Use the protractor in the picture to find the measure of ∠LOK and ∠LOM.

ManuscriptCopy
4. Explain how to find the measure of ∠KOM without repositioning the protractor.
Collaborative Activity: Robot Pathways
Help program each robot to follow its path by using a protractor to determine the measure of each turn the robot needs to make.
1. The ro bot needs to follow its path from point A to point E with turns represented by ∠ABC, ∠BCD, and ∠CDE. A
2. The robot needs to follow its path from point V to point Z with turns represented by ∠VWX, ∠WXY, and ∠XYZ.
3. Program a new pathway for the robot in question 1 by determining the measures of the angles that are complementary to ∠ABC, ∠BCD, and ∠CDE.
Angle
ABC
BCD
CDE
Measure of Complementary Angle
4. Program a new pathway for the robot in question 2 by determining the measures of the angles that are supplementary to ∠VWX, ∠WXY, and ∠XYZ.
Angle
Measure of Supplementary Angle
Collaborative Activity: Finding More Angle Measures
1. Use a protractor to measure the labeled angles in each figure.

2. A pattern composed of a square and four regular octagons is shown. In the pattern, all of the angles inside the octagons have the same measure.
a. Find the measure of one of the angles inside one of the octagons, without using a protractor.
b. Use a protractor to confirm your answer from part A.

3. When designing road networks, perpendicular intersections are ideal . In cases where an intersection must be skewed, the angle of the skew should be no more than 30° from perpendicular, as shown.
a. Without a protractor, determine the measure of angle A.
b. Without a protractor, determine the measure of angle B.
c. Explain how you determined the measure of each angle.
ManuscriptCopy
Lesson Summary
When solving problems involving unknown angle measures, it can be helpful to combine the use of a protractor with knowledge of right angles, straight angles, complementary angles, and supplementary angles.
• Right angles measure exactly 90°.
• Straight angles measure exactly 180°.
• Complementary angles are a pair of angles with a sum of 90°.
• Supplementary angles are a pair of angles with a sum of 180°.
Practice Problems
1. June thought ∠FLG and ∠GLH could be complementary angles. To prove it, she placed a protractor on the angles, as shown.
Explain whether the way June used the protractor confirms ∠FLG and ∠GLH are complementary angles.
2. In shop class, the students were learning how to cut a board with a saw. The shop teacher asked her class to practice sawing the board along the dashed line shown, which creates 2 angles of different measures.
a. Find the measure of angle A using a protractor.
b. Find the measure of angle B using a protractor.
Review Problems
3. The average price of a gallon (gal.) of milk in the US, in dollars ($), for each month from April 2000 to November 2006 was used to create the box plot shown.
a. Find the range of the data set.
b. Find the interquartile range (IQR).
ManuscriptCopy
c. Use the spread of the data to explain whether the average price of a gallon of milk from April 2000 to November 2006 varied a lot or a little.