3 2
STRATEGIES FOR LOCAL MATERIAL REUSE MINGXI SHU MSc SHENGHAN WANG BORJA ROMEU LANDSCAPE URBANISM MArch 2021-2023 ARCHITECTURAL ASSOCIATION SCHOOL OF ARCHITECTURE MArch BRADLEY NISSEN
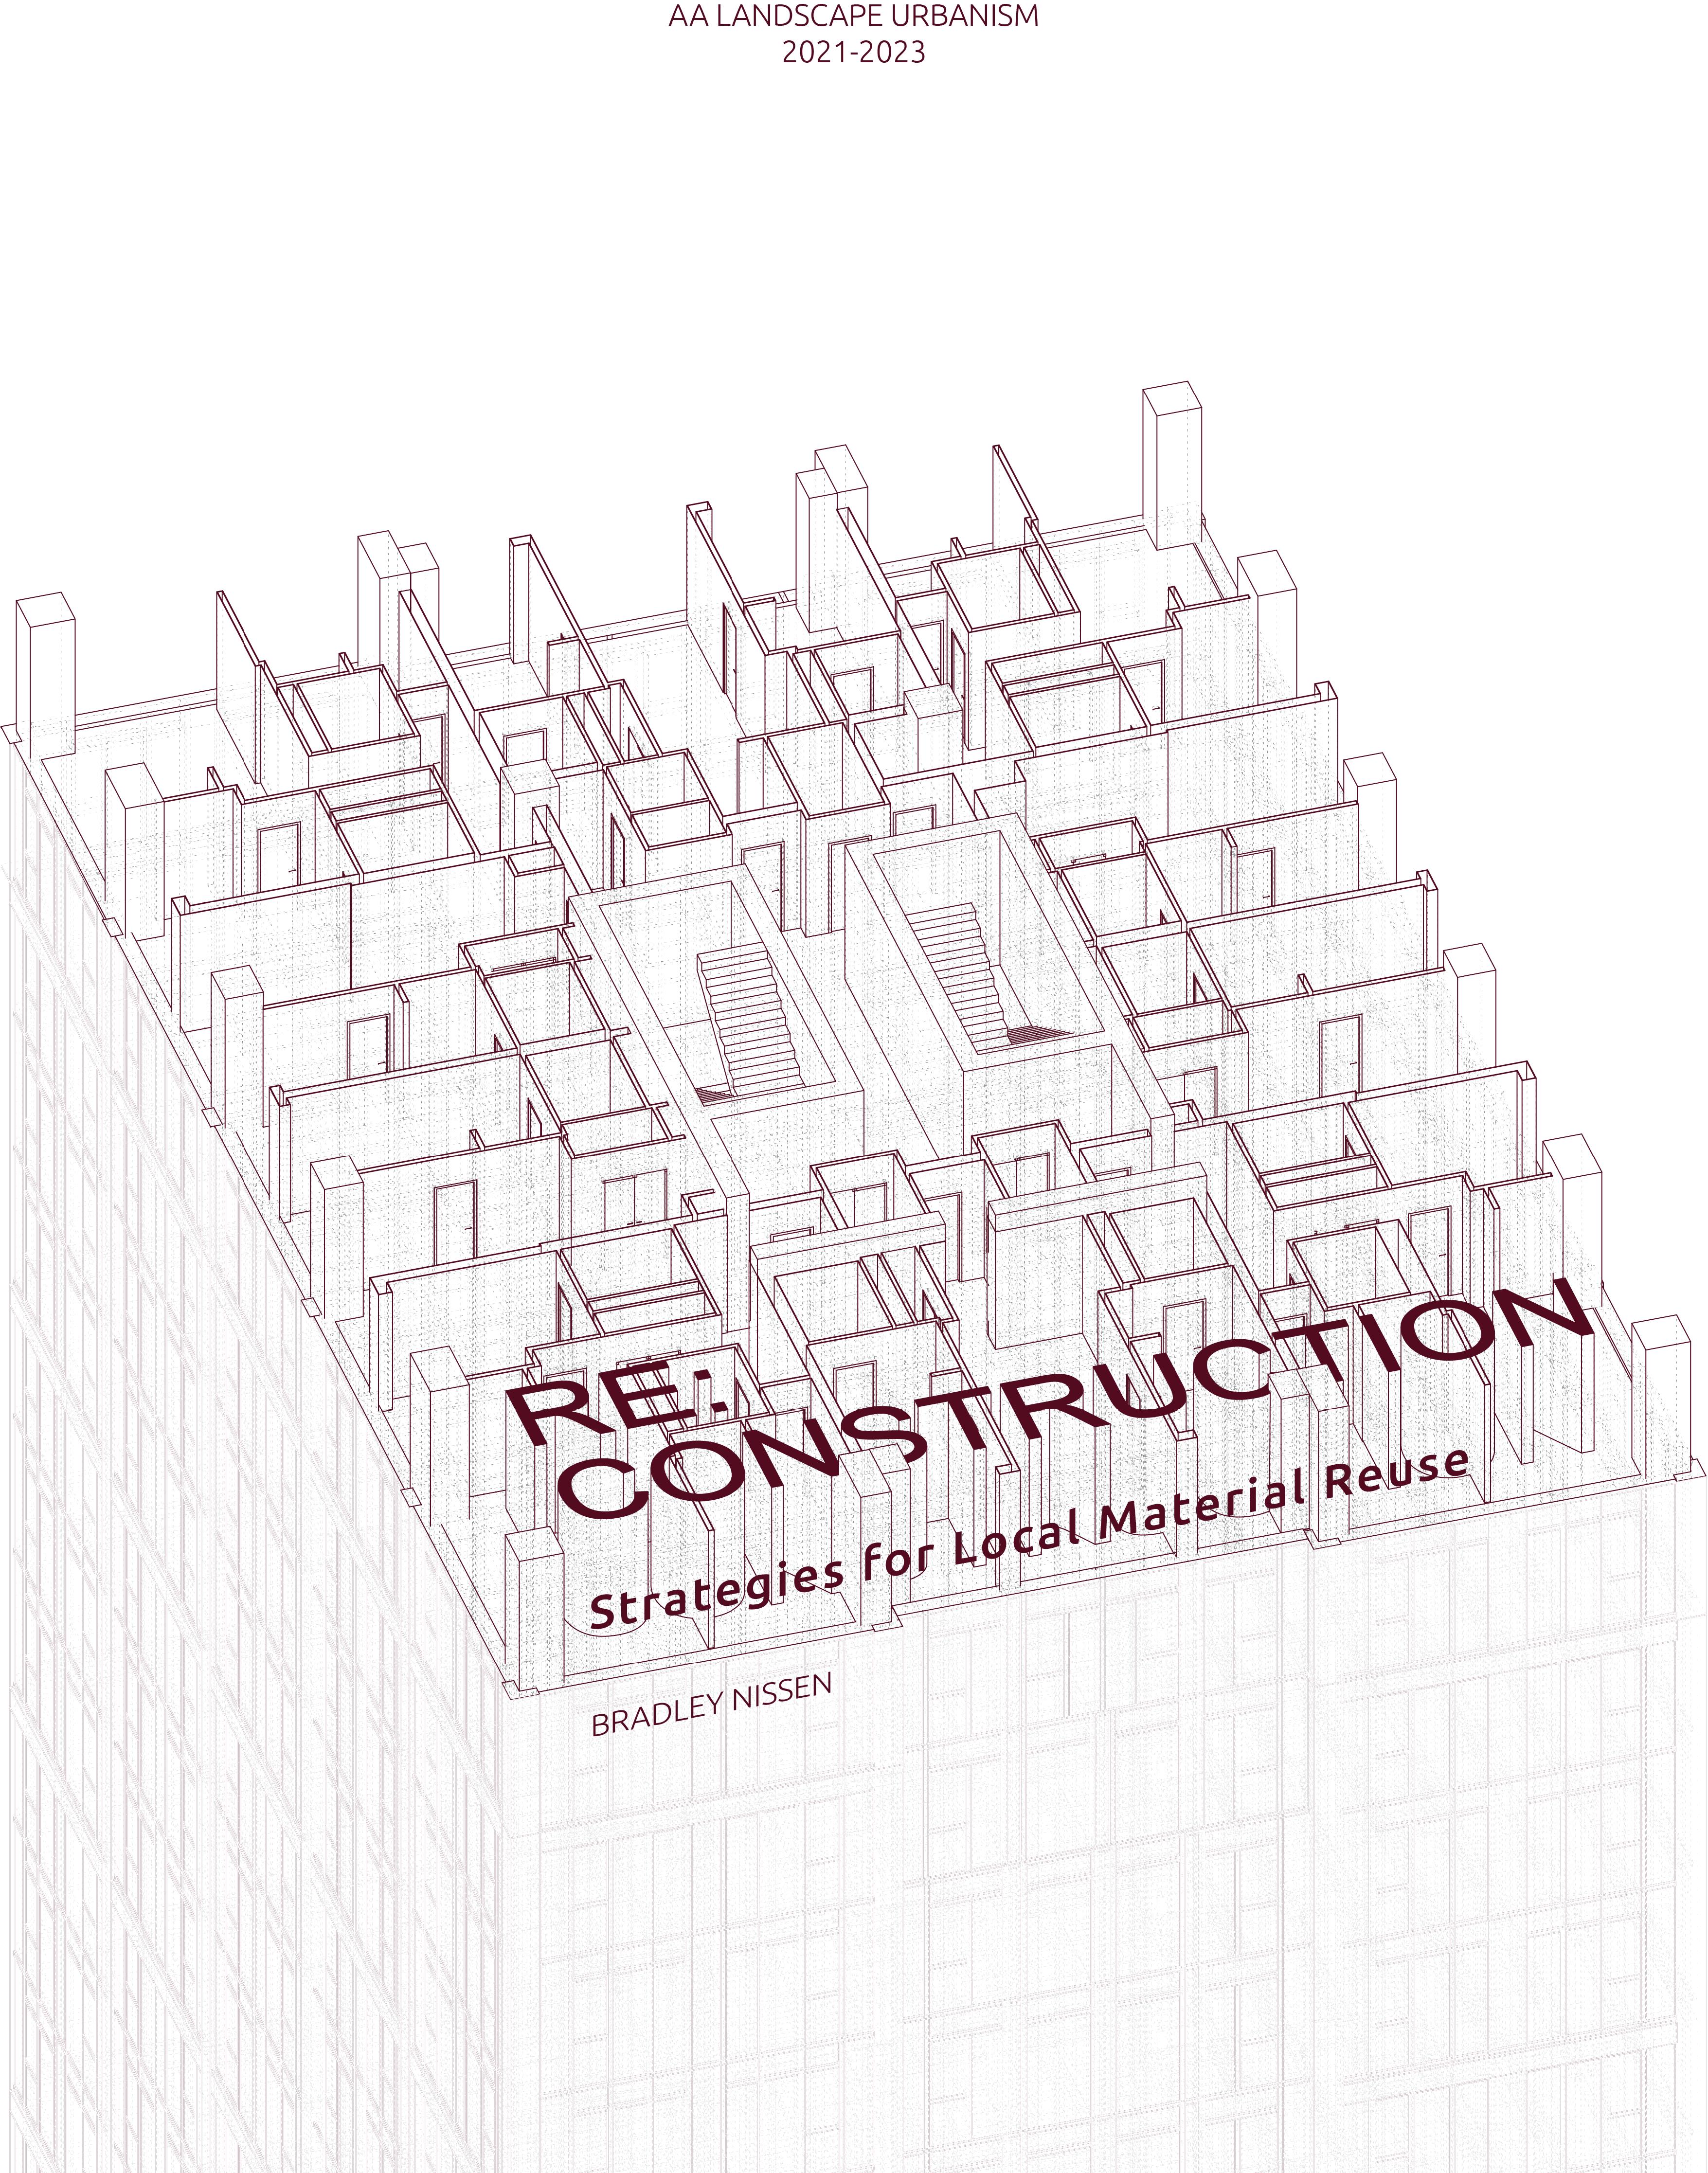
RE: CONSTRUCTION
ACKNOWLEDGEMENTS

I would like to take this opportunity to express my sincere thanks to Alfredo Ramirez, for without his guidance and generous support, I could not have completed this thesis. Additionally, I would like to thank Clara Oloriz and Eduardo Ramirez for their gratitudeandadvicegiventhroughouttheprogram.
I would especially like to thank Hazel Tilley, from Granby Four Street CLT. Without her conversations and inspiration, this project would not have been possible. I would also like to thank other members of the CLT, such as James and Eleanor, for their time during our field visit.
Thank you to our technical tutors Daniel Kiss, Camila Arretche, Carlotta Olivari, and Elena Luciano Suastegui, and to all the external jurors who have helped us to build this project. Last but not least, many thanks to my MSc colleaguesMingxiShu,ShenghanWang,andBorja Romeu, who have accompanied me throughout most of this thesis. All the diagrams and maps within the book have been credited. LANDSCAPE
URBANISM MArch 2021-2023 ARCHITECTURAL ASSOCIATION DIRECTORS
JOSE ALFREDO RAMIREZ EDUARDO RICO STUDIO MASTER CLARA OLORIZ SANJUAN
CLARA OLORIZ SANJUAN TERESA STOPANII TECHNICAL TUTORS
HISTORY AND THEORY
DANIEL KISS CAMILA ARRETCHE ELENA LUCIANO CARLOTTA OLIVARI SCHOOL OF ARCHITECTURE
RE: CONSTRUCTION STRATEGIES FOR LOCAL MATERIAL REUSE BRADLEY NISSEN
5 4
SHENGHAN WANG BORJA ROMEU MINGXI SHU
ABSTRACT
The rapid economic growth necessitated by capitalism has translated into increasing material extraction across the globe to fulfil the demands of urban development. With the construction industry responsible for a significant share of CO2 emissions as well as numerous other environmental and social externalities, the problem of increasing material extraction must be addressed. Developing a more circular construction economy entails prioritizing maintenance and reuse of existing structures and their components while better enabling reuse through policy initiatives and community-focused developments. Through the lens of existing buildings and alternative ownership models in Liverpool, this project investigates methods for collecting material data of new and existing structures to better facilitate the creation of a more robust material reuse network.
7 6
MATERIAL CONSEQUENCES OF RAPID URBANIZATION
AND PASSPORTS
THE NEOLIBERAL
GRANBY MODEL OF DEVELOPMENT
LOCAL NETWORK OF REUSE
9 8 02.6 A TYPICAL HIGH-RISE DEVELOPMENT: THE LEXINGTON 02.7 REFERENCES 02.1 MANAGE DECLINE POLICY 02.2 HOUSING MARKET RENEWAL INITIATIVE POLICY 02.3 ONE POUND HOUSE POLICY 02.4 POLICY CONSEQUENCE - OVERSEA INVESTMENT 02.5 CURRENT LIVERPOOL CITY CENTRE DEVELOPMENT 02 LIVERPOOL,
03 THE
03.2 CASE STUDY OF GRANBY COMMUNITY LAND TRUST 03.4 REFERENCES 03.1 PUBLIC-PRIVATE PARTNERSHIP 03.3 PUBLIC-COMMON PARTNERSHIP 04.1 MATERIAL MANAGEMENT PROCESS 04.2 PRE-DEMOLITION AUDITS 04.3 DECONSTRUCTION AND OWNERSHIP 04.4 MATERIAL CATALOGUE FROM DECONSTRUCTION 04.5 MATERIAL CATALOGUE FOR CLASSIFICATION AND USAGE GUIDANCE 04.6 MATERIAL PASSPORTS 04 AUDITS
05.1 MATERIAL MANUAL 05.2 CONSTRUCTION LIBRARY 05.3 MATERIAL REUSE COMPARISON 05.4 OUR VISION FOR THE COMMUNITY 05.6 ENVIRONMENTAL BENEFIT OF REUSING MATERIALS 05 THE MATERIAL
06 A
06.4 MATERIAL NETWORK 06.3 MATERIAL OPERATION SYSTEM IN LIVERPOOL 06.5 UK NETWORK VISION 01
CITY
MANUAL
01.1 UNSUSTAINABLE GROWTH OF CITIES 01.3 UK LAND-USE CHANGE FROM 1990 TO 2020 01.4 HOUSE PRICE IN ENGLAND 01.5 EMPTY HOUSES IN ENGLAND 01.6 CONSTRUCTION EXTERNALITIES ANATOMICAL MAP 01.2 ATLAS OF URBANIZATION AND ITS ENVIRONMENTAL CONSEQUENCES APPENDIX I. MATERIAL EXTRACTION AND PLANETARY BOUNDARIES APPENDIX II. UK SAND DEPOSITS, EXTRACTION, AND IMPACT 01.7 REFERENCES 04.7 MATERIAL AUDIT DURING RENOVATION 06.2 MATERIAL NETWORK AND FUTURE URBAN 06.1 MATERIAL OPERATION SYSTEM IN LIVERPOOL

CHAPTER 1 11 01 MATERIAL CONSEQUENCES OF RAPID URBANIZATION 01.1 UNSUSTAINABLE GROWTH OF CITIES 01.3 UK LAND-USE CHANGE FROM 1990 TO 2020 01.4 HOUSE PRICE IN ENGLAND 01.5 EMPTY HOUSES IN ENGLAND 01.6 CONSTRUCTION EXTERNALITIES ANATOMICAL MAP 01.2 ATLAS OF URBANIZATION AND ITS ENVIRONMENTAL CONSEQUENCES APPENDIX I. MATERIAL EXTRACTION AND PLANETARY BOUNDARIES APPENDIX II. UK SAND DEPOSITS, EXTRACTION, AND IMPACT 01.7 REFERENCES
UNSUSTAINABLE GROWTH OF CITIES
Since the industrial revolution, urbanization and its effects have been considered nearly universal globally and inevitable. During these centuries, according to Alfonso Vegara, our planet has been transformed into an increasingly urban environment where cities are the new engines of the global economy. As a result, people have tended to move from rural areas to cities. Today, these nodes of agglomeration are home to more than 50% of the world’s population, and by 2050 the UN estimates that this figure will approach 70%. Additionally, urban centers are responsible for 70% of the world’s GDP, produce more than 60% of its energy resources, release more than 70% of the total greenhouse gas emissions, and generate 70% of the world’s waste.3
 byBorjaRomeu
Urban areas in and of themselves do not exceed 3% of the earth’s surface but are responsible for transforming 70% of the planet’s land surface.4 For such a small amount of land to continue growing economically and materially, a web of functional landscapes is necessary to sustain these areas of concentrated urbanization. These areas can be classified into landscapes of primary production (agriculture, mining, fishing, pastoralism, forestry, etc), circulation (transportation networks, pipelines, air and sea routes), and waste disposal. In order to mitigate the effects of the ongoing climate crisis, we must consider alternative models of urbanization.
Map
13 12
1. ESTIMaTED CITIES GDp BY 2050
AFRICA ASIA EUROPE NORTH AMERICA SOUTH AMERICA
Liberia
Mozambique
Niger
Ethiopia
Kenya
Ghana
Mauritius
DOTS SIZED BY POPULATION
Credits:Flickr
An OEC study of more than 1,100 cities shows that more than 60% of the built-up area is low-density. This dispersed urban model ultimately promotes a capitalist system of living, whereby alternative goods, such as the car (a symbol of freedom and socio-economic status), are required. Furthermore, the extensive use of land for urban development creates a perception that land is unlimited. We are using up more and more land due to uncontrolled urban development processes, while simultaneously exploitating the hinterland for the extraction of cheap natural resources in order to continue urbanization.
According to predictions, by the year 2050, the consumption of raw materials for global urban development is expected to double. This growth is geographically asymmetric, and while in Europe and the United States the growth is relatively slow, around 25% and 17% respectively, Africa is estimated to grow by more than 700%, and could consume some 17.7 billion tons of materials by 2050. Southeast Asia follows closely behind with a predicted growth rate of more than 200%. Additionally, China’s Domestic Material Consumption (DMC) is expected to reach 13 billion tons by 2050.6

Brazil Chile Argentina United States Mexico Panama Cuba Ukraine Moldova Russia Spain Italy Ireland Austria Poland Slovakia Germany Luxembourg Iran China Thailand India North Korea Japan Singapore Qatar Egypt Angola Nigeria Tanzania Burkina Faso Ethiopia Niger Mozambique Liberia Kenya Ghana Mauritius
B
1.5
Argentina United States Panama Russia Spain Italy Ireland Austria Poland Slovakia Germany Luxembourg Japan Singapore Qatar Mauritius Brazil Chile Argentina United States Mexico Panama Cuba Ukraine Moldova Russia Spain Italy Ireland Austria Poland Slovakia Germany Luxembourg Iran China Thailand Japan Singapore Qatar Egypt Angola Mauritius Brazil Chile Argentina United States Mexico Panama Cuba Ukraine Moldova Russia Spain Italy Ireland Austria Poland Slovakia Germany Luxembourg Iran China Thailand India North Korea Japan Singapore Qatar Egypt Angola Nigeria Tanzania Burkina Faso Ethiopia Kenya Ghana Mauritius Brazil Chile Argentina United States Mexico Panama Cuba Ukraine Moldova Russia Spain Italy Ireland Austria Poland Slovakia Germany Luxembourg Iran China Thailand India North Korea Japan Singapore Qatar Egypt Angola Nigeria Tanzania Burkina Faso Ethiopia Niger Mozambique Liberia Kenya Ghana Mauritius Brazil Chile Argentina United States Mexico Panama Cuba Ukraine Moldova Russia Spain Italy Ireland Austria Poland Slovakia Germany Luxembourg Iran China Thailand India North Korea Japan Singapore Qatar Egypt Angola Nigeria Tanzania Burkina Faso Ethiopia Niger Mozambique Liberia Kenya Ghana Mauritius Brazil Chile Argentina United States Mexico Panama Cuba Ukraine Moldova Russia Spain Italy Ireland Austria Poland Slovakia Germany Luxembourg Iran China Thailand India North Korea Japan Singapore Qatar Egypt Angola Nigeria Tanzania Burkina Faso Ethiopia Niger Mozambique Liberia Kenya Ghana Mauritius 600M AFRICA Brazil Chile Argentina United States Mexico Panama Cuba Ukraine Moldova Russia Spain Italy Ireland Austria Poland Slovakia Germany Luxembourg Iran China Thailand India North Korea Japan Singapore Qatar Egypt Angola Nigeria Tanzania Burkina Faso Ethiopia Niger Mozambique Liberia Kenya Ghana Mauritius EUROPE NORTH AMERICA Brazil Chile Argentina United States Mexico Panama Cuba Ukraine Moldova Russia Spain Italy Ireland Austria Poland Slovakia Germany Luxembourg Iran China Thailand India North Korea Japan Singapore Qatar Egypt Angola Nigeria Tanzania Burkina Faso Ethiopia Niger Mozambique Liberia Kenya Ghana Mauritius Brazil Chile Argentina United States Mexico Panama Cuba Ukraine Moldova Russia Spain Italy Ireland Austria Poland Slovakia Germany Luxembourg Iran China Thailand India North Korea Japan Singapore Qatar Egypt Angola Nigeria Tanzania Burkina Faso
D aGraM 1. urBaN pOpuLaTION VS GDp pEr CapITa 2016
FIGurE 1. LONDON THaMES rIVEr aND CaNarY WHarF aErIaL VIEW
United States Mexico Panama Cuba Ukraine Moldova Russia Spain Italy Ireland Austria Poland Slovakia Germany Luxembourg 100% 80% 60% 40% 20% 0% $ 1,000 $ 2,000 $ 5,000 $ 10,000 GDP PER CAPITA $ 20,000 $ 50,000 $ 100,000 SHARE OF POPULATION LIVING IN URBAN AREAS D aGraM 2. urBaN pOpuLaTION VS GDp pEr CapITa 2016 Egypt Angola Nigeria Tanzania Burkina Faso Ethiopia Niger Mozambique Liberia Kenya Ghana Mauritius 100% 80% 60% 40% 20% 0% $ 1,000 $ 2,000 $ 5,000 $ 10,000 GDP PER CAPITA $ 20,000 $ 50,000 $ 100,000 SHARE OF POPULATION LIVING IN URBAN AREAS D aGraM 3. urBaN pOpuLaTION VS GDp pEr CapITa 2016 1.5 B DOTS SIZED BY POPULATION Egypt Angola Nigeria Tanzania Burkina Faso Ethiopia Niger Mozambique Liberia Kenya Ghana Mauritius 600M 1.5 B DOTS SIZED BY POPULATION Egypt Angola Nigeria Tanzania Burkina Faso Ethiopia Niger Mozambique Liberia Kenya Ghana Mauritius 600M 100% 80% 60% 40% 20% 0% $ 1,000 $ 2,000 $ 5,000 $ 10,000 GDP PER CAPITA $ 20,000 $ 50,000 $ 100,000 SHARE OF POPULATION LIVING IN URBAN AREAS 15 14
ATLAS OF URBANIZATION AND ITS ENVIROMENTAL CONSEQUENCES Material
D aGraM 4. GLOBaL BuILDING MaTEr aL uSE BY MaTErIaLS
byShenghanWang
Map 2. GLOBaL aTLaS OF urBaNIZaTION aND ITS CONSEQuENCES
The rapid economic growth necessitated by capitalism has translated into material growth in cities across the globe. As the world becomes more urbanized, this growth pushes cities both outward into surrounding landscapes and upward via unsustainable models of neoliberal high-rise developments. Ours is a world of resources and wealth, one extracted and reconfigured to produce the other. While the material resources we use to construct our cities and infrastructure are finite, capitalism requires the wealth they generate to increase indefinitely. The result of this unsustainable dichotomy is increasing extraction at a pace our planet is unable to cope with.
According to “Growth Opportunities in the Global Construction Industry 2018-2023: Trends, Forecast, and Opportunity Analysis,” the global construction industry is expected to reach an estimated $10.5 trillion by 2023, and it is forecast to grow at a CAGR of 4.2% from 2018 to 2023. The buildings and construction sector accounted for 36% of final energy use and 39% of energy and process-related carbon dioxide (CO2) emissions in 2018, 11% of which resulted from manufacturing building materials and products such as steel, cement, and glass.
The atlas on the left shows the construction material footprint along with the construction related CO2 emissions by country. The environmental cost of current urbanization processes has clearly already become a global issue. The materials we choose to build with contribute significantly to the climate crisis. This means that each decision regarding the types and amount of materials we use to construct our cities play a role in how quickly (if at all) we are able to decarbonize to a sustainable level.
18 Global material use per year (Billion t) Concrete 16 14 12 10 8 6 4 2 0 2000 2002 2004 2006 2008 2010 2012 2014 2016 Steel Cement(non-concrete use) Wood Brick Aggregates Plaster& Gypsum, Lime Ceramics byShenghanWang
urban cluster CO2 emission 30 100 200 mineral location construction material footprint t/cap
Consequences of Rapid Urbanization
17 16
APPENDIX I. MATERIAL EXTRACTION AND PLANETARY BOUNDARIES
Material Consequences of Rapid Urbanization
The extraction of virgin raw materials we use to construct the cities of today is projected to rise dramatically in the coming decades. Within a globalized market-based economy, these raw materials often originate far from the cities and countries they end up in, and their extraction, transportation, and assembly into familiar building components require energy and result in the release of greenhouse gases and waste into the environment.
The extraction of these materials strains the earth’s capacity, and their processing and transportation are dependent on existing energy infrastructure, leading to more fossil fuel extraction and more carbon emissions.
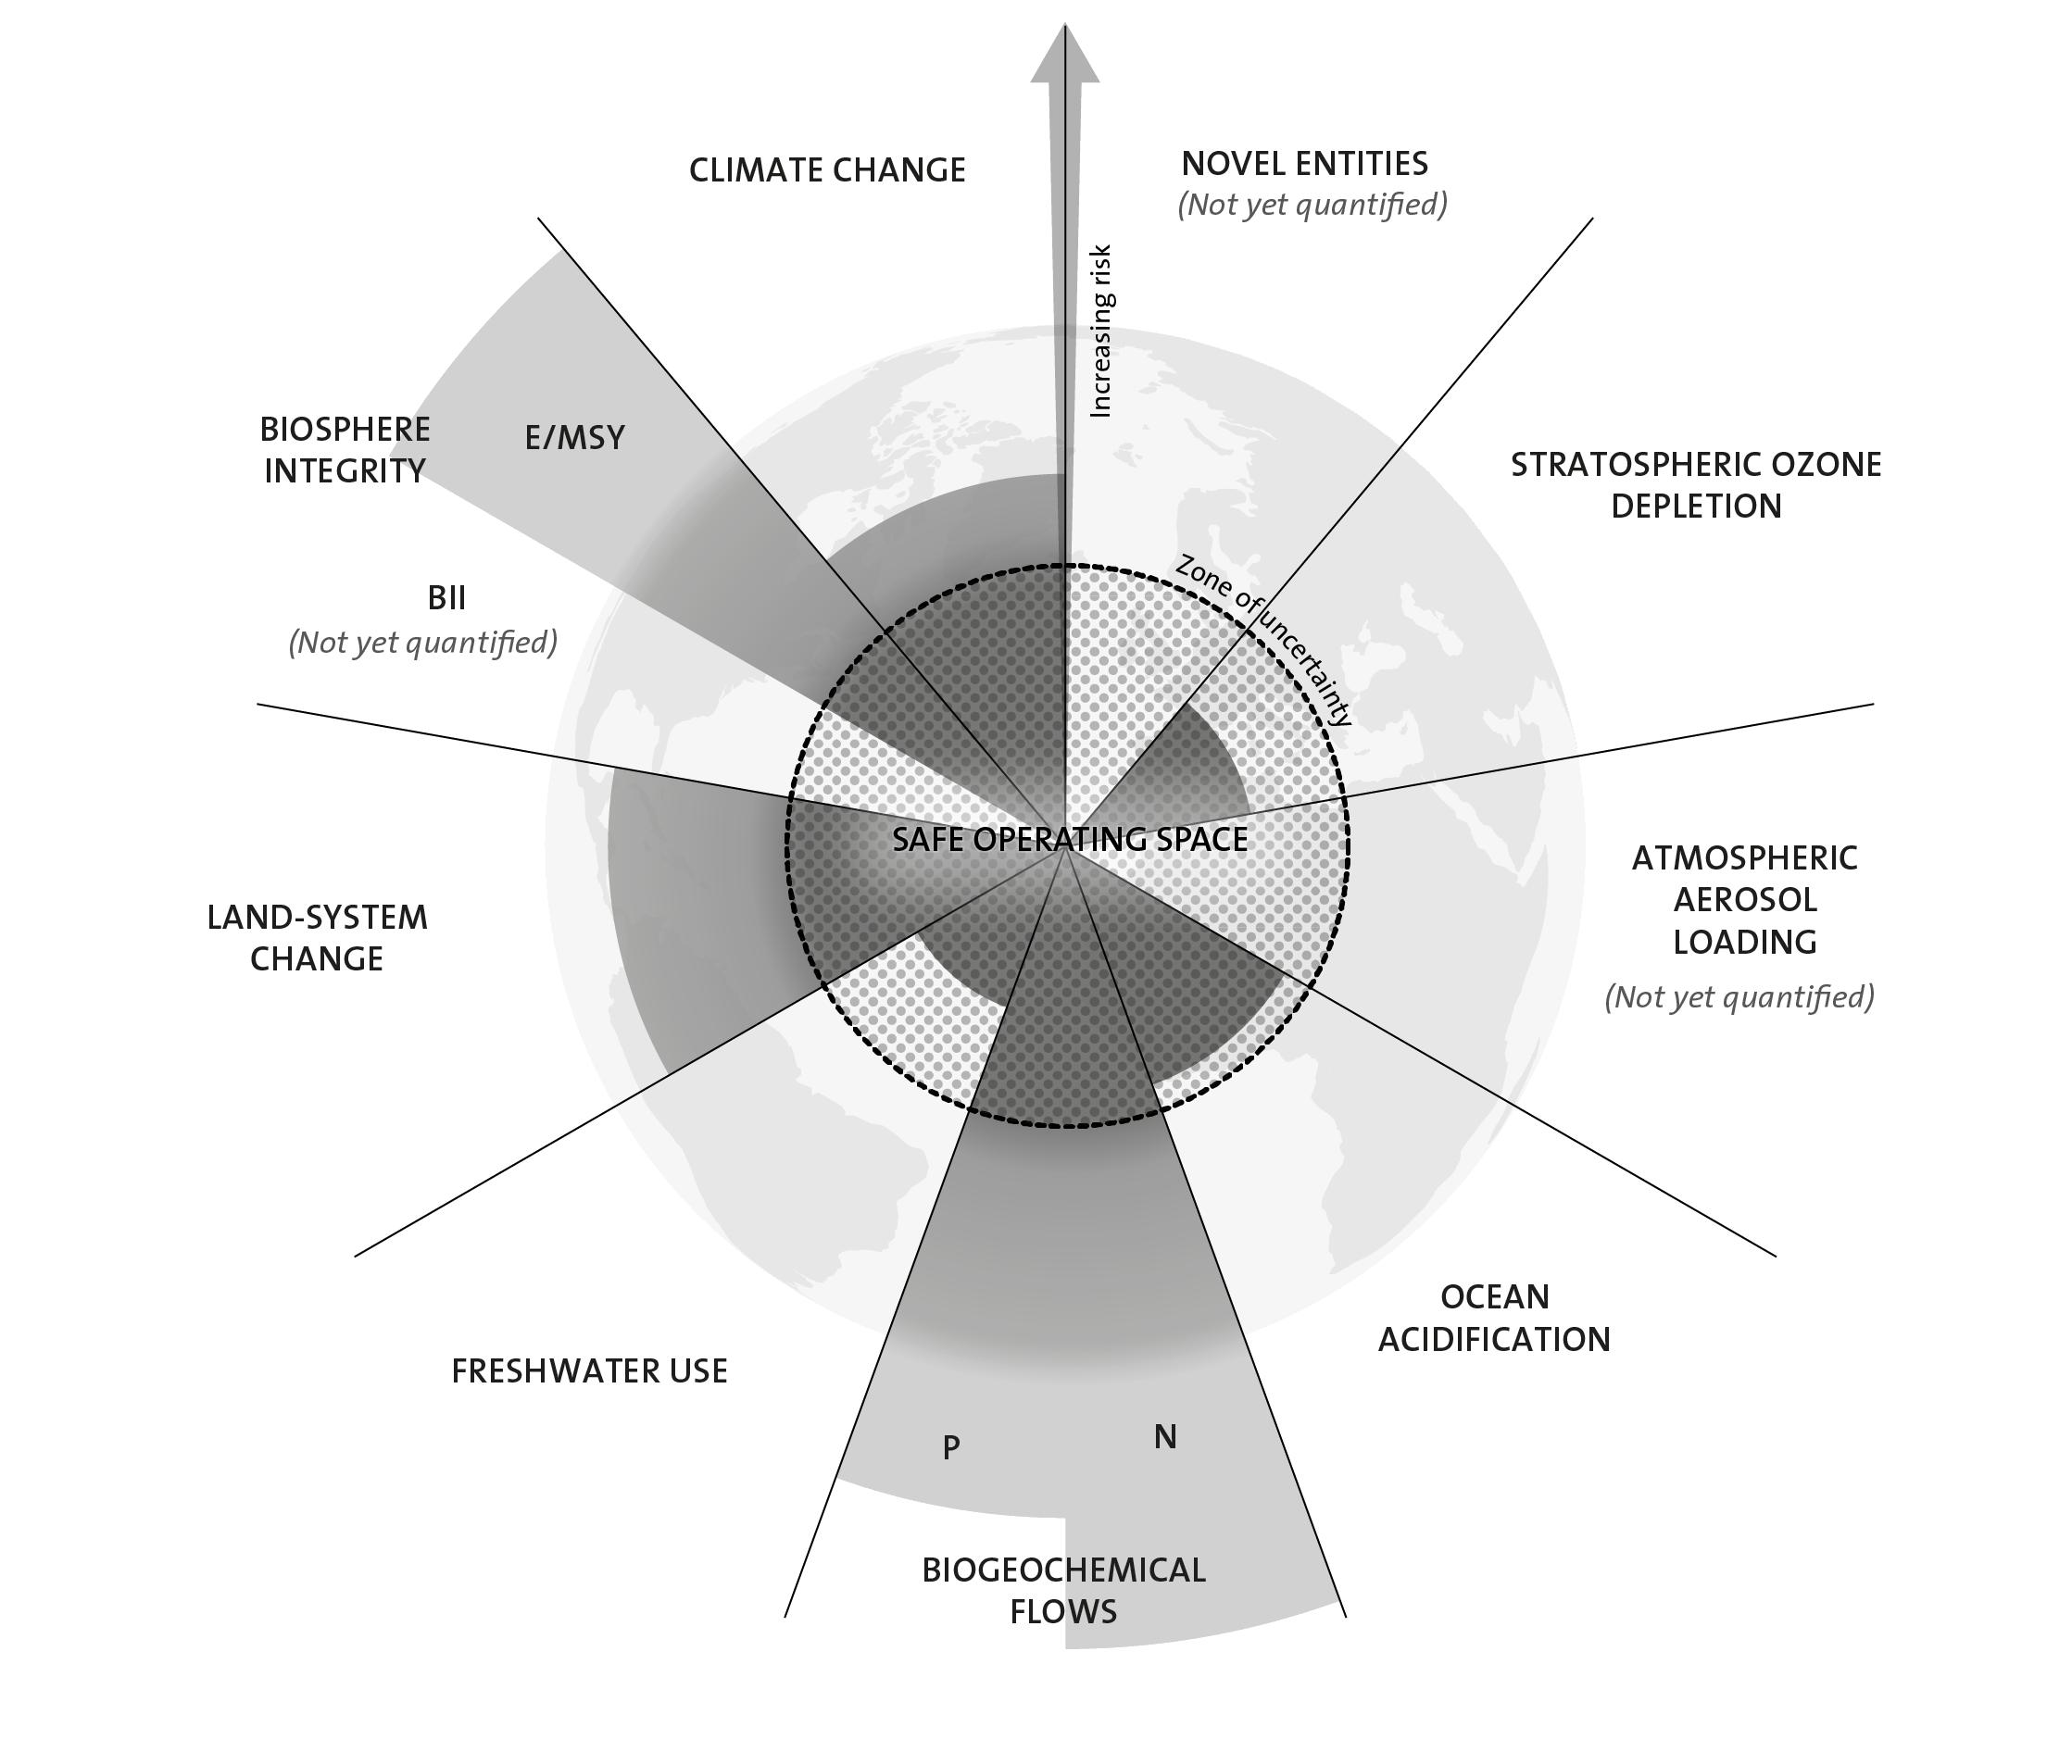
Climate researchers like Johan Rocktrom propose a holistic view of planetary boundaries to understand where we are over-reaching to evaluate the environmental risks associated with human activities.
Land-System Change
All over the planet, land is converted to better facilitate the extraction of raw materials. Forests, grasslands, wetlands, and other vegetation types have been converted, and this land-use change is one driving force behind the serious reductions in biodiversity. Also, it has significant impacts on water flows as well as the biogeochemical cycling of carbon, nitrogen, phosphorus, and other important elements. While each incident of land cover change occurs on a relatively local scale, the aggregated impacts can have consequences that manifest on a global scale. Applying Rockstrom’s planetary boundaries to land use change allows us to see that any potential boundary limiting land use must reflect not only the absolute quantity of land, but also its function, quality, and spatial distribution. Forests play a particularly important role in controlling the linked dynamics of land use and climate, and is the focus of the boundary for land system change.
Climate Change
Recent evidence suggests that the Earth, now passing 390 ppmv CO2 in the atmosphere, is rapidly bypassing Rockstrom’s planetary boundary and is potentially beyond the limit of several Earth system thresholds.10
We have reached a point at which the loss of summer polar sea-ice is almost certainly irreversible. This is one example of a well-defined threshold above which rapid physical feedback mechanisms can drive the Earth system into a much warmer state with sea levels metres higher than they presently are. The weakening or reversal of terrestrial carbon sinks, for example through the on-going destruction of the world’s rainforests, is another potential tipping point where climate-carbon feedback cycles accelerate Earth’s warming and intensify the climate impacts.
A major question is how long we can remain over this boundary before large, irreversible changes become unavoidable.
35.000 Million tonnes 30.000 25.000 20.000 15.000 10.000 5.000 1970 1980 1990 2000 2010 Years Railways Bricks Roads Building and infrastructure 35.000 Million tonnes 30.000 25.000 20.000 15.000 10.000 5.000 1970 1980 1990 2000 2010 Years Limestone Clay Sand Gravel 35.000 Million tonnes 30.000 25.000 20.000 15.000 10.000 5.000 1970 1980 1990 2000 2010 Years Railways Bricks Roads Building and infrastructure 35.000 Million tonnes 30.000 25.000 20.000 15.000 10.000 5.000 1970 1980 1990 2000 2010 Years Limestone Clay Sand Gravel Material Extraction
Club of Rome: Turn of the millenium Limits to Growth 28.6Gt 1972 2000 2016 2021 2050 Between Paris and Glasgow more than half a trillion tonnes of virgin materials were consumed. COP21 Paris COP26 Glasgow 101.4 Gt 1972-2050 170 Gt 89.9 Gt 54.9 Gt Projected with business as usual, material extraction is projected to surpass between 170 Gt and 184 Gt by 2050 VIRGIN MATERIAL EXTRACTION Source: The Circularity Gap Report 2022, Circle Economy(2022)
D aGraM 6. GLOBaL EXTraCTION OF NONMETaLLIC MINERALS BY TYPE, 1970-2010 byShenghanWang D aGraM 5. GLOBaL EXTraCTION OF NONMETaLLIC MINERALS BY SECTOR OF USE, 1970-2010 byShenghanWang
D aGraM 7. pLaNETarY BOuNDarIES D aGraM 8. VIRGIN MATERIAL EXTRACTION 1972-2050 19 18
APPENDIX II. UK SAND DEPOSITS, EXTRACTION, AND IMPACT
Material Consequences of Rapid Urbanization


One material in particular is a critical ingredient for urban development, sand. After water, sand is the world’s most consumed natural resource.11 It is a primary raw material used in the construction of roads, infrastructure, and buildings. Sand extraction has been rapidly increasing and the depletion of global sand reserves is a real problem. India has tripled its use of sand in construction since 2000, and China in the last ten years has consumed more sand than the US had throughout the 20th century.
The amount of sand each country imports is also correlated with their CO2 emissions. This makes it a useful metric for evaluating increasing development levels and their associated environmental costs.
The UK currently exports over 476 million tons of sand, with nearly 90% of these exports going to the European Union. UK imports of sand exceed 249 million tons with the largest imports coming from the European Union, specifically Denmark.12 Within the UK, sand extraction primarily occurs in two ways.
Offshore deposits are extracted by dredgers, large ships that scrape the seabed, before being offloaded at nearby wharfs.
On land, there are many sand and gravel mines spread across the UK, with over 56% of these mines operated by only three companies, Tarmac, CEMEX, and Hanson.13
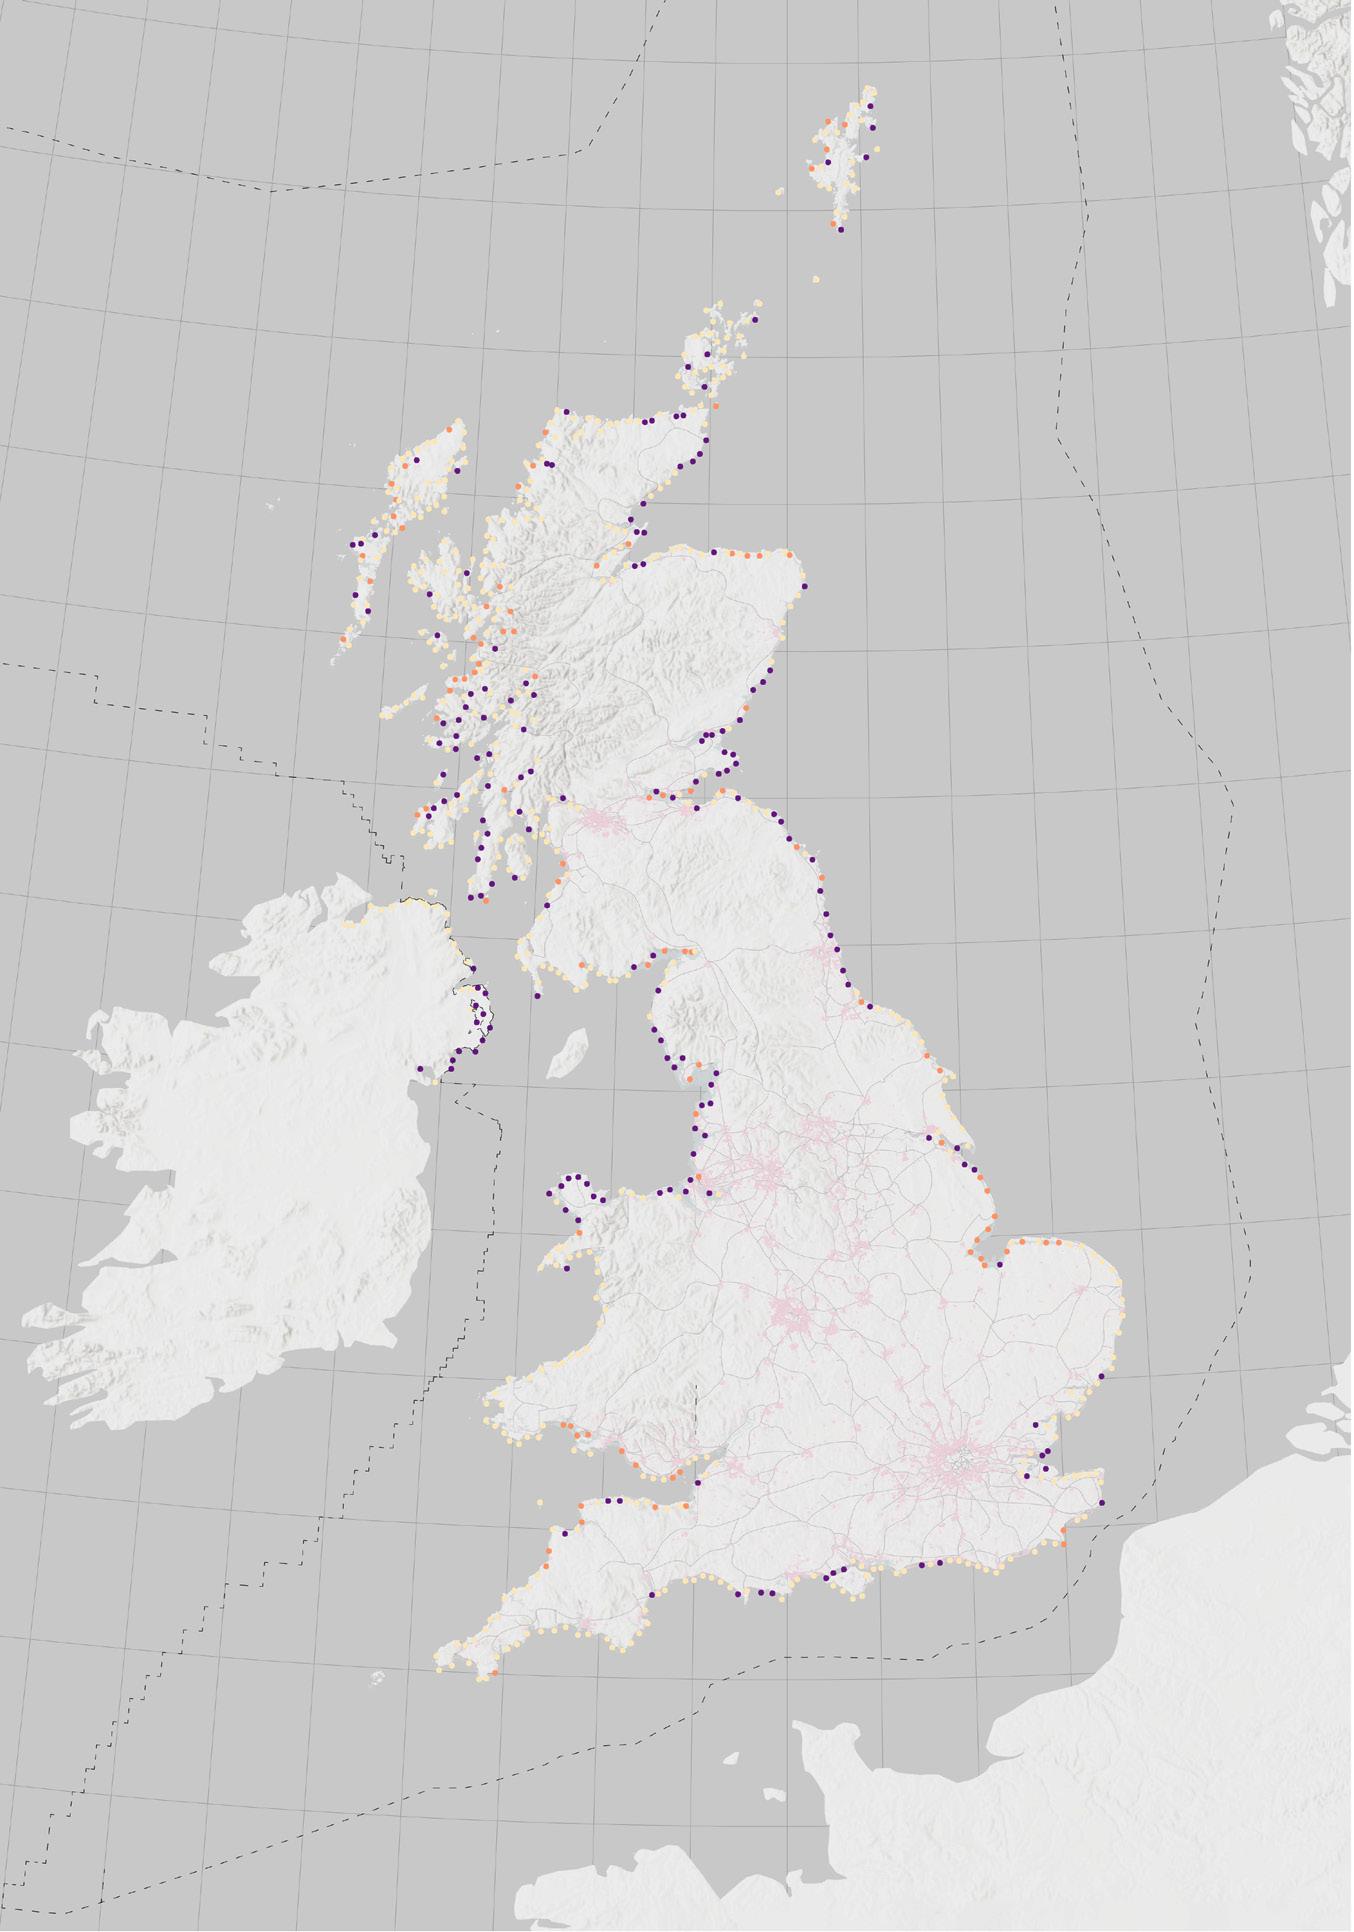
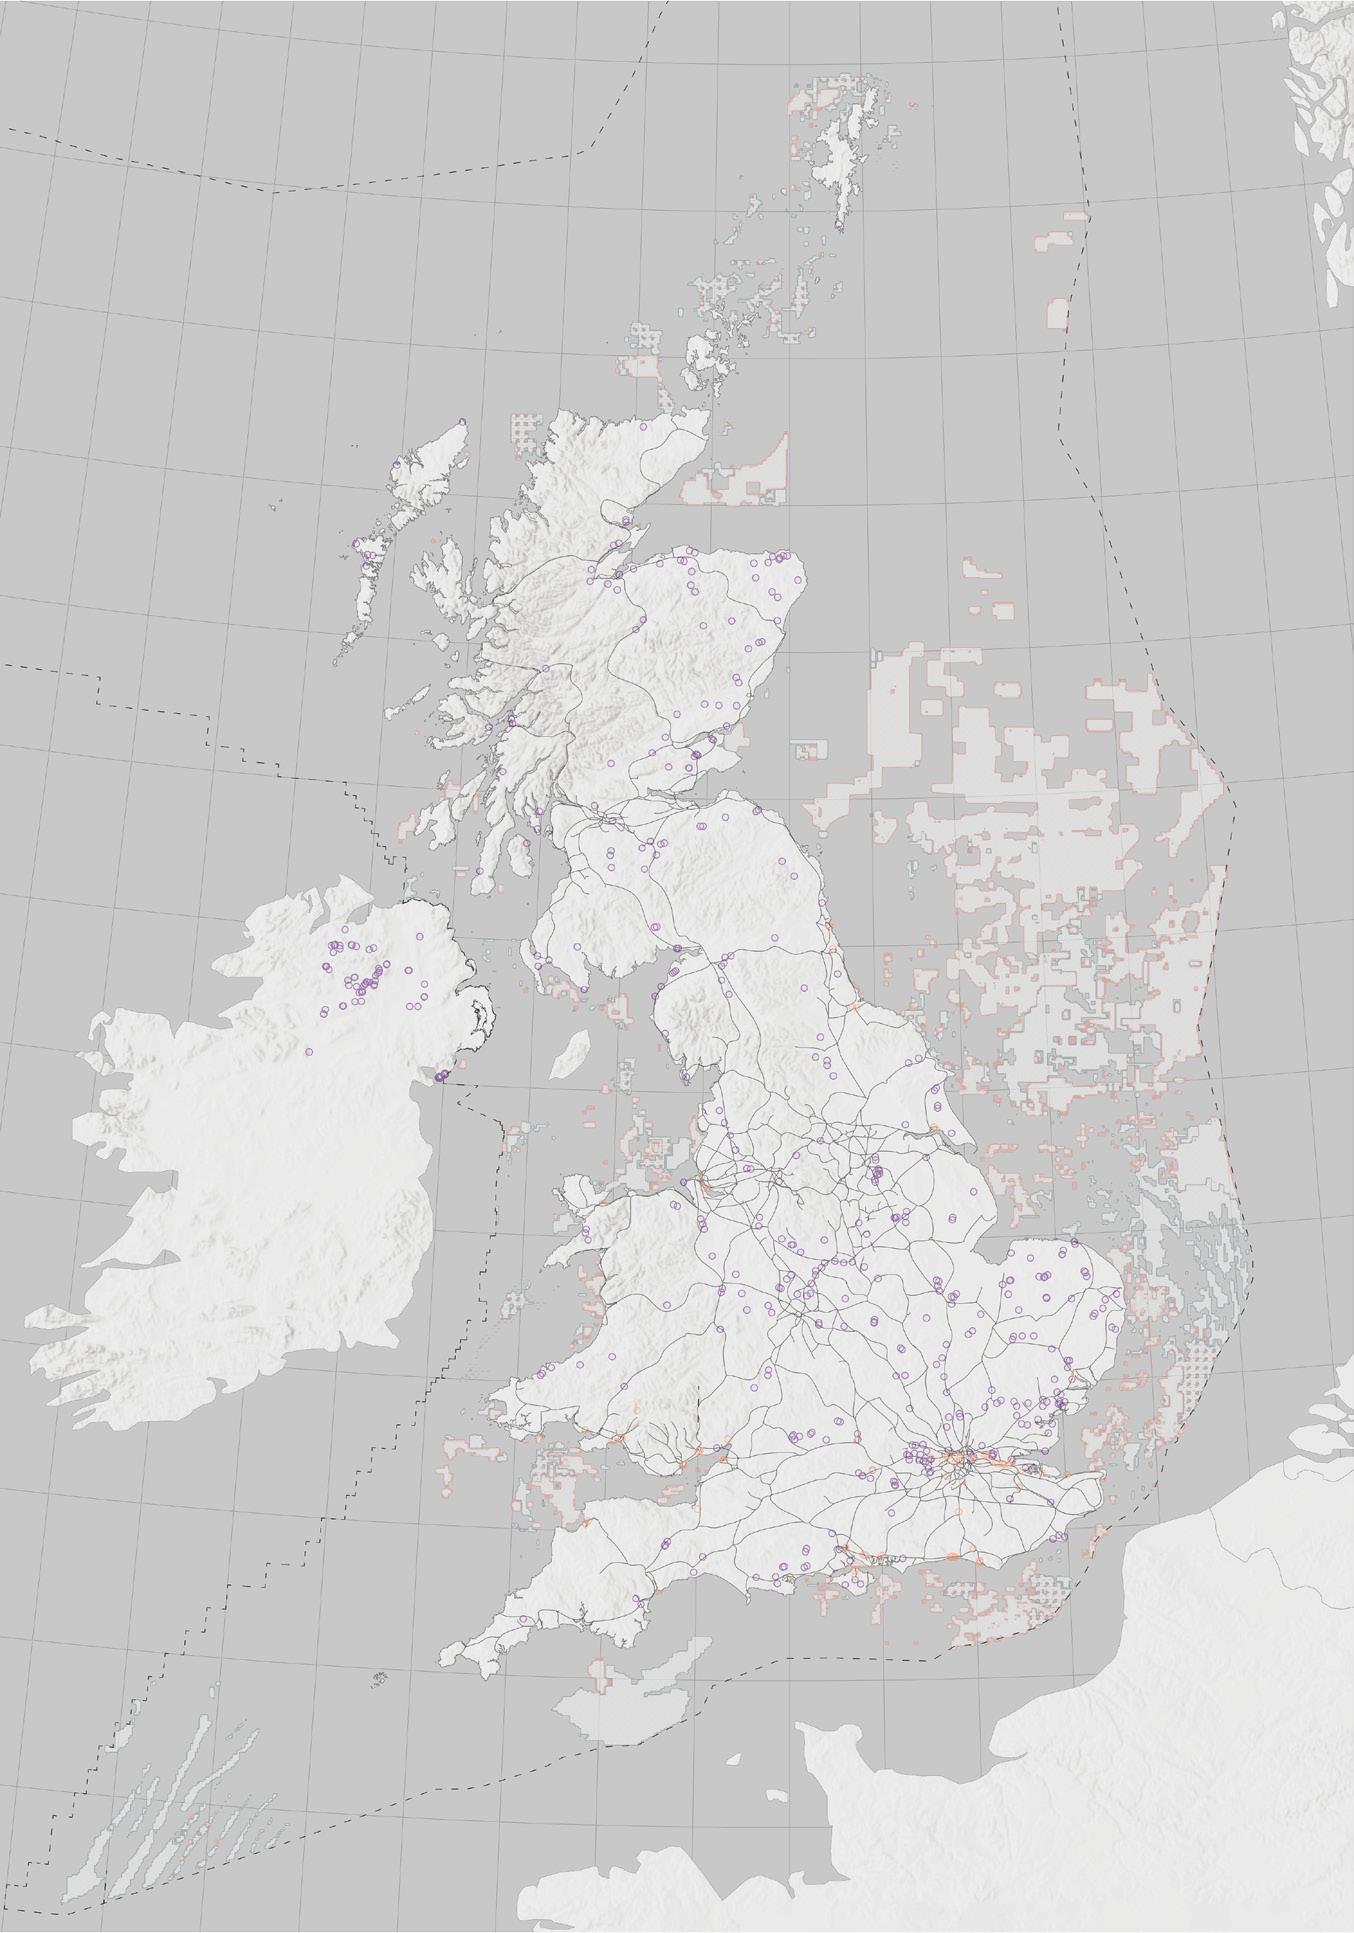
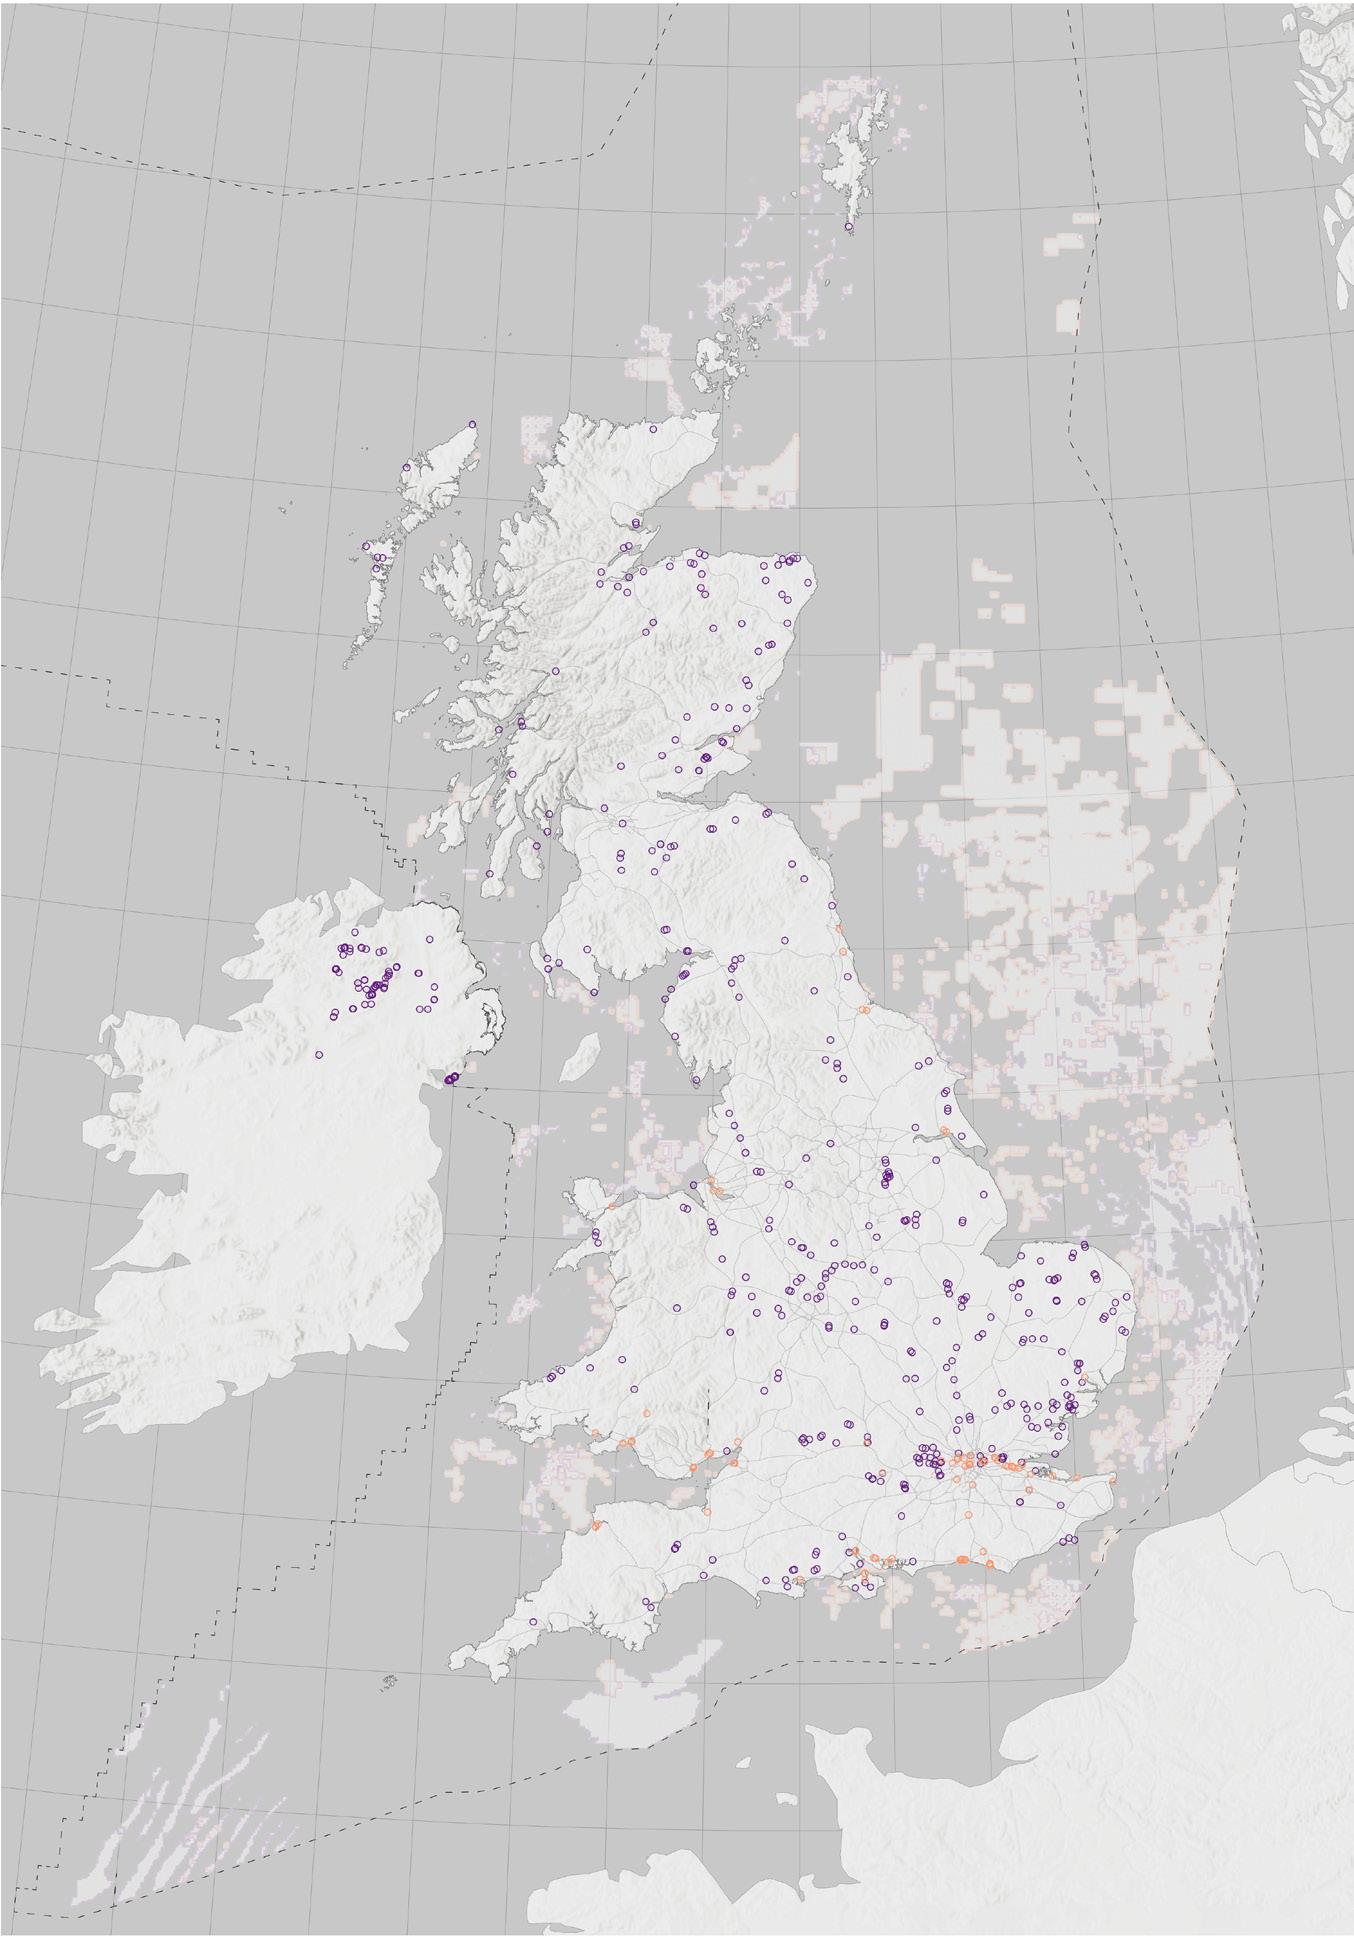


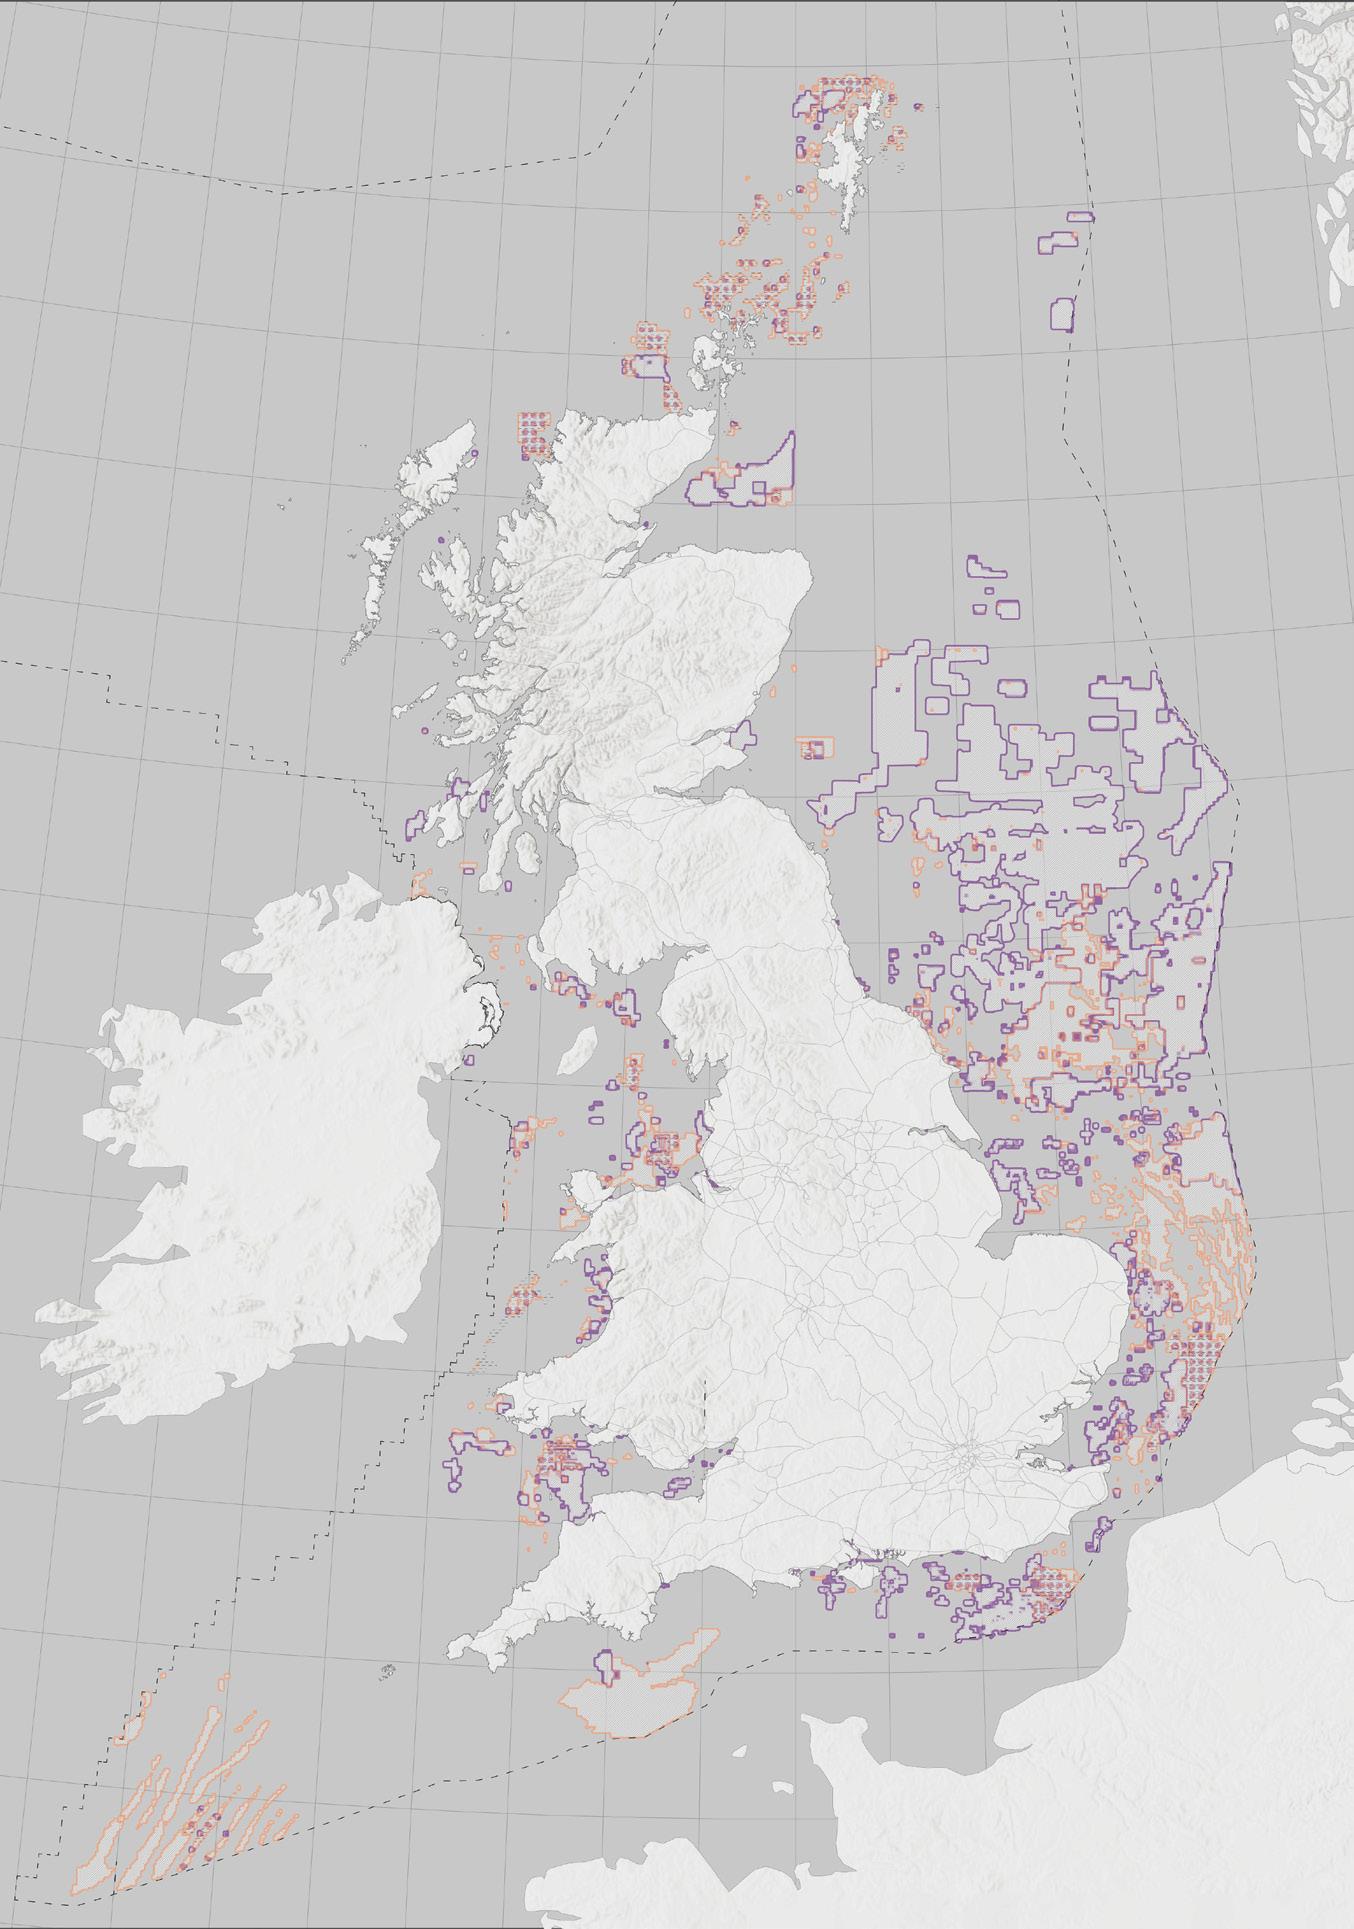
After extraction, this sand and gravel is then transported by road or rail to nearby construction sites or sent to material processing facilities such as concrete plants.
The offshore extraction of sand and gravel, in particular, has also greatly contributed to coastal erosion across the UK.
Coarse Fine sand Coarse sand Aggregates Marine Sand Mine and Quarries Transportation System Erosion Accretion Stable 4000 million tonnes 3000 2000 1000 CHINA NETHERLANDS UNITED STATES BELGIUM SINGAPORE GERMANY MACAO SWITZERLAND FRANCE COUNTRY 180 million tonnes 150 120 60 90 30 BELGIUM GERMANY IRELAND FRANCE NETHERLANDS CHINA THAILAND INDIA AZERBAIJAN COUNTRY 250 200 million tonnes 150 100 50 COUNTRY DENMARK NETHERLANDS GERMANY PORTUGAL NORWAY CHINA UNITED STATES FRANCE IRELAND tonnes 3000 2000 1000 CHINA NETHERLANDS UNITED STATES BELGIUM SINGAPORE GERMANY MACAO SWITZERLAND FRANCE COUNTRY 180 million tonnes 150 120 60 90 30 BELGIUM GERMANY IRELAND FRANCE NETHERLANDS CHINA THAILAND INDIA AZERBAIJAN COUNTRY 250 200 million tonnes 150 100 50 COUNTRY DENMARK NETHERLANDS GERMANY PORTUGAL NORWAY CHINA UNITED STATES FRANCE IRELAND 180 million tonnes 150 120 60 90 30 BELGIUM GERMANY IRELAND FRANCE NETHERLANDS CHINA THAILAND INDIA AZERBAIJAN COUNTRY 250 200 million tonnes 150 100 50 COUNTRY DENMARK NETHERLANDS GERMANY PORTUGAL NORWAY CHINA UNITED STATES FRANCE IRELAND
D aGraM 9. GLOBaL SaND IMpOrT 2019
Map 3. uK OFFSHOrE SaND EXTraCTION
byShenghanWangandBorjaRomeu byShenghanWangandBorjaRomeu Map 4. uK SaND MINES aND QuarrIES
byShenghanWang
Map 5. uK TraNSpOrTaTION NETWOrK Map 6. uK COaSTaL ErOSION
D aGraM 10. uK SaND EXpOrT 2019 D aGraM 11. uK SaND IMpOrT 2019 byShenghanWang byShenghanWang byShenghanWangandBorjaRomeu byShenghanWangandBorjaRomeu 21 20
UK LAND-USE CHANGE FROM 1990-2020
Material Consequences of Rapid Urbanization

One of the consequences of this increasing movement of people from rural to urban landscapes is an increase in urban land area. We see this trend throughout the UK as populations increase and more people have begin living in and around major cities.
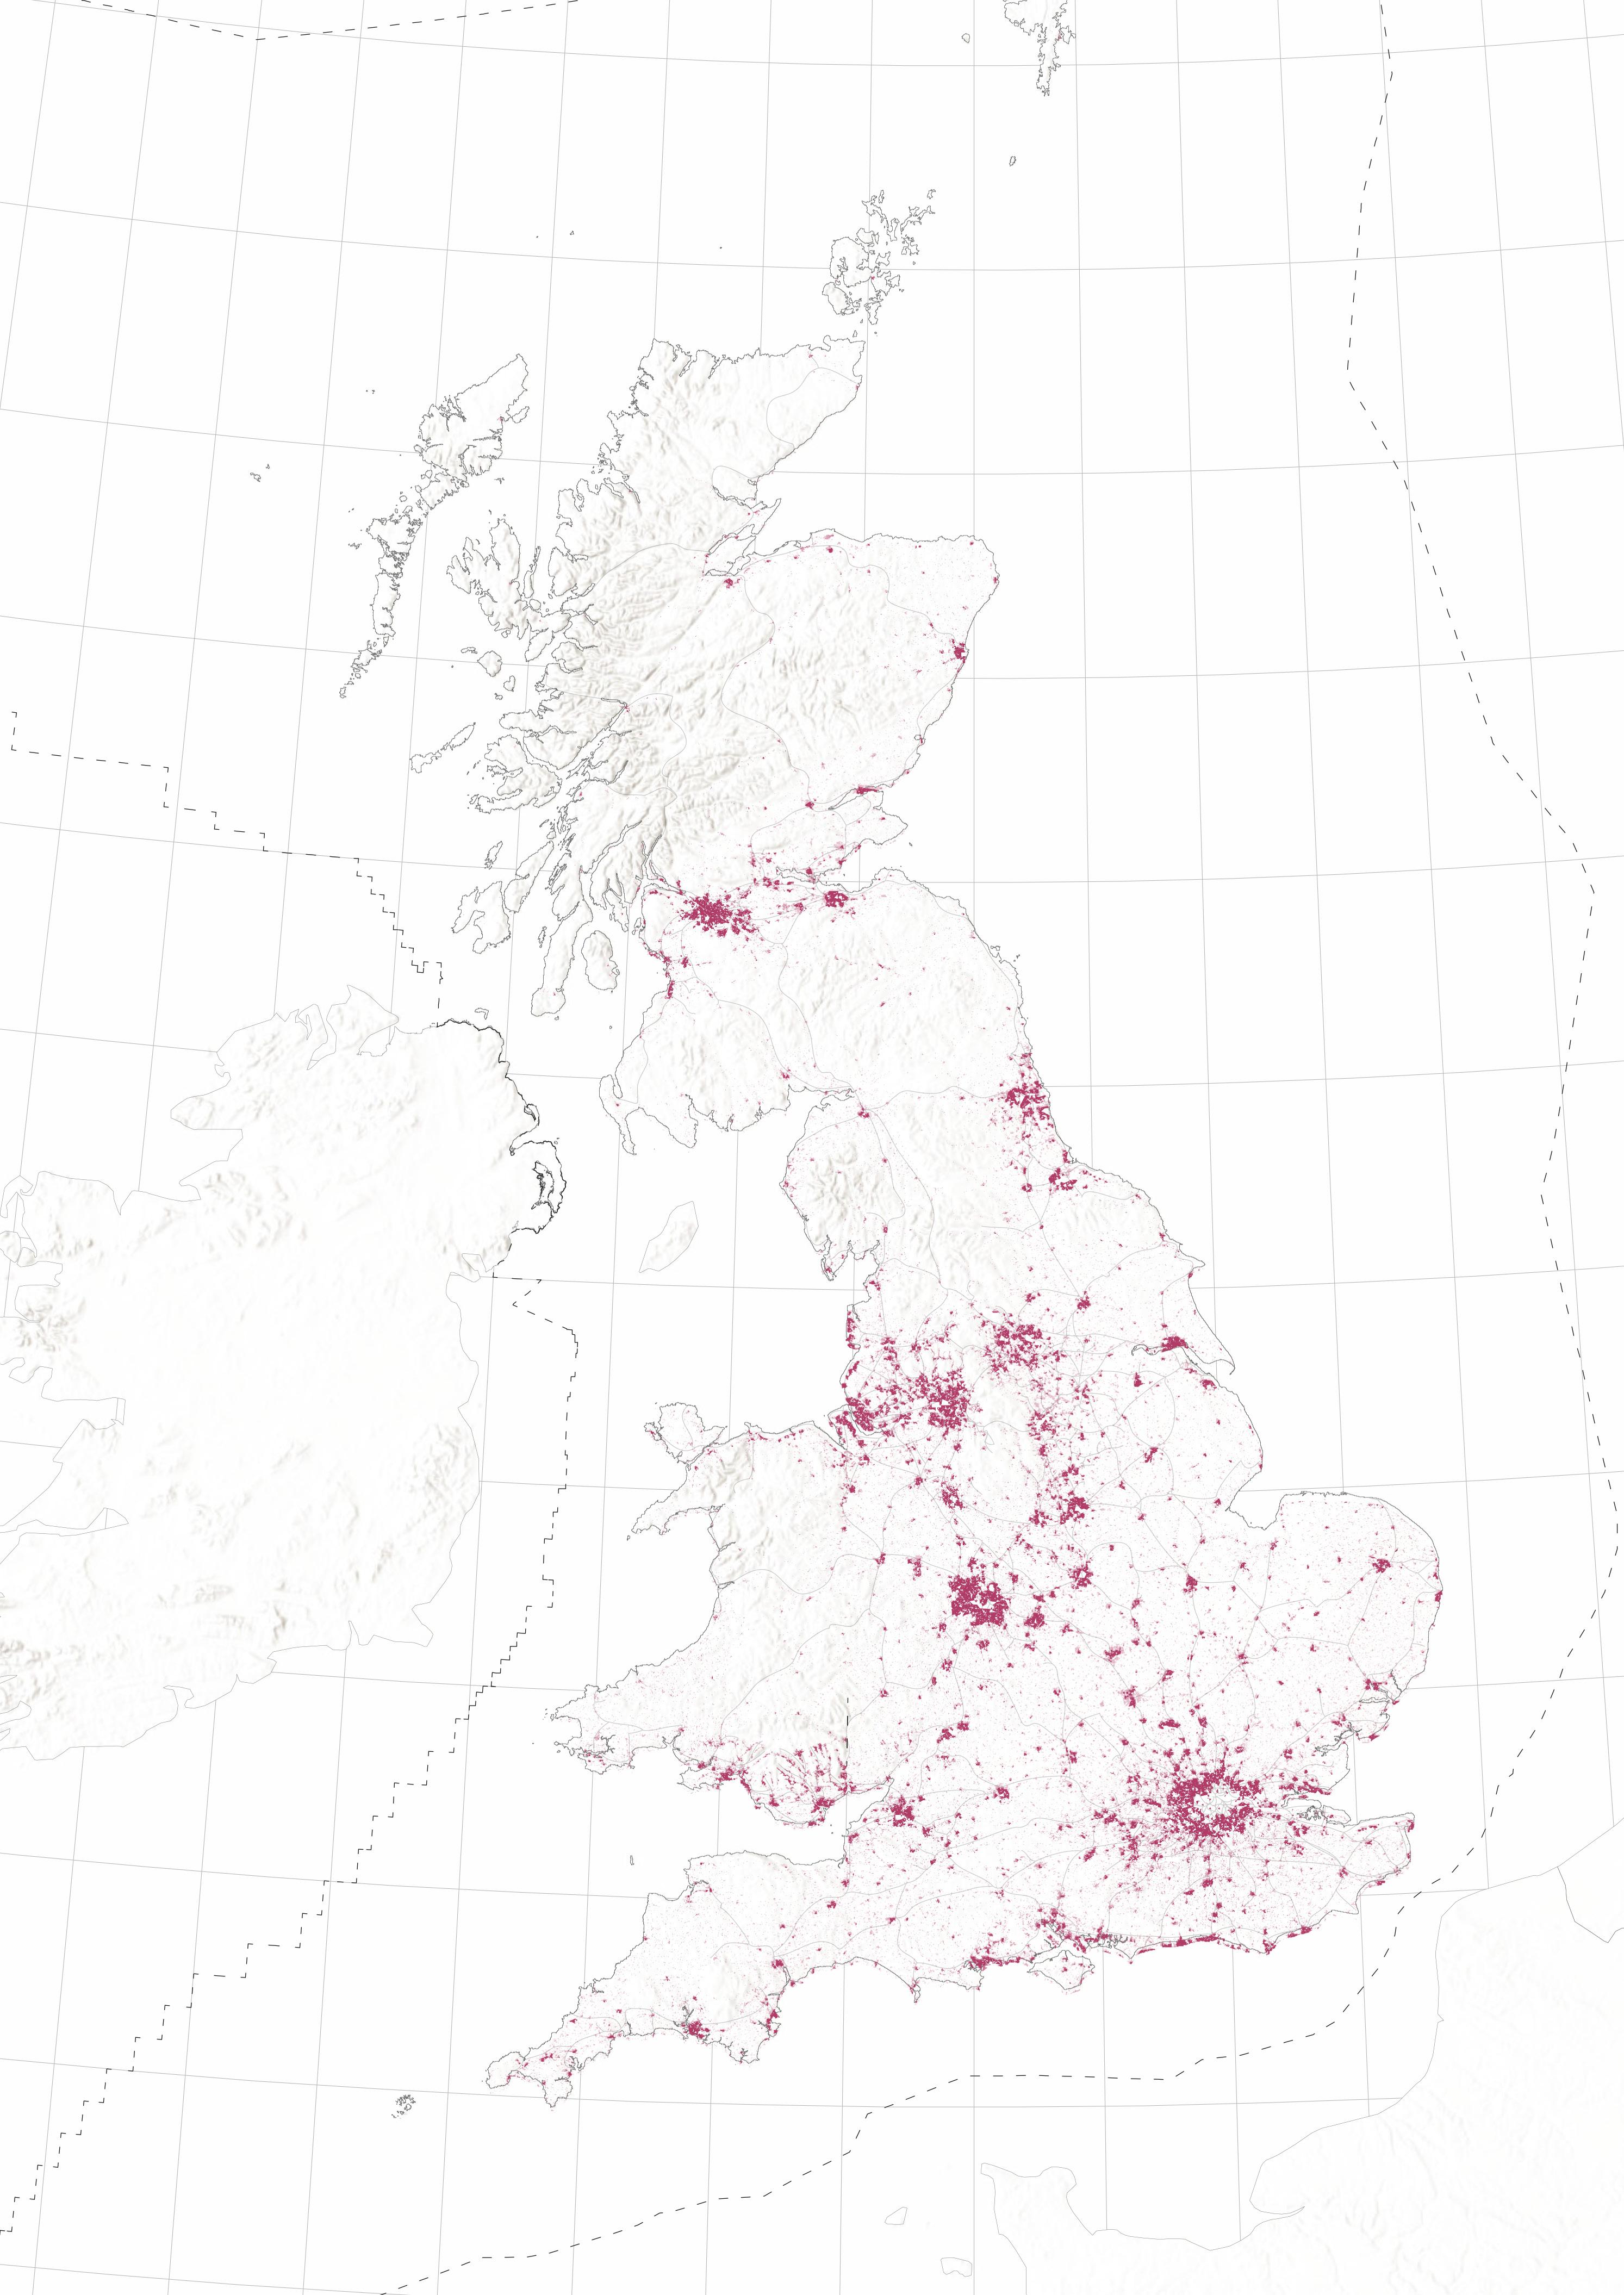
The map on the right visualizes the amount of land that has been converted into urban typologies over the past thirty years. Since 1990, over 18,000 square kilometers have become urban land, resulting in a loss of forests, grasslands, and vital agricultural land. This has resulted in a 34 percent increase in the amount of urban land area over this period.14
The rapid urbanization process has led to severe environmental consequences within UK as well as the hinterland due to the subsequent increase in material extraction to construct and supply cities.
urban area
D aGraM 12. uK LaND uSE CHaNGE DIaGraM byShenghanWang
byShenghanWang Map 7. uK LaND uSE CHaNGE URBAN URBAN 1990 2020 ARABLE ARABLE WOODLAND WOODLAND MOUNTAIN, HEATHER, BOG GRASSLAND GRASSLAND COASTAL COASTAL WATER WATER MOUNTAIN, HEATHER, BOG 23 22
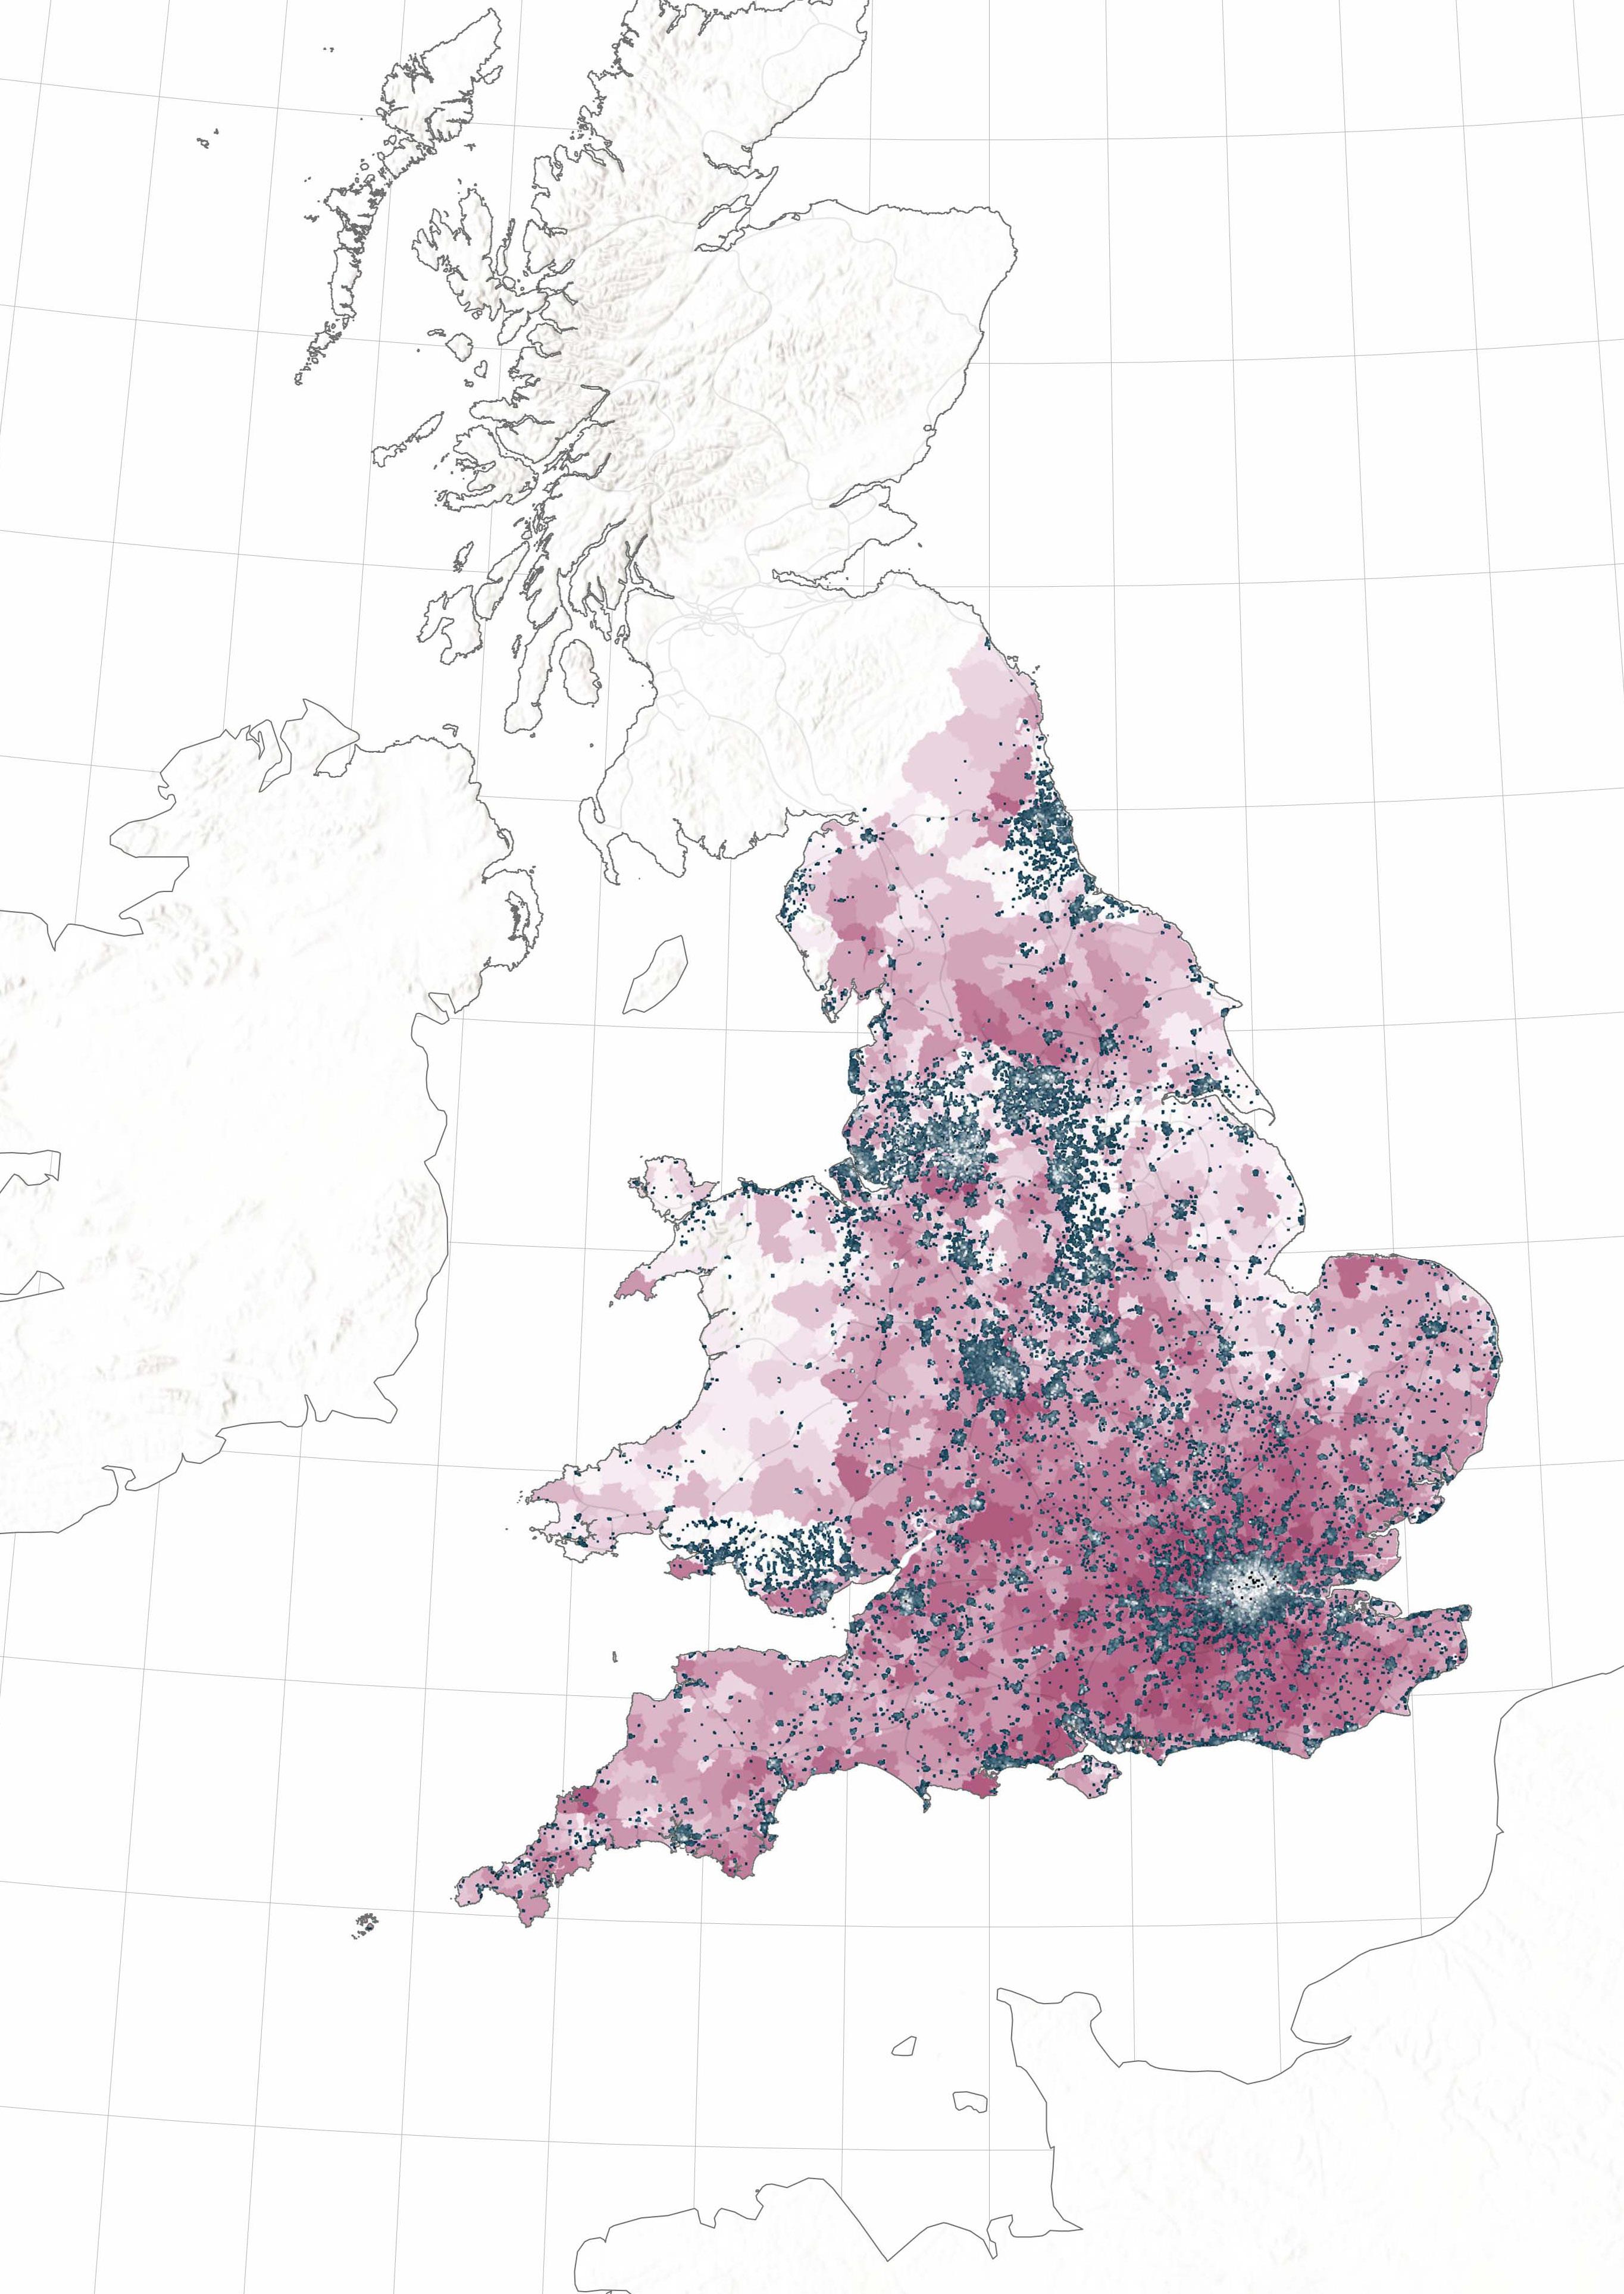
The effects of a runaway speculative housing market instigated by profit-driven development are already clear in large cities like London where increasing prices of land and property have pushed out lower income residents that cannot afford to live close to the city centre. From April 2003 to February 2016, home ownership in London has declined by 13.5%. Similar effects are being seen in cities like Liverpool, which has declined by 9.1% over the same period.15
With densification and rapidly increasing urban populations in a city like London, property speculation has spilled out into the surrounding countryside. The average home prices in nearly all of the south of England are directly correlated with their proximity to central London. This effect can be seen in other major cities, but in a city like Liverpool with a surplus of housing, the average property values are comparatively low.
The rate at which property values are increasing, however, is even more significant in Liverpool than it is in London. This phenomenon is likely attributable to the percention in property markets that housing prices should increase in urban areas regardless of supply.
LONDON PROPERTY PRICES +23.1% 2015 - 2020 LIVERPOOL PROPERTY PRICES +29.8% 2015 2020
ENGLAND £ 500.000 £ 450.000 £ 400.000 £ 350.000 £ 300.000 £ 250.000 £ 200.000 £ 150.000 £ 100.000 £ 50.000 £ 0 1975 1980 1970 LONDON ENGLAND UNITED KINGDOM WALES SCOTLAND NORTH IRELAND 1985 1990 1995 2000 2005 2010 2015 2020 byUKHousePriceIndex D aGraM 13. aVEraGE HOuSE prICE IN LONDON, uK aND NaTIONS
Map 8. uK HOuSING prICES aND pOpuLaTION byBradleyNissen £ 40.000 £ 2,759,000 25 24
HOUSING PRICE IN
Material Consequences of Rapid Urbanization
Statistics published by the Ministry of Housing, Communities and Local Government (MHCLG) put the number of empty homes in England in October 2019 at 648,114. This represents an increase of 2.2% on the previous year’s total. Of the 648,114, 225,845 are classified as empty homes with a duration of more than 6 months.16
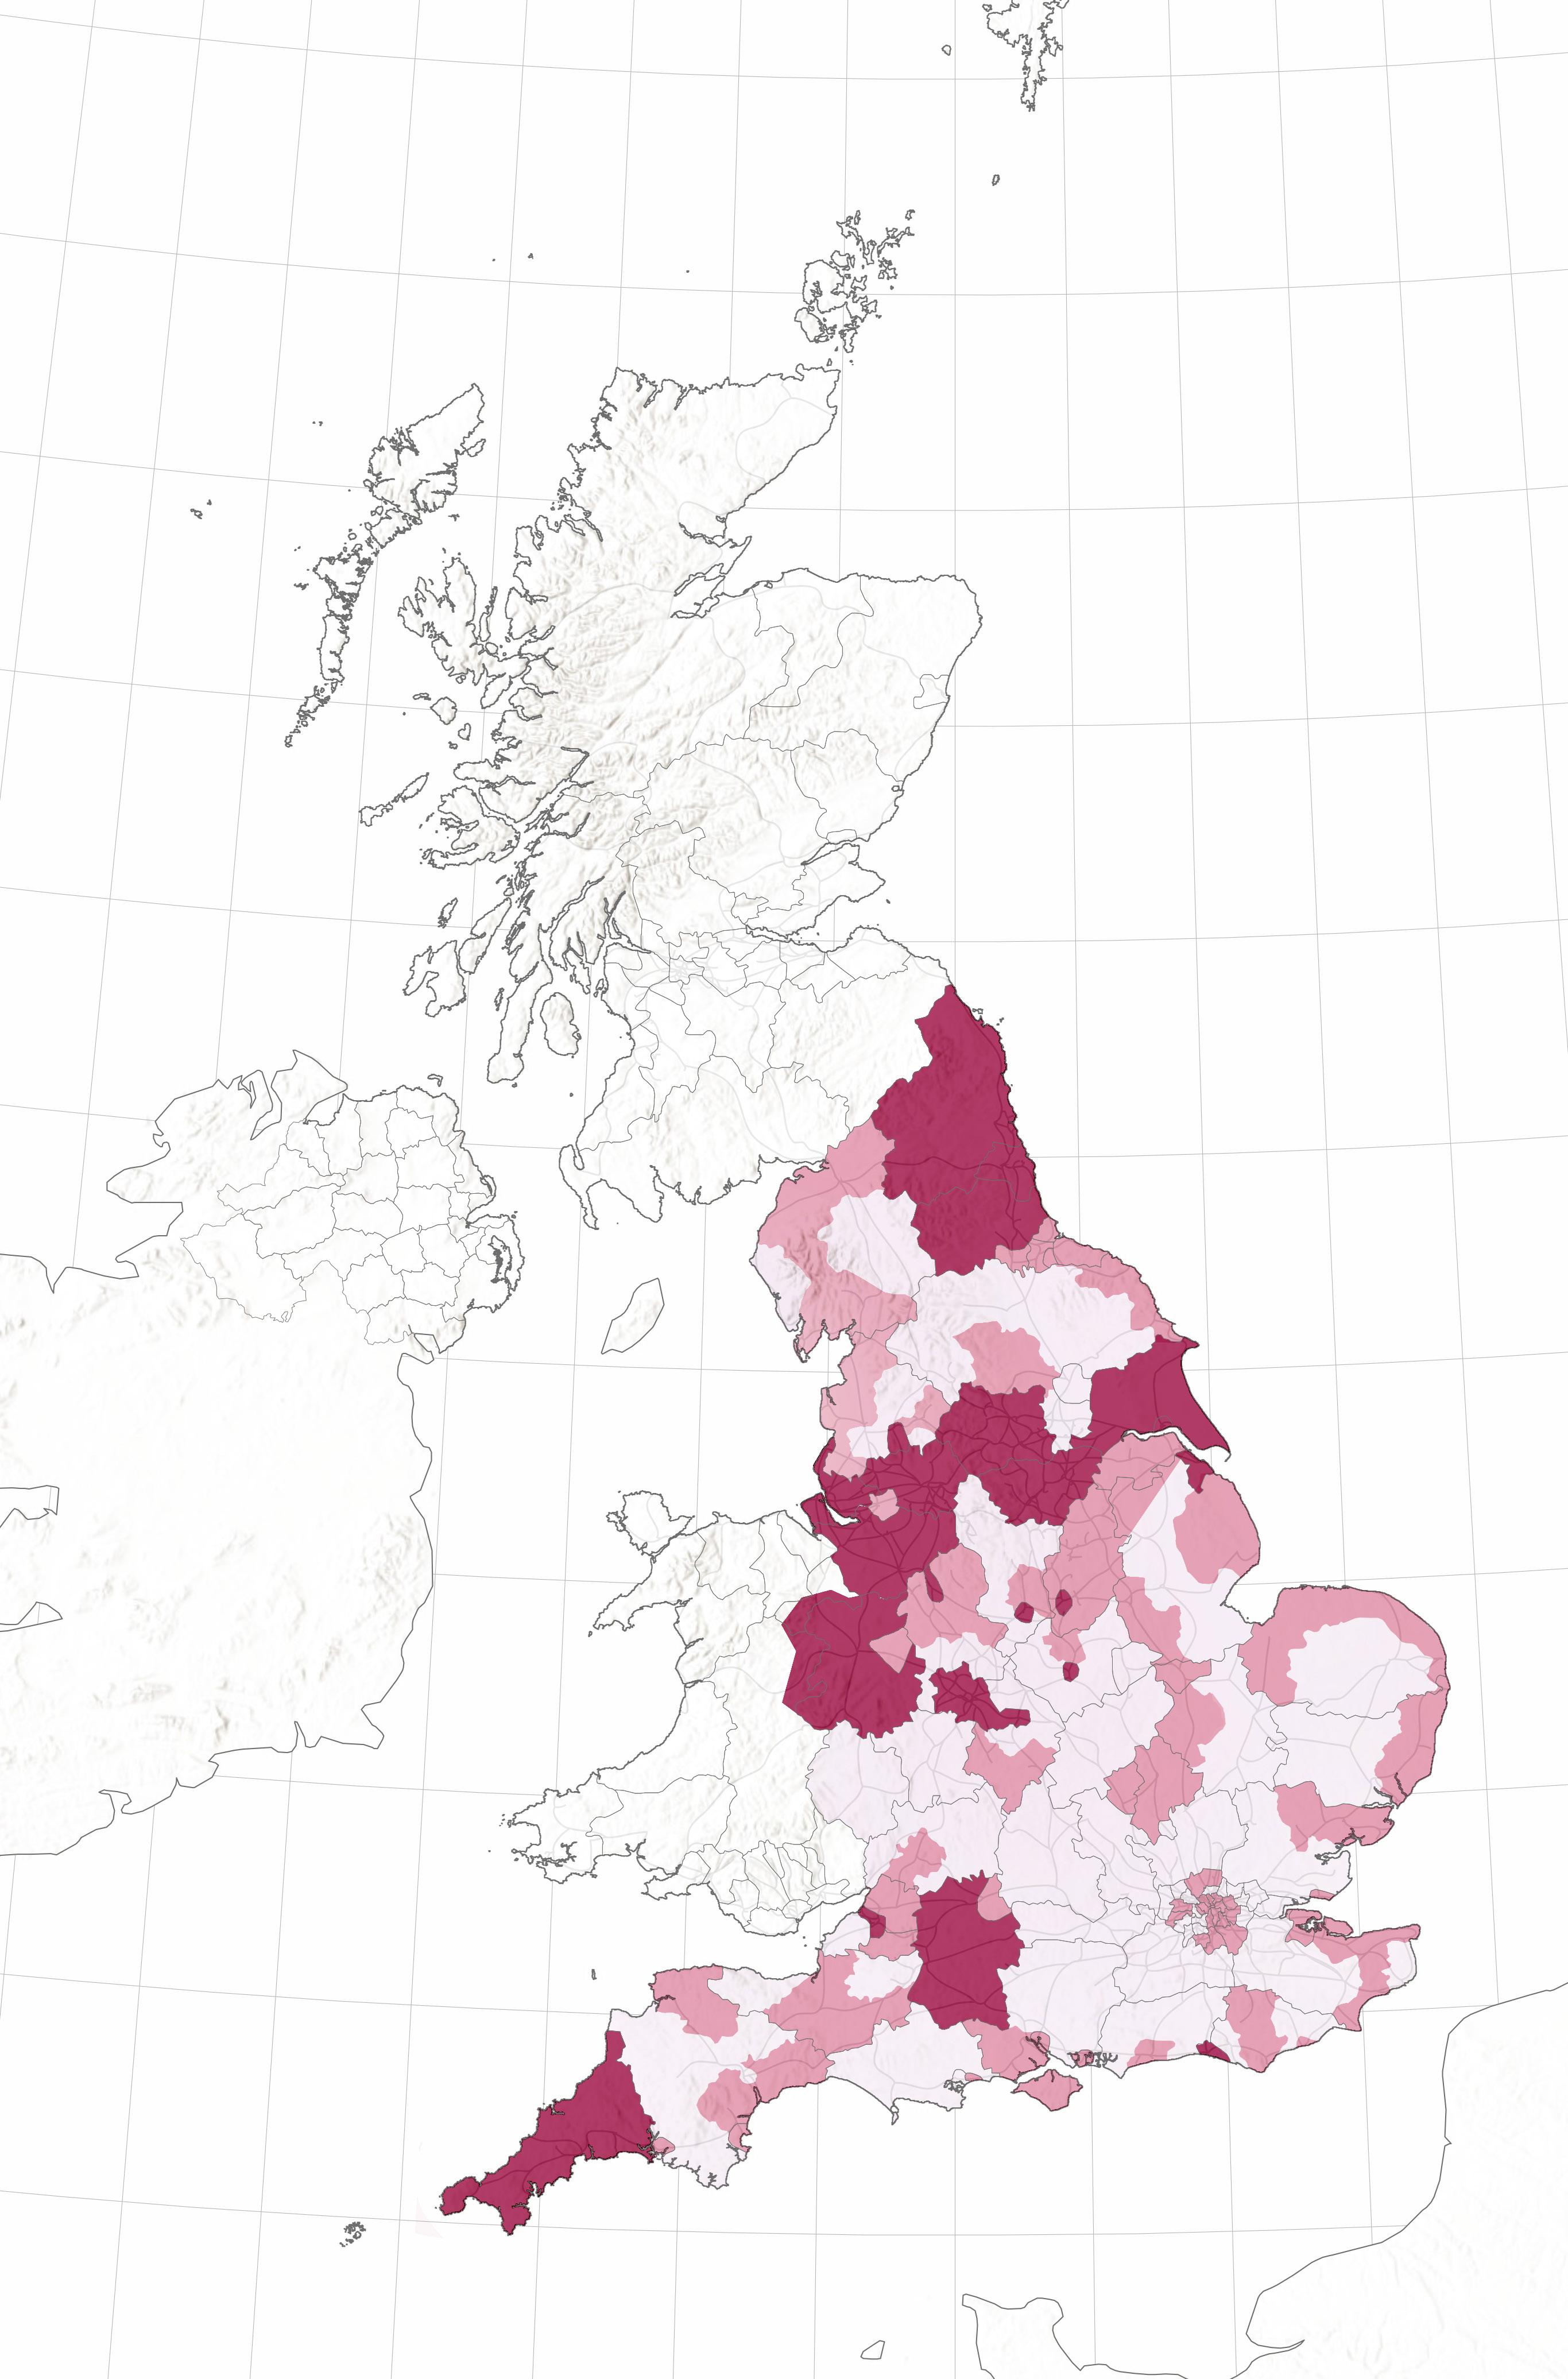
The Lancashire Yorkshire & Cheshire areas account for the highest number of empty homes. High levels of empty properties have a serious impact on the viability of communities by creating inequalities between communities and more deprived areas within the city.
This uneven dichotemy where property values increase alongside the number of empty homes is indicative of the neoliberal property market. These conditions are the precursers to the destruction of underfunded and therefore devalued neighborhoods. Gentrification by means of new developments soon follows. This further increases property values driving out local residents. In a world well within the throws of a climate crisis, policies and developments driven by profit motives will only exasterbate the demand for more materials and energy while producing unnecessary waste.
Material Consequences of Rapid Urbanization EMPTY HOUSES IN ENGLAND Up to 1,500 houses Between 15001 to 3000 houses 3,001 or more Map 9. VaCaNT HOuSES IN ENGLaND byBorjaRomeu
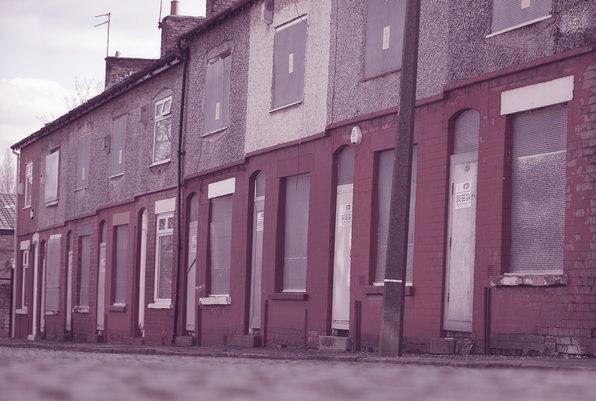
FIGurE 2. VaCaNT HOMES IN LIVErpOOL 27 26
Credits:ChristopherFurlong
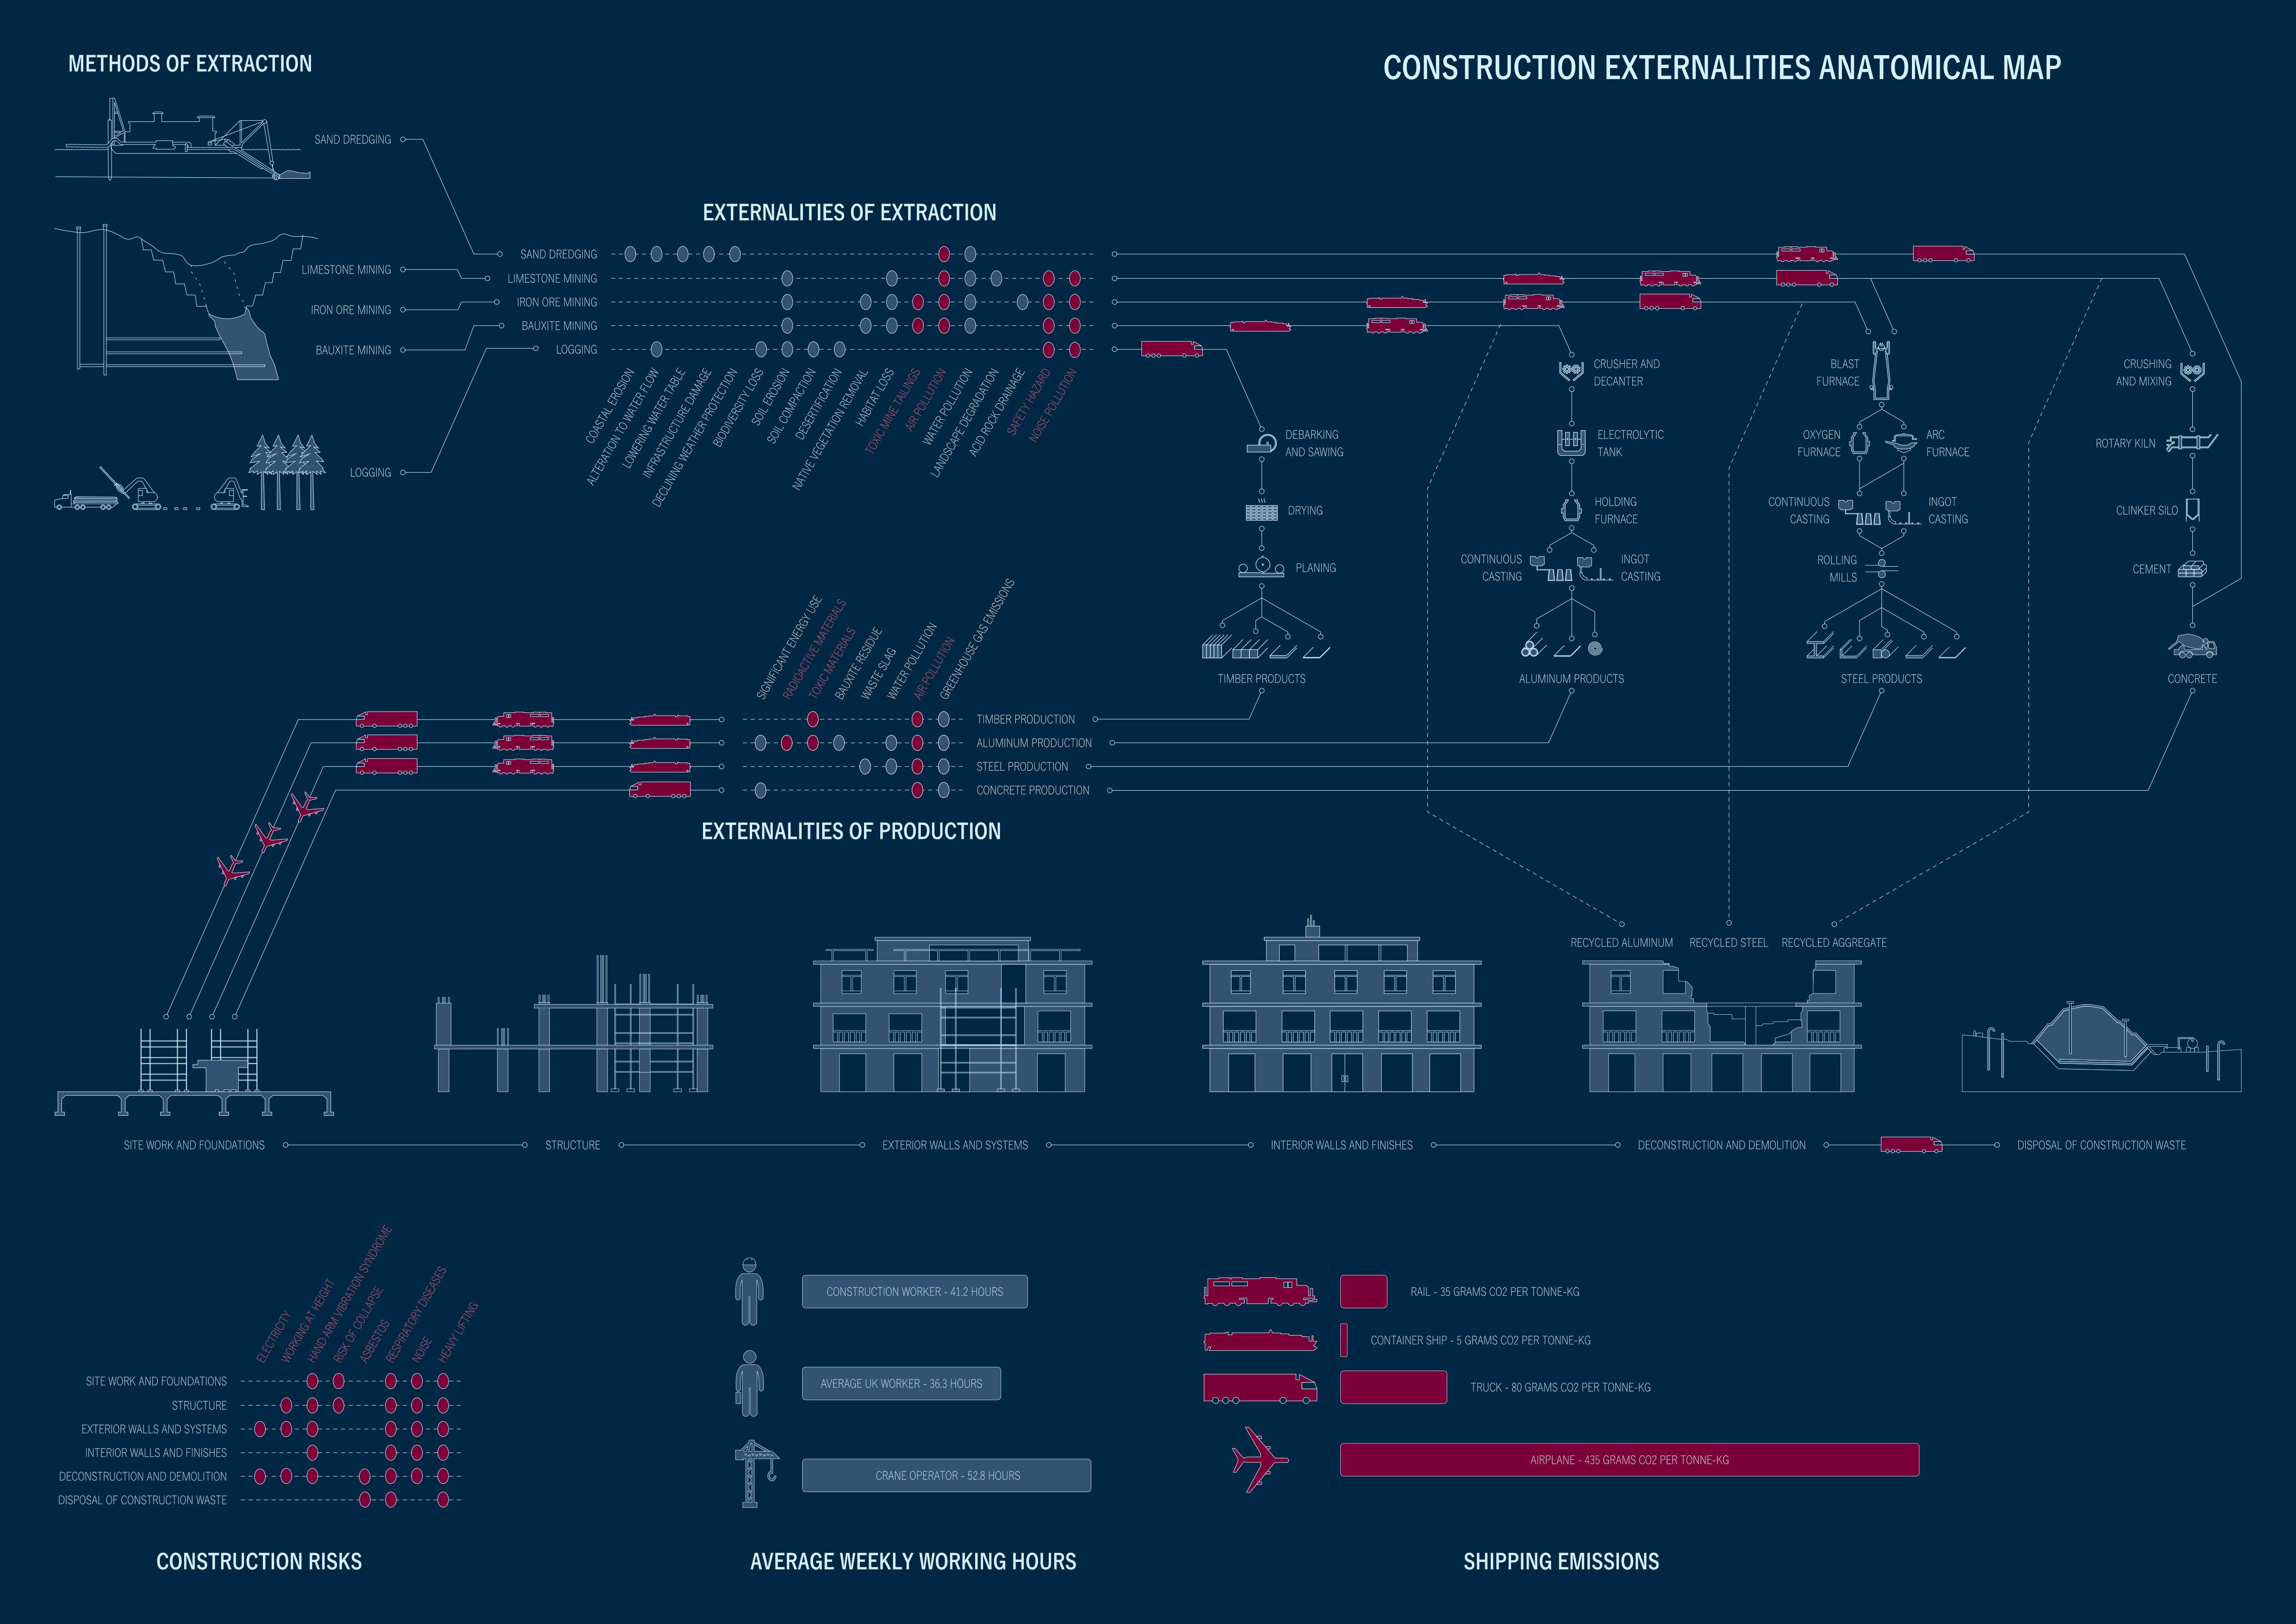
CONSTRUCTION EXTERNALITIES ANATOMICAL MAP
Material Consequences of Rapid Urbanization
The increasing demand for construction materials results in externalities at every stage from extraction of raw materials to the construction and demolition of buildings and infrastructure. Examples of this in the extraction stage include offshore sand dredging which destroys ecosystems and causes coastal erosion. Open pit mining for iron ore or bauxite produces toxic mine tailings. In these, the pink externalities are those that directly affect the workers responsible for the extraction of these raw materials.
The production stage is extremely energy intensive and harmful to workers and their local environments.
Many familiar construction materials such as steel beams require multiple complicated and potentially hazardous production steps between extraction and construction with many of these stages occuring at different locations. While the transportation of raw materials and building products is responsible for CO2 emissions, the emissions produced to refine raw materials and manipulate them into viable construction products typically takes even more energy.
During construction, workers are exposed to safety hazards, pollution, and longer than average working hours. Conditions such as hand-arm vibration syndrome are nearly unique to construction workers.
The construction industry was responsible for 39 percent of CO2 emissions in 2018 according to the IEA.17 Diagramming the other externalities associated with construction helps us to better understand all of its effects and underscores the importance of reducing raw material usage and unneccessary development.
Map 10. EXTraCTION EXTErNaLITIES byBradleyNissen Map 11. prODuCTION EXTErNaLITIES byBradleyNissen Map 12. CONSTruCTION EXTErNaLITIES byBradleyNissen Deconstructionand Demolition ConstructionWaste Disposal InteriorWallsand Finishes ExteriorWallsand Systems SiteWorkand Foundations Structure CONSTRUCTIONRISKS STAGESOFCONSTRUCTION ElectricityWorkingatHeightHandArmVibrationSyndromeRiskofCollapseAsbestosRespiratoryDiseases Noise HeavyLifting SiteWorkandFoundations DeconstructionandDemolition InteriorWallsandFinishes ExteriorWallsandSystems Structure DisposalofConstructionWaste ConstructionWorker 41.2hours Rail-35gramsCO2perTonne-KG ContainerShip-5gramsCO2perTonne-KG Truck-80gramsCO2perTonne-KG Airplane-435gramsCO2perTonne-KG AverageUKWorker 36.3hours CraneOperator 52.8hours SHIPPINGEMISSIONS AVERAGEWEEKLY WORKINGHOURS EXTERNALITIESOFEXTRACTION METHODSOFEXTRACTION SafetyHazardNoisePollution AlterationtoWaterFlow CoastalErosionLoweringWaterTableInfrastructureDamageDecliningWeatherProtectionBiodiversityLossSoilErosionSoilCompactionDesertificationNativeVegetationRemovalHabitatLossToxicMineTailingsAirPollutionWaterPollutionLandscapeDegradationAcidRockDrainage SandDredging Logging BauxiteMining IronOreMining LimestoneMining EXTERNALITIESOFPRODUCTION CONSTRUCTIONMATERIALPRODUCTION Blast Furnace Oxygen Furnace Continuous Casting Rolling Mills Arc Furnace Ingot Casting Steel Products Continuous Casting Holding Furnace Electrolytic Tank Crusherand Decanter Ingot Casting Aluminum Products Planing Drying Debarking andSawing Timber Products Clinker Silo Cement Rotary Kiln Crushing andMixing Concrete TimberProduction AluminumProduction SteelProduction ConcreteProduction RadioactiveMaterialsToxicMaterials AirPollution SignificantEnergyUse BauxiteResidueWasteSlagWaterPollution GreenhouseGasEmissions 29 28
31 30 Map 13. CONSTruCTION EXTErNaLITIES aNaTOMICaL Map byBradleyNissen Methods of Extraction CONSTRUCTION EXTERNALITIES ANATOMICAL MAP Material Consequences of Rapid Urbanization Externalities of Extraction Externalities of Production Construction Risks Average Weekly Working Hours Shipping Emissions Methods of Production
REFERENCES
1. Vegara, Alfonso. “Supercities: The Intelligence of the Territory.” MIPIM World Blog (blog), February 9, 2017. https://blog.mipimworld.com/ development/supercities-the-intelligence-of-theterritory/.
2. “68% Of the World Population Projected to Live in Urban Areas by 2050, Says Un | UN Desa Department of Economic and Social Affairs.” United Nations. United Nations, May 16, 2018. https://www. un.org/development/desa/en/news/population/2018revision-of-world-urbanization-prospects.html.
3. “SDG Indicators.” United Nations. United Nations. Accessed August 20, 2023. https://unstats. un.org/sdgs/report/2022/goal-11/.
“UN Chief Promotes ‘Enormous’ Benefits of Greener Cities | UN News.” United Nations. United Nations, October 3, 2021. https://news.un.org/en/ story/2021/10/1101992.
4. ONU Hábitat (2016). New Urban Agenda. www.habitat3.org/the-new-urban-agenda.
5. OECD (2018), Rethinking Urban Sprawl: Moving Towards Sustainable Cities, OECD Publishing, Paris, https://doi.org/10.1787/9789264189881-en.
6. Venditti, Bruno, and Christina Kostandi. The Material Impact of Global Urbanization. April 20, 2022. Elements. https://elements.visualcapitalist. com/visualizing-the-material-impact-of-globalurbanization/.
7. Reportlinker. (2018, June 27). Growth opportunities in the global construction industry. Growth Opportunities in the Global Construction Industry. Retrieved September 21, 2022, from https://www.prnewswire.com/news-releases/ growth-opportunities-in-the-global-constructionindustry-300624512.html
8. Environment, U. N. (2019, December 11). 2019 global status report for buildings and construction sector. UNEP. Retrieved September 21, 2022, from https://www.unep.org/resources/publication/2019global-status-report-buildings-and-constructionsector.
9. Rockström, J., W. Steffen, K. Noone, Å. Persson, F. S. Chapin, III, E. Lambin, T. M. Lenton, M. Scheffer, C. Folke, H. Schellnhuber, B. Nykvist, C. A. De Wit, T. Hughes, S. van der Leeuw, H. Rodhe, S. Sörlin, P. K. Snyder, R. Costanza, U. Svedin, M. Falkenmark, L. Karlberg, R. W. Corell, V. J. Fabry, J. Hansen, B. Walker, D. Liverman, K. Richardson, P. Crutzen, and J. Foley. 2009. Planetary boundaries:exploring the safe operating space for humanity. Ecology and Society
14(2): 32. [online] URL: http://www.ecologyandsociety. org/vol14/iss2/art32/
10. “390 Ppm CO2 Reported by Atmospheric Monitoring Station in Norway.” Green Car Congress, February 13, 2009. https://www.greencarcongress. com/2009/02/390-ppm-co2-rep.html.
11. Beiser, Vince. “Why the World Is Running out of Sand.” BBC Future. BBC, November 18, 2019. https://www.bbc.com/future/article/20191108-whythe-world-is-running-out-of-sand.
12. AJG Simoes, CA Hidalgo. The Economic Complexity Observatory: An Analytical Tool for Understanding the Dynamics of Economic Development. Workshops at the Twenty-Fifth AAAI Conference on Artificial Intelligence. (2011)
13. Cameron, D G, E J Evans, N Idoine, J Mankelow, S F Parry, M A G Patton, A Hill, T C Pharaoh, and J Ford. “Directory of Mines and Quarries, 2020.” Keyworth, Nottingham: British Geological Sur-vey, 2020.
14. Morton, R. D.; Marston, C. G,; O’Neil, A. W.; Rowland, C. S. (2020). Land Cover Map 2019 (land parcels, GB). NERC Environmental Information Data Centre. https://doi.org/10.5285/44c23778-4a73-4a8f875f-89b23b91ecf8
15. Parry, Josh. “Is Liverpool Heading for a London-Style Housing Crisis?” Liverpool Echo, September 1, 2016. https://www.liverpoolecho.co.uk/ news/liverpool-news/liverpool-heading-londonstyle-housing-11695462.
16. Wilson, Wendy, Hannah Cromarty, and Cassie Barton. Rep. Empty Housing (England), 2020.
17. IEA (2018), 2018 Global Status Report, IEA, Paris https://www.iea.org/reports/2018-globalstatus-report, License: CC BY 4.0
33 32
02 LIVERPOOL, THE NEOLIBERAL CITY
02.1 MANAGE DECLINE POLICY
02.2 HOUSING MARKET RENEWAL INITIATIVE POLICY
02.3 ONE POUND HOUSE POLICY
02.4 POLICY CONSEQUENCE - OVERSEA INVESTMENT
02.5 CURRENT LIVERPOOL CITY CENTRE DEVELOPMENT
02.6 A TYPICAL HIGH-RISE DEVELOPMENT: THE LEXINGTON
02.7 REFERENCES
CHAPTER 2 35
MANAGED DECLINE

Liverpool, The Neoliberal City
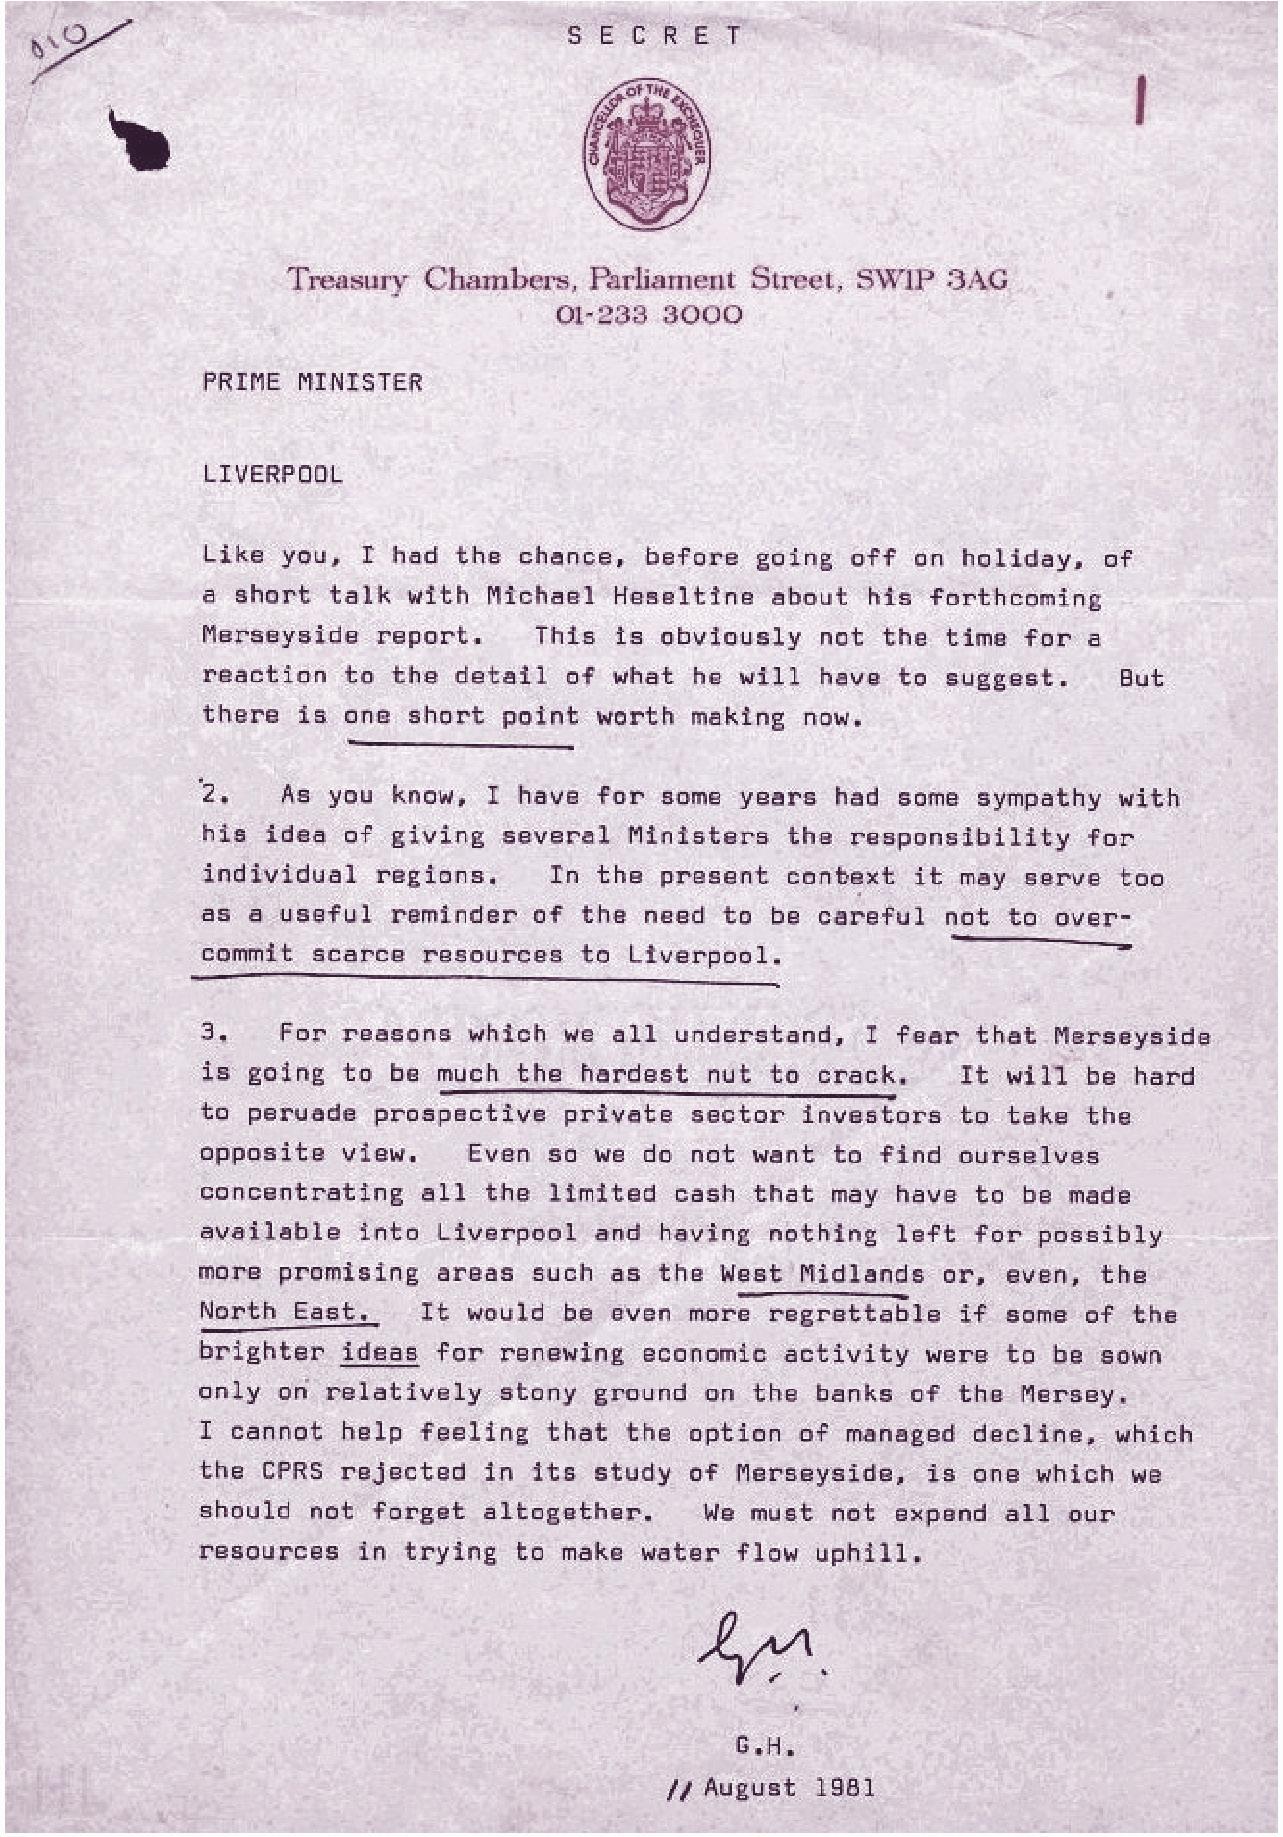
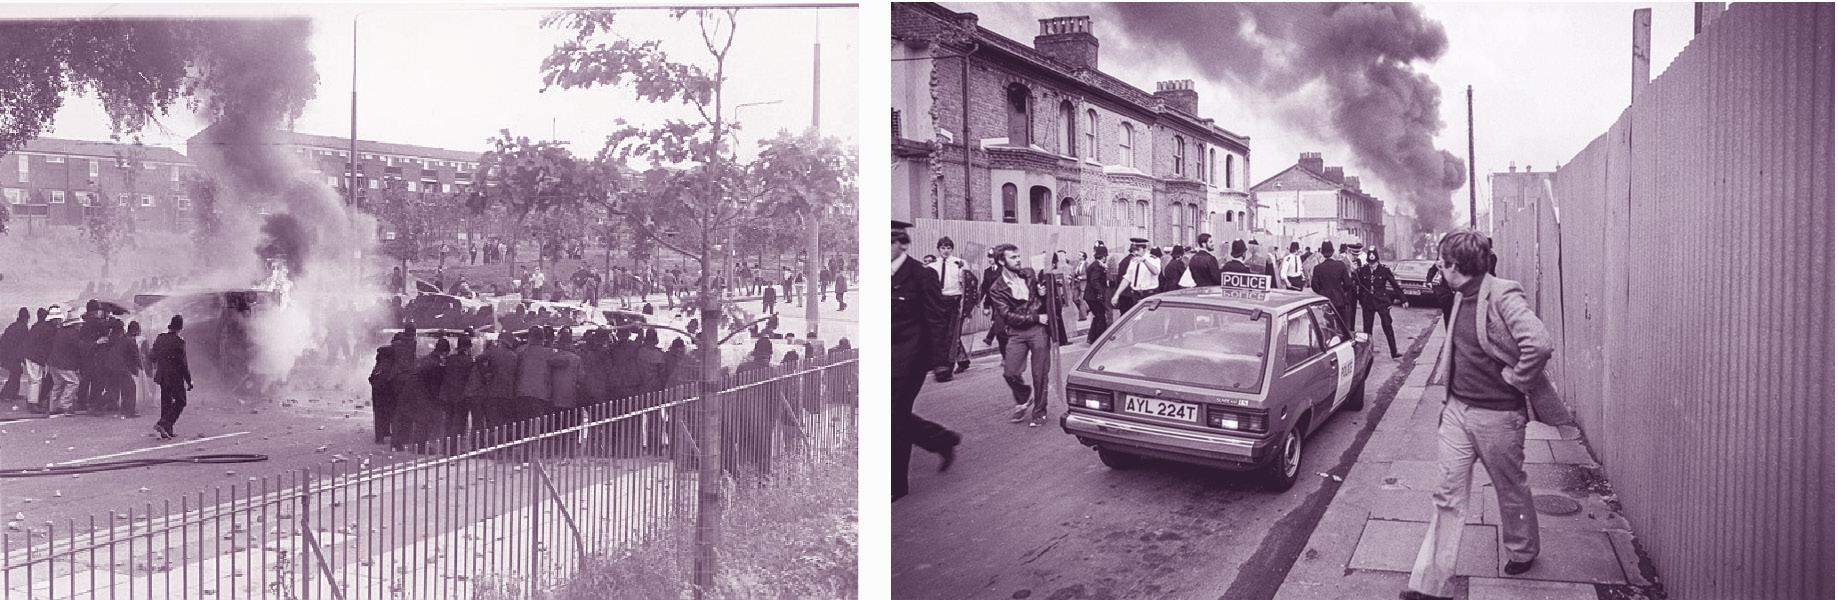
Liverpool has been uniquely effected by the consequences of urbanization and modern patterns of development. High unemployment rates throughout the 1970s hit the working-class communities of Liverpool very hard, leading to racial tensions and a decline in commercial activity. In 1981, rising hostilities between the larger Toxteth area (a neighborhood in south Liverpool) and the police, who had been targeting young black men for stop and search, led to the Toxteth Uprisings which further isolated the area. More and more shops went out of business and homes became vacant, soon falling into disrepair. Granby was in desperate need of support but was instead ignored. The Thatcher government’s approach toward Granby and other deprived areas became known as ‘Managed Decline,’ where instead of refurbishing the homes and providing financial support for the neighborhoods, they were intentionally left to rot. The government’s goal was to drive out the remaining residents and businesses and demolish the area entirely.18
Managed Decline occured throughout the UK, but Liverpool was particularly affected due to its economic decline and plethora of depopulating neighborhoods. The policy neglected and displaced vulnerable communities to allow for extensive redevelopment of the urban environment.
“ “
“Racism from the 50s really led to the uprisings of 1981, then the area was ghettoed off by the police so they put bollards on every road so there was only one way in and out of the Granby Triangle and then there was a gradually, sort of, just letting the place rot.”
QuotefromHazelTilley,duringonlineinterview
FIGurE 3. THE TOXTETH rIOTS OF 1981 IN pICTurES Credits:thesouthwestcollective,KimAldis
FIGurE 4. MaNaGED DECLINE NEWS HEaDLINES Credits:BBC,2011
FIGurE 5. LETTER FROM GEOFFERY HOWE (CHANCELLOR OF THE EXCHEQUER) TO PM THATCHER — 1981. Credits:https://medium.com/
37 36
Thatcher urged ‘let Liverpool deline’ after 1981 riots
HOUSING MARKET RENEWAL INITIATIVE
Liverpool, The Neoliberal City
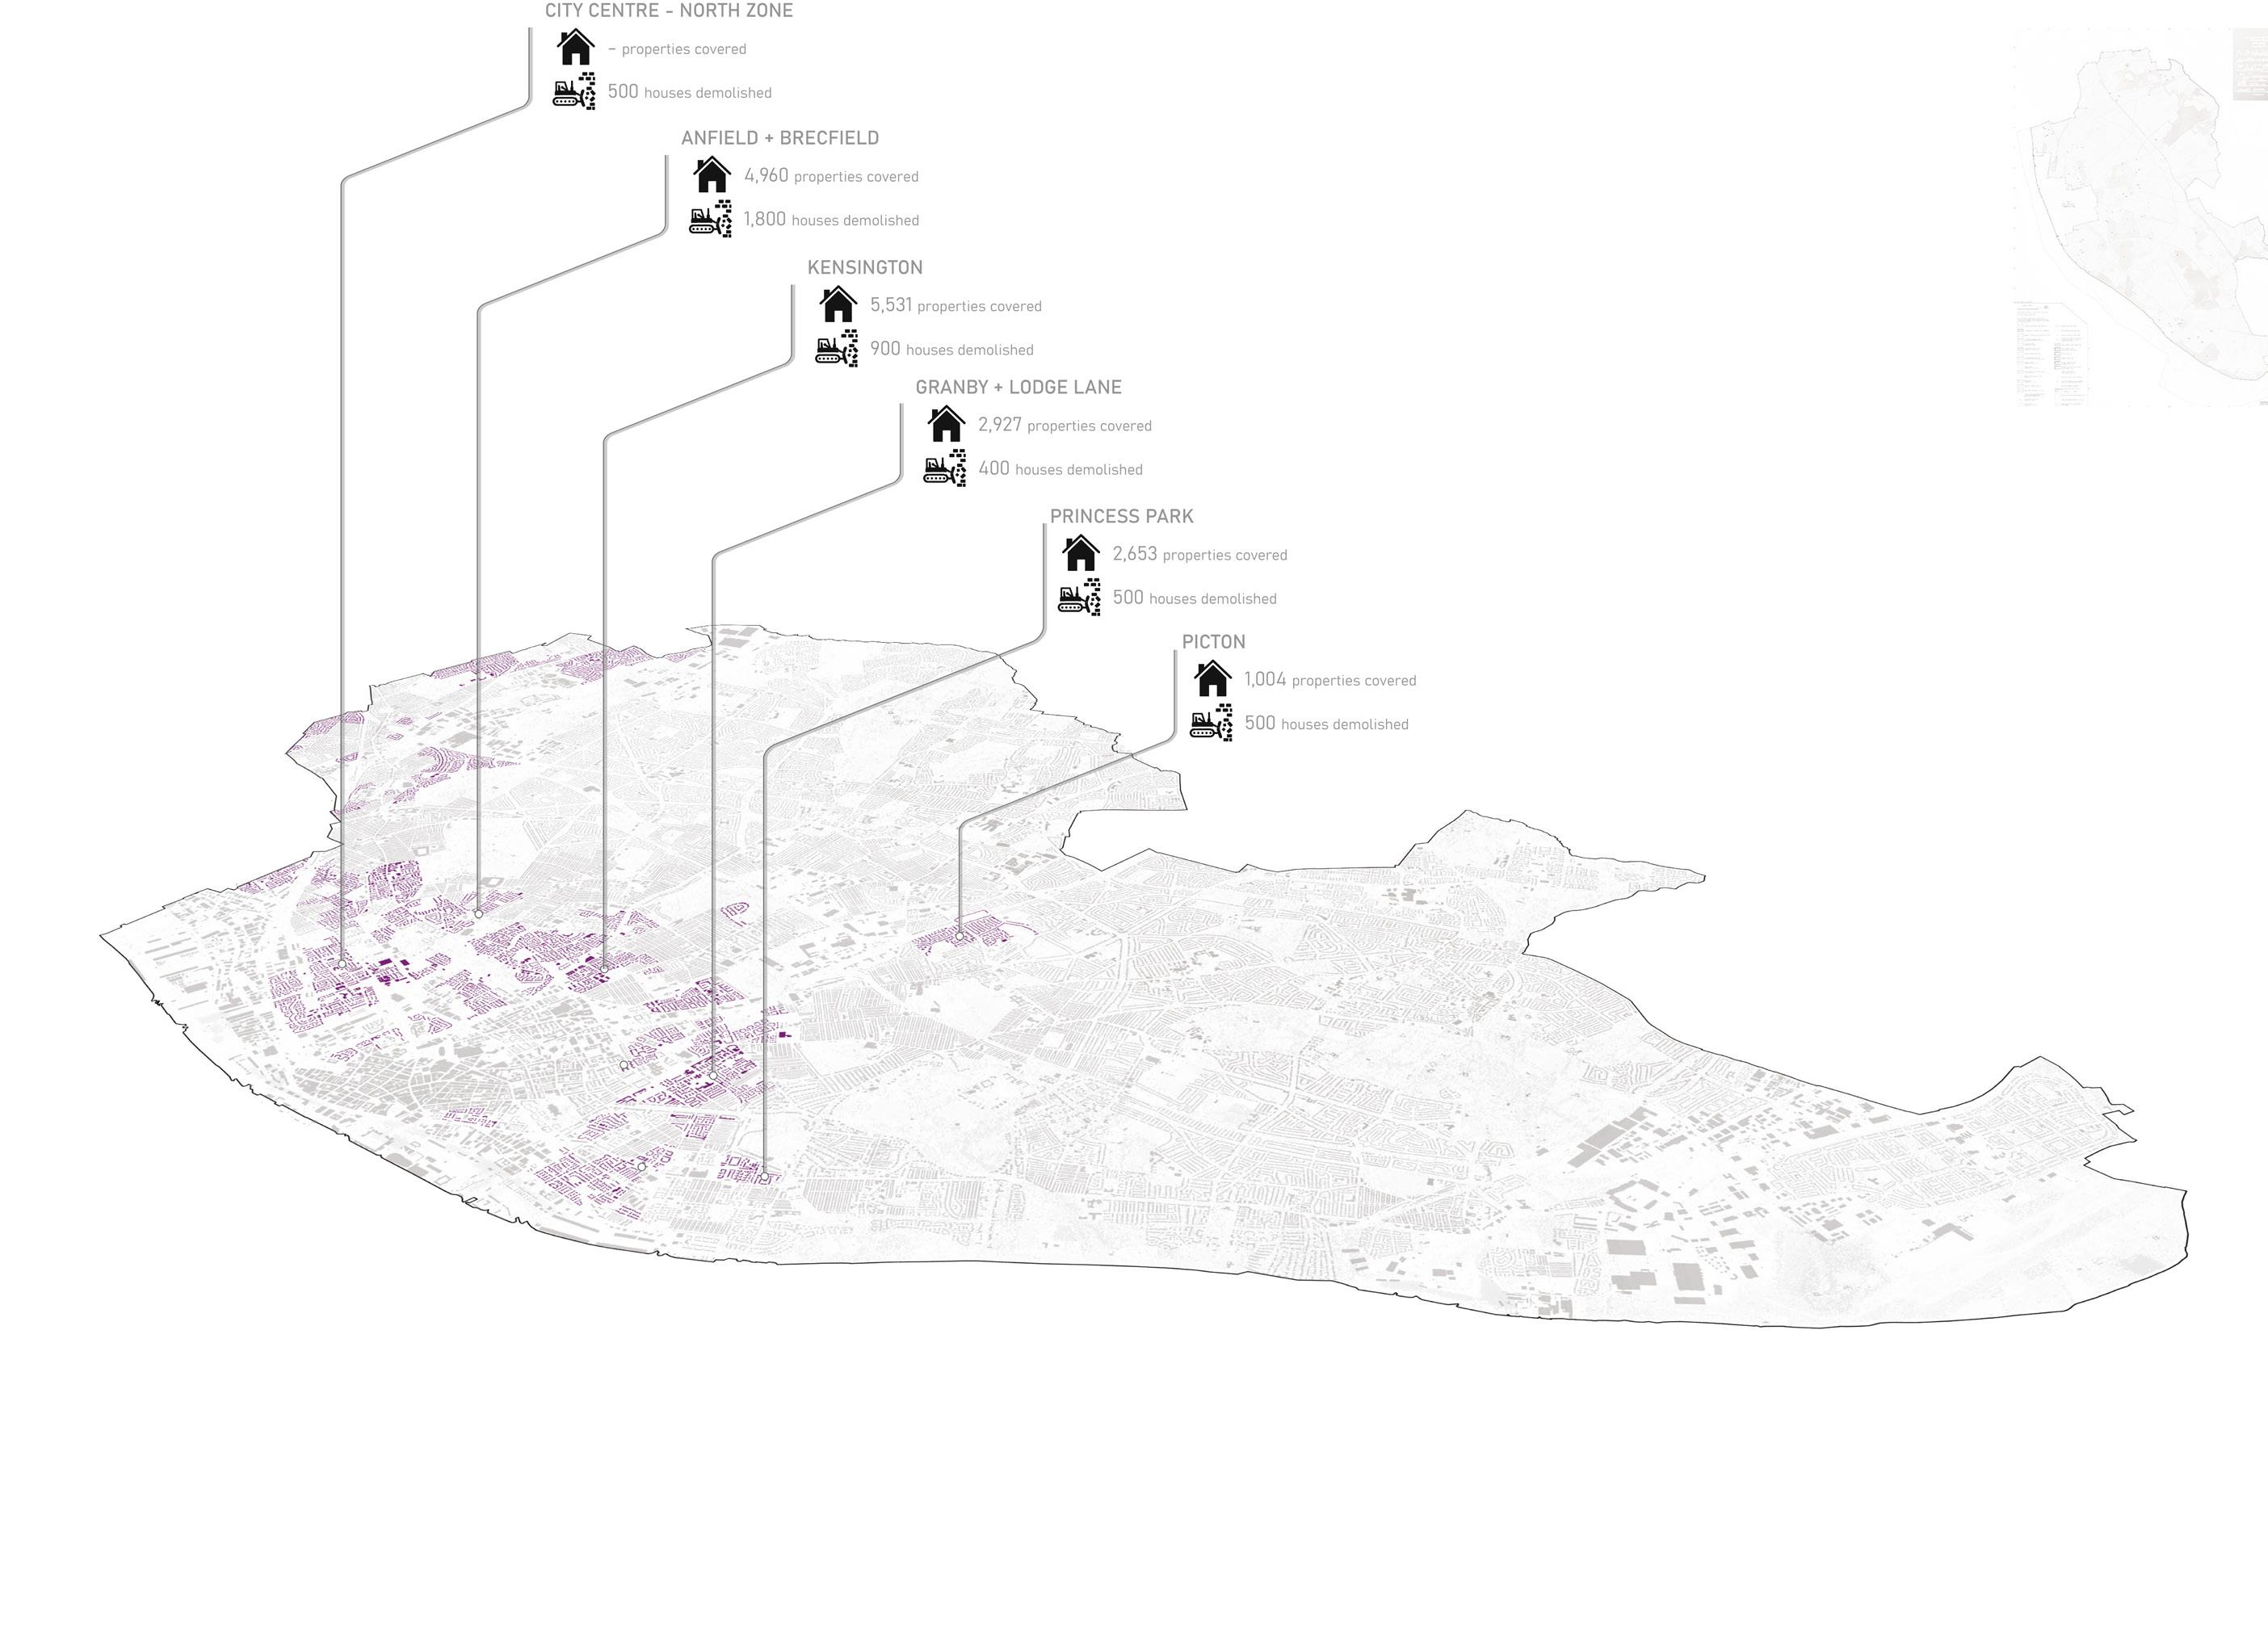
Following the Manage Decline policies of the Thacher government, 2002 saw the launch of an ambitious national urban regeneration initiative which aimed to renew large deprived areas in a number of cities, including Liverpool. The new policy, entitled the ‘Housing Market Renewal Initiative’ or HMRI, promoted the acquisition of property at low prices or through expropriation around the centre of Liverpool followed by the demolition of large numbers of houses in order to “sanitise” the city.19
The areas within Liverpool targeted by the HMRI were predominantly composed of pre-1919 terraced house. These were also the same neighborhoods which had been historically underfunded and neglected. In 2011, in the midst of the ‘regenerations,’ the program ran out of funding.20 This left communites in limbo with homes boarded up and half demolished. It was effectively another round of Managed Decline that left the remaining residents worse off than they would have been before the HMRI work had even begun.
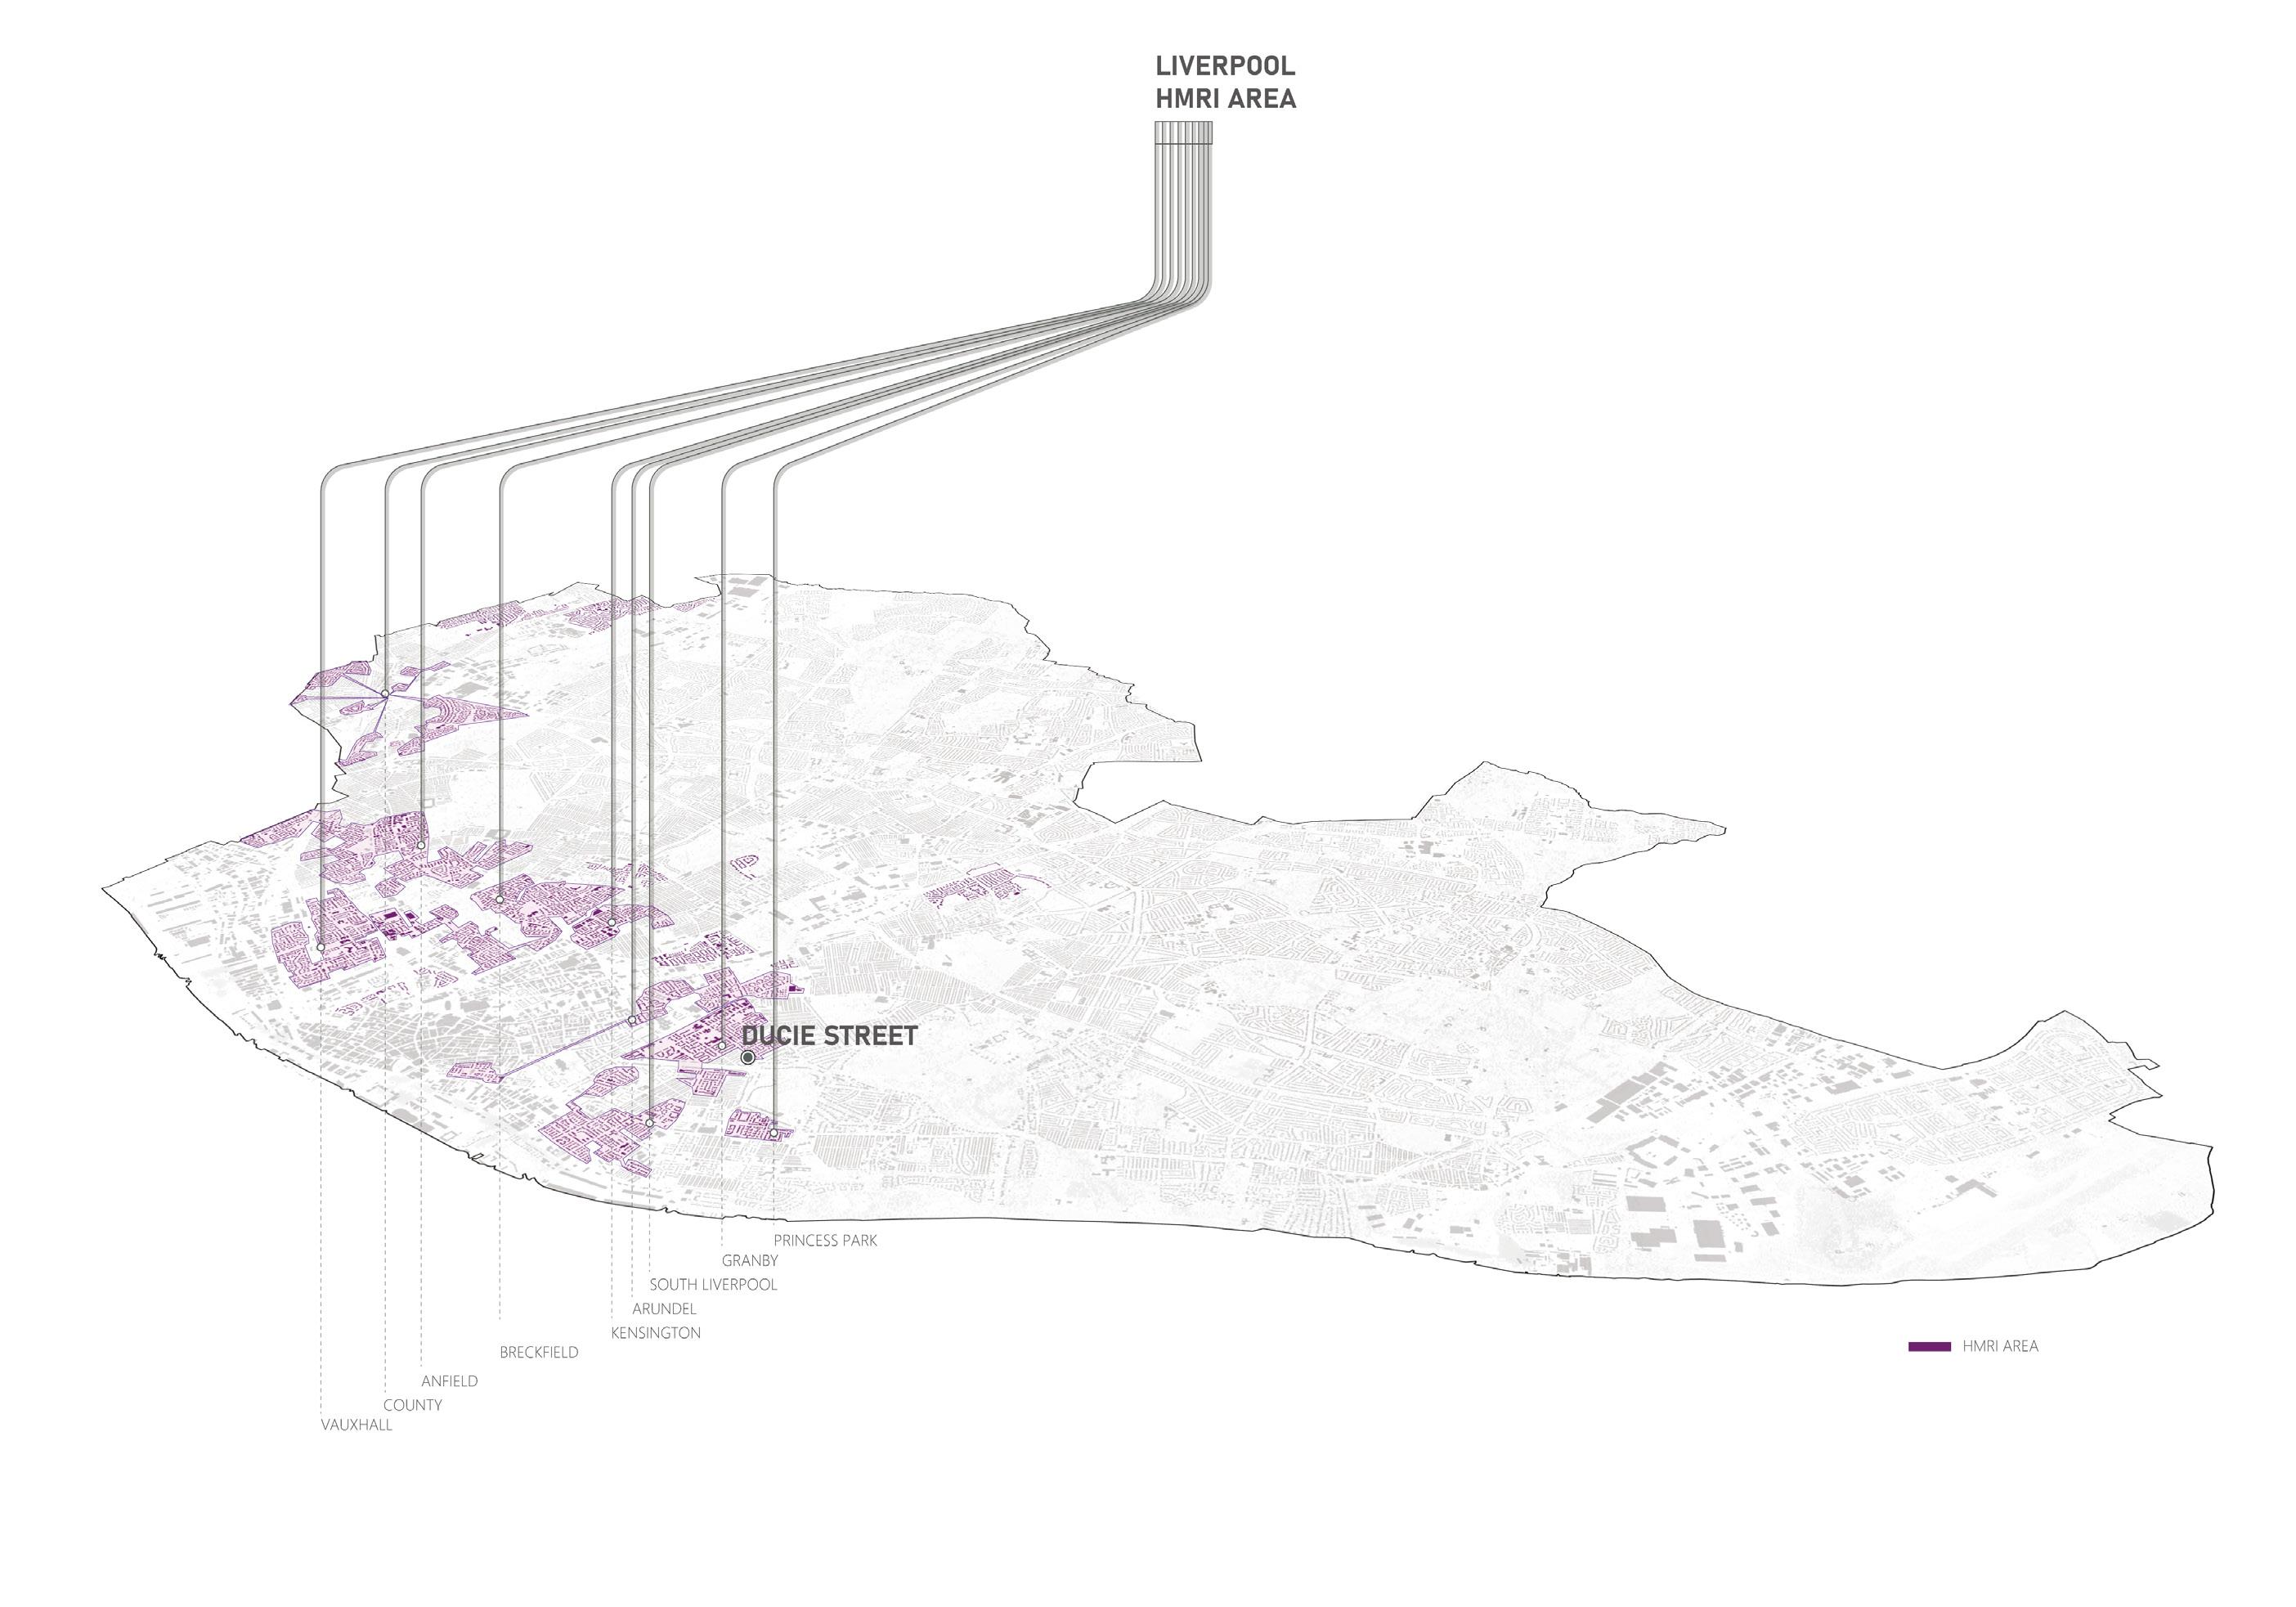 Map 14. LIVErpOOL HMrI arEaS byBorjaRomeuandShenghanWang
39 38
Map 15. HMr IMpaCT OF DEMOLISHED HOuSES byBorjaRomeuandShenghanWang
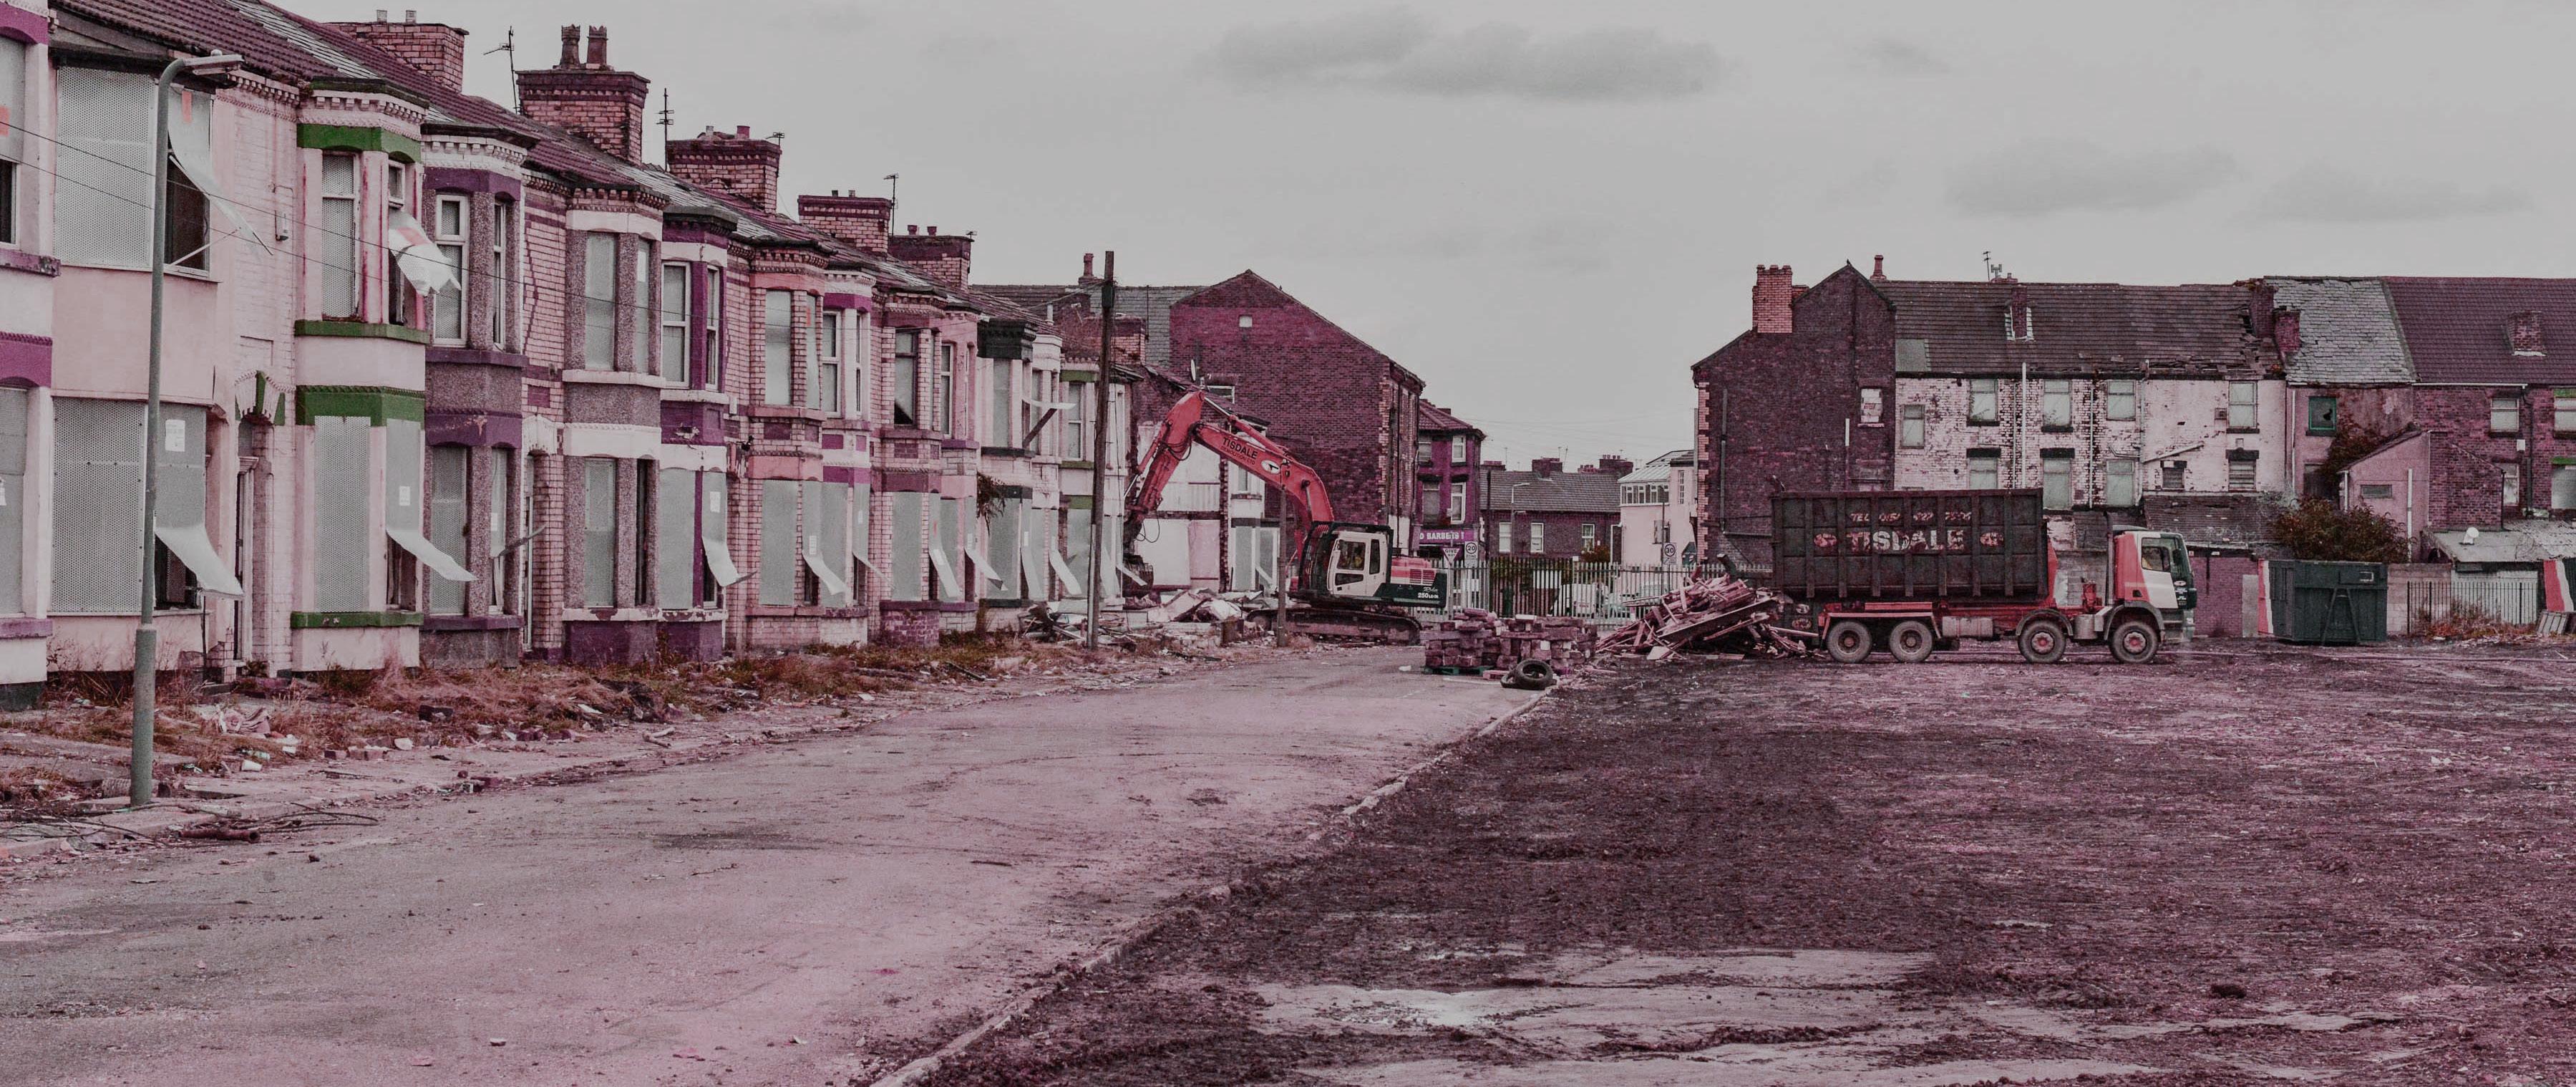
FIGurE 6. HOMEBaKED HOuSING MarKET rENEWaL arEa Credits:HomebakedCLT 41 40
HOUSE FOR A POUND SCHEME
Liverpool, The Neoliberal City
Credits:TheSundayTimes
After the failure of the Housing Market Renewal Initiative, the Liverpool City Council promoted the Homes for a Pound program to provide these derelict houses to local residents. After the involvement of private developers, however, there was an overall decline in property ownership and a concentration of capital abroad.
Therefore, while the Homes for a Pound program was presented as a positive initiative that promoted access to housing for people with greater social imbalances, it actually ended up becoming another form of land speculation which promoted and continues to promote the enrichment of a few to the detriment of the inhabitants of the city of Liverpool.21
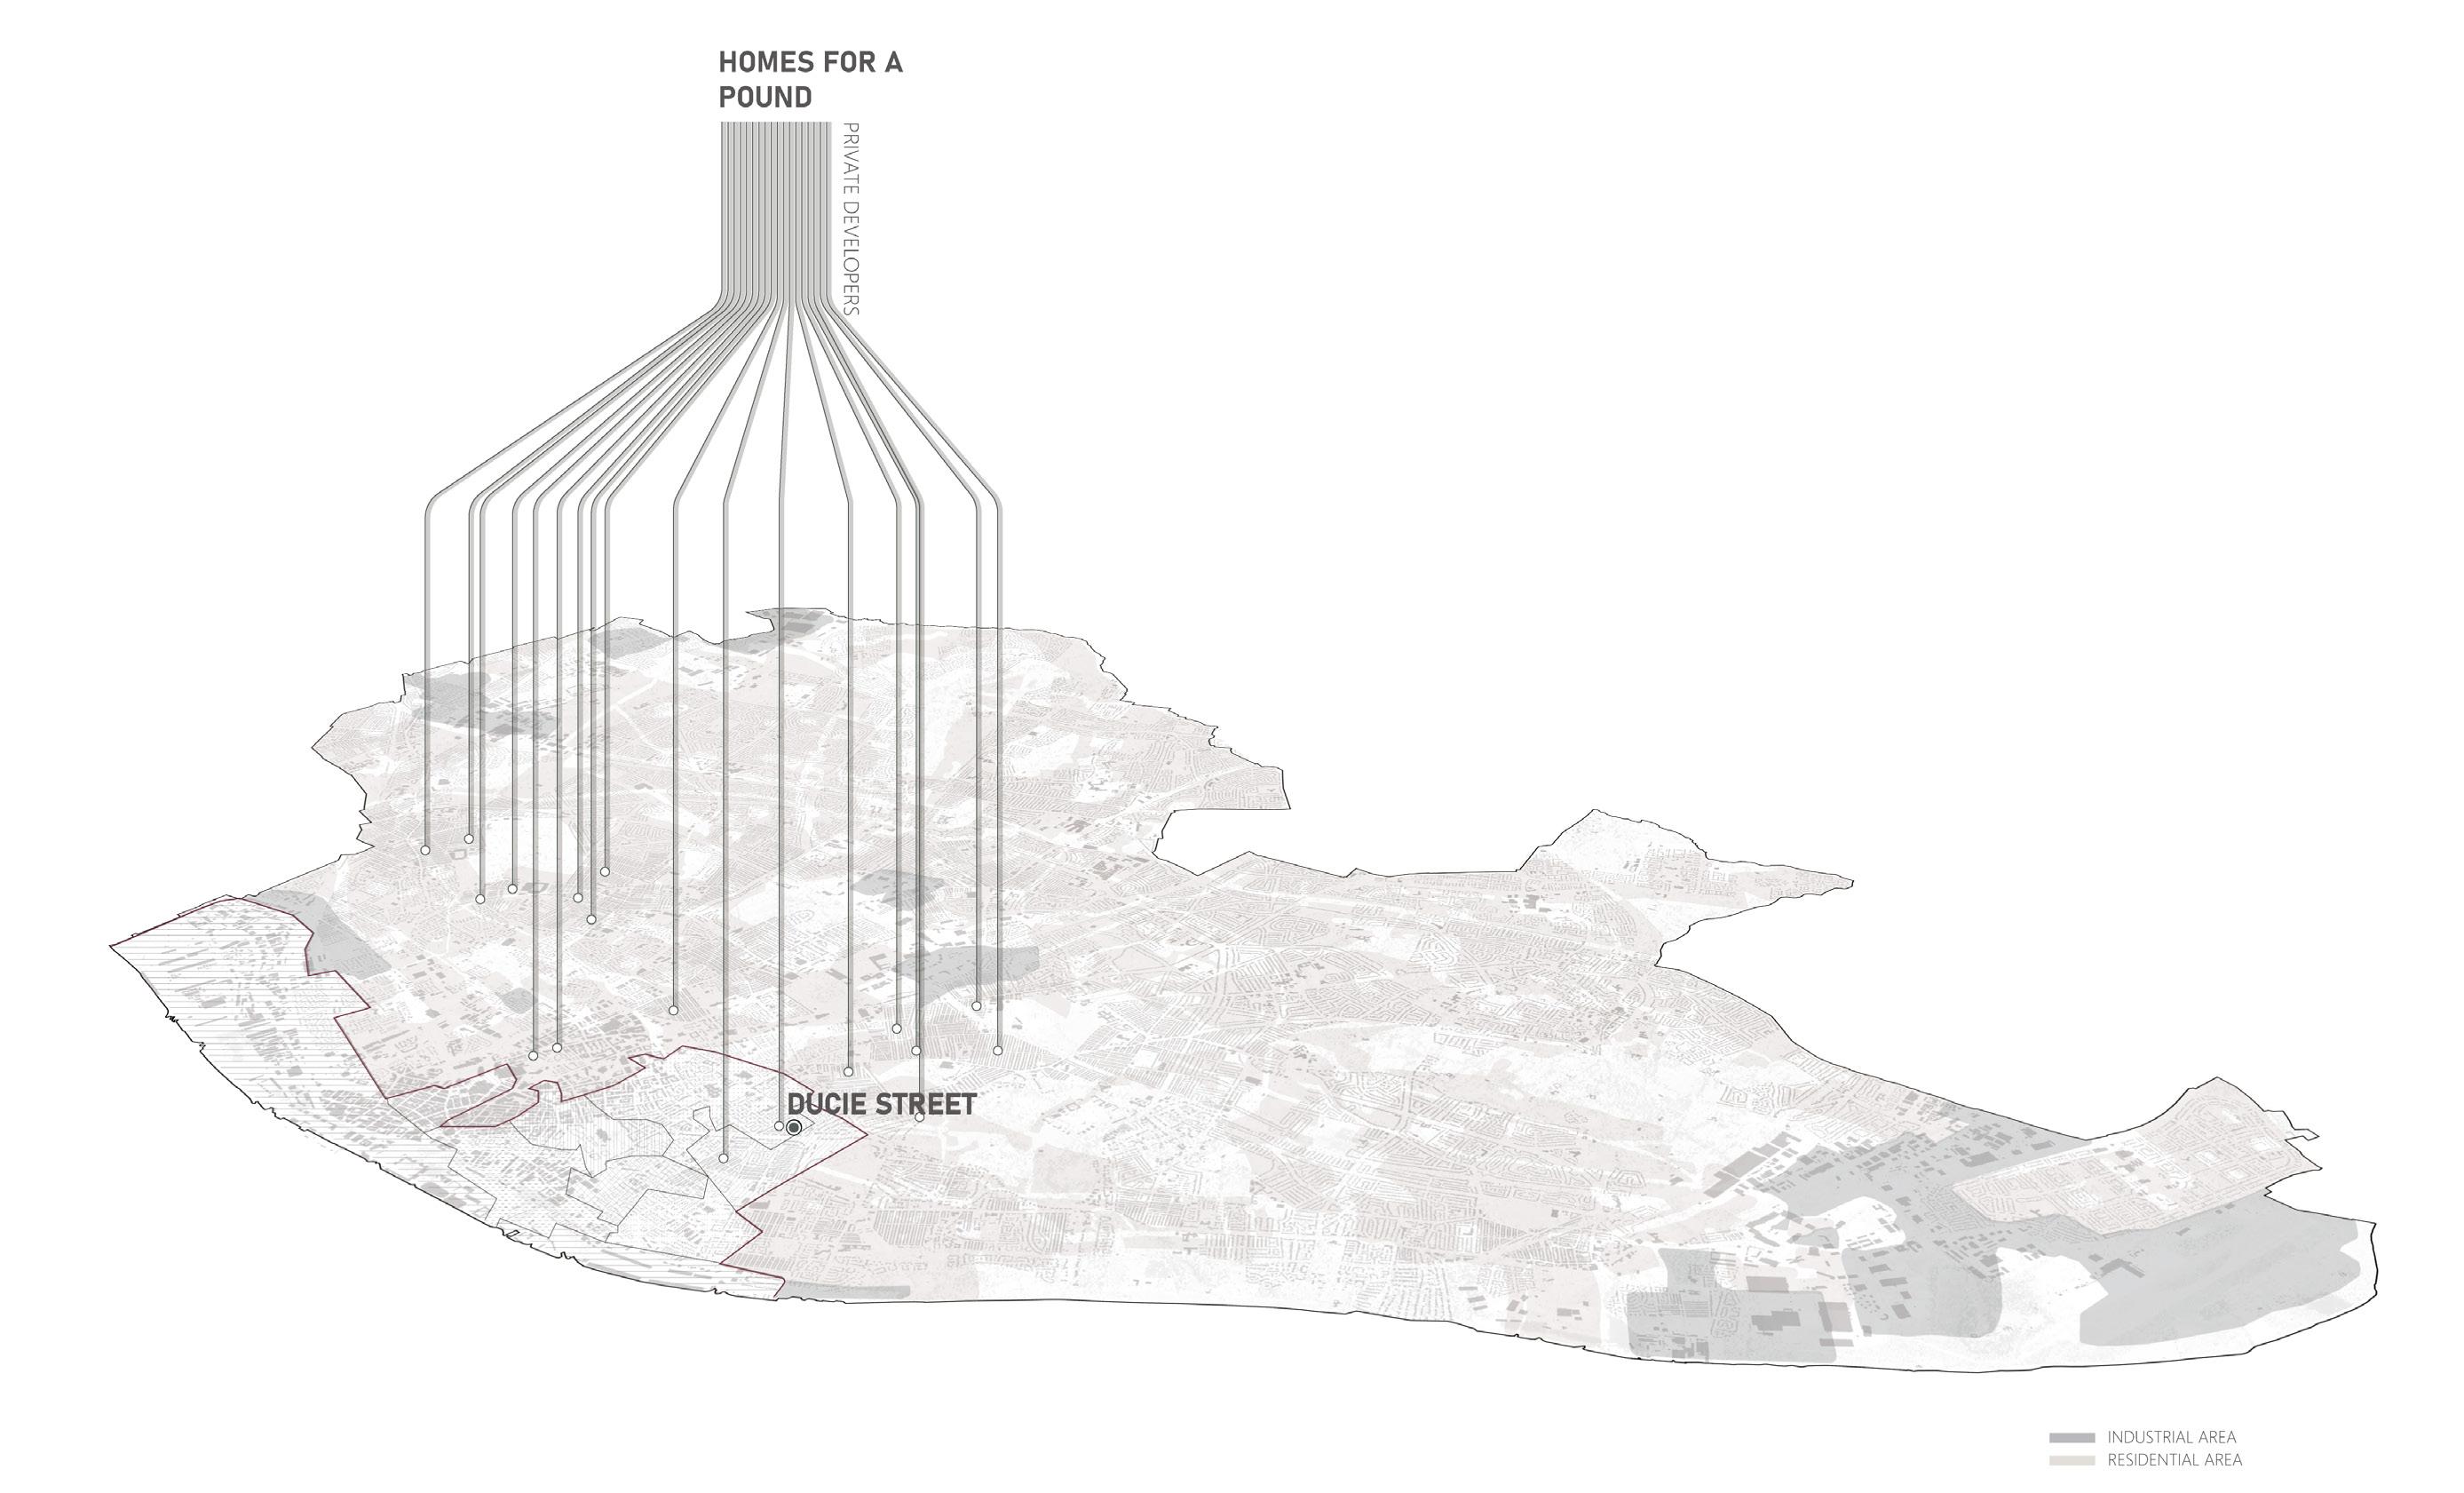

FIGurE 7. ILuSTraTION FrOM THE SuNDaY TIMES arTICLE EXpLOrING THE SpECuLaTION BEHIND £1 HOMES IN LIVErpOOL
Map 16. SpECuLaTION arEaS BY prIVaTE DEVELOpErS IN HOuSE FOr a pOuND SCHEME byBorjaRomeuandShenghanWang 43 42
OVERSEAS INVESTMENT IN MERSEYSIDE REGION
Liverpool, The Neoliberal City
Over the past 20 years, there has been a progressive increase investments in UK real estate by companies based overseas. This has resulted in a decline in property ownership in the region and a concentration of capital abroad.22 Additionally, the increasing offshore investments have prevented further reinvestment within the city.
Most of the overseas companies investing in Liverpool properties over the last 20 years are based in tax havens, such as Jersey, Guernsey, Bermuda, Cyprus and Isle of Man (many of these territories are British crown dependencies).23 These tax havens and other countries have lower taxation policies to atract large private companies and wealthy individuals who seek to maximize their profits, often to the detriment of the places where they invest.
These territories/countries become catalyists for the centralization of money and tax avoidance, and this has an impact on the cities where such investments are made. The wealth that is generated in the city through real estate development does not stay in the Liverpool Region.
2001 - 2005 2006 - 2010 2011 - 2015 2016 - 2020 20% 20% 20% 20% PHASE 1 PHASE 2 PHASE 3 PHASE 4 ROSDALE INVESTMENTS LIMITED HOMESELECT FINANCE (NO.3) LIMITED MODRIL PROPERTIES LIMITED DOOBA INVESTMENTS III LIMITED PHF SECURITIES NO.2 LIMITED MRF MANAGING TRUSTEE NO.1 LIMITED RATHGOLD LIMITED PALACE INVESTMENTS LIMITED PROMONTORIA HOLDING 74 B.V. KFIM LIPUT 1 LIMITED THISTLE INVESTMENTS LIMITED BRICKHILL PROPERTIES LIMITED VALEDOWN LIMITED MOUBRAY LIMITED CARTER GEM PROPERTIES LIMITED PBSA S.A R.L. ARC BKSCOUK001, LLC RI AZ SPEKE LIMITED PRIVATE COMPANY PROPERTY VALUE HOLD HOUSEHOLD INCOMES 45.9K - 56.9K > 21% 23.9K - 29.8K < 5% 29.8K - 33.7K 6 - 10% 33.7K - 39.2K 11 - 15% 39.2K - 45.9K 16 - 20% BNP PARIBAS SECURITIES SERVICE TRUST COMPANY LIMITED KB PROPERTY RENTALS LIMITED
LIVERPOOL REGION HOUSEHOLD INCOMES Map 17. OVErSEaS INVESTMENTS IN THE LIVErpOOL rEGION byBorjaRomeu 45 44
OVERSEAS INVESTMENT IN LIVERPOOL COUNCIL
Liverpool, The Neoliberal City
period 2001 - 2005

Most deprived areas in Liverpool

period 2006 - 2011
period 2011 - 2015
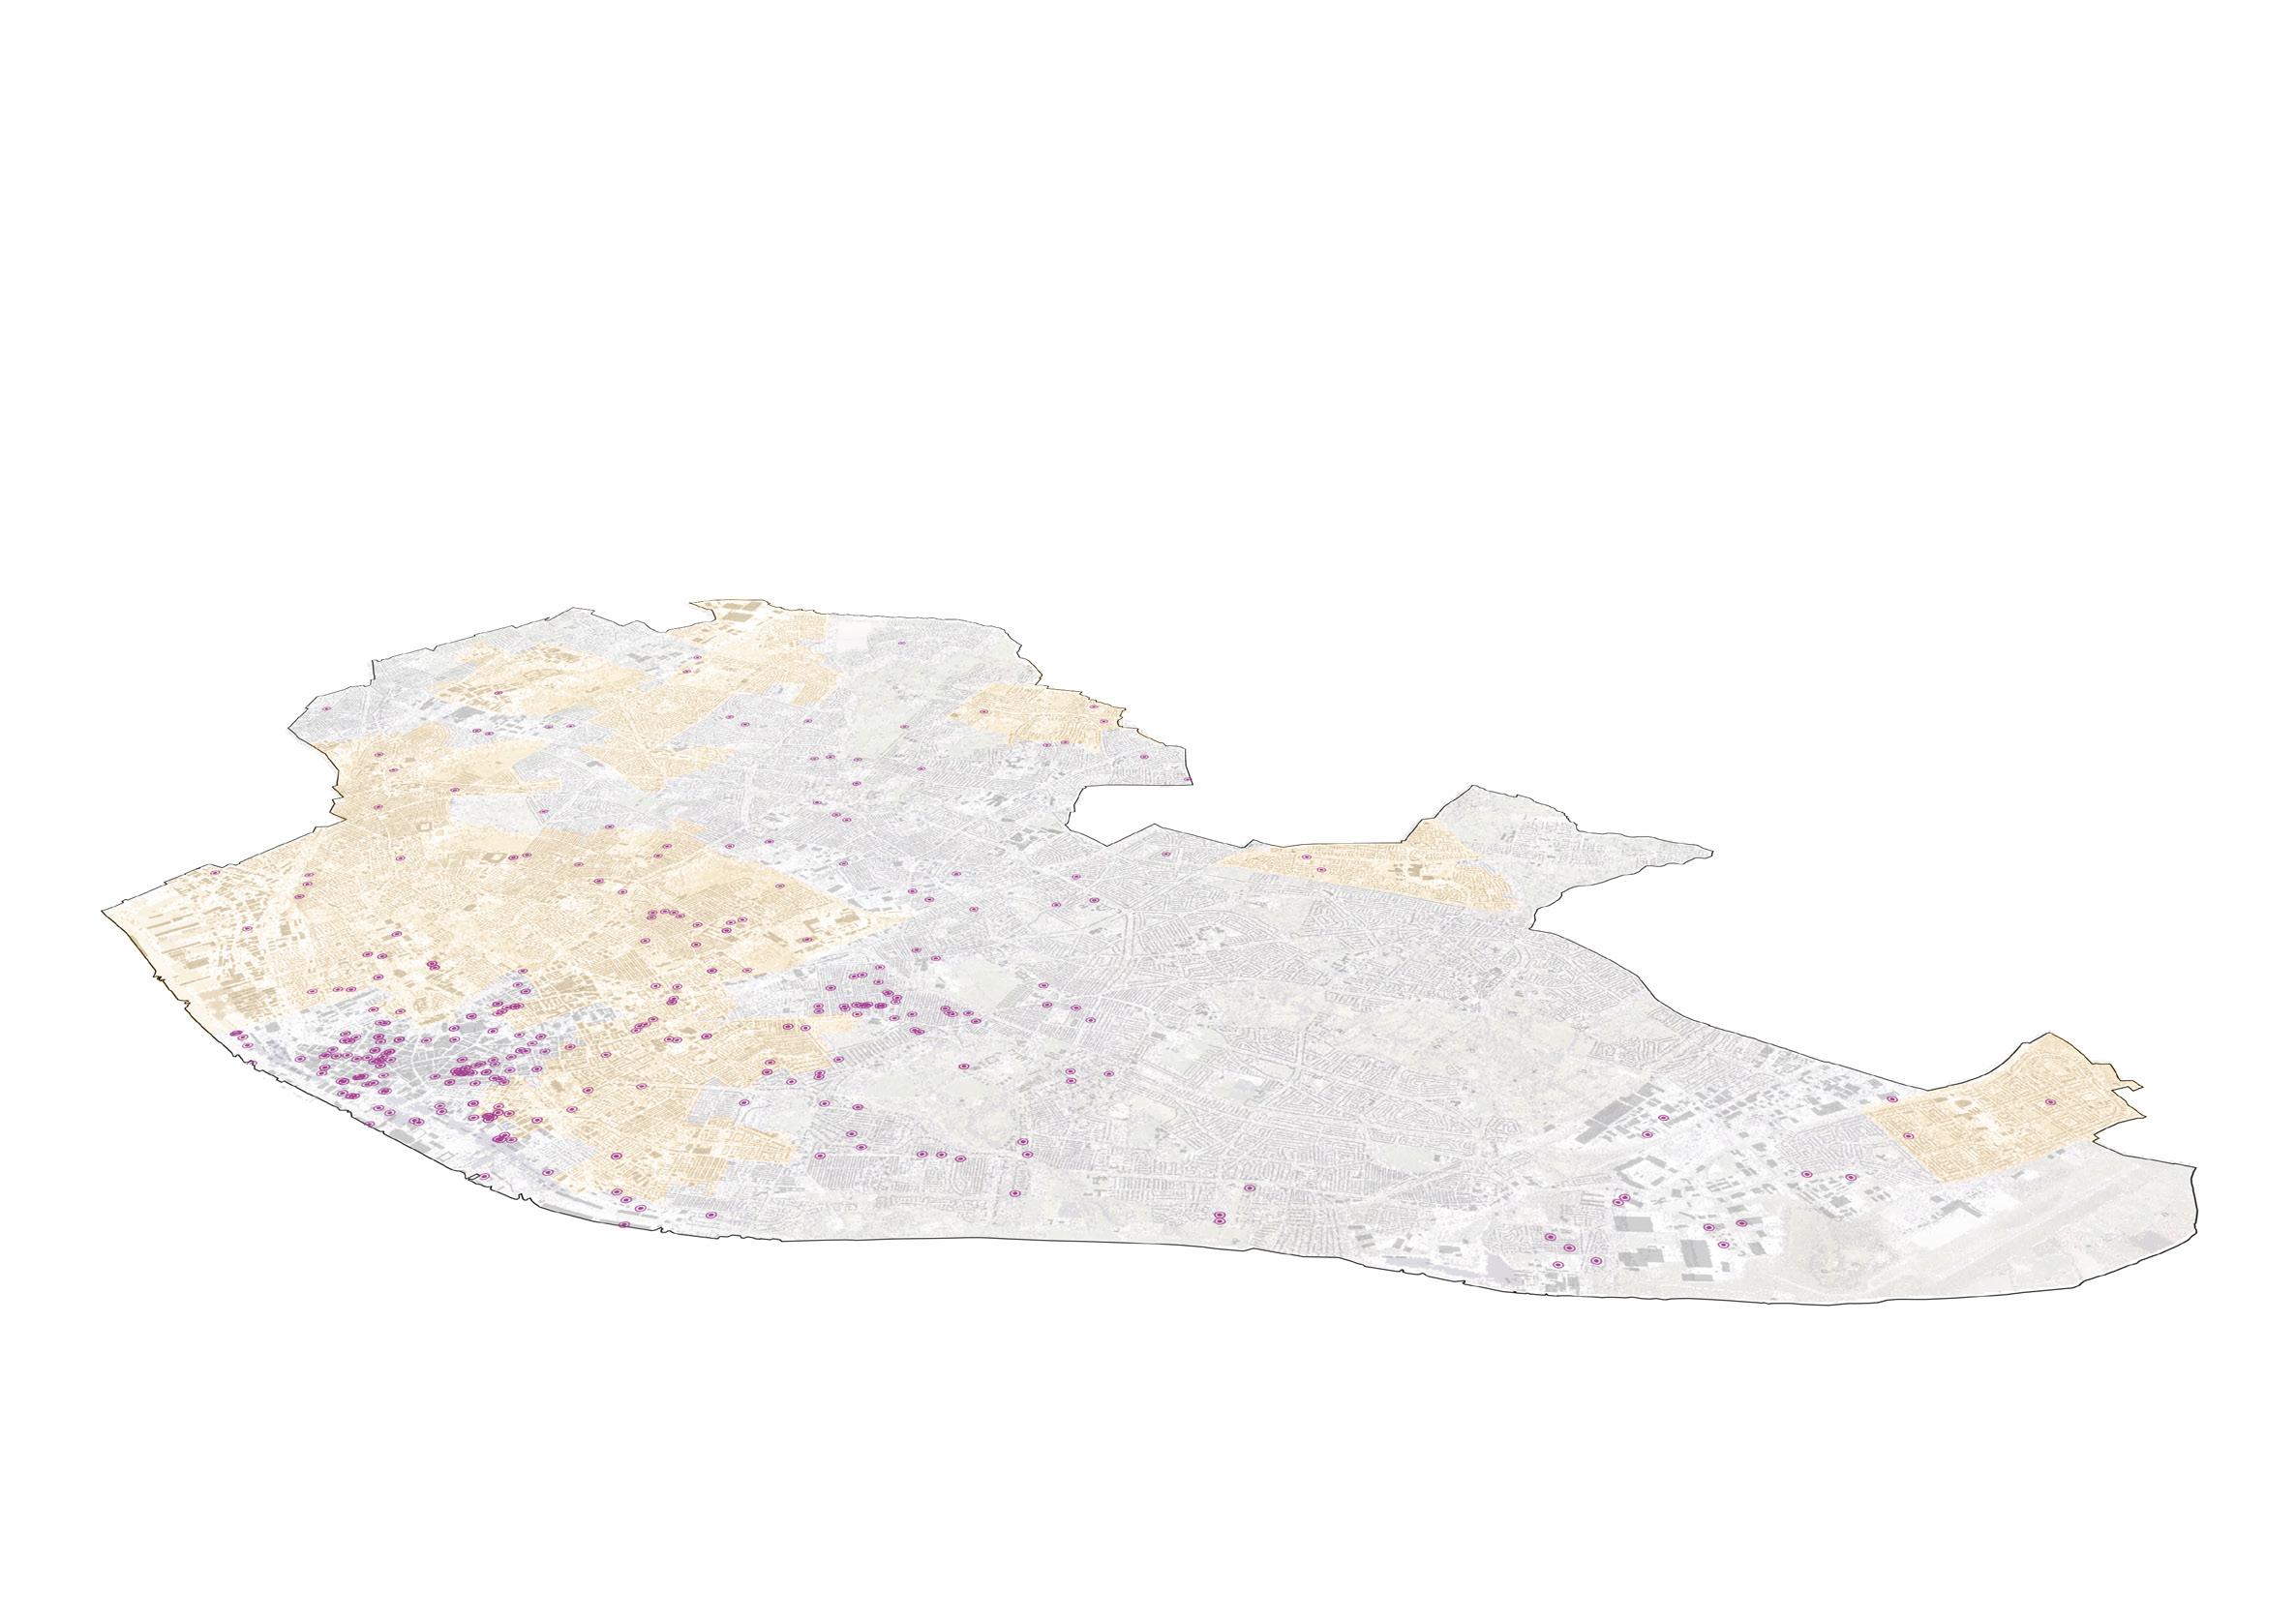
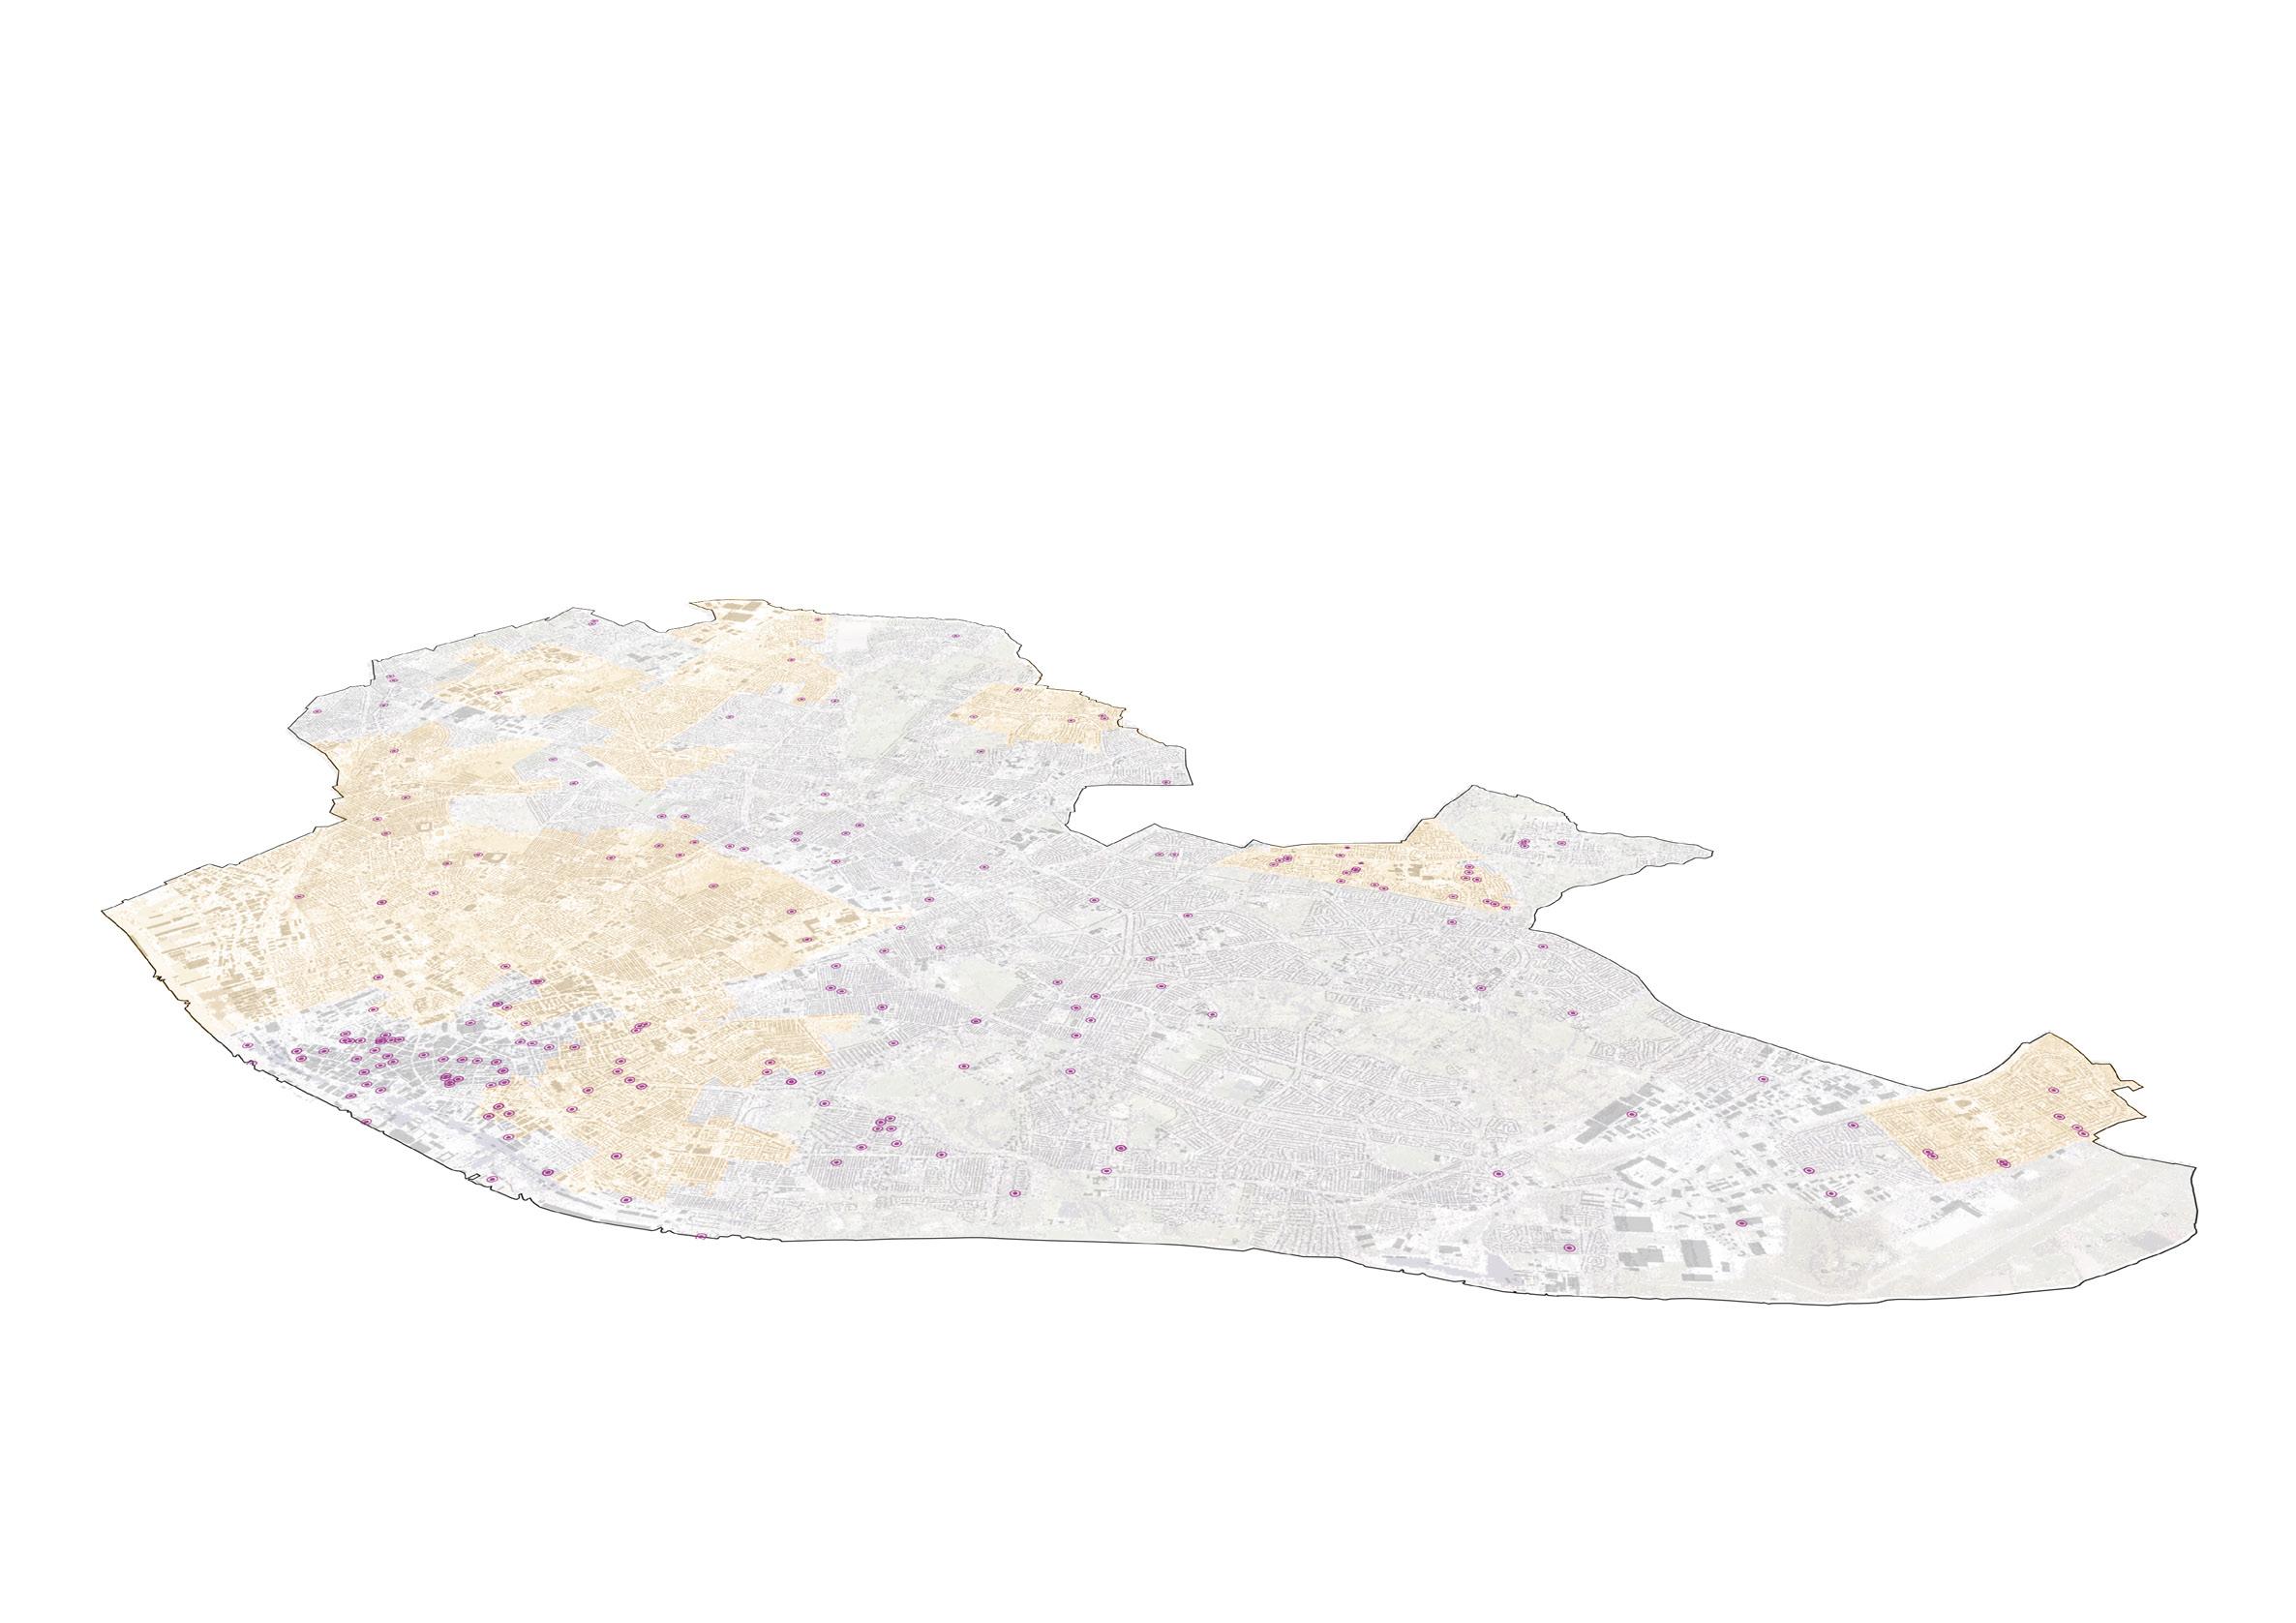
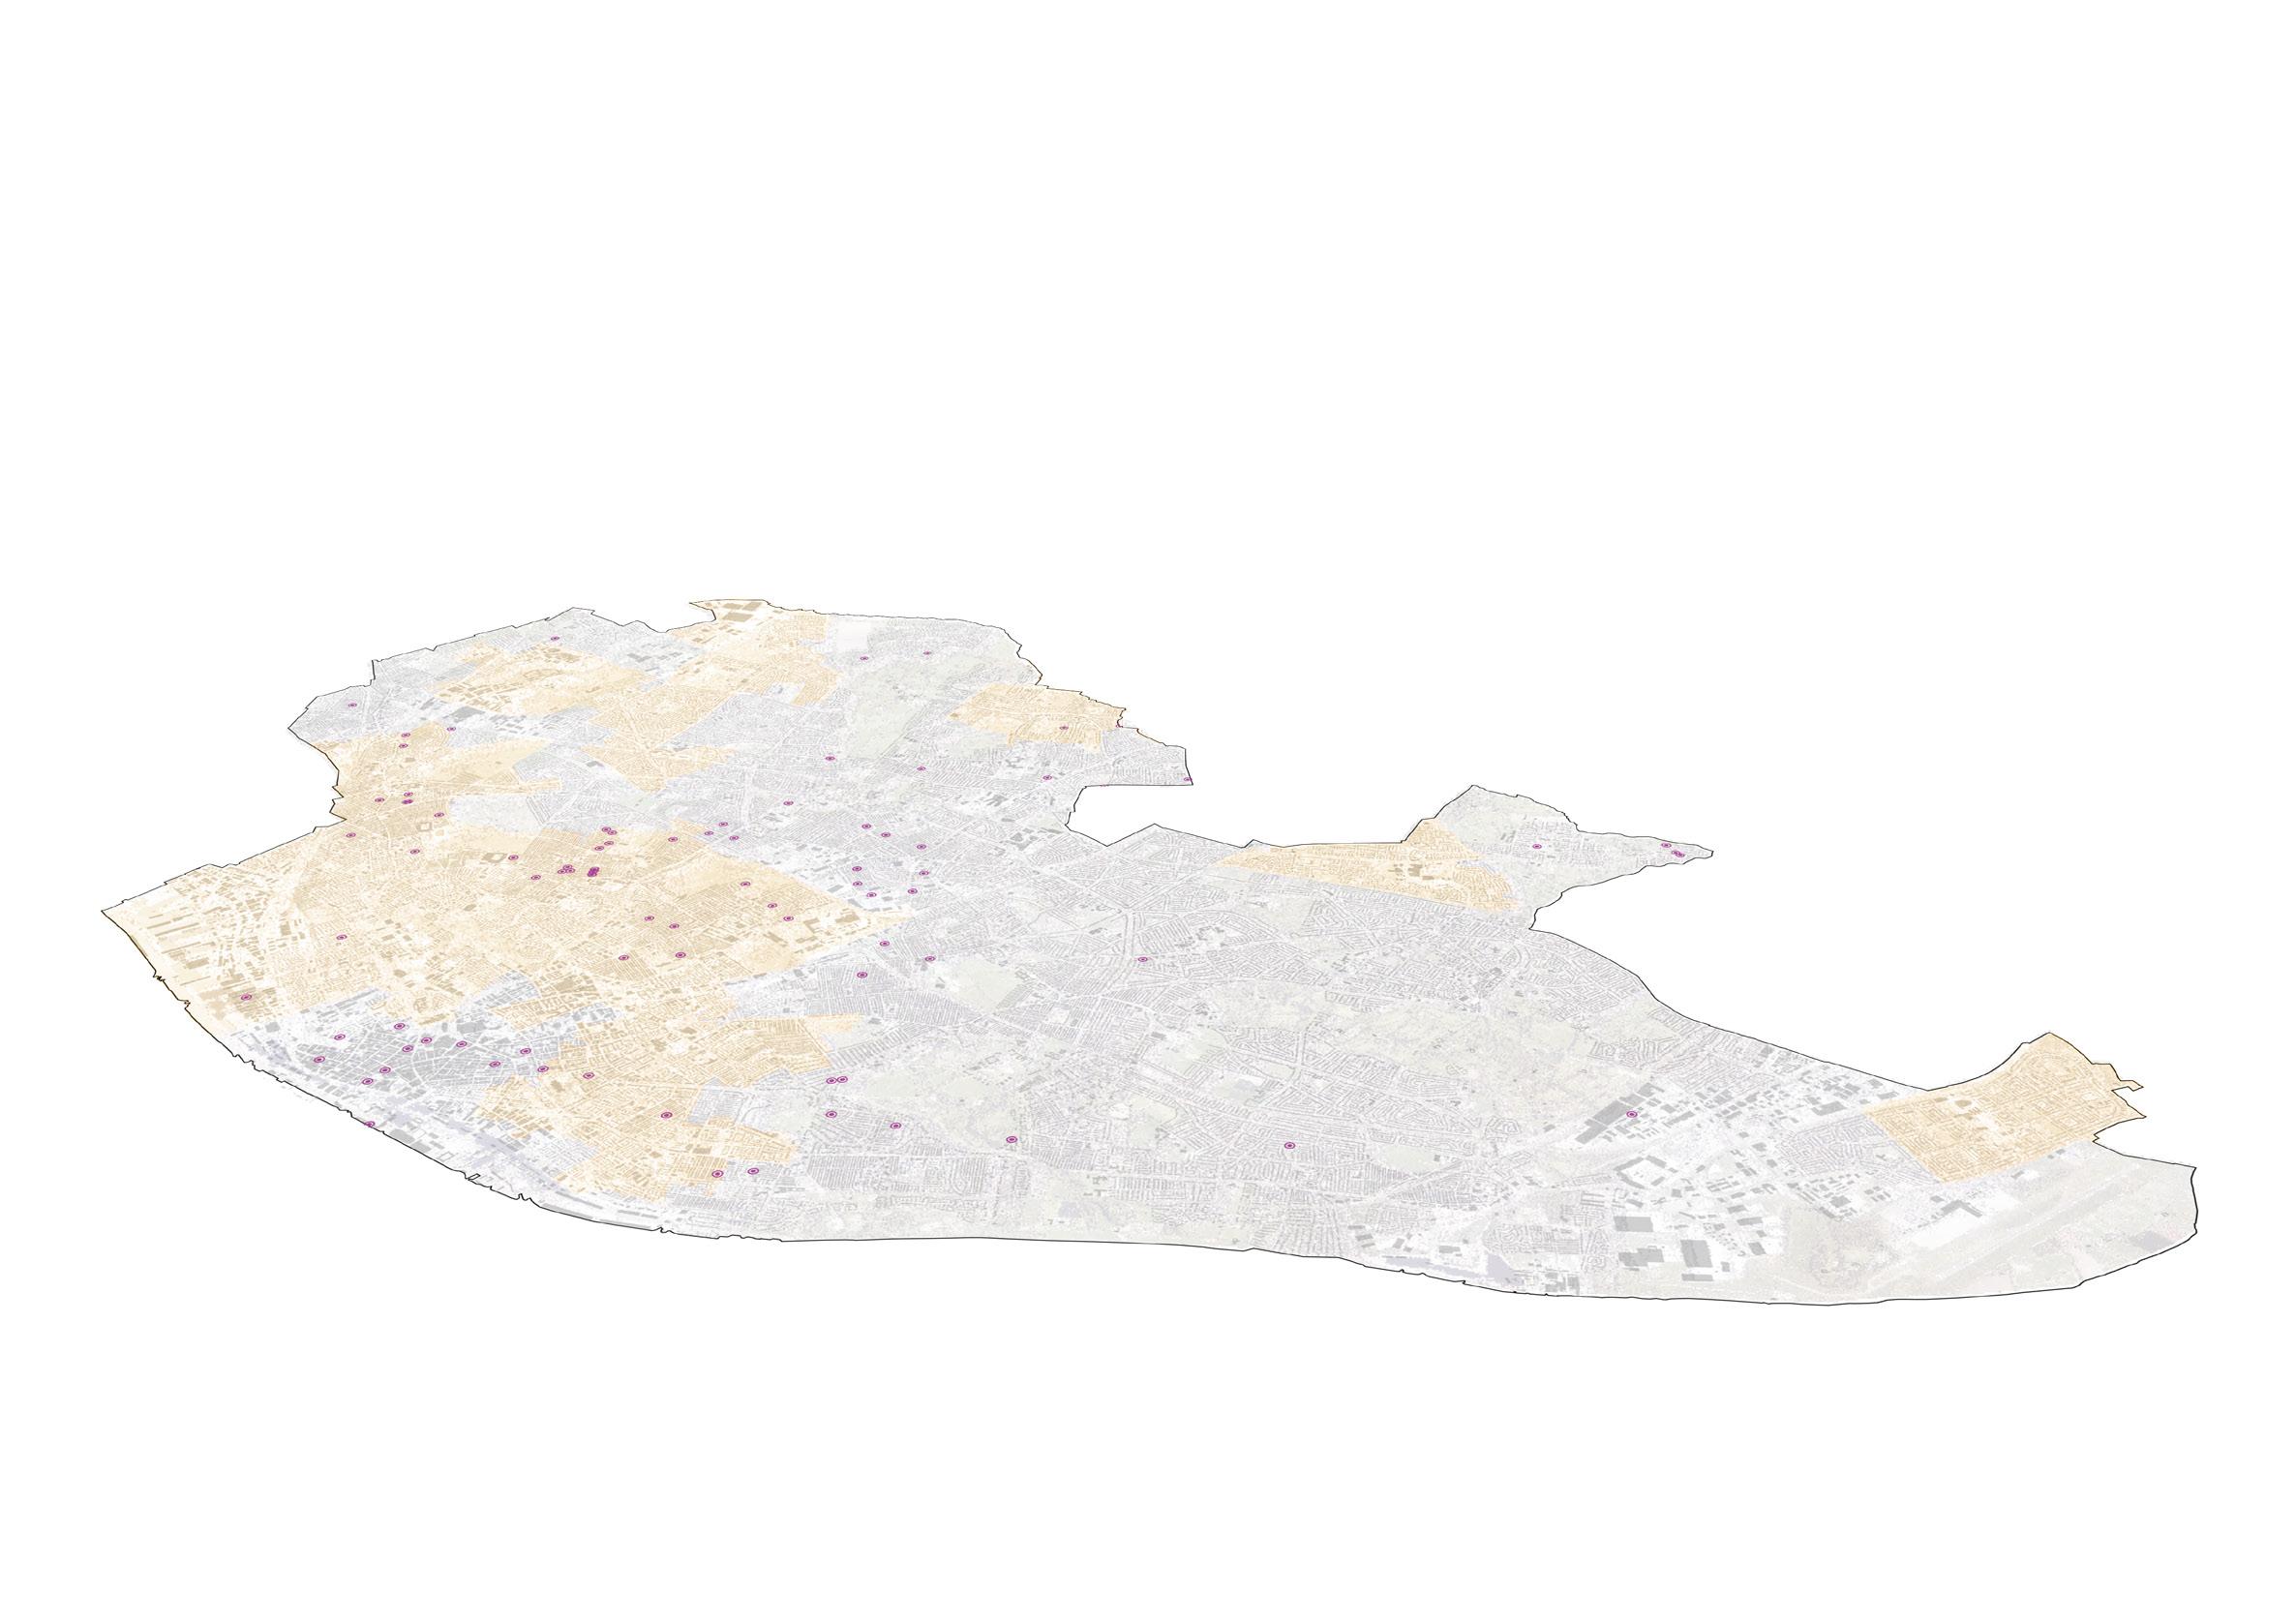
To take advantage of the rising land and housing prices, private companies, many based overseas, are increasing their investment in the Liverpool City Region. Many of these companies are based in offshore tax havens to maximize profits and obfuscate the origins of the investment. These investments encourage property speculation resulting in gentrification and even higher land and housing prices.
Within the Liverpool City Region, the city center of Liverpool is of great interest to overseas investors. Perhaps predictably, the higher income Central, Riverside, and Princess Park districts are by far the most attractive areas for foreign capital. However, lower income districts such as Anfield, Everton, Old Swam, and Wavertree are also seeing increasing investment, and these areas are facing increasing pressures due to gentrification. The effects of investments on lower income areas can compound, resulting in even more investment.24
Credits:TheSundayTimes
period 2006 - 2011
Map 18. OVErSEaS INVESTMENTS IN LIVErpOOL arEa byBorjaRomeu
FIGurE 8. HaTHErLEY STrEET IN TOXTETH
47 46
CURRENT LIVERPOOL CITY CENTRE DEVELOPMENT Liverpool, The Neoliberal City
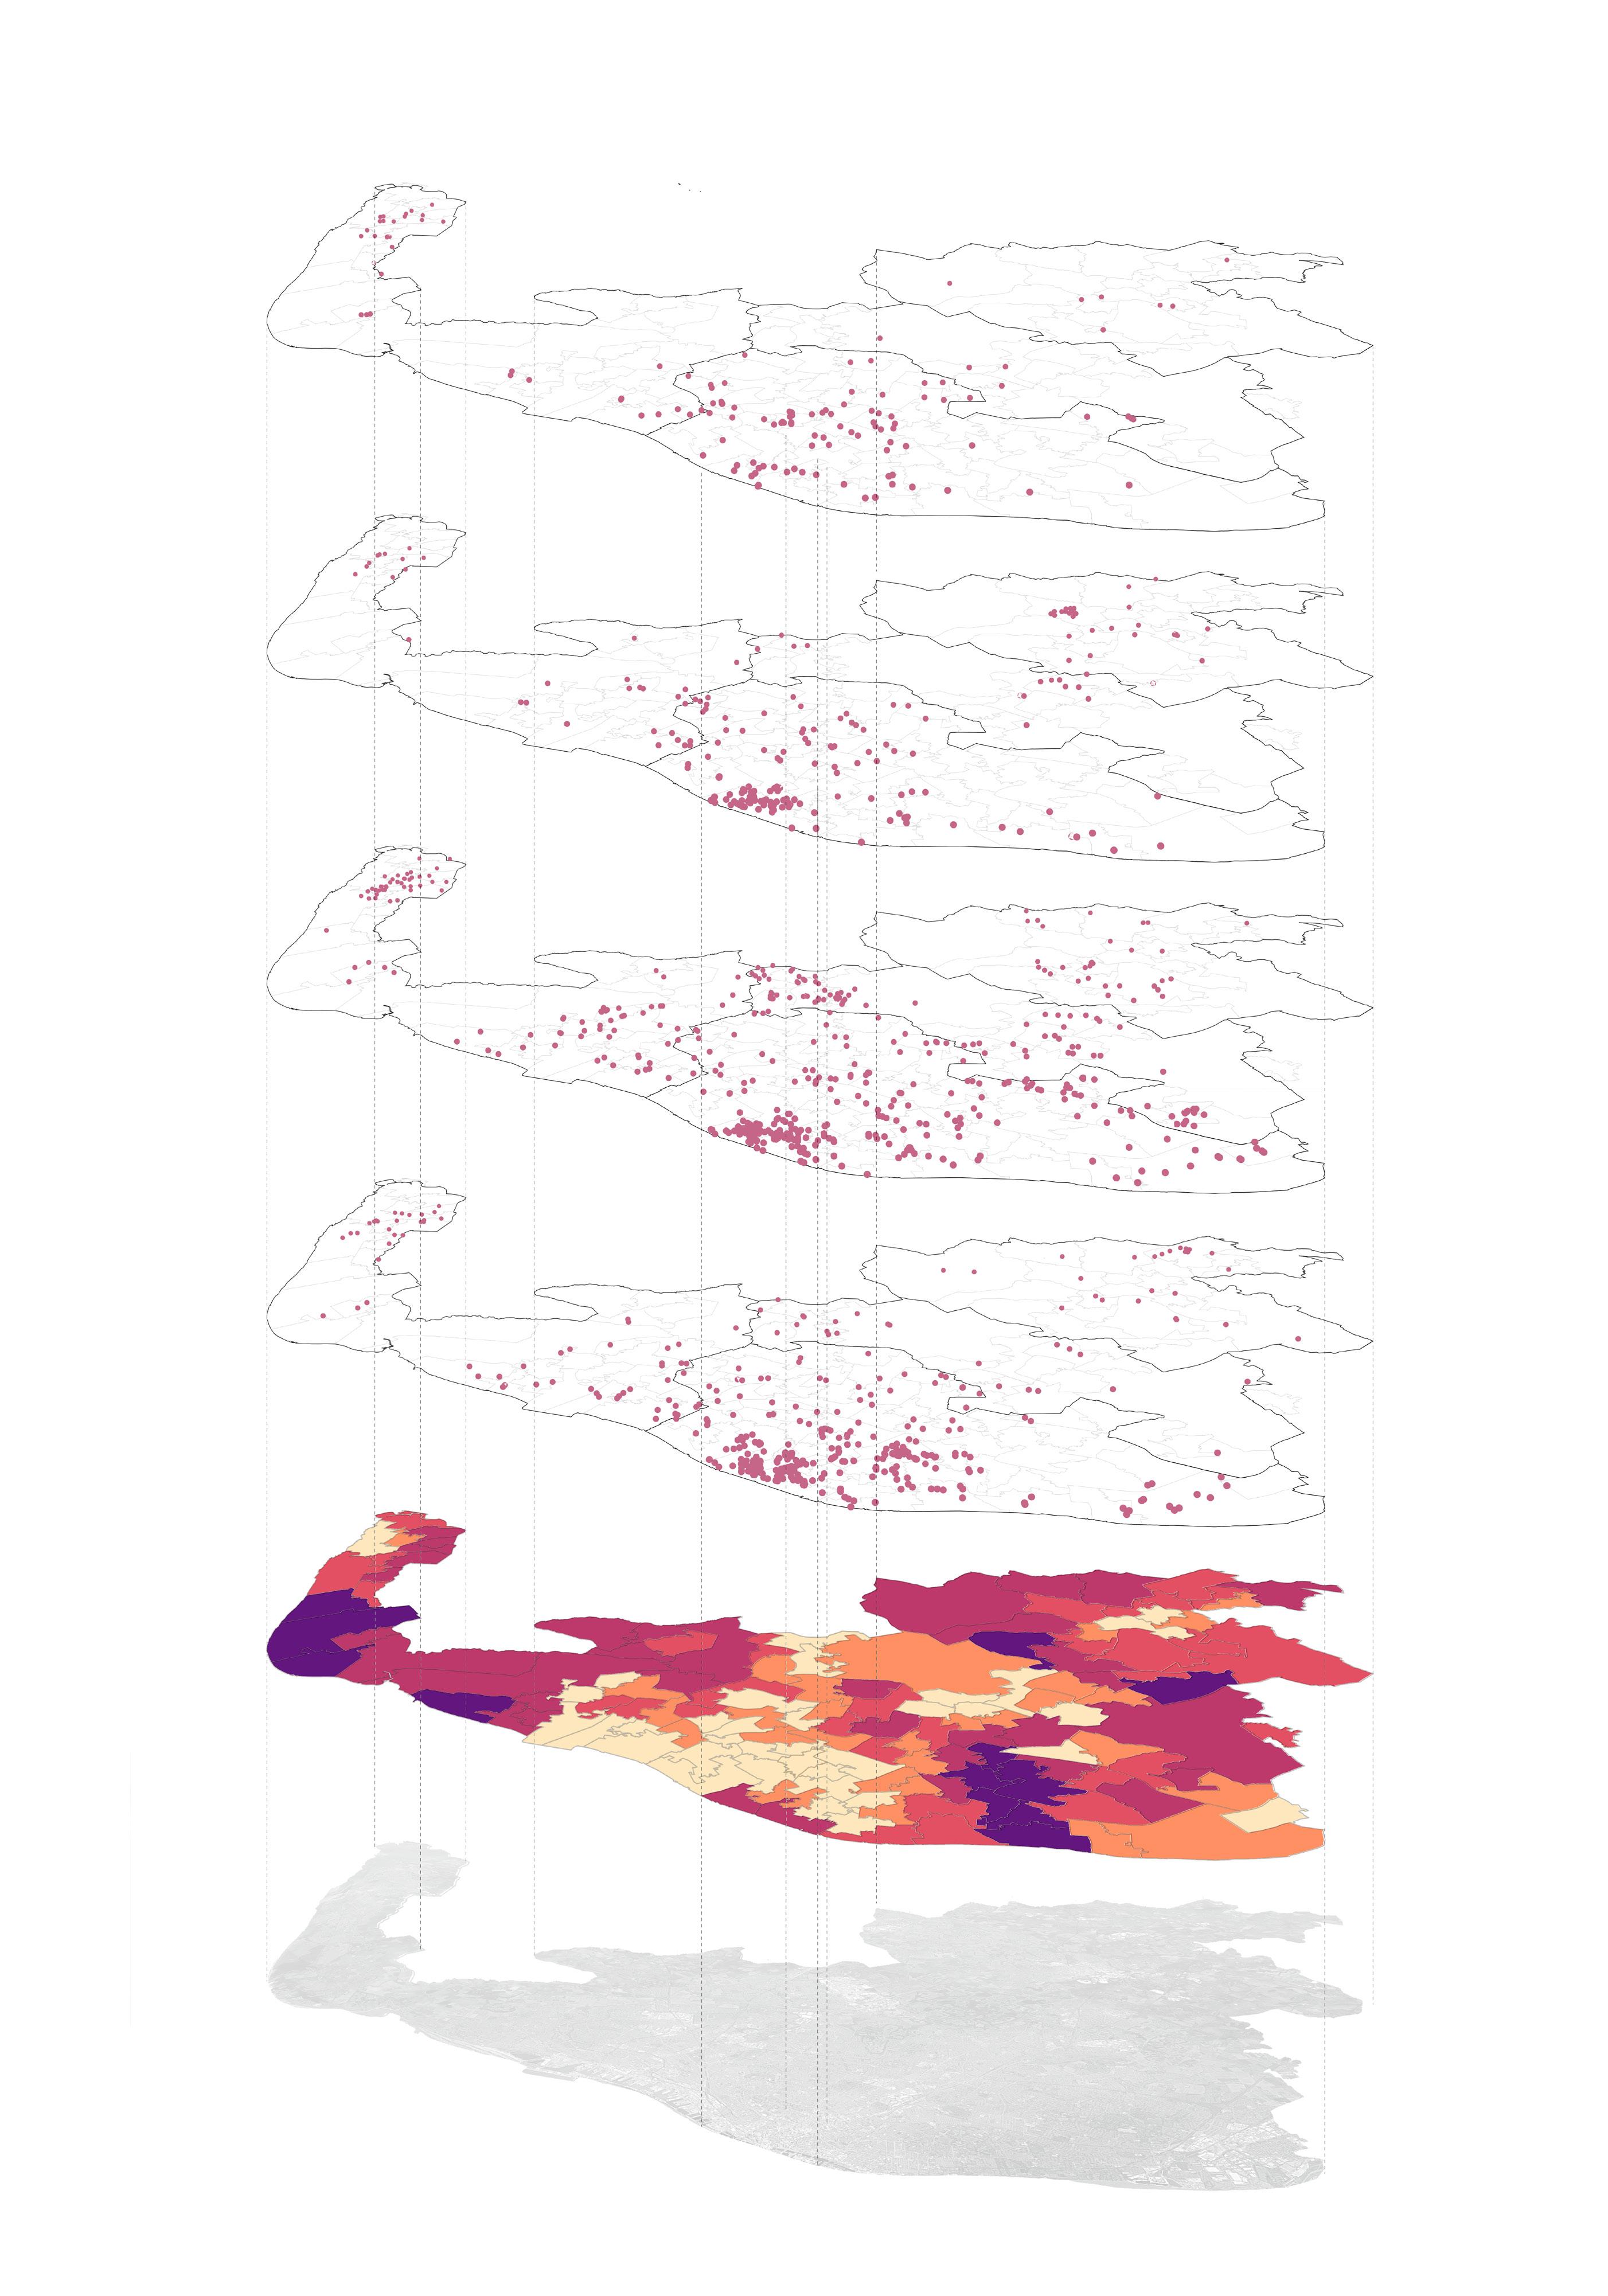
In the city center, we mapped information about recent or ongoing building proposals from the 2019 Liverpool Development Update to analyze the different types of projects being constructed or slated for development to compare their cost and functions.25
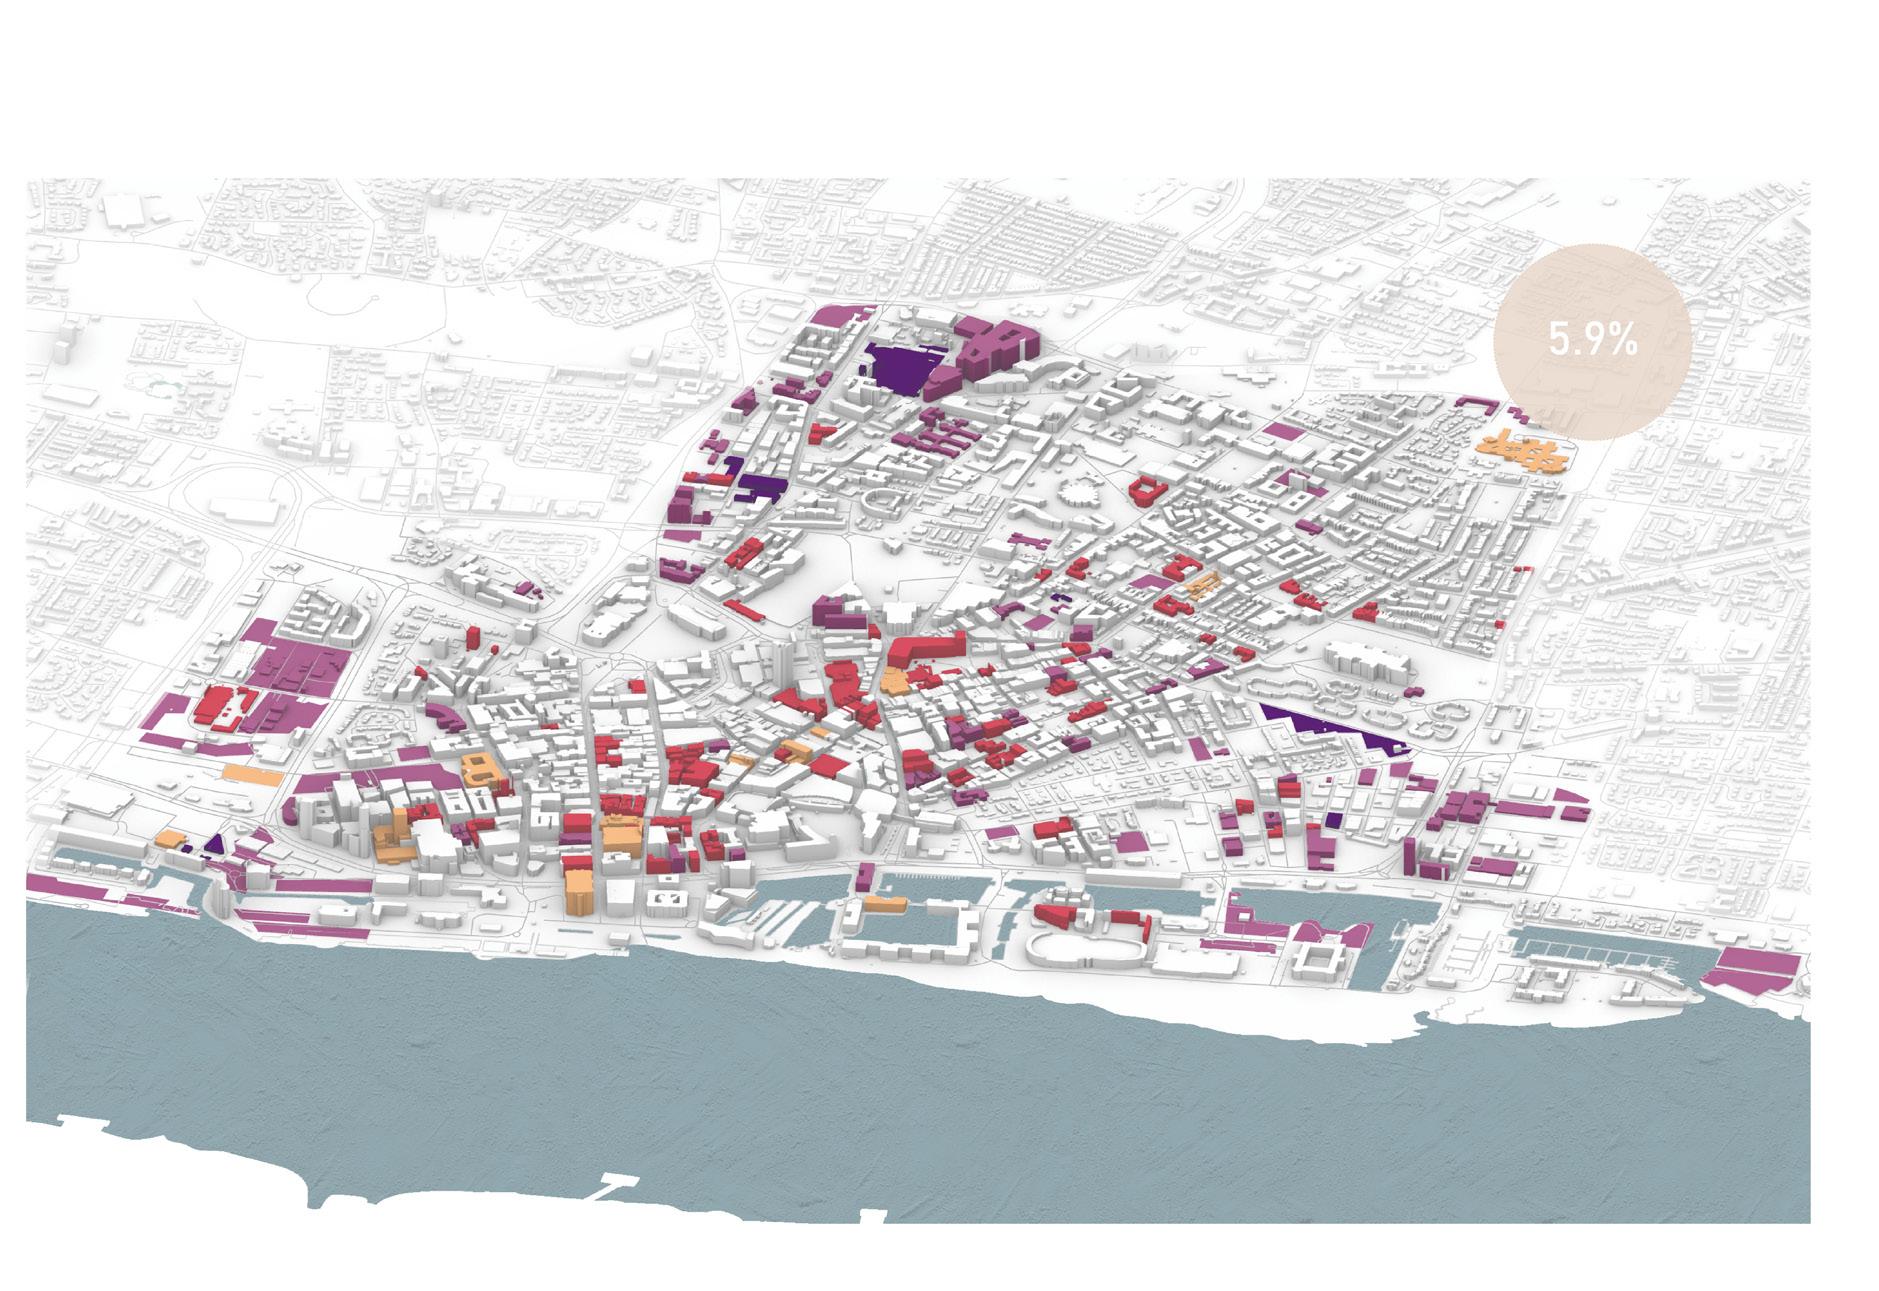
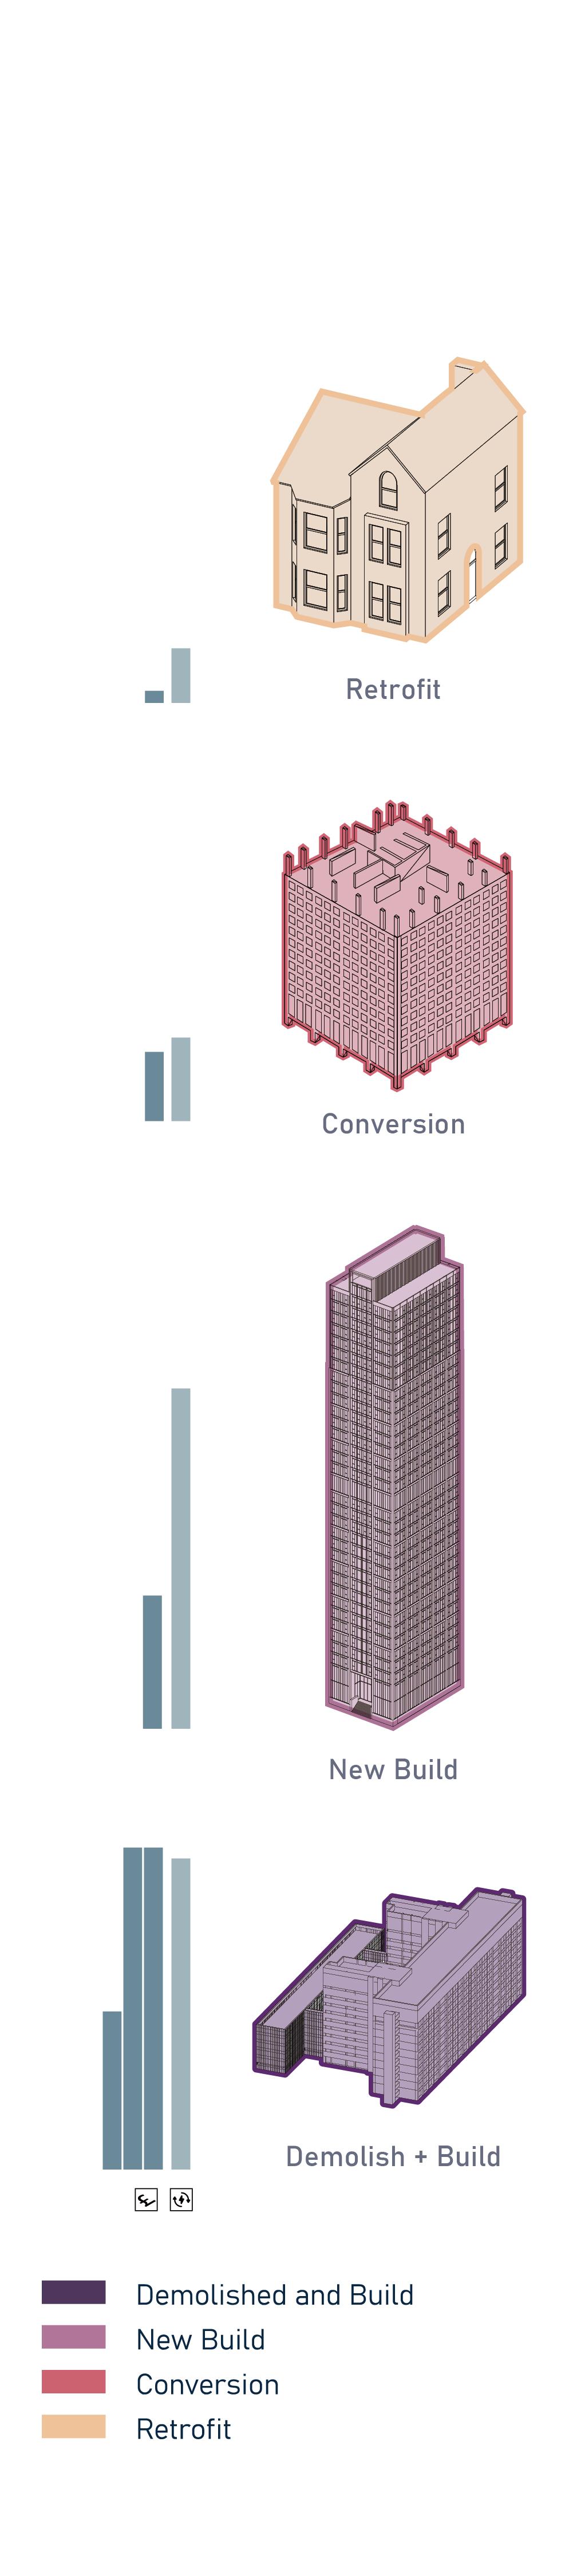
We divided these developments into four categories to better show their scope and potential effects on the city.
The Liverpool Development Update suggests that developments should take advantage of existing buildings where appropriate through refurbishment or rebuilding works, however this does not occur as frequently as would be suggested. Analyzing these recent projects in the Liverpool city center allows us to critique the types of projects being construction and their implications.
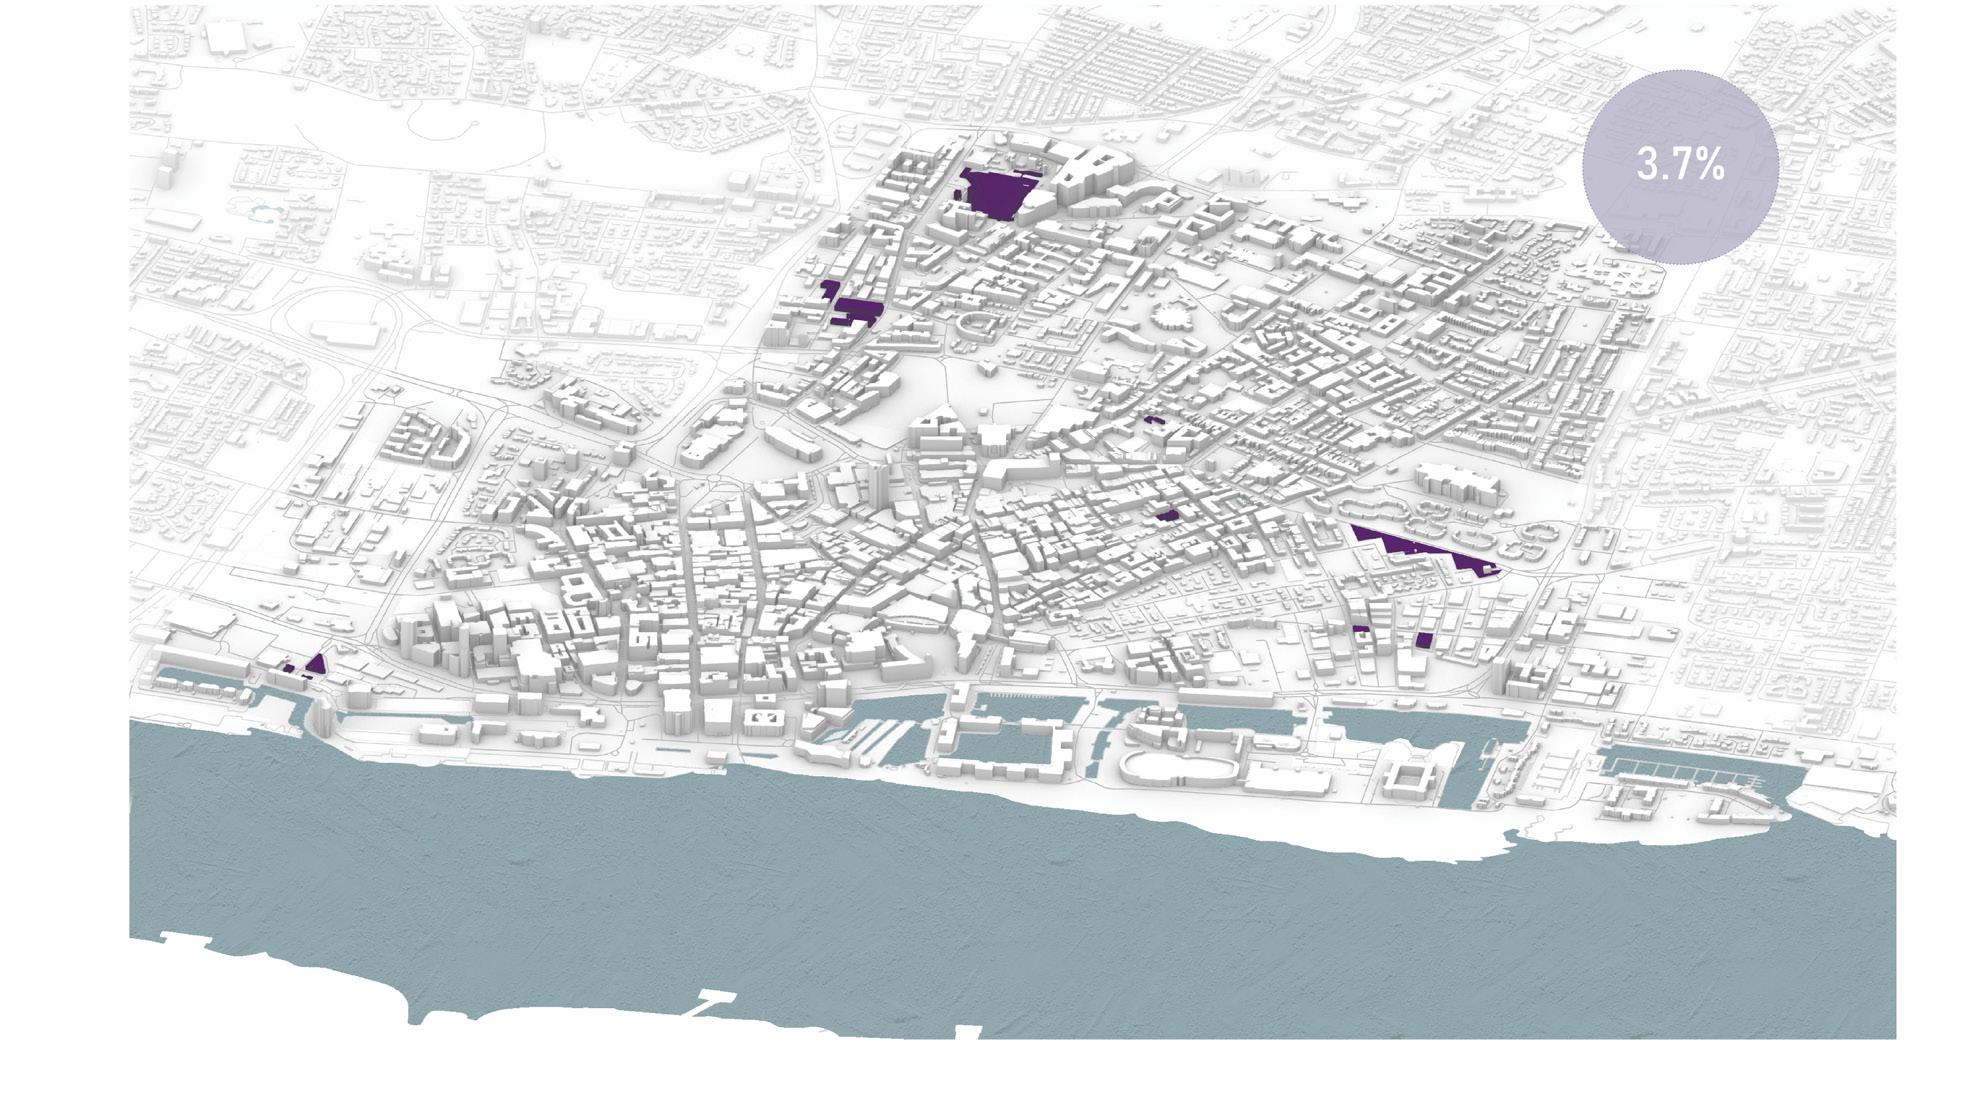
Demolish and build projects, which are the least sustainable construction model we categorized, accounted for 3.7 percent of the proposals in the report.
New build projects (which may also include demolitions) totaled over half of the developments in the city center. Pall Mall is one of the most expensive new build projects in the city, producing high-priced commercial space. It is estimated that the total cost of the three phases are £400m.
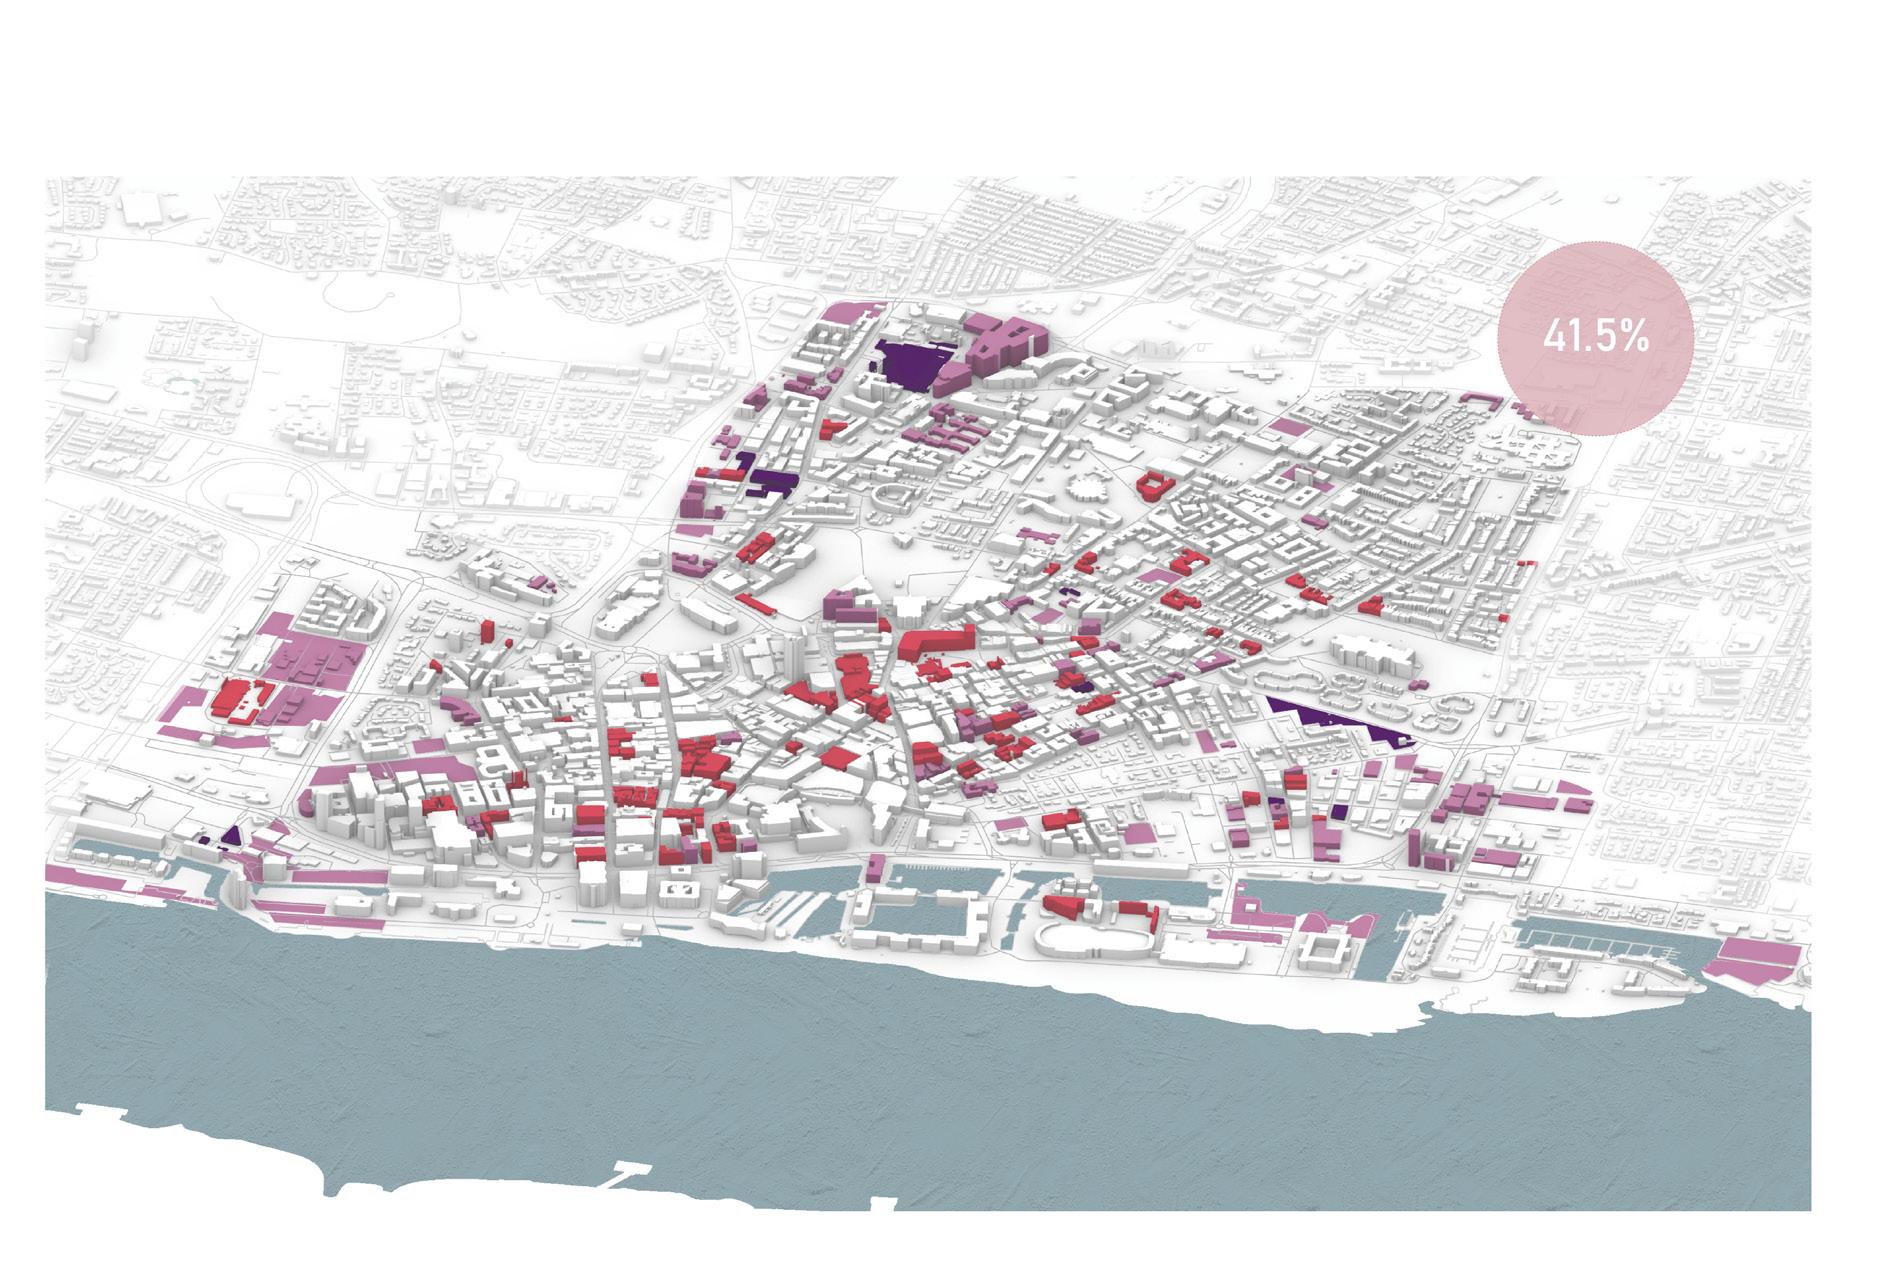
Conversion projects, which modernize and adapt an existing building to serve a new function, require less energy, materials, and cost compared with new building developments. Conversions accounted for over 40 percent of the projects listed.
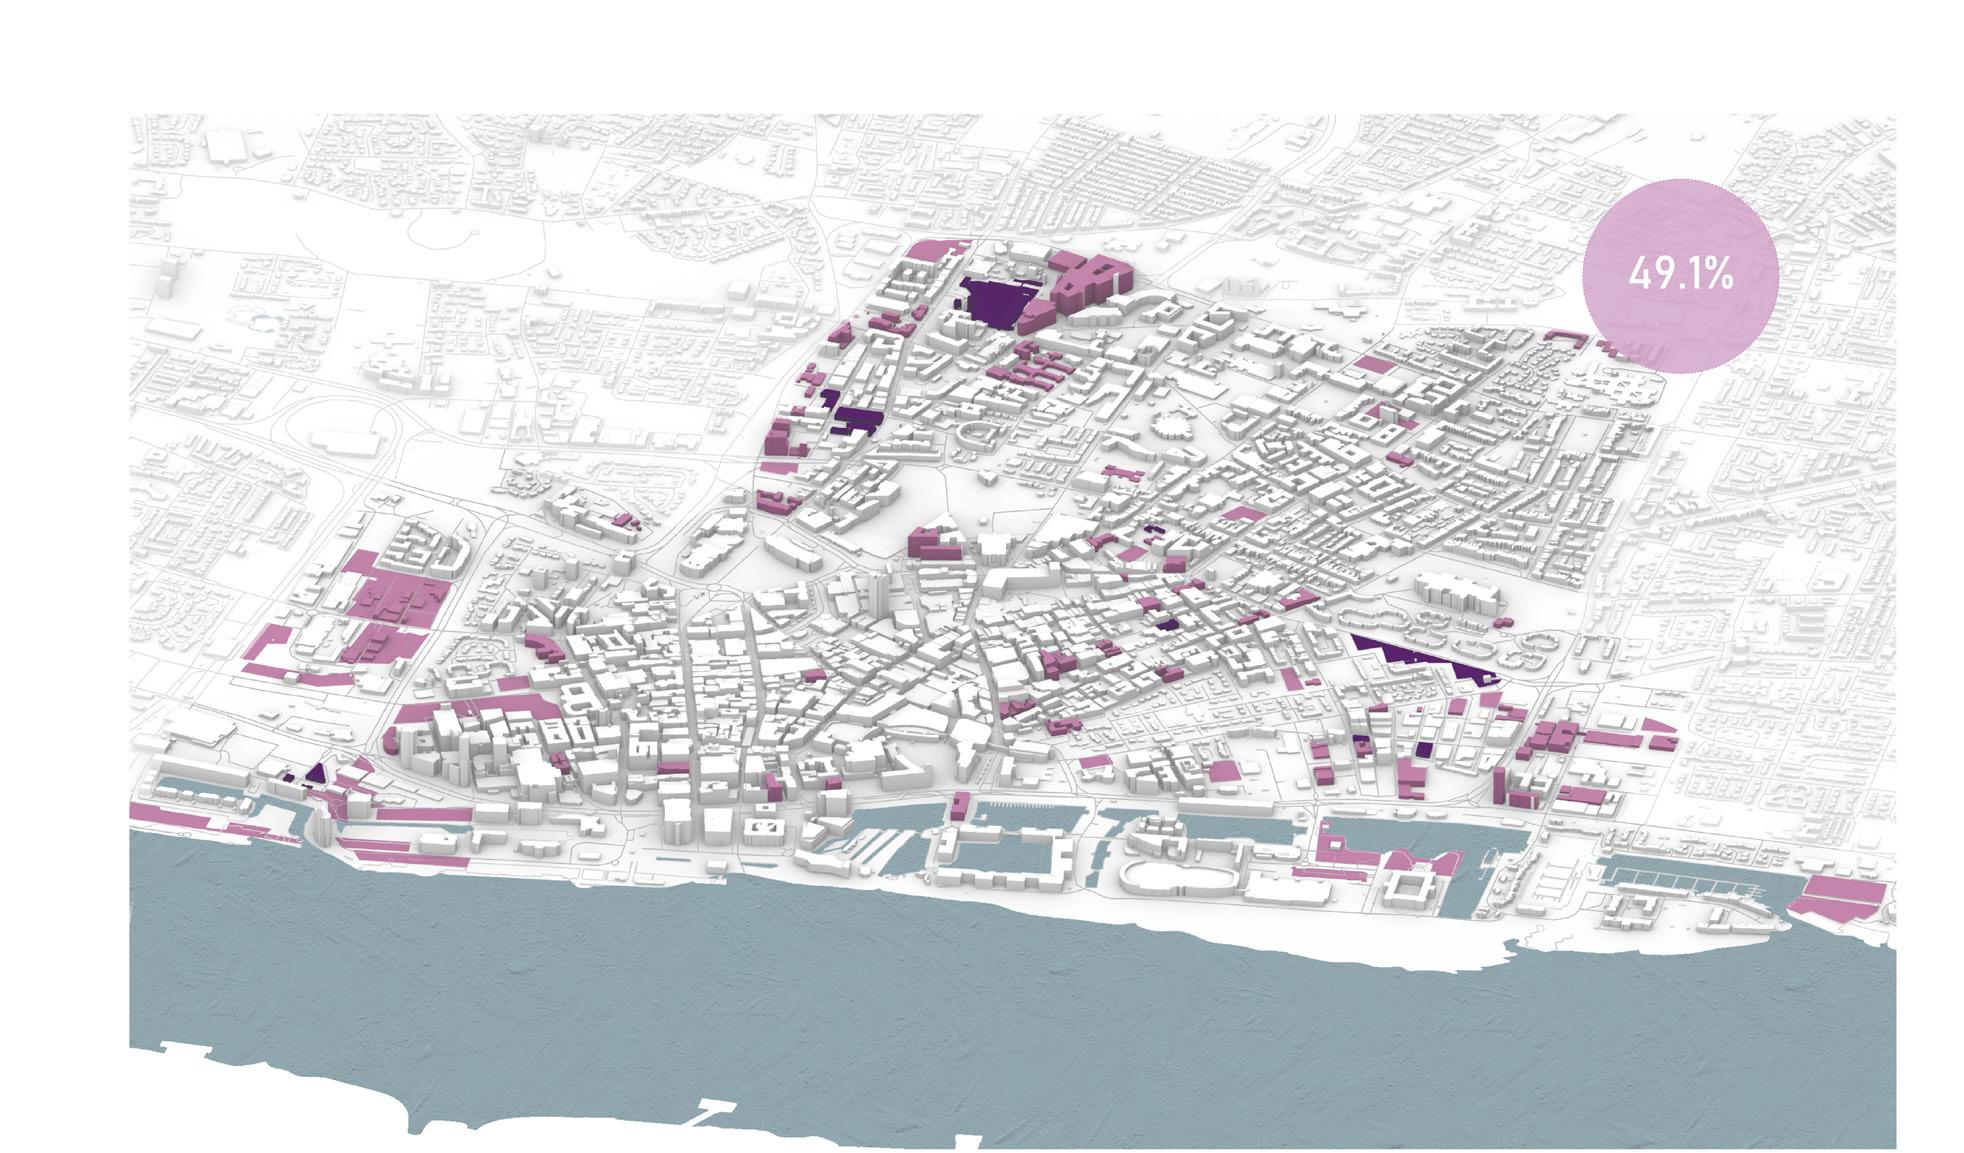
Retrofit projects are the least costly both financially and environmentally. This type of project involved refurbishing and modernizing an existing building. While they are typically cheaper and require less materials and labour than more substantial construction projects, they account for only a small share of the developments occuring in the Liverpool city center.
 Map 19. DEVELOpMENT TYpOLOGY. DEMOLITION aND BuILD
Map 20. DEVELOpMENT TYpOLOGY. NEW BuILD
byMingxiShu byMingxiShu
Map 21. DEVELOpMENT TYpOLOGY. CONVErSION
Map 22. DEVELOpMENT TYpOLOGY. rETrOFIT
byMingxiShu byMingxiShu
Map 19. DEVELOpMENT TYpOLOGY. DEMOLITION aND BuILD
Map 20. DEVELOpMENT TYpOLOGY. NEW BuILD
byMingxiShu byMingxiShu
Map 21. DEVELOpMENT TYpOLOGY. CONVErSION
Map 22. DEVELOpMENT TYpOLOGY. rETrOFIT
byMingxiShu byMingxiShu
49 48
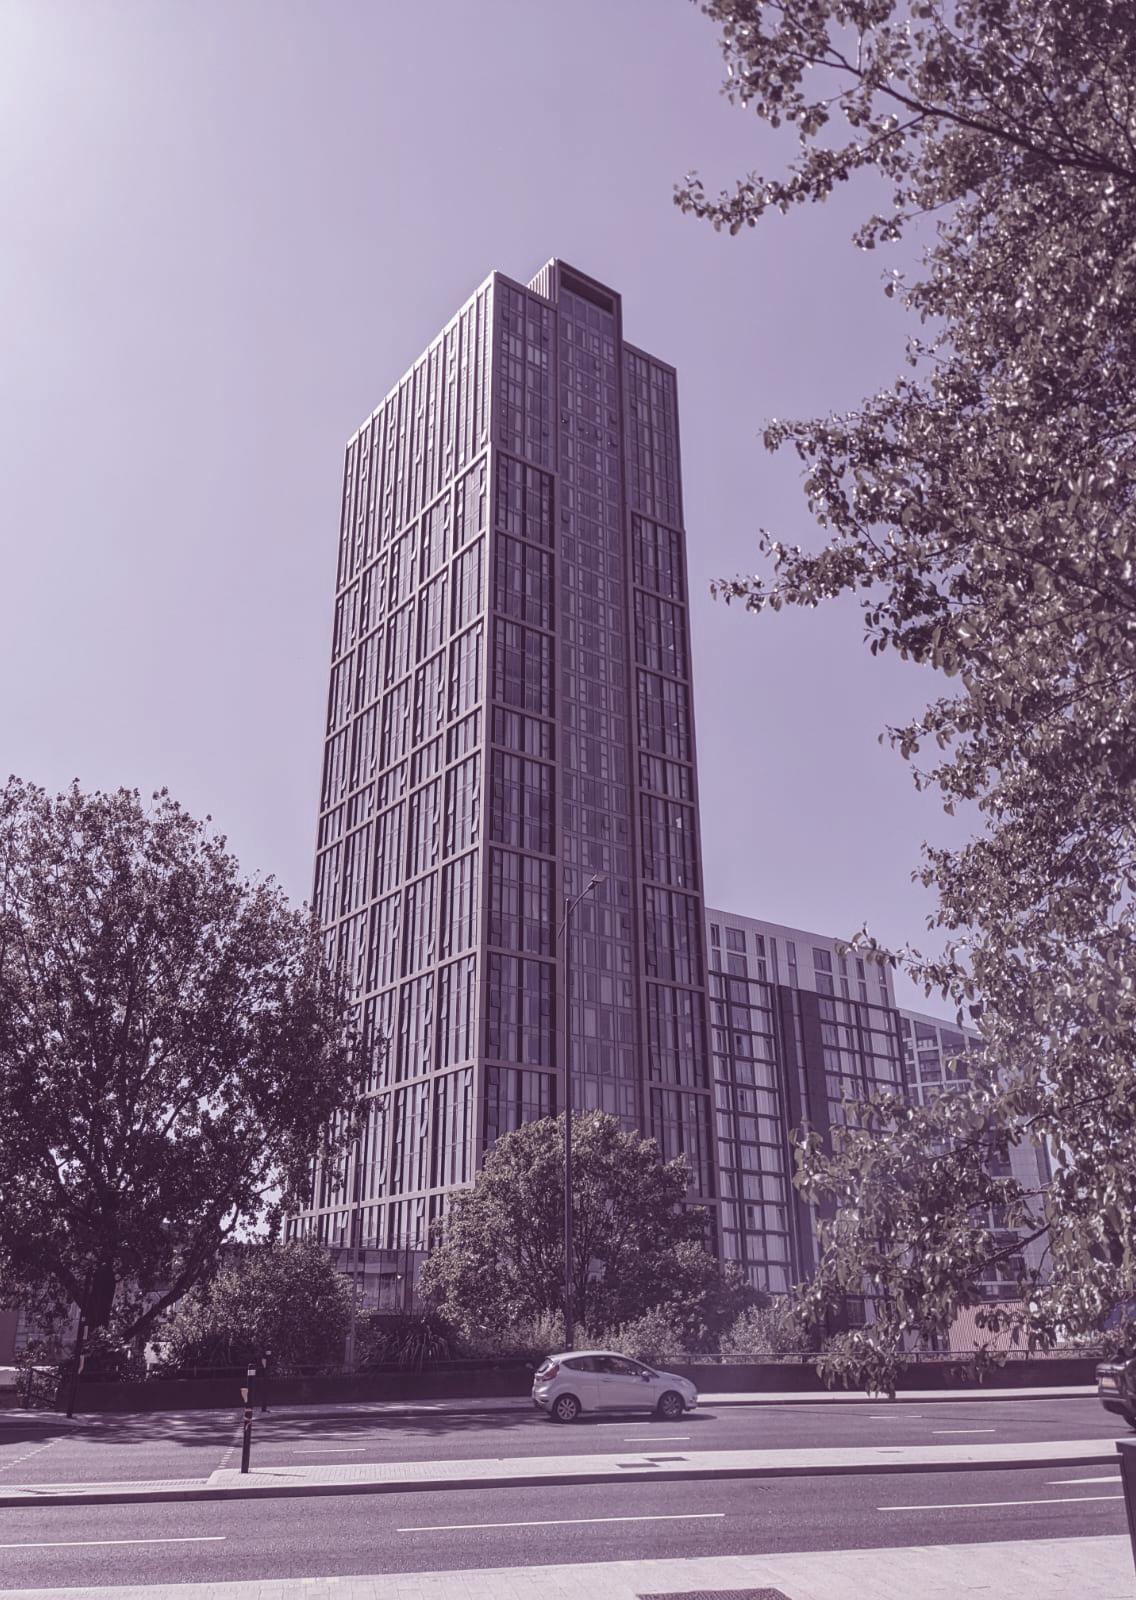
A TYPICAL HIGH-RISE DEVELOPMENT. THE LEXINGTON

City
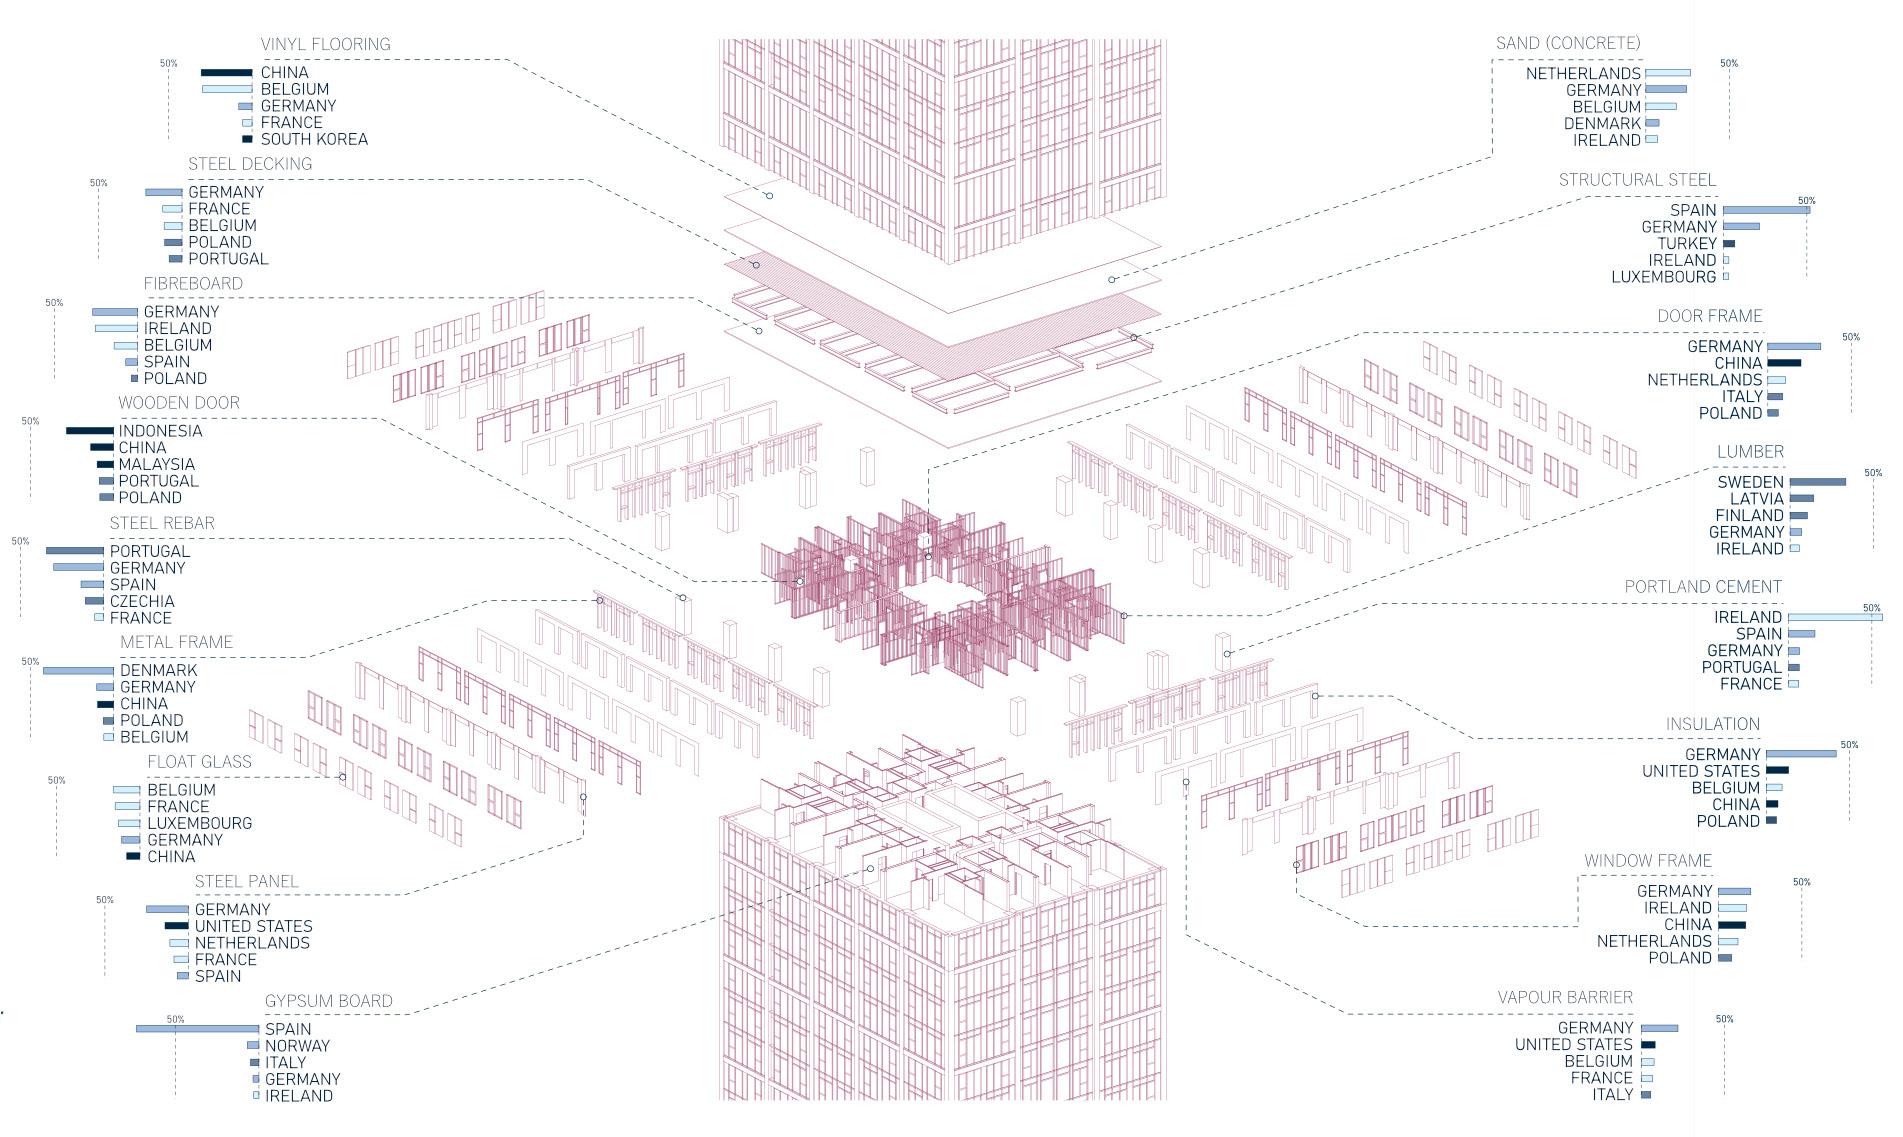
The Lexington in Liverpool is a prime example of the homogeneous neo-liberal developments occurring in cities across the globe. As cities across the world continue to grow, luxury condos like the Lexington are becoming more common sights. These buildings cater to the wealthy who can afford its flats and often use these properties as investments instead of as a primary residence. When cities construct these types of developments, housing prices can increase and lower-income residents in nearby neighborhoods can be priced out due to gentrification. These type of developments are often designed without taking into account the materials or the scale of nearby buildings.
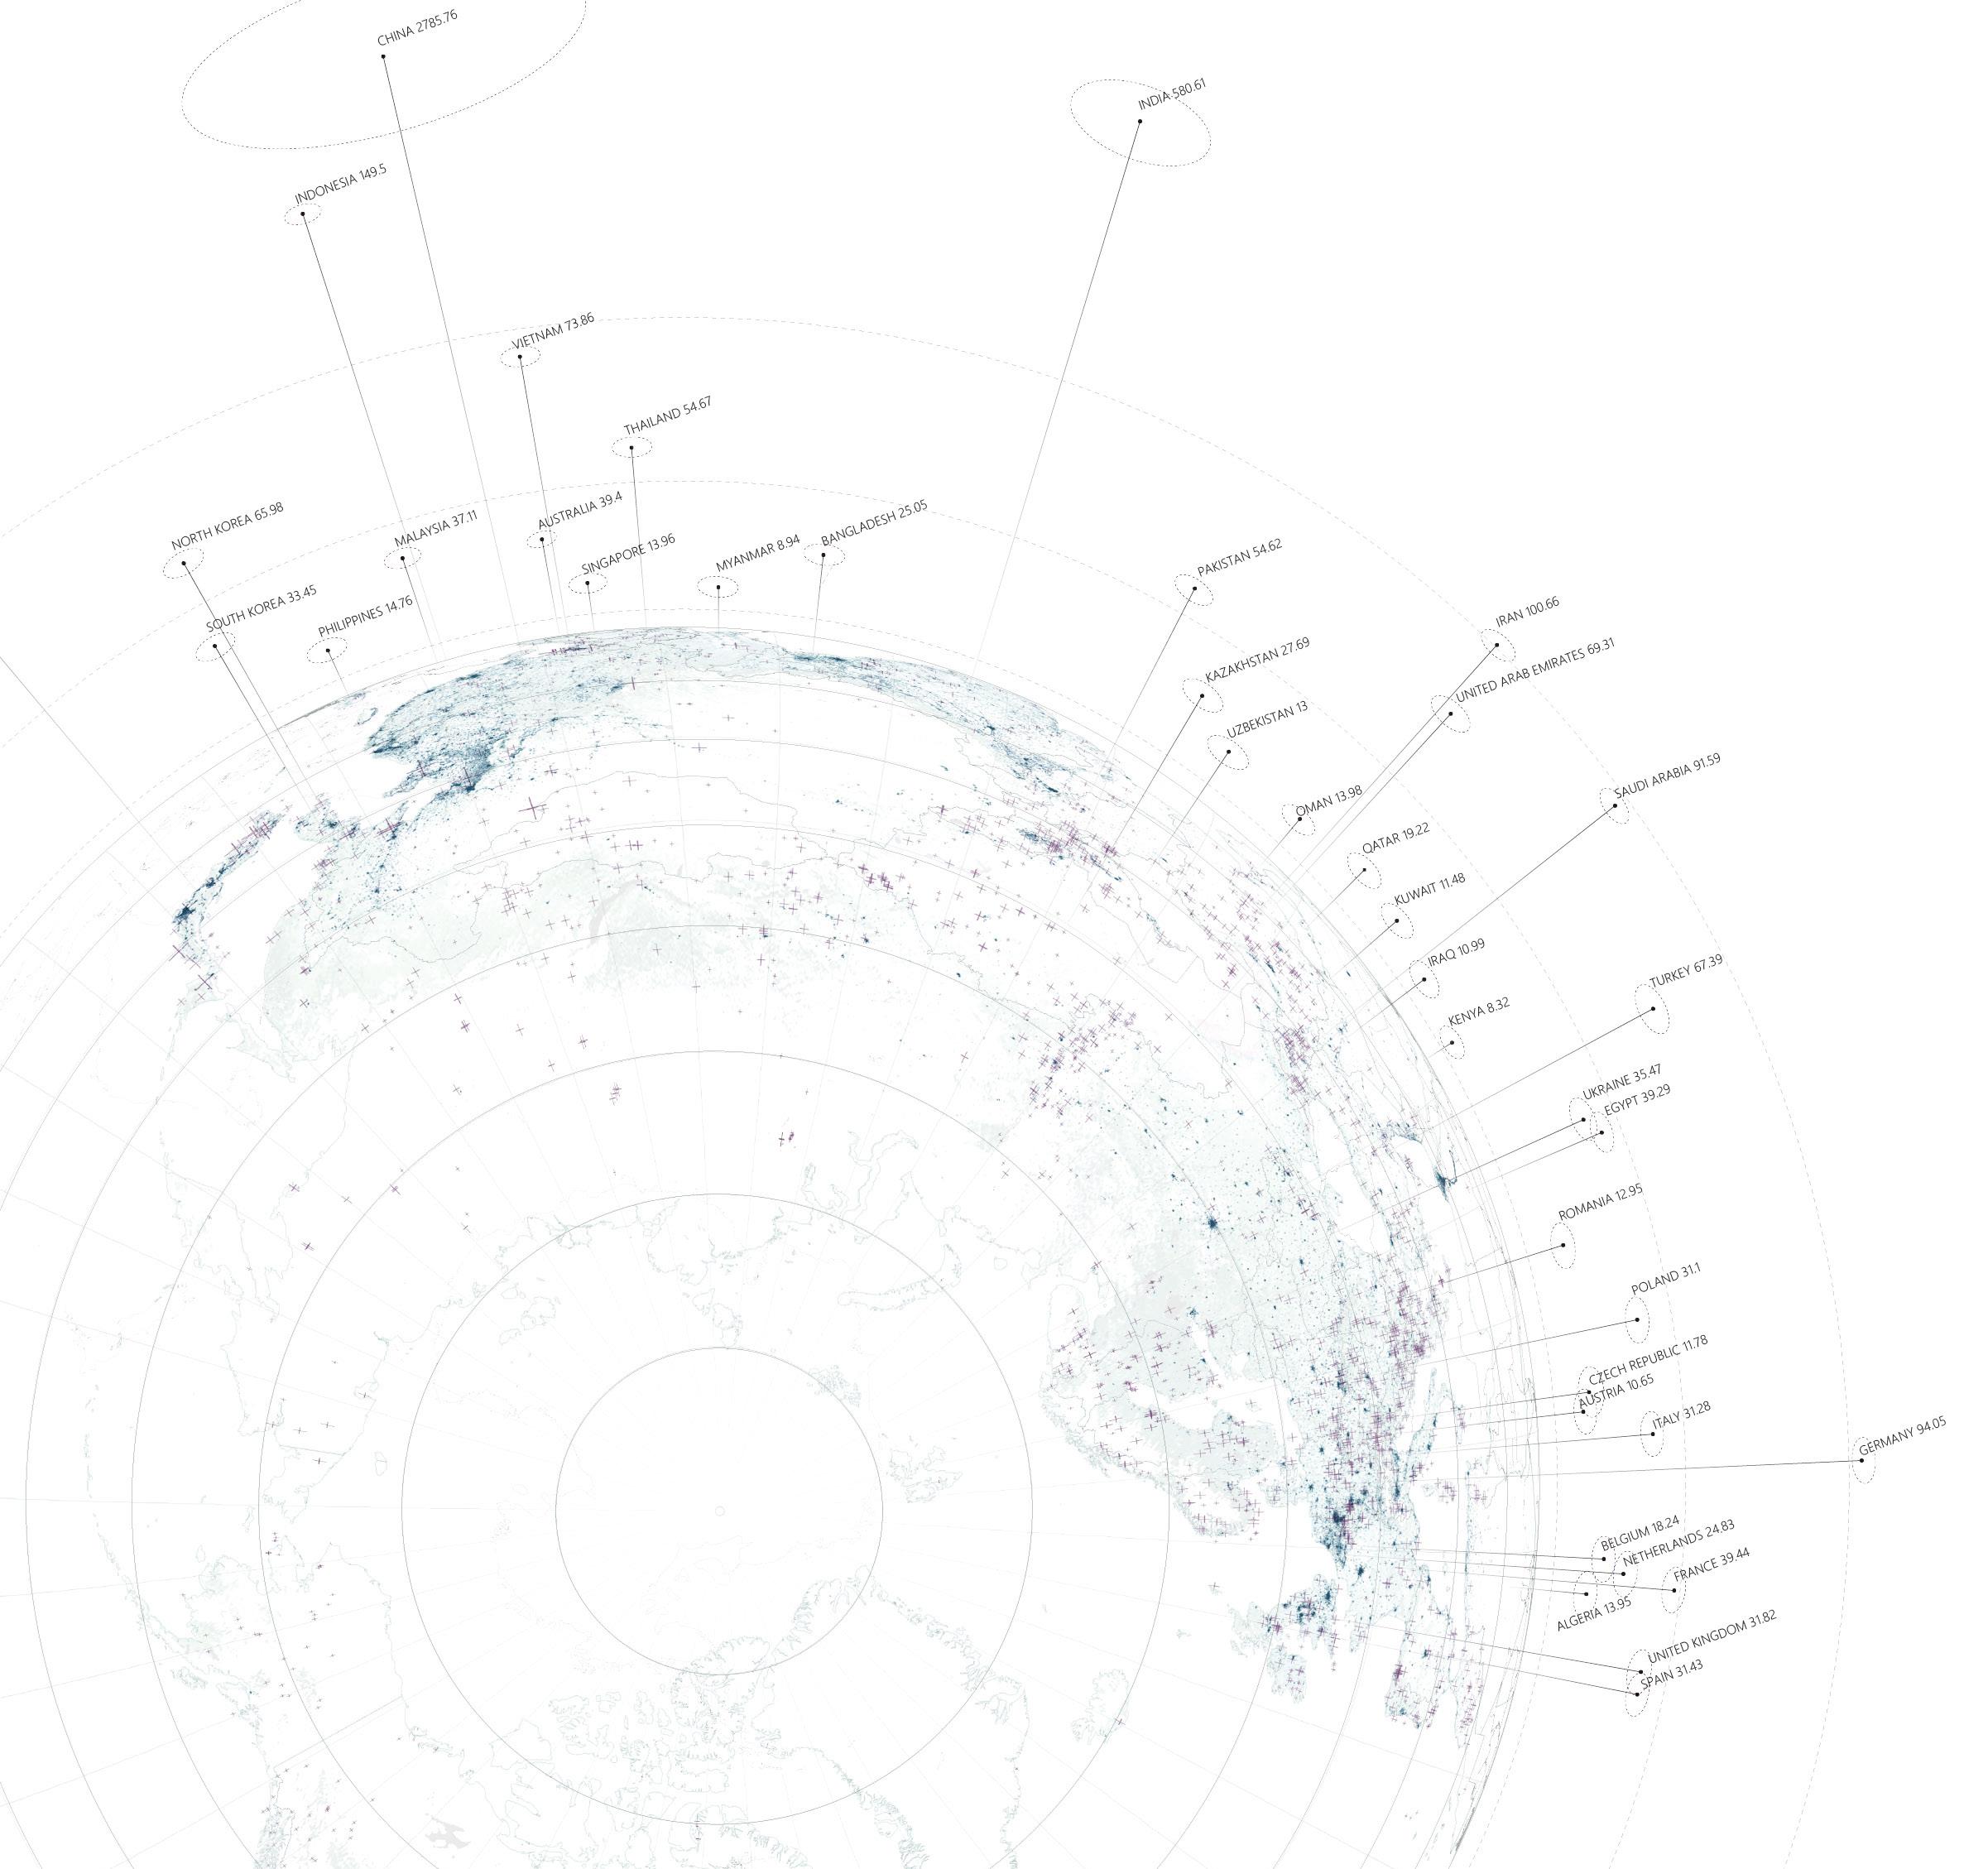
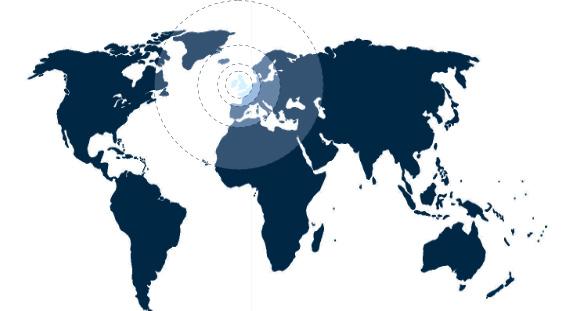
An exploded view of the materials typical in buildings like the Lexington reveals the complexity of its assembly and the wide variety of components used throughout its construction. We traced the possible origins of these materials by finding the top five countries that import each of these commodities into the UK to determine how far the average material used in this type of development must travel before construction. We discoverd, for example, that a more heavily processed and higher-value commodity like a wooden door is likely to have been produced far from the UK in countries like Indonesia or China while a cheaper product for its weight such as sand, which is a vital ingredient in the production of concrete, is more often to originate in a nearby country such as the Netherlands or Ireland.26
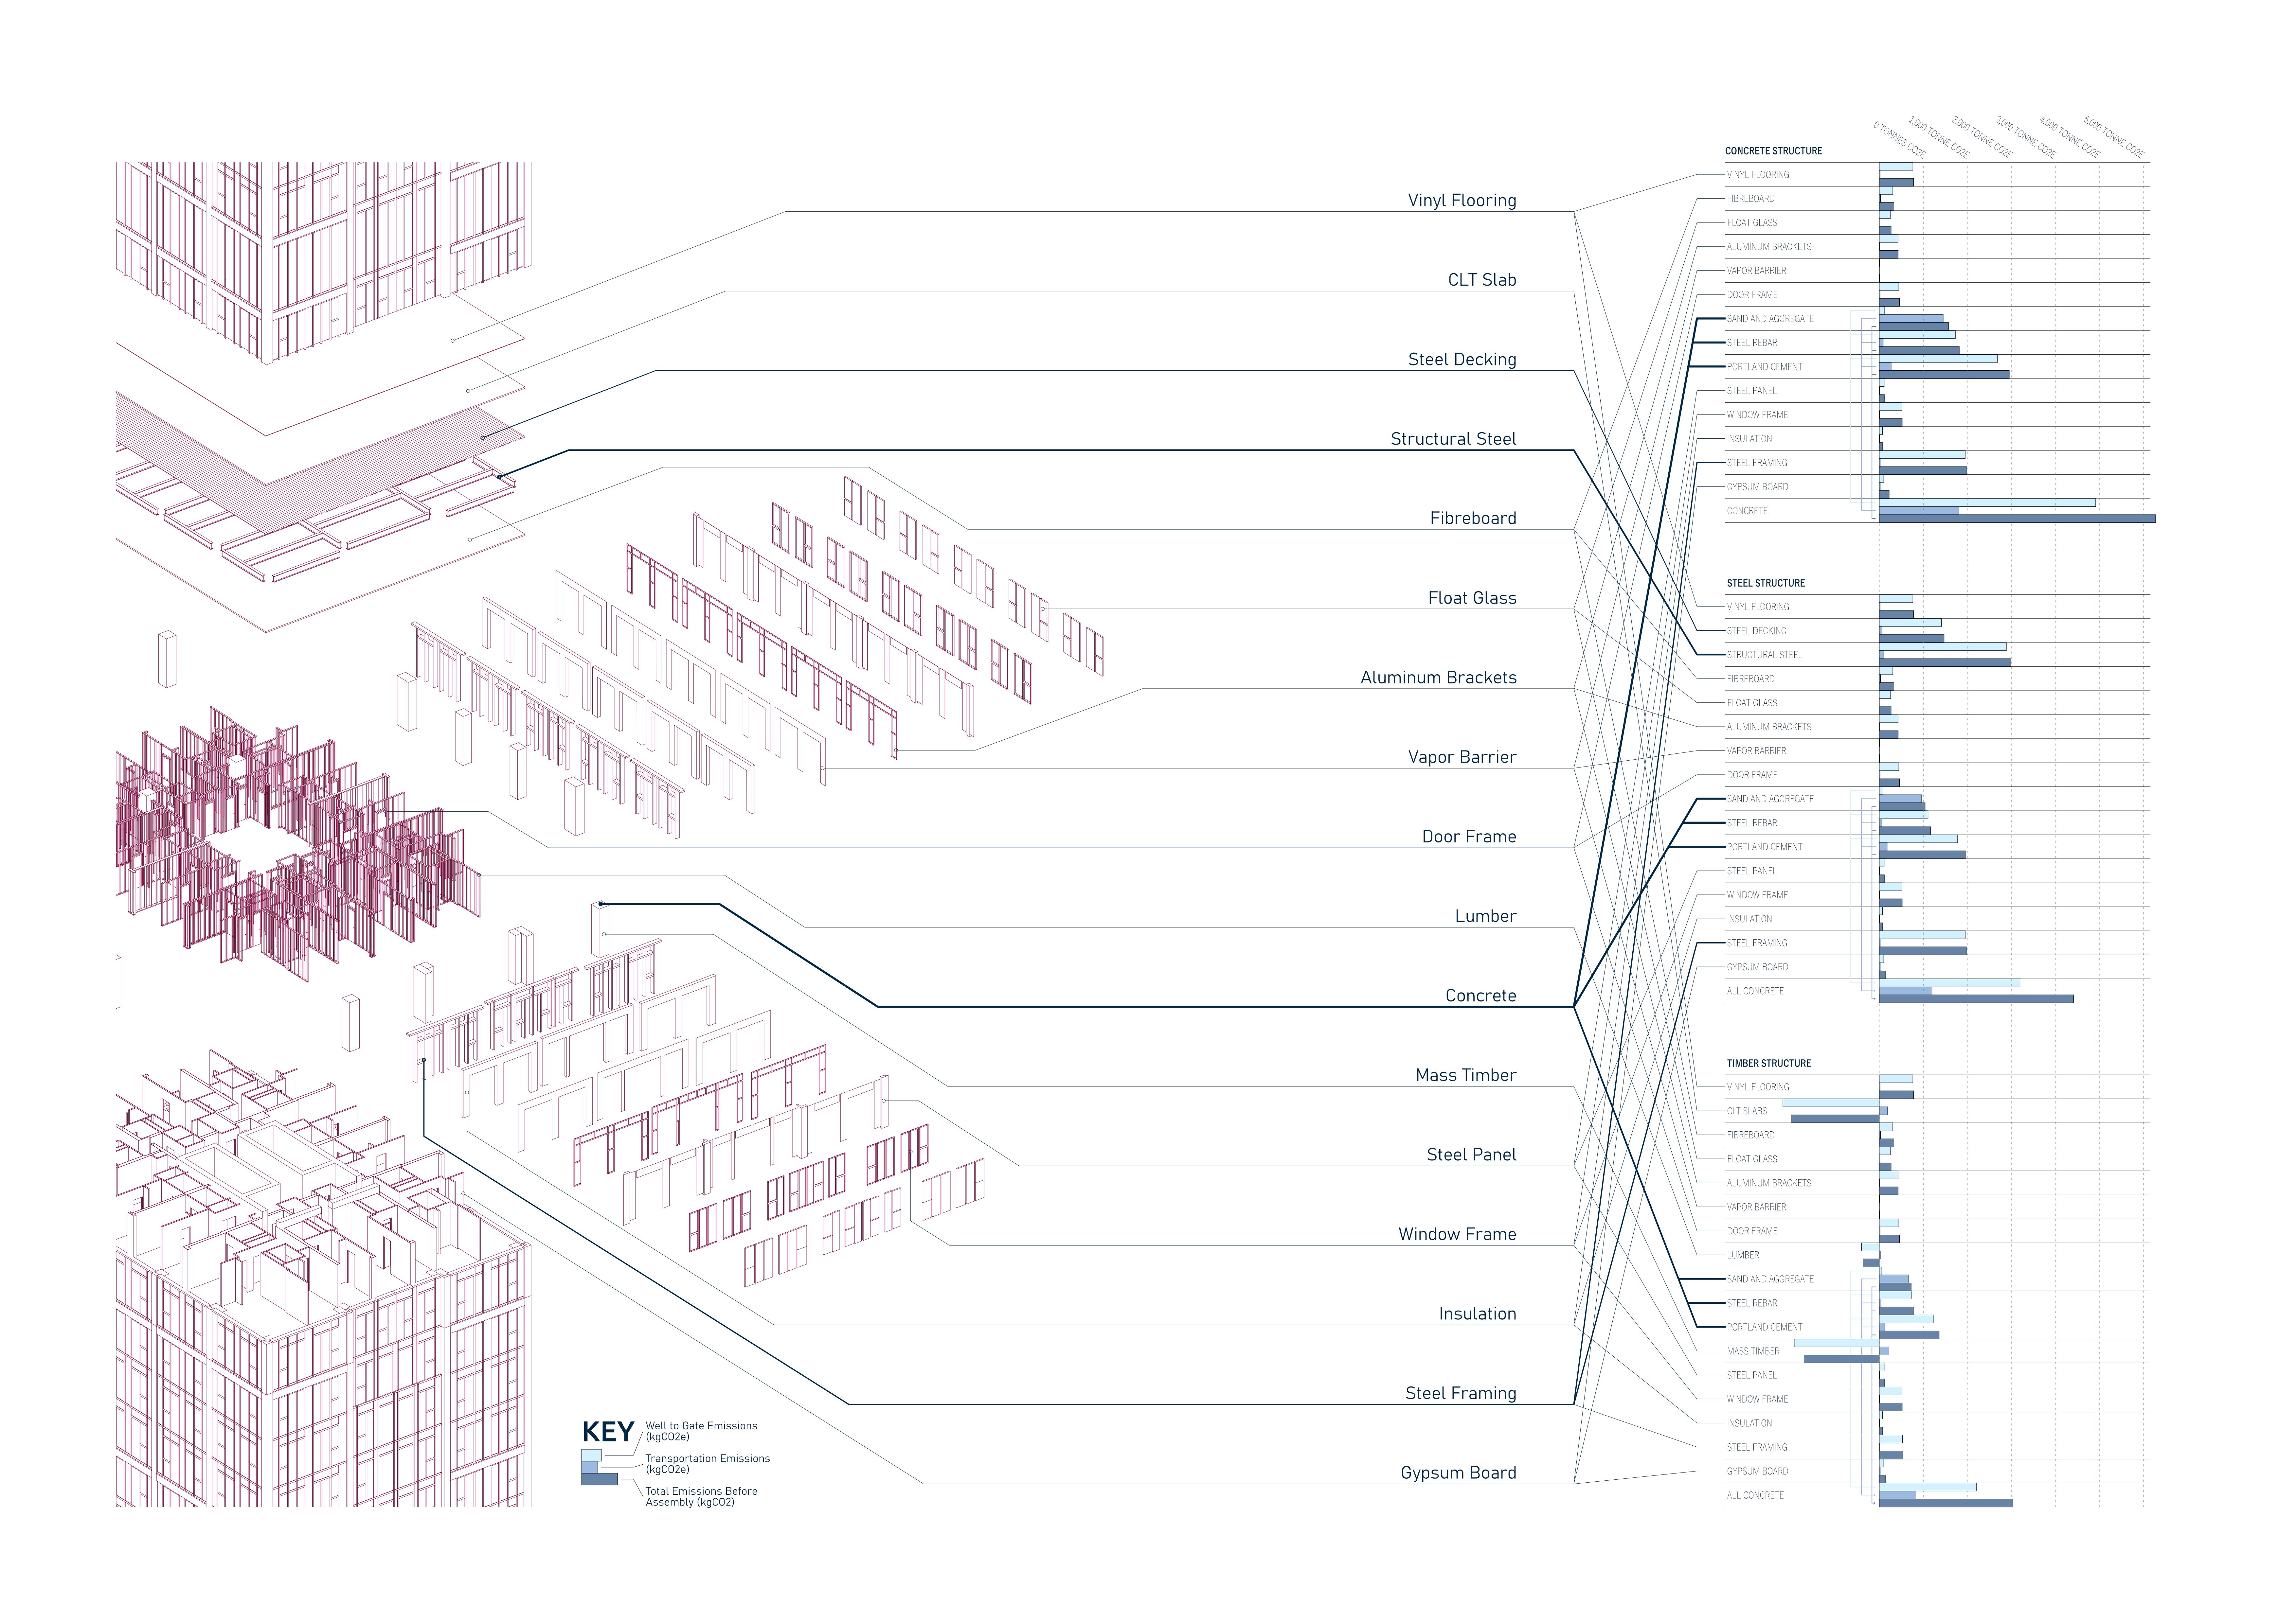
To construct a luxury high-rise residential building such as the Lexington in downtown Liverpool, a wide variety of materials from all over the world are manufactured, shipped, and assembled. From virgin raw material to finished product, the manufacturing of these materials results in significant carbon emissions. By cataloging these emissions along with the carbon released by transporting these materials, we can better understand the effects on the atmosphere associated with the construction of a single luxury high-rise. While the transportation emissions are significant, they pale in comparison to those resulting from material extraction and manufacturing.
byBradleyNissen
Map 24. THE LEXINGTON. GLOBaL OrIGINS OF CONSTruCTION MaTErIaLS. byBradleyNissen
Liverpool, The Neoliberal
Map 23. GLOBaL OrIGINS OF CONSTruCTION MaTEr aLS KEY Map
51 50
FIGurE 9. THE LEXINGTON BuILDING. OriginalphotobyBradleyNissen
CARBON EMISSIONS OF CONSTRUCTION MATERIALS
Liverpool, The Neoliberal City
Map 25. THE LEXINGTON. ENVIrOMENTaL IMpaCT OF NEW DEVELOpMENTS byBradleyNissen 53 52
REFERENCES
18. Online, Ross From. ‘What Managed Decline in Liverpool Can Teach Us about Conservative Attitudes towards Vulnerable…’. Medium (blog), 14 March 2020. https://medium.com/@rossjenk32/ what-managed-decline-in-liverpool-can-teach-usabout-conservative-attitudes-towards-vulnerablea86b6f10a229.
19. Housing Market Renewal Initiative Annual Report 2006/2007. Liverpool City Council, 2007.
20. Waite, Richard. “Pathfinder Fails for Liverpool.” Architects Journal, April 29, 2010. https://www.architectsjournal.co.uk/archive/ path%EF%AC%81nder-fails-for-liverpool. Accessed August 17, 2022.
21. Meddings, Sabah, and Nathaniel Barker. “How £1 Homes in Liverpool Ended up in the Hands of Tycoon Li Ka-Shing.” The Sunday Times. August 14, 2022. https://www.thetimes.co.uk/article/how1-homes-in-liverpool-ended-up-in-the-hands-oftycoon-li-ka-shing-ls5jszph0. Accessed September 1, 2022.
22. Information produced by HM Land Registry © Crown copyright [2022].
23. Information produced by HM Land Registry © Crown copyright [2022].
24. Information produced by HM Land Registry © Crown copyright [2022].
25. “Liverpool Development Update October 2019.” Liverpool: Liverpool City Council, October 2019.
26. AJG Simoes, CA Hidalgo. The Economic Complexity Observatory: An Analytical Tool for Understanding the Dynamics of Economic Development. Workshops at the Twenty-Fifth AAAI Conference on Artificial Intelligence. (2011)
55 54
03 THE GRANBY MODEL

CHAPTER 3 57
03.2 CASE STUDY OF GRANBY COMMUNITY LAND TRUST 03.4 REFERENCES 03.1 PUBLIC-PRIVATE PARTNERSHIP 03.3 PUBLIC-COMMON PARTNERSHIP
PUBLIC-PRIVATE PARTNERSHIP
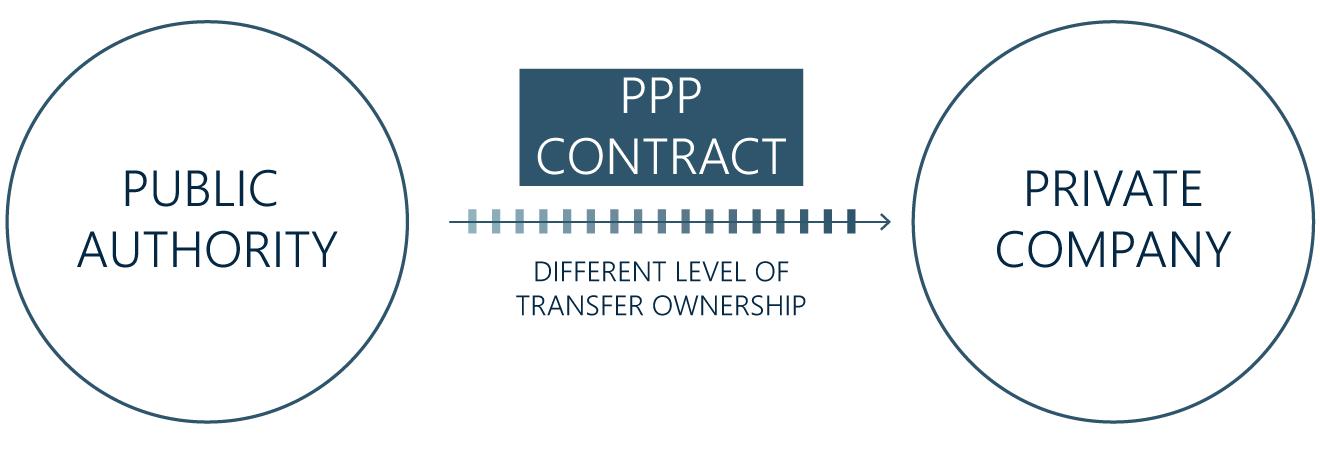
Many large-scale developments could be classified as public-private partnerships. Within this model, land or properties owned by the public are sold or leased to private companies to increase profits for the local authority with the goal of reducing costs for the city council and boosting the local economy. This profit-driven model seeks a high rate of return and the needs of the communities affected are often disregarded.
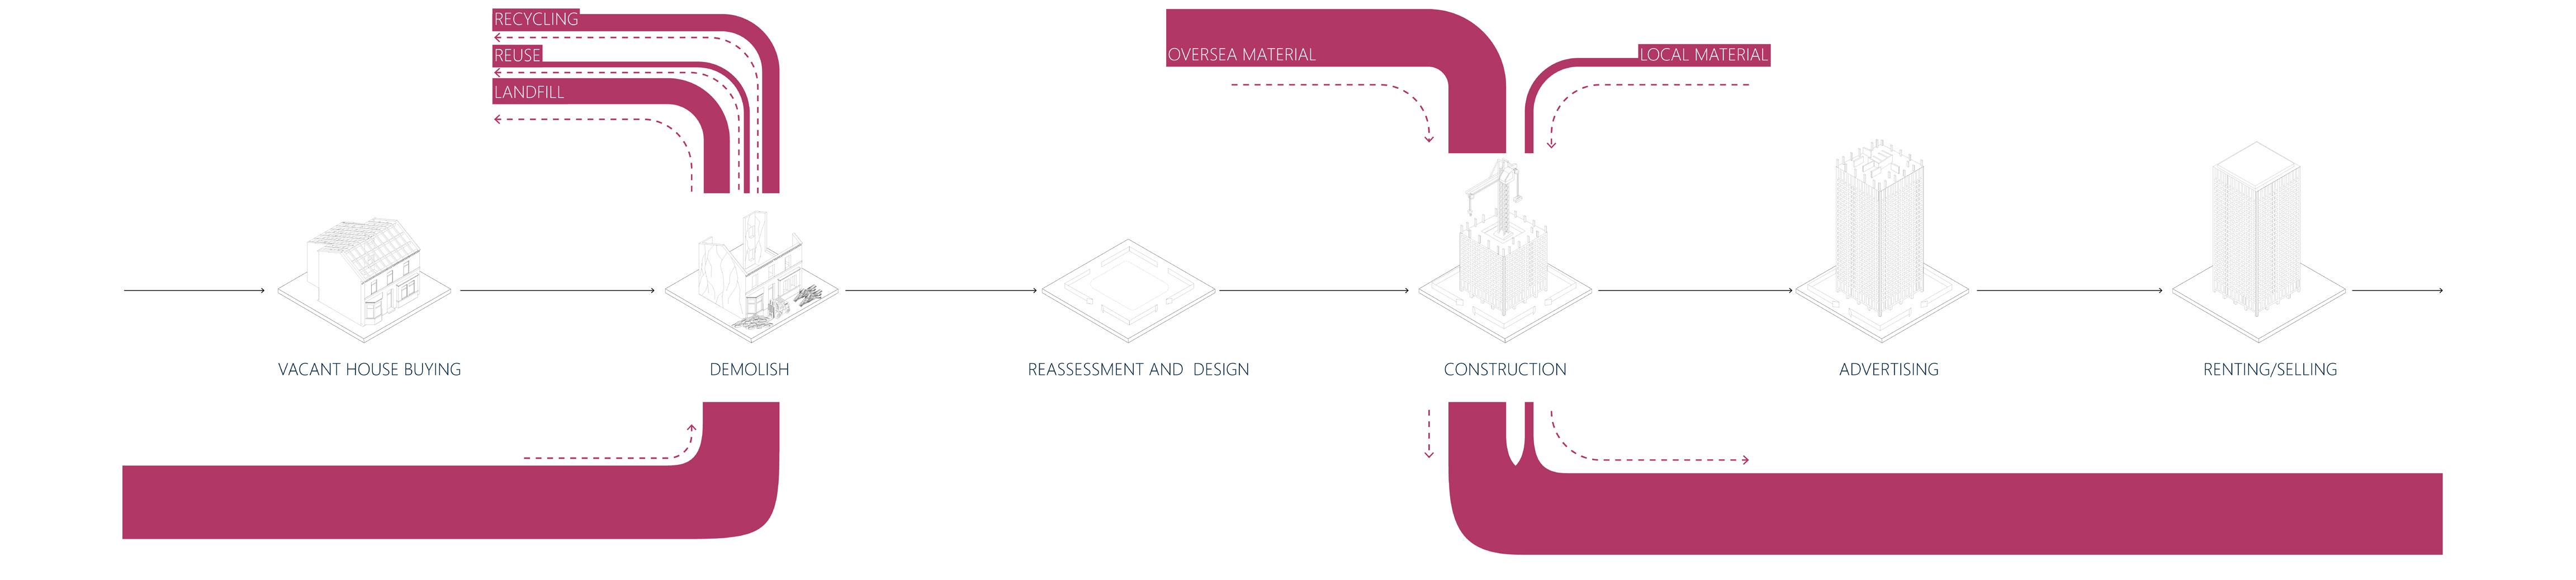
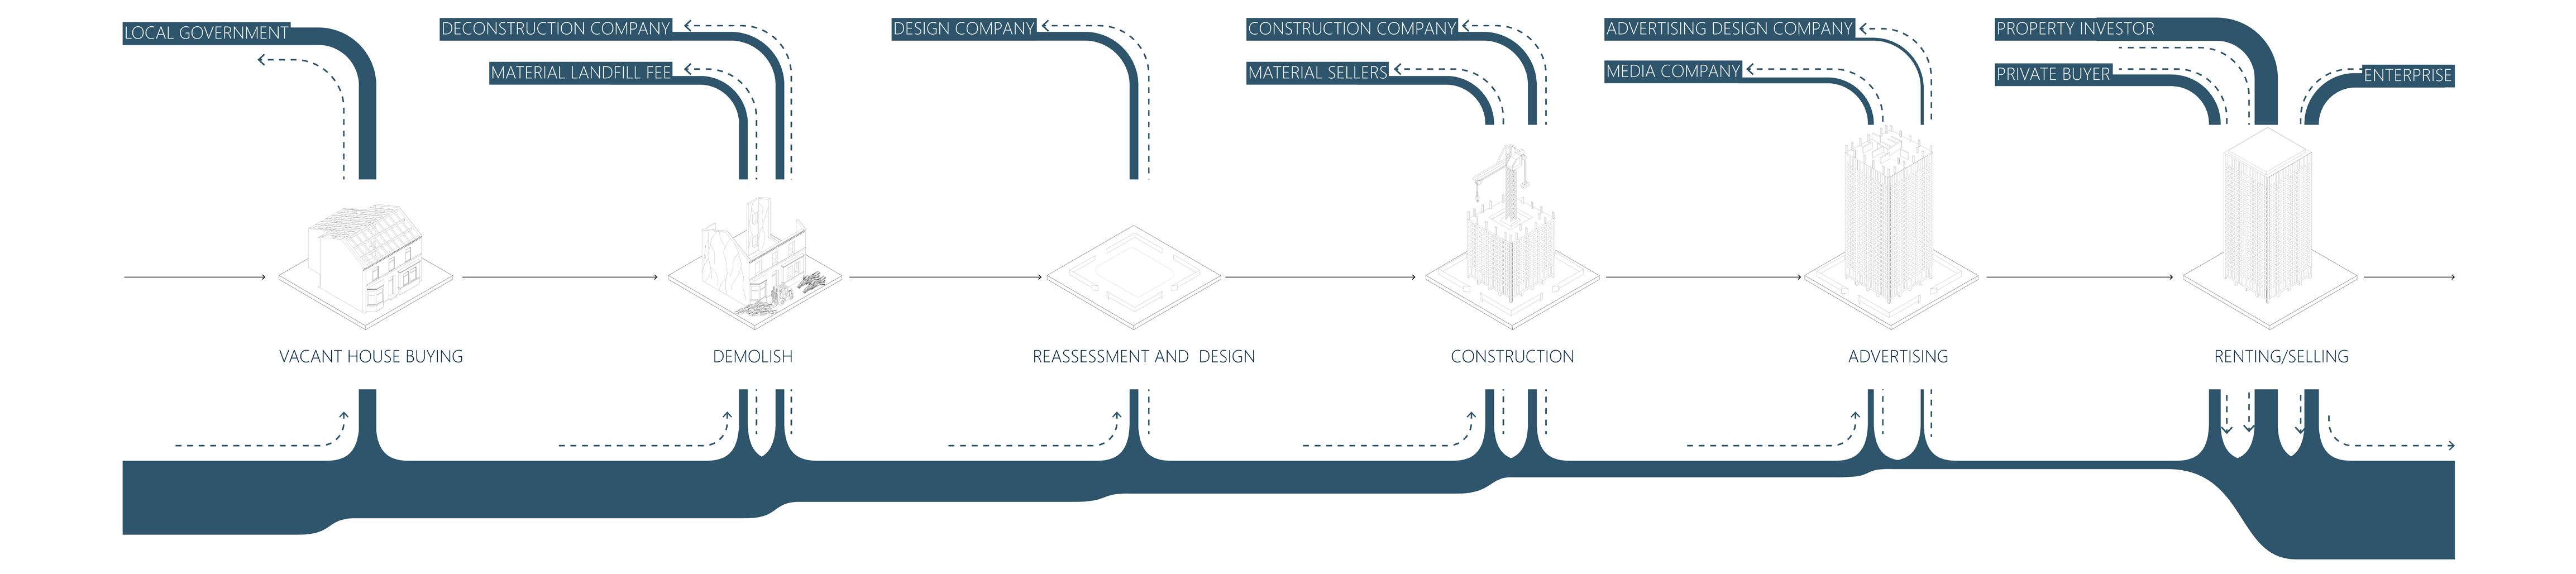
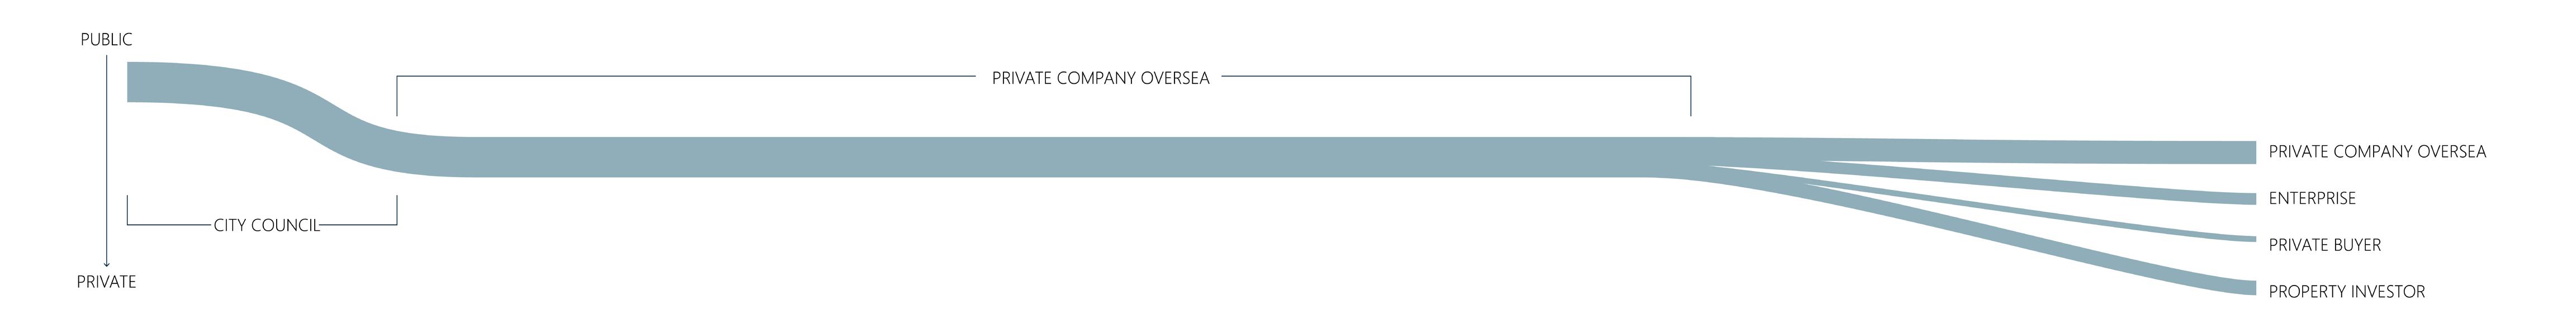
The diagrams on the right show the flow of ownership, materials, and financial resources for these types of projects. In Liverpool, homes acquired by the local government during Managed Decline and the Housing Market Renewal Initiative are sold cheaply to private developers who then demolish the existing houses and rebuild lower density, cheaply built homes in their place.
The majority of the profit from these projects goes to the private sector in the form of higher rents and property values with little benefit going to the council or local community.27 This model results in land intended for the public good becoming a tool to generate profit for developers and wealthy private owners. The material flow for this model is a consequences of the economic incentives. Existing materials are largely worthless with many ending up in landfills while new materials for constructing the newly built homes are sourced cheaply, often from overseas.
D aGraM 16. PUBLIC-PRIVATE PARTNERSHIP MODEL CONSTRUCTION MATERIAL FLOW byShenghanWang D aGraM 14. PUBLIC-PRIVATE PARTNERSHIP MODEL CONSTRUCTION CASH FLOW byShenghanWang D aGraM 15. PUBLIC-PRIVATE PARTNERSHIP MODEL byShenghanWang
59 58
The Granby Model
CASE STUDY OF GRANBY COMMUNITY LAND TRUST
 The Granby Model
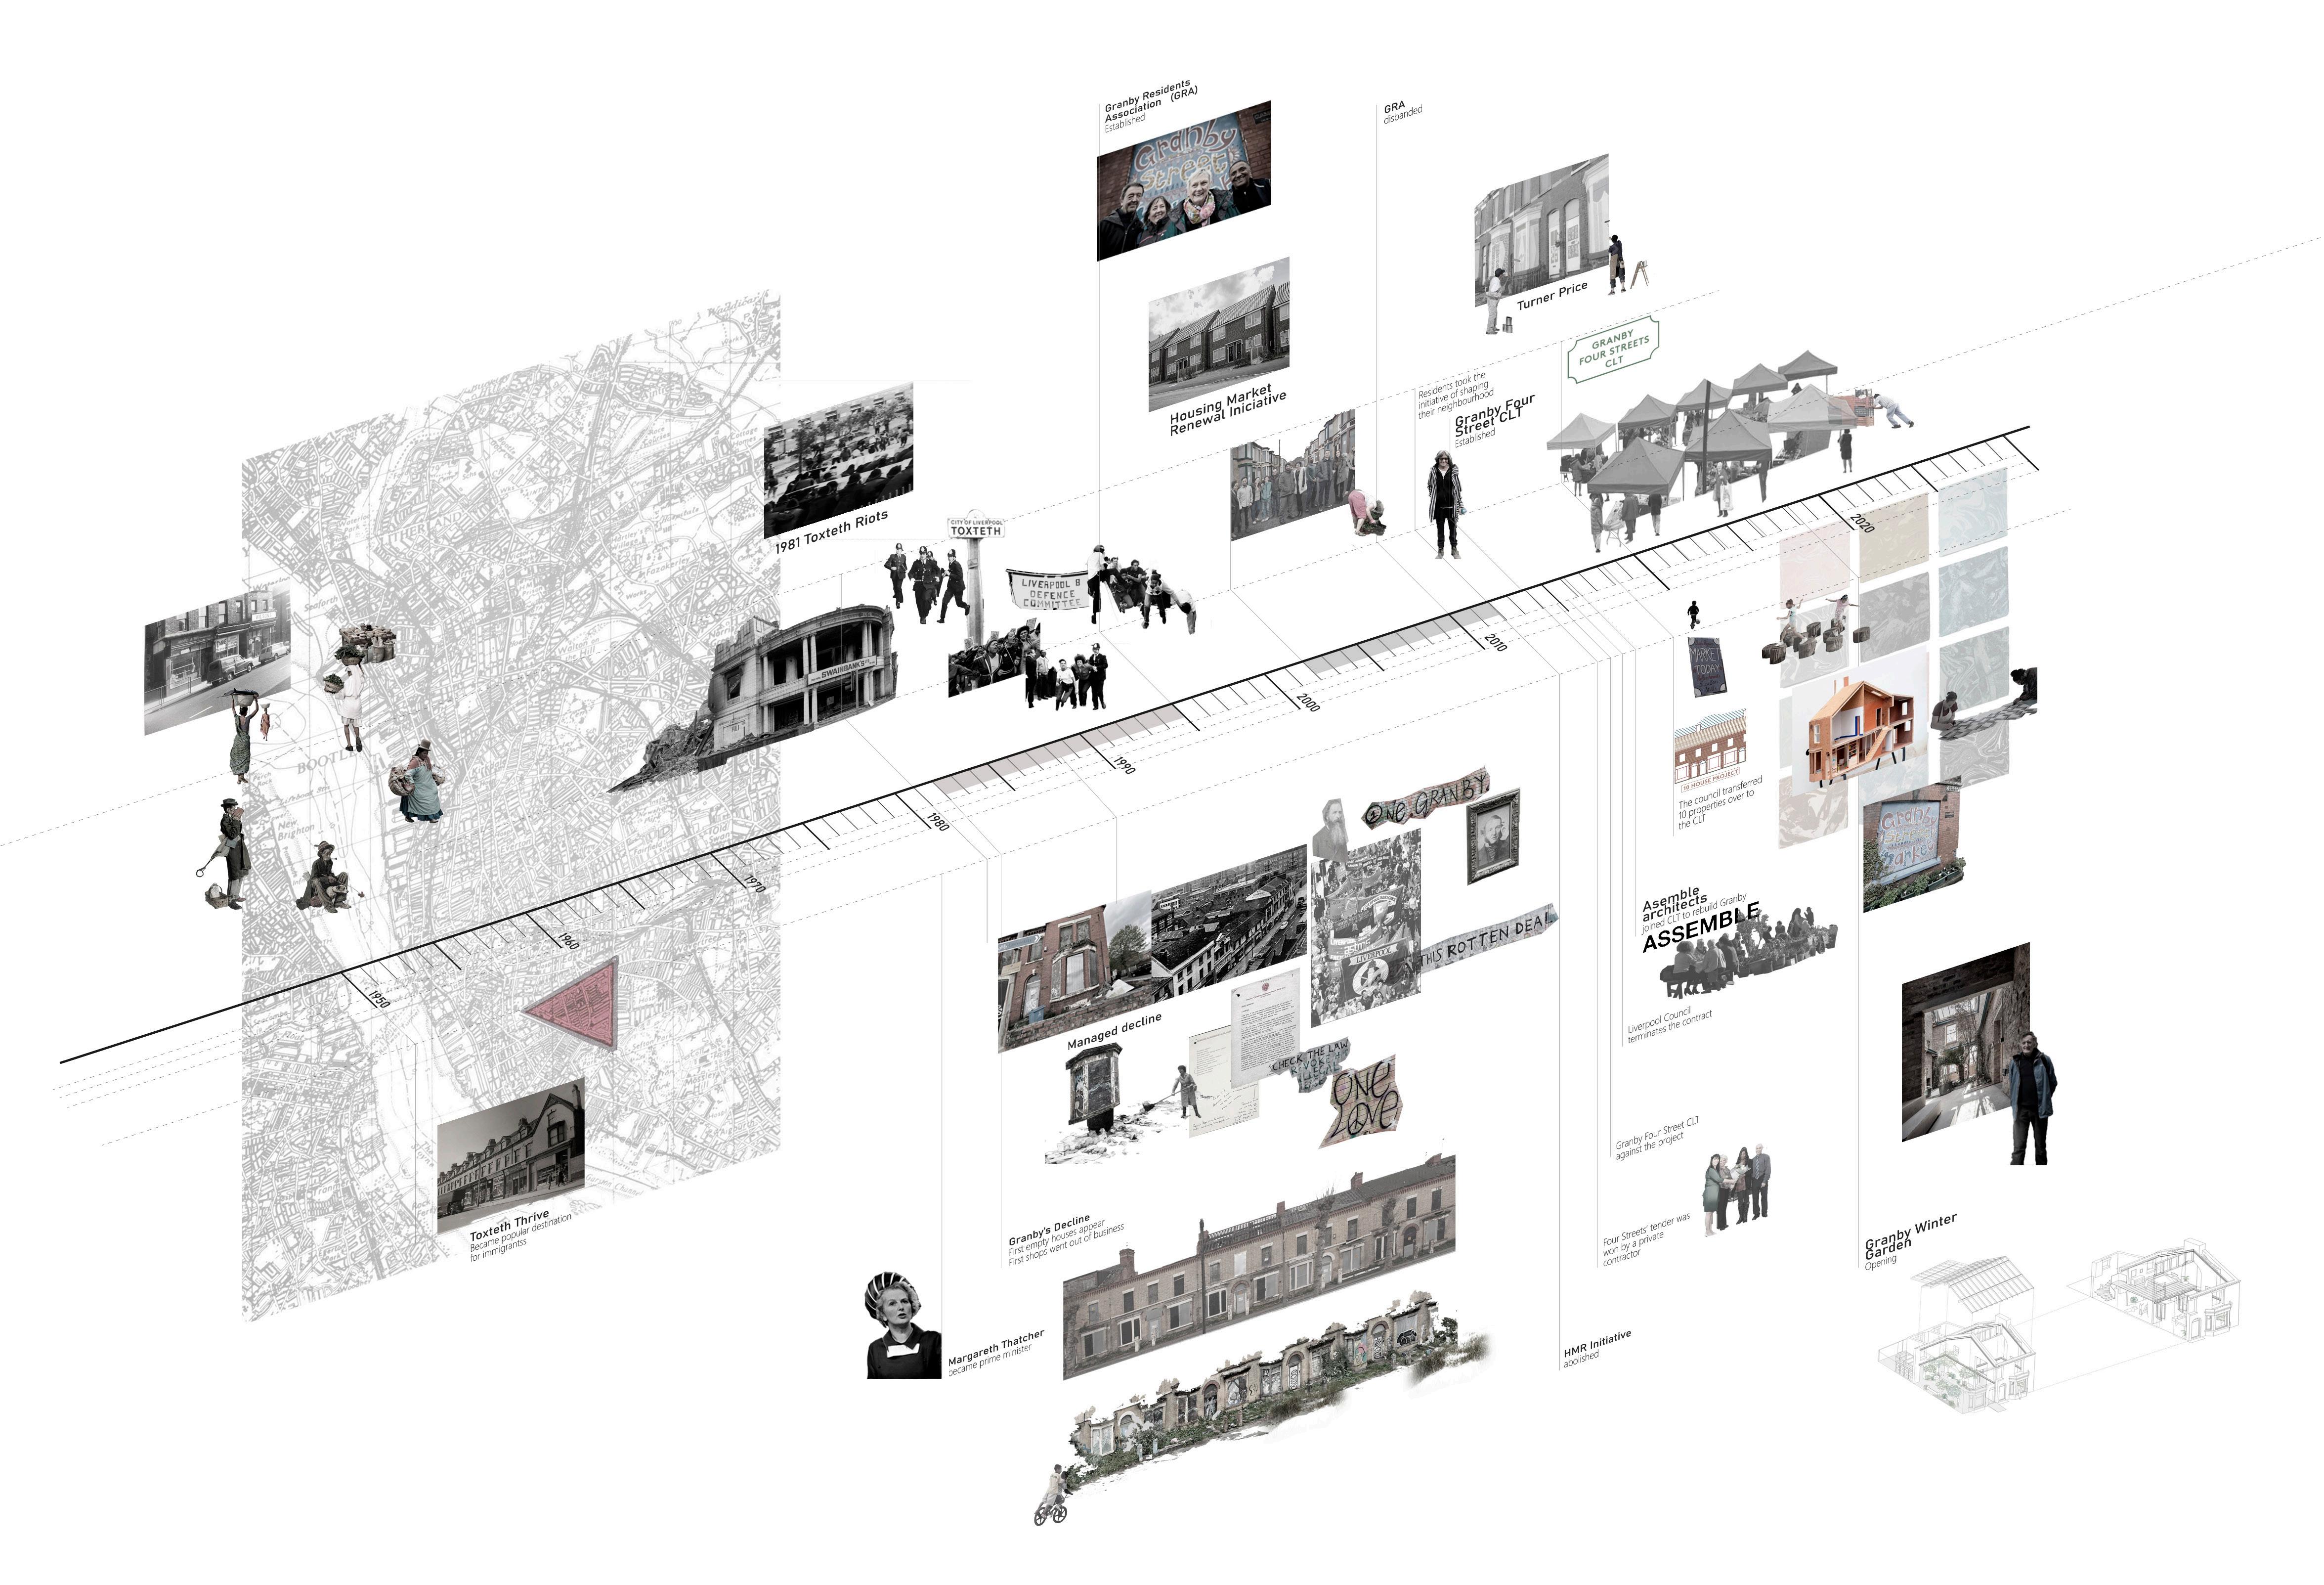
In some communities in Liverpool, the policies of Managed Decline and the HMRI did not go unchallenged. Granby, a south Liverpool neighborhood part of the larger Toxteth area, was uniquely affected by these policies with nearly all of the homes slated for demolition. Residents remaining in this community disadvantaged and neglected by the local authority began taking things into their own hands.
They began restoring the area on their own by cleaning up the streets, repainting homes, and gardening shared spaces. In 2011, the residents formed the Granby Four Streets Community Land Trust, or CLT, and petitioned the local council to transfer ownership of some of the vacant properties to the CLT for renovation.
The community worked to create shared gardens in empty lots and near vacant homes, and the CLT renovated 13 homes with the architecture firm Assemble. They sold six of the properties for low-cost homeownership and began renting out five more at affordable rates. These homes were awarded the Turner Prize in 2015.
Two of the homes that were deemed too costly to renovate completely were instead converted into the Winter Garden, a now iconic indoor community space that hosts many activities. Granby also hosts a street market once a week on the main road which attracts visitors from across the UK. Given the area’s history as a commercial hub, Granby Steet Market is an important step towards building and maintaining community wealth.
Map 26. GraNBY TIMELINE byMingxiShuandBorjaRomeu
“
There were 93 shops, and you didn’t have to go anywhere outside of Granby to do your shopping, so if you lived in Granby you could shop in Granby. You could do everything very locally, and you could get good quality stuff.
“
61 60
QuotefromHazelTilley,duringonlineinterview
63 62
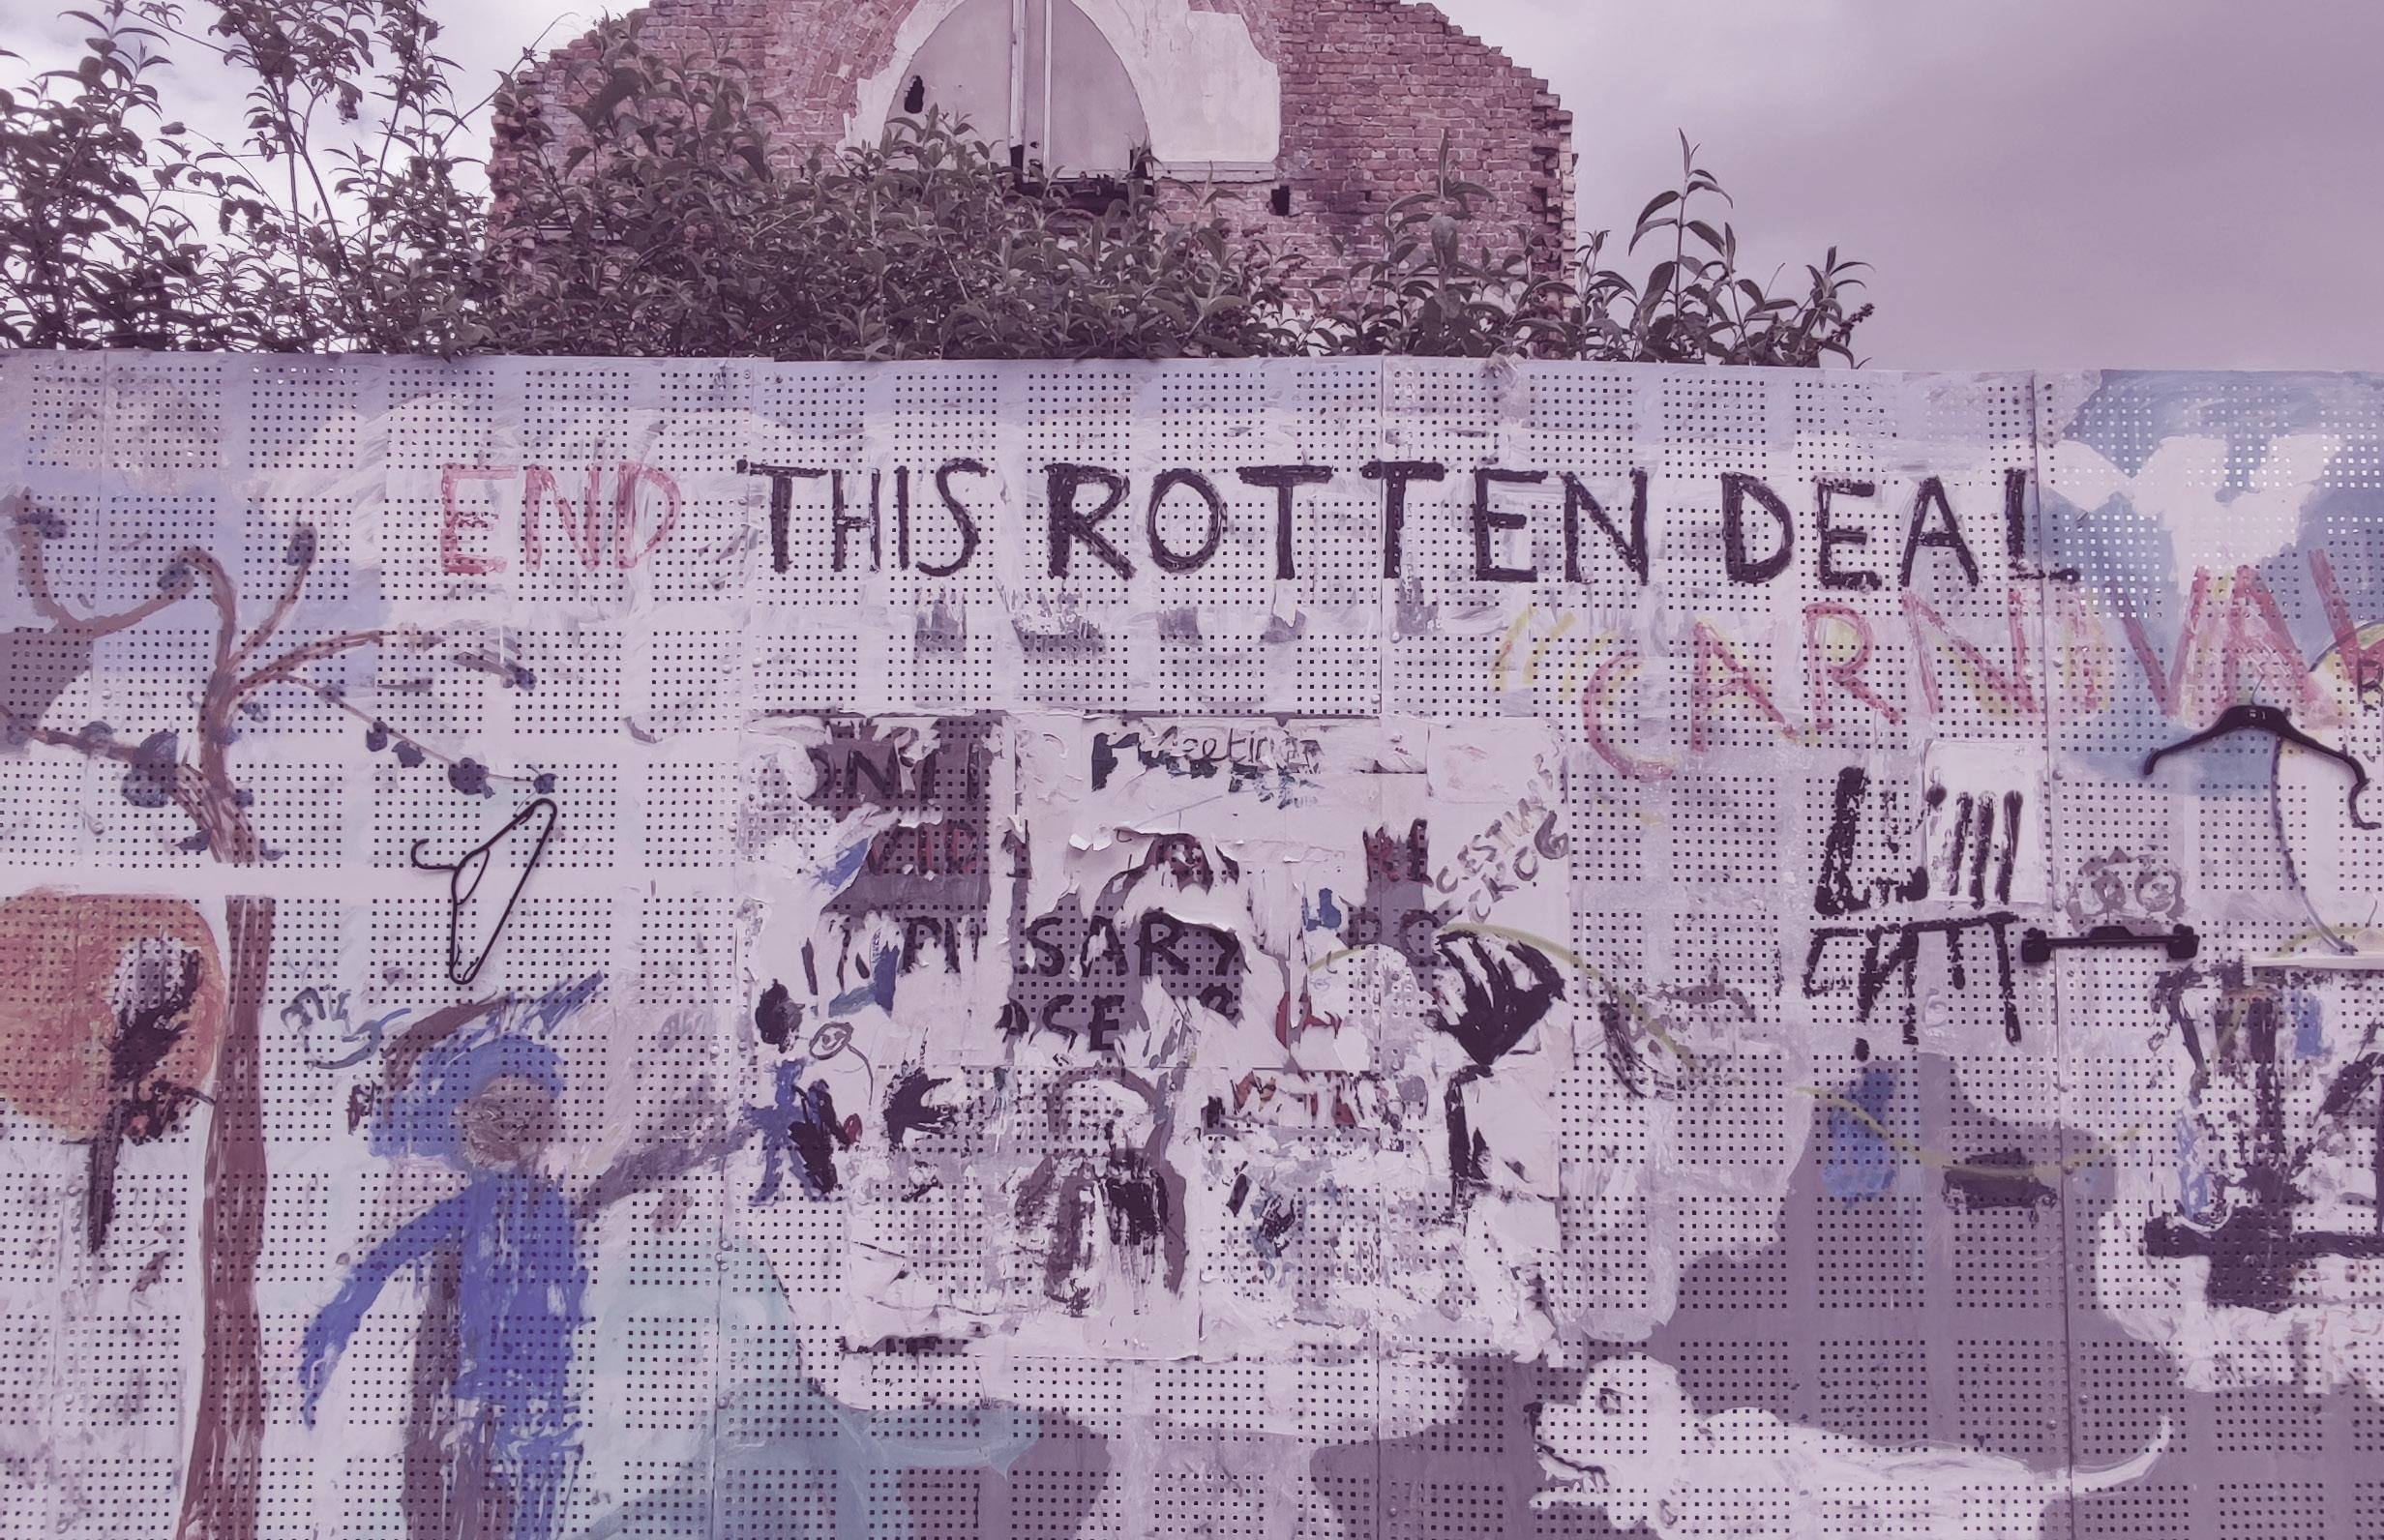
FIGurE 10. GraFFITI ON GraNBY STrEET OriginalpicturebyBorjaRomeu
GRANBY CLT ACHEVEMENTS
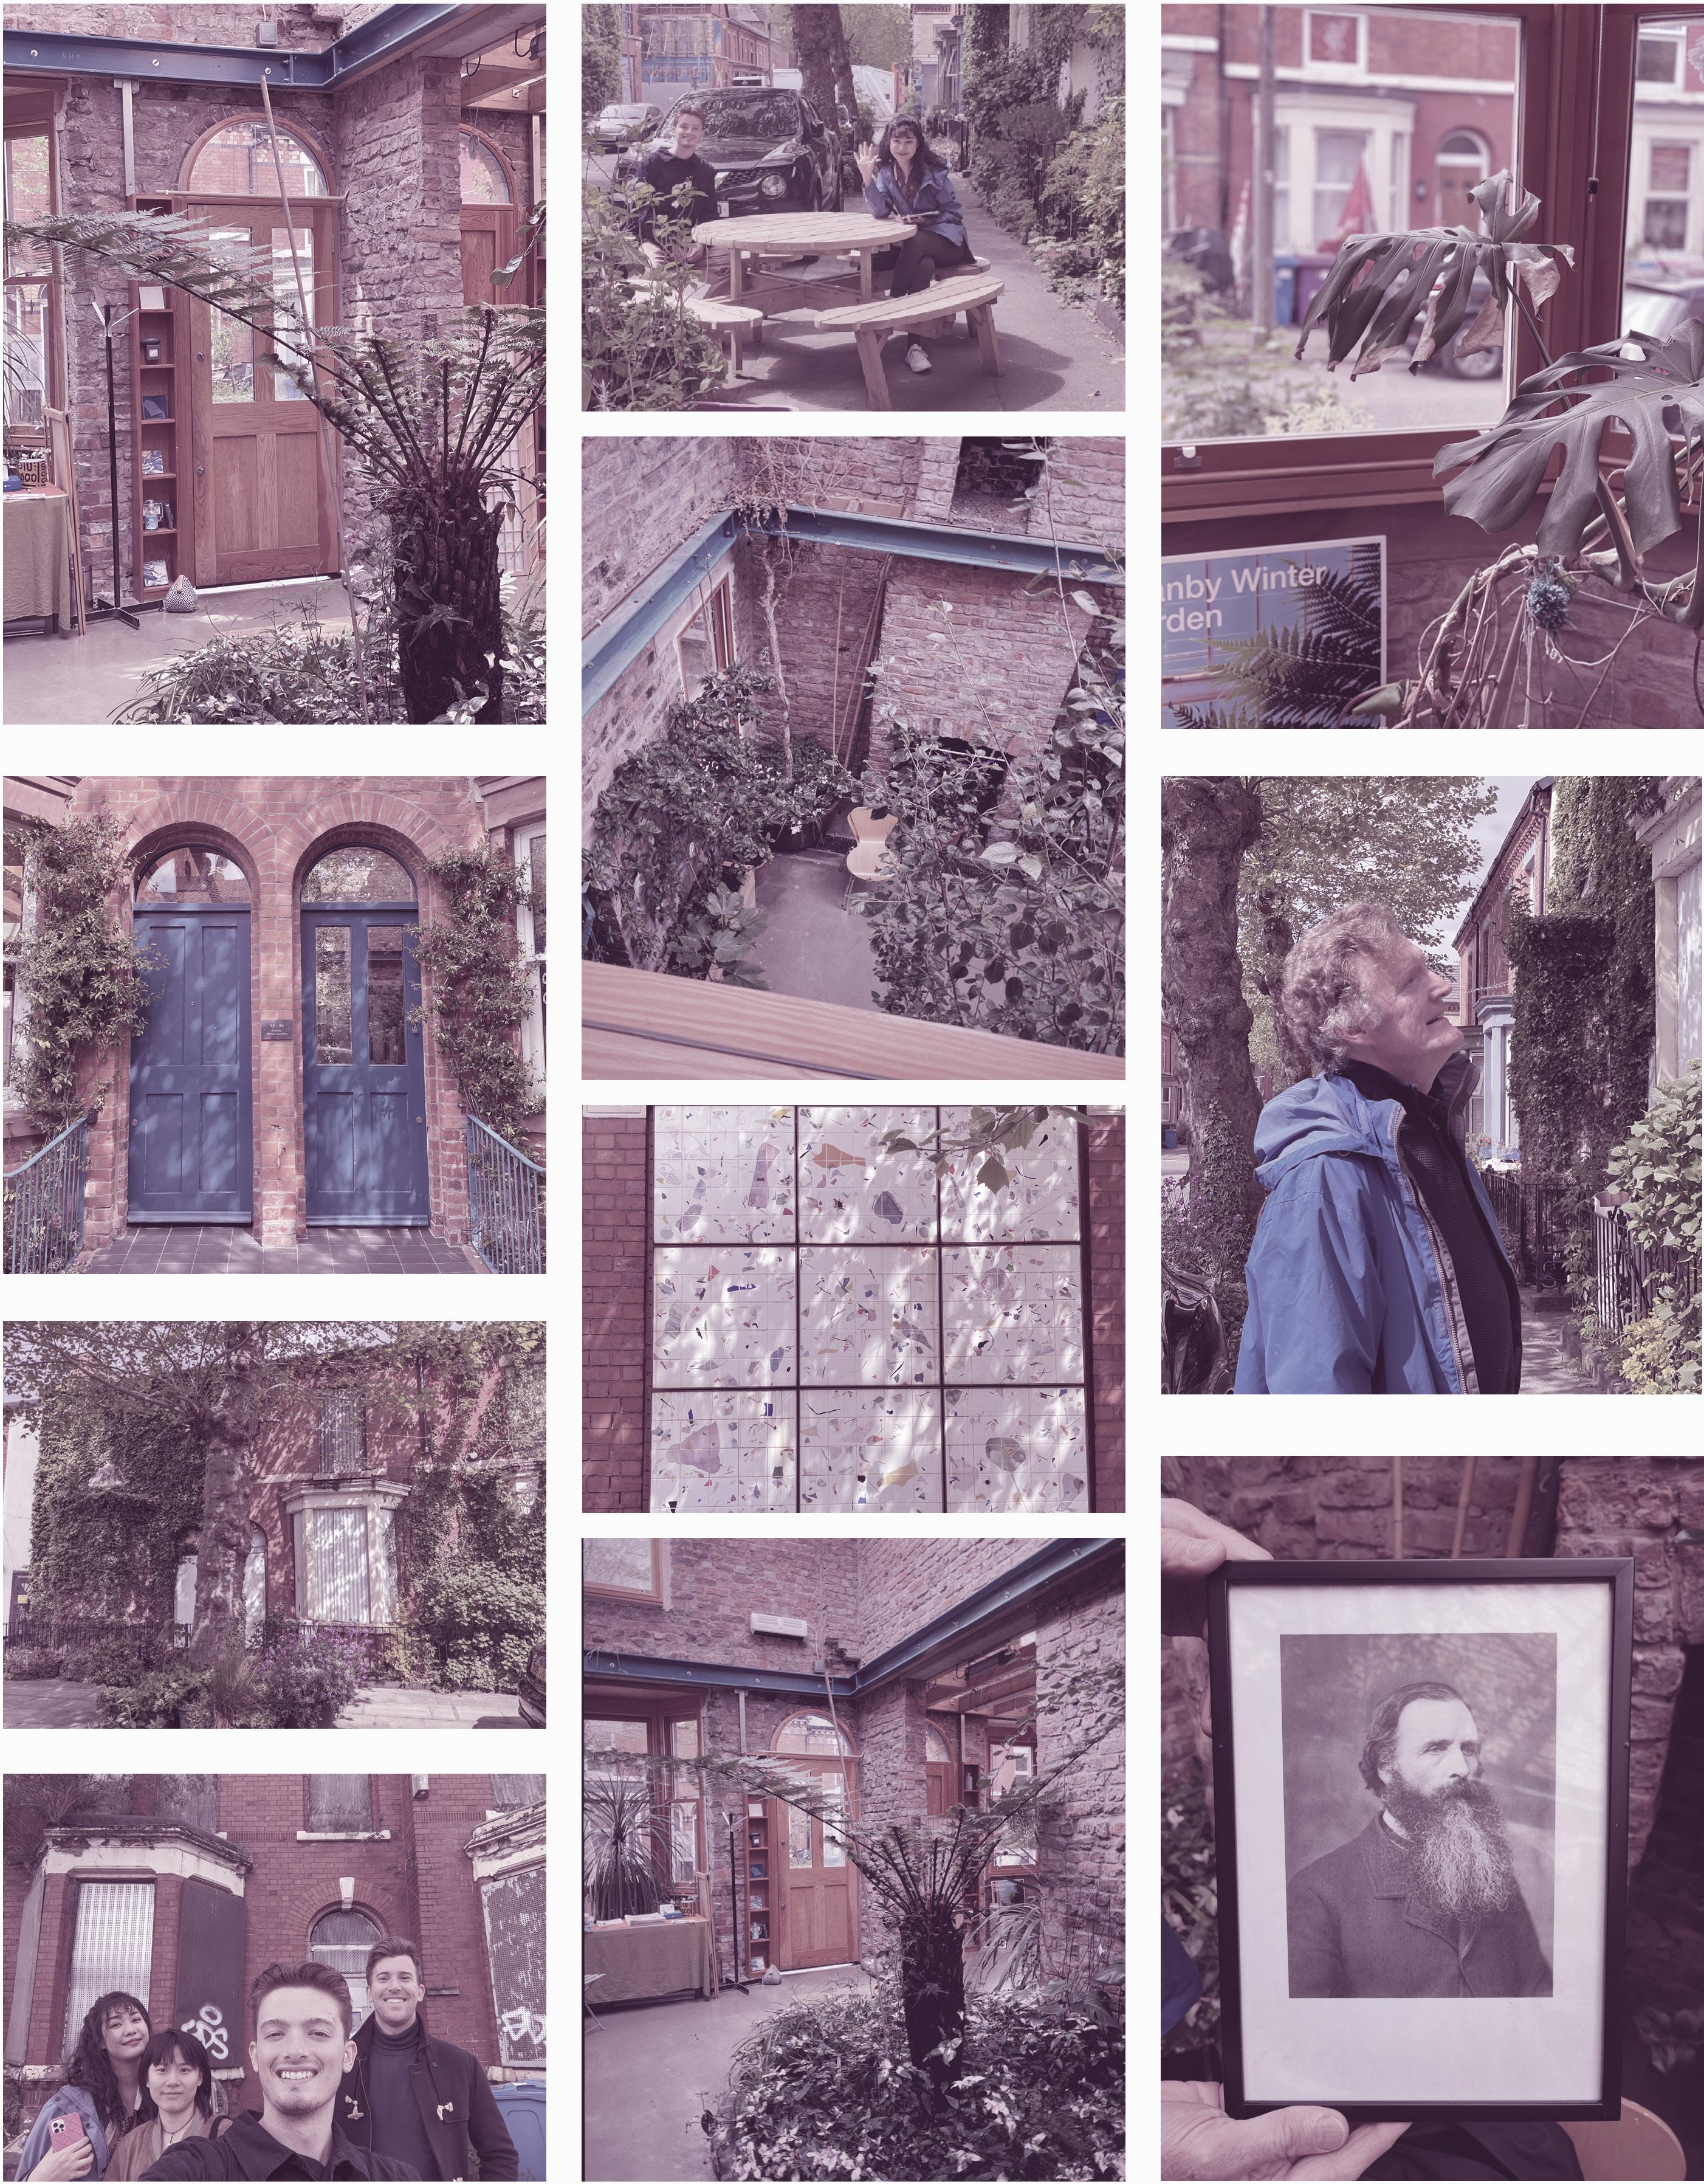
Our team was able to speak with Hazel Tilly, one of the founders of the Granby Four Streets CLT to learn about the history of the neighborhood and the many accomplishments achieved by the community. We were also able to visit Liverpool for a site visit to speak with other members of the community like James Mckeon and tour the Winter Garden. While the gardening and renovations have truly transformed Granby, there are still a number of derelict homes in need of renovation. We were able to document these homes during our site visit.
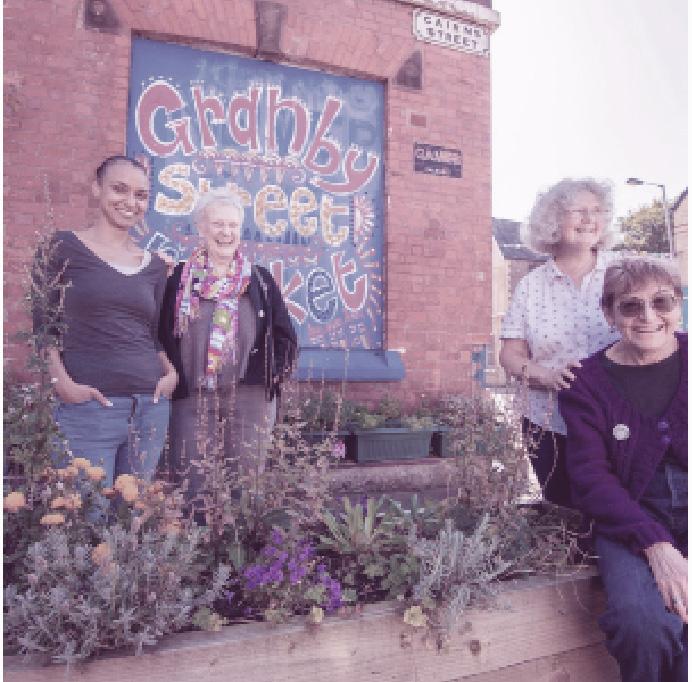 FIGurE 11. GraNBY CLT MEMBErS
Credits: JamesMaloney
The Granby Model
FIGurE 11. GraNBY CLT MEMBErS
Credits: JamesMaloney
The Granby Model
65 64
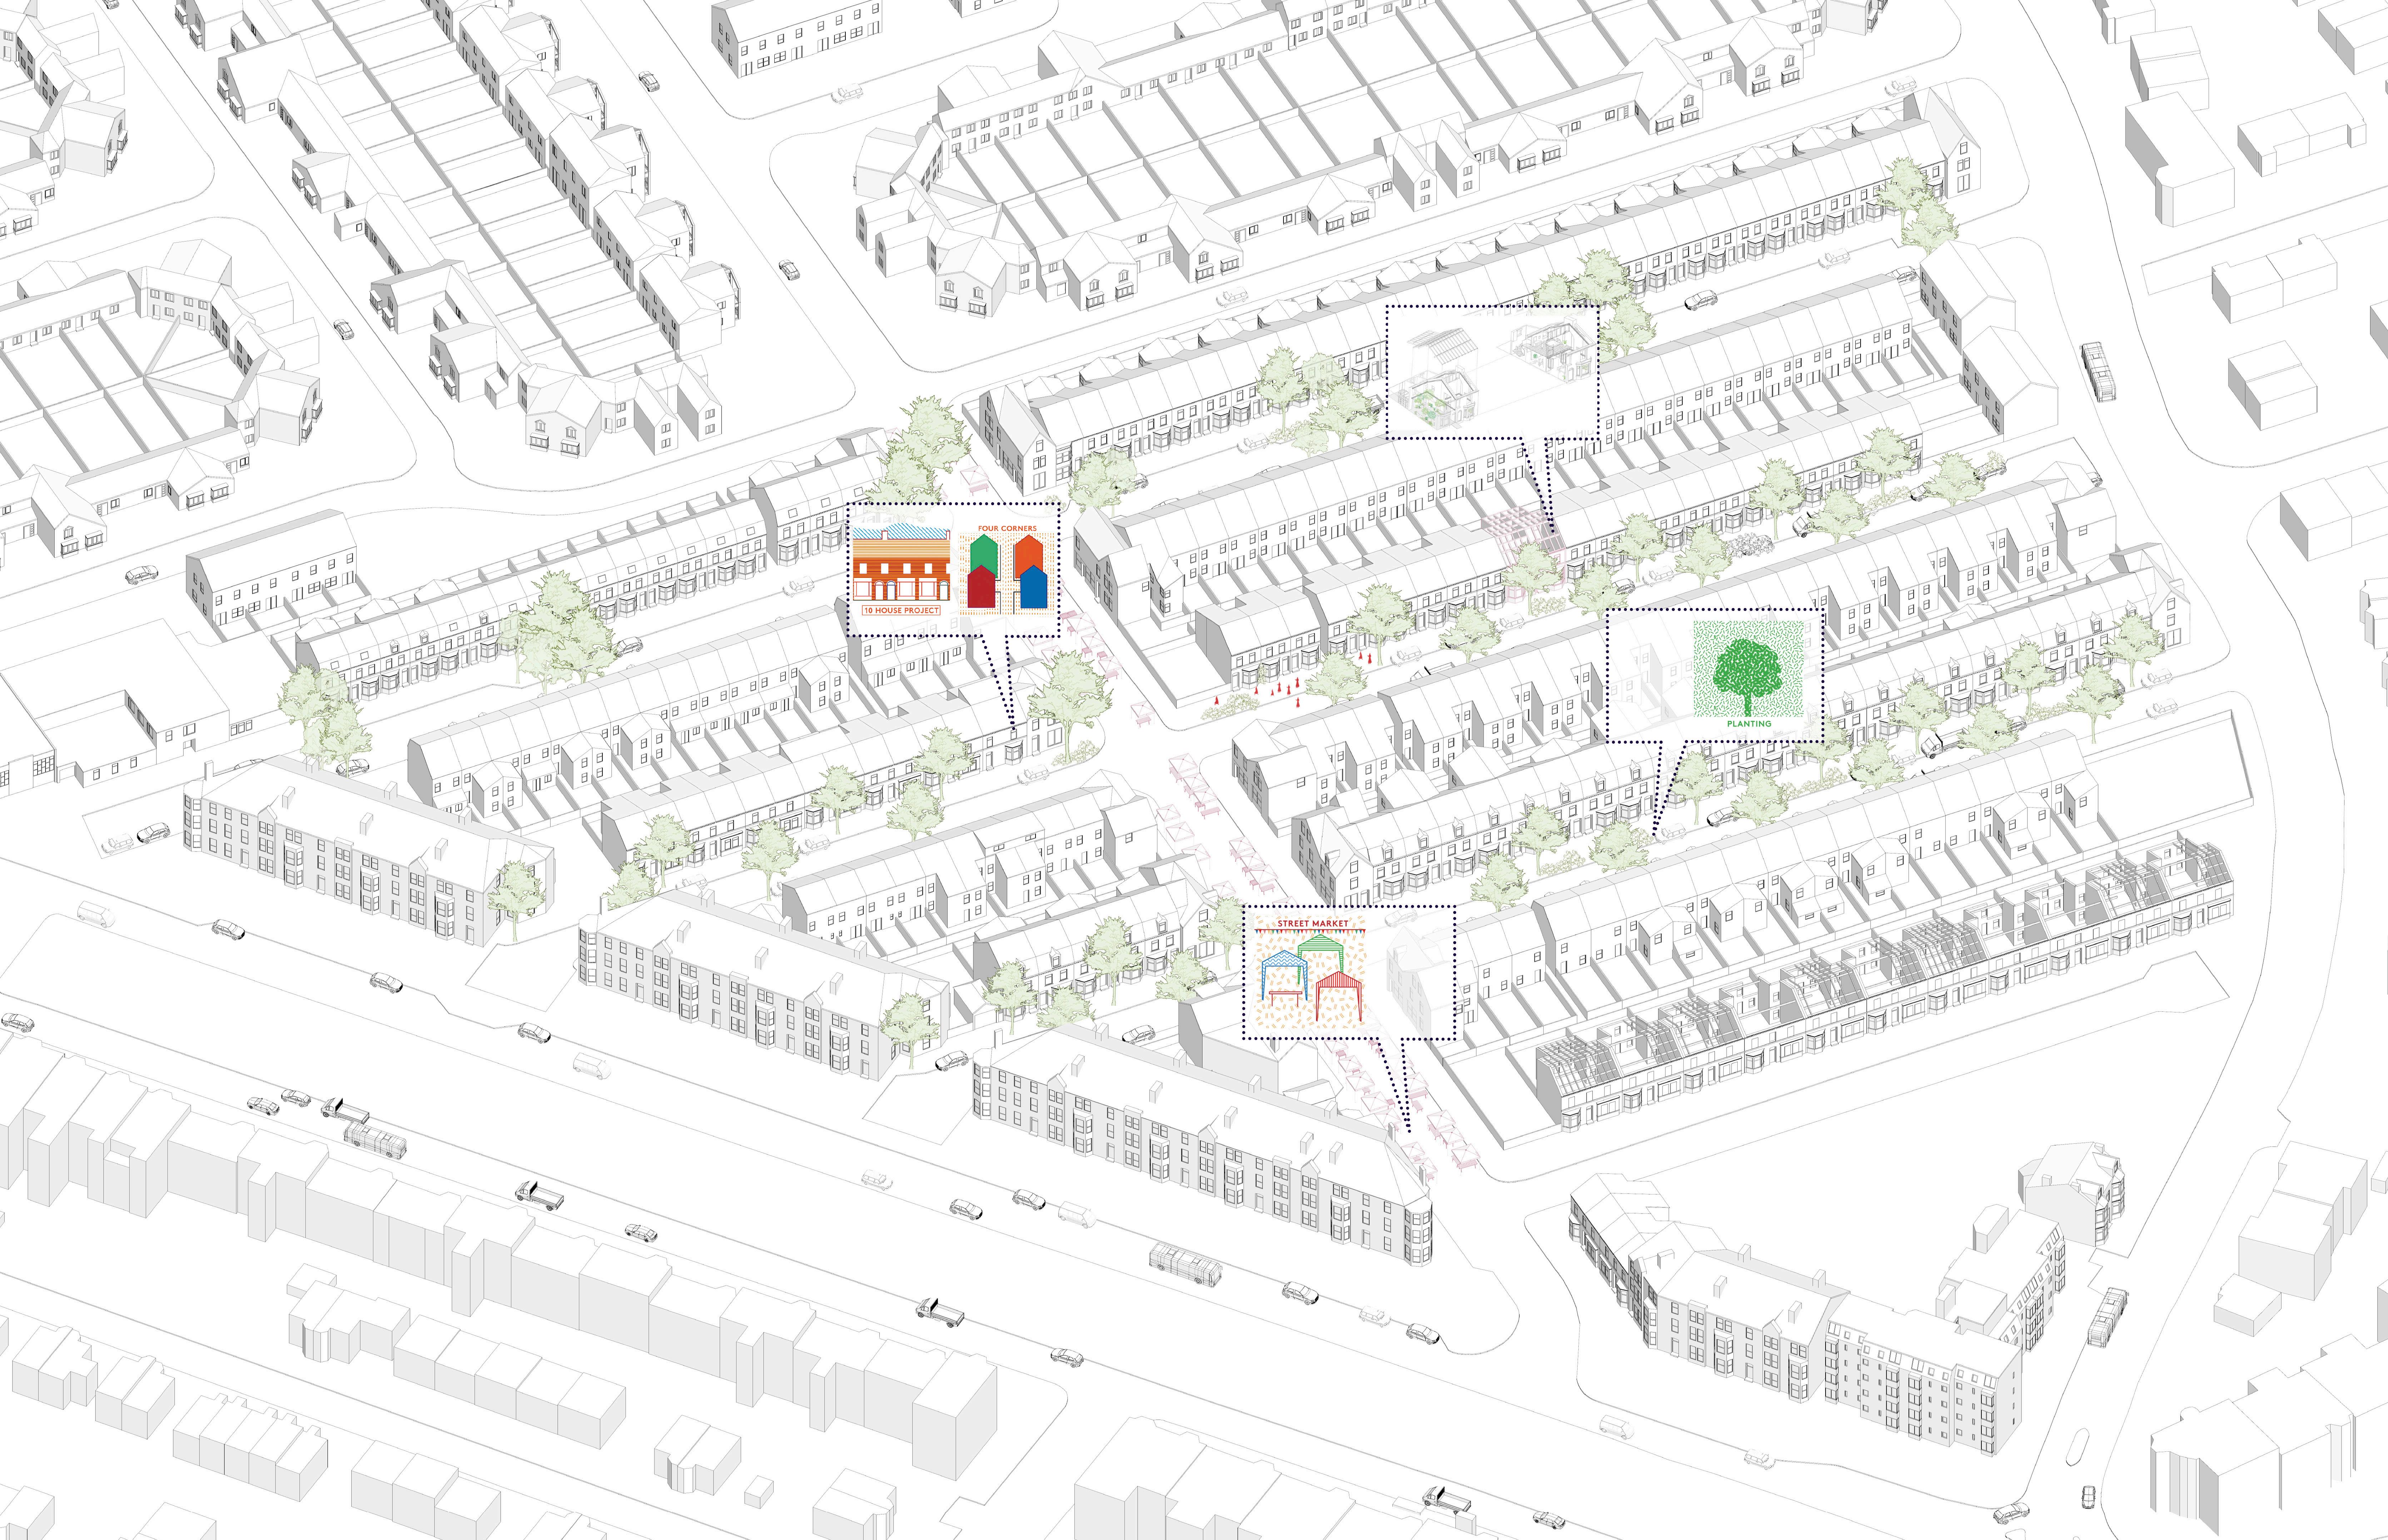
Map 27. GraNBY FOur STrEETS aXONOMETrIC VIEW byBorjaRomeuandBradleyNissen
 GRANBY SITE VISIT The Granby Model
FIGurE 12.
GRANBY SITE VISIT The Granby Model
FIGurE 12.
67 66
GraNBY WINTEr GarDENS OriginalpicturesbyMingxiShu andBorjaRomeu
PUBLIC-COMMON PARTNERSHIP
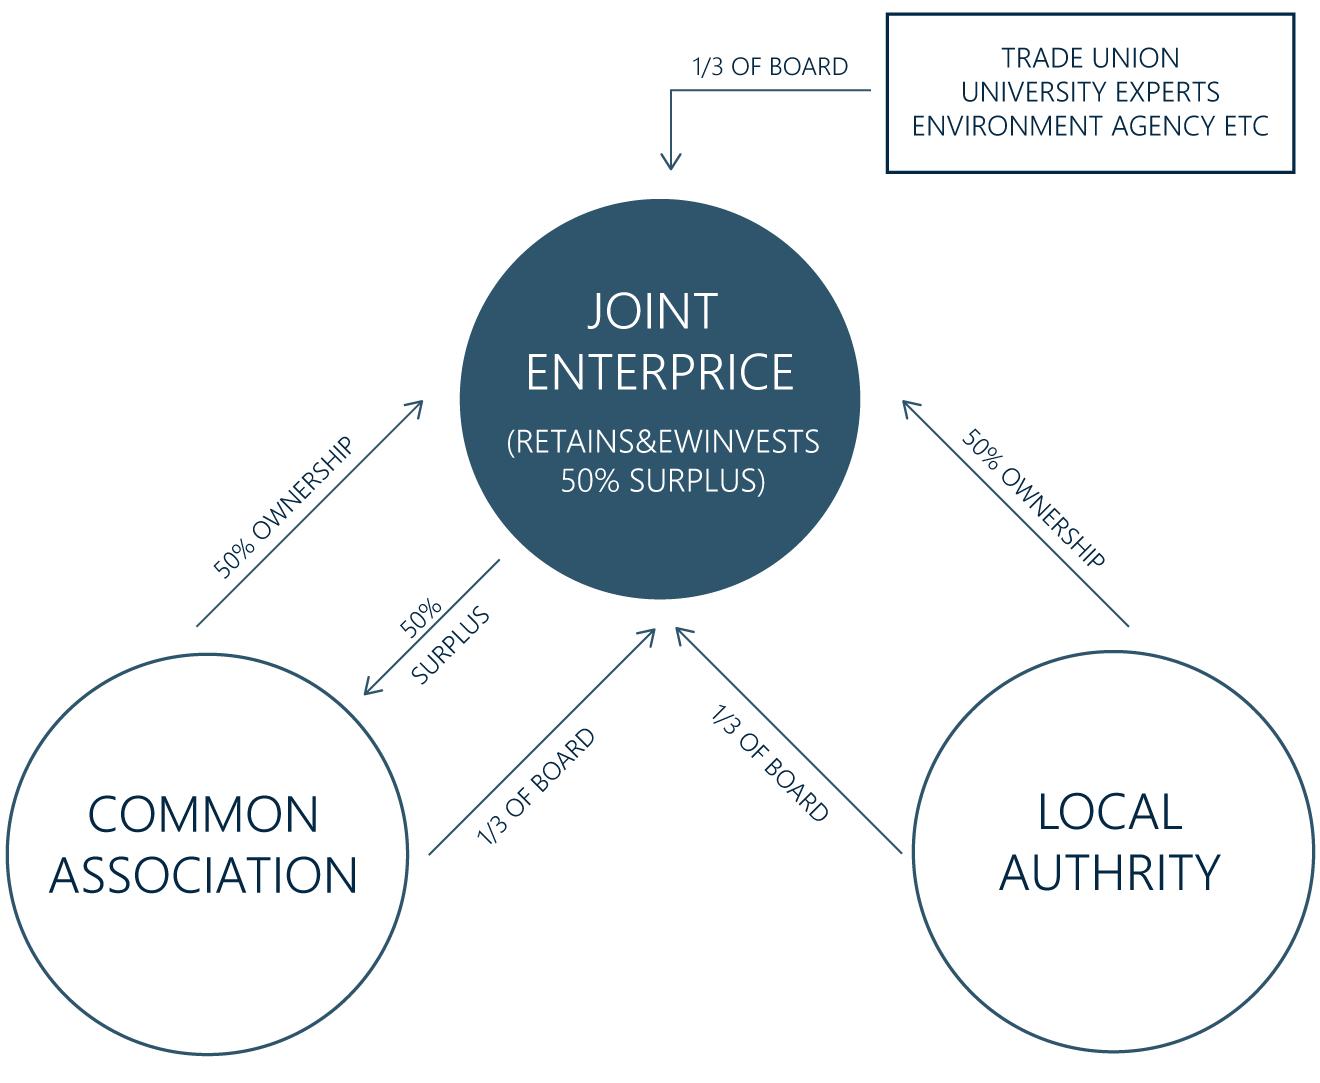
The work done by the Granby Four Streets Community Land Trust could be classified as an altogether different model of development and ownership, the Public-Common Partnership, or PCP. These offer a unique alternative to the overly simplistic binary of private vs public ownership. Instead, they entail joint ownership between the appropriate state authorities and commoners organizations (such as Community Land Trusts) with additional input by thirdparty associations made up of project-specific relevant parties such as trade unions and local experts.28
While the Granby Four Streets CLT does not involve joint ownership (as the homes acquired by the CLT are either owned by the CLT or sold for private ownership), their collaboration with the local authority to obtain ownership of the homes opens up the possibility for alternative models of governance and ownership.
Under the PCP model, profit motives are disincentivized. Any additional profits are either set aside for the future, or are used to establish other Public-Common Partnerships. Without a need to continuously generate income, the PCP model also has the opportunity to reimagine the material flow of any potential developments. Instead of demolishing existing buildings and sourcing materials as cheaply as possible, these types of projects could prioritize refurbishing existing buildings, reusing existing materials, and sourcing the remainder locally.
D aGraM 18. PUBLIC-COMMON PARTNERSHIP MODEL CONSTRUCTION MATERIAL FLOW byShenghanWang D aGraM 17. PUBLIC-COMMON PARTNERSHIP MODEL CONSTRUCTION CASH FLOW byShenghanWang FIGurE 13. PUBLIC-COMMON PARTNERSHIP MODEL KeirMilburnandBertieRussell 69 68
The Granby Model
REFERENCES
27. ADB, EBRD, IDB, IsDB, and WBG. 2016. The APMG Public-Private Partnership (PPP) Certification Guide. Washington, DC: World Bank Group. License: Creative Commons Attribution CC BY 3.0 IGO.
28. Russell, B., Heron, K., & Milburn, K. (2021, September). A new model. common wealth think tank. Retrieved September 21, 2022, from https://www. common-wealth.co.uk/interactive-digital-projects/anew-model.
71 70
04 AUDITS AND PASSPORTS

CHAPTER 4 73 04.1 MATERIAL MANAGEMENT PROCESS 04.2 PRE-DEMOLITION AUDITS 04.3 DECONSTRUCTION AND OWNERSHIP 04.4 MATERIAL CATALOGUE FROM DECONSTRUCTION 04.5 MATERIAL CATALOGUE FOR CLASSIFICATION AND USAGE GUIDANCE
04.6 MATERIAL PASSPORTS 04.7 MATERIAL AUDIT DURING RENOVATION
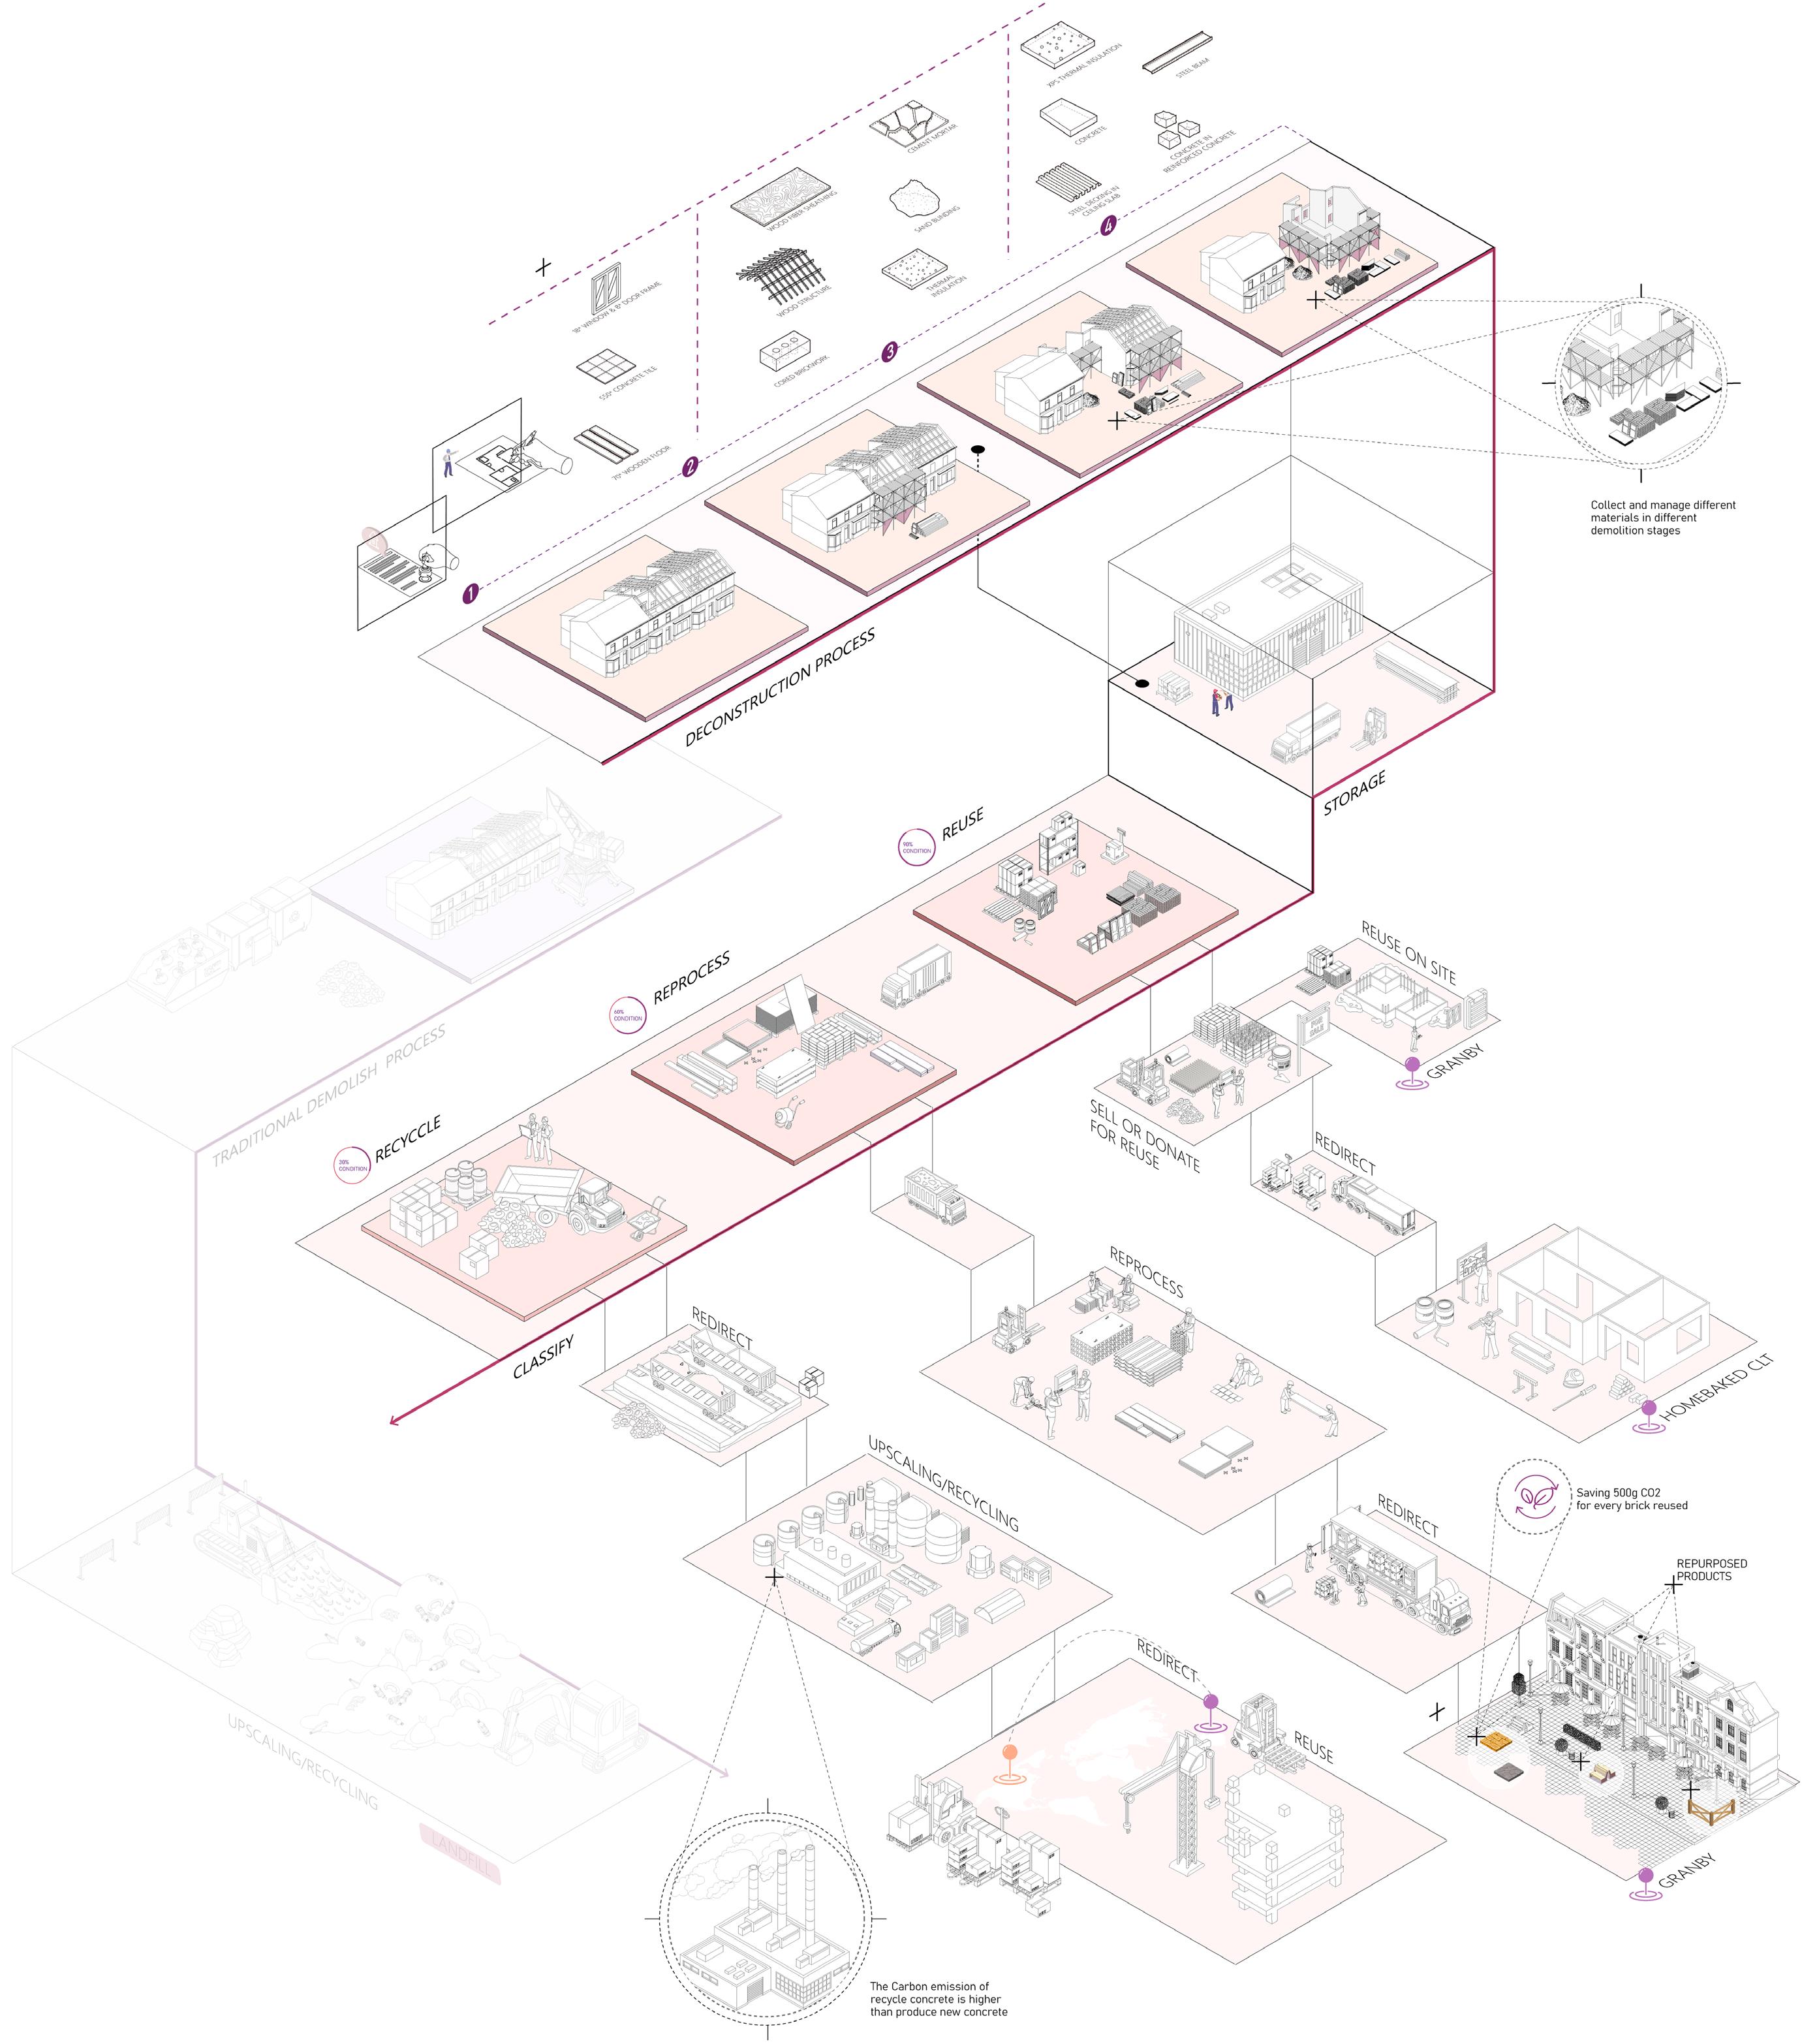
MATERIAL MANAGEMENT PROCESS
Audits and Passports
With alternative models of ownership structured to ensure that residents have more authority over their own communities and how they change, there is an opportunity to rethink how construction occurs. Our previous research has uncovered that it is imperative to reduce the consumption of raw materials. Through this lens, we have developed an alternative model of construction based around reusing existing buildings and their materials.
This research will be focused on Granby and will build upon the successes the neighborhood and the Community Land Trust have achieved so far.
Map 28. MaTEr aL MaNaGEMENT prOpOSaL byMingxiShu
75 74
PRE-DEMOLITION AUDITS
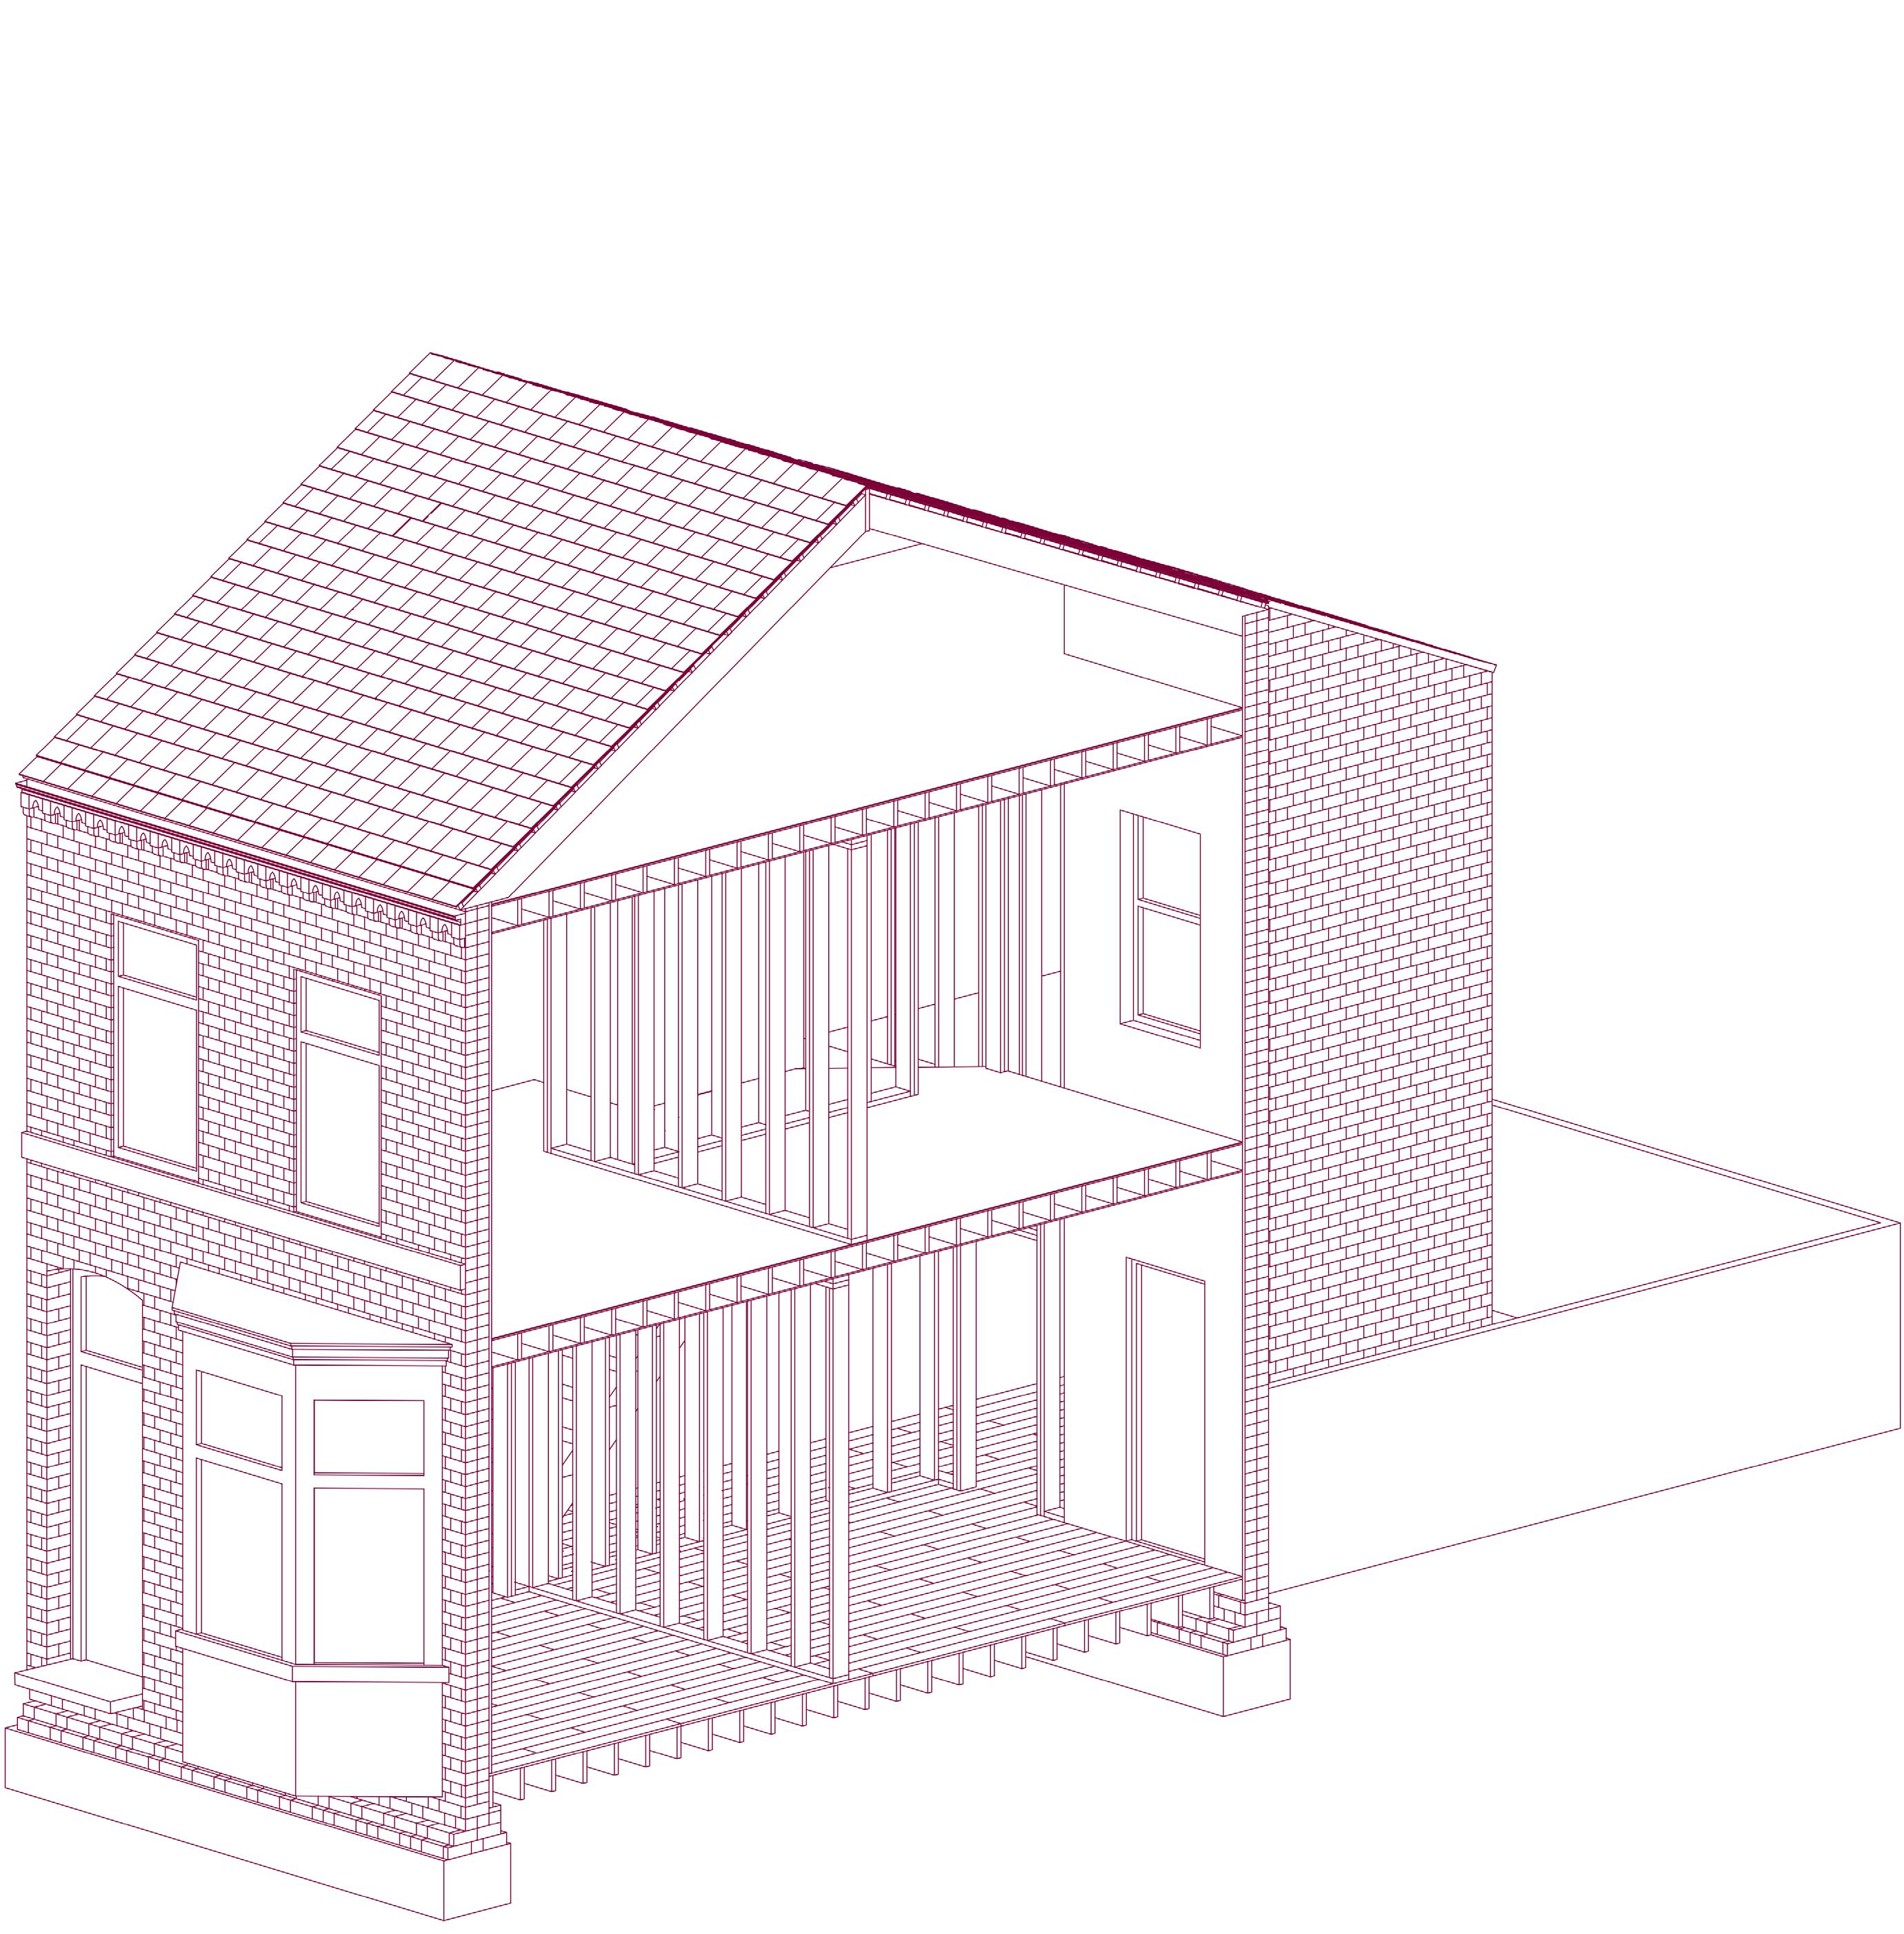
Ducie Street in Granby is still facing an ongoing development challenge. The homes are the most derelict in the neighborhood, and the current proposal is to demolish and replace them with expensive newly built homes.
If these homes are indeed too damaged to feasibly repair, they must still be considered valuable stores of materials available for reuse. There are a number of policies that could instigate the recovery of these materials and help facilitate a more circular construction economy.
The first step would be to ensure there is an availability of reclaimed materials for reuse. Mandatory predemolition audits would require materials to be cataloged to determine their quantity and reuse potential. Then, local reclamation facilities would be chosen to send the materials to. The material data collected from the audit would be sent to local reclamation sites, material resellers, and workshops.
Instead of demolition, the deconstruction process would make it possible to obtain a large quantity of materials that can be reused retrofitting buildings and the urban environment. A rough estimate of the materials that this typology of houses is:
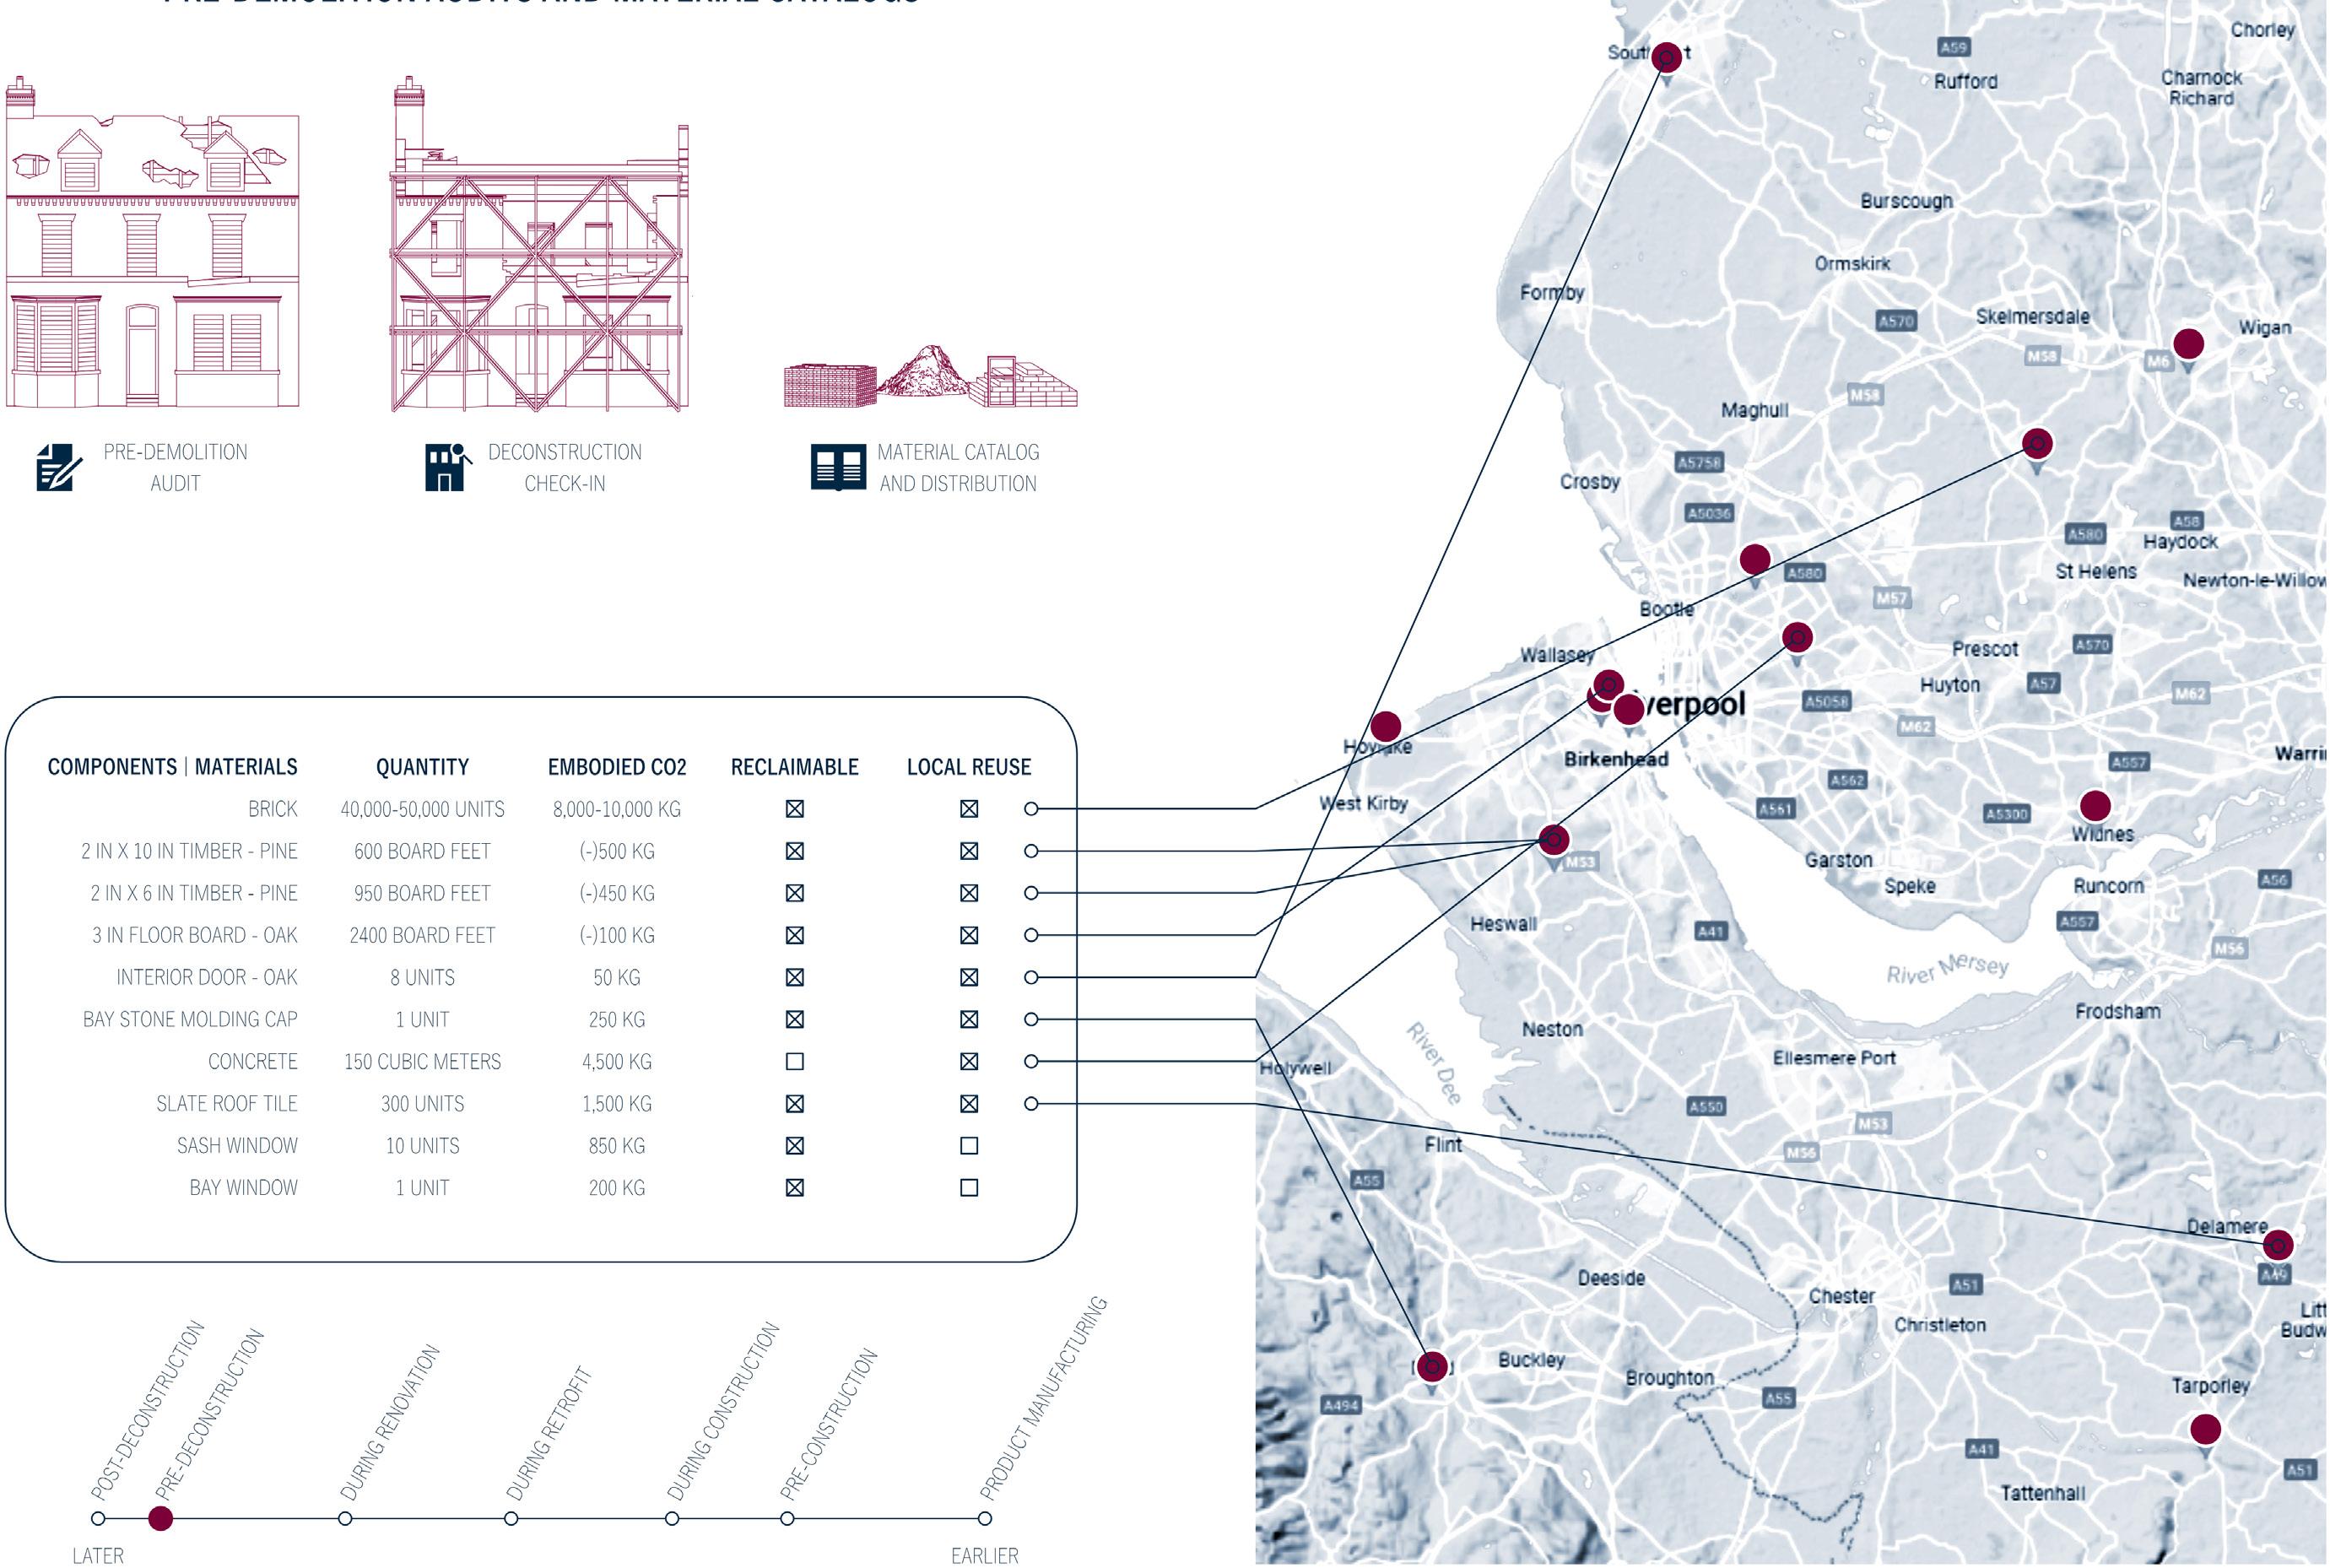
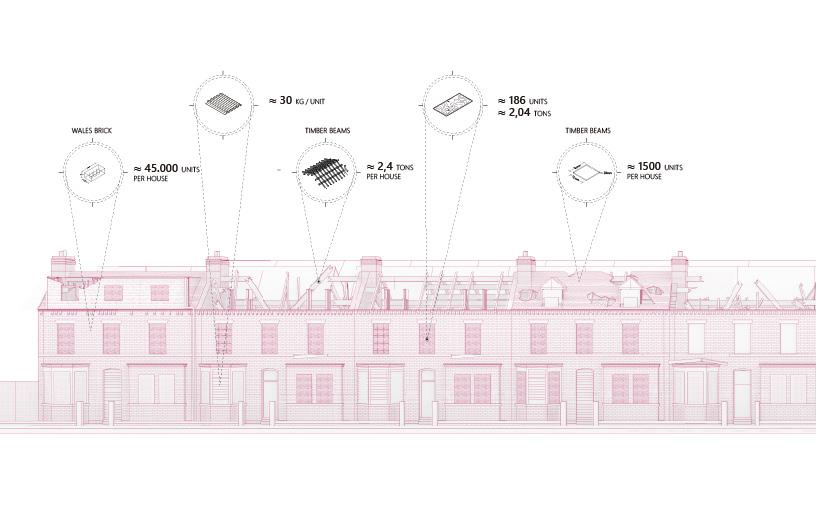
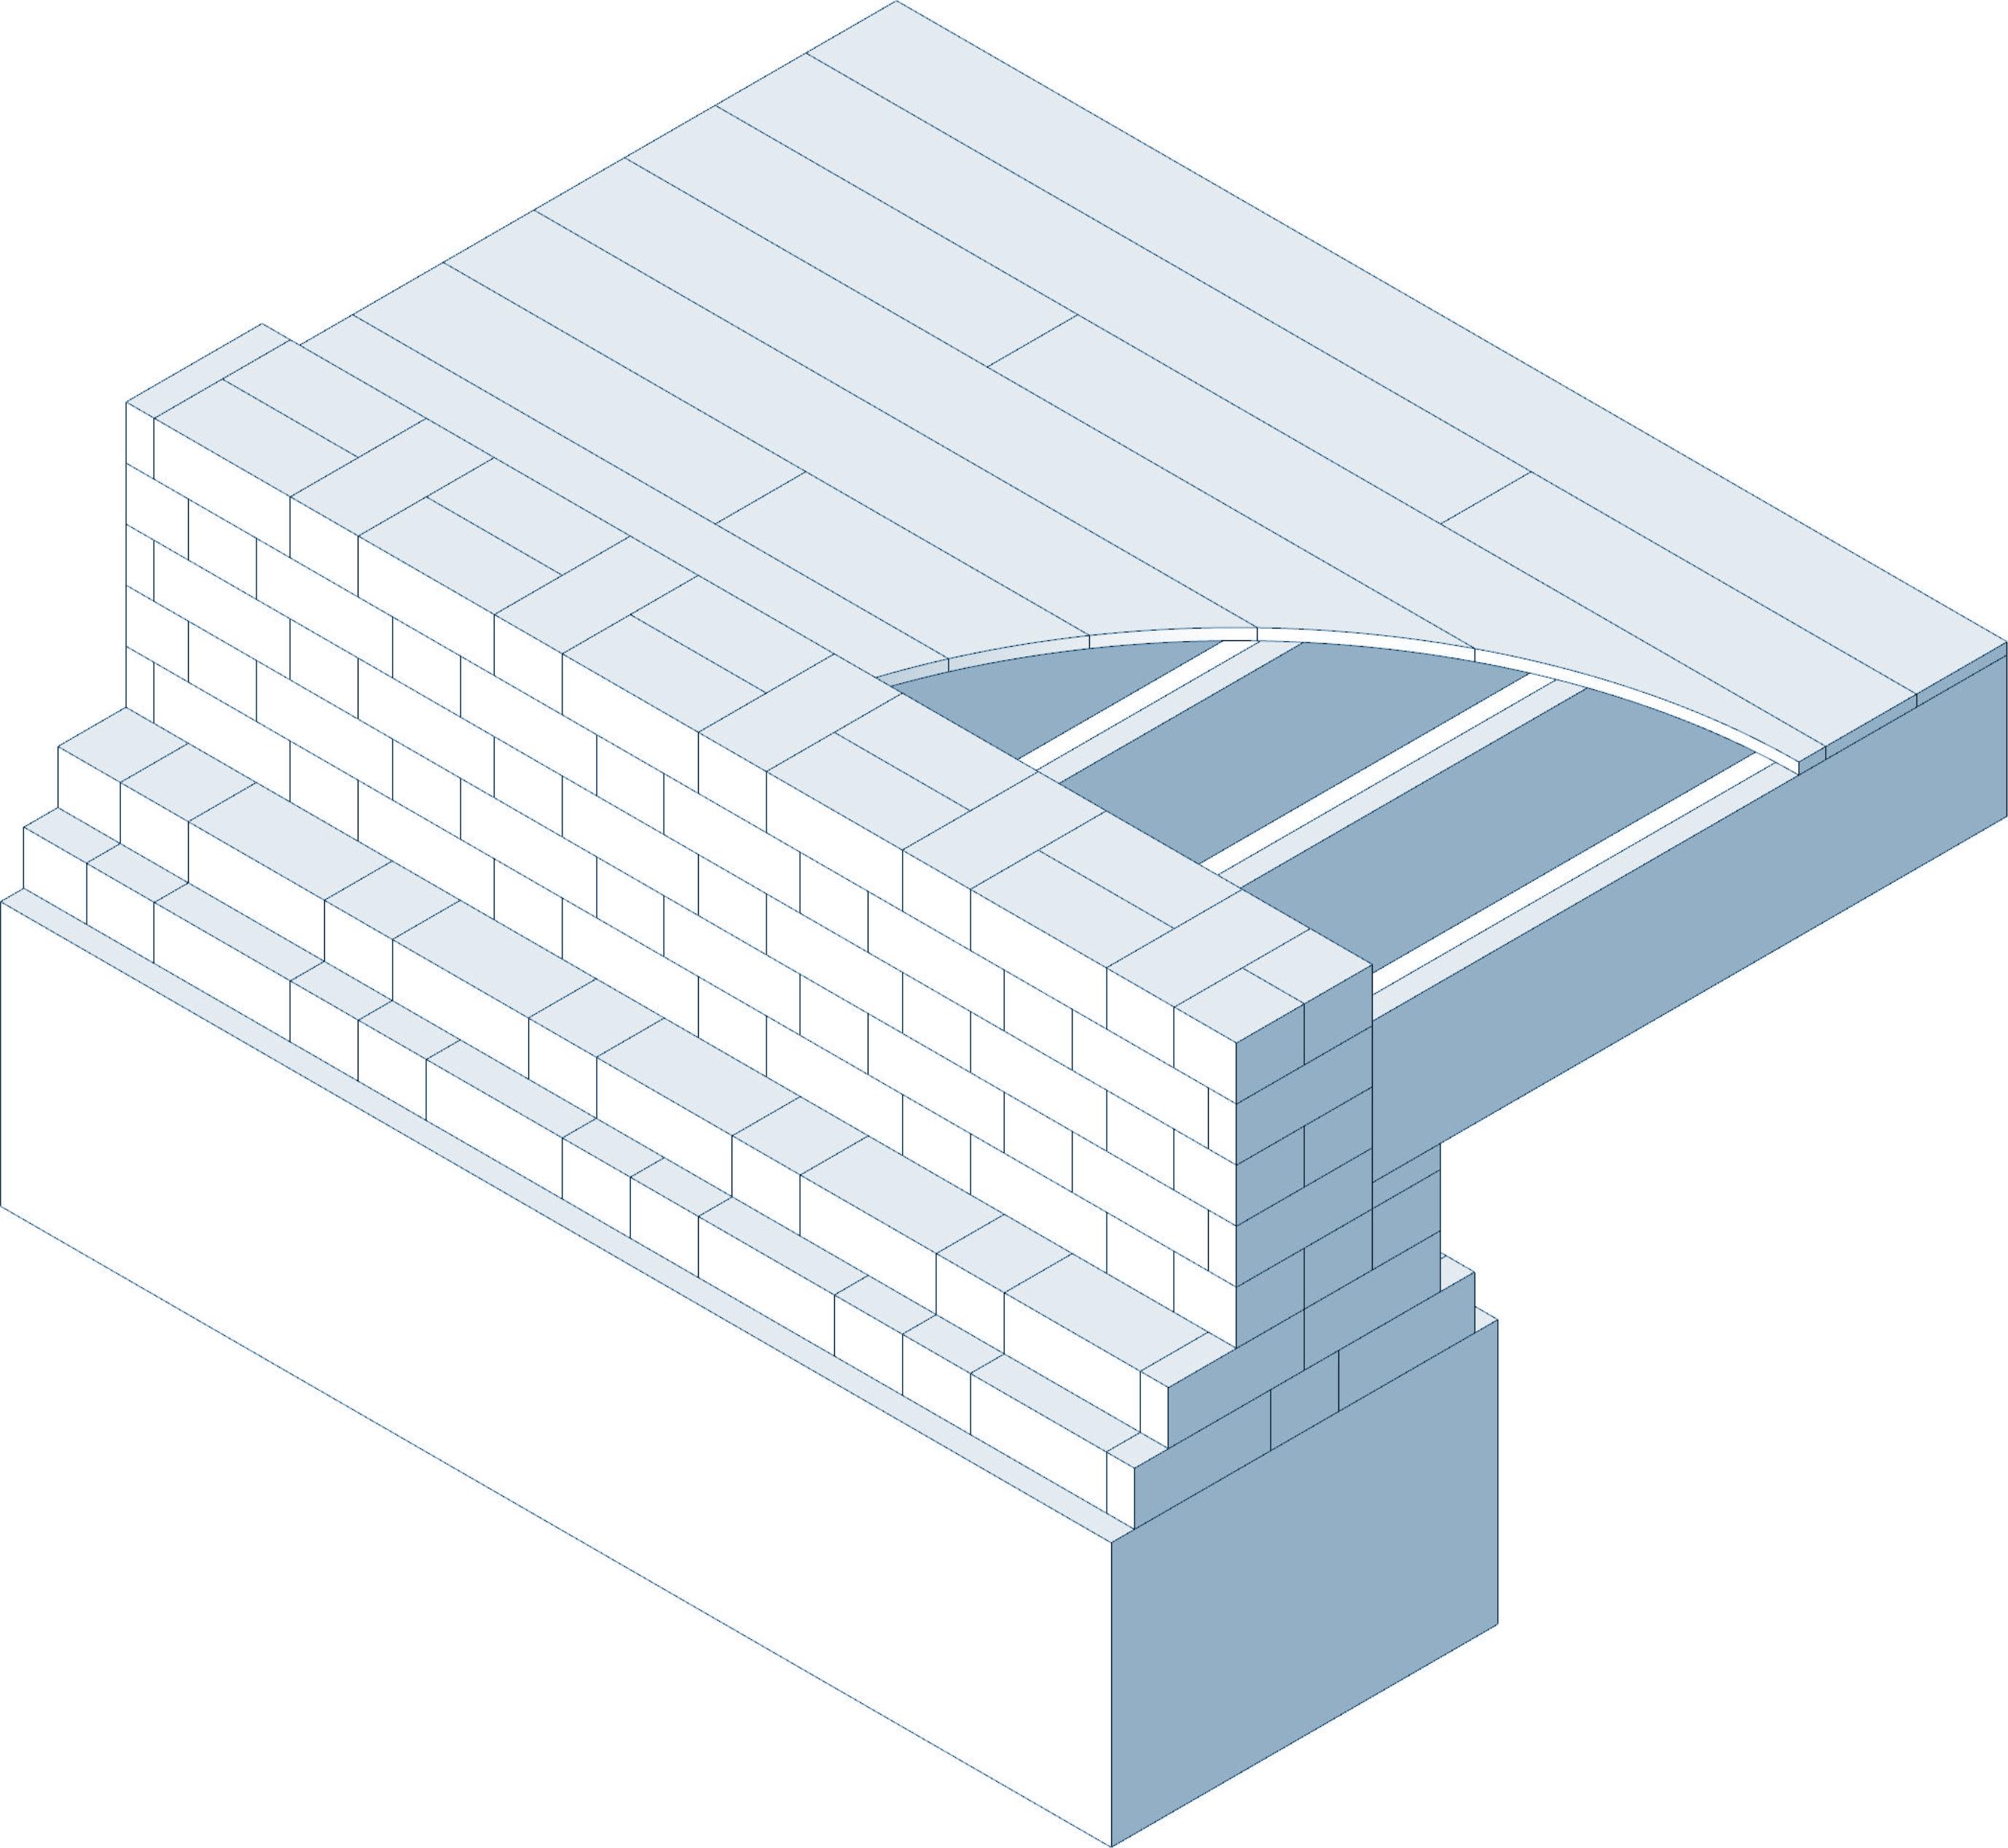
- Each house would have an amount of 45,000 units of Welsh brick from the 19th century.
- The structure of the houses is composed of 2.4 tons of wood, plus the existing partition walls.
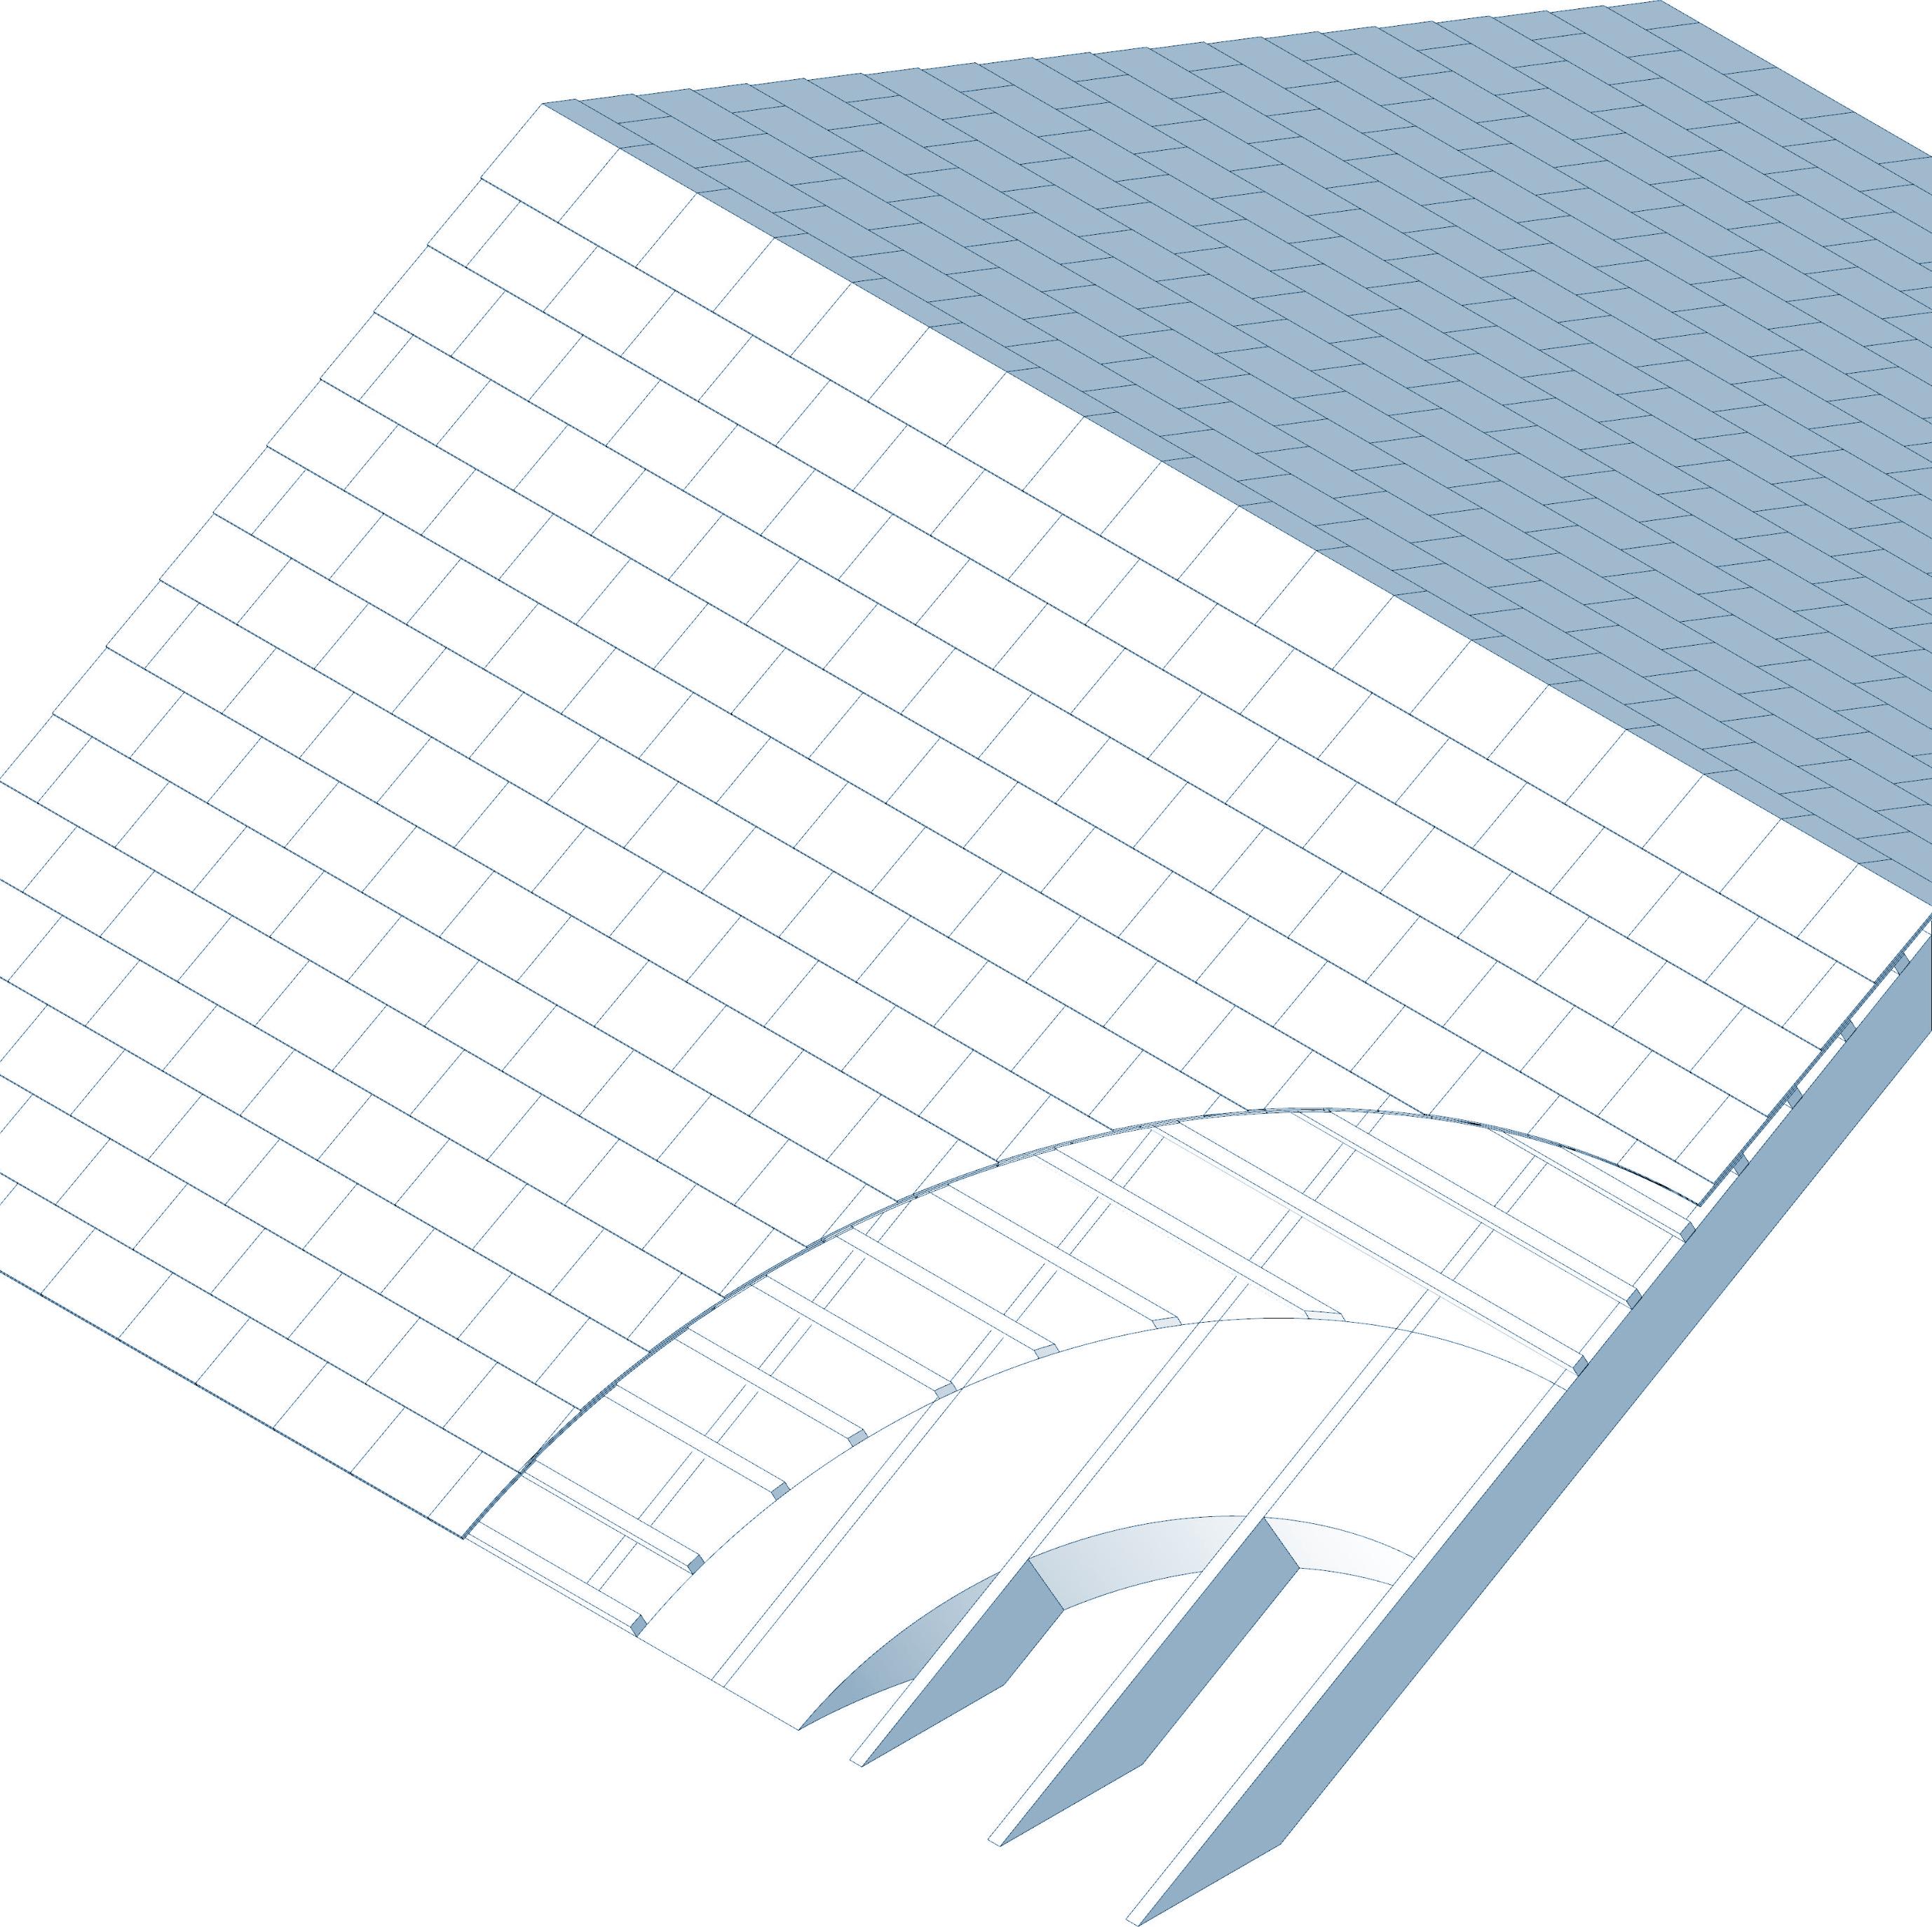
- Each house contains approximately 300 slate roof tiles.
These materials in particular, brick, wood, and slate roof tiles, are already commonly reclaimed and reintroduced into the urban fabric. As a first step, ensuring the collection of these materials through pre-demolition audits would be building upon an existing network of material resale.
ExistingMaterialResellersandReclamationFacilities
and Passports byBradleyNissen
DECONSTruCTION
prOCEDurE
Audits
Map 30.
auDIT
Map 29. DuCIE ST. FaCaDE SECTION. MaTErIaLS EXTraCTED byBorjaRomeu
77 76
DECONSTRUCTION AND OWNERSHIP Audits and Passports
Within the PCP model, ownership of vacant and derelict properties are transfered from the local authority to joint ownership with community organizations. These organizations, such as Community Land Trusts, will use funding from the local authority or private sources in the form of grants and loans to renovate the property and provide stewardship for their care.
With common ownership of derelict buildings, community organizations with input from the local council and expertise from relevant companies and organizations can determine a buildings suitability for renovation or adaptive reuse. Buildings in the worst conditions would be carefully deconstructed to reclaim materials to be used for other projects within the community.
The most derelict buildings, for which renovation is not suitable, will be carefully deconstructed. The materials will first be catalogued through mandatory pre-demolition audits, then transported to local reuse facilities. From there, these materials can be reused locally in retrofits projects, new build constructions, and nearby workshops.
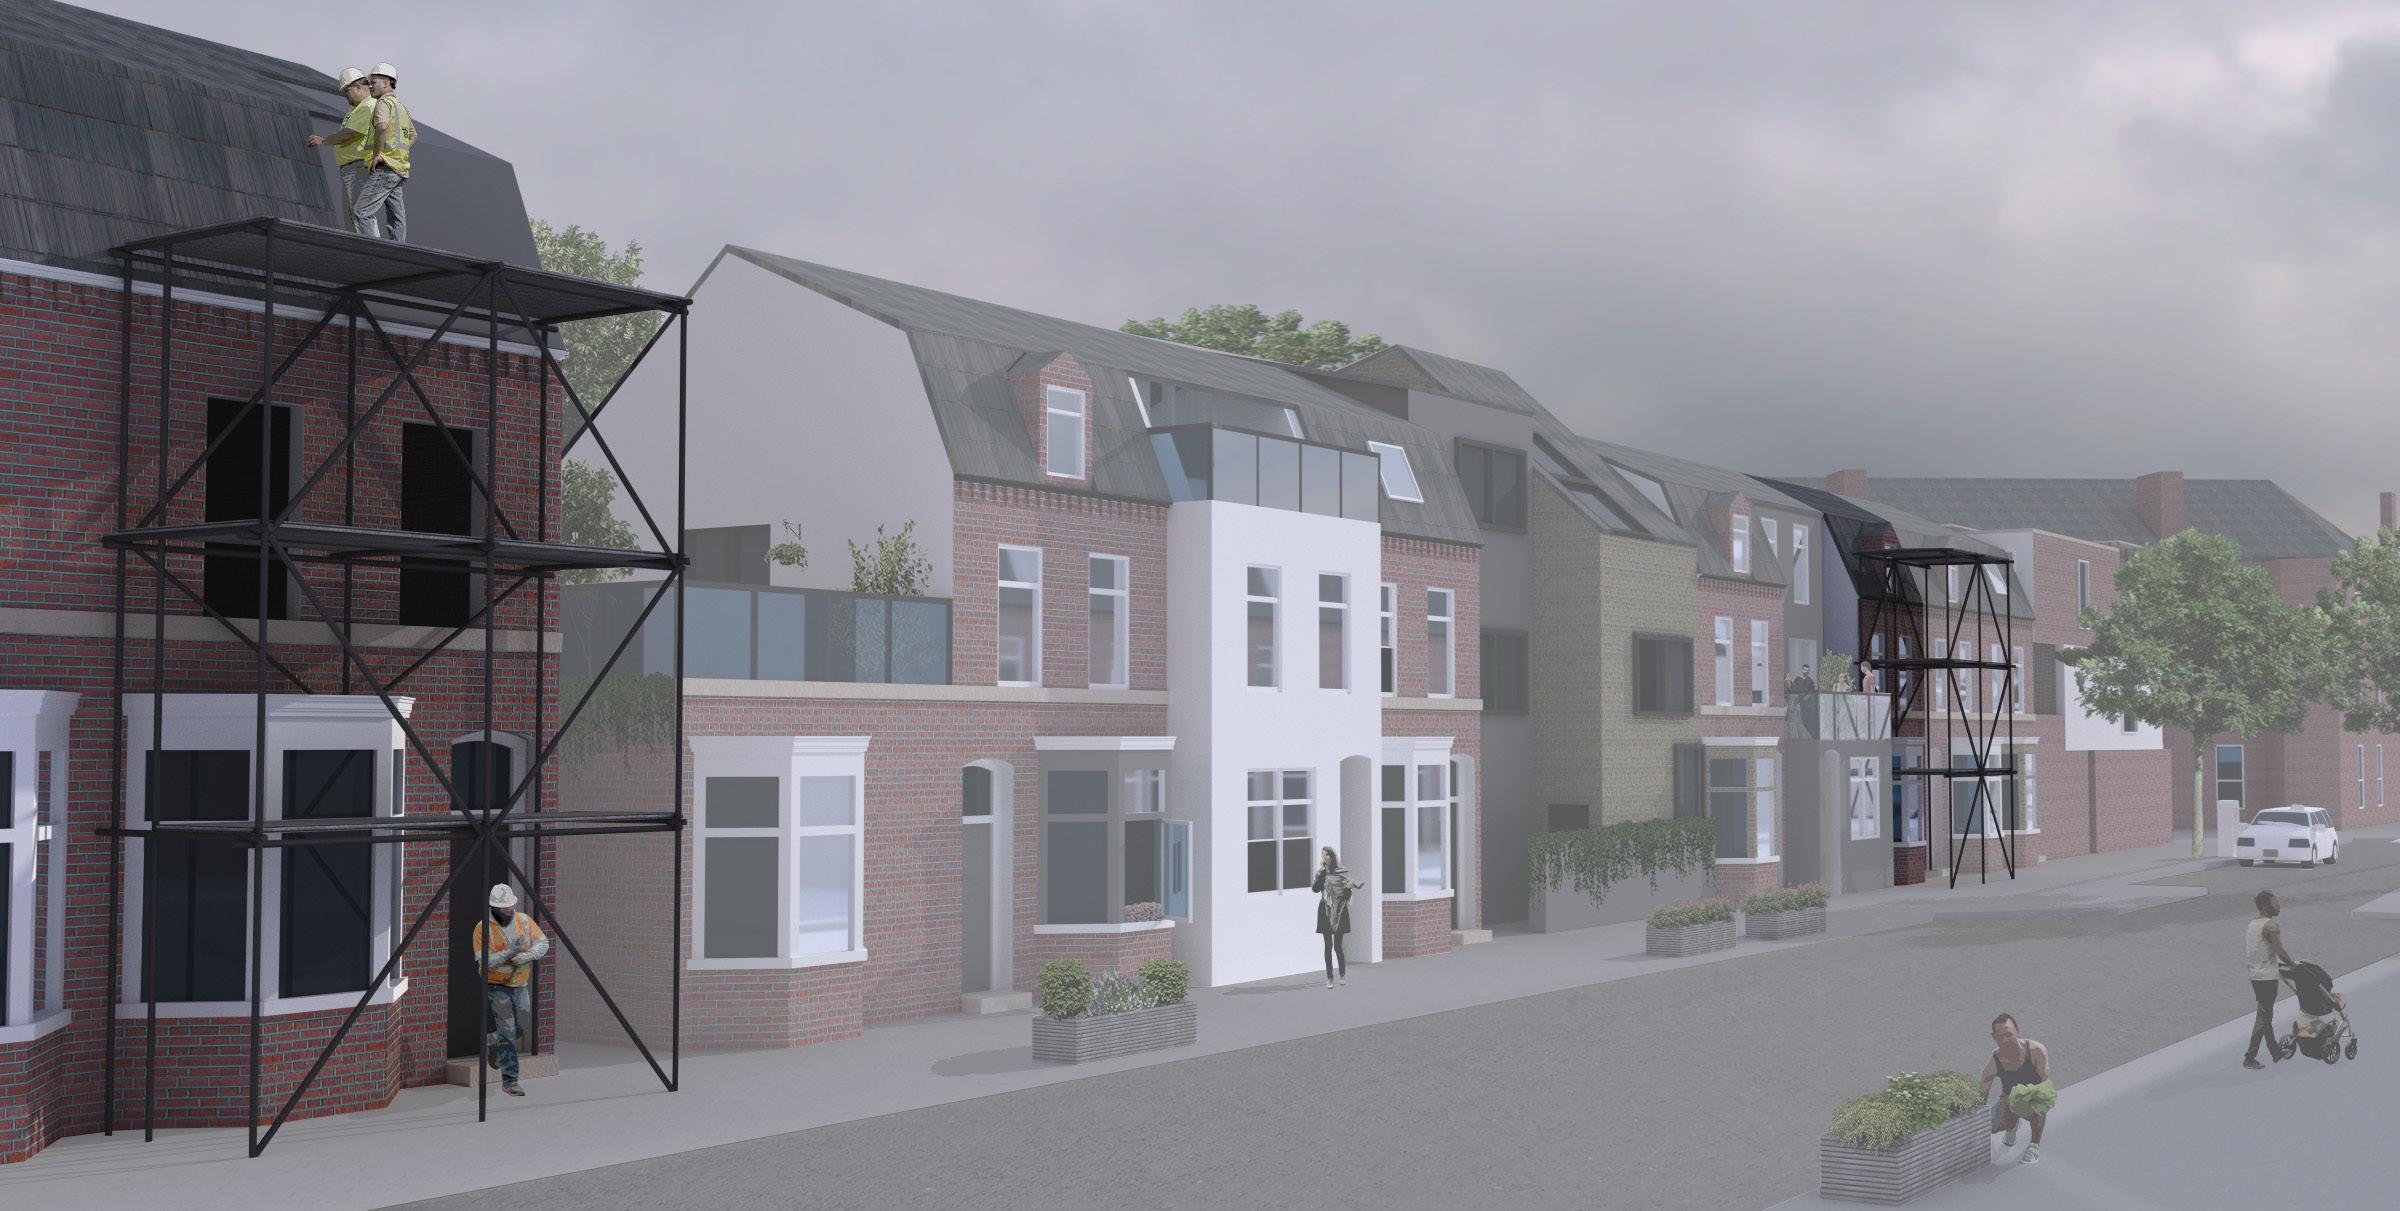
Map 31. GraNBY rENDErING DECONSTruCTION auDITS byBradleyNissen 79 78
MATERIAL CATALOGUE FROM DECONSTRUCTION
After a building has been deconstructed, individual components and materials will be in different conditions and will have different dimensions. These differences must be accounted for within a future material management system to ensure that materials with a higher reuse potential are separated from materials that may be downcycled into another type of construction product.

32. MaTEr aL CaTaLOGuE
81 80
Map
FOr TErraCE HOuSE byShenghanWang Audits and Passports
MATERIAL CATALOGUE FOR CLASSIFICATION AND USAGE GUIDANCE
Audits and Passports Map
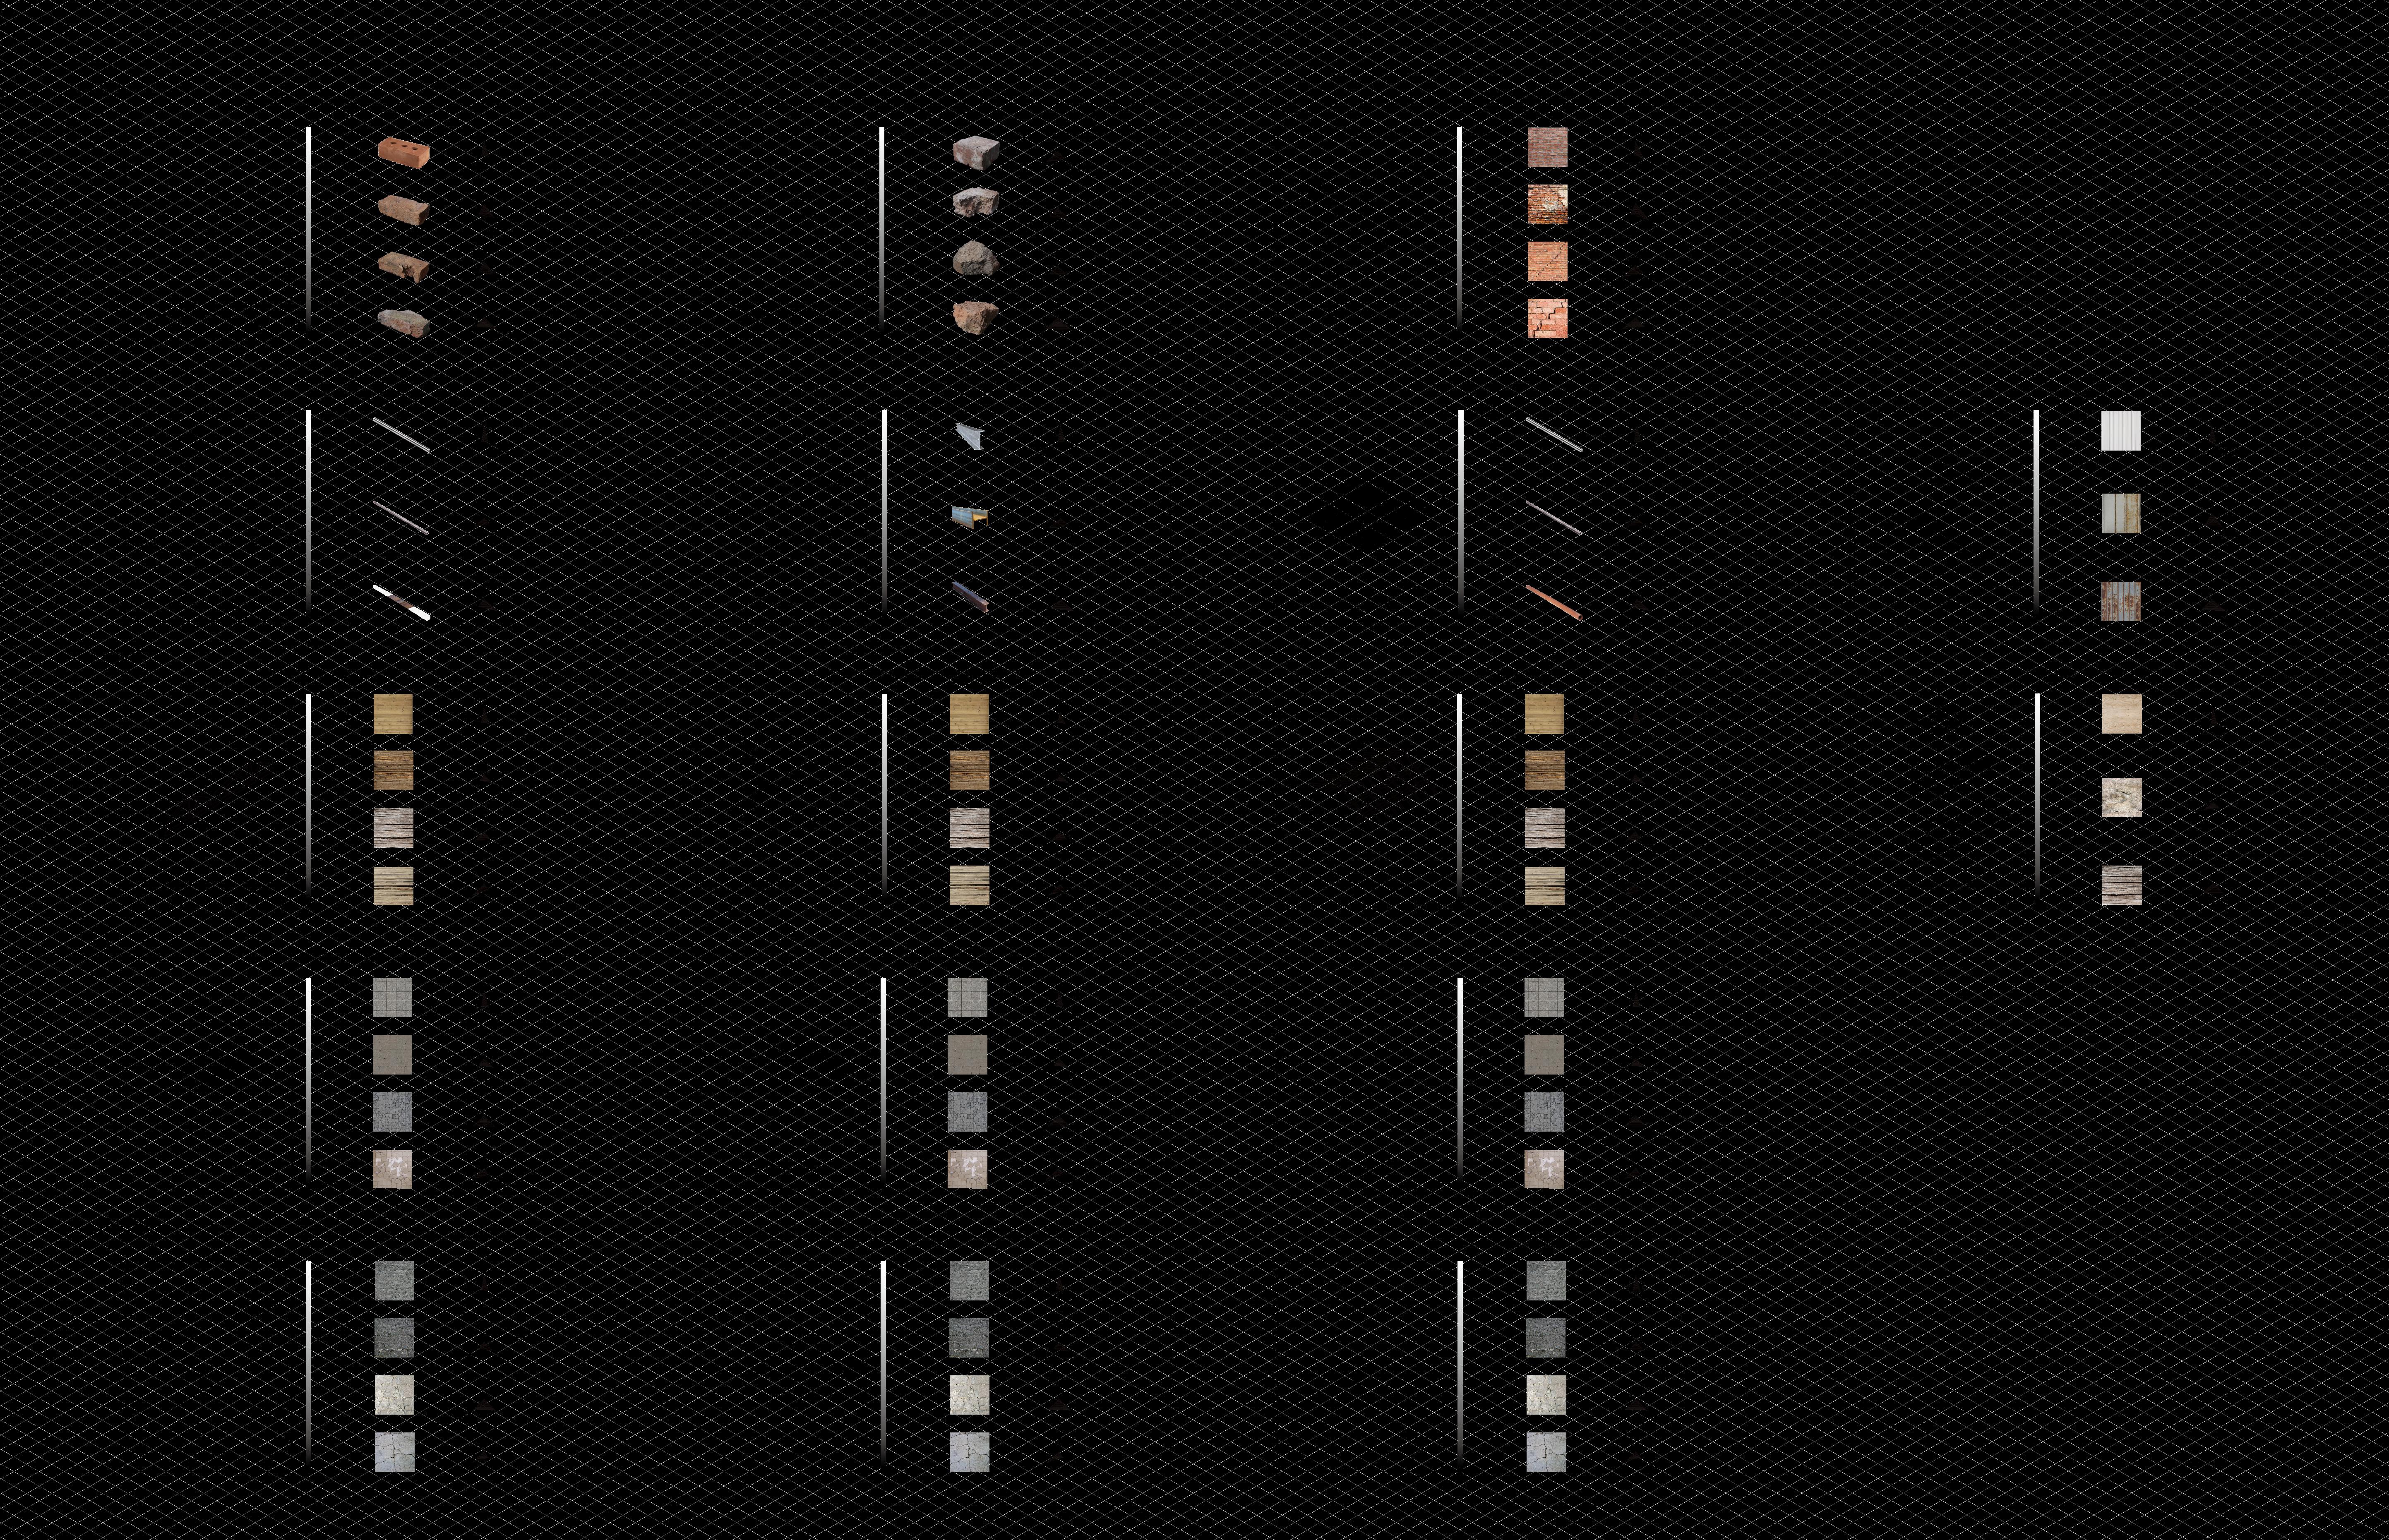
We have selected five of the most common construction materials and provided recommendations for their subsequent management in different conditions. Some higher quality materials may be directly reused, while others of lesser quality may be recycled or repurposed. By understanding the differences in quality of reclaimed materials, we can better provide clear pathways for reuse regardless of their quality. This framework would not only be relevant for deconstruction companies performing material audits, but they could also be used by community members in need of materials for renovations, DIY projects, and fabrications to determine the availability and quality of materials.
33. MaTEr aL CaTaLOGuE
COMparISON
83 82
QuaLITY
byShenghanWang
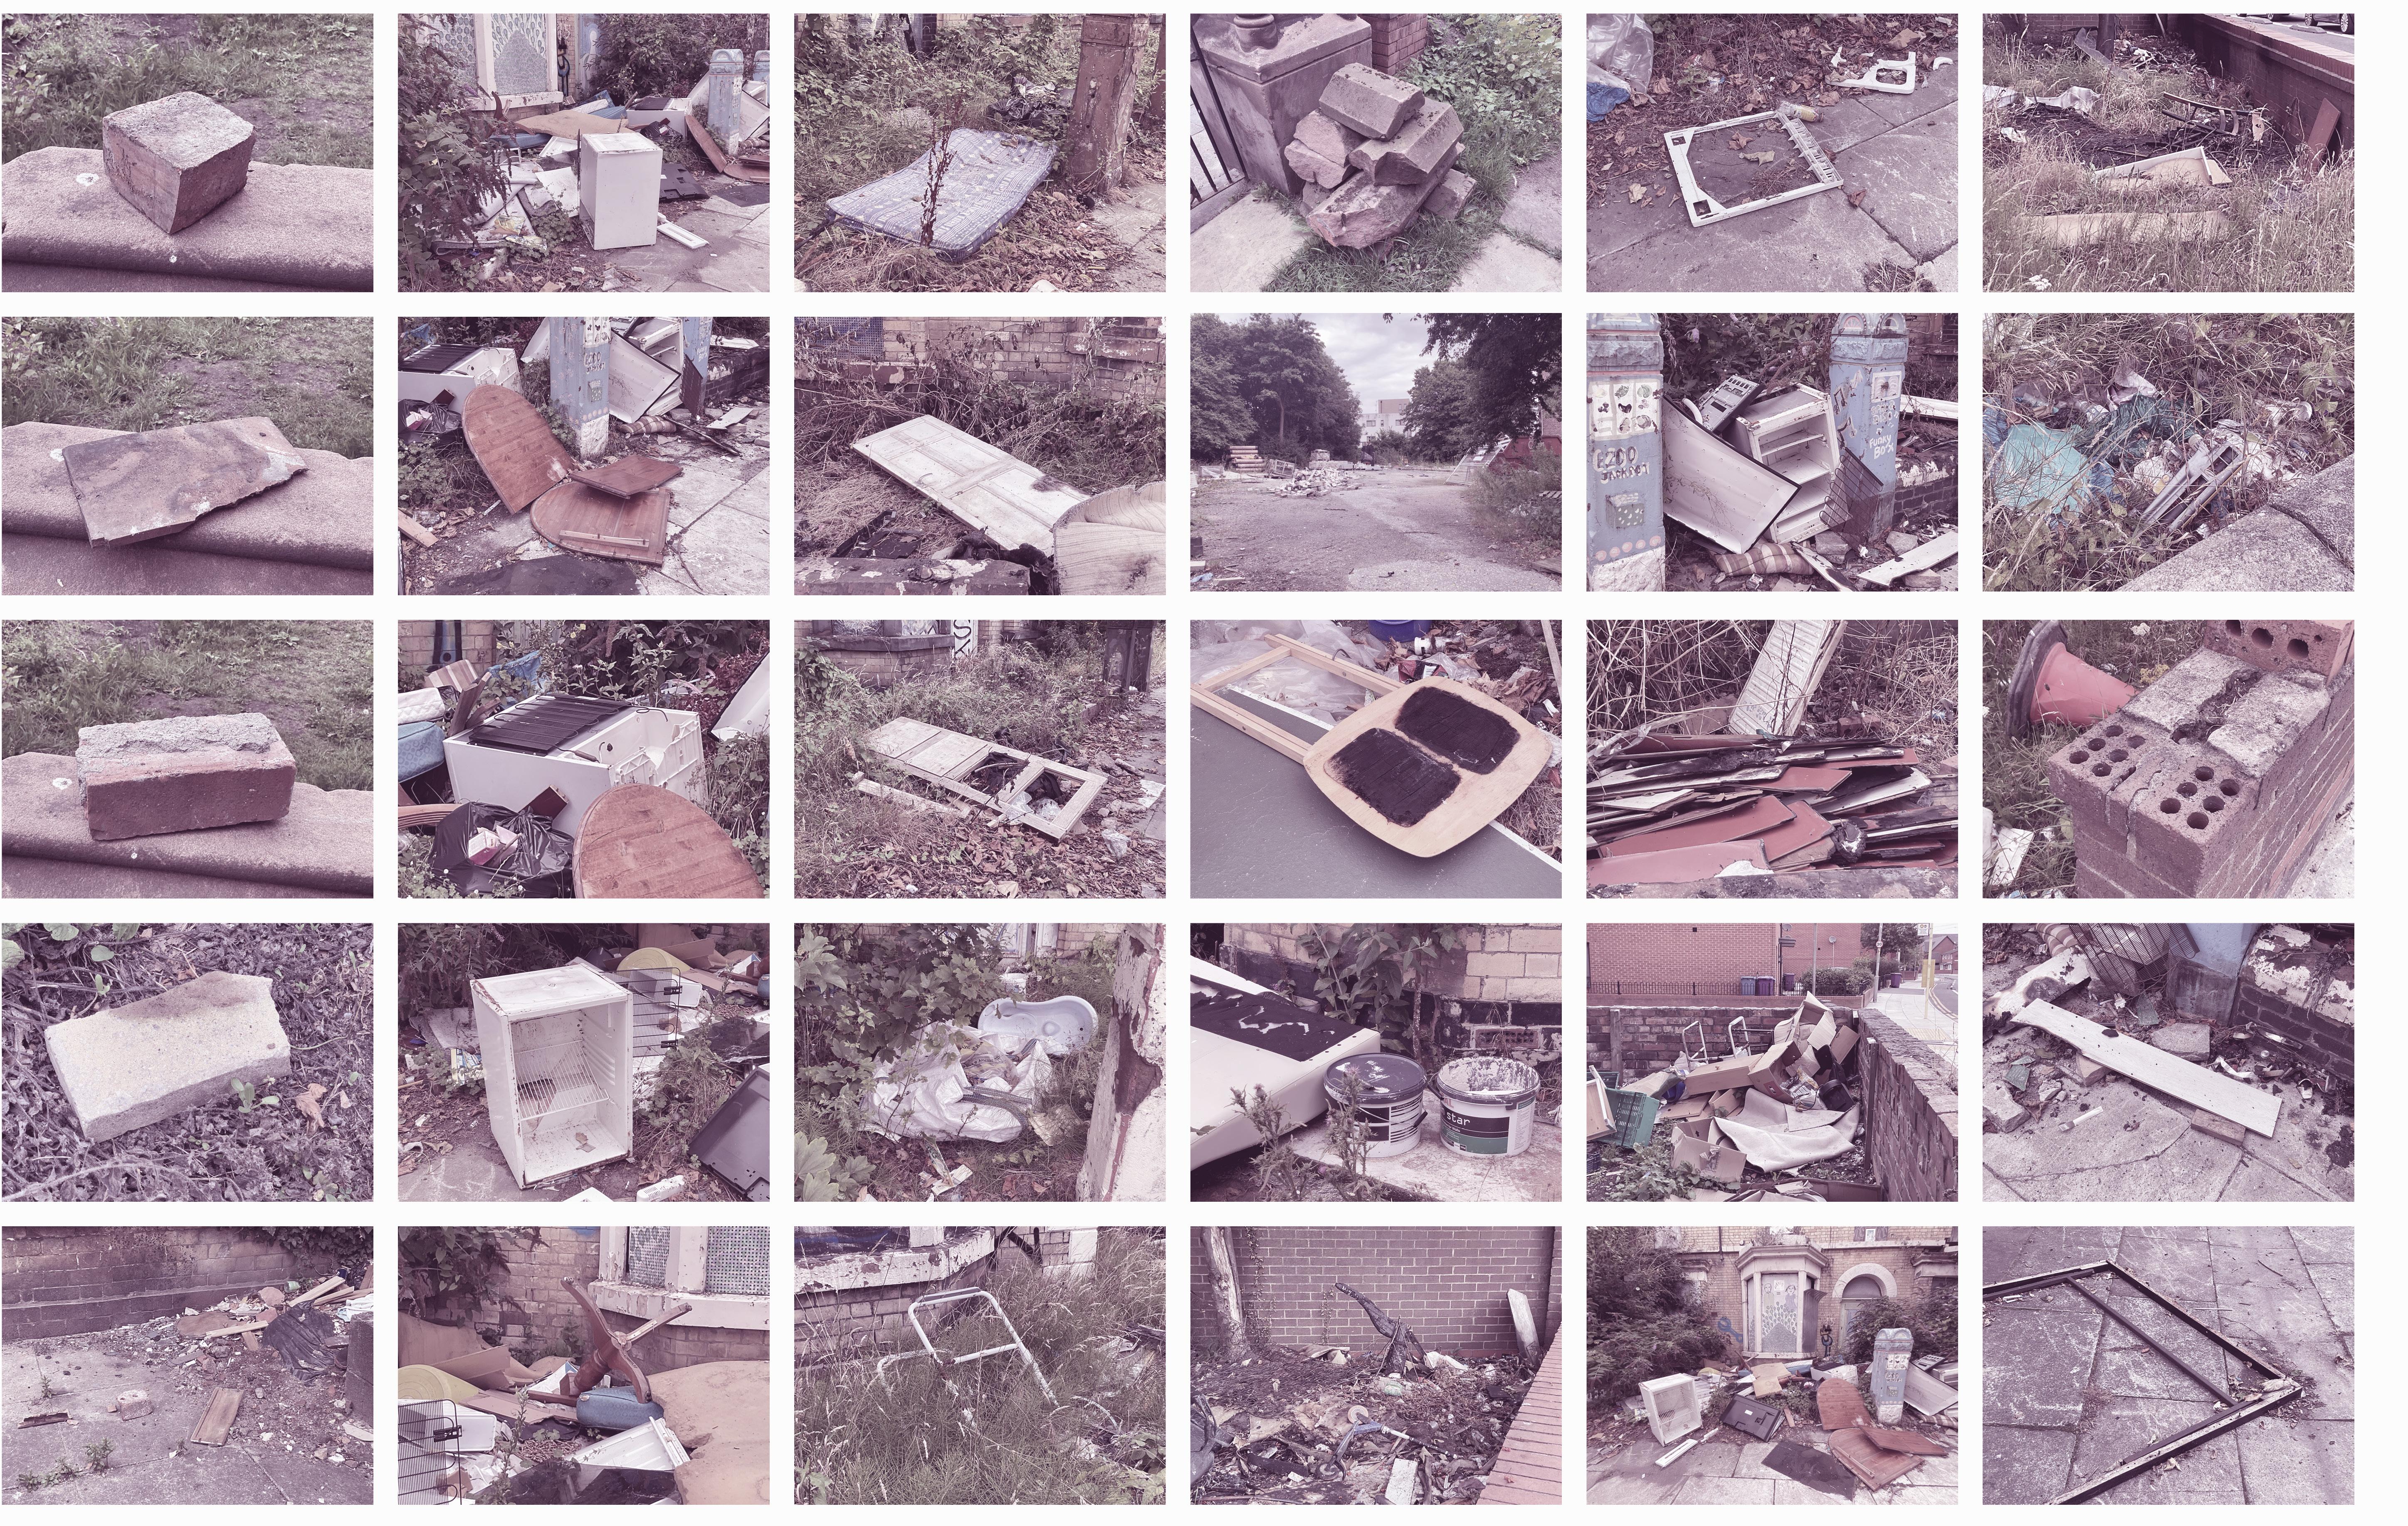
GRANBY SITE VISIT Audits and Passports FIGurE 14. aBaNDONED MaTErIaLS IN GraNBY arEa OriginalpicturesbyMingxiShu 85 84
MATERIAL PASSPORTS
Audits and Passports
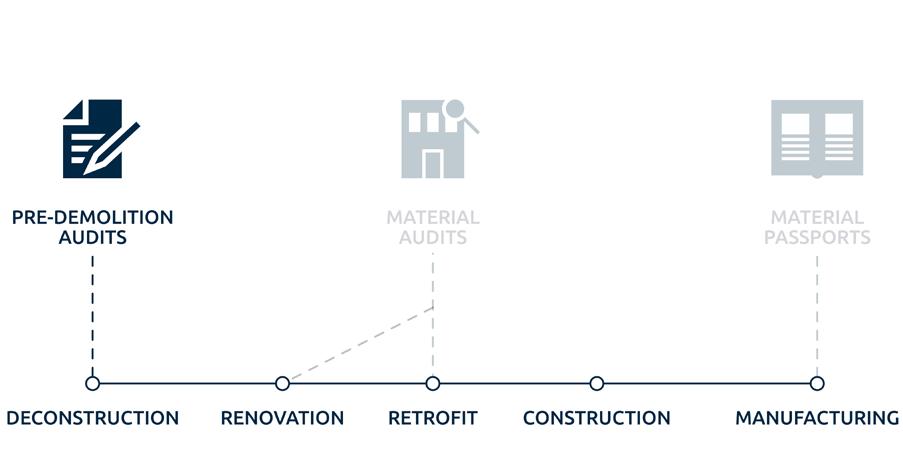
A lack of material data is one of the largest obstacles to reuse. Another initiative, Material Passports, seeks to ensure recovery and reuse of building components by collecting and distributing material data publicly.
Material Passport data is valuable for various actors at every stage. For instance, architects can connect material passports to BIM software to choose more sustainable materials with higher reuse potential, or deconstruction companies can use this information to ensure material reuse at the end of a building’s life.
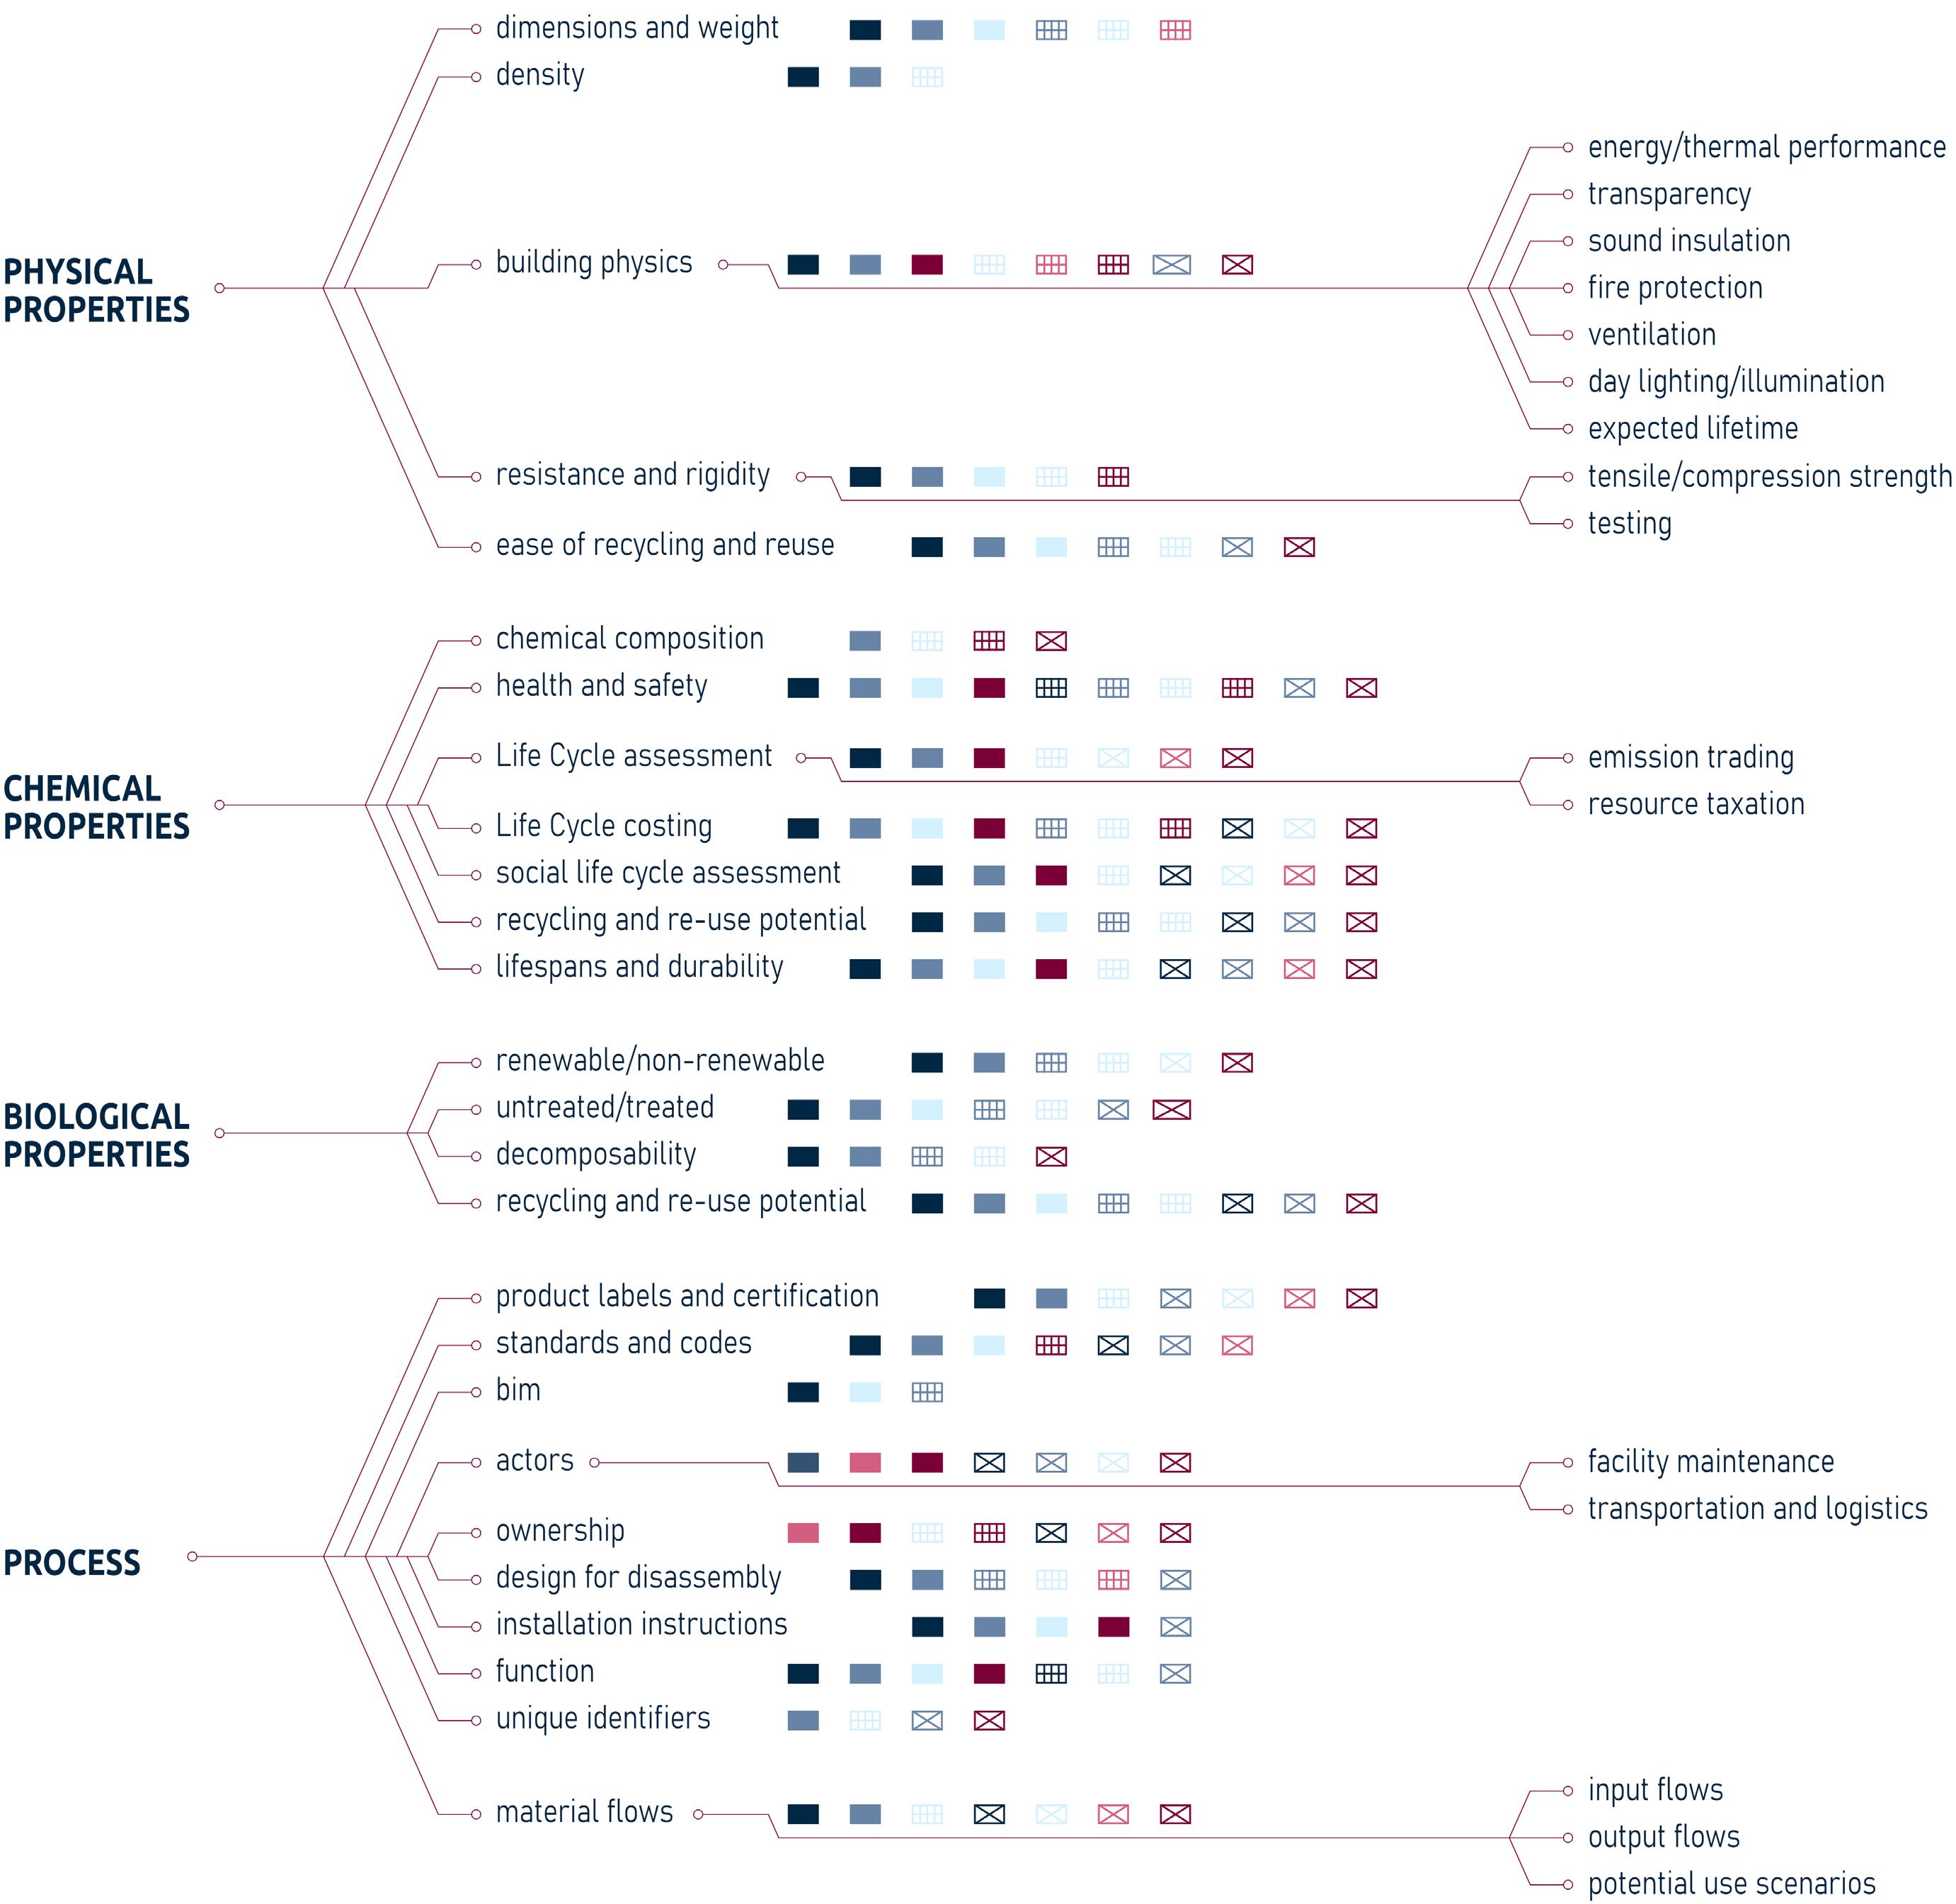

By requiring material passports for all new buildings, we could ensure that the information necessary for reuse is available and accessible.
 Map 34. MaTEr aL paSSpOrT DaTa aND aCTOrS byBradleyNissen
87 86
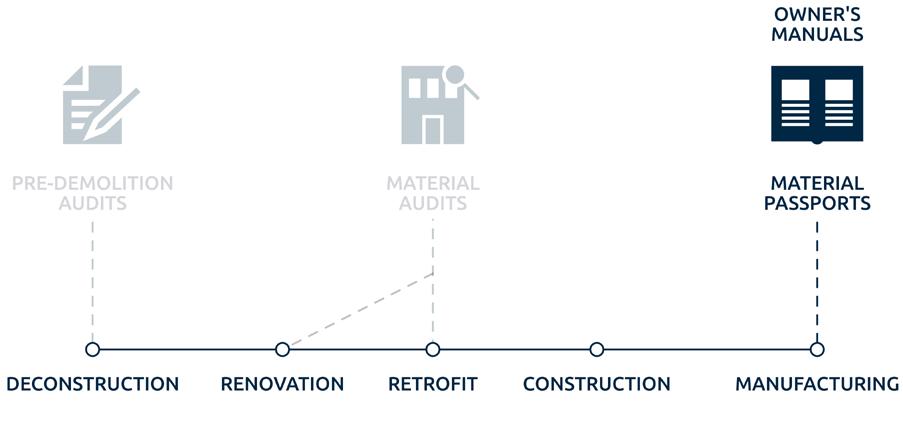
MATERIAL PASSPORT AND ROUGHING BOOK
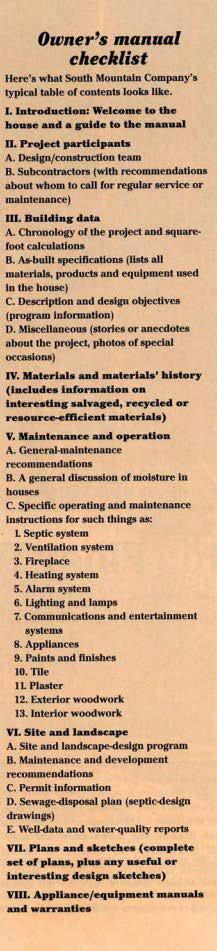
South Mountain Company Architects in the US have been producing owner’s manuals for homes they build, providing owners with building and material data, equipment manuals and warranty information, and maintenance and operation instructions.
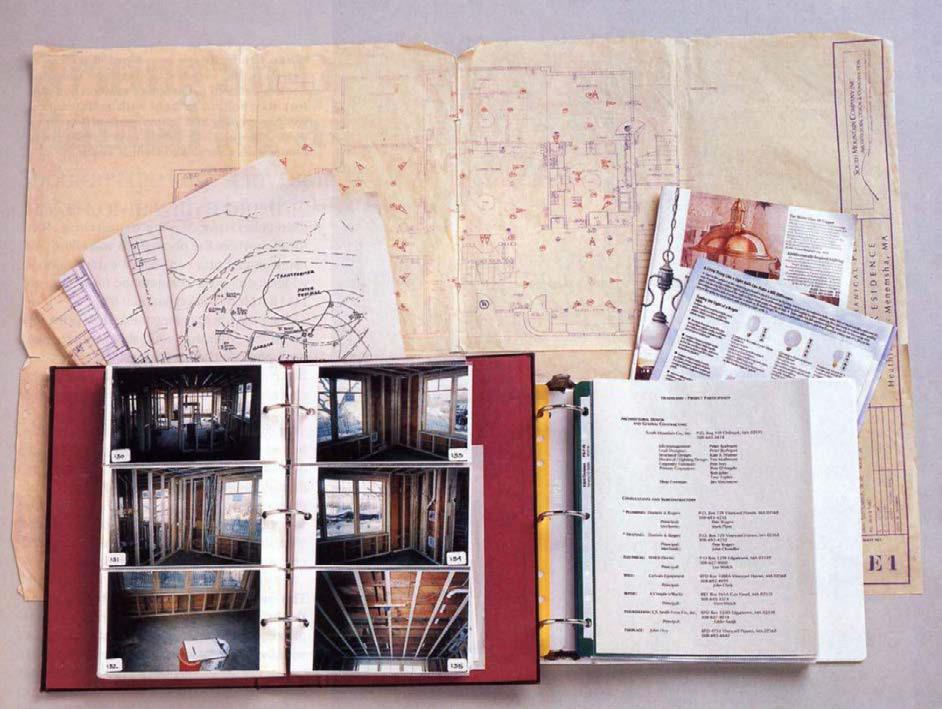
Additionally, they provide a booklet full of photographs taken during the construction stage to give the owners information about how the building is constructed. This booklet empowers residents by enabling construction literacy and is extremely helpful for contractors and workers during repairs or renovation projects.

Map 35. MaTEr aL paSSpOrT appLICaTION by
FIGurE 15. rOuGHING BOOK aND OWNEr’S MaNuaL bySouthMountainCompany Architects
BradleyNissen
Audits and Passports 89 88
MATERIAL AUDIT DURING RENOVATION
Audits and Passports
Renovations and retrofit projects will have access to a large supply of reclaimed materials collected from deconstructions. With robust material data and flexible building regulations, use of reclaimed materials in construction projects will be a viable alternative to new materials.
Before substantial construction projects such as renovations or retrofits, material audits will be performed. These will categorize and locate all of the materials within the existing building to be included in a material passport database and for the creation of material manuals for the home. Changes and additional materials will also be tracked and included.
Material Passports and Owner’s Manuals are important, but they are currently aimed at cataloging information for new buildings and roughly 80 percent of the buildings we will have in 2050 have already been built. This means that it is imperative that any attempt to catalog materials or other building components should include existing buildings.
Substantial construction projects, such as energy retrofits and conversions would provide the best opportunity to collect material data for existing buildings. Material audits performed at this stage would provide detailed information about materials available for reclamation and would expand our knowledge of the existing building stock.
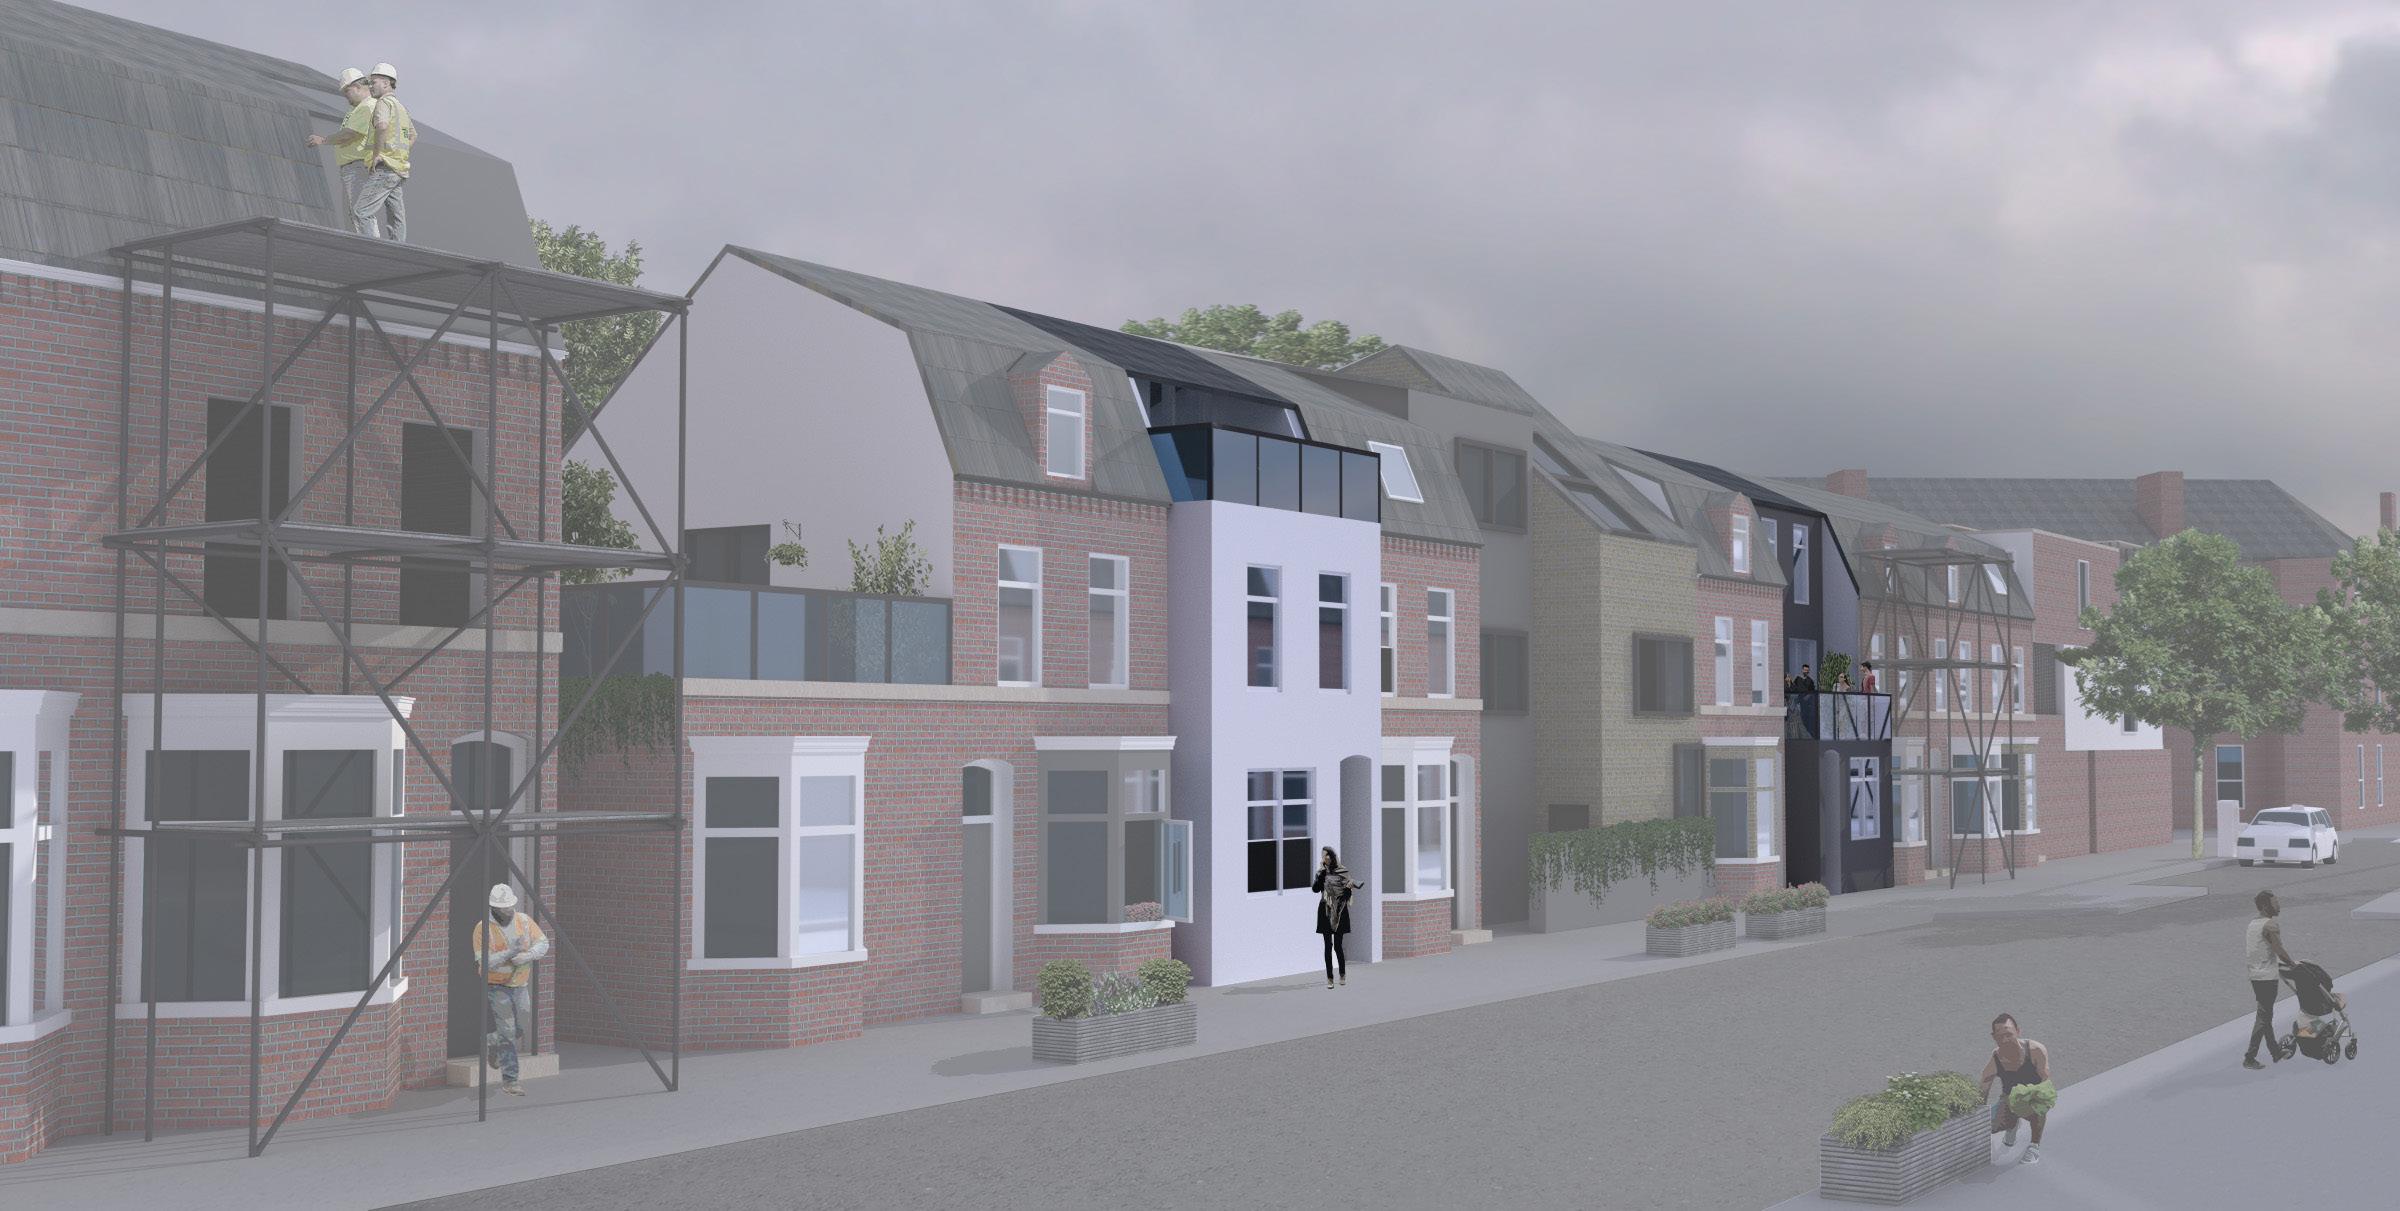
Map 36. GraNBY rENDErING rETrOFIT auDITS byBradleyNissen 91 90
CHAPTER 5 93 05.1 MATERIAL MANUAL 05.2 CONSTRUCTION LIBRARY 05.3 MATERIAL REUSE COMPARISON 05.4 OUR VISION FOR THE COMMUNITY 05.6 ENVIRONMENTAL BENEFIT OF NEW DEVELOPMENT 05 THE MATERIAL MANUAL
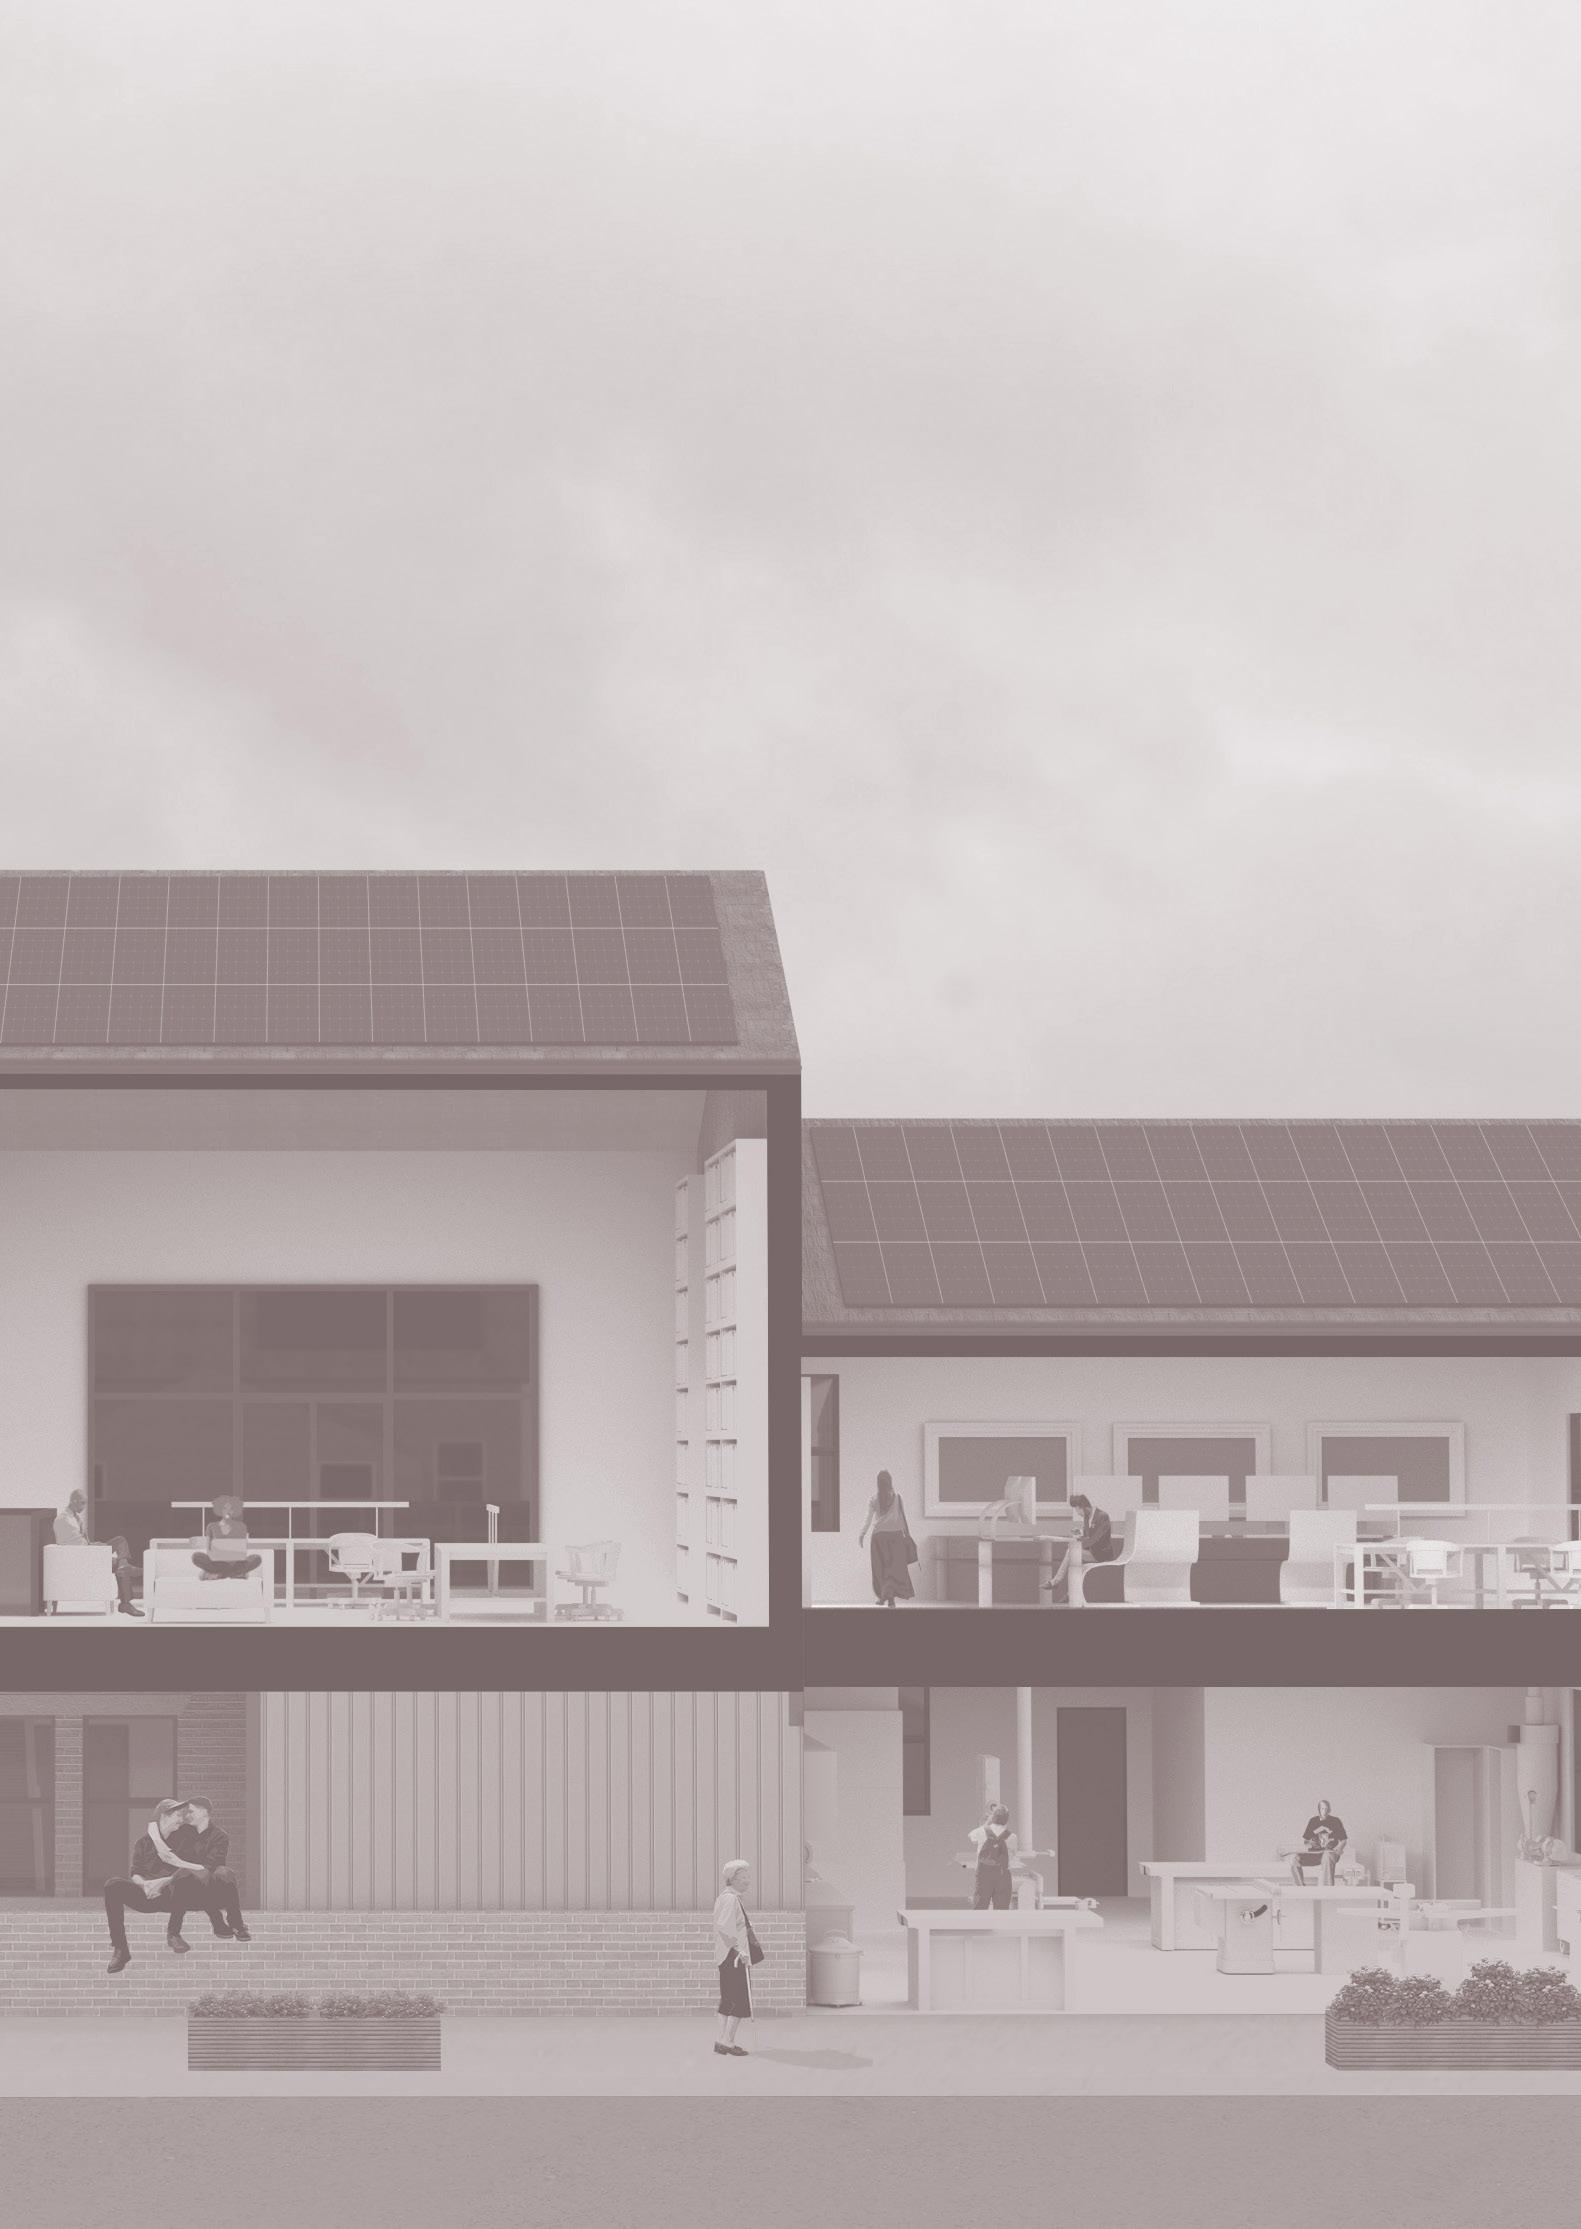
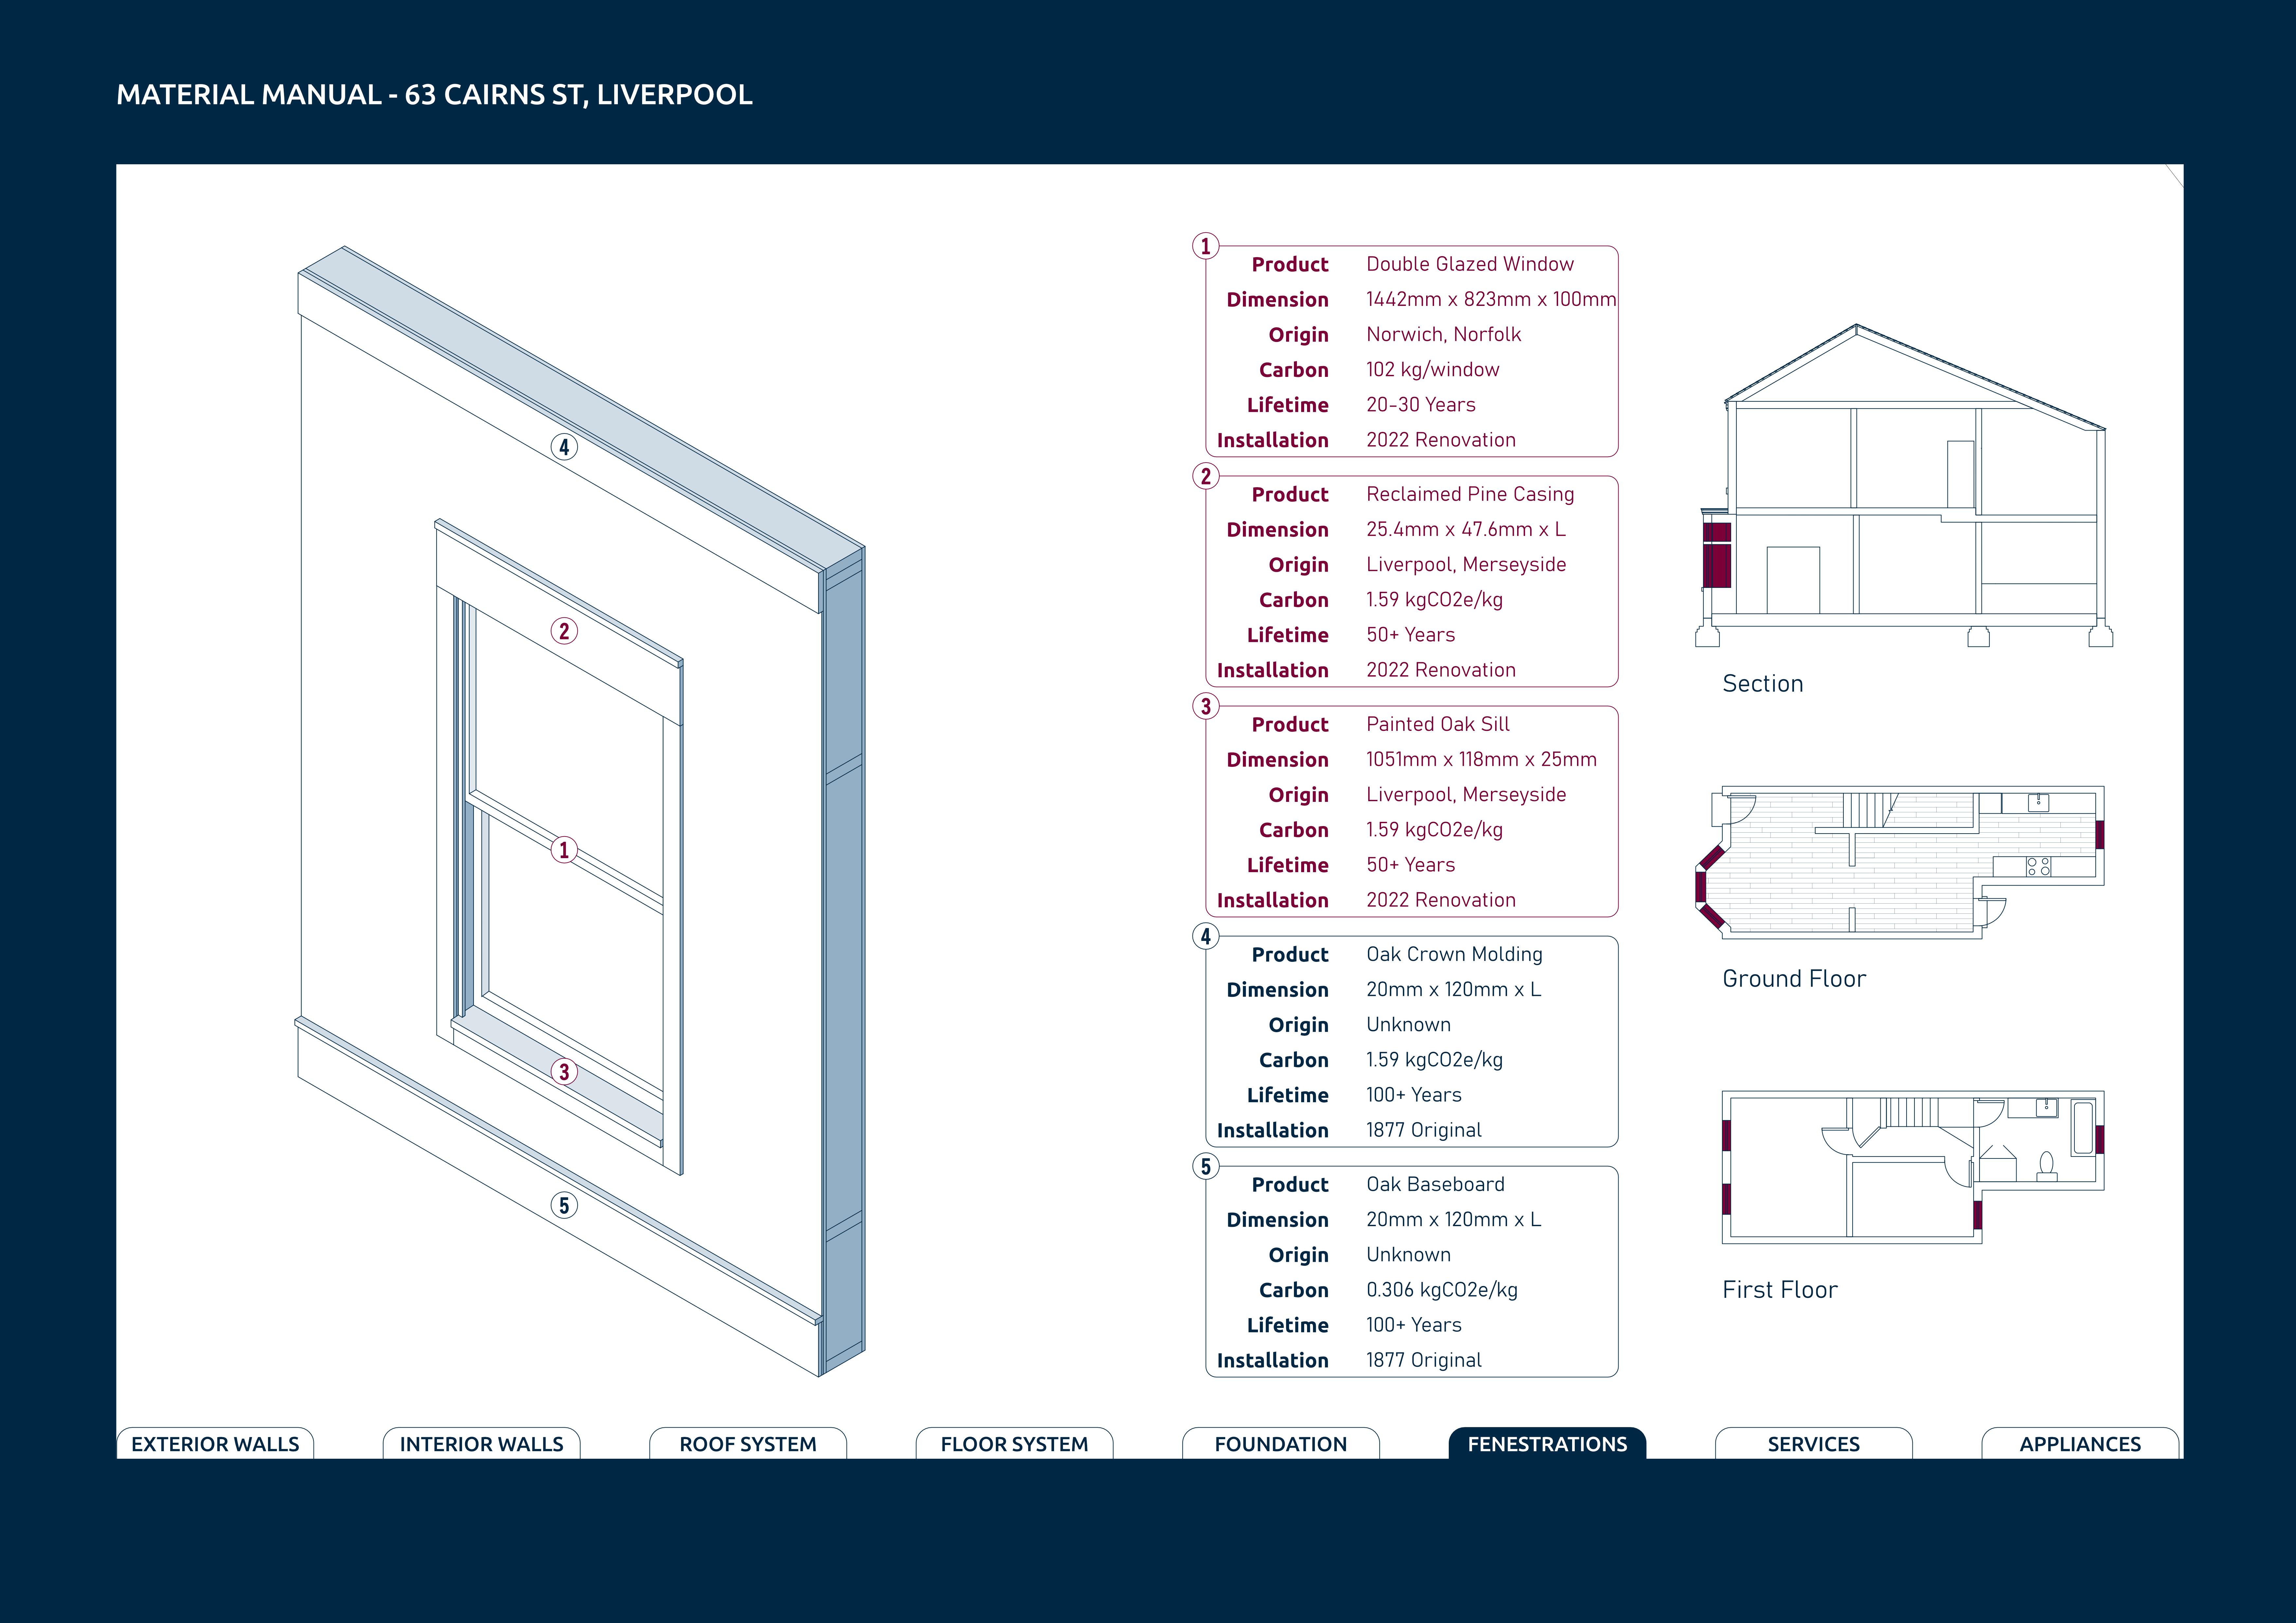
Once collected, this information should be publicly available in the form of material passports, but it should also be formatted into a collection of accessible drawings like an owner’s manual that provide occupants with detailed information about the construction of the buildings they live and work in and the materials within them.
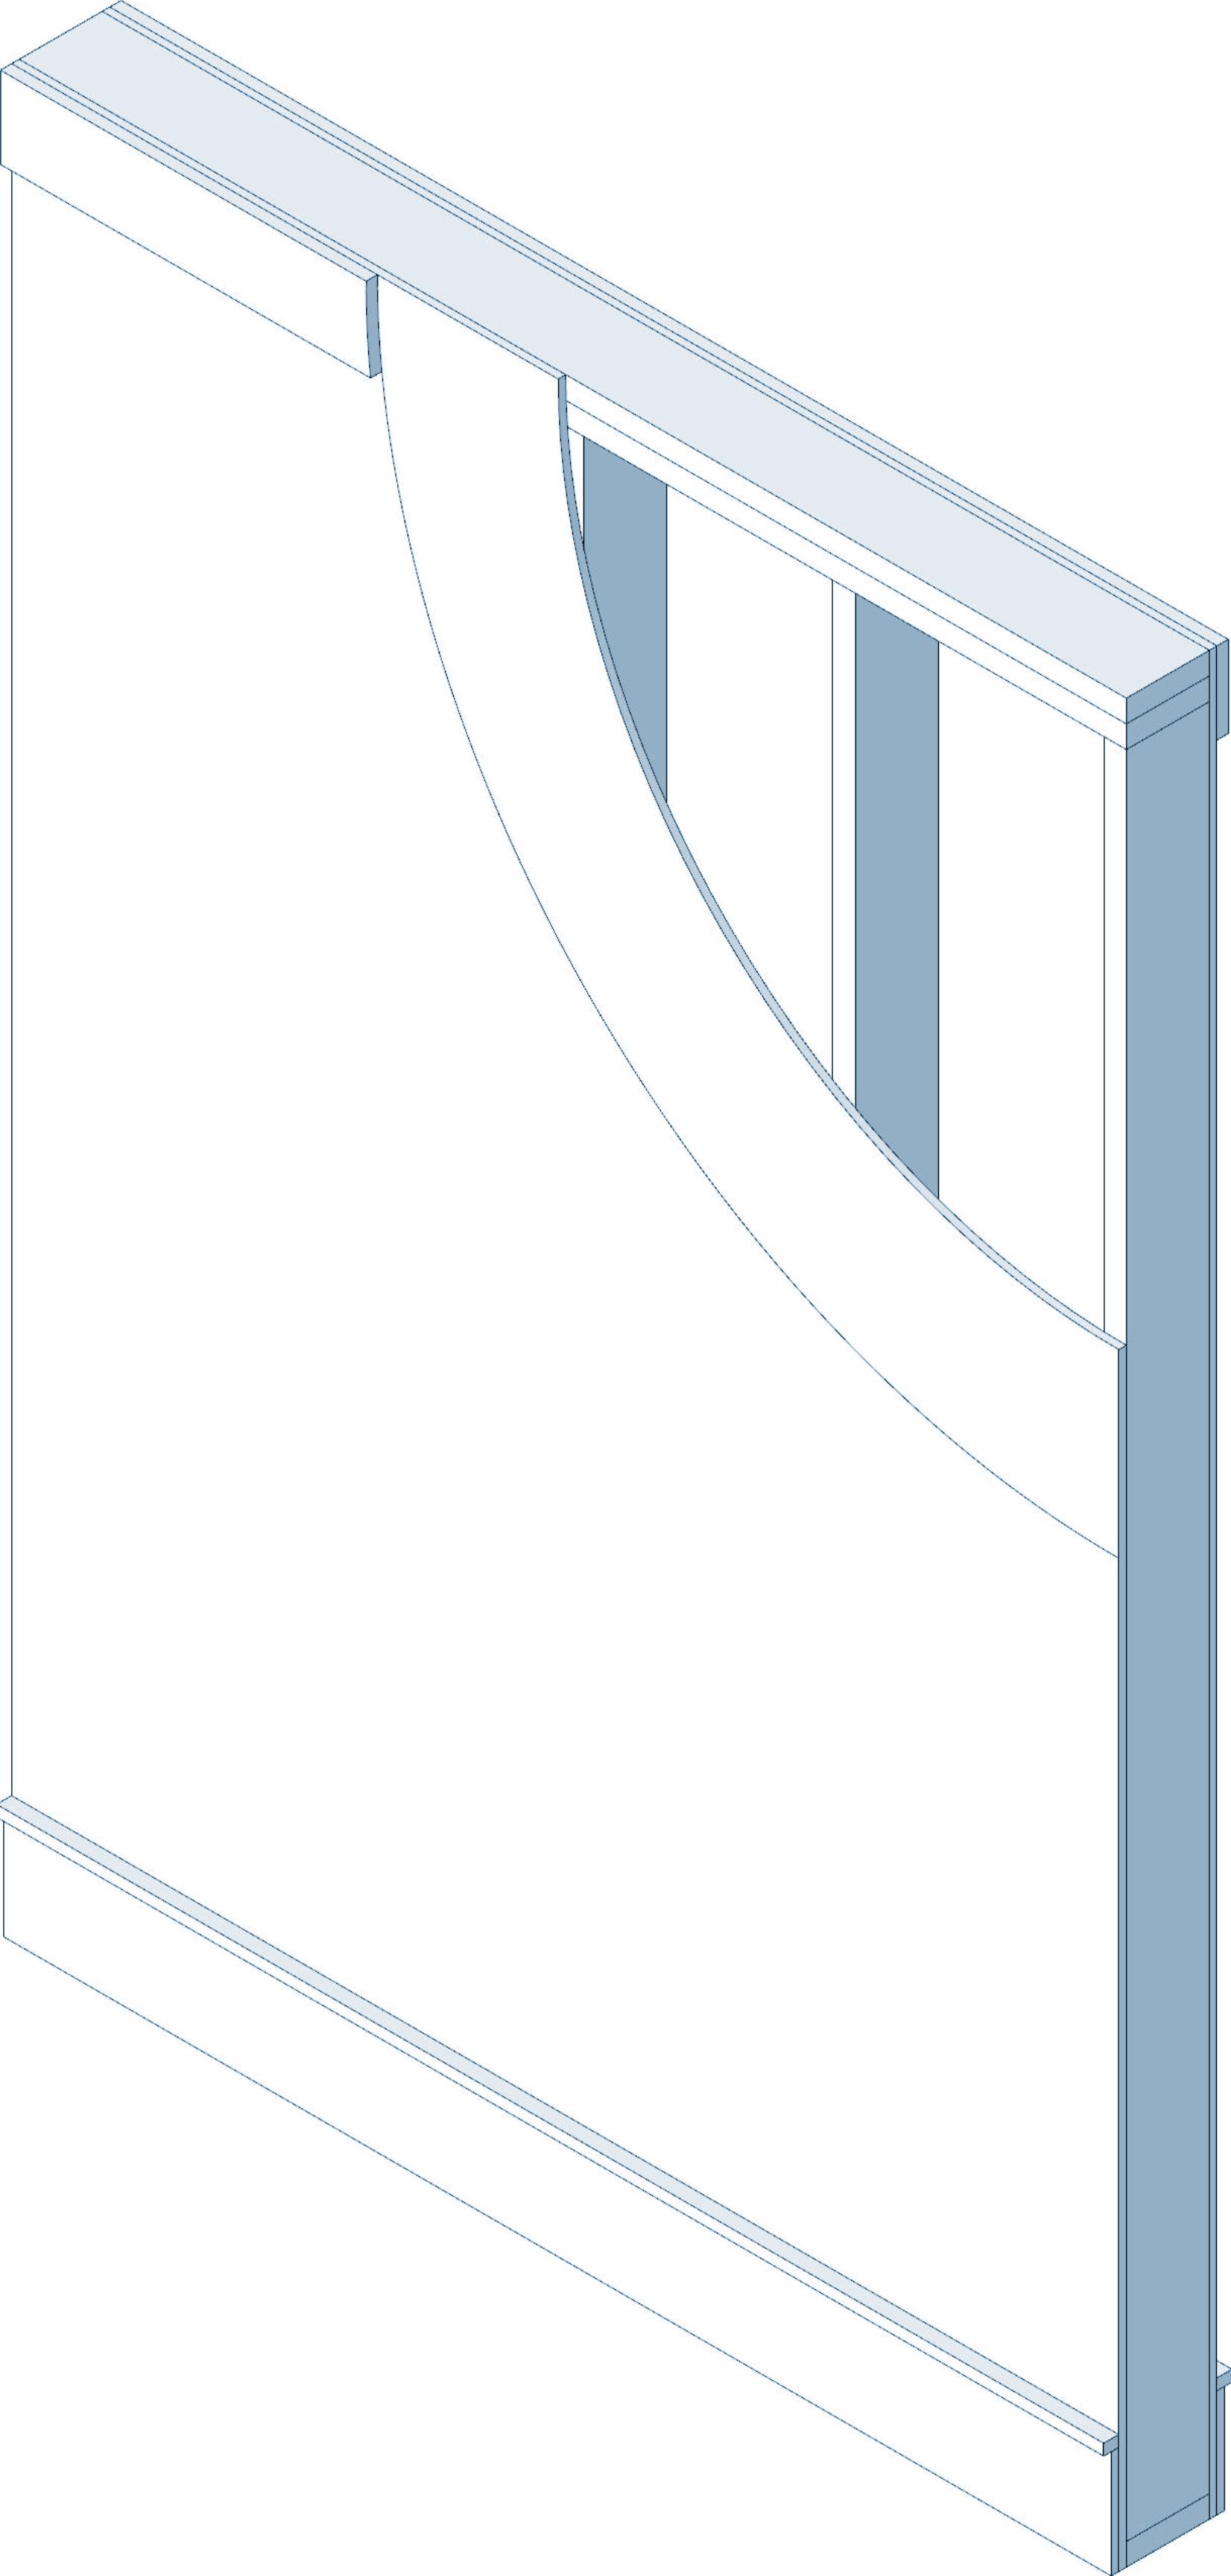
These drawings would show individual components such as exterior and interior walls with detailed but relevant data about each material, its origin, expected lifetime, and location within the building. As materials are replaced or added over time, these changes would also be cataloged like when an energy retrofit adds thermal insulation.
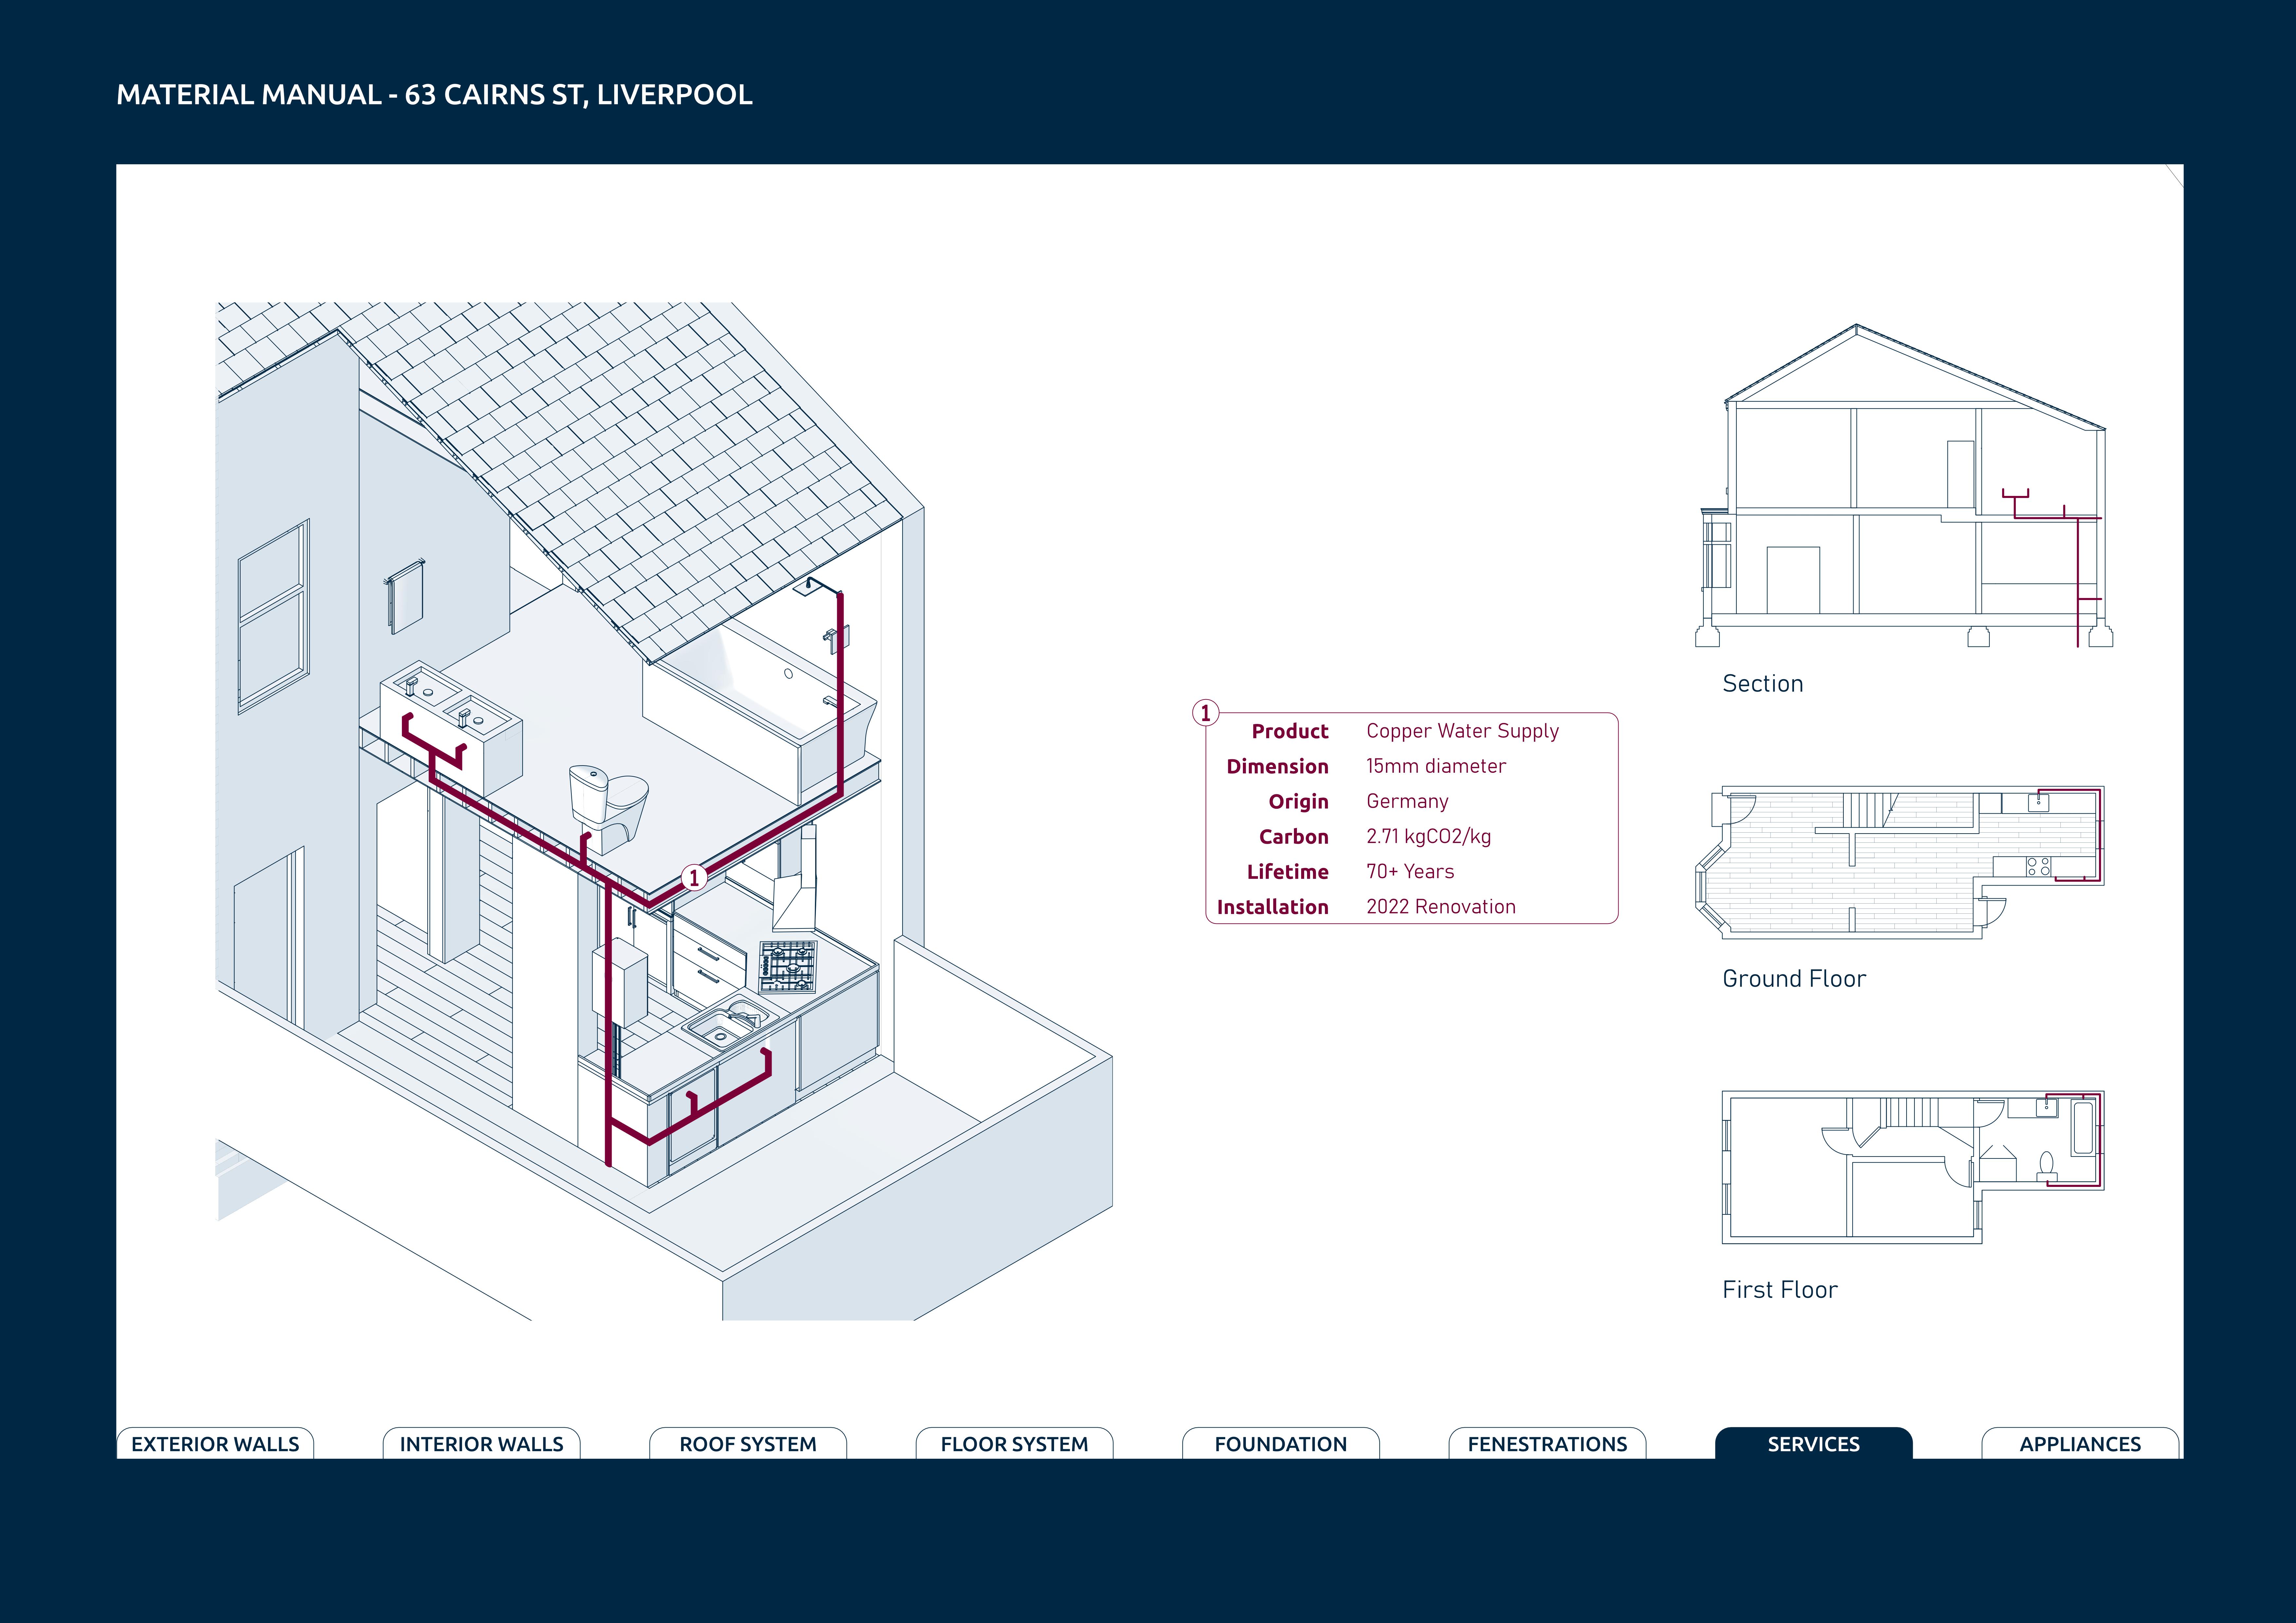
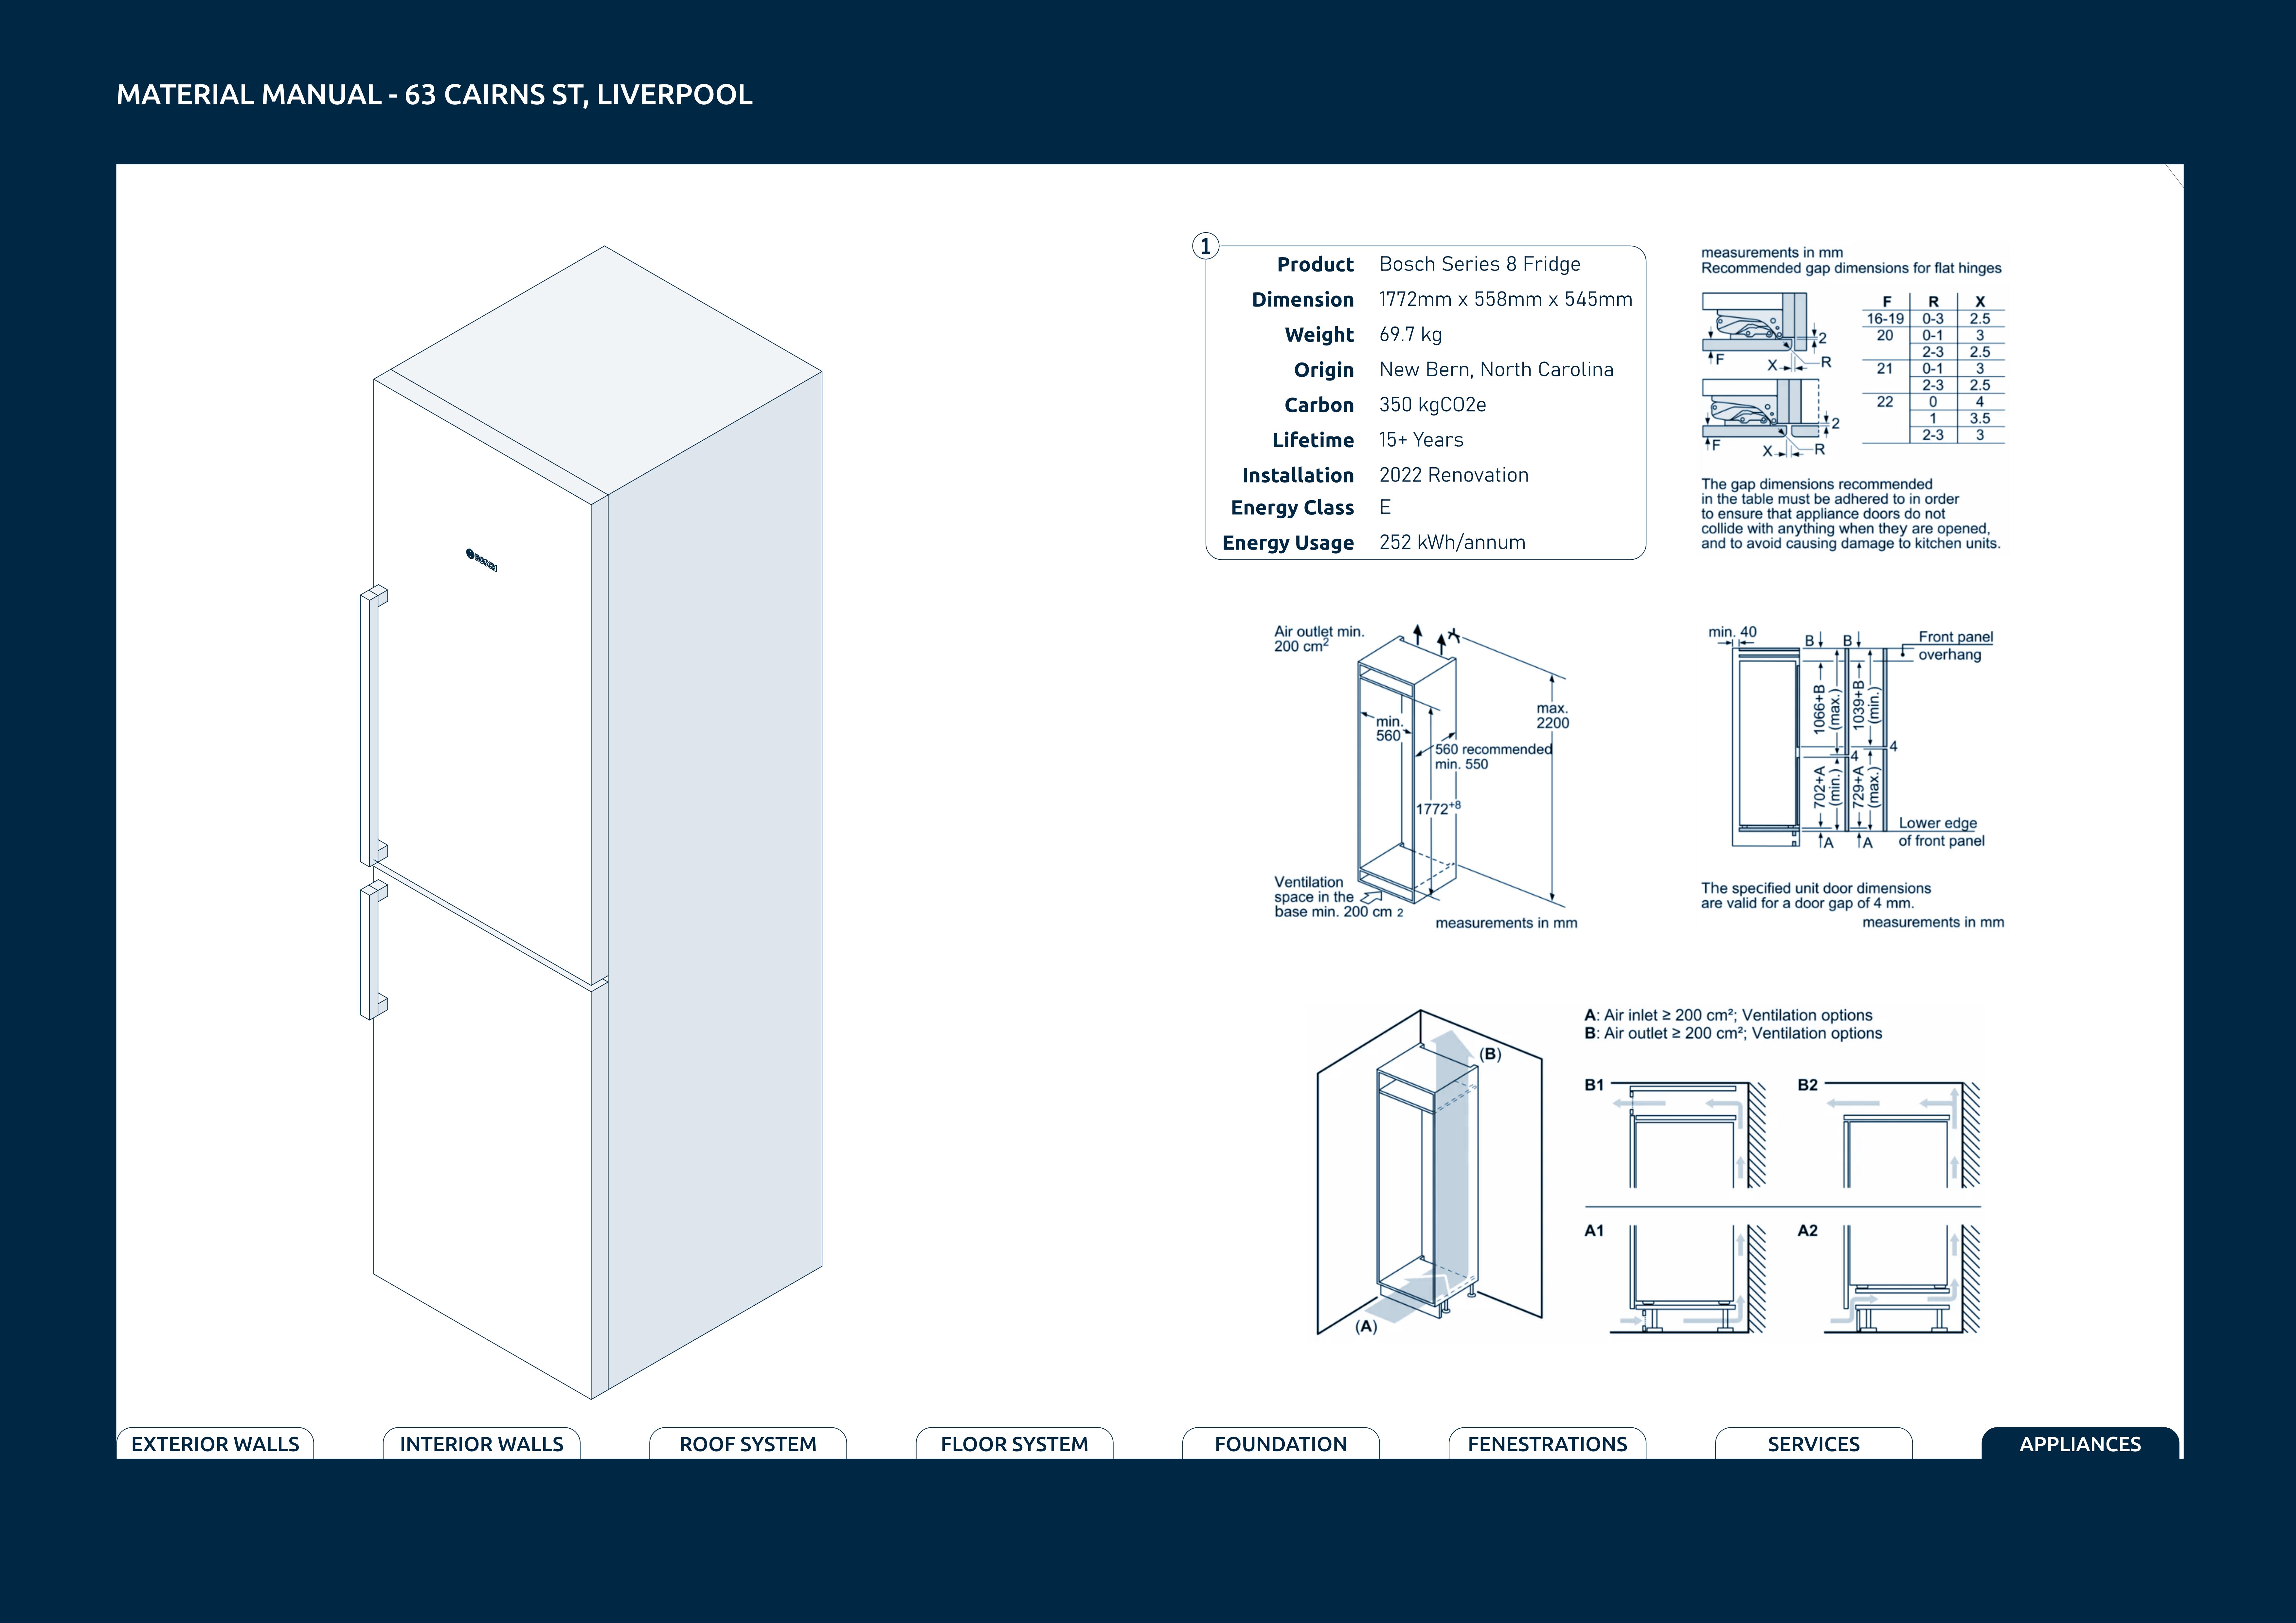
The location of services such as water supply lines would be clearly identified to enable more efficient and effective troubleshooting and repairs. Details about individual appliances including warranty information and repair instructions would be included as well.
The following collection of drawings are examples of how these types of material manuals could look. This framework prioritizes the legibility of information and promotes construction literacy.
MATERIAL MANUAL
The Material Manual 95 94
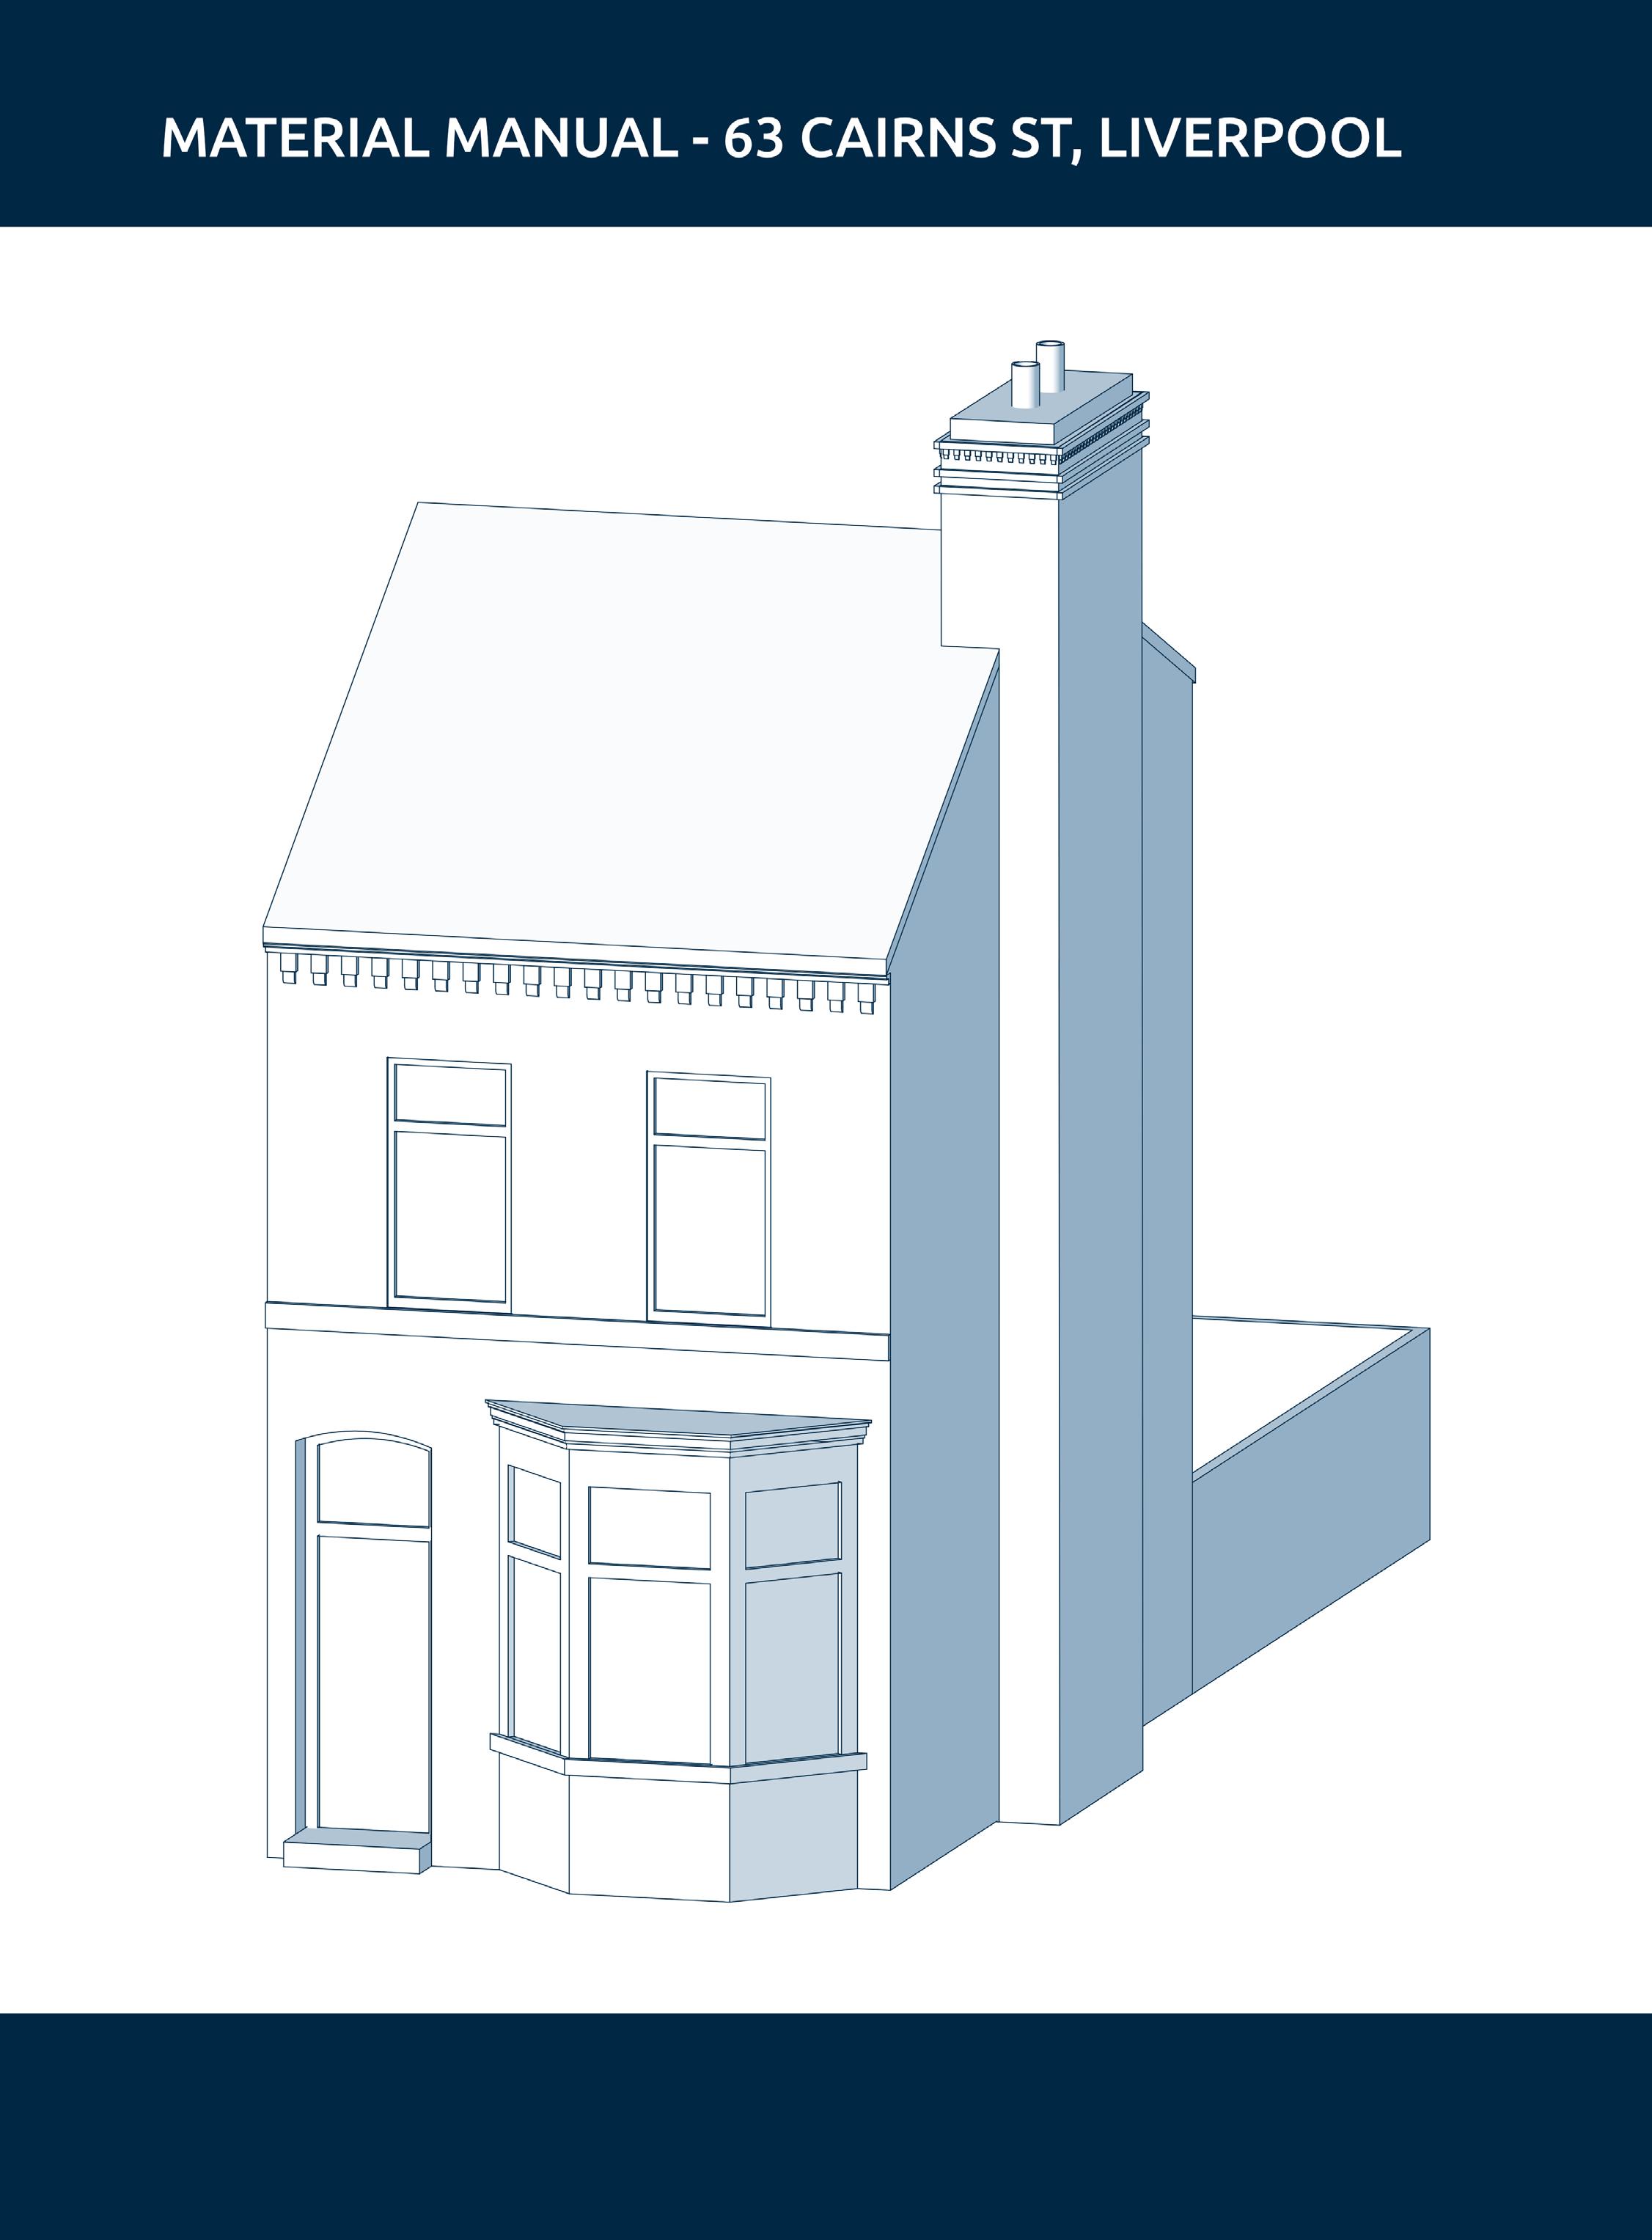
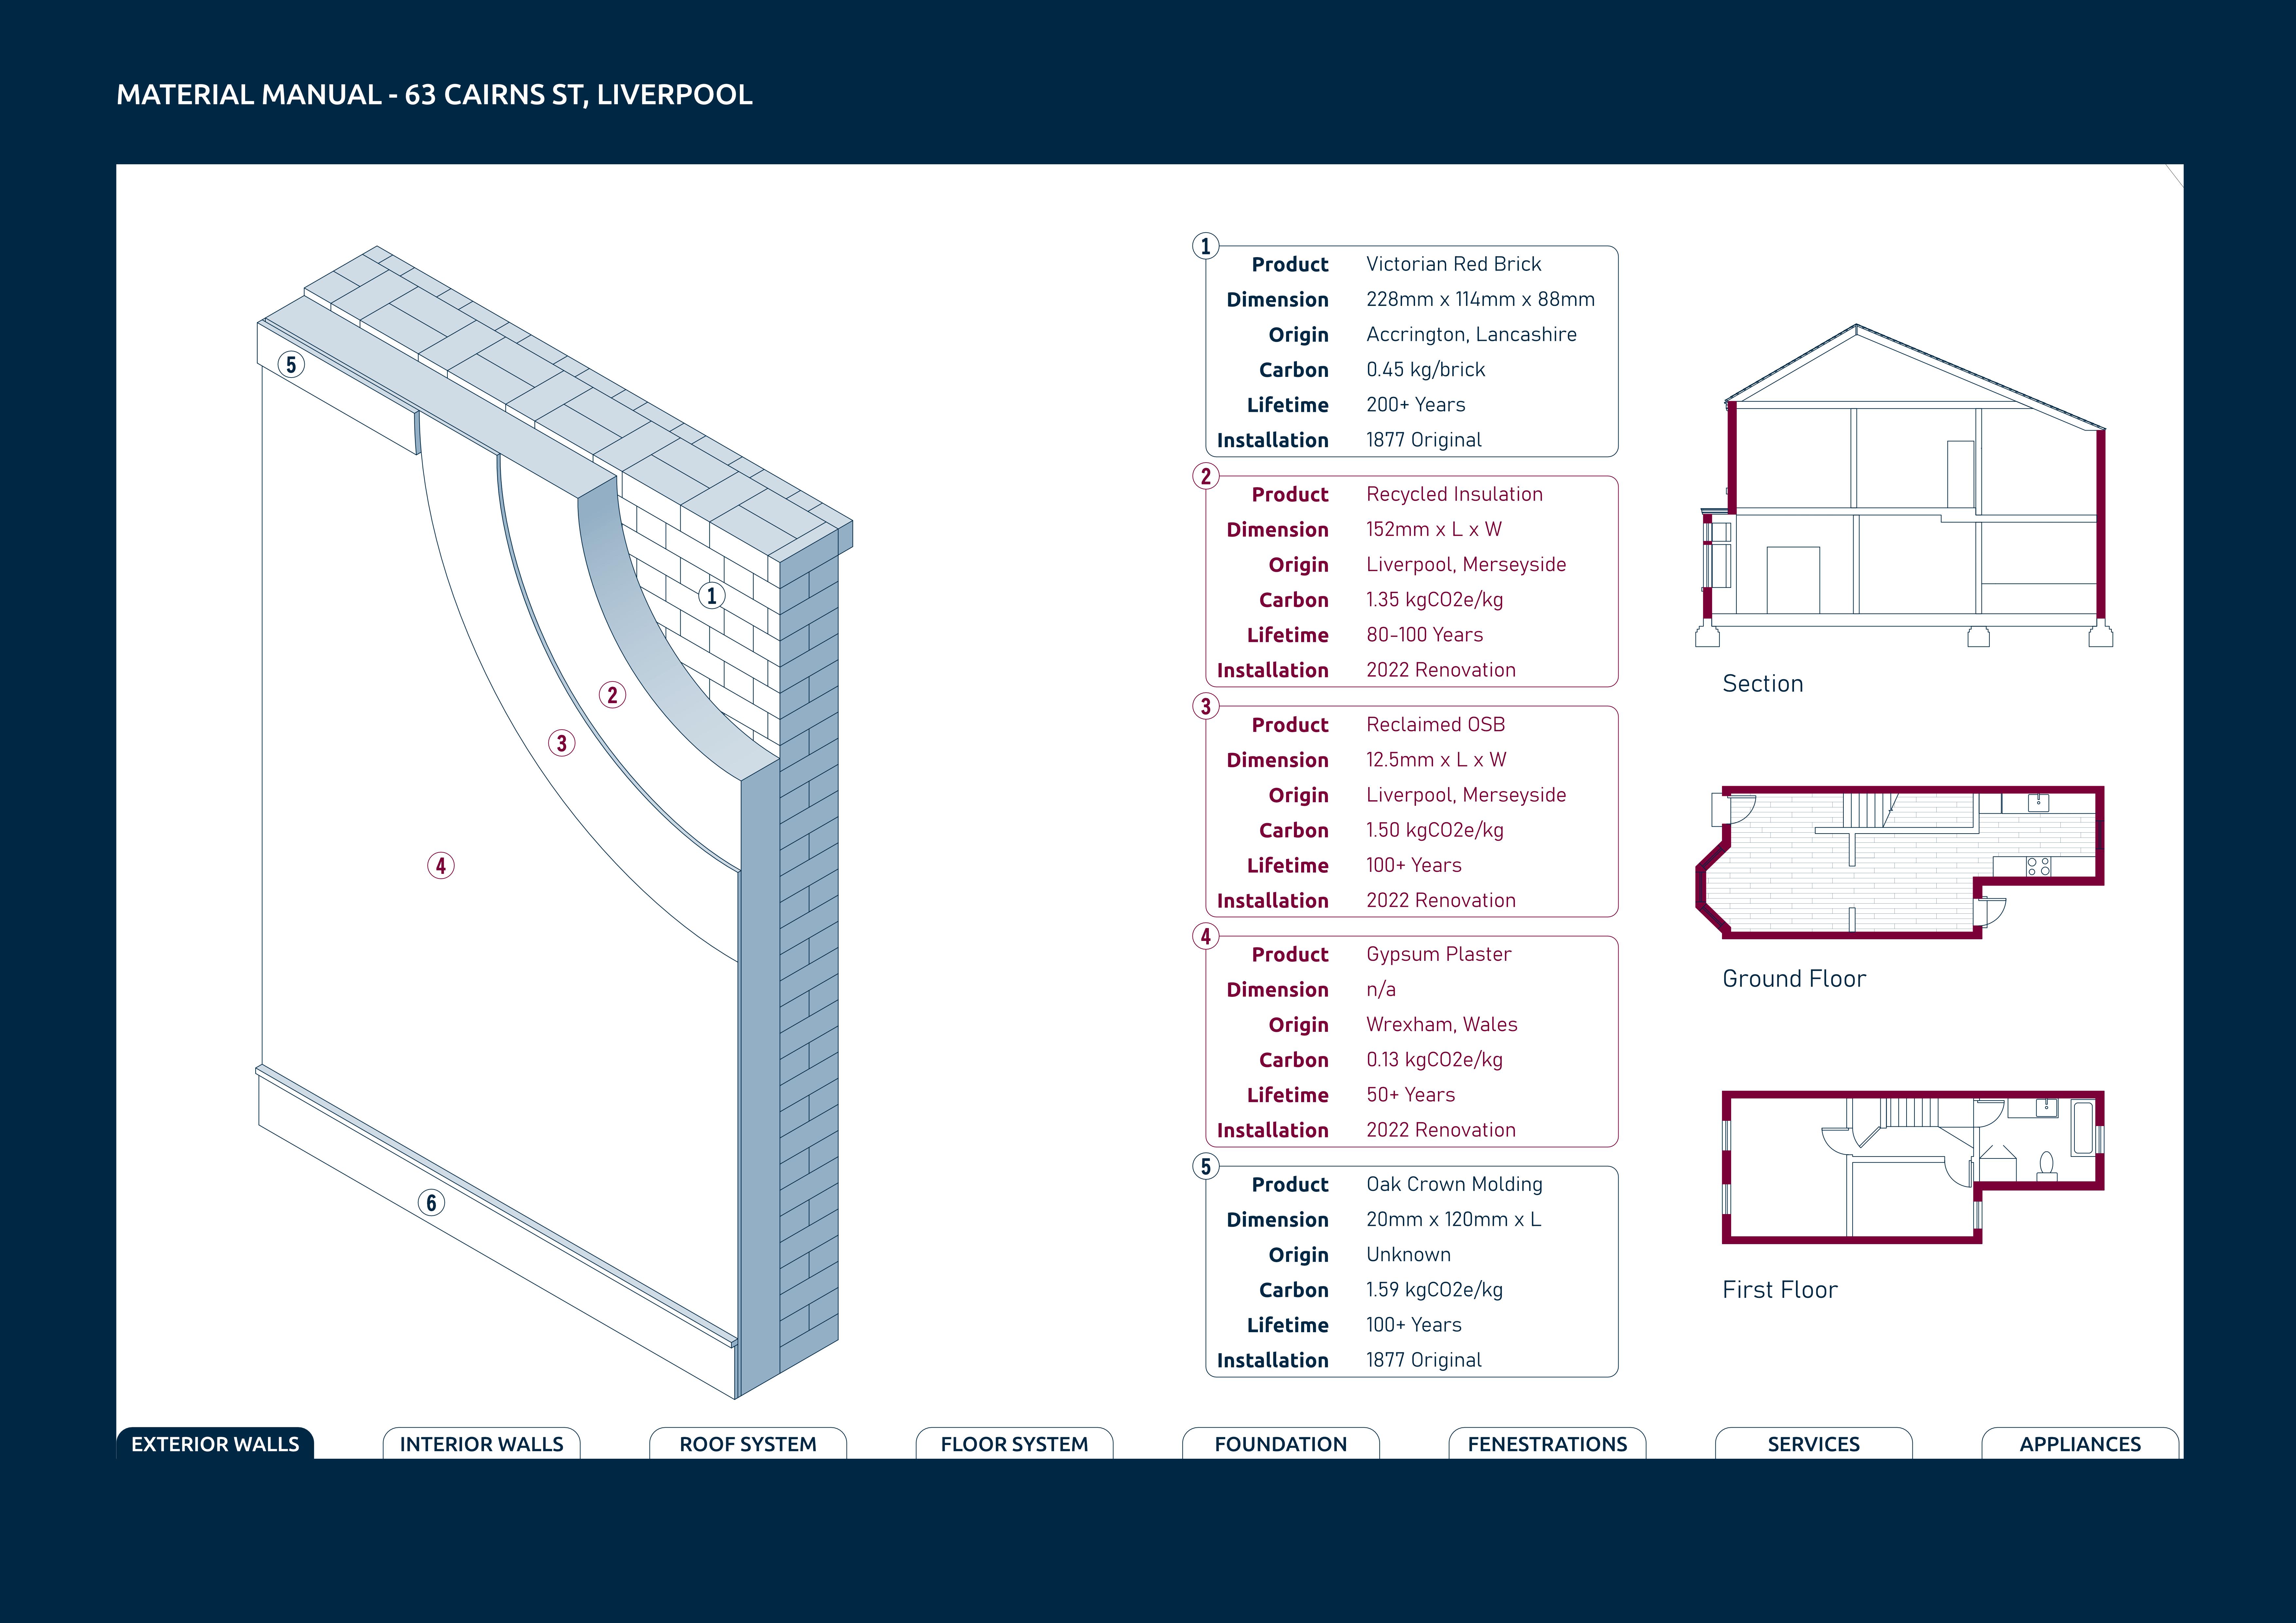
Map 37. MaTEr aL MaNuaL byBradleyNissen
97 96
MATERIALMANUAL-63CAIRNSST,LIVERPOOL
Product OakStuds
Dimension 38mmx89mmxL
Origin Unknown
Carbon 1.59kgCO2e/kg
Lifetime 100+Years
Installation 1877Original
Product PinePlywood
Dimension 12.5mmxLxW
Origin Unknown
Carbon 1.61kgCO2e/kg
Lifetime 100+Years
Installation 1877Original
Product GypsumPlaster
Dimension n/a
Origin Unknown
Carbon 0.13kgCO2e/kg
Lifetime 50+Years
Installation 1965Renovation
Product OakCrownMolding
Dimension 20mmx120mmxL
Origin Unknown
Carbon 1.59kgCO2e/kg
Lifetime 100+Years
Installation 1877Original
Product OakBaseboard
Dimension 20mmx120mmxL
Origin Unknown
Carbon 0.306kgCO2e/kg
Lifetime 100+Years
Installation 1877Original
Section
INTERIORWALLS ROOFSYSTEM FLOORSYSTEM FOUNDATION FENESTRATIONS SERVICES APPLIANCES EXTERIORWALLS
GroundFloor FirstFloor
99 98
MATERIALMANUAL-63CAIRNSST,LIVERPOOL
Product OakStuds
Dimension Origin Carbon
Lifetime
Installation
38mmx235mmxL Unknown 1.59kgCO2e/kg
100+Years
1877Original
Product GlassWoolInsulation
Dimension 210mmx235mmxW
Origin Unknown
Carbon 1.35kgCO2e/kg
Lifetime 80-100Years
Installation 2002Renovation
Product PineEavesBatten
Dimension 50mmx50mmxL
Origin Unknown
Carbon 1.55kgCO2e/kg
Lifetime 60+Years
Installation 1965Renovation
Product SlateRoofTile
Dimension 6.5mmx254mmx520mm
Origin Delabole,Cornwall
Carbon 0.063kgCO2e/kg
Lifetime 100+Years
Installation 1877Original
Product Polyethylene
Dimension n/a
Origin Unknown
Carbon 2.54kgCO2e/kg
Lifetime 20+Years
Installation 2002Renovation
Section
GroundFloor
FirstFloor
INTERIORWALLS ROOFSYSTEM FLOORSYSTEM FOUNDATION FENESTRATIONS SERVICES APPLIANCES EXTERIORWALLS
101 100
MATERIALMANUAL-63CAIRNSST,LIVERPOOL
Product OakStuds
Dimension 38mmx140mmxL
Origin Unknown
Carbon 1.59kgCO2e/kg
Lifetime 100+Years
Installation 1877Original
Product PinePlywood
Dimension 12.5mmxLxW
Origin Unknown
Carbon 1.61kgCO2e/kg
Lifetime 100+Years
Installation 1877Original
Product PolypropyleneCarpet
Dimension n/a
Origin Unknown
Carbon 4.98kgCO2e/kg
Lifetime 5-15years
Installation 2005Renovation
Product Plasterboard
Dimension 12.5mmxLxW
Origin Unknown
Carbon 0.39kgCO2e/kg
Lifetime 70+Years
Installation 1965Renovation
Section
INTERIORWALLS ROOFSYSTEM FLOORSYSTEM FOUNDATION FENESTRATIONS SERVICES APPLIANCES EXTERIORWALLS
GroundFloor FirstFloor
103 102
MATERIALMANUAL-63CAIRNSST,LIVERPOOL
Product ConcreteFoundation
Dimension 620mmx450mmxL
Origin Unknown
Carbon 0.103kgCO2e/kg
Lifetime 200+Years
Installation 1877Original
Product VictorianRedBrick
Dimension 228mmx114mmx88mm
Origin Accrington,Lancashire
Carbon 0.45kg/brick
Lifetime 200+Years
Installation 1877Original
Product OakStuds
Dimension 38mmx235mmxL
Origin Unknown
Carbon 1.59kgCO2e/kg
Lifetime 100+Years
Installation 1877Original
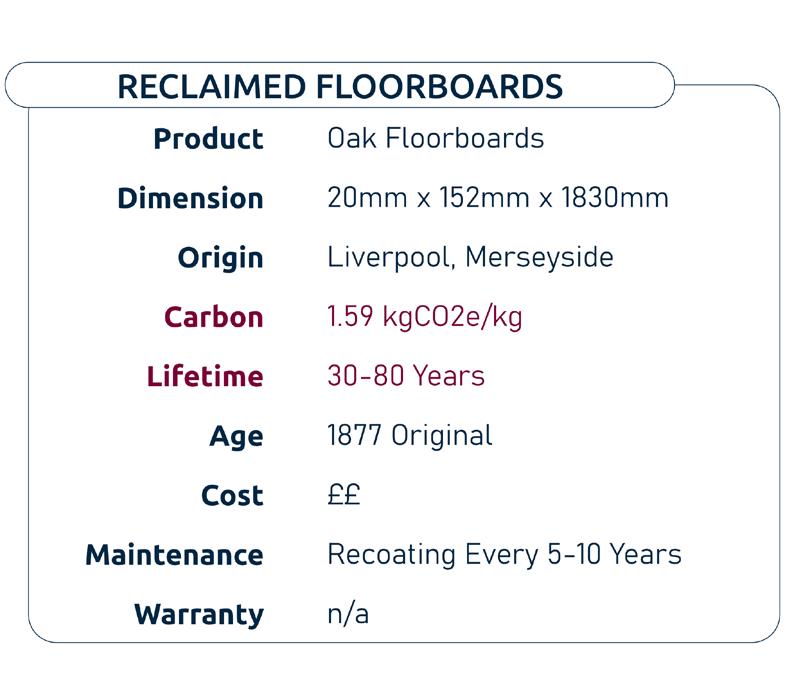
Product OakFloorboards
Dimension 20mmx152mmx1830mm
Origin Unknown
Carbon 1.59kgCO2e/kg
Lifetime 100+Years
Installation 1877Original
INTERIORWALLS ROOFSYSTEM FLOORSYSTEM FOUNDATION FENESTRATIONS SERVICES APPLIANCES EXTERIORWALLS
Section GroundFloor FirstFloor
105 104
107 106
109 108
111 110
CONSTRUCTION LIBRARY
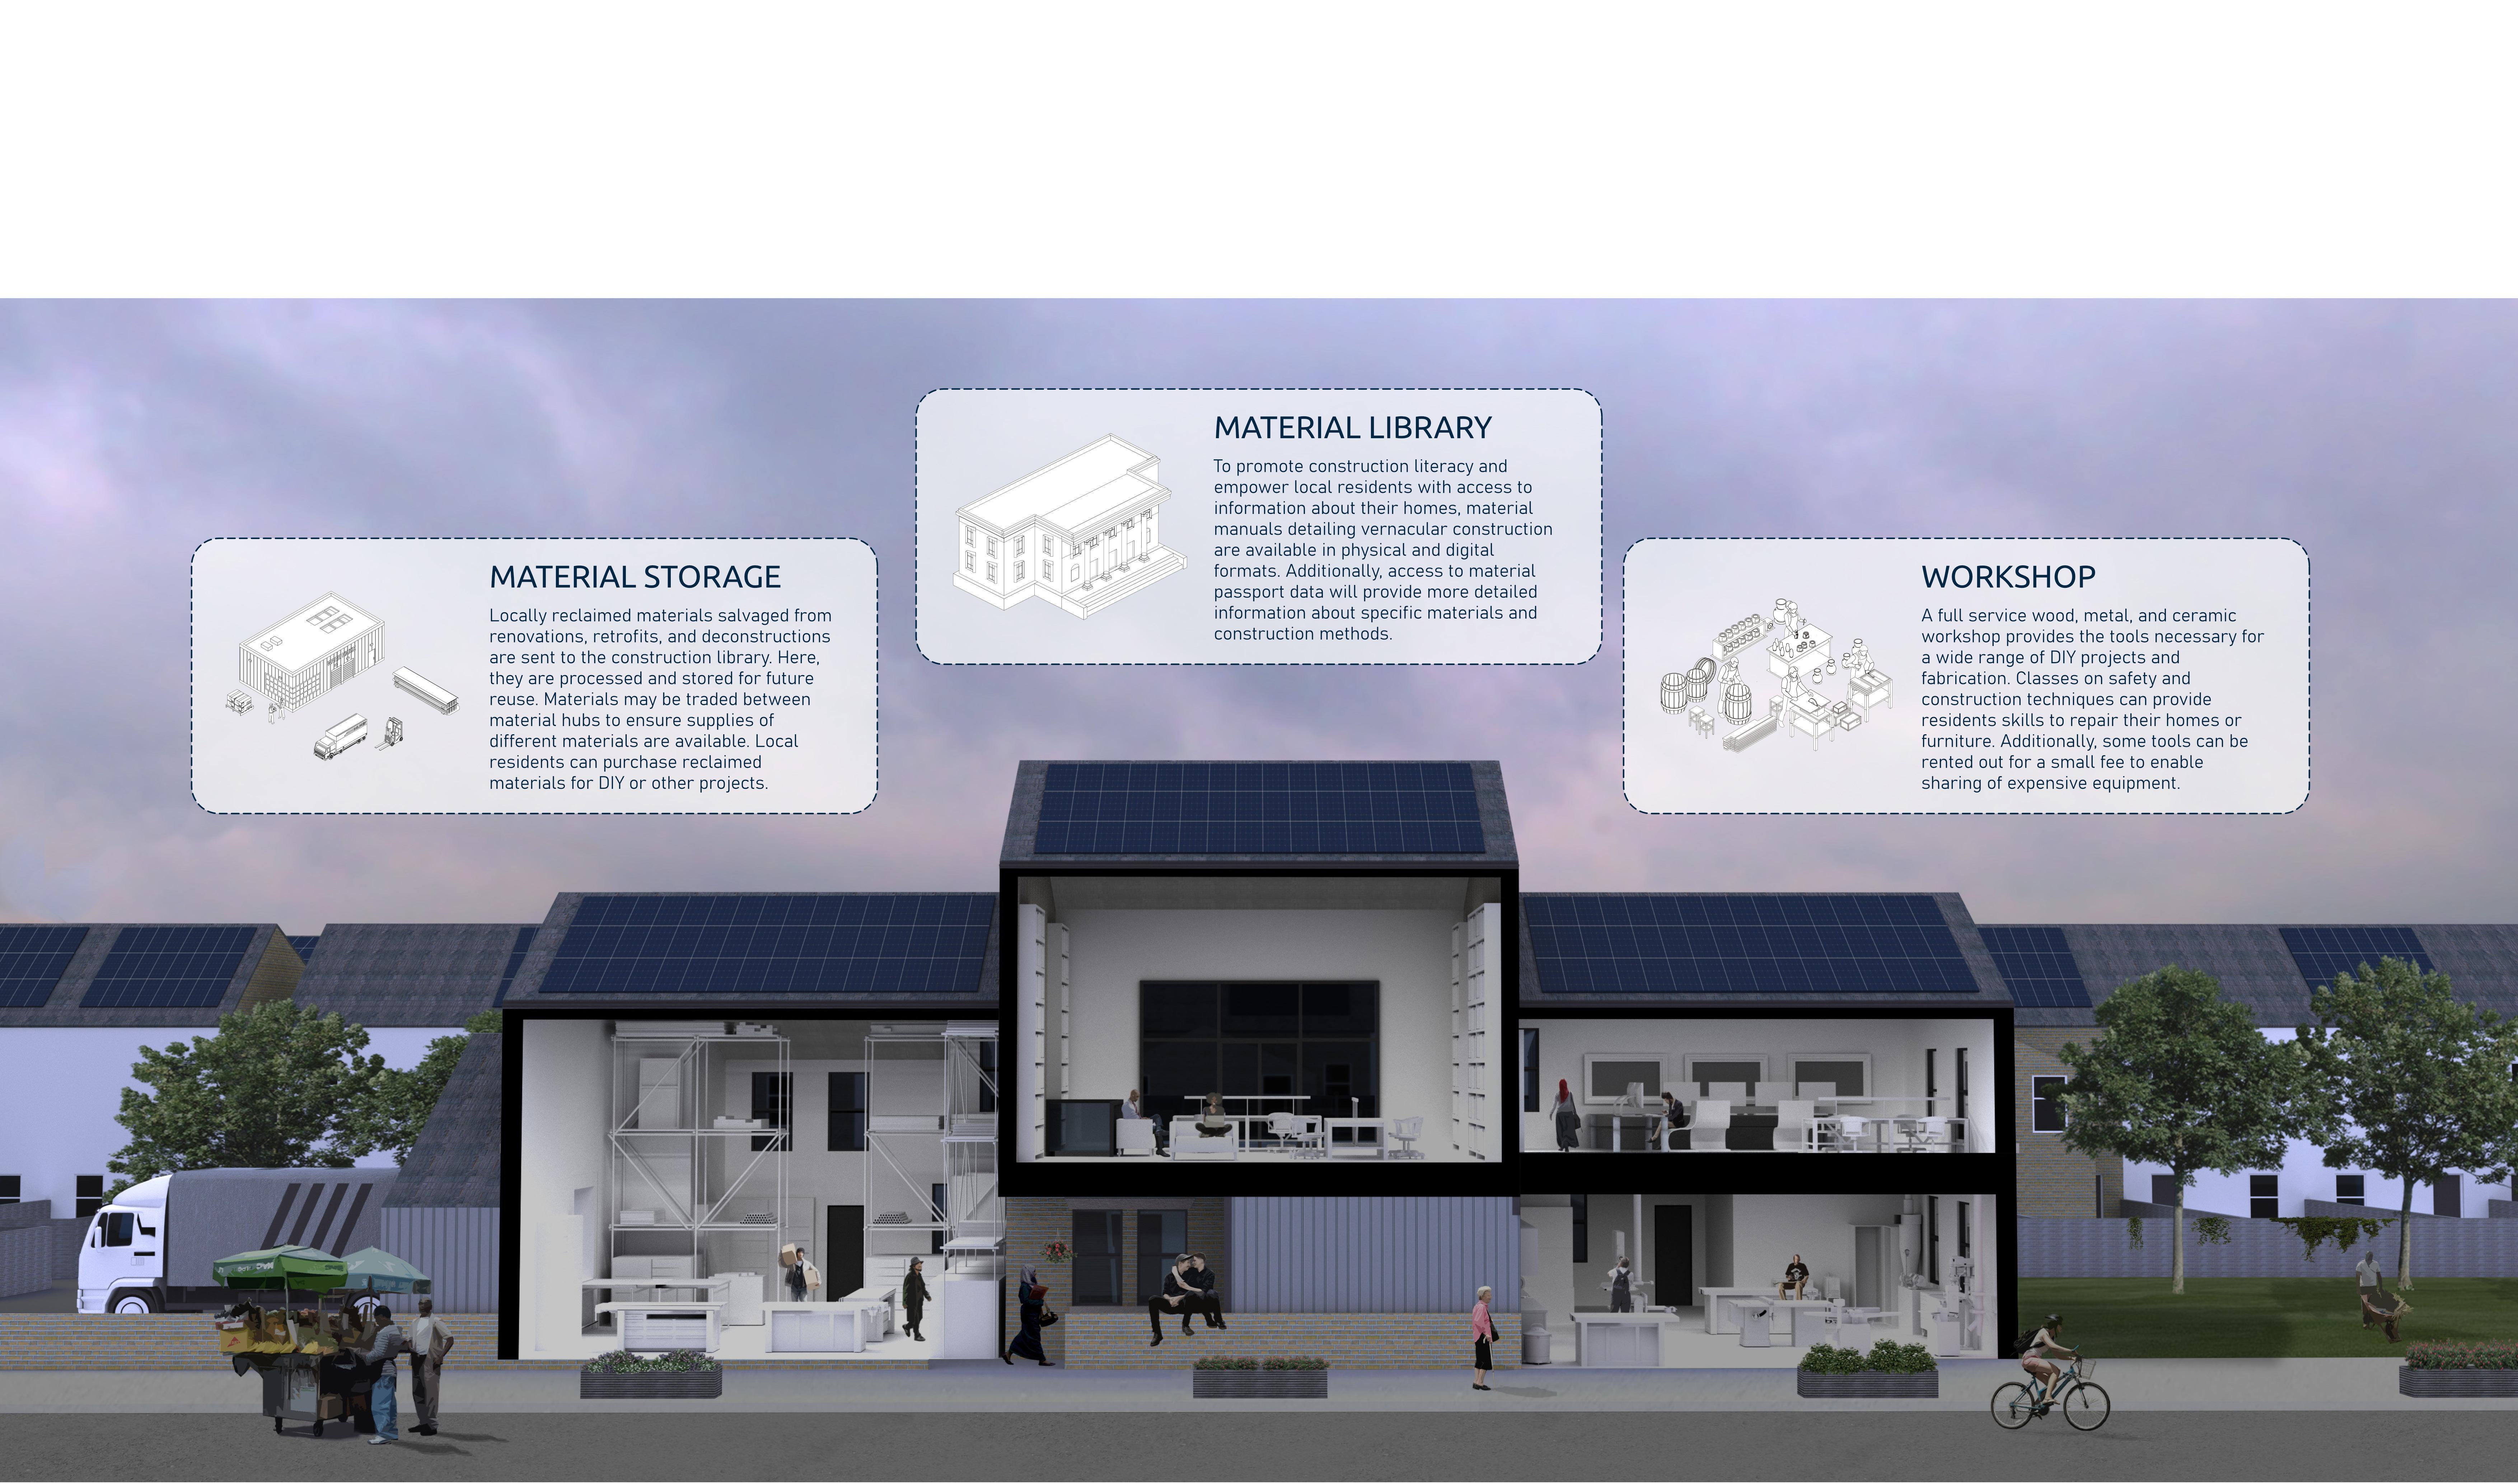
Material Manuals would promote construction literacy and empower local residents by giving them access to detailed but accessible information about their homes. This information would be available publicly within the Construction Library along with access to more detailed material passport databases.
A supply of reclaimed materials, workshop, and publicly available material data in the Construction Library would provide the skills, knowledge, tools, and materials necessary for a circular construction economy.
 Map 38. CONSTruCTION LIBrarY
byBradleyNissen
Map 38. CONSTruCTION LIBrarY
byBradleyNissen
113 112
The Material Manual
MATERIAL REUSE COMPARISON
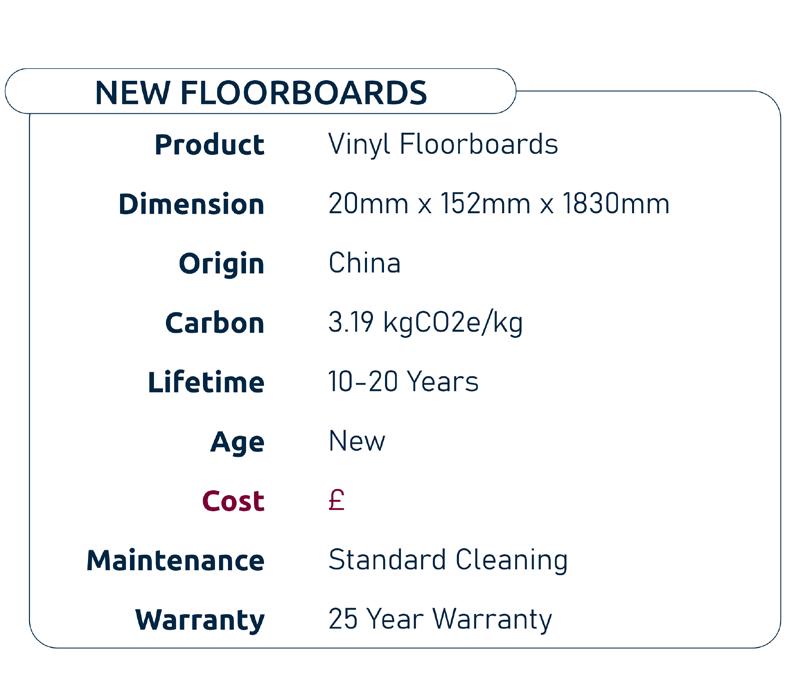
With detailed information available for reclaimed materials, architects and contractors can better compare new and reclaimed materials to make a more sustainable choice. Additionally, understanding the history of reclaimed materials can imbue them with cultural value and help people develop a more personal connection with them.
The Material Manual 115 114
Map 39. MaTEr aL rEuSE COMparISON byBradleyNissen
OUR VISION FOR THE COMMUNITY
Materials reclaimed from deconstructions and renovation projects will not only be reused in future buildings, but could also be used to transofmr the vacant Ducie Street site into a vibrant public space for the community.
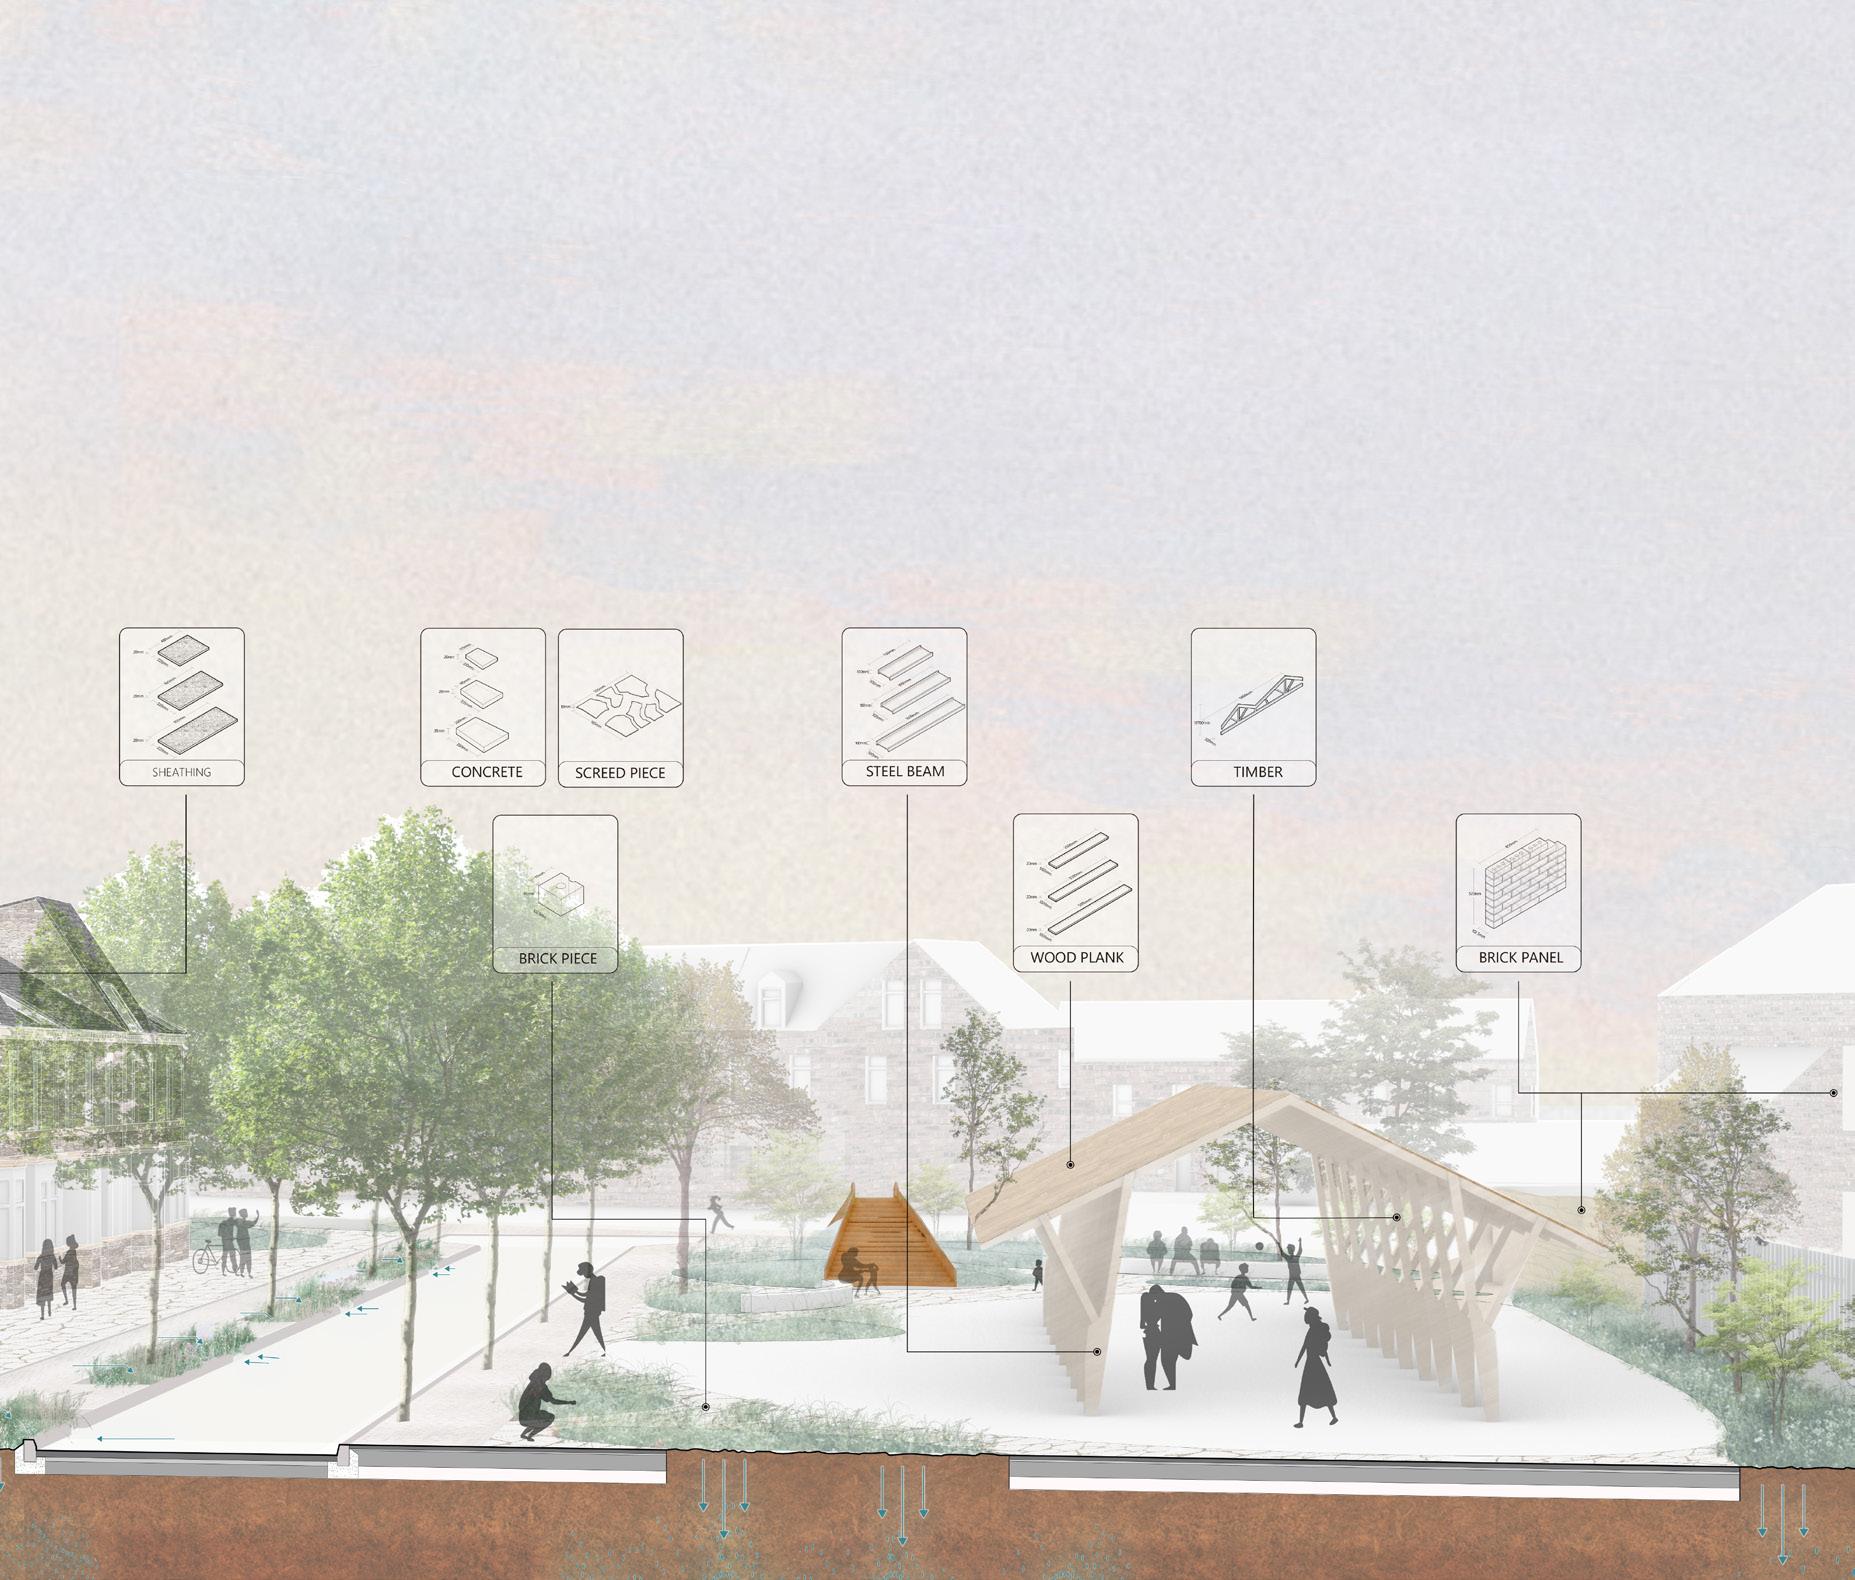
Bricks too damaged to be reused whole could be used to create permeable paving, fill gabions, or as aggregates. Timber could be reconstructed into seating and planters for both outdoor public spaces or for the interior furniture in the construction library and local houses.
Concrete, asphalt, and aggregate could be utilized as permeable pavers, gabion filler, or as a subbase for roads and drainage systems.
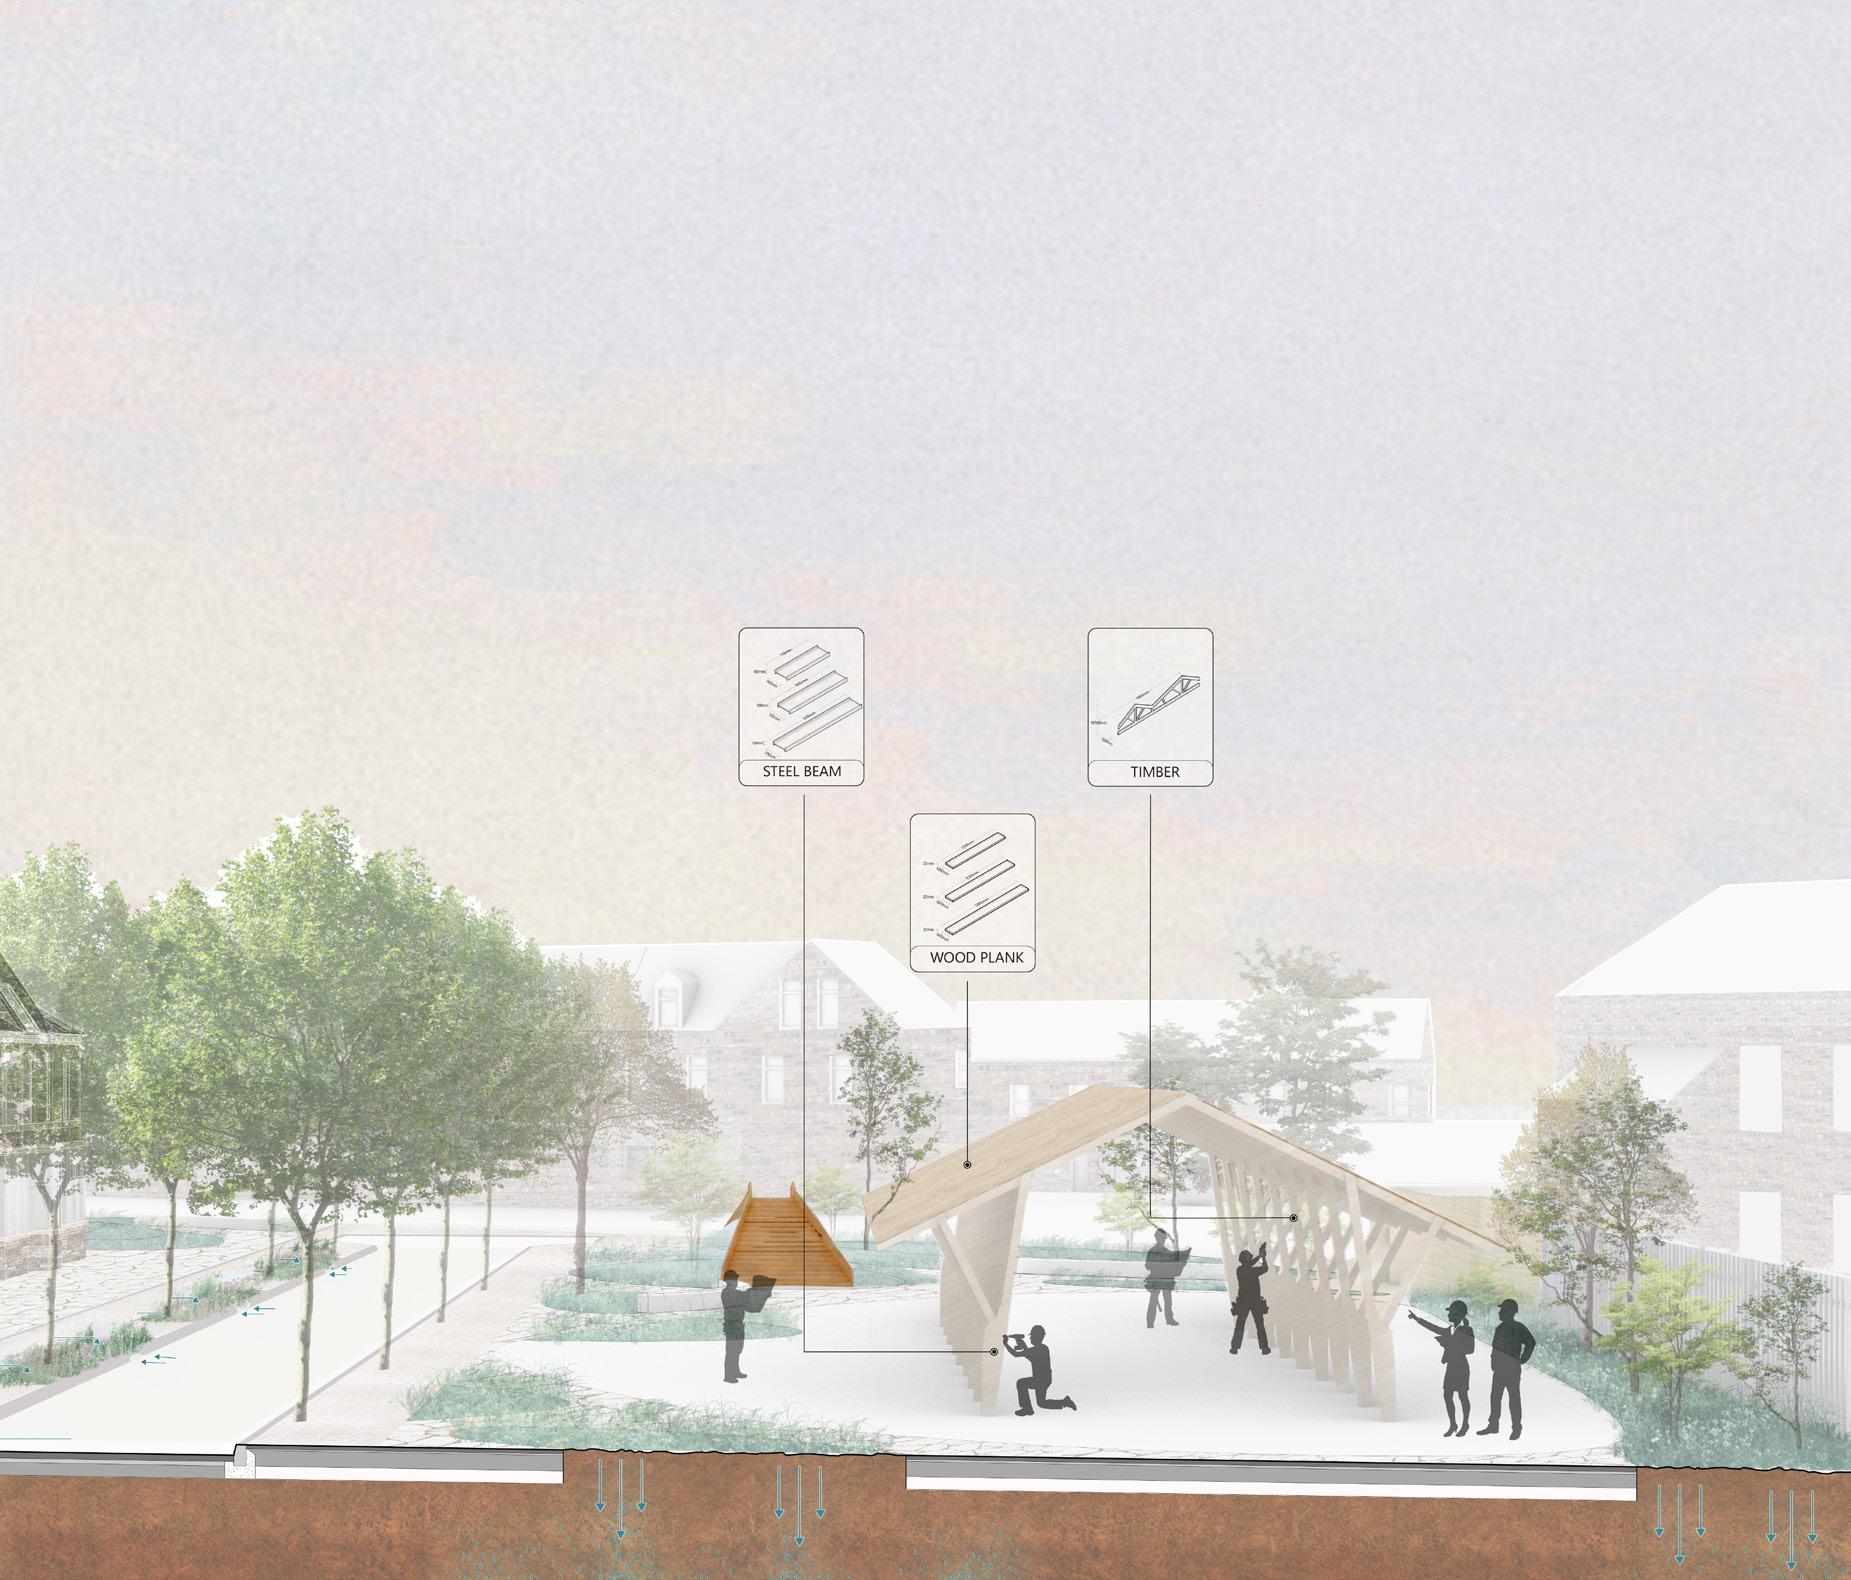
Timber beams that maintain their structural integrity can be used on the roofs of the renovated houses and could also be used to construct a pavillion or other outdoor gathering spaces.
To encourage innovative use of reclaimed materials, each year academic institutions such as the University of Liverpool will be invited to participate by building an ephemeral installation for the neighborhood of Granby
byBorjaRomeu Map 40. rEuSED MaTEr aLS
The Material Manual byBorjaRomeu Map 41. paVILION rESuE MaTEr aLS
117 116
CHAPTER 6 119 06 A LOCAL NETWORK OF REUSE 06.4 MATERIAL NETWORK 06.3 MATERIAL OPERATION SYSTEM IN LIVERPOOL 06.5 UK NETWORK VISION 06.2 NEW BUILD AND REGULATION 06.1 PUBLIC COMMON PARTNERSHIP FRAMEWORK
The Granby model is a form of Public-Common Partnerships as described by Common Wealth and the Center for Local Economic Strategies. These are models of joint ownership and governance where a council or local authority works with commons associations such as community land trusts enabling more radical solutions to local problems. In Granby, the derelict homes slated for demolition were instead handed over to the Granby CLT, allowing for them to be sustainably retrofitted
and affordably rented, bypassing property speculation and wasteful development. Building on the Public Common Partnership model, the collection and distribution of material data would be a collaborative effort between the local authority, deconstruction companies, and local universities studying material science and engineering. Material producers would be required to include their products in publicly available material passports, and data from audits of deconstructions and retrofit
projects would also be included. This information would then be used by architects and construction companies to create material manuals for each building they work on. Public Common Partnerships could also play a role in establishing local building regulations. Community Organizations, Architects, and Construction Companies could work together to provide guidelines that would best enable material reuse and innovation within construction while prioritizing the living standards of the community.
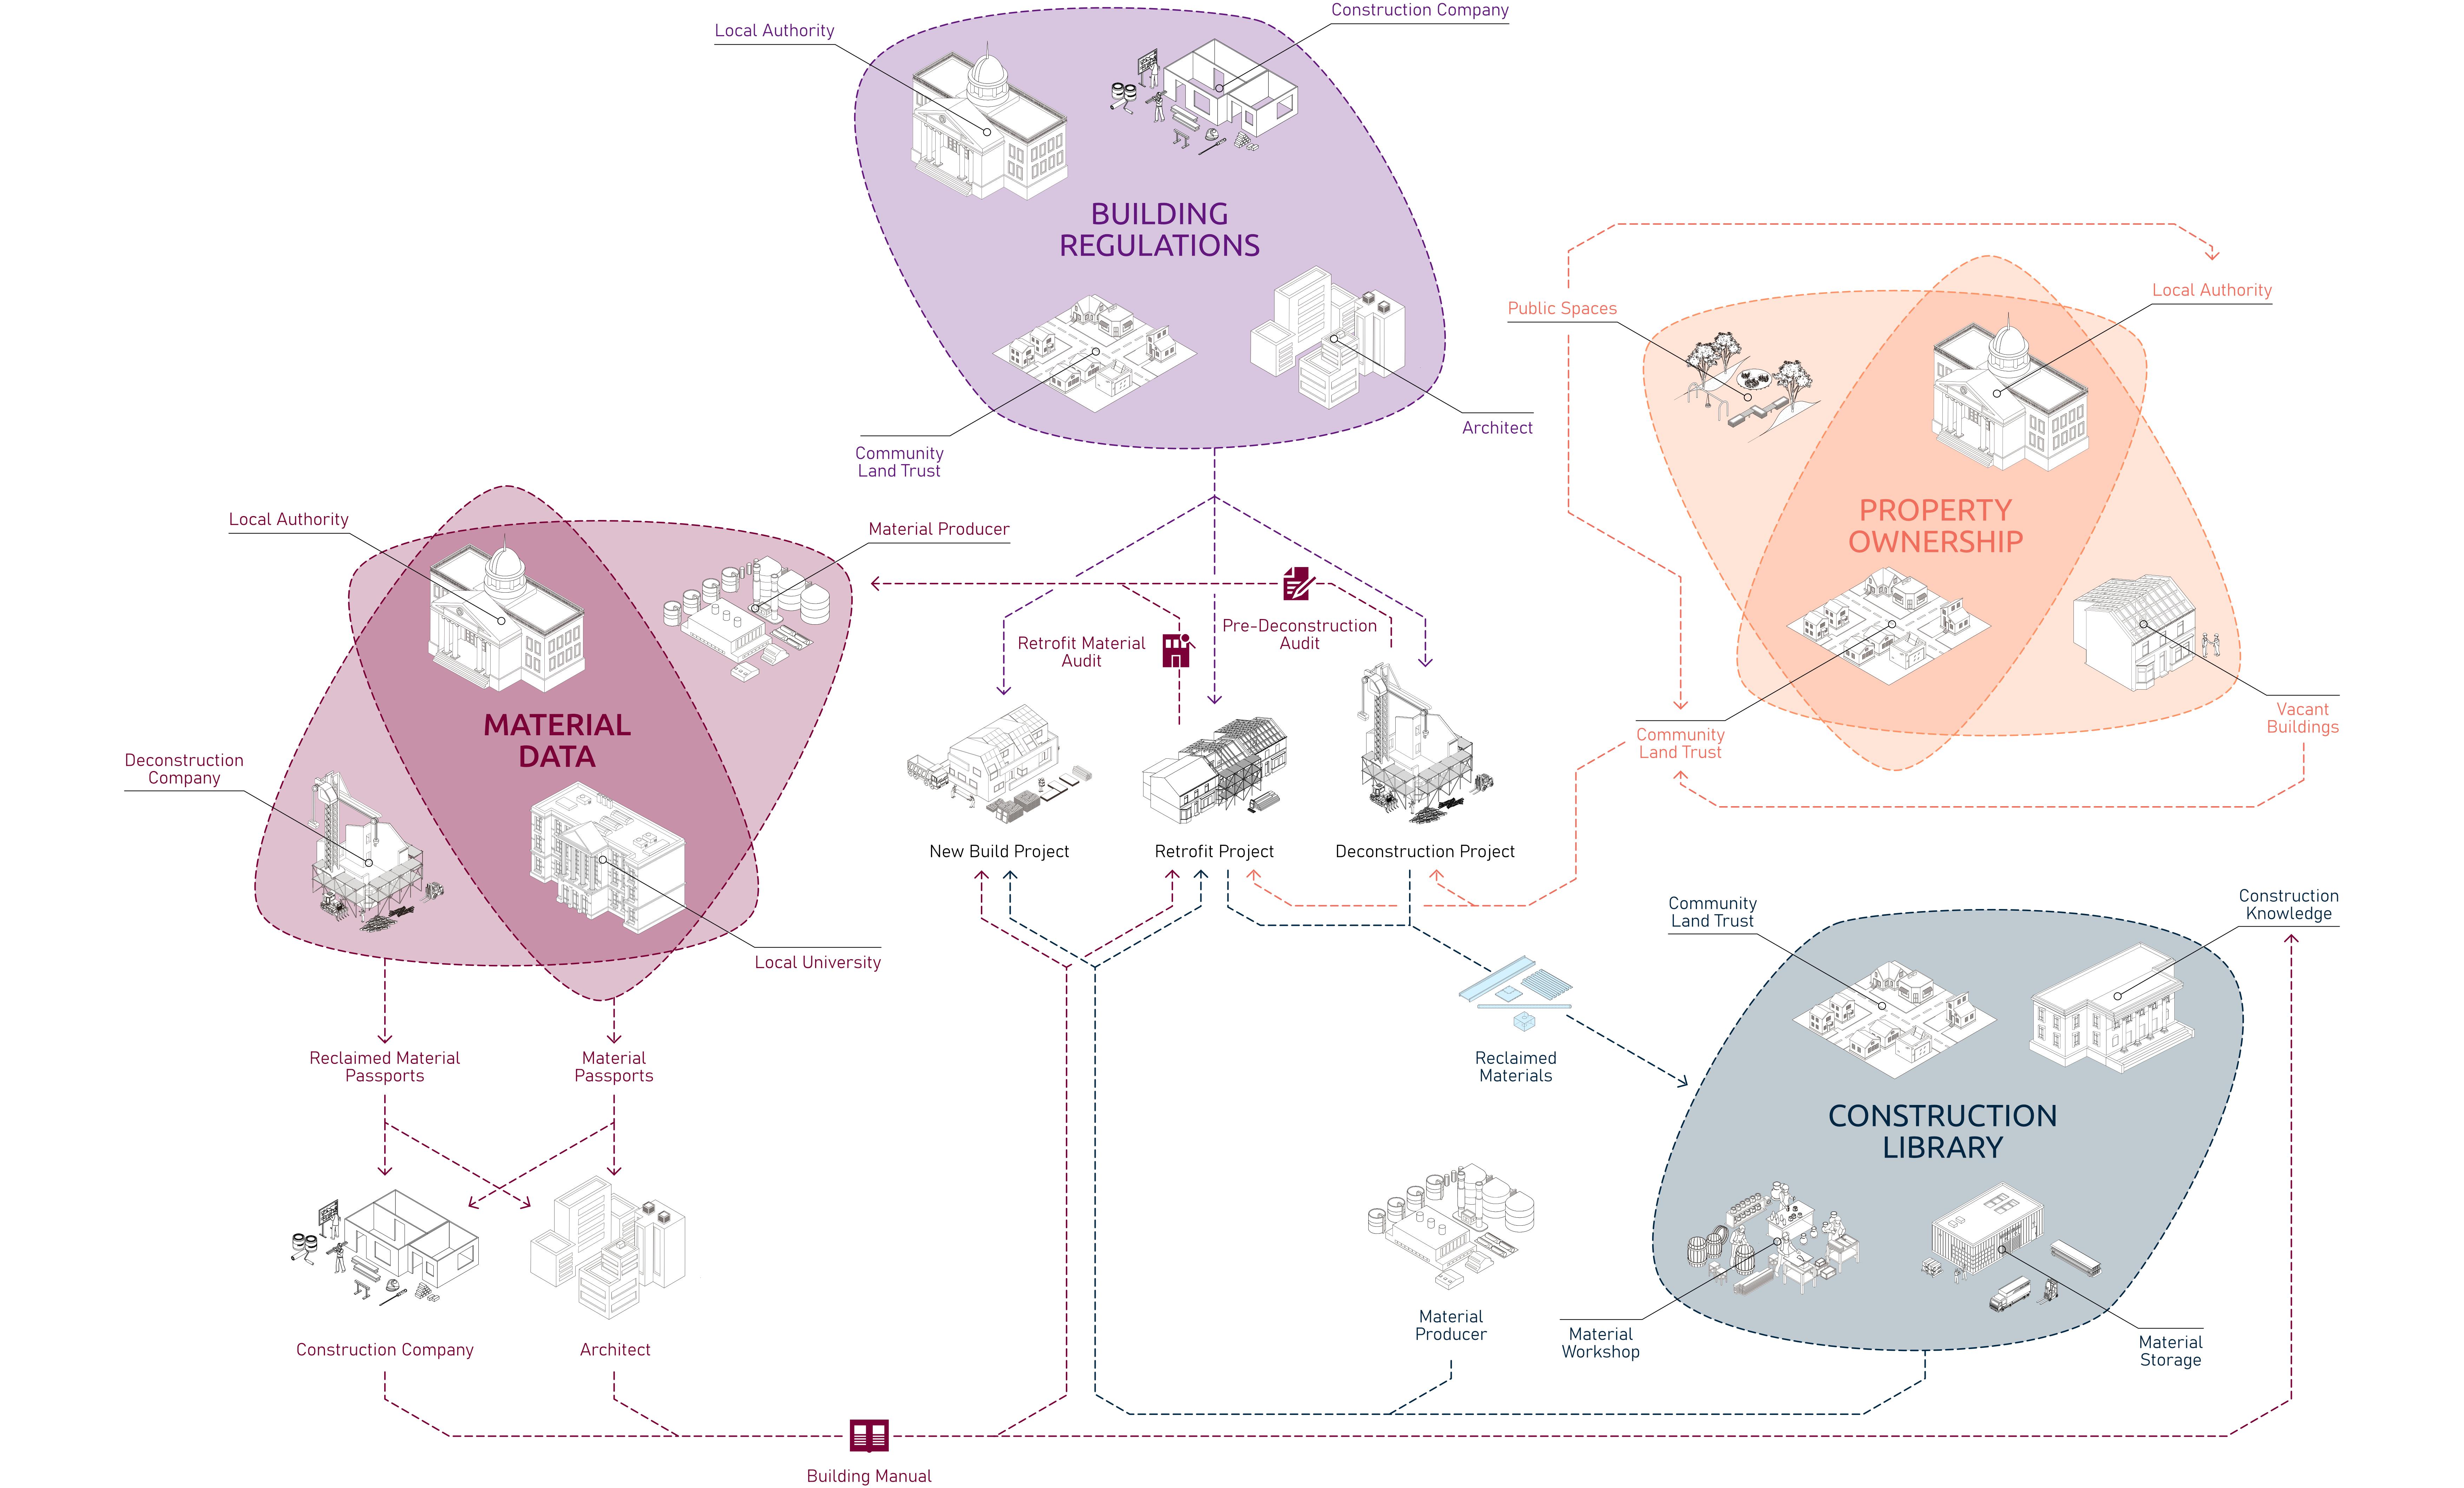
PUBLIC COMMON PARTNERSHIP
FRAMEWORK
A Local Network of Reuse
by BradleyNissen
Map 42. puBLIC COMMON parTNErSHIp FraMEWOrK
121 120
When a new building is required, construction with reclaimed materials will be prioritized. A robust local material resell network and community ownership of assets will facilitate this transition towards a more circular construction economy. All new build projects will catalogue material data in the form of material passports and manuals.
New construction projects would become acts of local participation as residents and CLT members would have a voice in how their community changes.
Regulations on local constructions will be developed with the PCP model. This will enable community organizations, experts in the field, and the local authority to work together to develop rules and requirements that are in the best interest of the community and encourage more sustainable and equitable construction methods and materials.
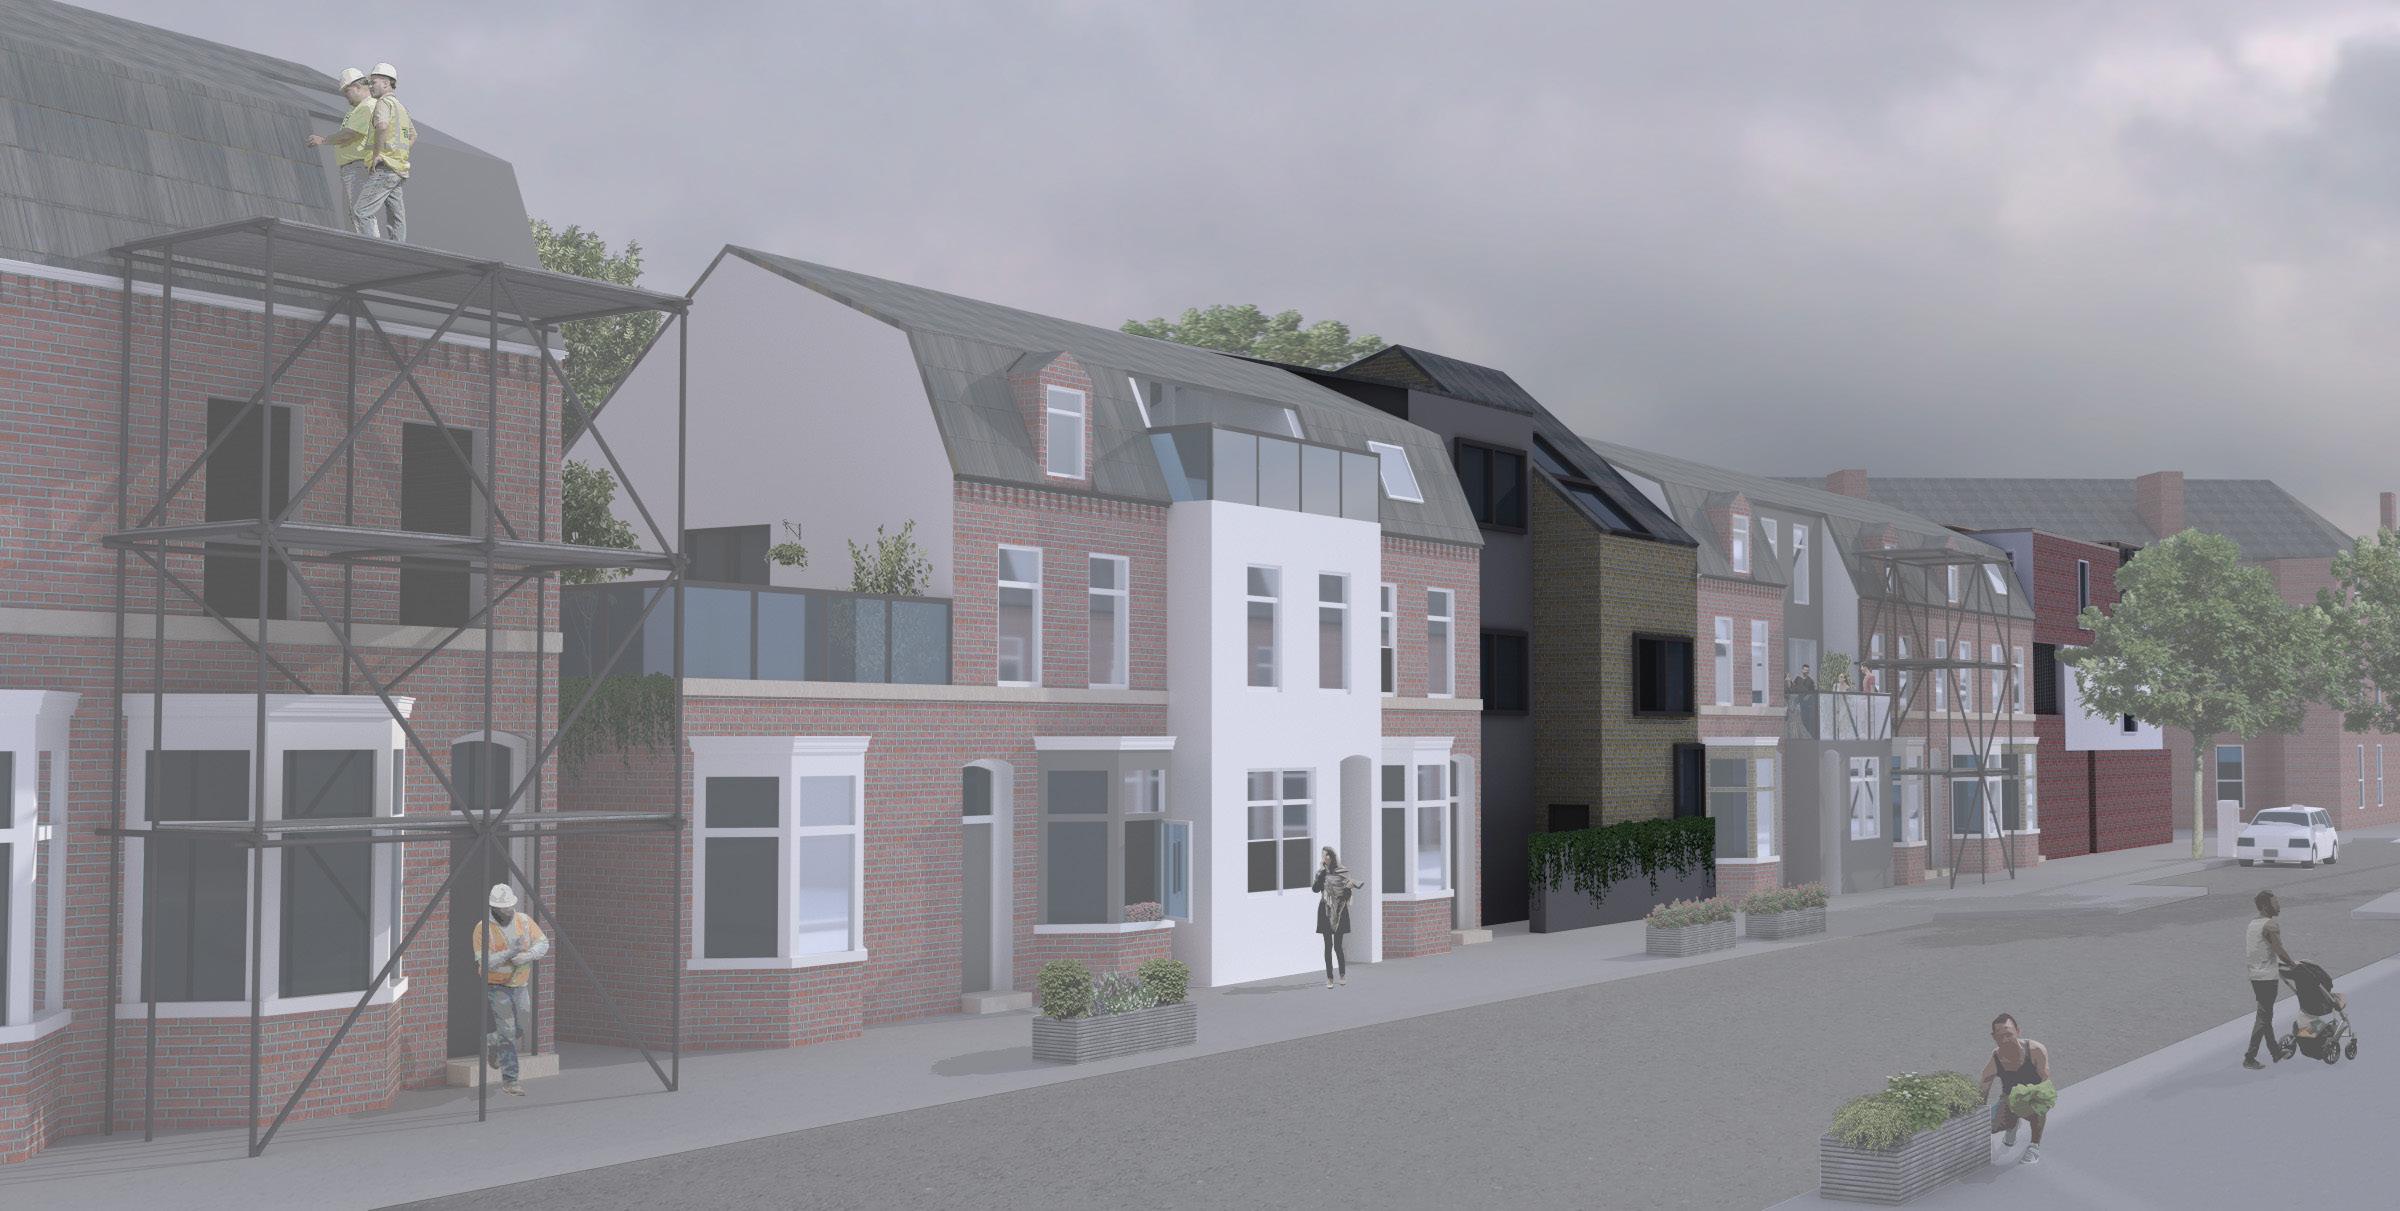
NEW BUILD AND REGULATIONS A Local Network of Reuse Map 43. GraNBY rENDErING rETrOFIT auDITS byBradleyNissen 123 122
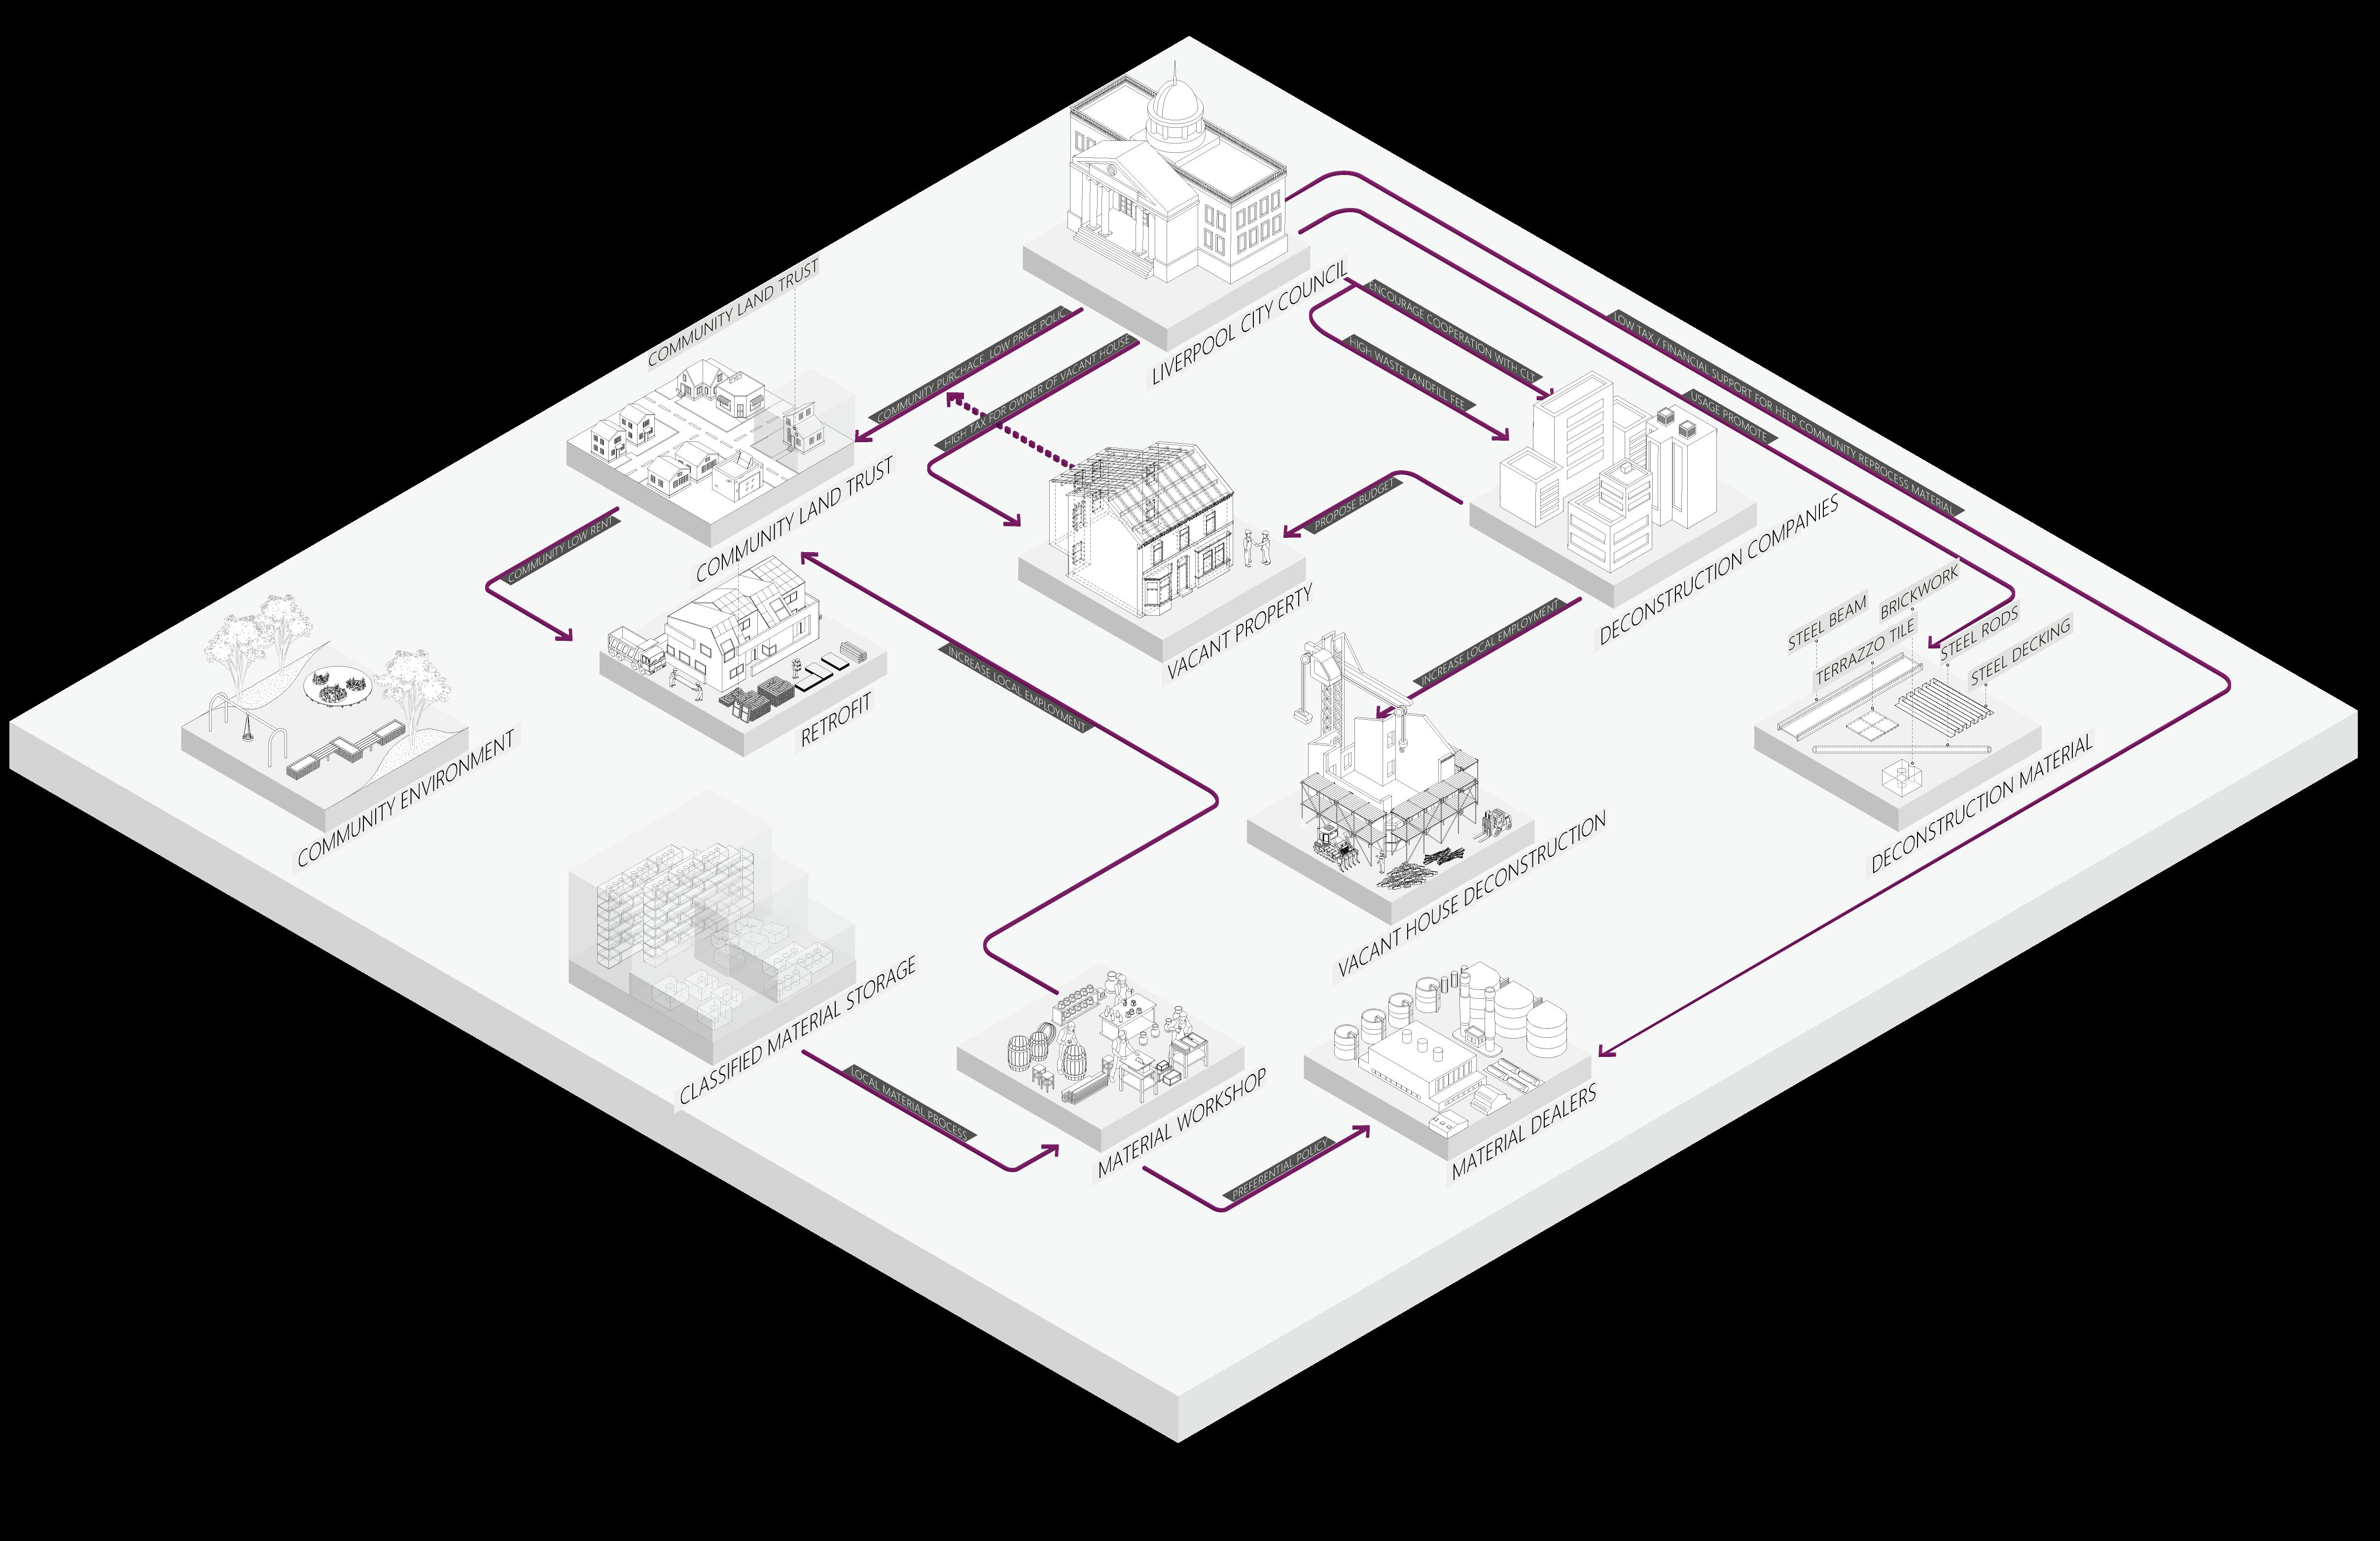
MATERIAL OPERATION SYSTEM
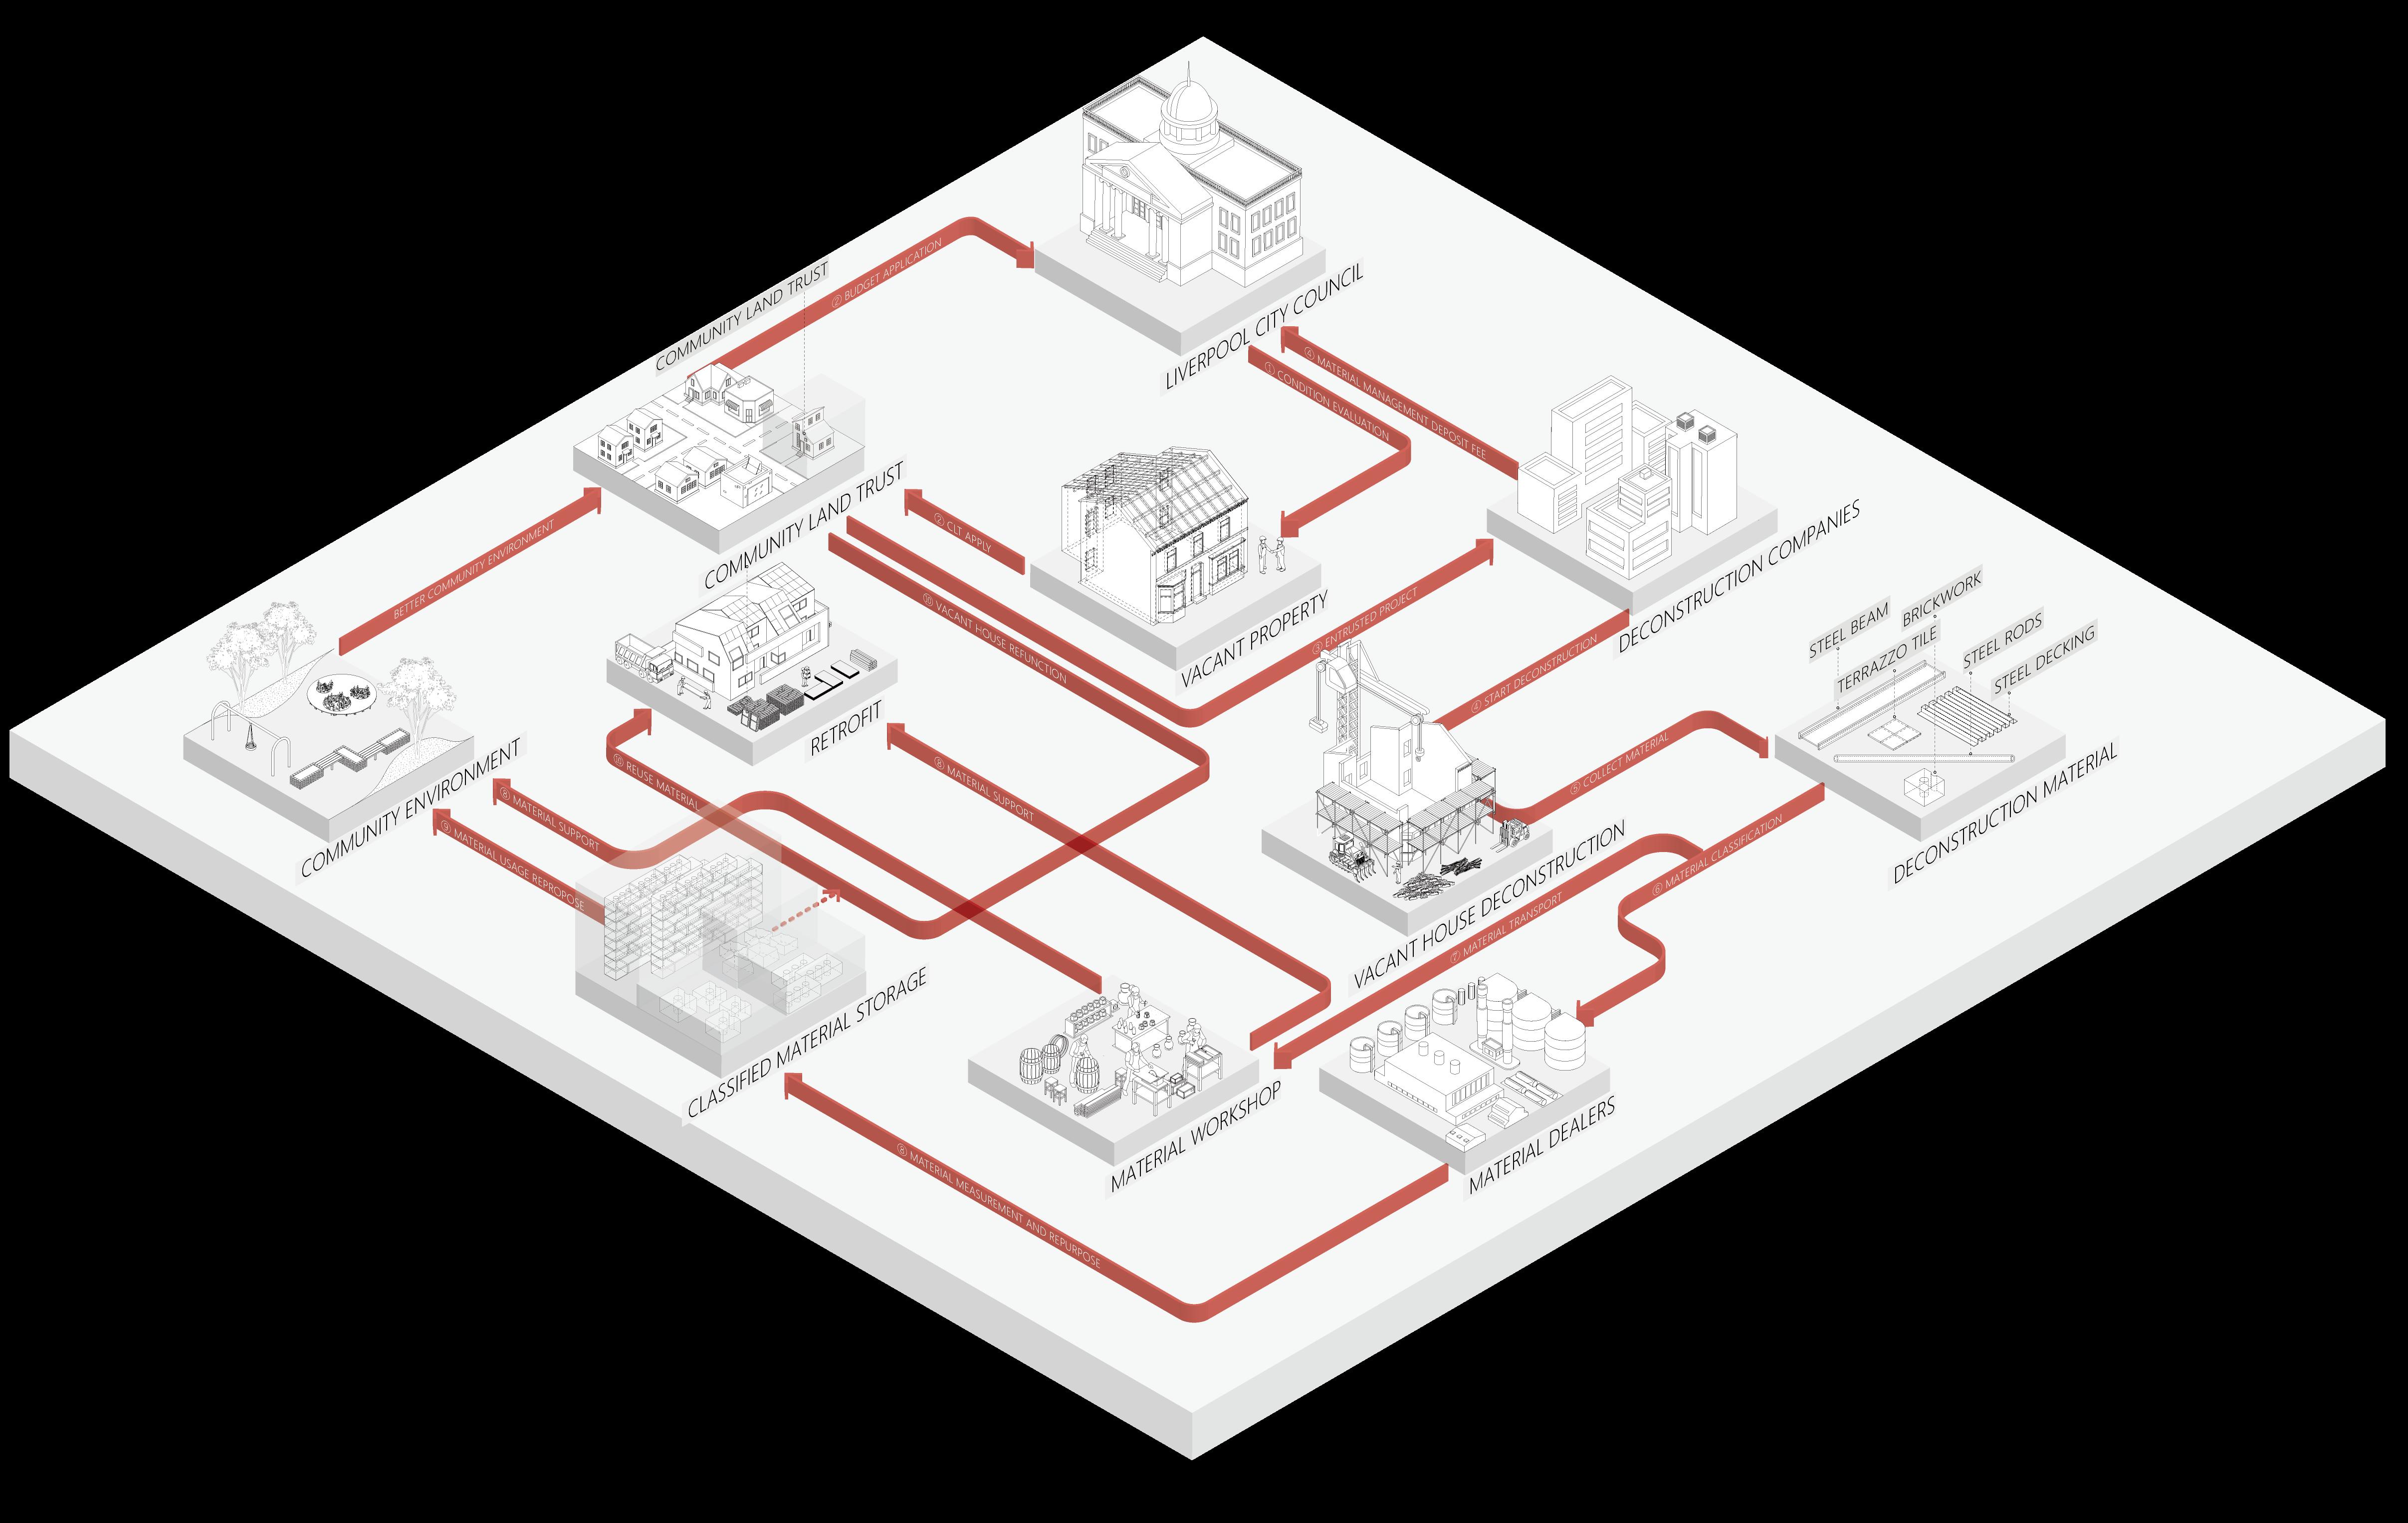
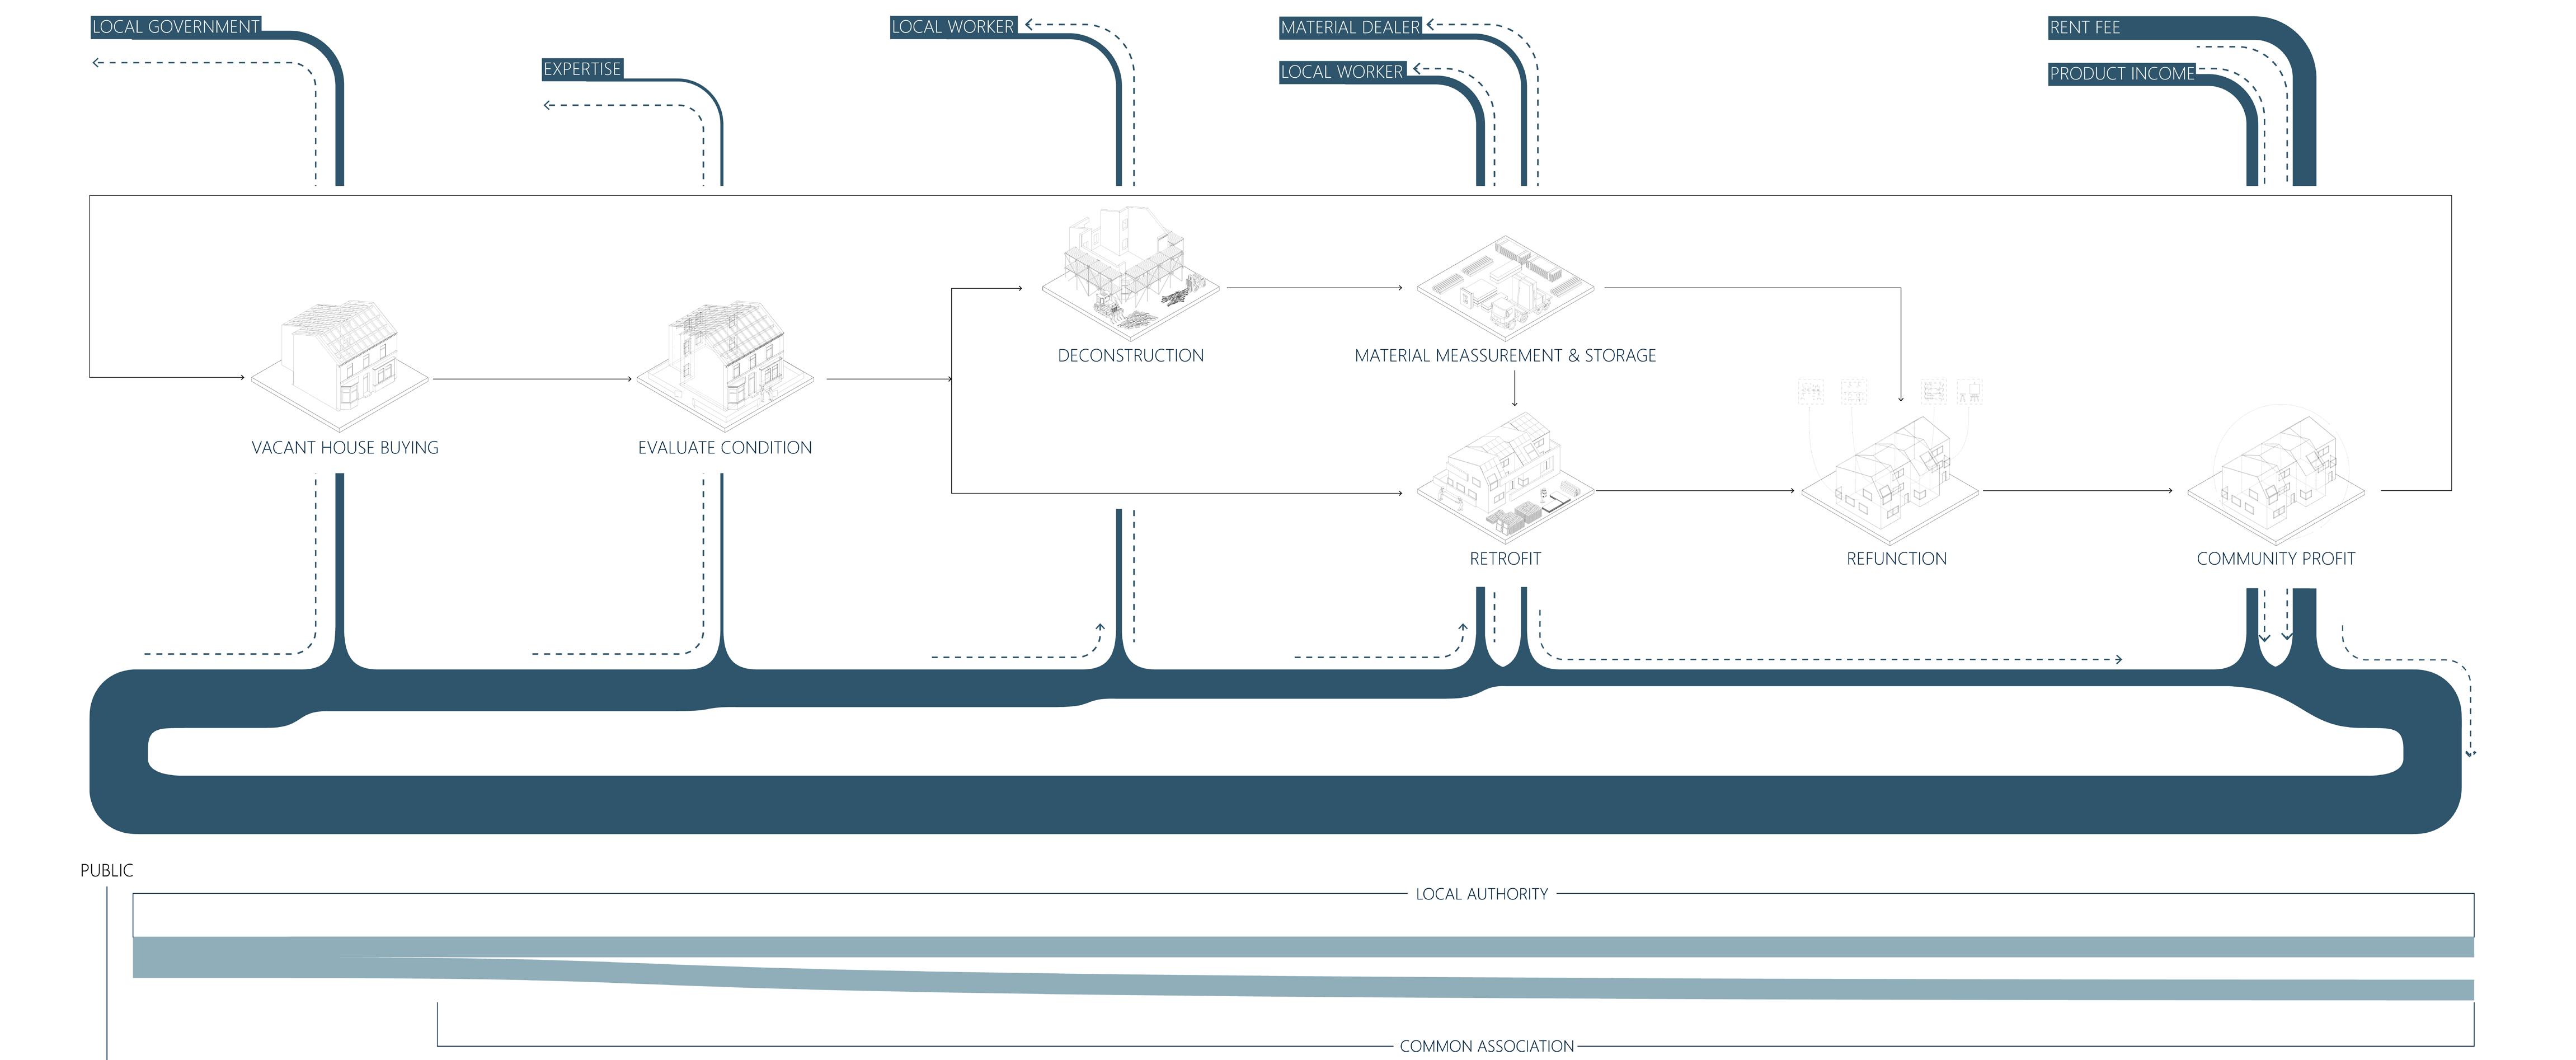
In order to make significant and impactful changes to the way we construct our buildings and our communities, we require many different organizations with different interests to work together. Community Land Trusts, supported by local city councils, and other community organizations will work together with construction and deconstruction companies to draft policies and provide recommendations that reimagine how materials can and will be used in their communities. By giving residents more automomy in how their neighborhoods are built, we can better serve the needs of those historically disadvantaged.
by ShenghanWang
Map 44. MaTErIaL OpEraTION SYSTEM: OpEraTION FLOW A Local Network of Reuse 125 124
MATERIAL OPERATION SYSTEM
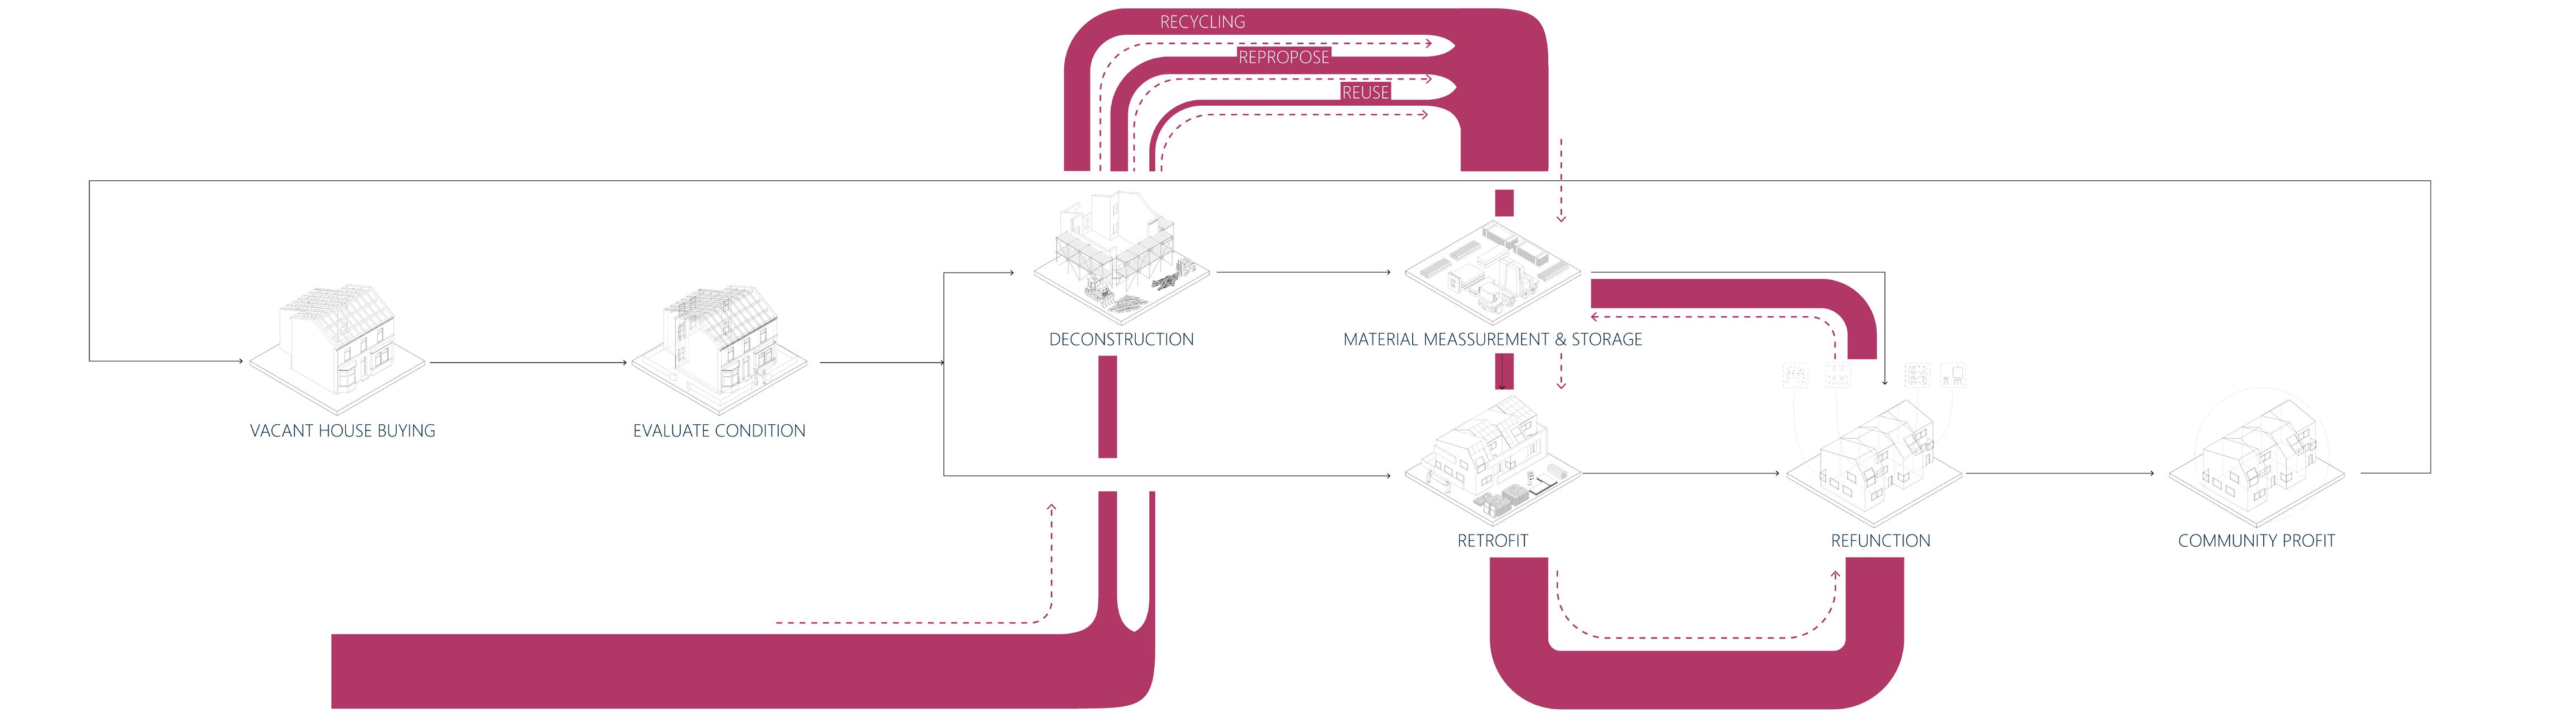
Specific policies and initiatives are necessary to support community land trusts and promote a more sustainable and equitable construction system. Vacant homes should be handed over to CLTs along with the appropriate funding needed for renovation or sustainable deconstruction. Landfilling avoidable construction waste should be illegal with material reuse networks and construction libraries established to reintroduce materials from local constructions and deconstructions back into the local economies. New constructions should be required to build with a specified amount of reused materials, and they should be encouraged to source all other materials locally when possible. By maintaining and supporting a new material network that is more local, we can build community wealth while simultaneously reducing the raw material extraction and labour exploitation.
Map 45. MaTErIaL OpEraTION SYSTEM: pOLICY SuppOrT by ShenghanWang
A Local Network of Reuse 127 126
With a number of other successful CLTs and local community organizations already established in Liverpool, the successes of Granby could be replicated across the city. Material resellers and construction libraries could work together to ensure the sustainable collection and reintroduction of reclaimed materials. This material network would enable communities to renovate homes, buildings, and outdoor spaces.


CONSTRUCTION COMPANY DINGLE GREENBANK CENTRAL PICTON KENSINGTON AND FAIRFIELD KIRKDALE EVERTON Beesley & Fields Ltd Unit3 Design Studio Liverpool City Council Wirral Mix Ltd Wirral Mix Ltd Luna Creations Metal Clay Botanical Charms Class Beers Timber & Building Supplies Ltd Ceranic Painting Workshoop Keith Davison Partnership Chestnut Building Centres Granby Workshop Travis Perkins Alexander Steel Stockholders Mindful Macrame Class COMMUNITY LAND TRUST MATERIAL WORKSHOP MATERIAL WORKSHOP MATERIAL DEALER COMMUNITY WORKSHOP RETROFIT HOUSES COMMUNITY SHOP COMMUN TY SHOP OUTDOOR MARKET DECONSTRUCTION COMMUNI TY GARDEN PEDESTRAIN-FRIENDLYSTREET MATERIAL NETWORK
A Local Network of Reuse Map 46. MaTEr aL NETWOrK IN LIVErpOOL by ShenghanWang 129 128
Granby Four Streets CLT has over a decade of experience promoting community well-being and has brought a lot of valuable experience and inspiration to many other start-up CLTs. The work that they have accomplished so far in the face of adversity is truly inspiring. Community Land Trusts are becoming more and more common throughout the UK with many already producing positive benefits for their neighborhoods. By learning from each other’s successes and collaborating whenever possible, they have the opportunity to radically change when, where, and especially how development occurs. Our project would not have been possible without the incredible work already done by these organizations, and our goal for this project is to build upon their work to envision how cities can grow and develop sustainably in the future.
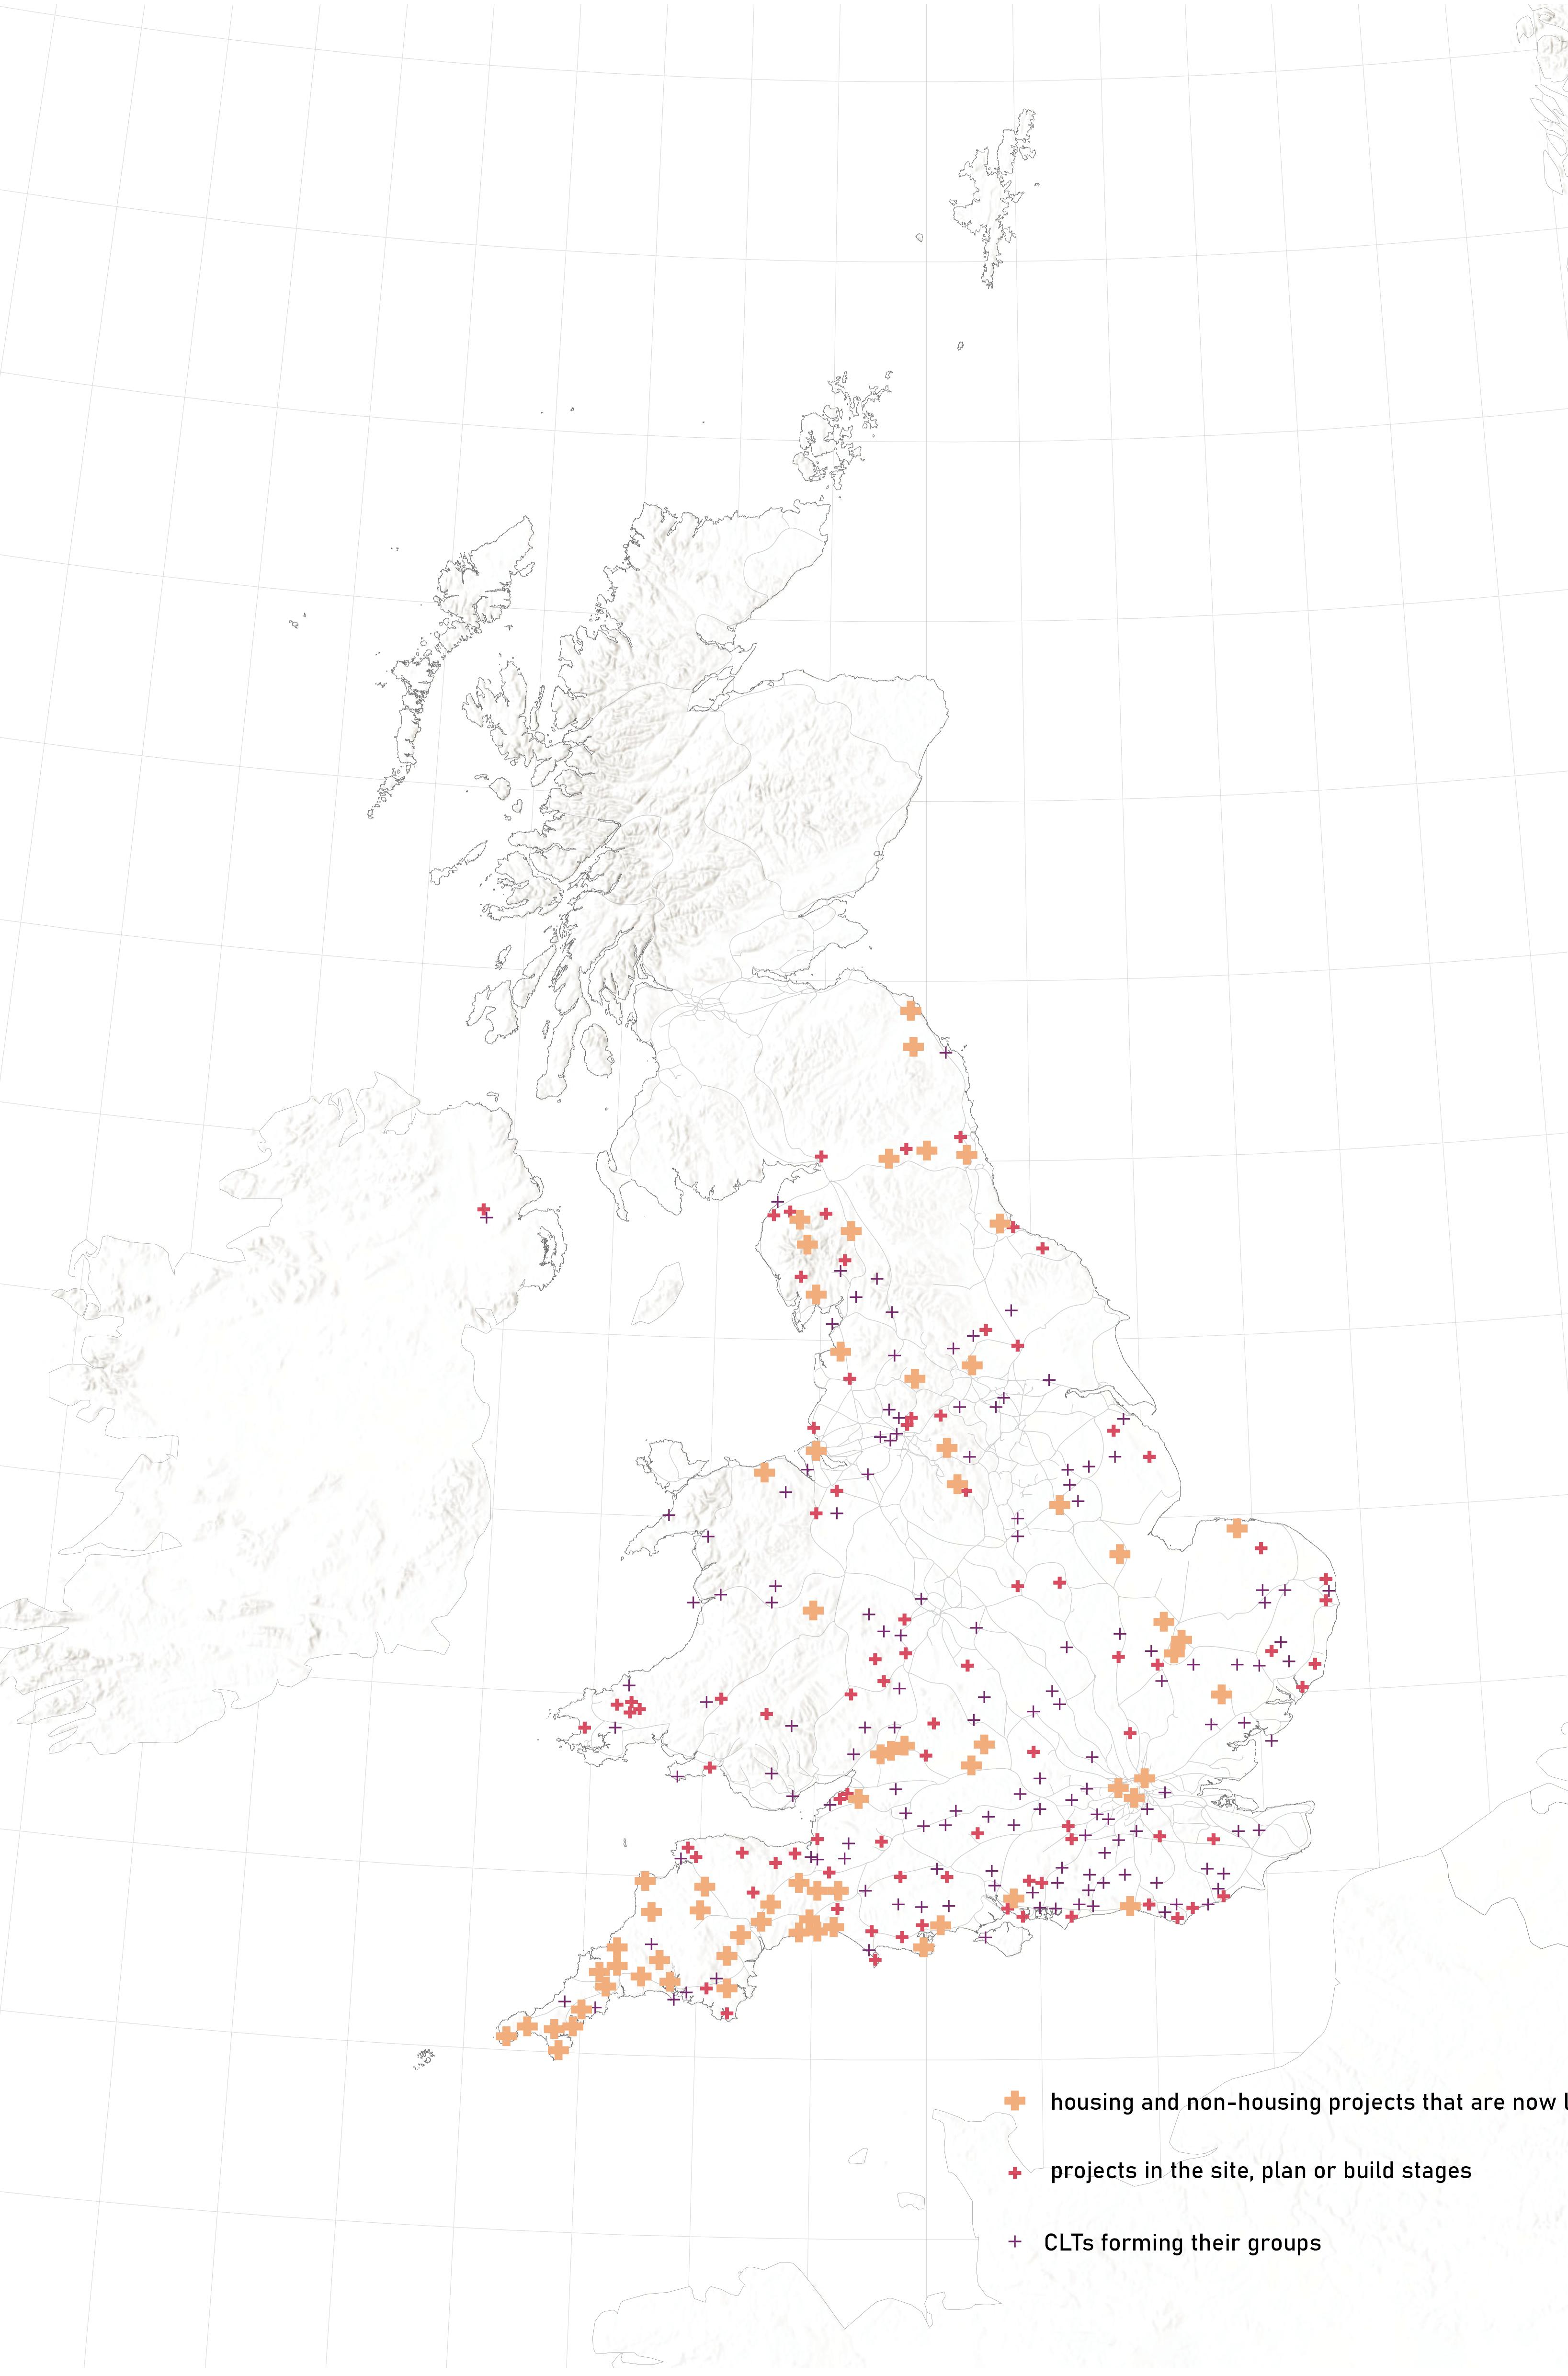
UK NETWORK VISION A Local Network of Reuse Map 47. CLT
Map byMingxiShu
“ “
“I actually do think we need to future-proof our streets and our homes and our lives, and it needs to be done collectively”
QuotefromHazelTilley,duringonlineinterview
131 130
133 132 07 APPENDIX 07.2 TABLE OF MAPS 07.1 TABLE OF DIAGRAMS 07.3 TABLE OF FIGURES
TABLE OF DIAGRAMS
CHAPTER 01. MATERIAL CONSEQUENCES OF RAPID URBANIZATION
Diagram 01. Urban population vs GDP per capita. 2016.
OWID based on UN World Urbanization Prospects (2018), Maddison Project Database 2020 (Bolt and van Zanden (2020)) OurWorldInData.org/urbanization
Diagram 02. Urban population vs GDP per capita. Global North 2016.
OWID based on UN World Urbanization Prospects (2018), Maddison Project Database 2020 (Bolt and van Zanden (2020)) OurWorldInData.org/urbanization
Diagram 03. Urban population vs GDP per capita. Global South 2016.
OWID based on UN World Urbanization Prospects (2018), Maddison Project Database 2020 (Bolt and van Zanden (2020)) OurWorldInData.org/urbanization
Diagram 04. Global building material use by materials.
Huang, Beijia & Gao, Xiaofeng & Xu, Xiaozhen & Song, Jialing & Geng, Yong & Sarkis, Joseph & Fishman, Tomer & Kua, Harn & Nakatani, Jun. (2020). A Life Cycle Thinking Framework to Mitigate the Environmental Impact of Building Materials. One Earth. 3. 10.1016/j.oneear.2020.10.010.
Diagram 05. Global extraction of nonmetallic minerals by sector of use, 1970-2010.
Miatto, A., Schandl, H., Fishman, T. and Tanikawa, H. (2017), Global Patterns and Trends for Non-Metallic Minerals used for Construction. Journal of Industrial Ecology, 21: 924-937. https://doi.org/10.1111/jiec.12471
Diagram 06. Global extraction of nonmetallic minerals by type, 1970-2010.
Miatto, A., Schandl, H., Fishman, T. and Tanikawa, H. (2017), Global Patterns and Trends for Non-Metallic Minerals used for Construction. Journal of Industrial Ecology, 21: 924-937. https://doi.org/10.1111/jiec.12471
Diagram 07. Planetary boundaries.
J. Lokrantz/Azote based on Steffen et al. Planetary Boundaries illustration in black and white. 2015. https://www.stockholmresilience.org/research/planetary-boundaries.html.
Diagram 08. Virgin material extraction 1972-2050.
Circle Economy. “The Circularity Gap Report 2022.” Amsterdam: Circle Economy, 2022.
Diagram 09. Global sand import 2019.
AJG Simoes, CA Hidalgo. The Economic Complexity Observatory: An Analytical Tool for Understanding the Dynamics of Economic Development. Workshops at the Twenty-Fifth AAAI Conference on Artificial Intelligence. (2011)
Diagram 10. Uk sand export 2019.
AJG Simoes, CA Hidalgo. The Economic Complexity Observatory: An Analytical Tool for Understanding the Dynamics of Economic Development. Workshops at the Twenty-Fifth AAAI Conference on Artificial Intelligence. (2011)
Diagram 11. Uk sand import 2019.
AJG Simoes, CA Hidalgo. The Economic Complexity Observatory: An Analytical Tool for Understanding the Dynamics of Economic Development. Workshops at the Twenty-Fifth AAAI Conference on Artificial Intelligence. (2011)
Diagram 12. Uk land use change diagram.
DOI for Land Cover Map 2019 (land parcels, GB): Morton, R. D.; Marston, C. G,; O’Neil, A. W.; Rowland, C. S. (2020). Land Cover Map 2019 (land parcels, GB). NERC Environmental Information Data Centre. https://doi.org/10.5285/44c23778-4a73-4a8f875f-89b23b91ecf8
Diagram 13. Average house price in London, UK and nations. UK House Price Index; reports (Office for National Statistics)
CHAPTER 03. THE GRANBY MODEL
Diagram 14. Public-Private Partnership model construction cash flow.
ADB, EBRD, IDB, IsDB, and WBG. 2016. The APMG Public-Private Partnership (PPP)
Certification Guide. Washington, DC: World Bank Group. License: Creative Commons Attribution CC BY 3.0 IGO
Diagram 15. Public-Private Partnership model.
Shenghan Wang
Diagram 16. Public-Private Partnership model construction material flow.
ADB, EBRD, IDB, IsDB, and WBG. 2016. The APMG Public-Private Partnership (PPP)
Certification Guide. Washington, DC: World Bank Group. License: Creative Commons Attribution CC BY 3.0 IGO
Diagram 17. Public-Common Partnership model construction cash flow.
How ‘public-common partnerships’ can help us take back what’s ours. (2019, July 10). Novara Media. https://novaramedia.com/2019/07/10/how-public-commonpartnerships-can-help-us-take-back-whats-ours/
Diagram 18. Public-Common Partnership model construction material flow.
How ‘public-common partnerships’ can help us take back what’s ours. (2019, July 10). Novara Media. https://novaramedia.com/2019/07/10/how-public-commonpartnerships-can-help-us-take-back-whats-ours/
TABLE OF MAPS
CHAPTER 01. MATERIAL CONSEQUENCES OF RAPID URBANIZATION
Map 01. Estimated Cities GDP by 2050
Corbane, Christina; Florczyk, Aneta; Pesaresi, Martino; Politis, Panagiotis; Syrris, Vasileios (2018): GHS built-up grid, derived from Landsat, multitemporal (19751990-2000-2014), R2018A. European Commission, Joint Research Centre (JRC) doi:10.2905/jrc-ghsl-10007 PID: http://data.europa.eu/89h/jrc-ghsl-10007.
Map 02. Global Atlas of Urbanization and its Consequences.
OECD (2022), “Material resources: Material resources”, OECD Environment Statistics (database), https://doi.org/10.1787/data-00695-en (accessed on 20 September 2022).
Florczyk A., Corbane C,. Schiavina M., Pesaresi M., Maffenini L., Melchiorri, M., Politis P., Sabo F., Freire S., Ehrlich D., Kemper T., Tommasi P., Airaghi D., Zanchetta L. (2019)
GHS Urban Centre Database 2015, multitemporal and multidimensional attributes, R2019A. European Commission, Joint Research Centre (JRC)PID: https://data.jrc. ec.europa.eu/dataset/53473144-b88c-44bc-b4a3-4583ed1f547e
Climate Watch Historical GHG Emissions. 2022. Washington, DC: World Resources Institute. Available online at: https://www.climatewatchdata.org/ghg-emissions
Maus, Victor; Giljum, Stefan; Gutschlhofer, Jakob; da Silva, Dieison M; Probst, Michael; Gass, Sidnei L B; Luckeneder, Sebastian; Lieber, Mirko; McCallum, Ian (2020): Global-scale mining polygons (Version 1). PANGAEA, https://doi.org/10.1594/ PANGAEA.910894
Map 03. UK Offshore Sand Extraction Survey, B. G. (n.d.). Directory of mines and quarries. Mine & quarry Minerals UK. Retrieved September 21, 2022, from https://www2.bgs.ac.uk/mineralsuk/mines/ dmq.html
Map 04. UK Sand Mines and Quarries
Bide, T. (2014, June). Thinking big - defining resources for Major Coastal Defence Projects. Retrieved September 21, 2022, from https://www.researchgate.net/profile/ Thomas-Bide/publication/308115338_THINKING_BIG_-DEFINING_RESOURCES_ FOR_MAJOR_COASTAL_DEFENCE_PROJECTS/links/57da785008ae4e6f1842c12a/ THINKING - BIG - DEFINING - RESOURCES - FOR - MAJOR - COASTAL - DEFENCEPROJECTS.pdf
Map 05. UK Transportation Network OS open roads. OS Products. (n.d.). Retrieved September 21, 2022, from https:// www.ordnancesurvey.co.uk/business-government/products/open-map-roads
Map 06. UK Coastal Erosion
European atlas of the seas. European Commission. (2016, August). Retrieved September 21, 2022, from https://ec.europa.eu/maritimeaffairs/atlas/maritime_atlas/#lang=E N;p=w;bkgd=5;theme=195:0.75;c=-340318.7714205728,7599429.374956644;z=10
Map 07. UK Land Use Change
Morton, R.D.; Marston, C.G.; O’Neil, A.W.; Rowland, C.S. (2021). Land Cover Map 2020 (land parcels, GB). NERC EDS Environmental Information Data Centre. https://doi. org/10.5285/0e99d57e-1757-451f-ac9d-92fd1256f02a
- Rowland, C.S.; Marston, C.G.; Morton, R.D.; O’Neil, A.W. (2020). Land Cover Map 1990 (vector, GB). NERC Environmental Information Data Centre. https://doi. org/10.5285/304a7a40-1388-49f5-b3ac709129406399
Map 08. UK Housing Prices and Population
Contains HM Land Registry data © Crown copyright and database right 2020. This data is licensed under the Open Government Licence v3.0.
“Mid-Year Population Estimates, UK June 2020.” Office for National Statistics, June 25, 2021.
Map 09. Vacant Houses in England
Wilson, Wendy, Hannah Cromarty, and Cassie Barton. Rep. Empty Housing (England), 2020. https://commonslibrary.parliament.uk/research-briefings/sn03012/
Map 10. Extraction Externalities
See Map 13.
Map 11. Production Externalities
See Map 13.
Map 12. Construction Externalities
See Map. 13
Map 13. Construction Externalities Anatomical Map
“Top Ten Health and Safety Risks in Construction.” Alcumus, October 27, 2021. https://www.alcumus.com/en-gb/insights/blog/top-ten-health-and-safety-risksin-construction/.
Gardiner, Joey. “Should We Work All Hours?” Building, July 20, 2012. https://www. building.co.uk/focus/should-we-work-all-hours/5039631.article.
“Greenhouse Gas Emissions in Shipping.” Shell Global, n.d. https://www.shell. com/energy-and-innovation/the-energy-future/greenhouse-gas-emissions-inshipping.html.
CHAPTER 02. LIVERPOOL, THE NEOLIBERAL CITY
Map 14. Liverpool HMRI Areas.
“Housing Market Renewal Initiative Annual Report 2006/2007”. Liverpool City Council, 2007.
Map 15. HMRI Impact of Demolished Houses
“Housing Market Renewal Initiative Annual Report 2006/2007”. Liverpool City Council, 2007.
Map 16. Speculation Areas by Private Developers in House for a Pound Scheme Meddings, Sabah, and Nathaniel Barker. “How £1 Homes in Liverpool Ended up in the Hands of Tycoon Li Ka-Shing.” The Sunday Times. August 14, 2022. https:// www.thetimes.co.uk/article/how-1-homes-in-liverpool-ended-up-in-the-handsof-tycoon-li-ka-shing-ls5jszph0.
“Mayor Wowed by Revamped £1 Home.” Liverpool Express, November 10, 2017. https://liverpoolexpress.co.uk/mayor-wowed-revamped-1-home/.
Waite, Richard. “Pathfinder Fails for Liverpool.” Architects Journal, April 29, 2010. https://www.architectsjournal.co.uk/archive/path%EF%AC%81nder-fails-forliverpool.
Map 17. Overseas Investments in the Liverpool Region.
Information produced by HM Land Registry © Crown copyright [2022]. Economic activity. OS Products. (n.d.). Retrieved September 20, 2022, from https:// digimap.edina.ac.uk/roam/download/society
Map 18. Overseas Investments in the Liverpool Area.
Information produced by HM Land Registry © Crown copyright [2022].
Map 19. Development Typology. Demolition and build
- “Liverpool Development Update October 2019.” Liverpool: Liverpool City Council, October 2019
Map 20. Development Typology. New build
“Liverpool Development Update October 2019.” Liverpool: Liverpool City Council, October 2019
Map 21. Development typology. Conversion
“Liverpool Development Update October 2019.” Liverpool: Liverpool City Council, October 2019
Map 22. Development typology. Retrofit
“Liverpool Development Update October 2019.” Liverpool: Liverpool City Council, October 2019
Map 23. Global Origins of Construction Materials Key Map.
Map 24. The Lexington. Global Origins of Construction Materials.
AJG Simoes, CA Hidalgo. The Economic Complexity Observatory: An Analytical Tool for Understanding the Dynamics of Economic Development. Workshops at the Twenty-Fifth AAAI Conference on Artificial Intelligence. (2011)
135 134
Map 25. The Lexington. Environmental Impact of New Developments
AJG Simoes, CA Hidalgo. The Economic Complexity Observatory: An Analytical Tool for Understanding the Dynamics of Economic Development. Workshops at the Twenty-Fifth AAAI Conference on Artificial Intelligence. (2011)
“Embodied Carbon - The ICE Database,” 2019. https://circularecology.com/ embodied-carbon-footprint-database.html.
“Embodied Carbon - ICE Cement, Mortar and Concrete Model,” 2019. https:// circularecology.com/embodied-carbon-footprint-database.html.
ICE Database Machine Readable V3.0 Beta,” 2019. https://circularecology.com/ embodied-carbon-footprint-database.html.
CHAPTER 03. THE GRANBY MODEL
Map 26. Granby Timeline
New Statesman. ‘You can buy a house in Liverpool for £1’, 9 June 2021. https://www. newstatesman.com/spotlight/2018/03/you-can-buy-house-liverpool-1.
Granby 4 Streets Community Land Trust. ‘Granby 4 Streets Community Land Trust Granby 4 Streets Community Land Trust’. Accessed 23 September 2022. https:// www.granby4streetsclt.co.uk.
Alex. ‘Granby Four Streets - Power to Change’, 11 March 2022. https://www. powertochange.org.uk/case_study/granby-four-streets/.
Parry, Josh. ‘Look How Far the Granby 4 Streets Have Come’. Liverpool Echo, 7 December 2015. http://www.liverpoolecho.co.uk/news/liverpool-news/look-howfar-granby-4-10564438.
Granby 4 Streets Community Land Trust. ‘History’. https://www.granby4streetsclt. co.uk/history-of-the-four-streets.
Map 27. Granby Four Streets Axonometric view.
CHAPTER 04. AUDITS AND PASSPORTS
Map 28. Material Management Proposal.
Bradley, Guy. ‘A GUIDE TO DECONSTRUCTION’, n.d., 93.
Diyamandoglu, Vasil, and Lorena M. Fortuna. ‘Deconstruction of Wood-Framed Houses: Material Recovery and Environmental Impact’. Resources, Conservation and Recycling 100 (July 2015): 21–30. https://doi.org/10.1016/j.resconrec.2015.04.006.
Wei, Yujie, Akash Pushkar, and Burcu Akinci. ‘Supporting Deconstruction Waste Management through 3D Imaging: A Case Study’. Banff, AB, Canada, 2019. https:// doi.org/10.22260/ISARC2019/0059.
Finkelstein, Emily A. ‘EXTREME ADAPTIVE REUSE: THE ANALYTICS OF DECONSTRUCTION AND THE UPCYCLING OF BUILDING MATERIALS’, n.d., 78. Urbanism, Unagru Architecture &. ‘Is It Worth Using Reclaimed Bricks?’ unagruarchitecture, 22 March 2022. https://www.unagru.com/single-post/is-it-worthusing-reclaimed-bricks.
Map 29. Ducie St. Facade Section. Materials Extracted.
Map 30. Deconstruction Audit Procedure
Map 31. Granby Rendering Deconstruction Audits
Map 32. Material Catalogue for Terrace House.
Map 33. Material catalogue Quality Comparison
Map 34. Material Passport Data and Actors
Heinrich, Matthias, and Werner Lang. Publication. Materials Passports - Best Practice. Technische Universitat Munchen, in association with BAMB, 2019. https:// www.bamb2020.eu/wp-content/uploads/2019/02/BAMB_MaterialsPassports_ BestPractice.pdf.
Map 35. Material Passport Application
Map 36. Granby Rendering Retrofit Audits
CHAPTER 05. THE MATERIAL MANUAL
Map 37. Material Manual
“KIV87VF30G Built-in Fridge-Freezer with Freezer at Bottom - Bosch Home,” n.d. https://www.bosch-home.co.uk/product-list/KIV87VF30G.
Map 38. Construction Library
Map 39. Material Reuse Comparison
Map 40. Reused materials.
Map 41. Pavilion Reuse Materials.
CHAPTER 06. A LOCAL NETWORK OF REUSE
Map 42. Public-Common Partnership Framework
Map 43. Granby Rendering Retrofit Audits
Map 44. Material Operation System: Operation Flow
Map 45. Material Operation System: Policy Support
Map 46. Material Network in Liverpool
Map 47. CLT Map
TABLE OF FIGURES
Figure 01. London Thames River And Canary Wharf Aerial View. London Thames River and Canary Wharf Aerial View. November 14, 2018. Flickr. https://www.flickr.com/photos/roli_b/46030772521/in/photostream/.
Figure 02. Vacant Houses in Liverpool.
Furlong, Christopher. Derelict Homes in Liverpool Liverpool Echo. Acces-sed July 14, 2022. https://www.liverpoolecho.co.uk/news/liverpool-news/liver-poolthousands-more-empty-homes-21234082
Figure 03. The Toxteth Riots Of 1981 In Pictures.
Fradley, Samuel. ‘Kim Aldis - The Brixton Riots of 1981 in Pictures’. The South West Collective of Photography (blog), 28 October 2019. https://thesouthwestco-llective. co.uk/kim-aldis-the-brixton-riots-of-1981-in-pictures/.
Figure 04. Managed Decline News Headlines.
BBC News. ‘Thatcher Urged “let Liverpool Decline” after 1981 Riots’, 30 Decem-ber 2011, sec. UK. https://www.bbc.com/news/uk-16361170.
Figure 05. Letter From Geoffery Howe (Chancellor Of The Exchequer) To Pm Thatcher — 1981.
Ross From. ‘What Managed Decline in Liverpool Can Teach Us about Con-servative Attitudes towards Vulnerable...’. Medium (blog), 14 March 2020. https://medium. com/@rossjenk32/what-managed-decline-in-liver-pool-can-teach-us-aboutconservative-attitudes-towards-vulnerable-a86b-6f10a229.
Figure 06. Homebaked Housing Market Renewal Area. Loudon, Mark. Homebaked. Housing Market Renewal Area. Homebaked Community Land Trust. Accessed May 5, 2022. https://homebaked.org.uk/about_us/ story/.
Figure 7. Illustration House for £1 speculation in Liverpool.
Speakman, James. Paved with Gold? Hatherley Street in Toxteth. The Sunday Times. The Times, August 14, 2022. https://www.thetimes.co.uk/article/how-1-ho-mes-inliverpool-ended-up-in-the-hands-of-tycoon-li-ka-shing-ls5jszph0.
Figure 8. Hatherley Street In Toxteth.
Speakman, James. Paved with Gold? Hatherley Street in Toxteth. The Sunday Times. The Times, August 14, 2022. https://www.thetimes.co.uk/article/how-1-ho-mes-inliverpool-ended-up-in-the-hands-of-tycoon-li-ka-shing-ls5jszph0.
Figure 9. The Lexington Building.
Original picture by Bradley Nissen. April 14, 2022.
Figure 10. Graffiti On Granby Street
Original picture by Borja Romeu. April 13, 2022.
Figure 11. Granby Clt Members.
Rand, Lisa. ‘Our Streets Were Forgotten by the City so We Fought Back’. Li-verpool Echo, 21 September 2019. https://www.liverpoolecho.co.uk/news/liver-pool-news/ streets-were-forgotten-city-fought-16947325.
Figure 12. Granby Winter Gardens.
Original picture by Mingxi Shu and Borja Romeu. April 13, 2022.
Figure 13. Public-Common Partnership Model. Milburn, Keir. Russell, Bertie. ‘Public-Common Partnerships: Building New Circuits of Collective Ownership’. Common Wealth, 27 June 2019. https://www.commonwealth.co.uk/reports/public-common-partnerships-building-new-circuits-ofcollective-ownership
Figure 14. Abandoned Materials In Granby Area.
Original picture by Mingxi Shu, July 29. 2022
Figure 15. Roughing Book and Owner’s Manual. Phillips, Scott. ‘Writing an Owner’s Manual for a House’. Fine Homebuilding, February/March 1998. https://www.southmountain.com/press/writing-ownersmanual-house/
137 136

139 138