Decalaration : “ I certify that this piece of work is entirely my/our and that my quatation or paraphase from the published or unpublished work of other is duly acknowledge .”
The team would like to express our deepest gratitude to Dr. Michael Weinstock, Dr. Milad Showkatbakhsh and Dr. Anna Font Vacas whose guidance and invaluable insights have been instrumental in shaping the direction of this research. We would also like to extend our sincere thanks to the faculty members Dr. Alvaro Velasco Perez, Paris Nikitidis, Krishna Bhatt, Abhinav Chadhary, Danae Polyviou for their constant support, constructive feedback, and for providing the resources necessary to refine and develop our ideas.
we would also like to acknowledge the support and academic resources provided by the AA School of Architecture, which created the foundation for this project and enabled us to carry out this research with rigor and clarity.
Finally, we are deeply grateful to my peers, family, and friends for their encouragement and support throughout this journey. This work would not have been possible without their contributions, patience, and understanding.
Global scale ..............................................................................................................................
Sediment Persistence Index (SPI)
Phase wise Development.....................
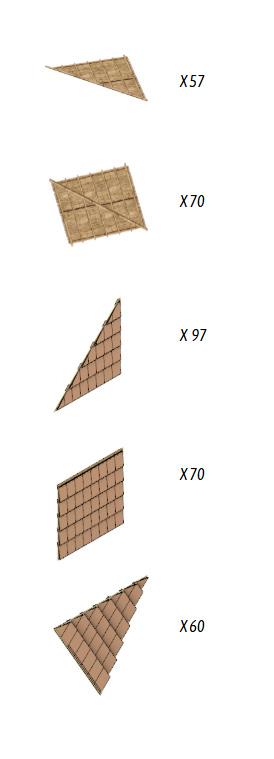
Kit of Parts ..................................................................................................................................
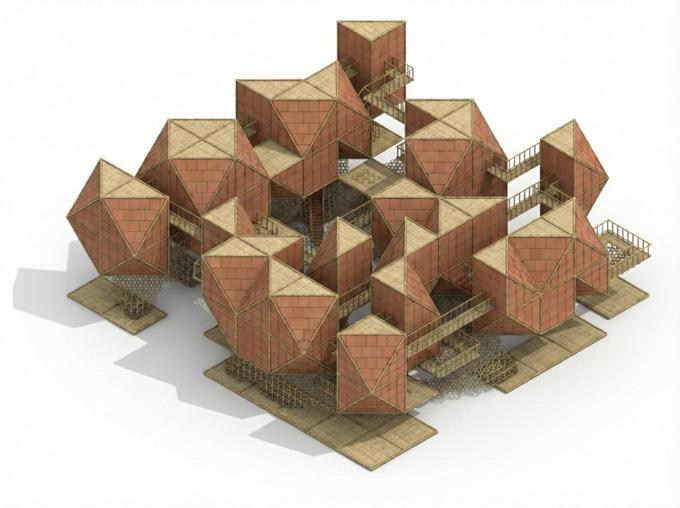
Incremental assembly.....................
06. Discussion
07. Appendix
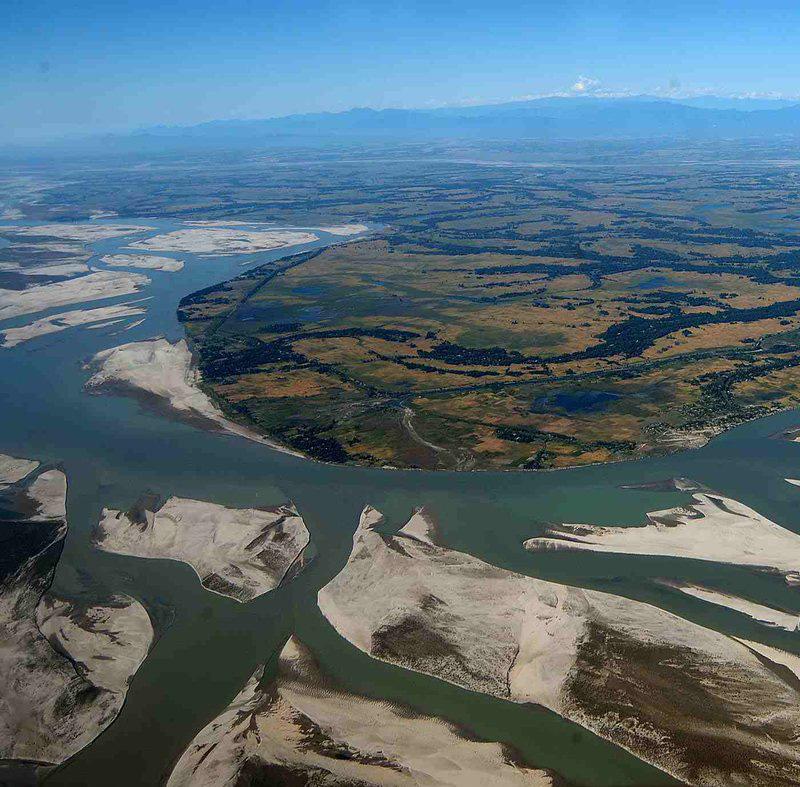
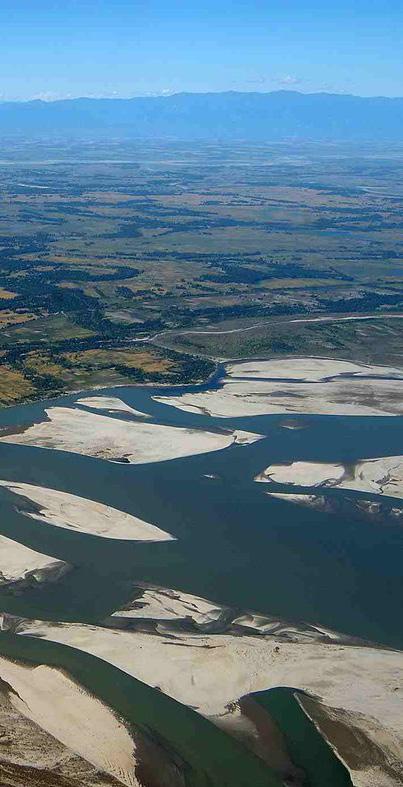
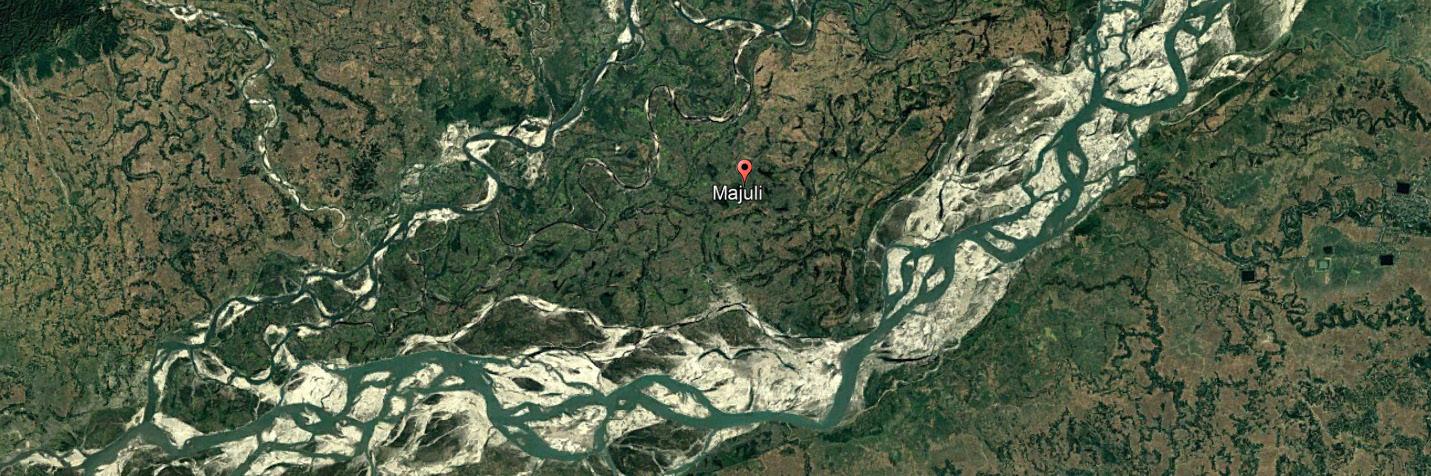
Fig. 02
An aerial view of Majuli, situated in the middle of the Brahmaputra in Jorhat district of Assam. Photo: Ritu Raj Konwar
Abstract
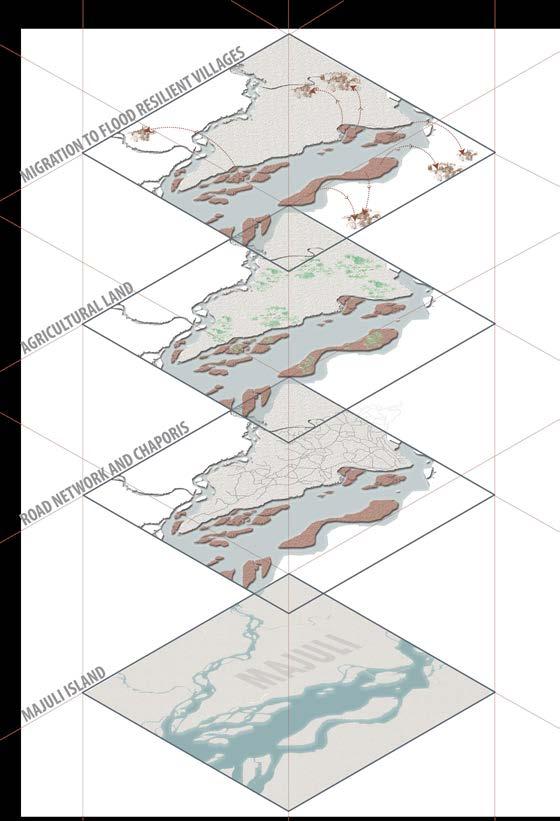
The chaporis, the lush, high landforms that support the island’s ecosystems and populations, are being gradually eroded by seasonal flooding and erosion on Majuli, the biggest inhabited river island in the world. Villages are uprooted as these delicate areas disappear, upsetting livelihoods, cultural continuity, and the close bond between people and the Brahmaputra River.
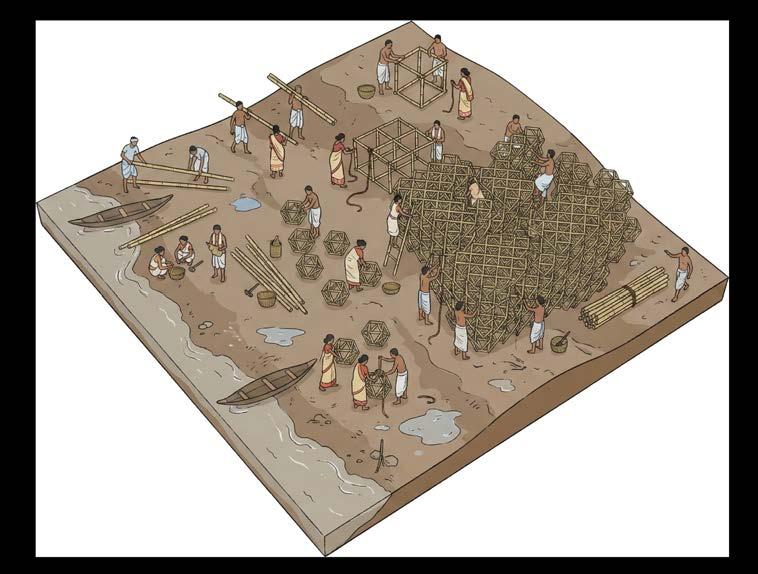
The work reconceives architecture as an active participant in the evolving Brahmaputra landscape, something that grows, adapts, and intervenes, rather than standing apart from the river’s shifting force. The study positionsbuilt form as an ecological agent capable of redirecting water flows, shaping sediment behaviour, and accelerating the emergence of new ground. Building on this premise, the project develops an eleven-year territorial strategy composed of modular units, bamboo frameworks, and adaptive living systems embedded within Majuli’s unstable fluvial terrain. In the early years, submerged biological scaffolds capture suspended silt, initiating the rise of fresh topography. As deposition thickens, these interventions reorganise into amphibious clusters resilient enough to anchor themselves on uncertain ground while continuing to choreograph sediment movement. Crucially, this architectural ecology extends beyond its environmental role: it supports the continuity of livelihoods, protects settlement patterns, and reduces the cycles of displacement that repeatedly fracture community life. By enabling land to grow with the people who depend on it, the system safeguards agriculture, fishing networks, and cultural practices that are inseparable from Majuli’s identity, allowing communities not only to remain but to thrive within the river’s shifting rhythms.
This project proposes a built environment that evolves in synchrony with the river rather than resisting it, reimagining settlement-making as a symbiosis between land, water, and people. In this approach, the future becomes a map of the past: each phase of habitation is inscribed directly onto the shifting memory of the Brahmaputra’s sediment flows, allowing new territory to grow from the traces of earlier ecological processes. Erosion, once a force of displacement, becomes a generator of opportunity, as the architectural system amplifies sedimentation to rebuild the very ground that has been lost.
By showing that architecture can spark ecological renewal and rebuild territory rather than dominate nature, the research frames a new mode of climate-adaptive urban emergence, a future in which settlements take shape from the river’s own memory, growing in tune with its shifting rhythms.
Glossary
Brahmaputra : 9th largest river in the world
Chapori : Temporary Silt bars formed in river
Satra : Monastic institutions
Neo Vashnavism : An egalitarian, revivalist movement within Hinduism
Ghat : Terraced steps leading down to a river
Burhi Dihing : Large tributary, about 380 kilometres (240 mi) long, of the Brahmaputra River
Mising tribe : An ethnic group primarily inhabiting the Indian states of Assam
Chang Ghar : Stilt houses traditionally built by the Mising people
Namghar : Vaishnavite prayer hall and cultural center
Introduction
Majuli is the world’s largest river island yet, beyond its geographical planetary achievement, it could be argued as even more remarkable in being a coalescence of cultural heritage, ecological processes, and economic practices. Situated amidst the braided channels of the Brahmaputra River, Majuli’s existence is continuously shaped by natural forces like seasonal flooding, sedimentation, and erosion, that not only reconfigure its terrain but also deeply influence the lives, livelihoods, and built environments of its inhabitants. This dissertation examines Majuli not merely as a geographical entity but as a dynamic socio-ecological system. It understands the island as a realm in which not only water and land meet, but, furthermore humans are in constant negotiation with their ecology. More than an island characterised by isolation, we understand Majuli as a melting pot of interrelations between the natural and the cultural domains.
The Satras, monastic establishments that play a crucial role in preserving regional customs, rituals, and performing arts, are the foundation of Majuli’s cultural axis. Majuli creates a private space for Satras using the braided pattern of the Brahmaputra. These cultural and spiritual hubs are essential components of the community’s everyday activities and spatial arrangement rather than discrete places of worship. Additionally, the Satras’ presence influences the programming of the island’s architectural fabric, from ceremonial grounds and performance venues to vernacular houses, while also driving a specialist tourism industry.
Economically, Majuli thrives on seasonal activities such as agriculture, pottery, fishing, and mask-making, each intrinsically tied to the river patterns. These occupation-based practices are vulnerable to the hydrological behaviour of the Brahmaputra, which governs access to land, timing of crop cycles, and the safety of structures. The braided morphology of the river, characterized by its shifting channels and sandbars, provides both opportunities and risks. While the formation of sandbars offers fertile ground for temporary cultivation and grazing, these landforms are ephemeral and often disturbed by peak-flood events.
But, eventually, it is the natural forces of the river that could be argued, configure life on the island. The river’s constant reshaping of terrain through processes of braiding, sandbar formation, and channel migration dictates the resilience strategies adopted by the islanders. These are not seen as isolated disasters, but as recurring, systemic forces embedded in everyday life. Flood and erosion, therefore, are not peripheral crises but fundamental conditions to consider. The community’s adaptive responses, temporary structures, mobile livelihoods, and dispersed settlement reflect a long-standing engagement with ecological uncertainty. However these forces are aggravating, Majuli is facing heavy land shrinkage over the time due to seasonal erosion and flood. The most fertile piece of land called chaporis is the most affected, resulting in mass shifting of the villages on these parts and the mainland. This affects the livelihood of the people who have a strong cultural and economic link to their villages.
Therefore, the dissertation proposes an interdependent design framework where architecture is conceived not as an object, but as a process, one that co-evolves with the changing terrain, cultural rituals, and economic cycles of the island. Built form and landscape are no longer viewed as separate, but as part of a living system that moves in rhythm with the Brahmaputra.
1. Sarmah, Dhruba Jyoti, and Rajib Kumar Bhattacharjya. “Geospatial Assessment on the Changing Pattern of Geomorphology: A Case Study on the World’s Largest River Island Majuli.” E3S Web of Conferences 347 (2022): 04002.
2. Gupta, Aishani. “Stories, Theatre and Worship: The Sacred Masks of Majuli.” Garland Magazine, June 1, 2025. 3. Majuli, River Island. “Largest river island”. Guinness World Records. Retrieved 6 September 2016.
Domain
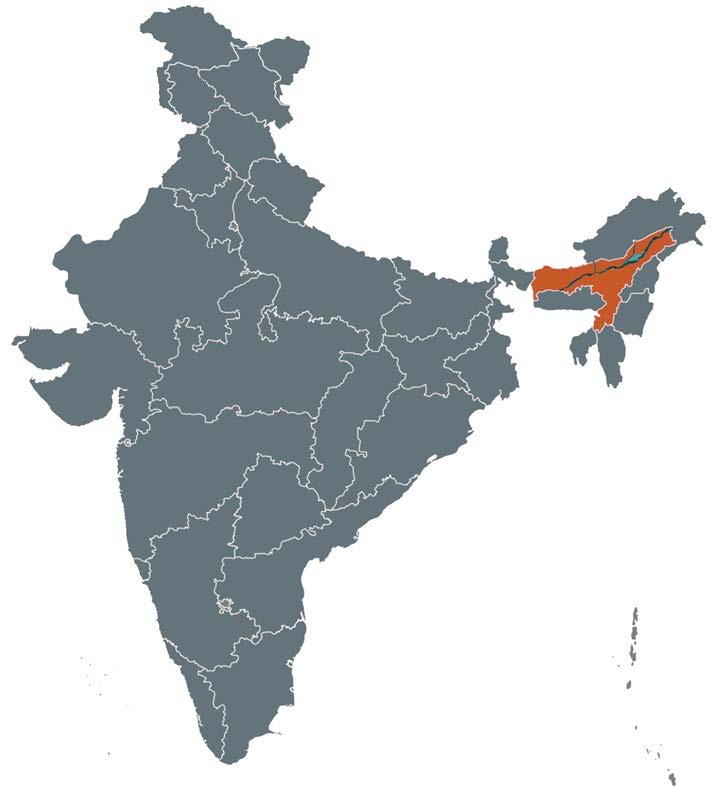
Majuli : World’s largest inhabited river island
Situated in the middle course of the River Brahmaputra in the state of Assam northeast India, Majuli is the largest and the most populous riverine island in the world. It is situated between 26°45′ N- 27°12′ N latitude and 93°39′ E and 94°35′ E longitude. The island is bounded by the river Brahmaputra in the south, river Subansiri in the north-west and Kherkota river in the north-east. The island covers a total area of 487.55 km2 with a population of 1,67,304. The island consists of three Mauzas viz. Ahatguri, Kamalabari and Salmora, 20 Gaon Panchayats (village councils) and 248 cadastral villages.
Formation of Majuli :
Majuli arose due to geomorphological changes induced by flooding and alterations in river courses. The island is situated between two waterways: the Brahmaputra to the north and the Burhi Dihing to the south. A succession of earthquakes between 1661 and 1696 prepared the ground for a monumental flood in 1750, altering the area. This flood redirected the Brahmaputra’s course, leading to the creation of Majuli Island.
After these great earthquakes, the island has witnessed tremendous changes in its morphology due to continuous changes of river channels. The great earthquake has lifted up the river bed of Brahmaputra by 3–4 m due to the deposition of heavy silts, which resulted in bank line erosion and floods in the island year after year. A distinct characteristic of the island is the presence of numerous mid-channel silt bars or islets resulting from the braided nature of the river Brahmaputra. Apart from these, there are numerous wetlands, ox-bow lakes, and tributaries in the island, which cover 14% of the total geographical area of the island.
: Sarmah, Dhruba
and Rajib
Fig. 03 : Geographical Location of Majuli-Assam, India, Created by Author
Climate of Majuli
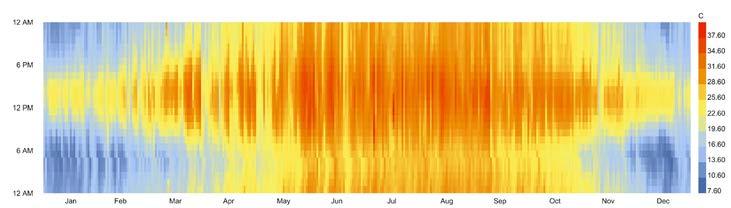
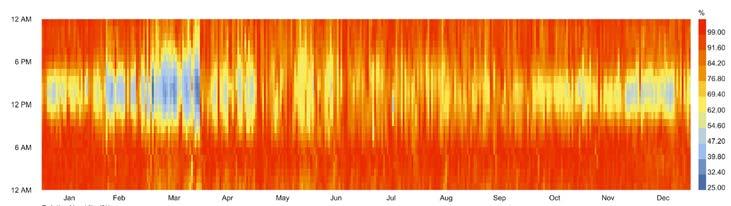
Majuli Island experiences a unique subtropical climate characterized by warm temperatures, elevated humidity levels, and pronounced seasonal fluctuations. The life rhythm on the island is intricately connected to these climatic changes, as alternating wet and dry spells mold the natural surroundings and human activity patterns.
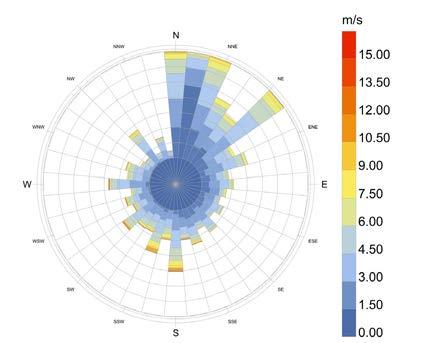
The southwest monsoon prevails from June to September, causing heavy rains and fierce winds that lead to frequent flooding and serious riverbank erosion. Conversely, the winter months from November to February are marked by cooler and drier weather, as gentle northeast winds provide more stable and comfortable conditions for farming, festivities, and everyday activities. During the transitional periods of spring and autumn, the arrival and departure of the monsoon are marked, resulting in fertile soils and a constant reshaping of the island’s delicate landscape.
Fig. 04 : Wind rose diagram of Majuli created using Ladybug tools Created by Author
Fig. 05 : Temperature chart of Majuli created using Ladybug tools, Created by Author
Fig. 06 : Relative humidity chart of Majuli created using Ladybug tools Created by Author
City Jorhat Country : IND
Relative Humidity
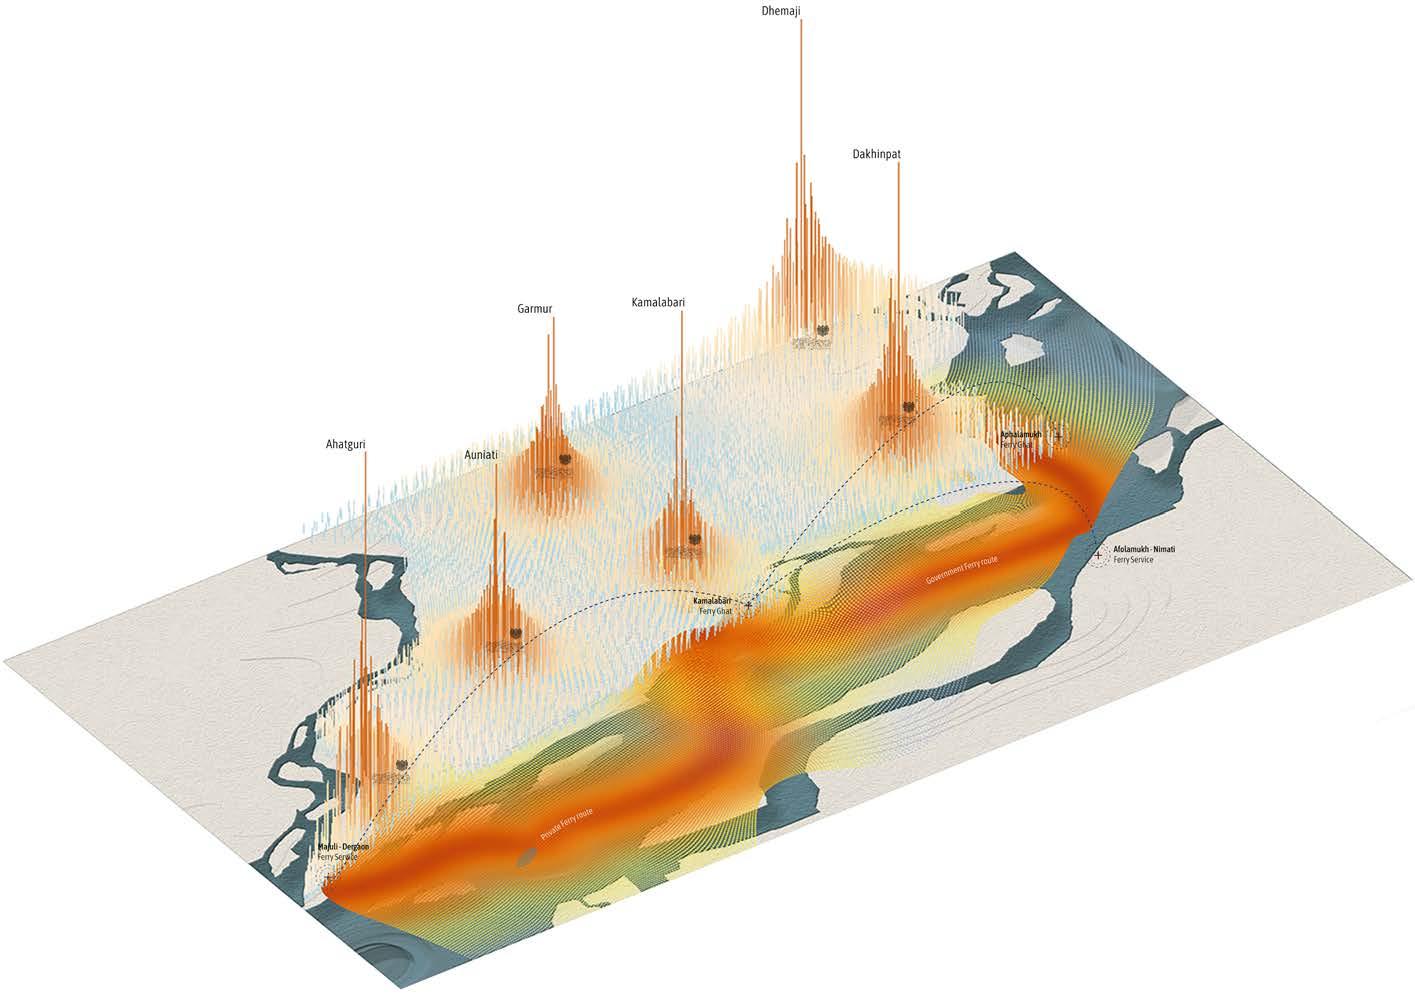
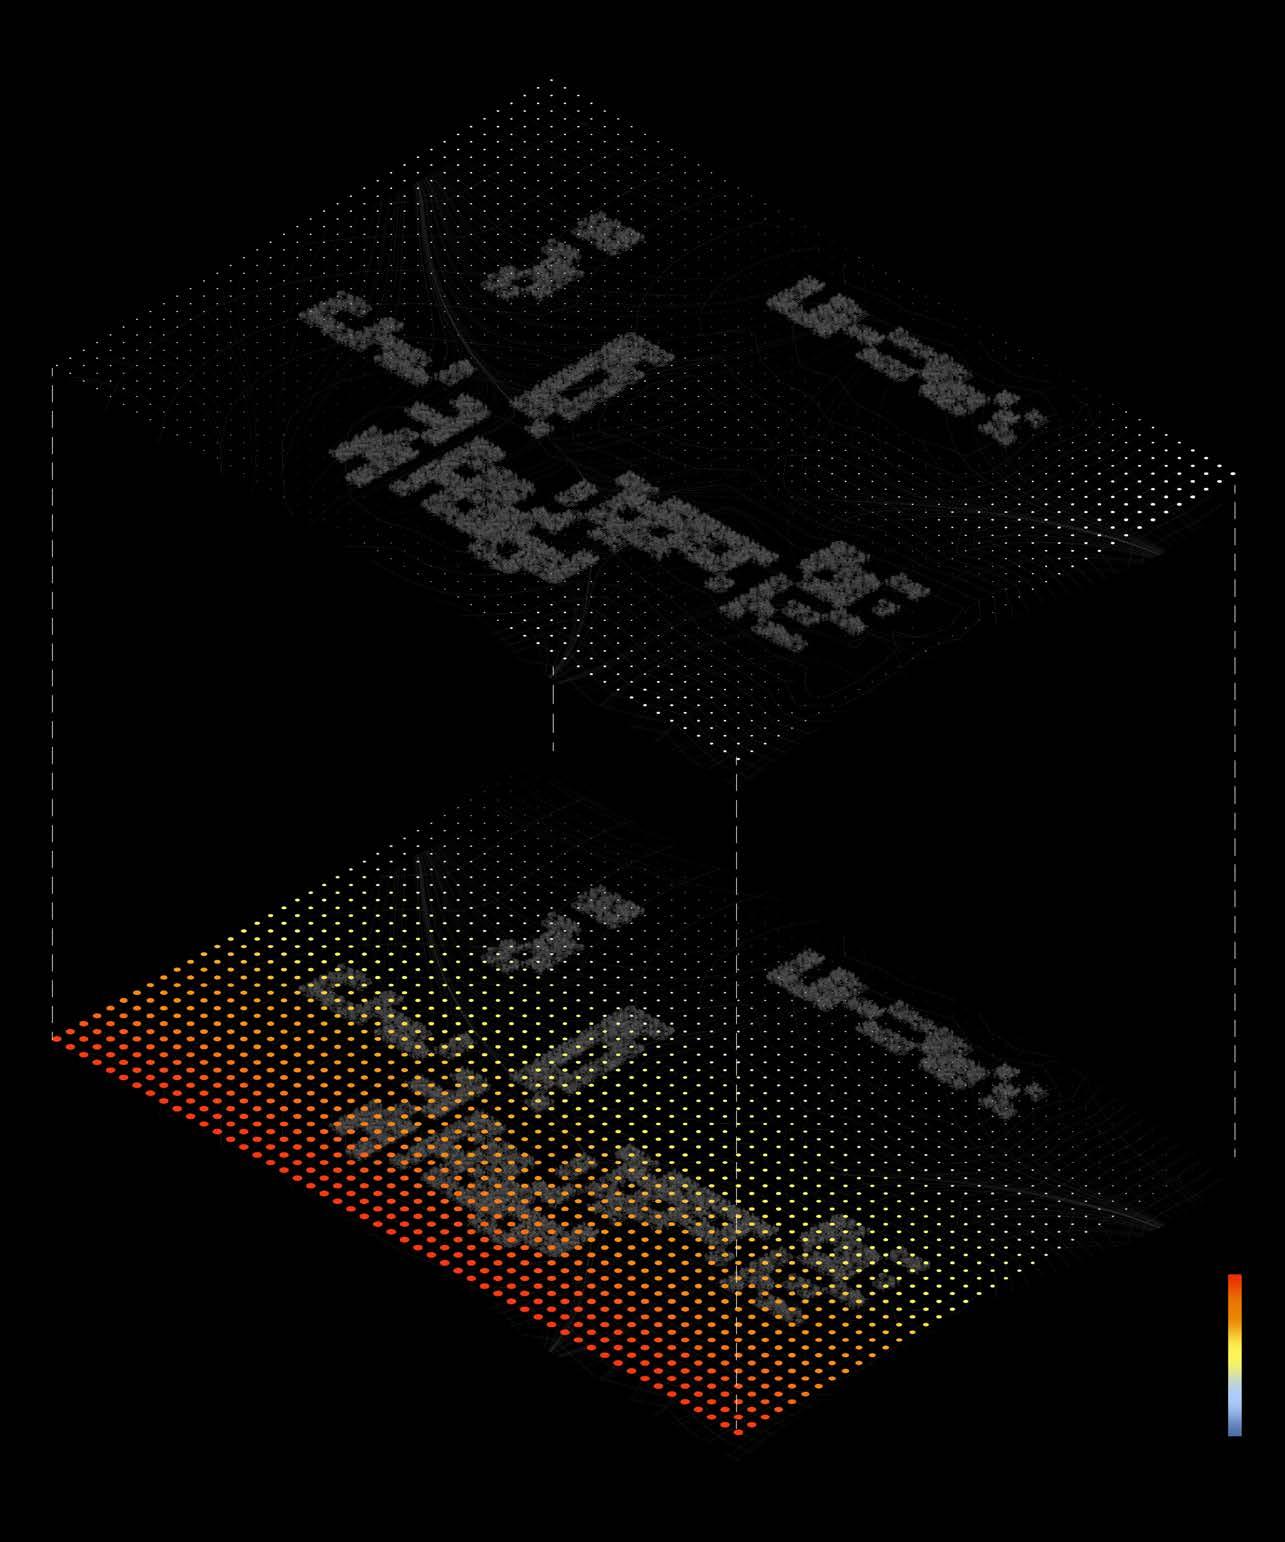
Settlement Density in Relation to the Brahmaputra River System
(Fig. 5) represents a map depicting changes in population density among Majuli Island’s main villages, with vertical peaks indicating regions of high settlement. Settlements like Dhemaji, Dakhinpat, Kamalabari, Garamur, Auniati, and Ahatguri arise as the primary hubs, clearly setting themselves apart from the less densely populated areas around them. The high-density regions serve as socio-spatial anchors on the island, concentrating cultural, economic, and infrastructural activities.
Fig. 07 Settlement Density in Relation to the Brahmaputra River System, Created by Author
The observed intensity patterns are intrinsically linked to the geomorphology of the Brahmaputra River and its dynamic floodplain. Settlement distribution reflects a search for fertile land suitable for agriculture, access to navigable waterways for connectivity and trade, and proximity to Satras and cultural centres that reinforce community life. Warmer zones on the map highlight the influence of government and private ferry routes extending from major ghats, which continue to be the primary mobility corridors and lifelines for the island.
When considered as a whole, these density distributions demonstrate the deeply embedded relationship among hydrological conditions, geography, and community clustering. They frame the current logic of land occupation and also provide a critical basis for investigating patterns of land use, infrastructure resilience, and potential future development pathways on Majuli. Thus, population density transcends its role as a mere demographic measure; it embodies the influence of environmental processes, cultural practices, and accessibility on the lived spatiality of the island.
Sources
5. Nayak, Debendra Kumar, and Mayuri Das. “An Assessment of Redistribution of Population in Majuli Island due to River Bank Erosion.” Department of Geography, North Eastern Hill University, Shillong.
Fig. 08 : Cultural heritage of Majuli, Credits : Oscar Espinosa
Credits Prachi Joshi
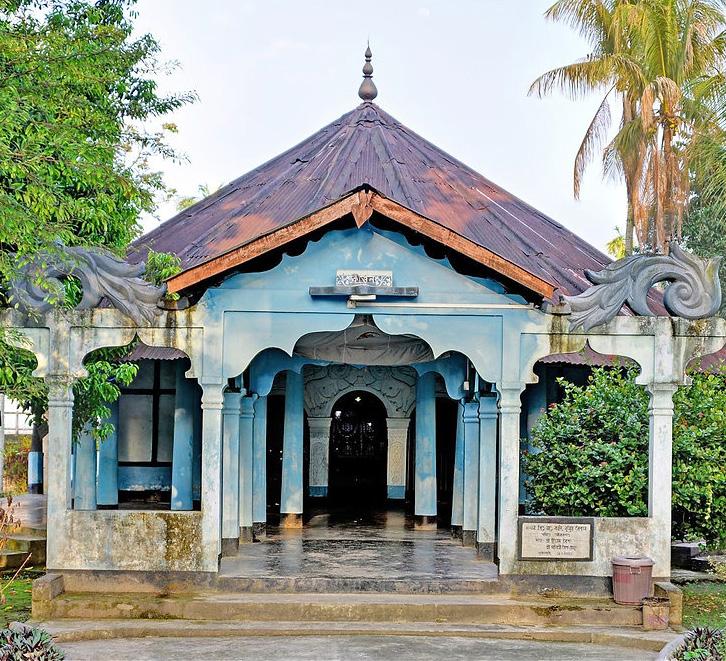
About seventeen years ago, efforts began to have Majuli Island recognised as a UNESCO World Heritage Site. Known as the world’s largest inhabited river island, Majuli is celebrated for its cultural and natural heritage. A defining aspect of Majuli’s identity is its network of Satras, Vaishnavite monastic institutions that act as spiritual and communal centres.
Each Satra functions as a largely self-sustained community, incorporating tradesmen such as carpenters, weavers, boat-makers, potters, and tailors. Surrounded by agricultural land, they produce their own food and maintain an independent, self-reliant way of life.
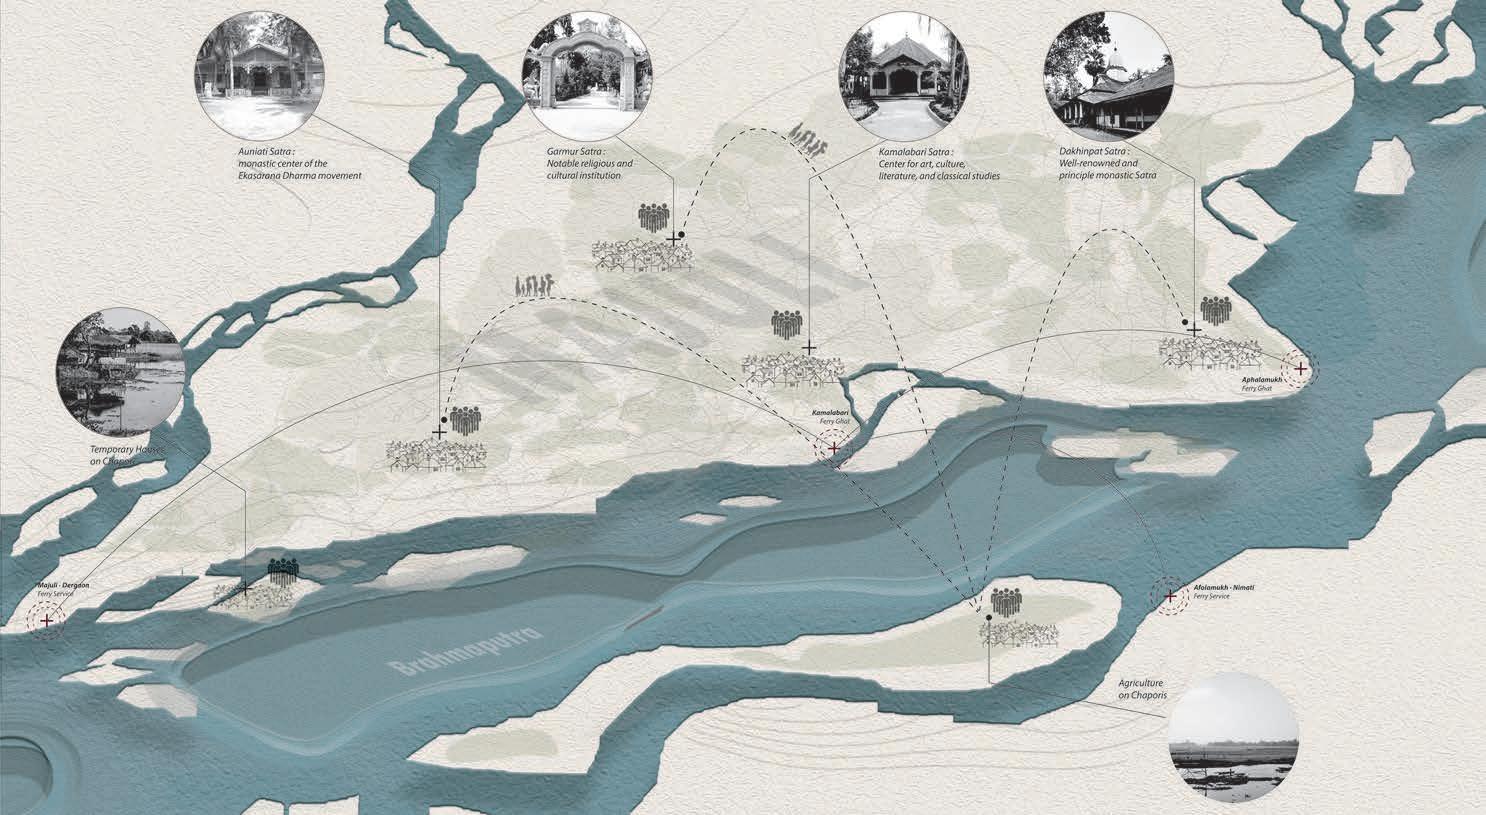
Fig. 09 : Prominent Satra locations in Majuli, Created by Author
6. Pawar, Vikram. “The Satras of Majuli on the Brahmaputra.” Tekton 3, no. 2 (September 2016): 58–75.
Identity of Majuli
Satras
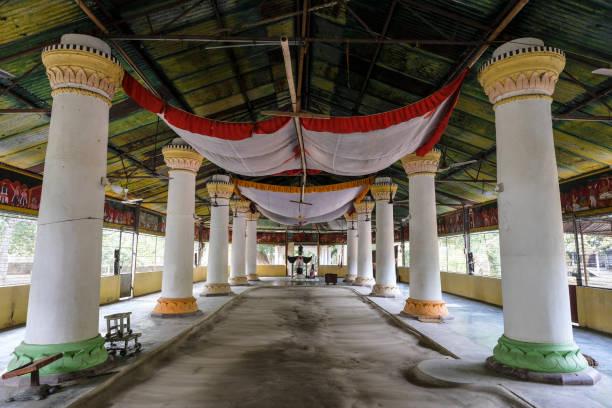
Fig. 10: Sri Sri Uttar Kamalabari Satra, Credit: Dibankkita Saha
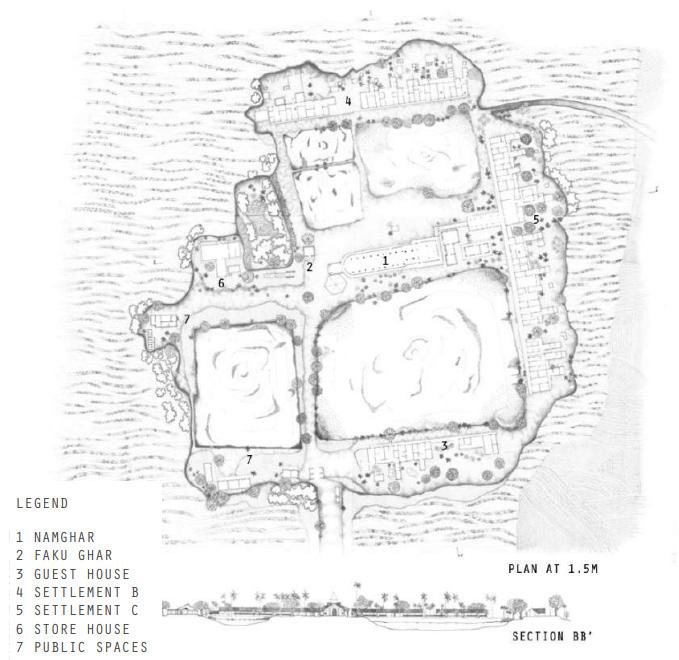
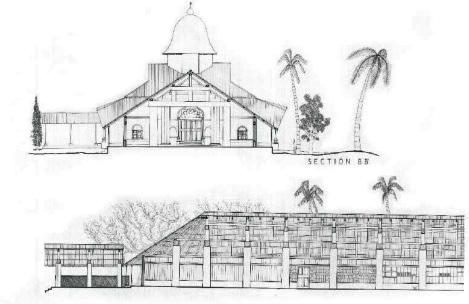
The layout of a Satra follows a formal grid pattern, with the Namghar (prayer hall) and the Manikut (the innermost sanctum) placed at the center. Around these core structures are other important spaces like the entrance gateway (Karpat), the Satradhikar’s (head priest’s) residence, living quarters for disciples, a guest house, a storage area, and more. This arrangement naturally divides the central courtyard into four sections. Each of these sections contains a pond that supports a variety of aquatic life, including fish. These ponds not only help recycle wastewater but also contribute to the local biodiversity.
Sources Pawar, Vikram. “The Satras of Majuli on the Brahmaputra.” Tekton 3, no. 2 (September 2016): 58–75.
Fig. 11 : Plan and Section of Dakhinpat Satra, Majuli, Credit: KRVIA Students’ work 2010
Fig. 13 : Plan of Kamalabari Satra, Majuli, Credit: KRVIA Students’ work 2010
Fig. 12 : Sections of Dakhinpat Satra, Majuli, Credit: KRVIA Students’ work 2010
Tourism, craft and performance
Tourism in Majuli has grown steadily due to the island’s unique cultural, ecological, and spiritual significance. Known as the cultural heart of Assam, Majuli is home to numerous satras that preserve classical dance, music, art, and literature. Tourists are drawn to the island’s serene landscapes, vibrant festivals like Raas Leela, and traditional tribal villages.
The satras of Majuli are not only spiritual centres but also major attractions that play a vital role in the island’s growing tourism. These monastic institutions, founded by Srimanta Sankardev and his disciples in the 15th and 16th centuries, represent the heart of the Assamese Vaishnavite tradition. For visitors, the satras offer a unique window into Majuli’s living heritage, combining religion, art, performance, and community life.
Tourists are particularly drawn to the monastic dances, music, and theatrical performances which are deeply rooted in devotional storytelling. These art forms, often performed during festivals or special rituals, provide immersive cultural experiences. Satras like Auniati, Kamalabari, and Dakhinpat are among the most visited, known for their architectural simplicity, peaceful ambience, and open hospitality.
Hindu monk wearing a traditional ceremonal mask, Credit:Danielrao
Fig. 14 : Masks used for celebrations and festivals in Satras, Credit:OscarEspinosa
Mask making at Chamaguri Satra in Majuli, Credit:Abhilekh Saikia
Sources : Gupta, Aishani. “Stories, Theatre and Worship: The Sacred Masks of Majuli.” Garland Magazine, June 1, 2025.
Social fabric and Economic activities
Majuli’s social fabric is shaped by a harmonious blend of indigenous communities, religious institutions, and traditional lifestyles. The island is home to diverse ethnic groups, including the Mishing, Deori, Sonowal Kachari, and Assamese Hindu populations, who coexist with strong community ties and shared cultural practices. Social life in Majuli is deeply rooted in collective participation, seasonal festivals, and rituals, many of which revolve around agricultural cycles and Vaishnavite traditions upheld by the island’s satras. These monastic institutions not only serve as religious centres but also function as custodians of education, art, and social organization, reinforcing values of unity, discipline, and cultural identity.
Economically, Majuli is primarily agrarian, with a majority of its residents engaged in farming, cultivating crops like bamboo, rice, mustard and vegetables. Fishing is another major livelihood, given the island’s riverine geography. Traditional crafts such as handloom weaving, pottery, and mask-making, especially by artisans linked to satras, contribute to both local use and tourism-driven sales.
In recent years, eco-tourism and cultural tourism have emerged as supplemental sources of income, offering homestays, guided tours, and local products to visitors. Despite the growing tourism sector, the economy remains vulnerable to flooding, erosion, and infrastructure challenges, making sustainable development and climate resilience critical to Majuli’s future well-being.
Stock Photos, Ancient Civilization, Credit:chriss73
Fesitivals
Majuli’s festivals create a repetitive yearly cycle that influences social life and space use, reflecting the island’s rich cultural legacy and profound spiritual origins. While Bhaona and Paal Naam demonstrate Vaishnavite devotion via
holy theatre and nonstop chanting, celebrations like Bhogali Bihu honour the harvest season with communal feasting, singing, and joy. Raas Mahotsav draws sizable crowds into common cultural areas by showcasing scenes from Krishna’s life through elegant dance and music, fusing creative discipline with faith.
Fig. 15 : cultural festivals: Bhogali (Magh Bihu), Bhaona Festival, Paal Naam, Majuli Music Festival, Raas Mahotsav, Ali-Aye-Ligang (Mising Tribe Festival), and Janmashtami.Credit Stock images
Temporary increases in human density and spatial activation are produced by these festivals, which serve as recurring amplifiers of social and economic activity. While Janmashtami is marked through dramatic plays and rituals, community customs like Ali-Aye-Ligang, performed by the Mising tribe,
Festivals in Majuli cause brief increases in population and spatial activity. The Majuli Music Festival, Janmashtami, and Ali-Aye-Ligang all improve community relations, boost local economies, synchronise agricultural cycles, and draw attention to the necessity of flexible public areas.
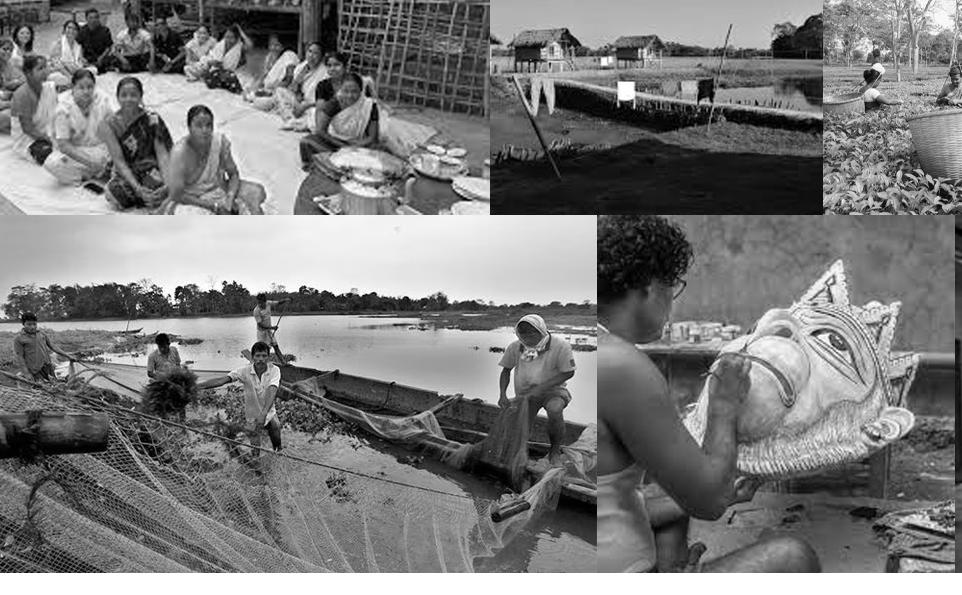
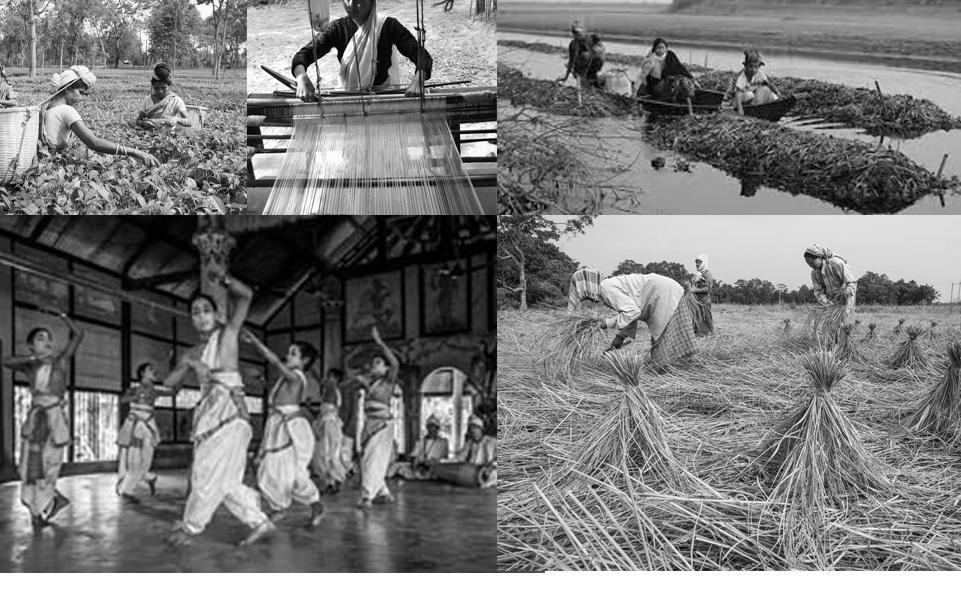
Work & Occupation
Majuli’s life is formed by land, water, and memories through her work. Traditional jobs are a part of everyday life on the island, not something distinct from it. Every practice represents generations of shared expertise,
from the meticulous carving of ritual masks to the slow weaving of linen, from fishing in braided rivers to working the land, bamboo and clay.
Fig 16. traditional livelihoods and crafts: mask making, clothes weaving, fishing, bamboo and cane craft, agriculture, and horticulture and pottery. Credit Stock images
Families are supported by these means of subsistence, which also preserve centuries-old skills. Local materials are transformed into tools and artwork through bamboo and cane crafts. Seasonal cycles are followed by horticulture and agriculture, which are informed by a deep knowledge of the ground and river.
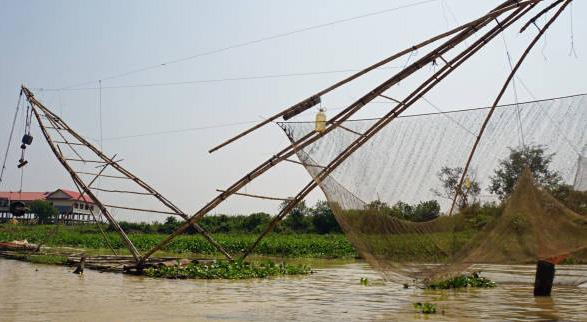
Fishing, with methods tailored to changing waterways, is a tradition and a means of subsistence. Making masks and pottery has spiritual and cultural significance that connects daily work to festivals, performances, and beliefs.
Fig. 16 : The Brahmaputra river seen from space. Source: Thomas Pesquet, ESA.
BRAHMAPUTRA
RIVER
Brahmaputra River : Dynamics, 9th largest river in the world by discharge
Originating near the Mansorovar Lake (Angsi Glacier) in Tibet, the Brahmaputra River transverses through the cold deserts of the region for a distance of 1625 km, where it is known as the Yarlung Tsangpo River. The river enters into the state of Assam with a very gentle slope after taking a very rapid descent in heights in Arunachal Pradesh. This region is characterised by the alluvial fans with large deposits of sediments carried by the river and its tributaries. Once it enters into the plains of Assam, it is fed by numerous tributaries and due to sudden change in channel gradient, it takes a braiding pattern. Hence, Majuli, the largest riverine island in the world, was formed in the mid-channel of the river.
The River Brahmaputra is far more than a geographical feature in Assam, it is a cultural lifeline that flows through the collective consciousness of its people. Its presence is deeply embedded in local folklores, songs and literature, where it is often personified as a living being with moods, rhythms, and divine significance.
In folk songs and dances, the Brahmaputra becomes a recurring theme that reflects the joys and sorrows of life along its banks. The river’s flow is mirrored in the Bihu dance and music, which celebrate agrarian cycles tied to the river’s seasonal behaviour. Folk art, including motifs in textiles and paintings in manuscripts or on murals, frequently incorporate symbols of the river, signifying its presence in daily life.
The river being a dynamic source also plays a significant role in the economy of Majuli. The alluvial deposits by the river and its tributaries make it one of the most agriculturally productive regions of the country. In addition to agriculture, fishing forms the backbone of its seasonal livelihood.
Seasonal flooding, especially during the monsoon months, further adds to this erosion as the river frequently overflows and encroaches upon the island’s edges. Land loss as a consequence of riverbank erosion not only threatens the existence of infrastructures or agricultural lands near to the riverbank but also poses threat to aquatic habitats and causes sedimentation downstream due to the generation of fine-grained sediments (Darby & Thorne, 1995). In India, most of the hydrological challenges are owed to the high sediment load of the rivers which ultimately results in riverbed aggradations, bank erosion and channel widening (Nanson and Hickin, 1986).
Additionally, the Brahmaputra’s natural tendency for channel migration, where it periodically shifts its course, contributes to the submergence of existing land while simultaneously forming new but unstable sandbars elsewhere. This suggests an urgent need for multifaceted approaches of effective spatial planning to protect this geo-heritage from being further engulfed by the river Brahmaputra and Subansiri.
Souce : 12. Bridge, John S. 1993. “The Interaction between Channel Geometry, Water Flow, Sediment Transport and Deposition in Braided Rivers.” Geological Society, London, Special Publications 75 (January): 13–71. https://doi.org/10.1144/GSL.SP.1993.075.01.02. Darby, Stephen E., and Colin R. Thorne. “Effect of Bank Stability on Geometry of Gravel Rivers.” Journal of Hydraulic Engineering 122, no. 8 (1996): 443–54. https:// doi.org/10.1061/(ASCE)0733-9429(1996)122:8(443) Nanson, G. C., and E. J. Hickin. “A Statistical Analysis of Bank Erosion and Channel Migration in Western Canada.” Geological Society of America Bulletin 97, no. 4 (1986): 497–504. https://doi.org/10.1130/0016-7606(1986)97<497:ASAOEB>2.0.CO;2.
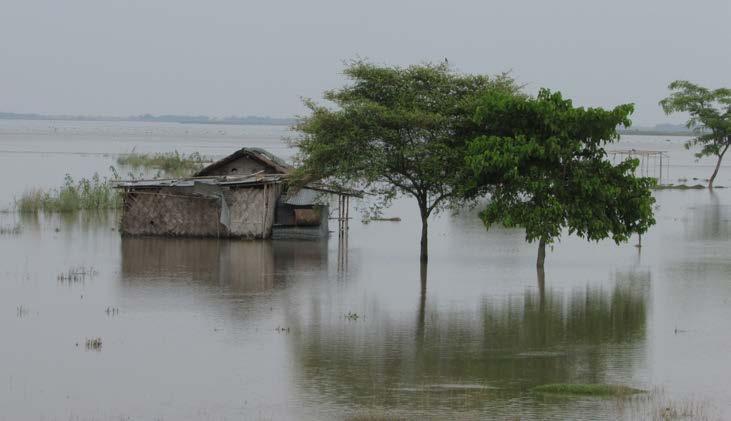
Fig. 18 : Floods in the Brahmaputra river valley. Photo by Mitul Baruah.
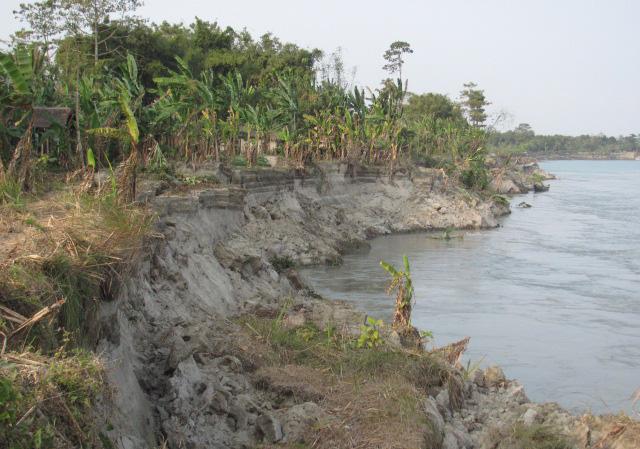
Fig. 19 : River bank erosion along the Brahmaputra destroying agricultural land. Photos by Mitul Baruah.
https://www.google.com/maps/place/Majuli
https://www.google.com/maps/place/Majuli
https://www.google.com/maps/place/Majuli
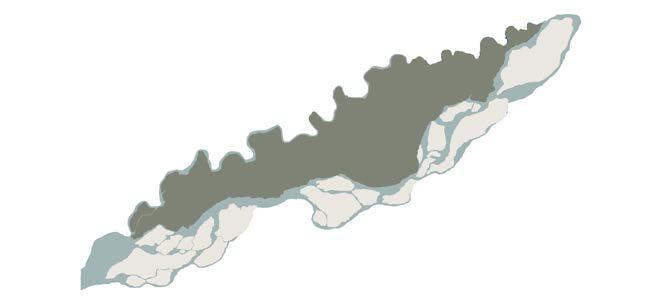
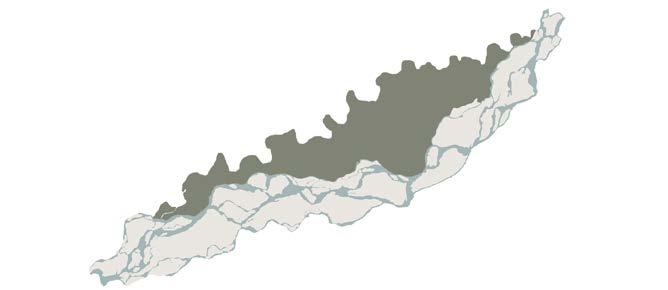
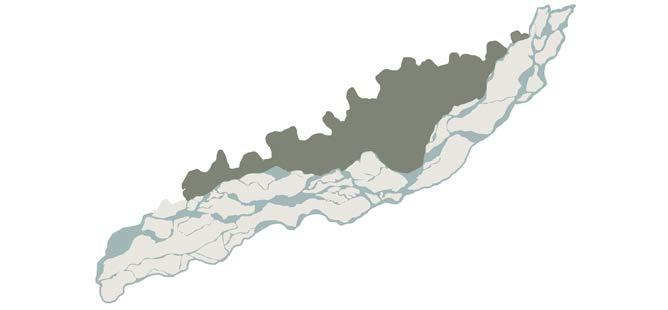
Fig. 20 Changing landmass of Majuli Island
Changing Landmass
Over the last 100 years, Majuli’s area has been significantly diminished due to the unceasing and changing forces of the Brahmaputra River. Majuli, once acknowledged as the largest river island globally, spanning over 1,200 square kilometers, has gradually succumbed to erosion and now comprises less than 50% of its original area. Research indicates that the average annual degradation rate from 1975 to 2021 was 3.07 km², underscoring the magnitude and enduring nature of this change.
The main cause of this loss is severe riverbank erosion, which worsens during the monsoon months when the Brahmaputra floods. The river’s braided structure is vital to this process: the Brahmaputra, which bears one of the heaviest sediment loads of any river system globally, perpetually divides into several shifting channels. With the increase of water velocity, it erodes the banks, undermining the soil and carrying off large areas of land.
The river’s constant reshaping creates a delicate balance. Land is eroded from one bank while the Chaporis, form elsewhere. However, these chaporis lack stability and are often not suitable for long-term settlement, resulting in displaced families having to rebuild on uncertain ground. As fertile farmland is lost, agriculture is jeopardized and cultural and religious institutions like the Satras must endure frequent relocations because of rising waters. Erosion has significantly outstripped deposition over time, resulting in Majuli’s ongoing vulnerability, with threats to both its physical geography and cultural identity.
:
13. Dey,
“Majuli—the world’s largest river island might just disappear in the future”. The Times of India. ISSN 0971-8257. Retrieved 9 February 2025.
14. Manogya Loiwal (18 February 2014). “Majuli, world’s largest river island is shrinking and sinking”. India Today. Retrieved 5 April 2016.
15. Sahay, Avijit, and Nikhil Roy. “Shrinking Space and Expanding Population: Socioeconomic Impacts of Majuli’s Changing Geography.” Focus on Geography 60, no. 3 (2016). https://doi.org/10.21690/foge/2016.60.3f
Fig. 21 : Map of Majuli in 1975, Created by Author
Fig. 22 : Map of Majuli in 2000, Created by Author
Fig. 23 : Map of Majuli in 2015, Created by Author Source
Panchali.
WHAT IS A CHAPORI ?
Chaporis
Brahmaputra carries a high sediment load up to 500 million tonnes per year. The velocity of the river drops at certain points due to variable reasons resulting in the deposition of sediments creating temporary islands and silt bars called Chaporis. These formations can be temporary, seasonal, or semi-permanent, depending on river dynamics, making them one of the most unstable and unpredictable land typologies in the region.
Formed through the continuous process of sediment deposition, chaporis are lowlying siltbars or islands that emerge as the river changes course and deposits silt and sand. Despite their fragile nature, the Chaporis in Majuli play a vital role in the livelihood of the people by hosting vibrant ecosystems and human communities. These silt bars are used for seasonal agriculture, grazing, and fishing.
These land masses are highly dynamic in nature, often shifting, eroding, or reforming with each flood season. Seasonal flooding, rapid erosion, and limited access to infrastructure make these areas highly vulnerable. Residents often face displacement and loss of livelihood with each monsoon cycle. Despite this, chaporis continue to be inhabited due to their fertile soil and access to water resources, highlighting a complex relationship between people and a shifting landscape.
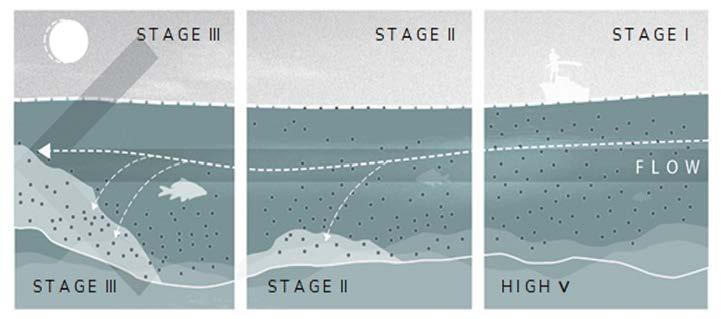
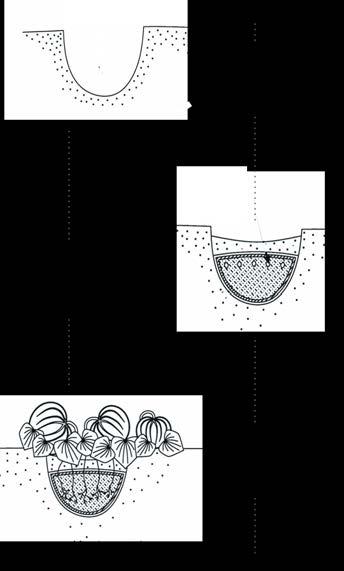
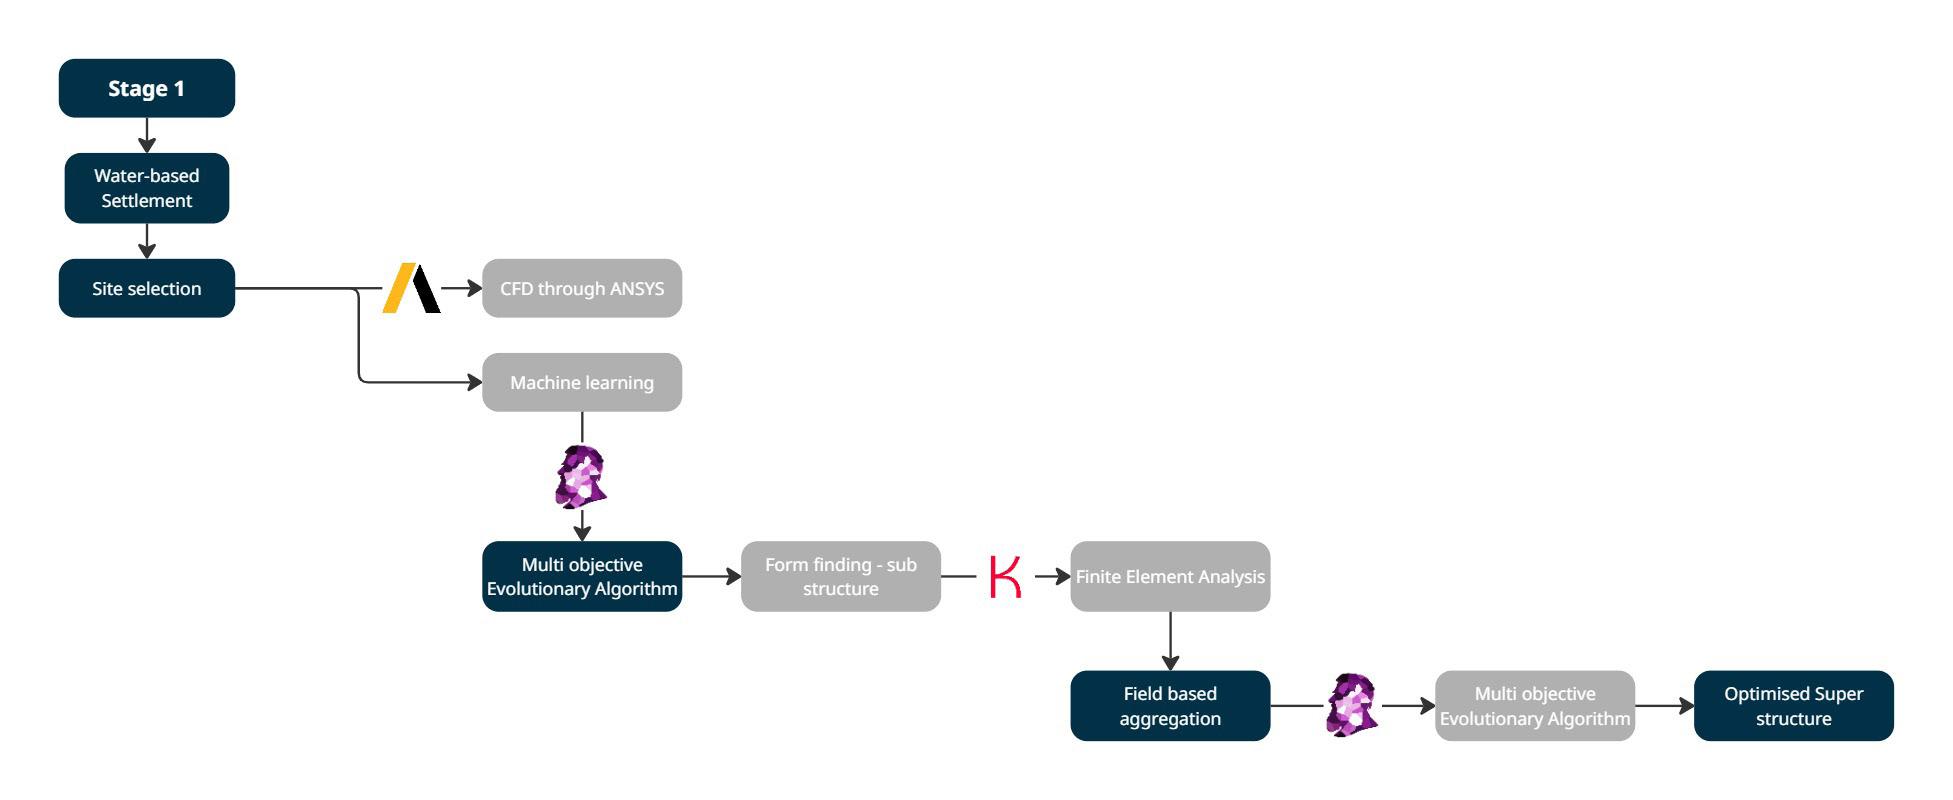
Stage 1 :
During the first stage, the river moves quickly and energetically, transporting significant quantities of suspended sediments like clay, silt, and sand. The vigorous current maintains the movement of these particles, carrying them downstream and preventing them from settling.
Stage 2 :
When the flow starts to decelerate, the river’s ability to carry loads diminishes. Particles with greater weight, such as sand and small gravel, begin to accumulate on the riverbed, creating initial mounds of deposited material. These accumulations beneath the surface of the water serve as a base for additional growth.
Stage 3 :
The mounds grow higher with ongoing accumulation until they emerge above the water’s surface. These elevated landforms evolve into sandbars (Chaporis), which may eventually become stabilized by vegetation but are still susceptible to erosion and the effects of shifting currents.
Fig. 24 : Stages of Chapori formation, Created by Author
Formation of Chapori
River blocks
Reduced flow velocity causes sediments to settle, forming blocks that alter the river’s path.
River turns
Sharp bends in the river slow down the current, encouraging deposition and shaping new landforms
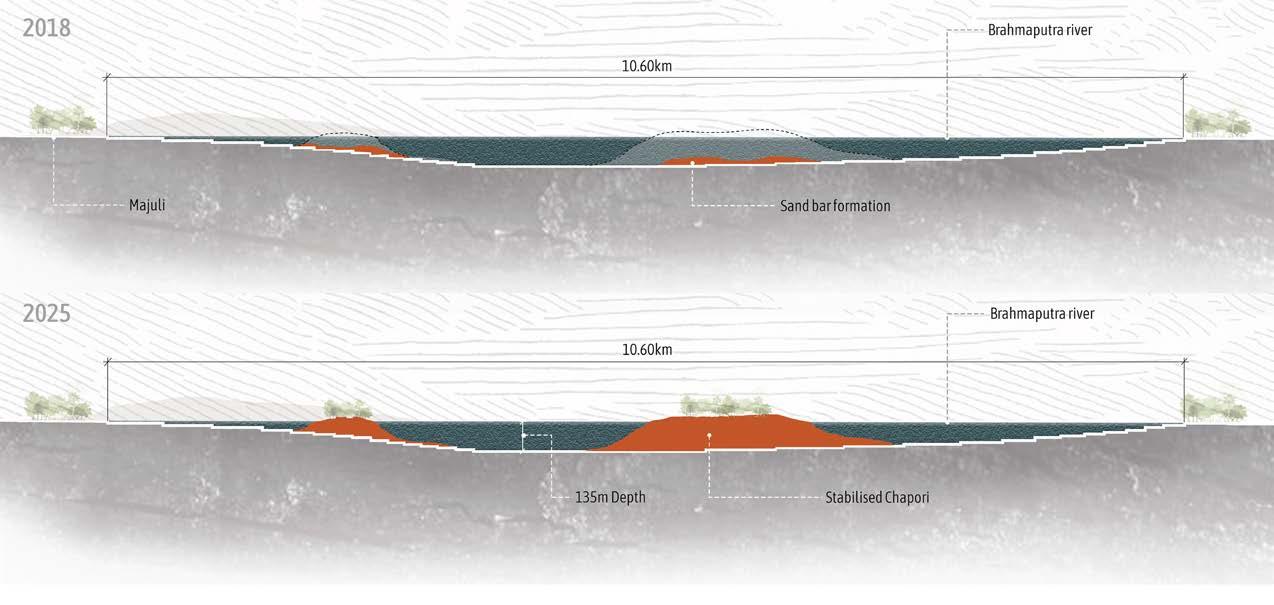
Section AA (Formation of Silt Bar)
Section AA ( Stabilised silt bar – Chapori)
Fig. 25 Sections of Chapori formation, Created by Author
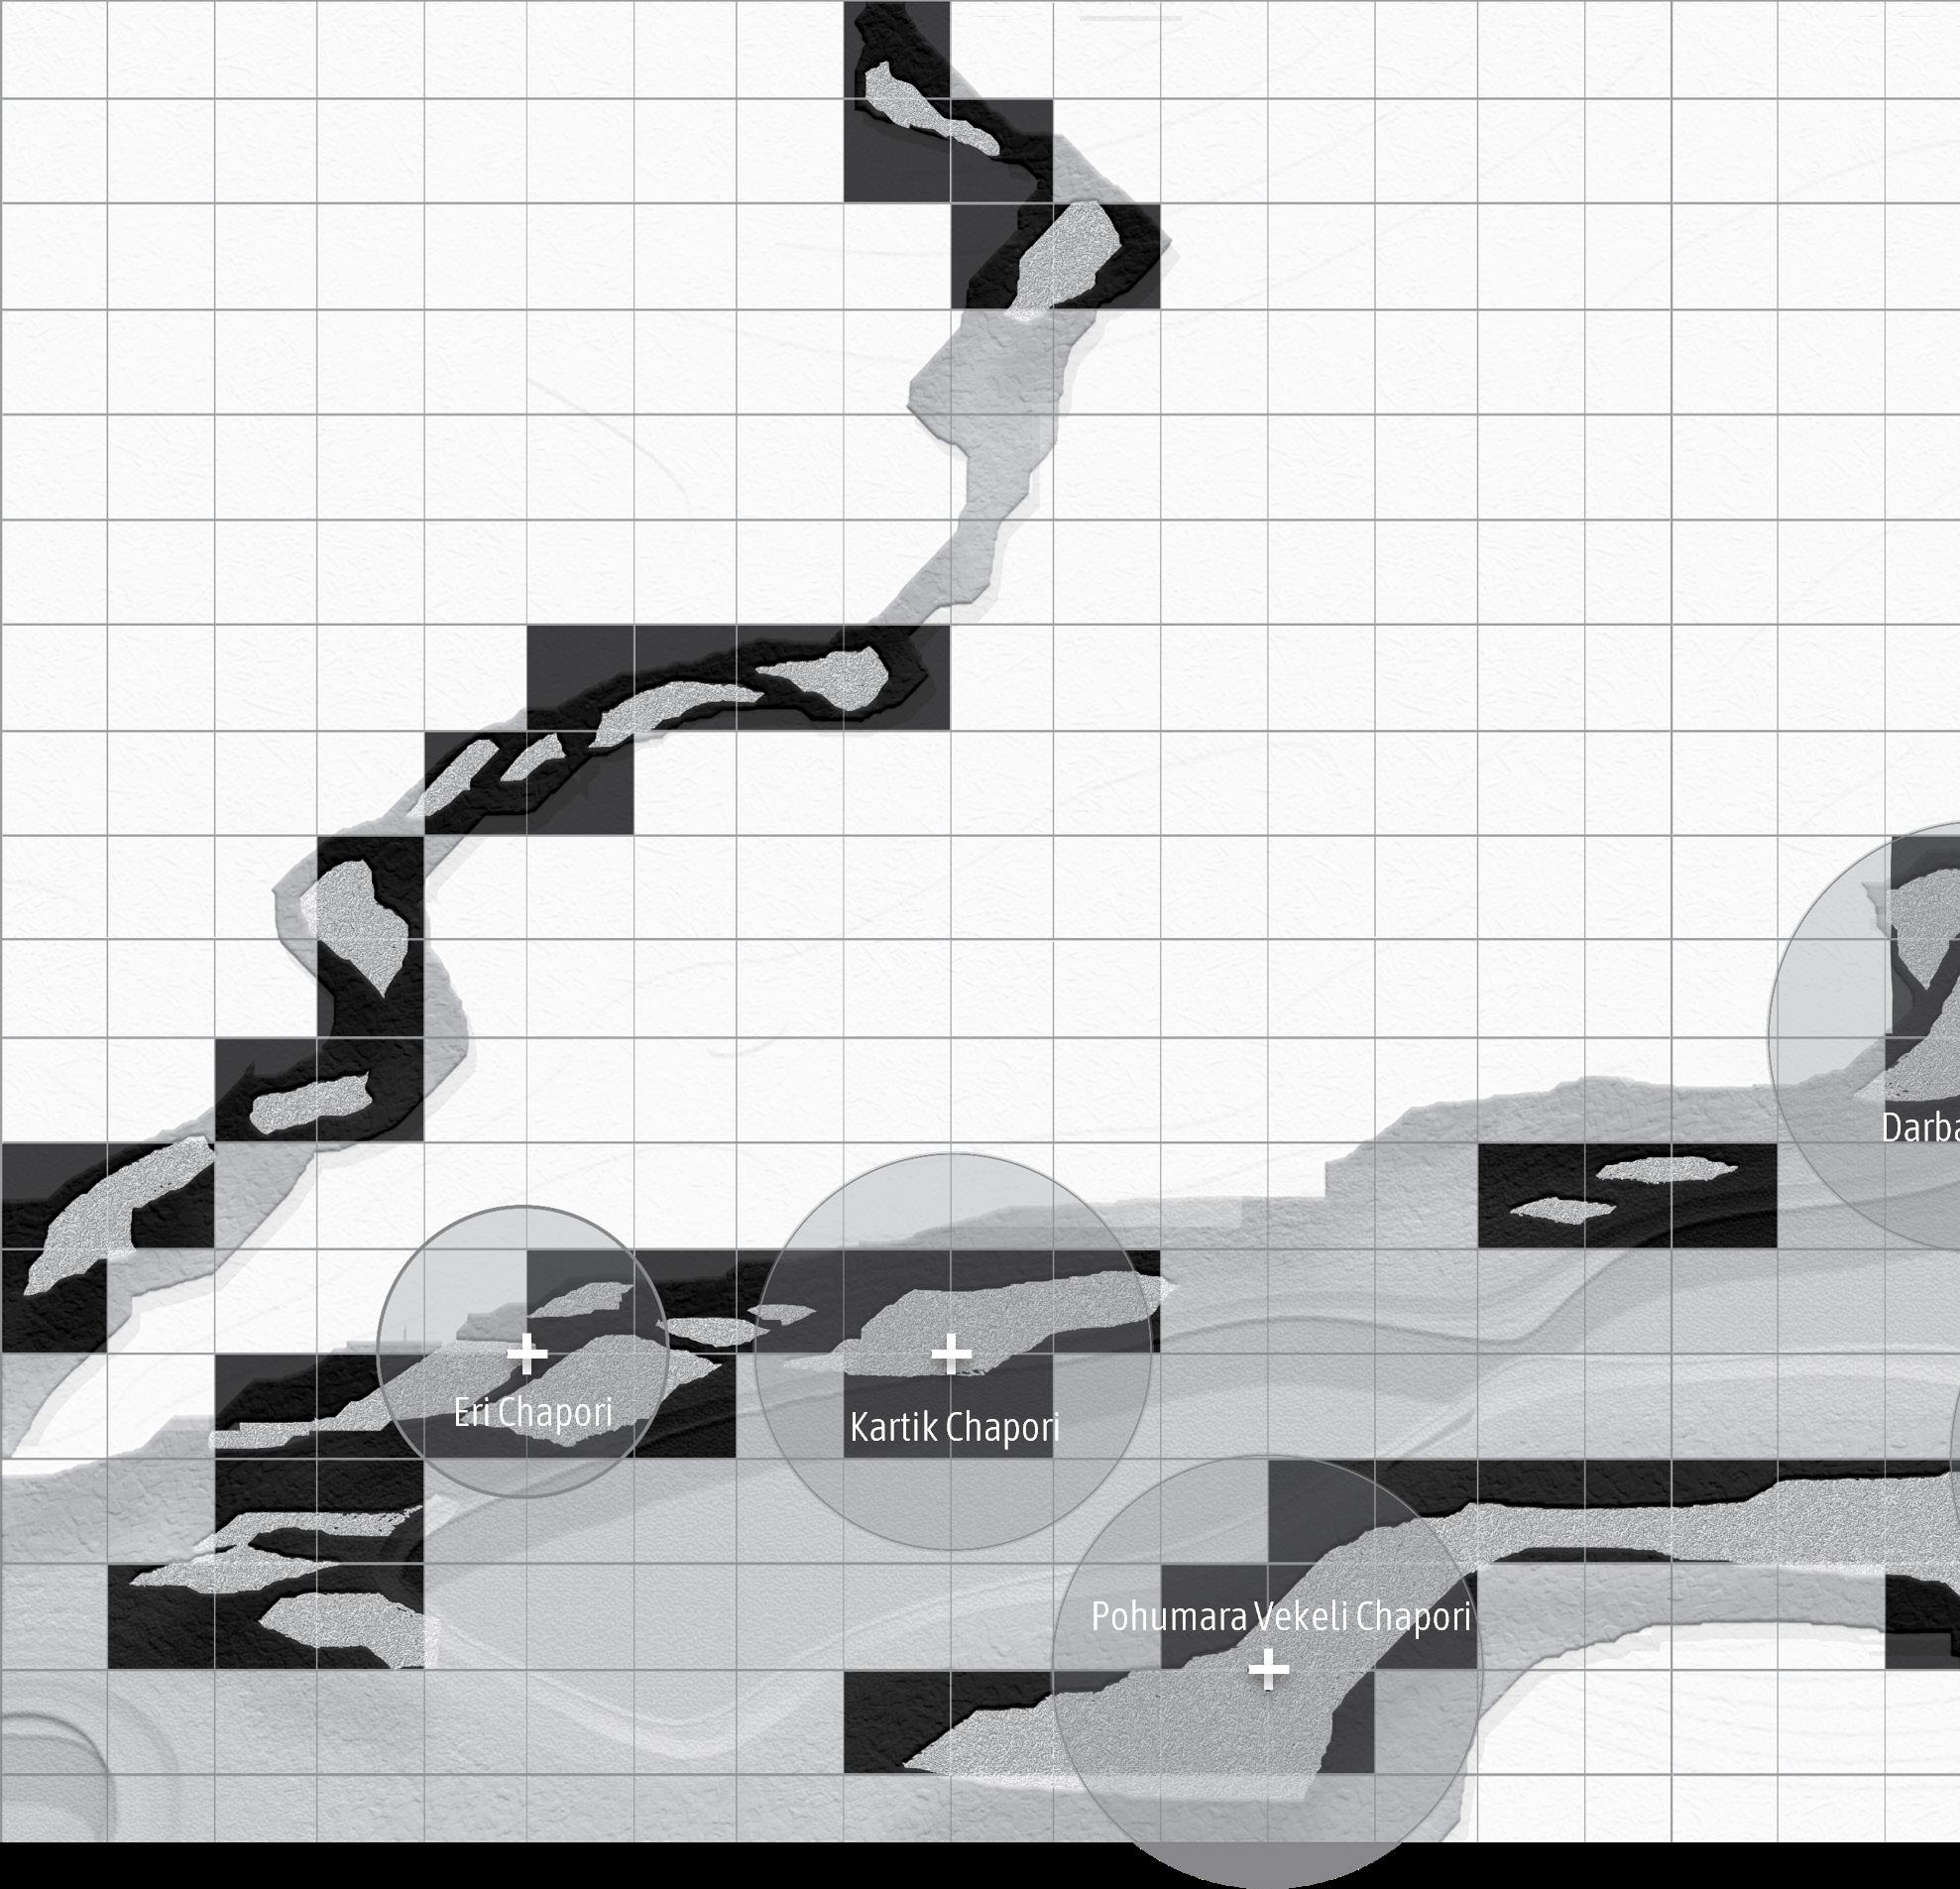
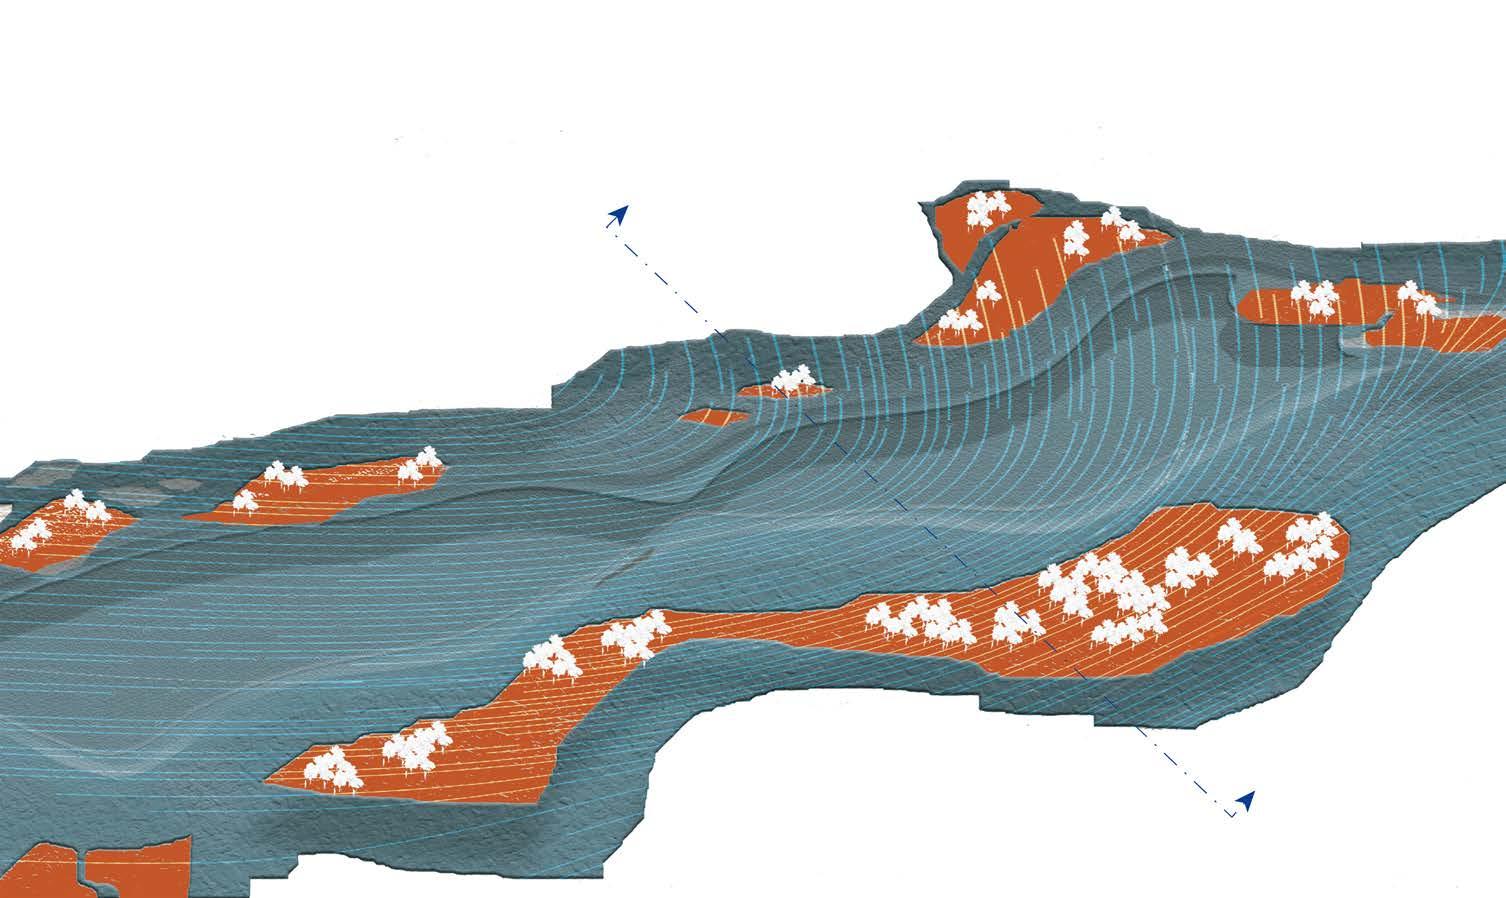
Fig. 26 View highlighting existing Chaporis in Majuli, Created by Author
Significance and history
Chaporis hold both historical and socio-cultural significance in the context of Majuli’s landscape. Historically, these transient landforms have served as crucial spaces for settlement, agriculture, and grazing, particularly for marginalized and displaced communities. Over generations, local populations have adapted to the unpredictable nature of chaporis, developing resilient lifestyles deeply connected to the rhythm of the Brahmaputra River.
Culturally, they reflect the enduring relationship between the people and the river, embodying themes of mobility, adaptation, and survival. However, increasing erosion and climate variability have made life on chaporis more precarious, highlighting their historical importance while underscoring the urgent need for sustainable interventions.
Chaporis are highly dynamic, often shifting location entirely due to strong river currents and channel migration. The above diagram illustrates how these sandbars evolve over time, initially unstable, they can begin to stabilize when vegetation takes root. This plant growth helps anchor sediments, reducing erosion and allowing the chapori to grow. Stabilized chaporis eventually support agriculture or grazing, though they remain vulnerable to future floods and river shifts.
Stabilisation of Chaporis
The stabilisation of the transient siltbars formed along the Brahmaputra, depends on natural sedimentary processes and on human activity. In their initial stages, these landmasses are highly unstable, composed of loose alluvial deposits that are easily eroded or reshaped by the river’s currents.
However, once communities begin to occupy these emerging lands, practices such as agriculture, cultivation, and small-scale settlement play a critical role in consolidating them. The act of tilling the soil, planting crops, and nurturing vegetation binds the top layer of soil, gradually increasing soil cohesion and reducing erosion. Root systems of cultivated plants help trap moisture and sediments, anchoring the fragile ground. Over time, this cycle of human engagement accelerates the natural process of land stabilisation, transforming chaporis from impermanent siltbanks into habitable and productive landscapes.
S., A. K. Das, A. Hussain, and M. S. Kumar.
Fig. 27 : Sand stabilisation process, Created by Author
Silt Bar Deformation Index
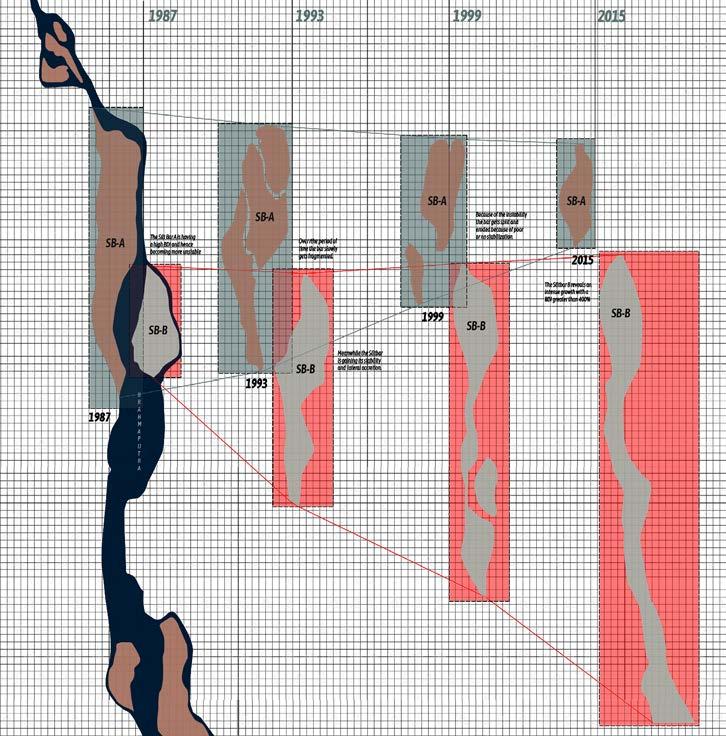
Chaporis transformation must be quantified using morphological indicators that reflect erosion, accretion, and migration over time in order to surpass qualitative observation. Braid silt bars are formed by changes in flow velocity, sediment load, and channel shifts, making it essential to use a systematic method for assessing their stability and long-term trends.
As a key measure for evaluating the morphodynamical behavior of braid silt bars in fluvial systems, the Bar Deformation Index (BDI) is employed. The BDI measures bar morphology changes by assessing the spatial displacement and aerial variation of silt bars at various temporal snapshots. A greater BDI correlates with increased morphological instability, suggesting that the bar is very dynamic and susceptible to deformation; conversely, a lower BDI indicates relative stability and sediment accumulation.
Two silt bars in the studied river segment (Fig. 27), designated SB-A and SBB, displayed differing morphodynamical characteristics during the years 1987, 1993, 1999, and 2015. SB-A showed a continuously elevated BDI, indicating considerable spatial fragmentation and eventual relocation from its initial position. These observations corroborate the dynamic and unstable characteristics of SB-A, which render it very vulnerable to erosion and morphological breakdown.
In contrast, SB-B demonstrated a low BDI and an increase of more than 400% in aerial extent, indicating improved natural stabilization and sediment accumulation. This implies that a low BDI promotes long-term morphological persistence and bar growth when hydrodynamic conditions remain consistent.
The comparative analysis highlights that while high BDI values may initiate morphological change and sediment redistribution, driven by flow velocity, pressure gradients, and depth variations, a reduction in BDI is essential for bar stabilization and long-term ecological integration. Therefore, BDI acts as both a diagnostic and prognostic tool for understanding sedimentary processes in dynamic fluvial environments.
Source Sarma, Dipima. Rural Risk Assessment due to Flooding and Riverbank Erosion in Majuli, Assam, India. M.Sc. thesis, Faculty of Geo-Information Science and Earth Observation, University of Twente, March 2013. Begum, S., A. K. Das, A. Hussain, and M. S. Kumar. “Living in a Transient Riverine Environment: Environmental Stressors and Opportunities in the Braid Bars of Brahmaputra River.” Natural Hazards, advance online publication (2025). https://doi.org/10.1007/s11069-025-07253-9
Fig. 28 : Silt bar deformation process, Created by Author
Fig. 29 : Emerging Chaporis, Created by Author
Emerging Chaporis
Opportunity Space
Introducing River culture:
An examination of chapori dynamics and bar deformation reveals an important duality: although Majuli’s landmass is perpetually endangered by erosion and the movement of channels, these very processes also create new areas via the deposition of sediment. This paradox opens up an opportunity space in which loss and renewal coexist within the same ecological cycle. Chaporis can be viewed not just as unstable and transient, but rather their development can be seen as a basis for adaptive strategies that directly interact with the river’s morphodynamics.
River Culture (Wantzen, 2016) is based on the insight that current environmental change endangers both biological and cultural diversities in rivers and their basins. Riverscapes can be regarded as an interface of aquatic and terrestrial conditions, strongly controlled by complex interactions of many factors which include, hydrology, sediment transfer, soil-vegetation dynamics, biotic interactions and finally by land use. In the case of a river-floodplain system, the natural ecosystem functions include water as a means of transport, shelter, food resources and other prominent economic activities. The rhythm of the water has become an impulse generator for the organisation of the annually changing cultural activities as well as the livelihood of the people.
Considering the complex environmental and humanitarian challenges faced by Majuli, ranging from severe land erosion and seasonal flooding to cultural displacement and socio-economic vulnerability, this dissertation aims to explore architectural strategies that foster a sustainable and regenerative relationship with the environment. Rooted in the principle of extending architecture’s timeline into the future, the primary intention is to move beyond short-term or reactive solutions and instead envision a built environment that is adaptive, enduring, and symbiotic with its ecological context.
Central to this vision is the commitment to maintain a healthy, non-extractive, and non-polluting interaction with the natural systems of Majuli. This involves rethinking materials, construction processes, and spatial organization to minimize ecological impact while enhancing resilience.
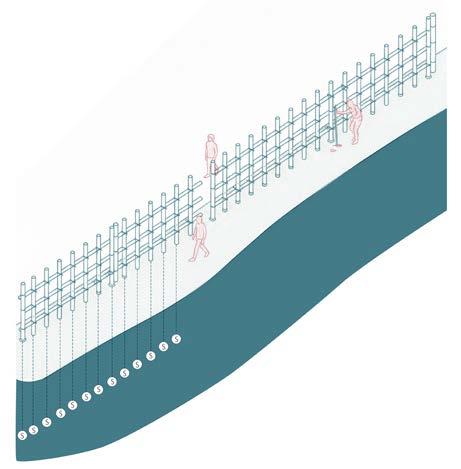
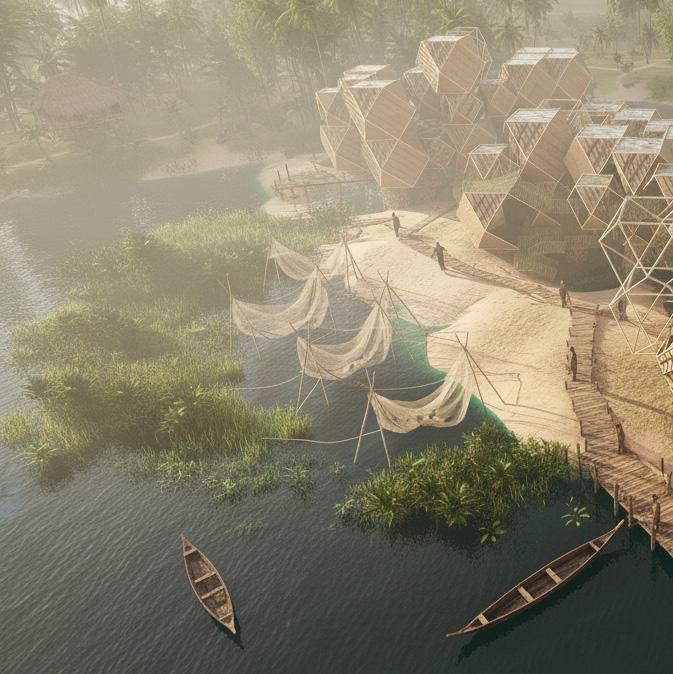
The primary intervention focuses on strategically guiding sediment deposition along the eroded banks of Majuli by installing flood-resilient stilt structures that serve both functional and ecological purposes. These stilts are designed not only as supports for permanent, elevated housing units but also as physical barriers that slow down river flow in targeted areas, encouraging sediment to accumulate over time. This controlled deposition process facilitates the formation of new chaporis. Unlike naturally occurring, unstable sandbars, the new chaporis are artificially stabilized through planting of vegetation, structural reinforcement, and adaptive infrastructure.
As these Chaporis grow and mature, they gradually integrate with the existing landmass, effectively becoming an extension of the mainland. This approach enables displaced residents to return to their ancestral lands with greater safety and permanence, while also contributing to the restoration of lost terrain.
Furthermore, this approach supports the expansion of the settlement network onto newly formed chaporis as well as the adjacent flood-prone mainland. Since this mainland currently lacks permanent habitation due to frequent flooding, it presents an opportunity for displaced communities, and the ancestral infrastructure that has moved to higher ground to return and re-establish themselves on their original lands. The primary goal of this settlement strategy is to regenerate lost land, restore housing, and rekindle the emotional connection to Majuli.
Source 16. Wantzen, Karl M., Aziz Ballouche, Isabelle Longuet, Ibrahima Bao, Hamady Bocoum, Lassana Cissé, Malavika Chauhan, Pierre Girard, Brij Gopal, Alioune Kane, Mercedes Marchese, Prakash Nautiyal, Paulo de Tarso Teixeira, and Maciej Zalewski. 2016. “River Culture: An Eco-Social Approach to Mitigate the Biological and Cultural Diversity Crisis in Riverscapes.” Ecohydrology & Hydrobiology 16, no. 1 (February): 7–18.
Majuli’s Existing Settlement:
Adaptation, Resilience, and Meaning
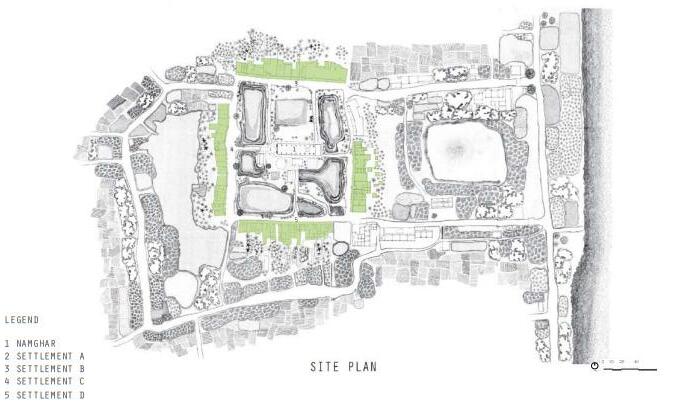
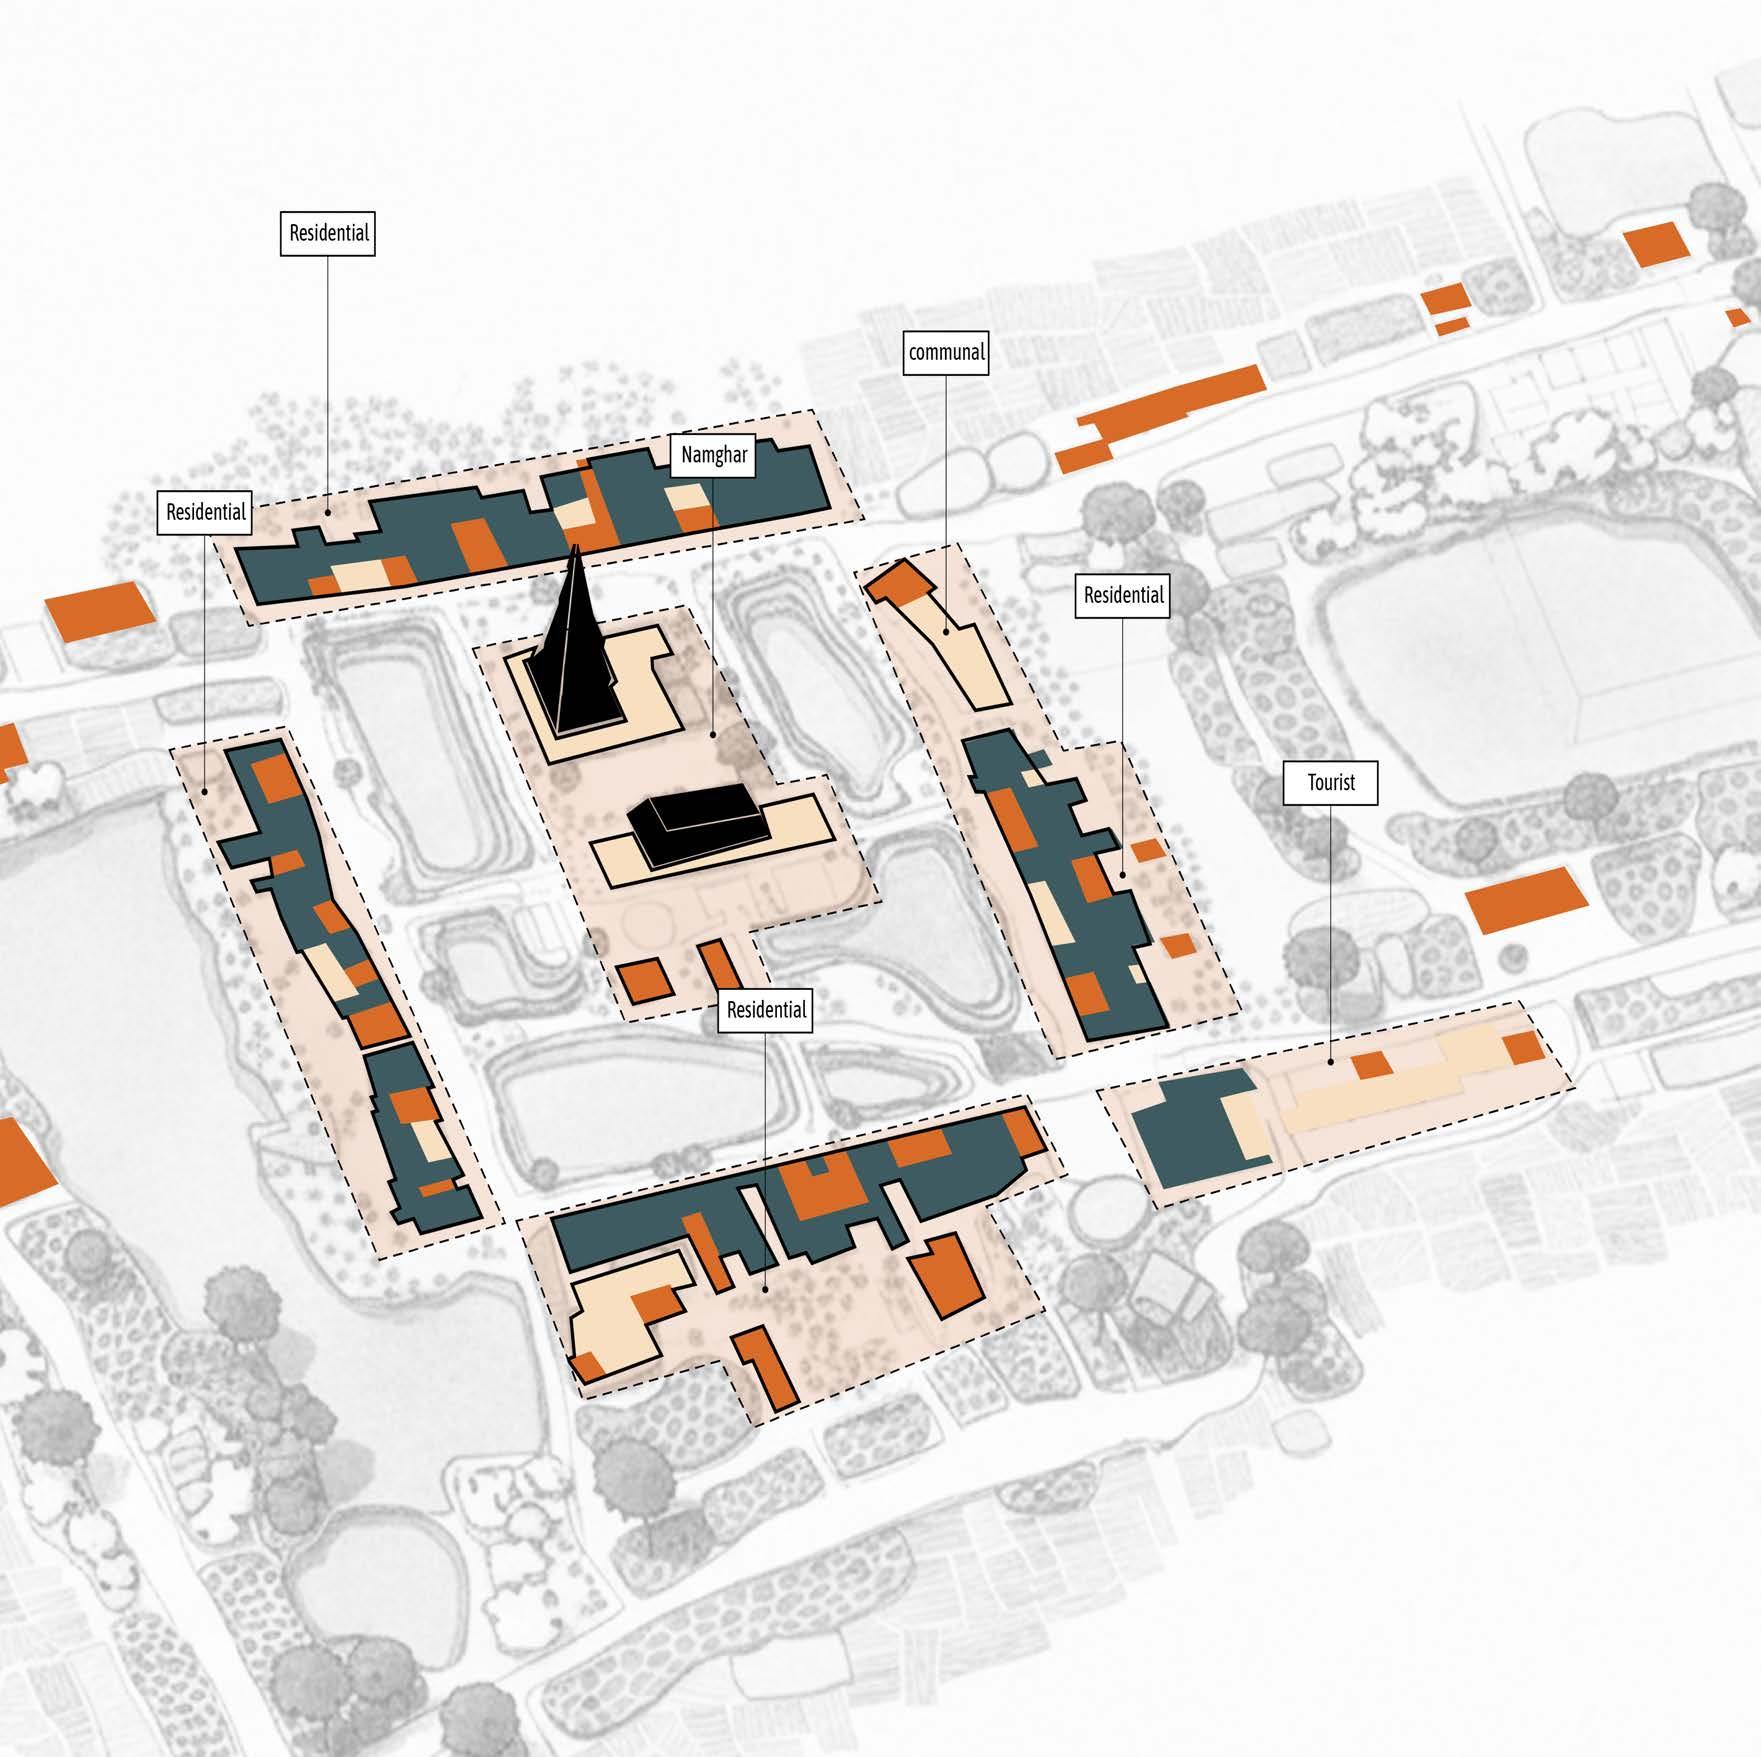
The existing plan of the Majuli site illustrates a highly adaptive settlement morphology shaped by hydrological forces and socio-cultural practices. At the core of the layout is the Namghar, the traditional communal and spiritual institution that anchors the surrounding settlement clusters. Its central position reinforces its role as both a cultural nucleus and a spatial organiser, around which residential units, circulation paths, and shared open spaces are arranged.
The pattern of ponds, wetlands, and vegetated buffers visible across the plan demonstrates an environment-conscious logic that has evolved in response to recurring floods and seasonal changes. These water bodies function simultaneously as ecological stabilisers, livelihood resources, and protective features. Residential clusters (Settlements A–D) follow an organic alignment along relatively elevated terrain, forming compact neighbourhood units that balance enclosure, accessibility, and environmental exposure.
Agricultural fields surrounding the built zones further emphasise the settlement’s dependence on agrarian and fishing-based economies. The porous interface between built structures, landscape elements, and water systems reflects a resilient, decentralised model of rural planning. This intricate relationship between cultural institutions, ecological systems, and spatial organisation provides a critical reference for our own design approach. It informs and inspires our proposed settlement strategy, ensuring that our intervention respects the cultural identity of Majuli, the ecological fragility of the site, and the lived experiences of its people.
The existing plan
Fig. 30 : Exisiting Plan of Kamalabari Settlement in Majuli region, Created by Author
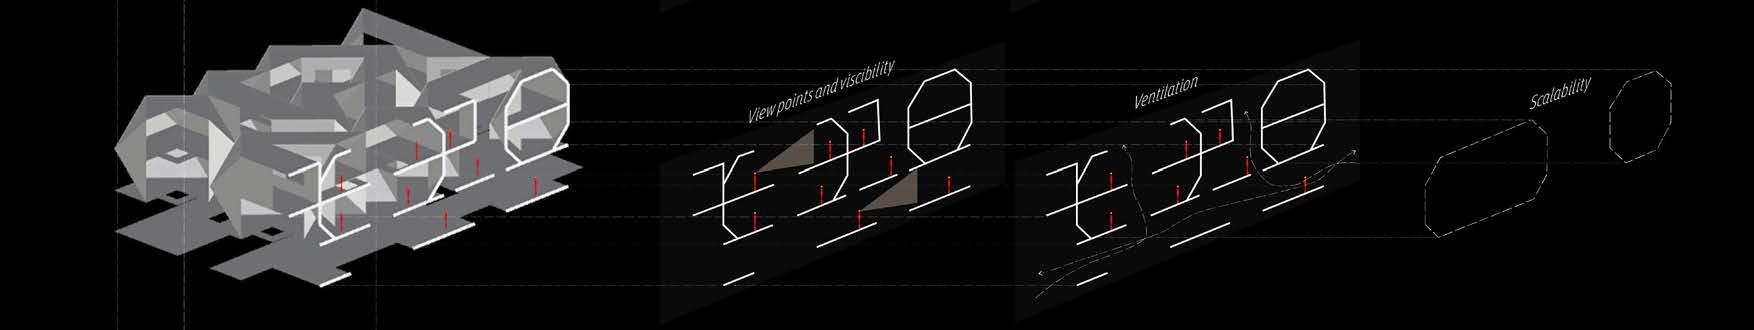
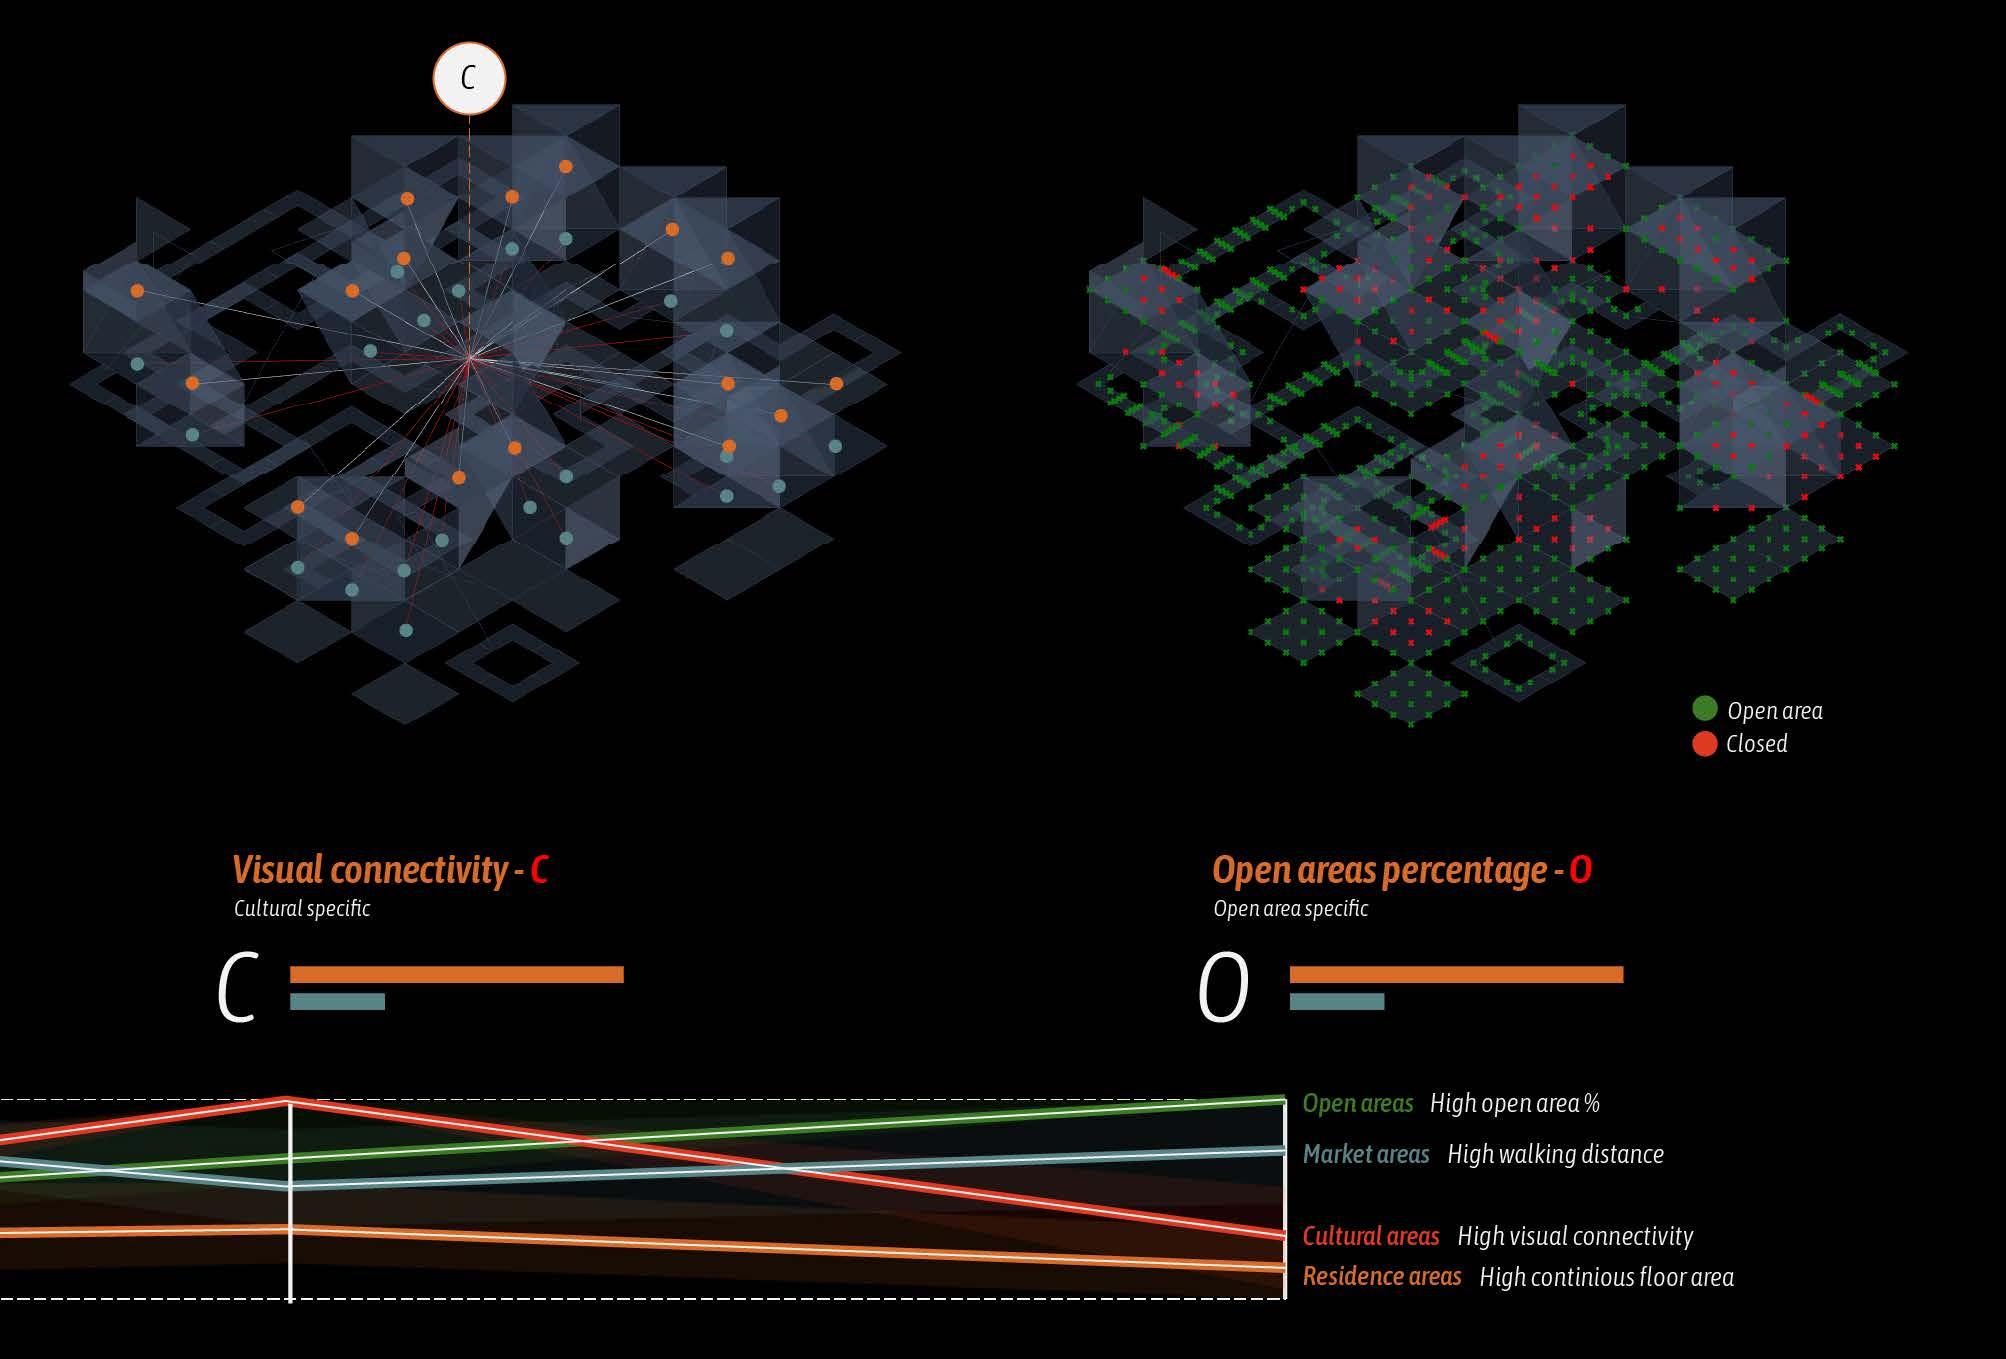
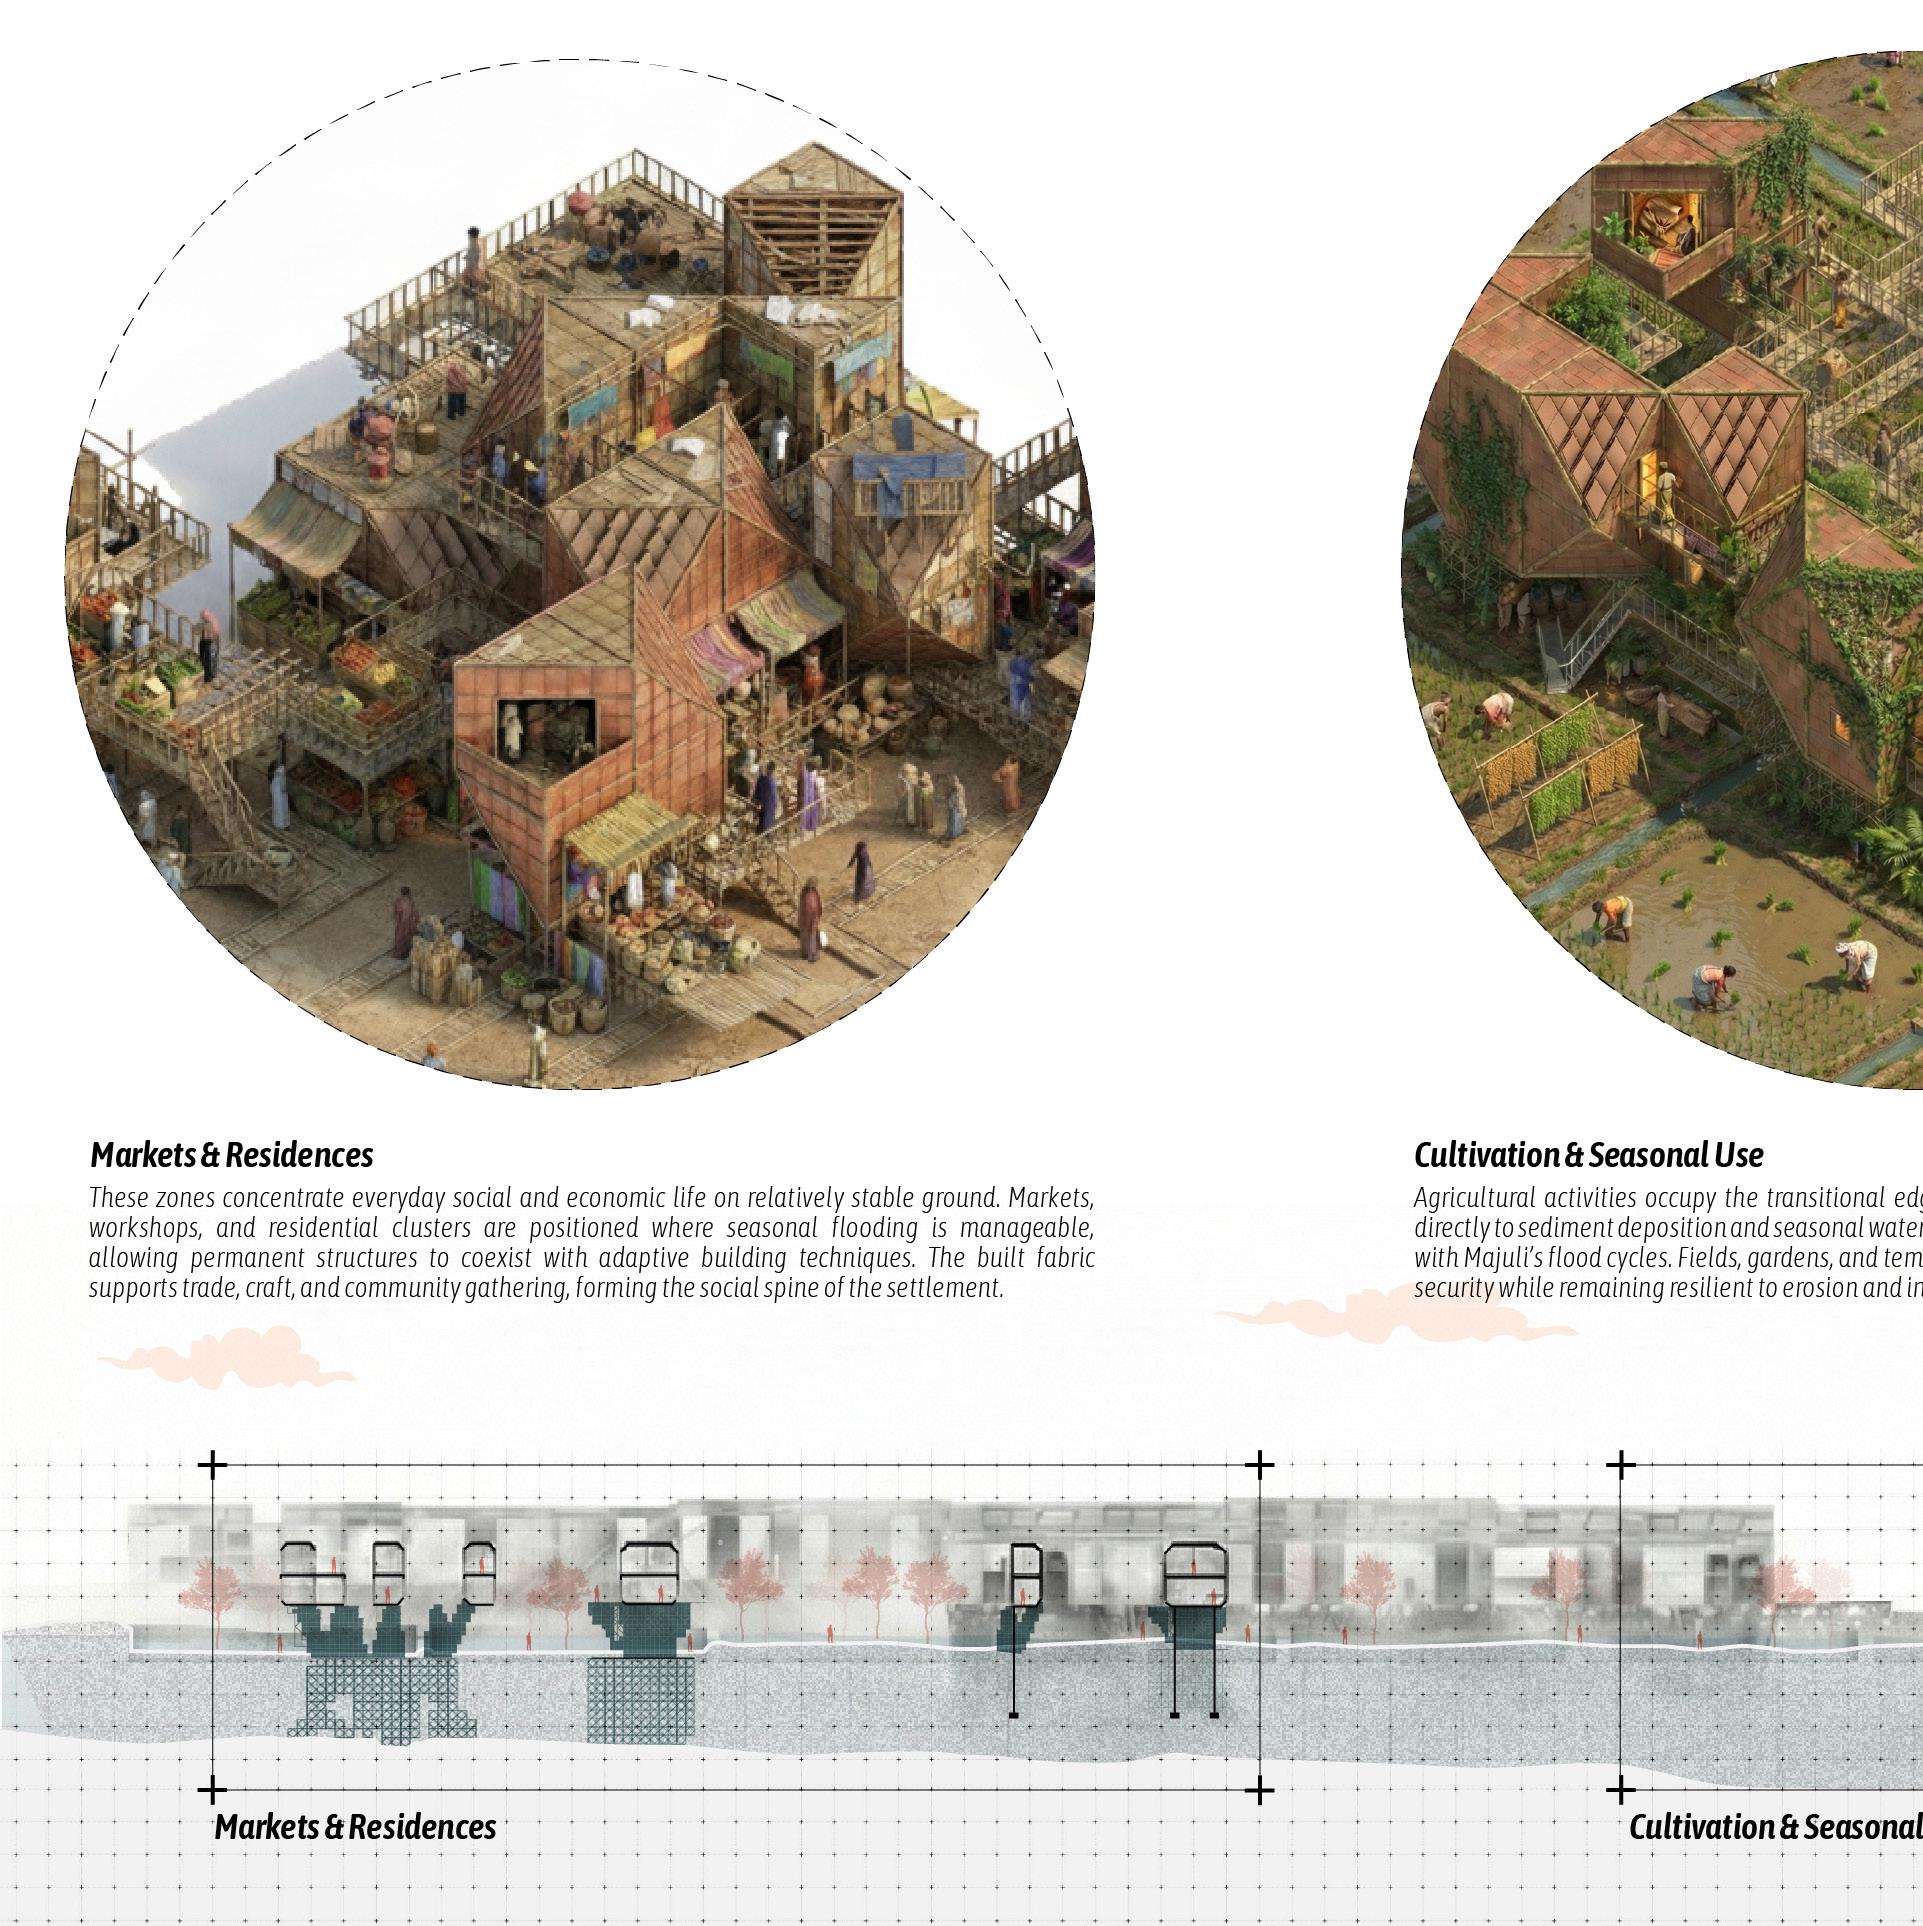
Spatial Distribution
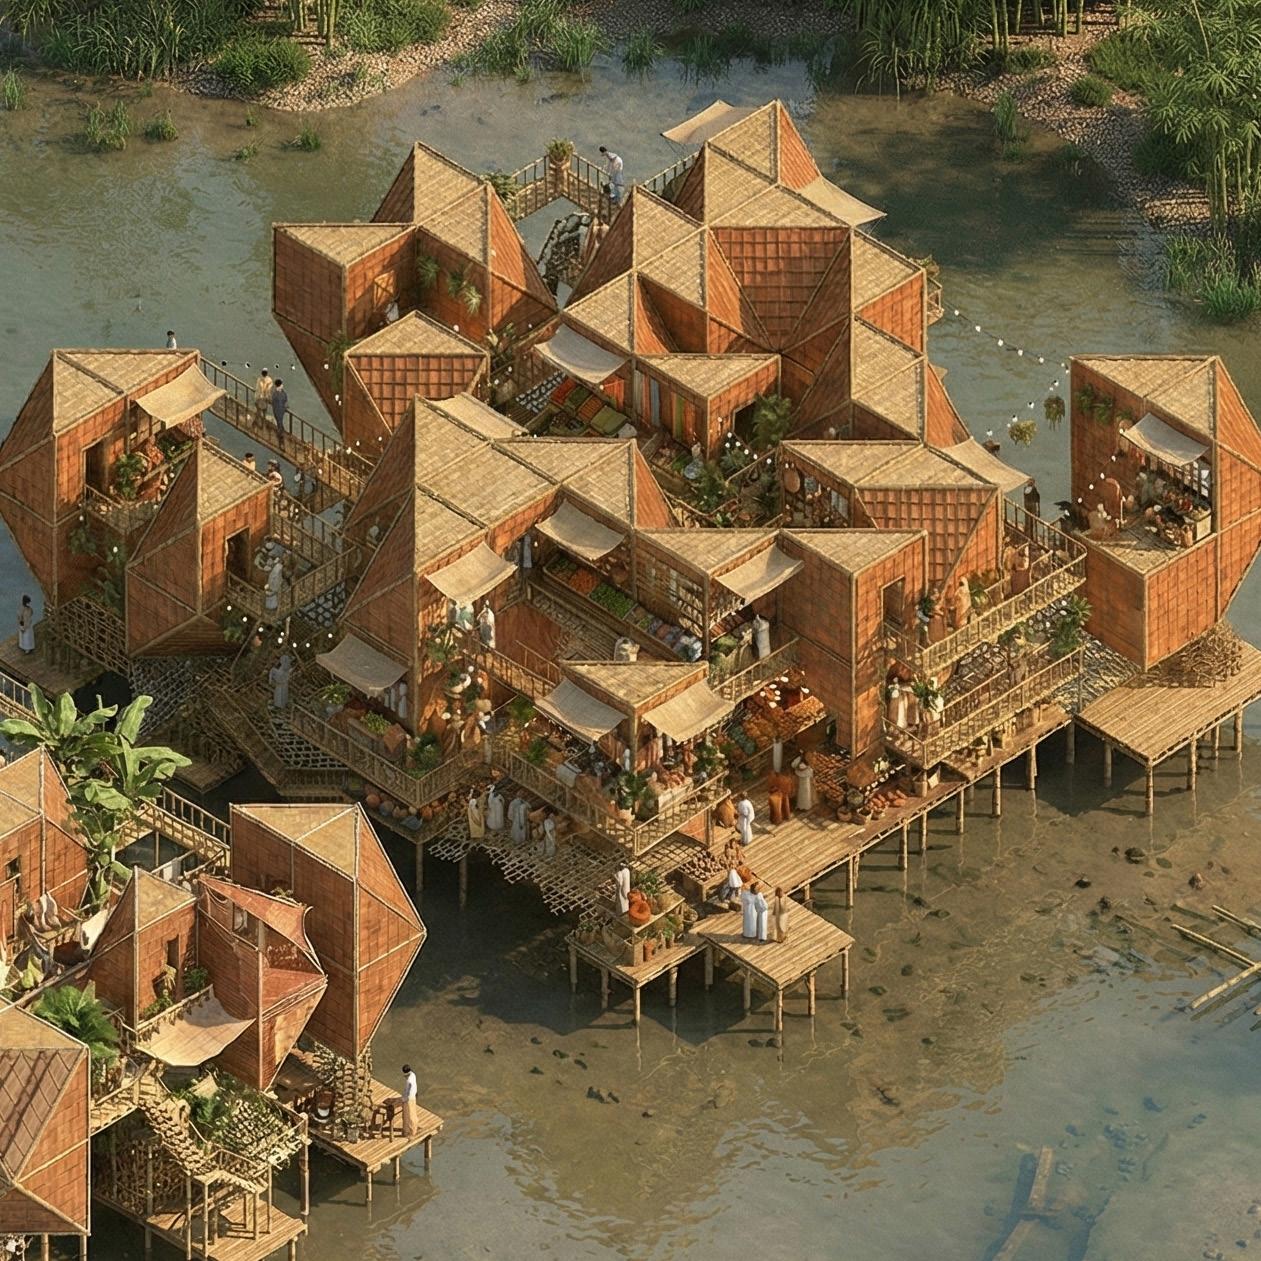
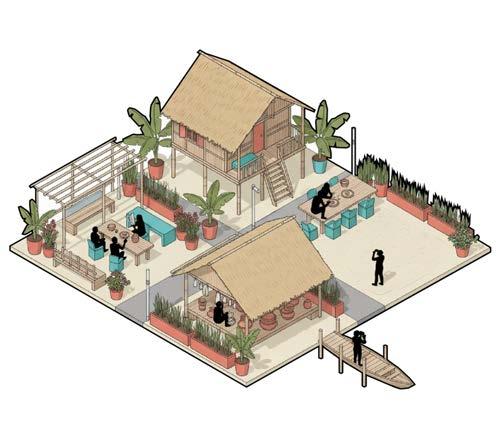
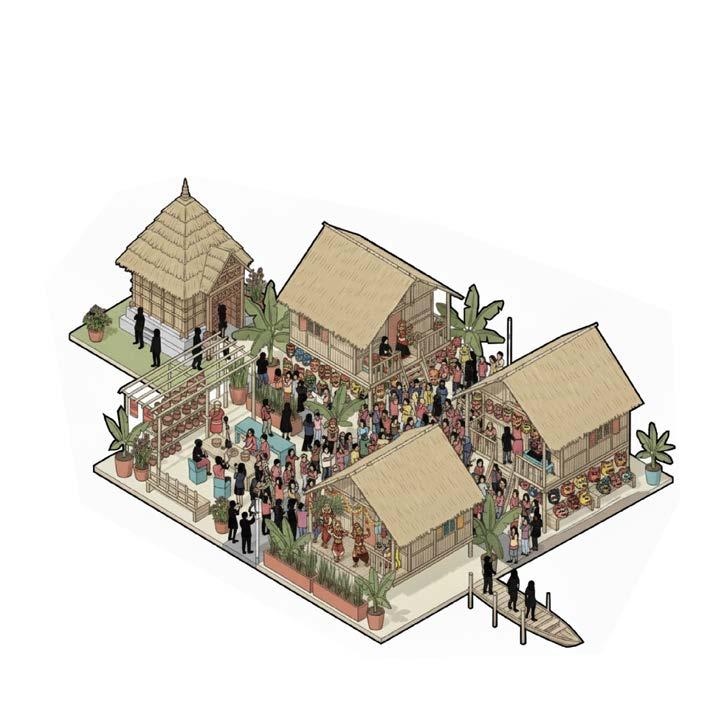
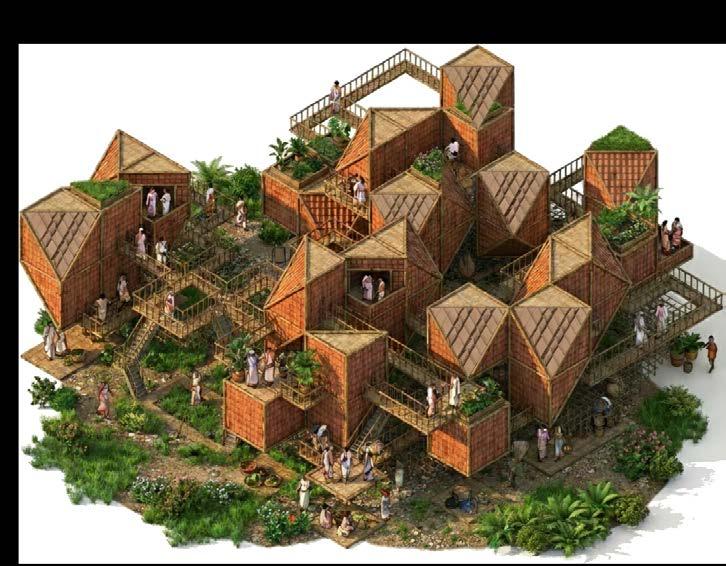
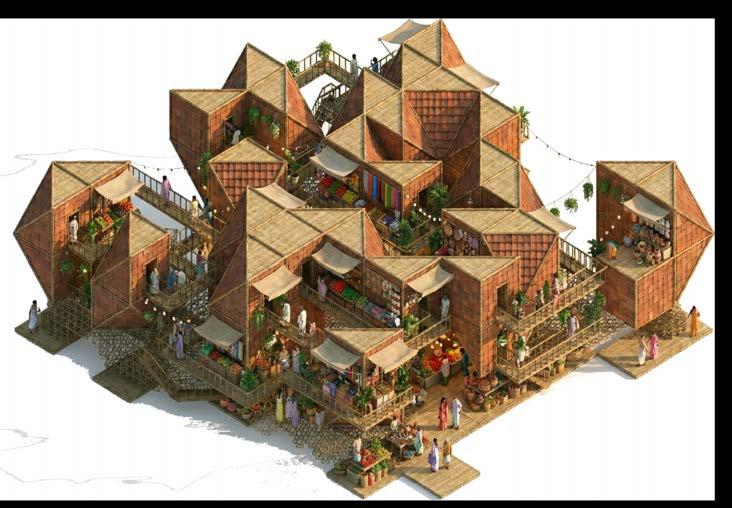
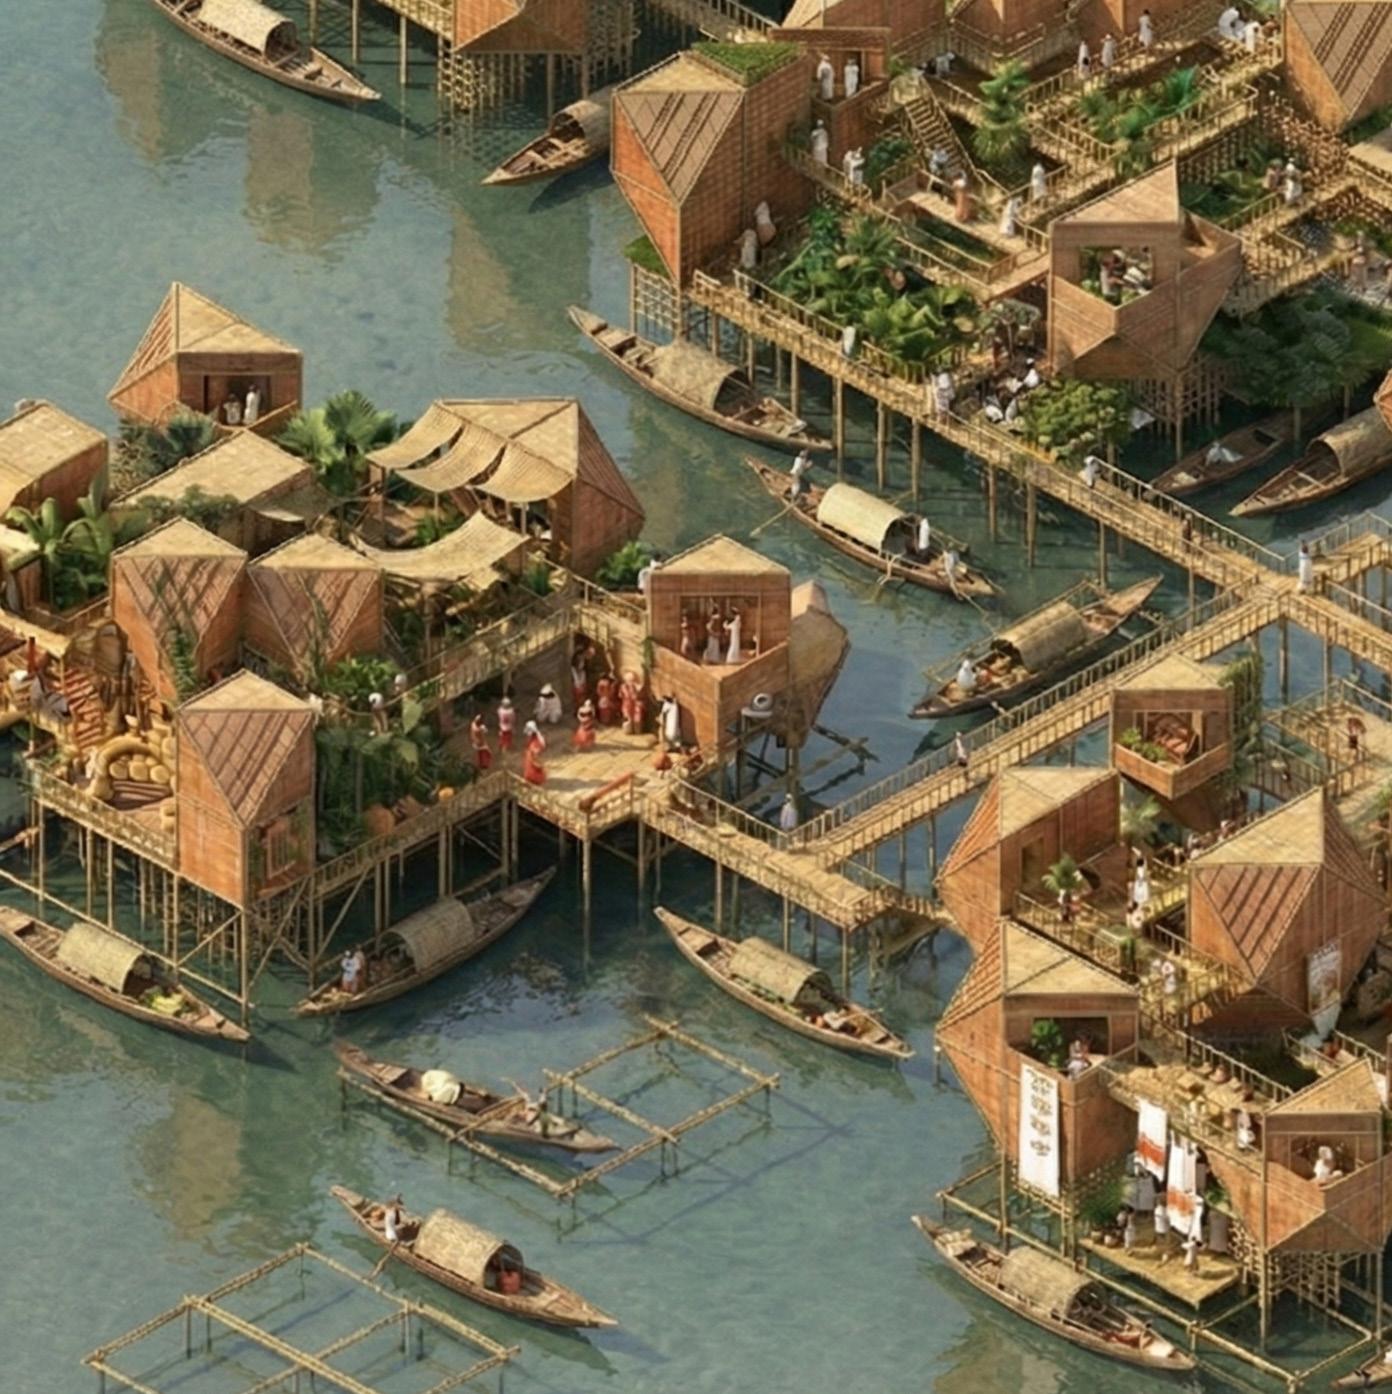
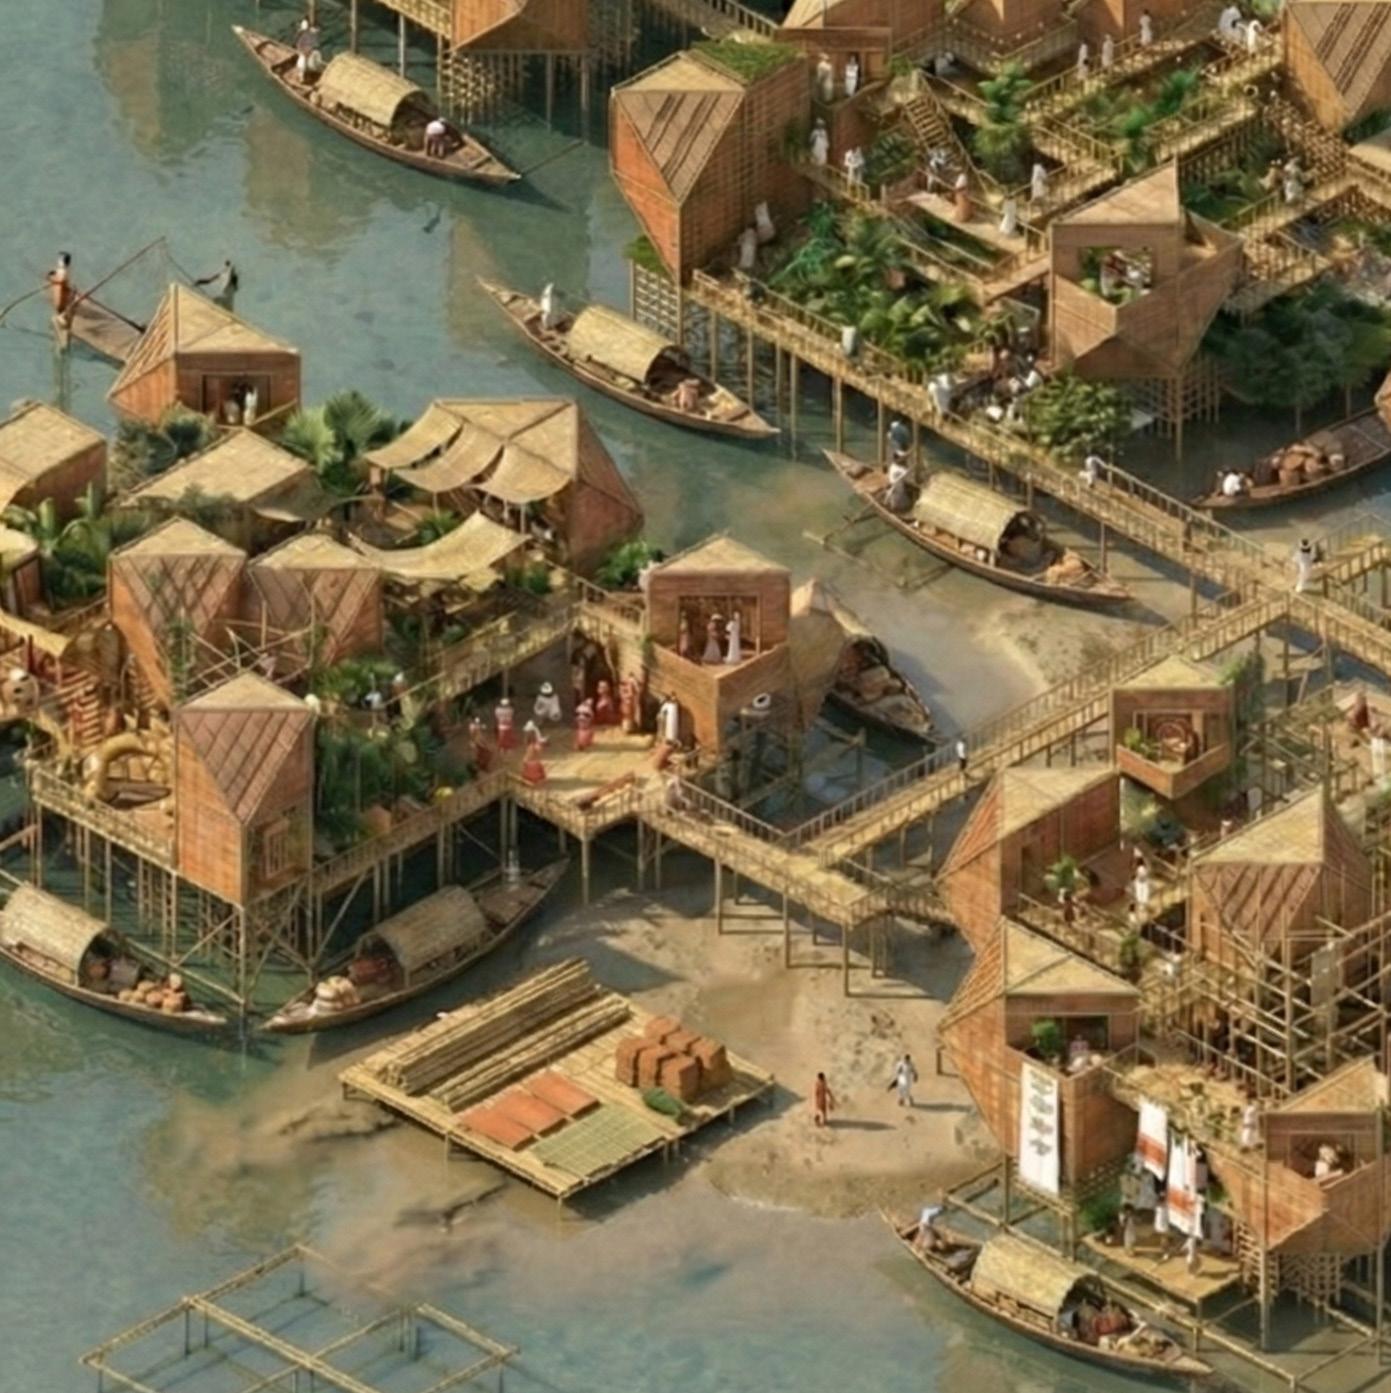
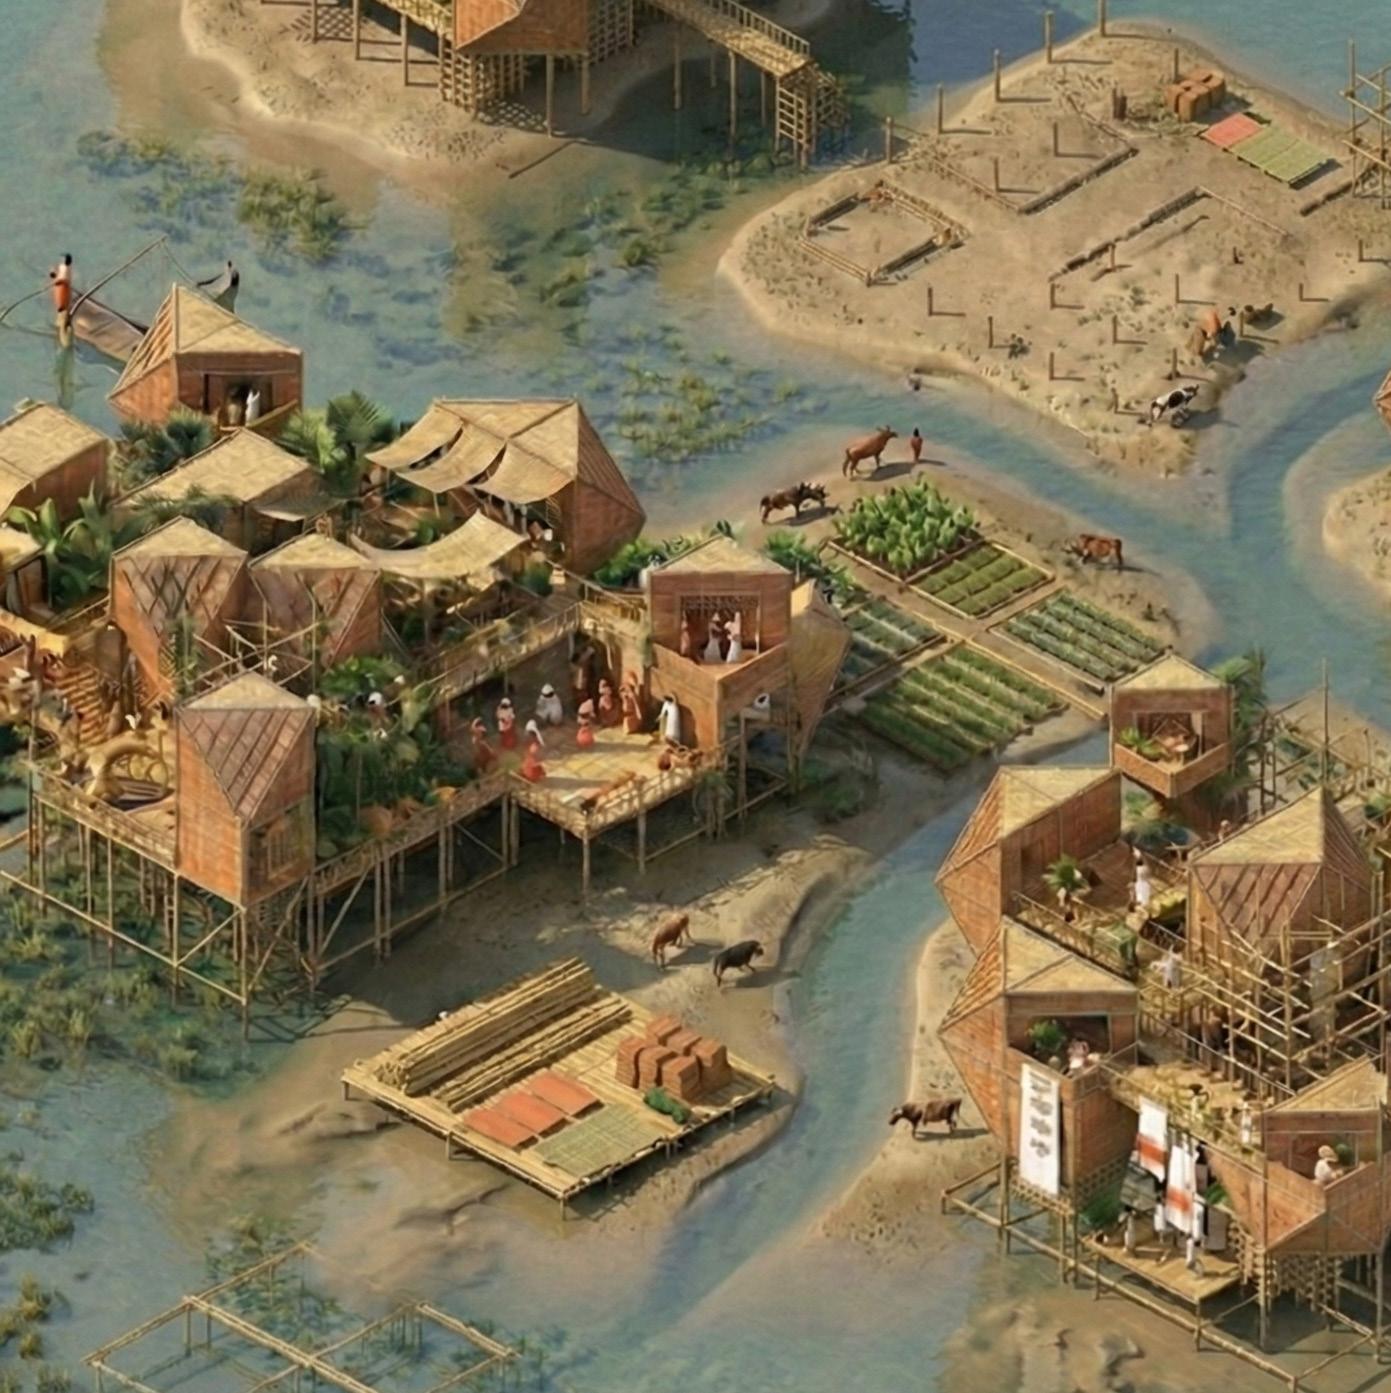
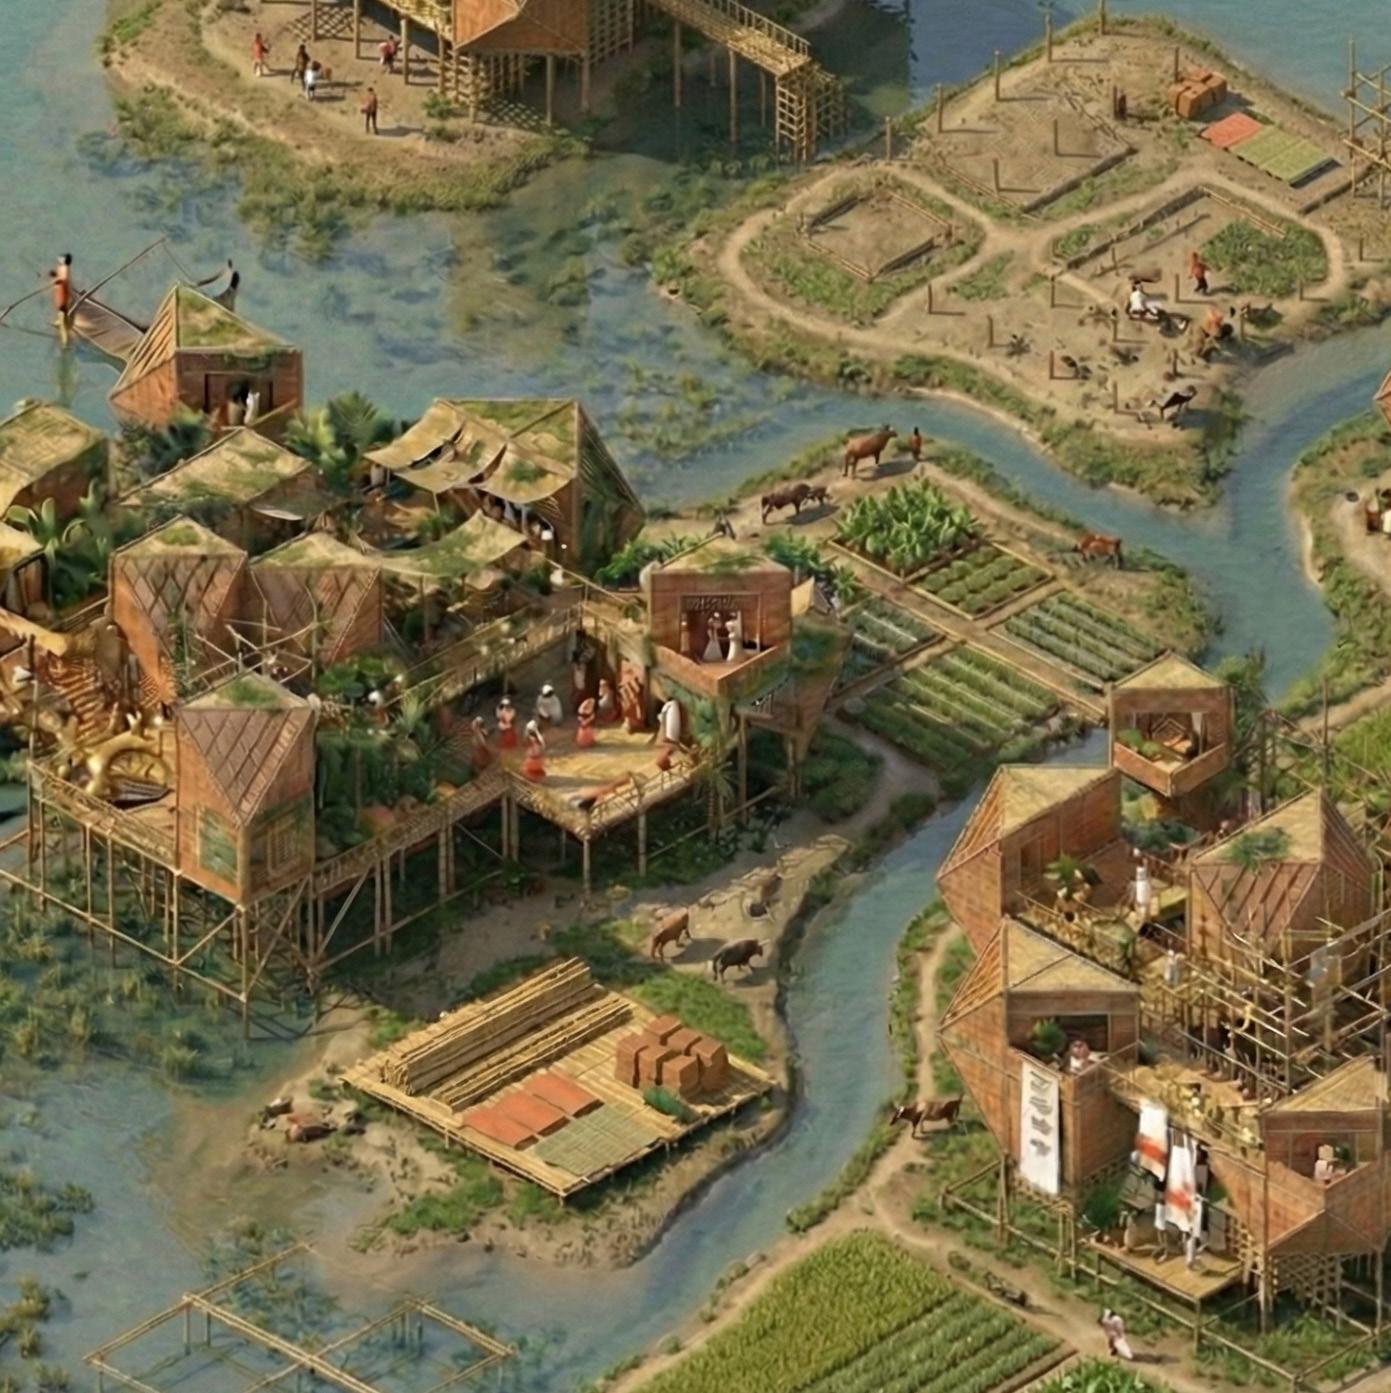
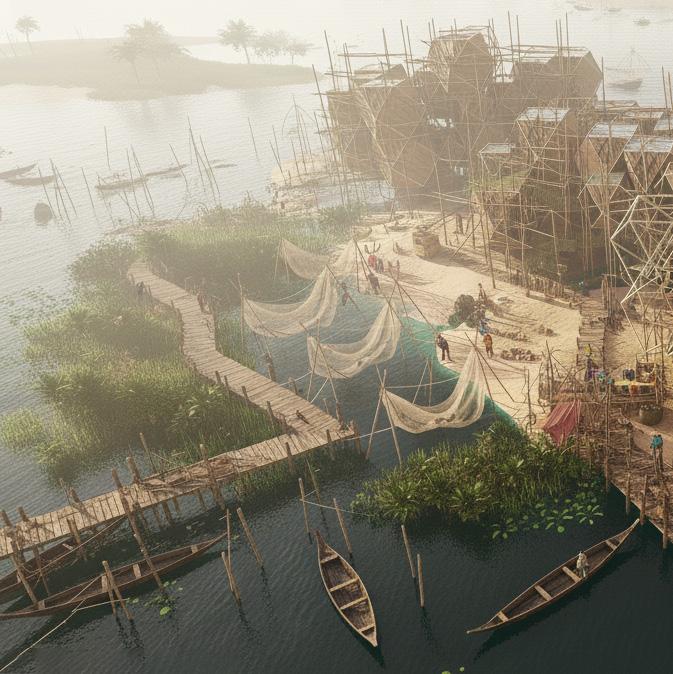
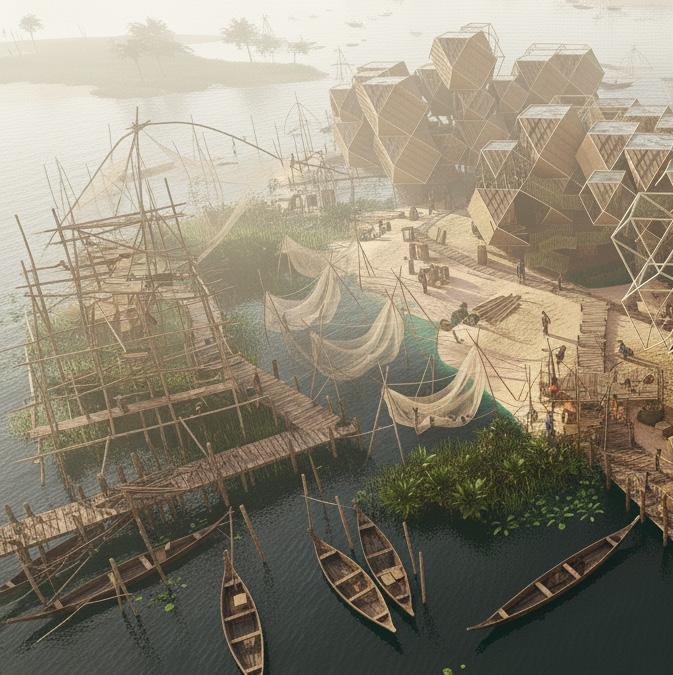
The tourism zone is designed to host visitors while supporting local economic growth through controlled engagement. Primary users include tourists accessing lodging, performances, and cultural programs, with a user split of approximately 35% local population and 65% tourist flow, resulting in a 1:2 ratio. Key activities include homestays, guided tours, cultural performances, and dining. This zone is spatially positioned to remain connected to communal and cultural areas without overwhelming them. Architecture here balances hospitality requirements with local scale and materiality, ensuring tourism functions as a complementary layer that generates income while preserving social and cultural integrity.
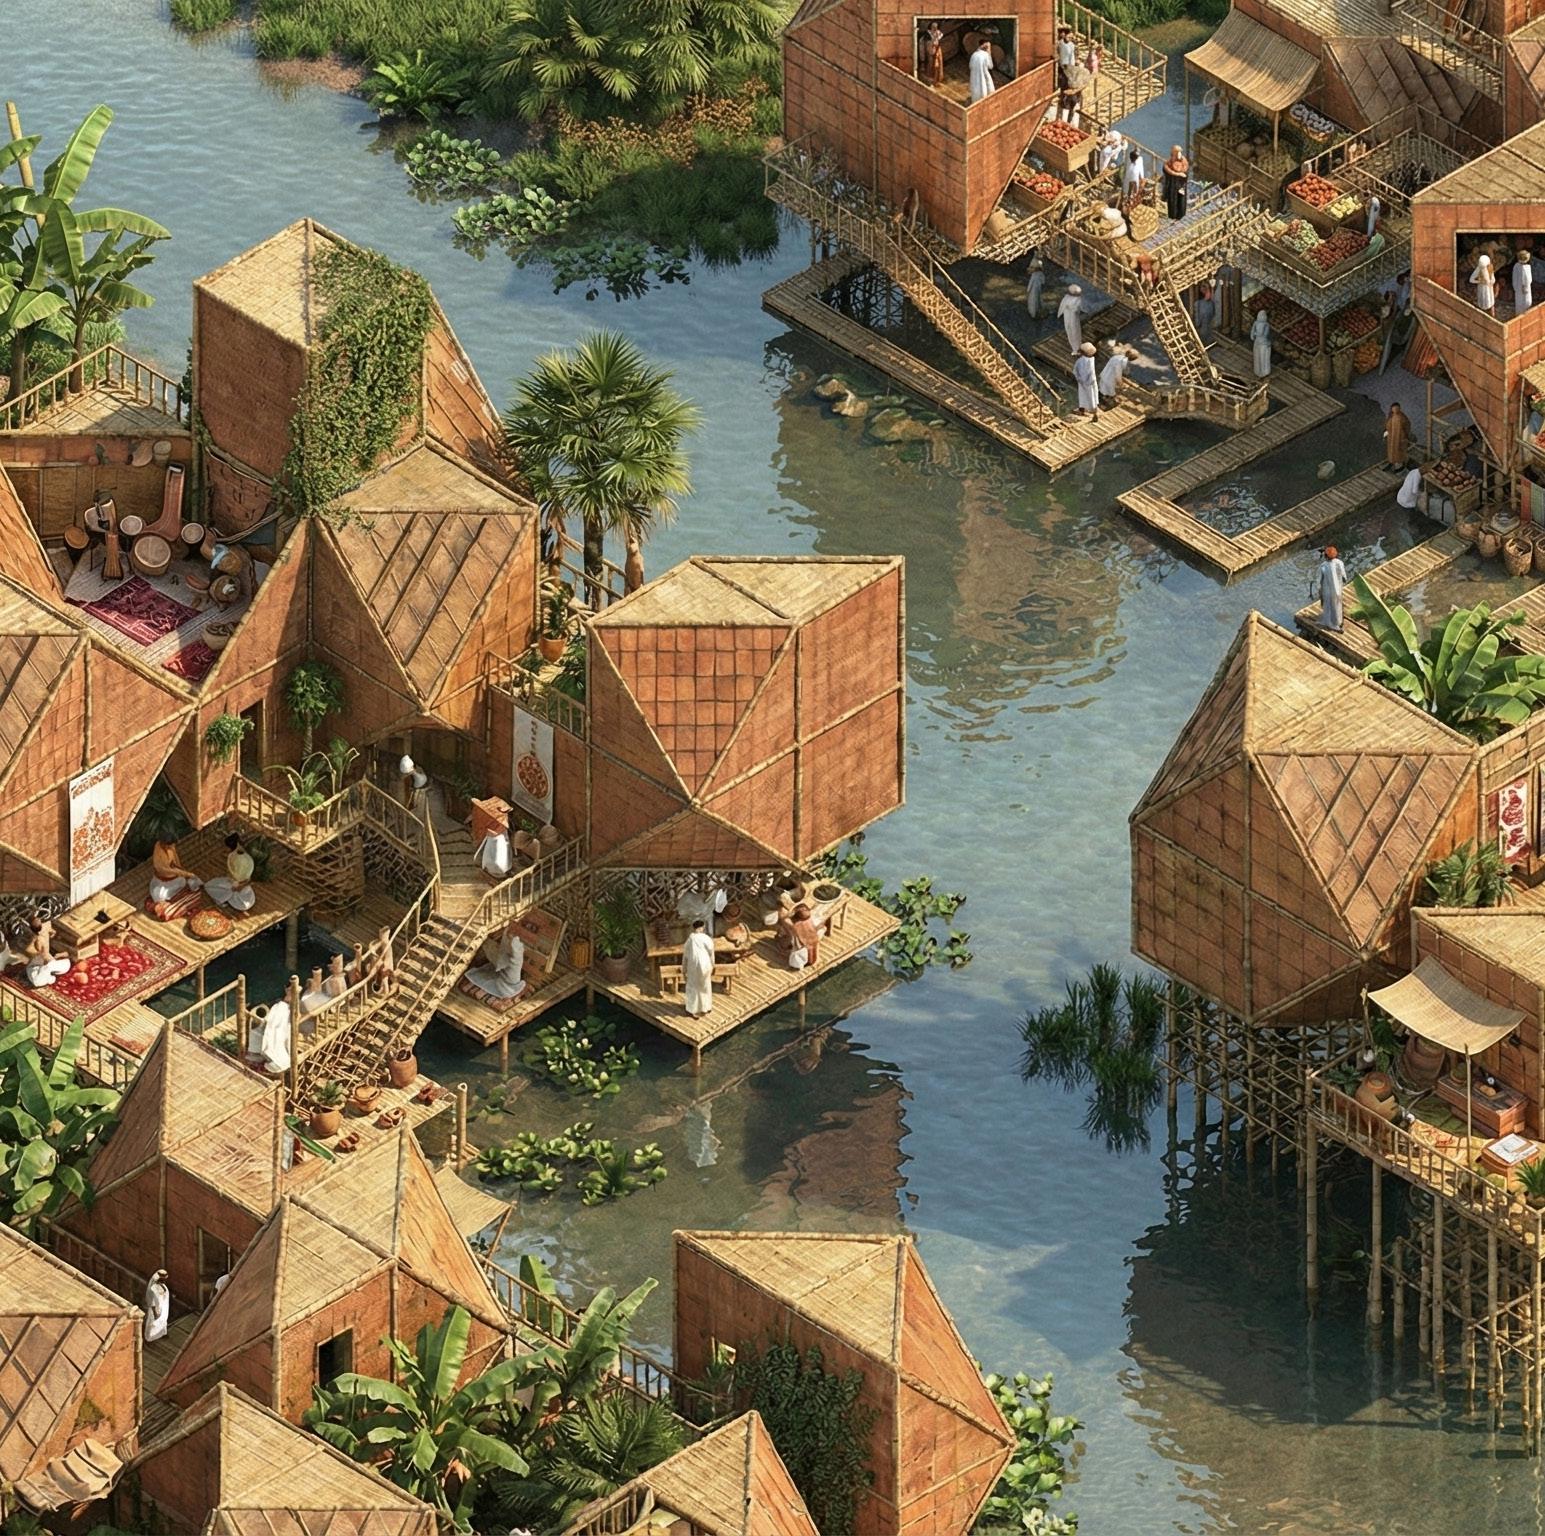
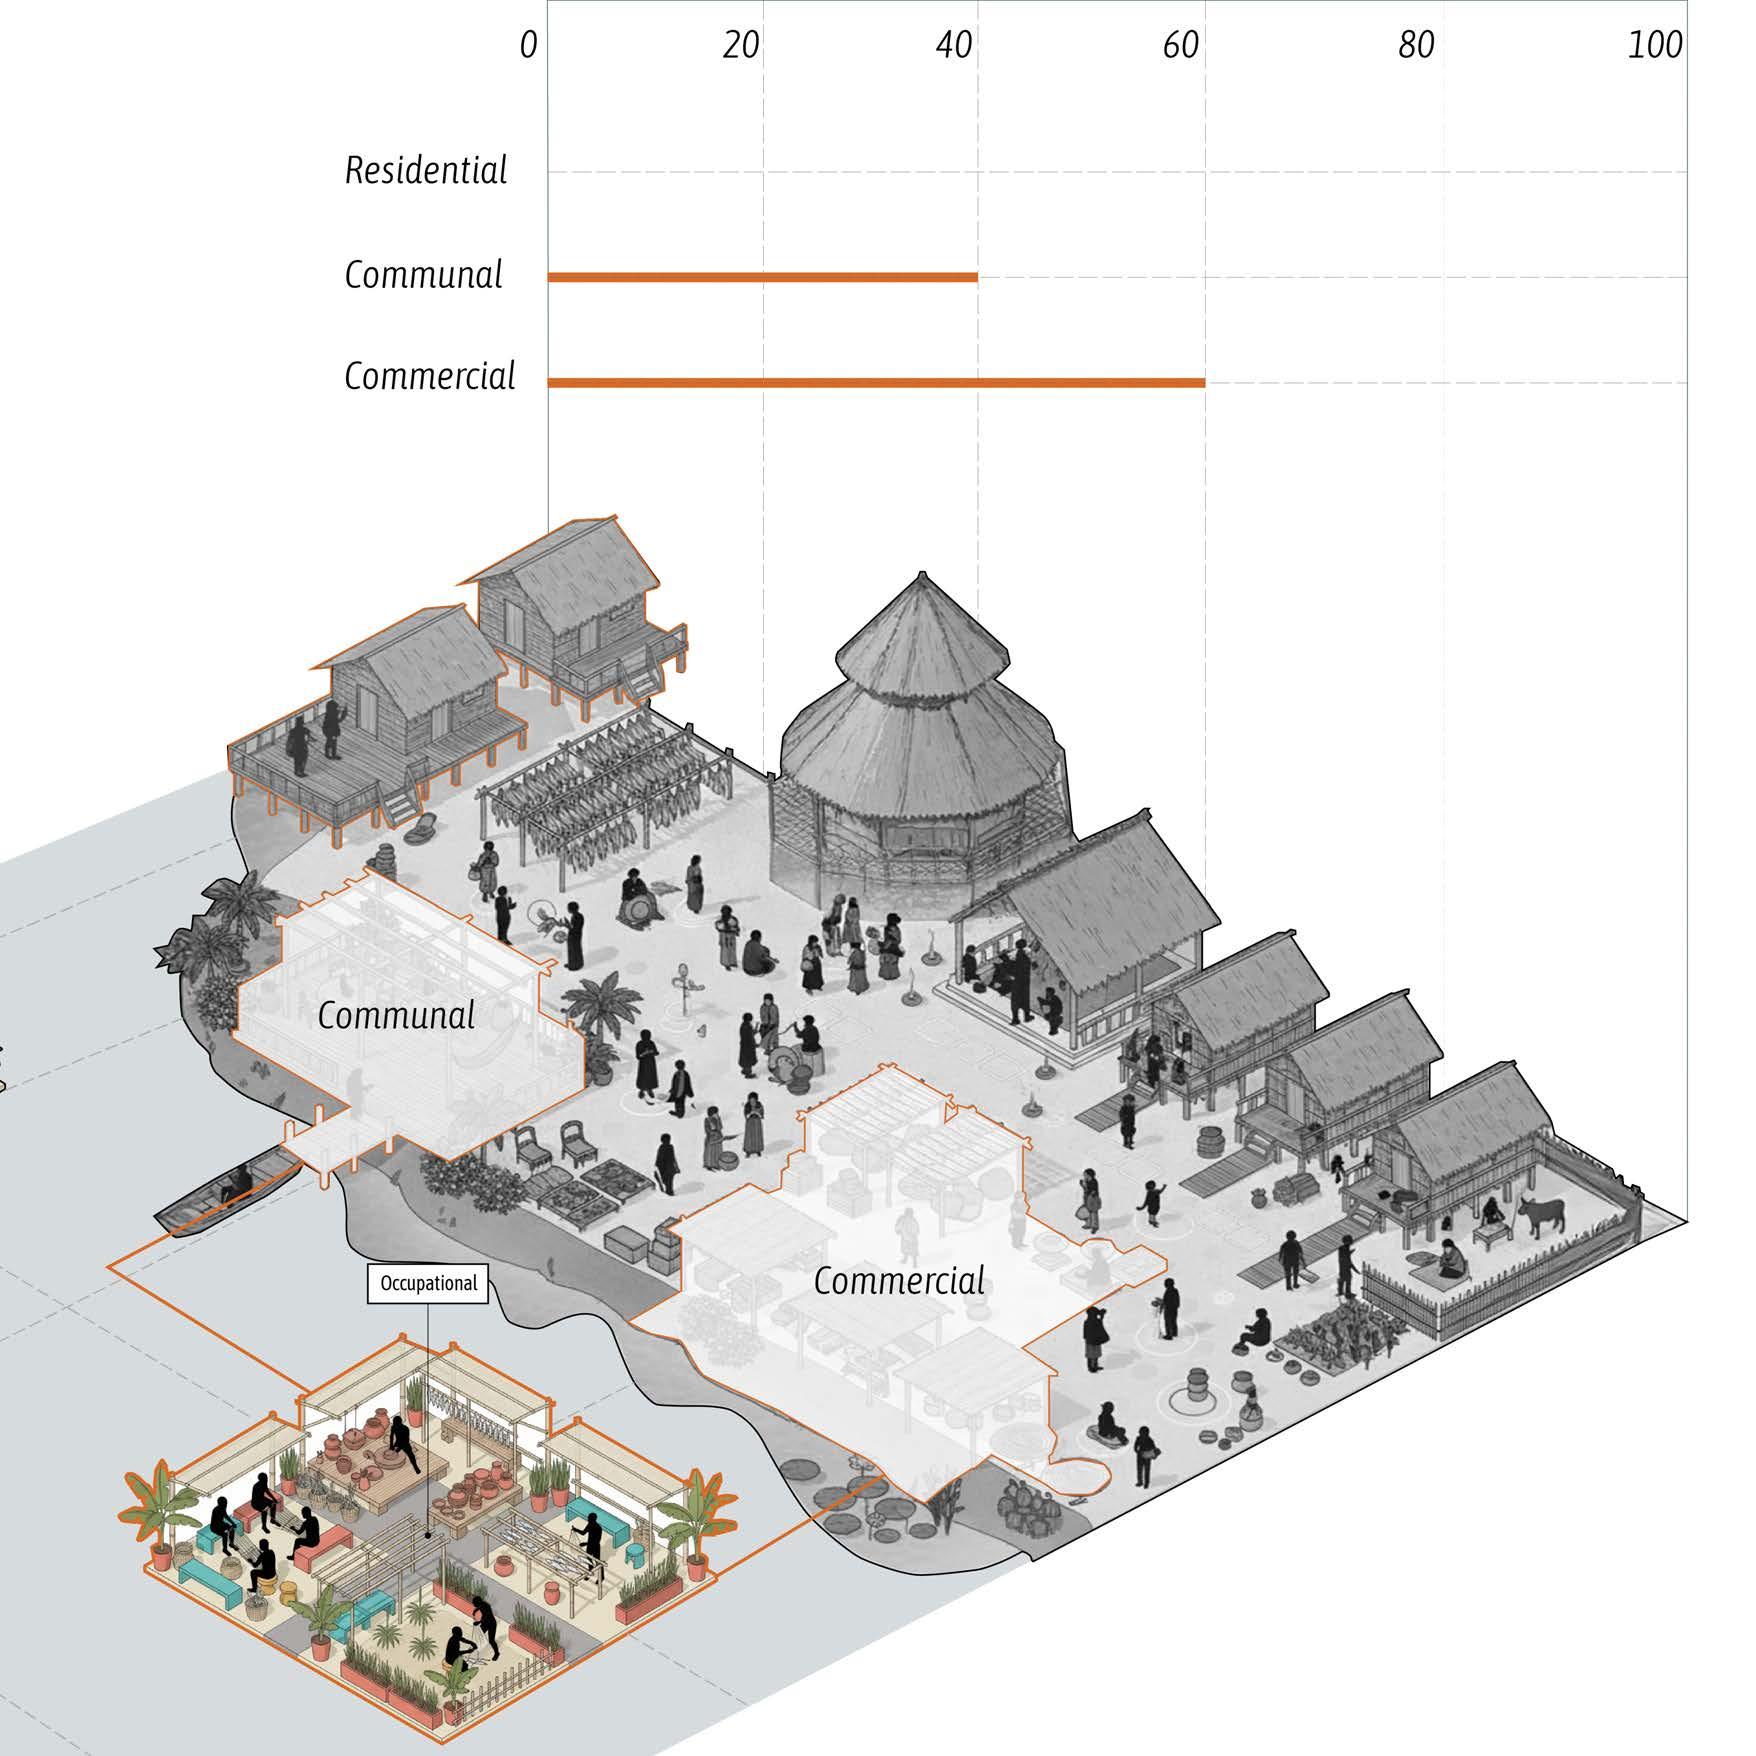
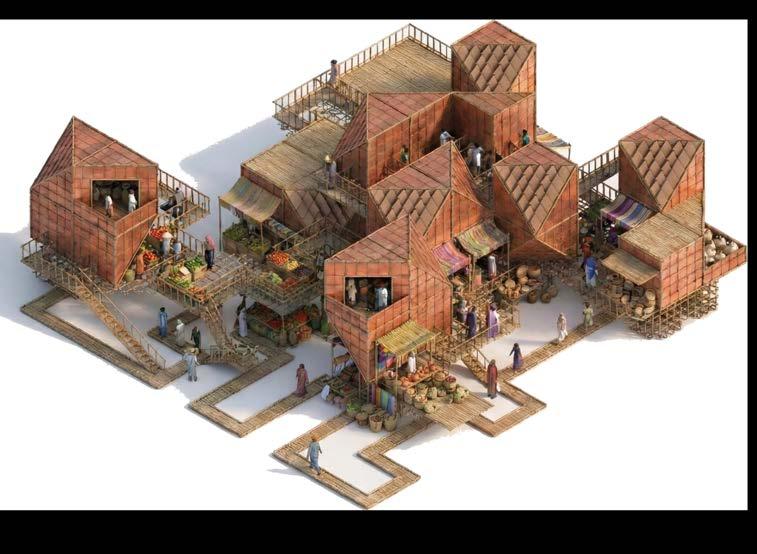
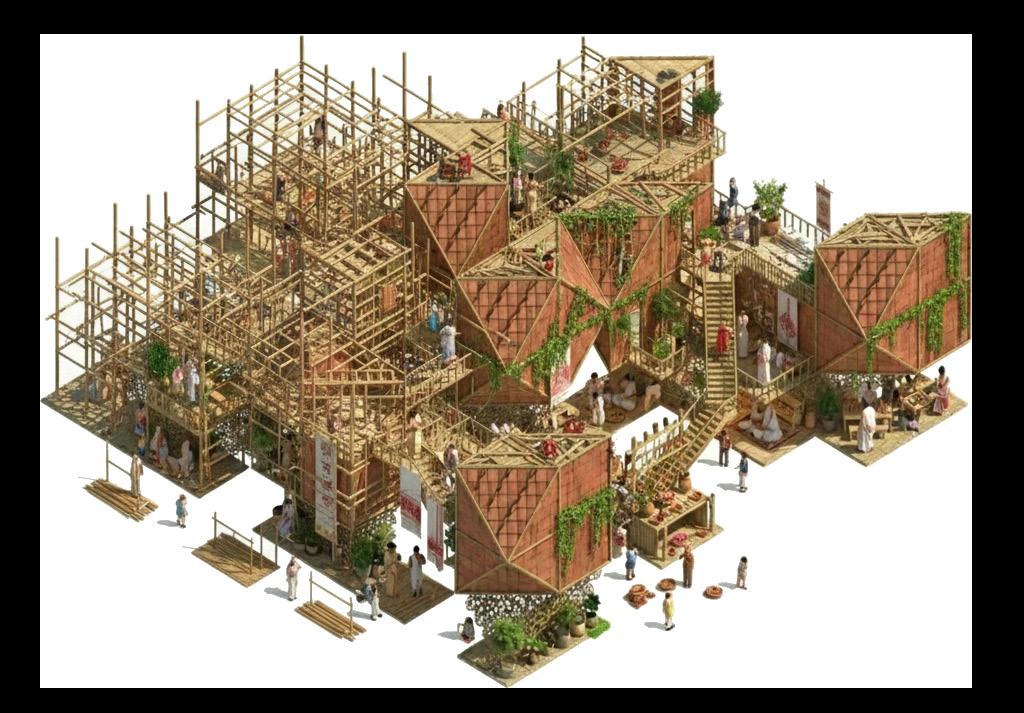
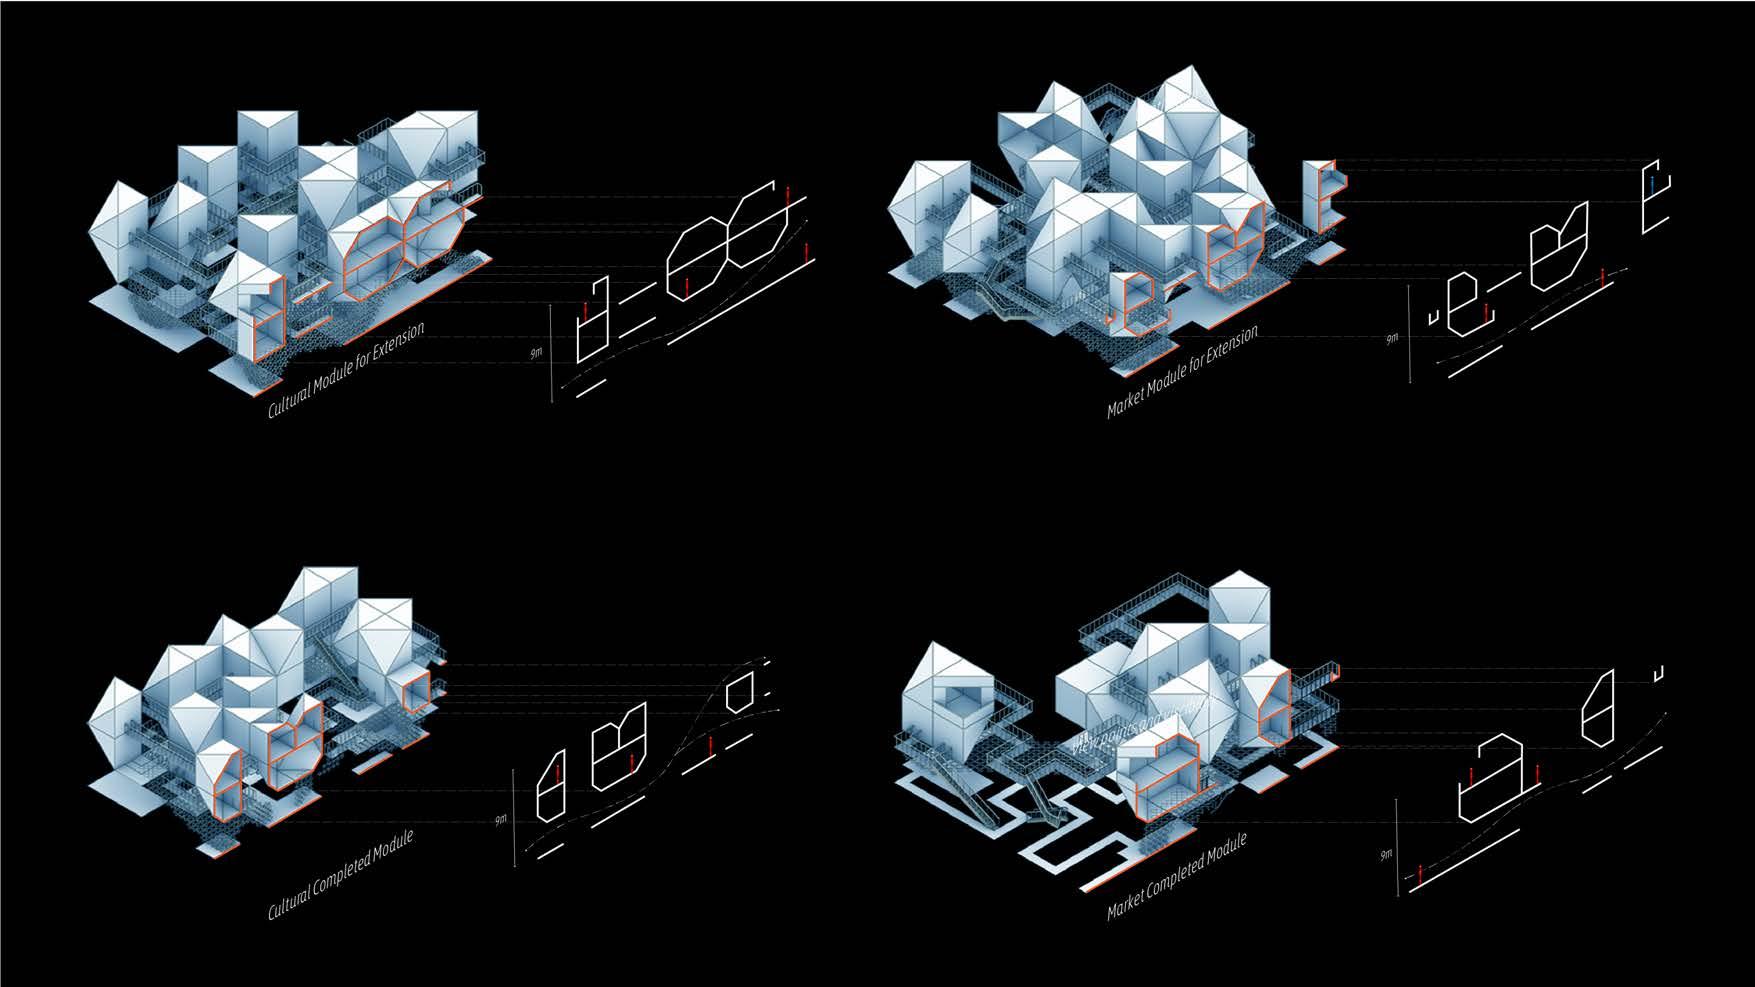
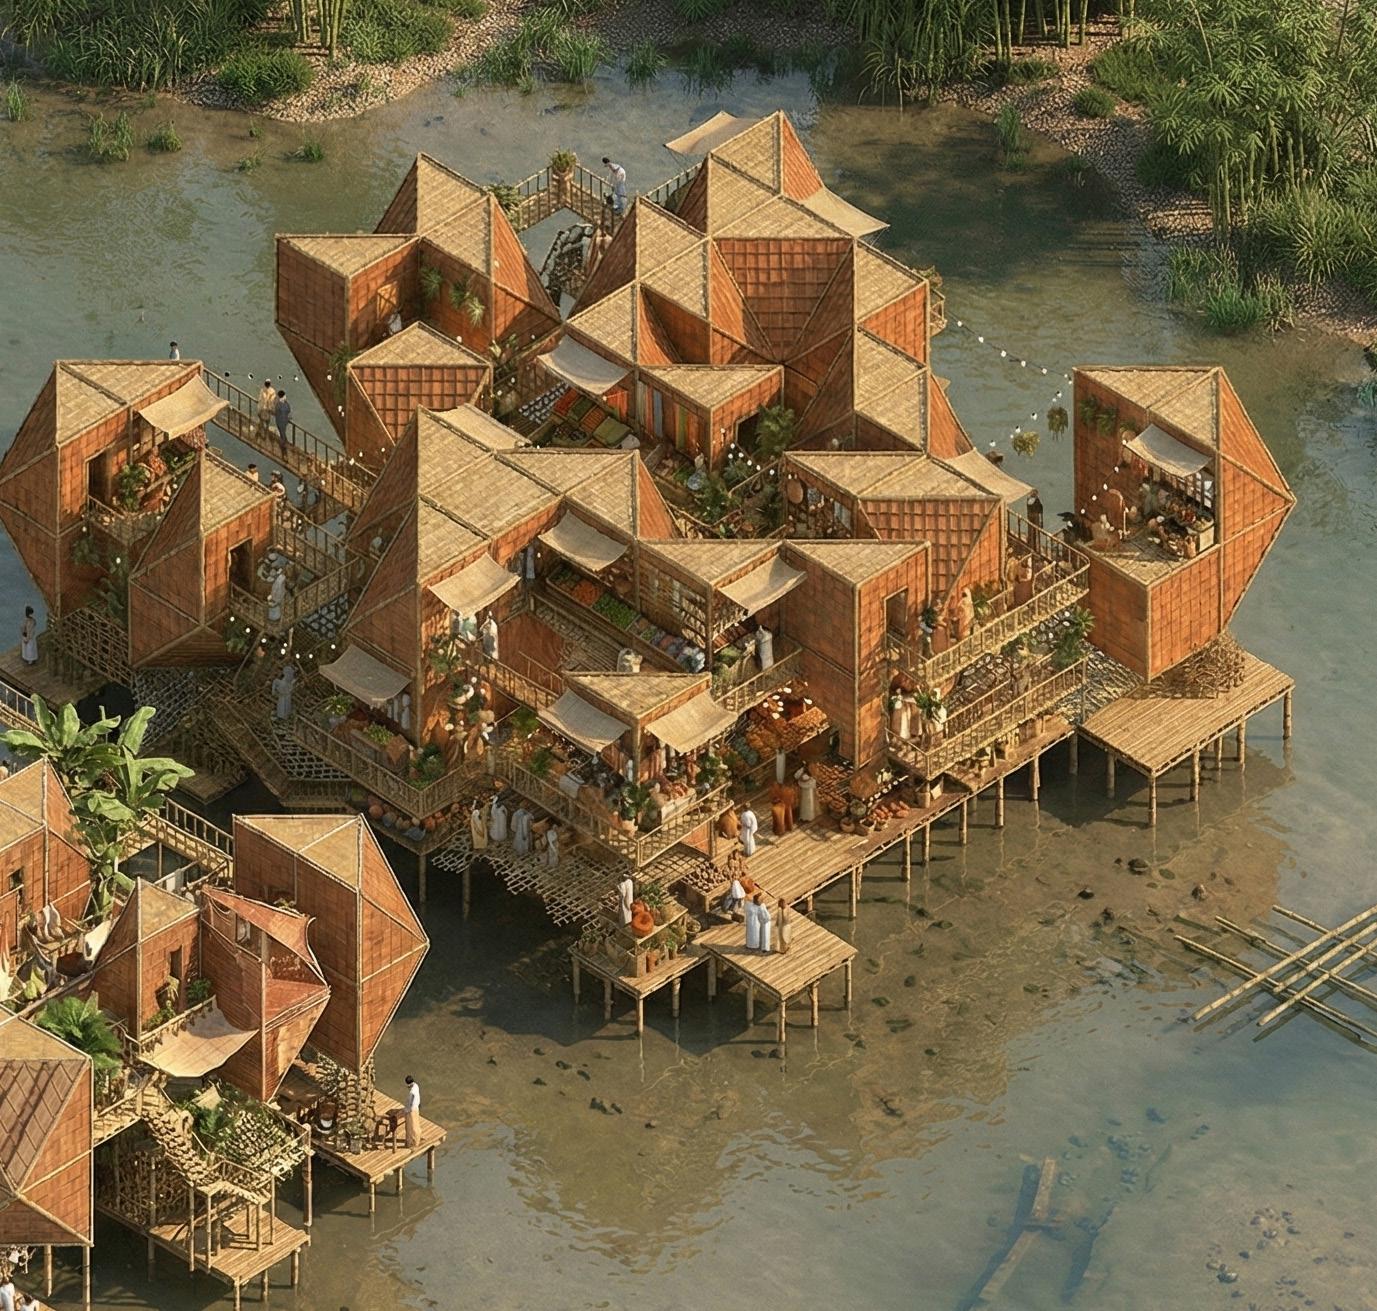
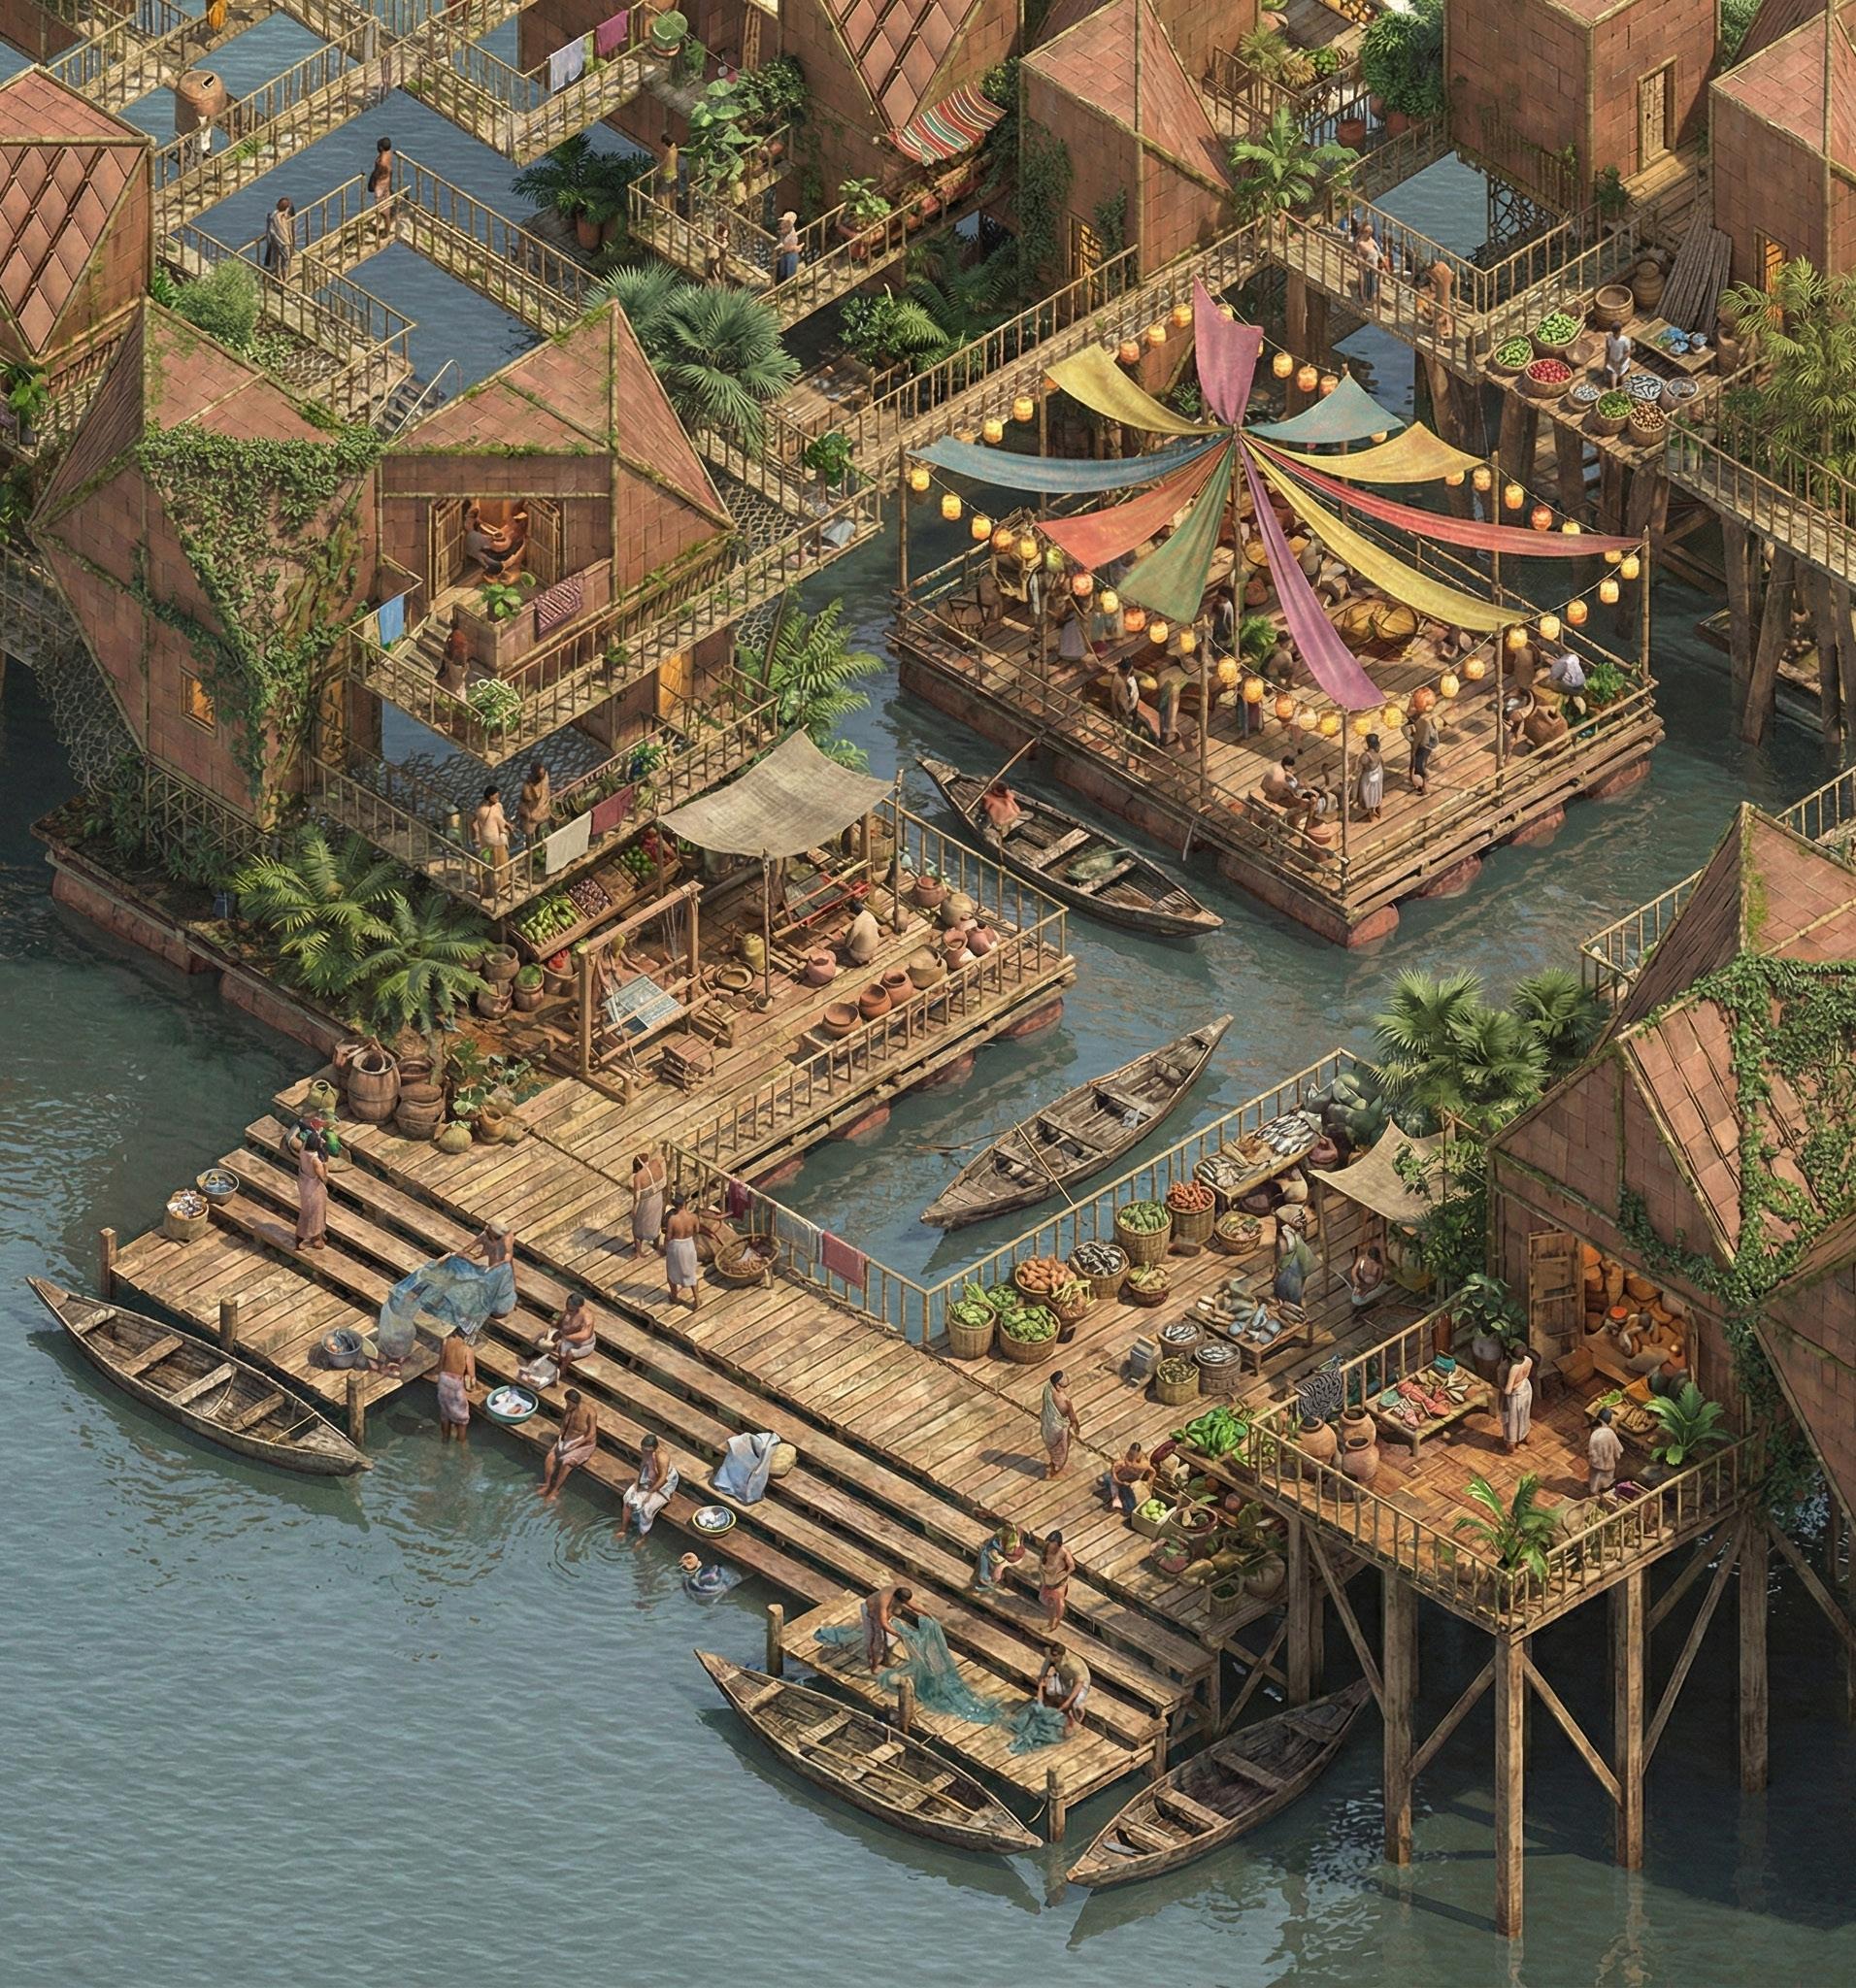
The market zone functions as an economic interface between local communities and visitors. It is primarily used by local vendors and visiting buyers, with a user distribution of approximately 60% local population and 40% tourists, resulting in a ratio of 3:2. Key activities include the sale of crafts, agricultural produce, and goods, alongside cultural exchange through trade. This zone experiences fluctuating intensity based on seasonal tourism and festival cycles. Spatially, it is organized to support high visibility, movement, and interaction, allowing economic activity to expand or contract as needed while reinforcing trade as both a livelihood strategy and a social connector.
Tourism
Market
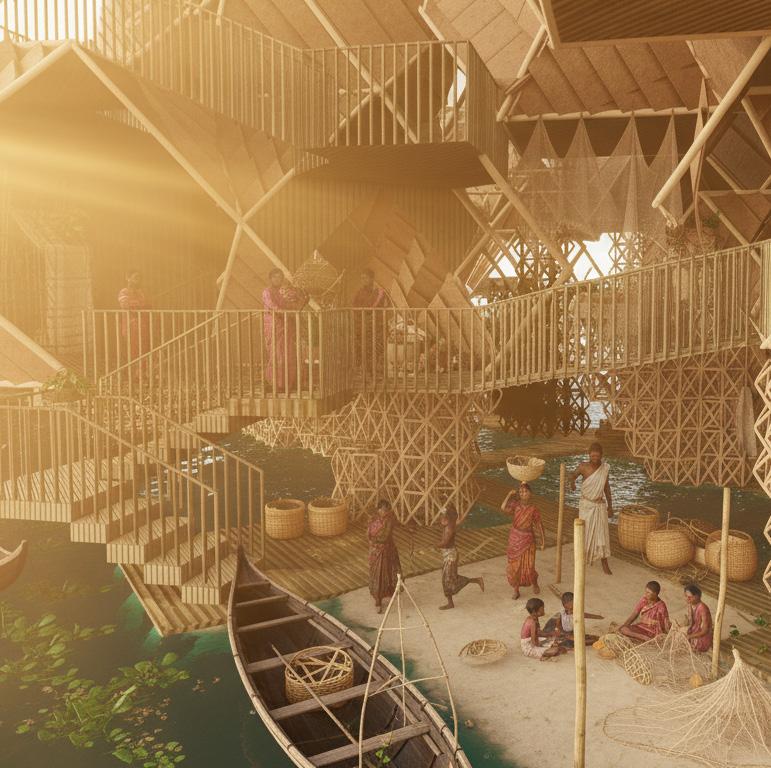
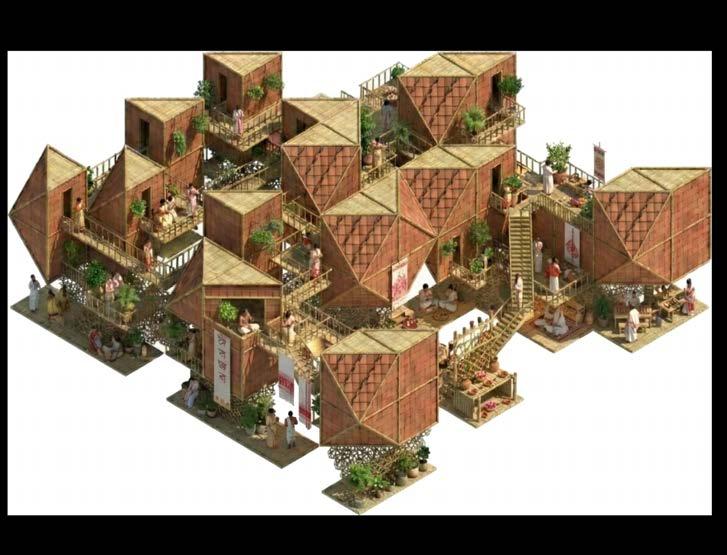
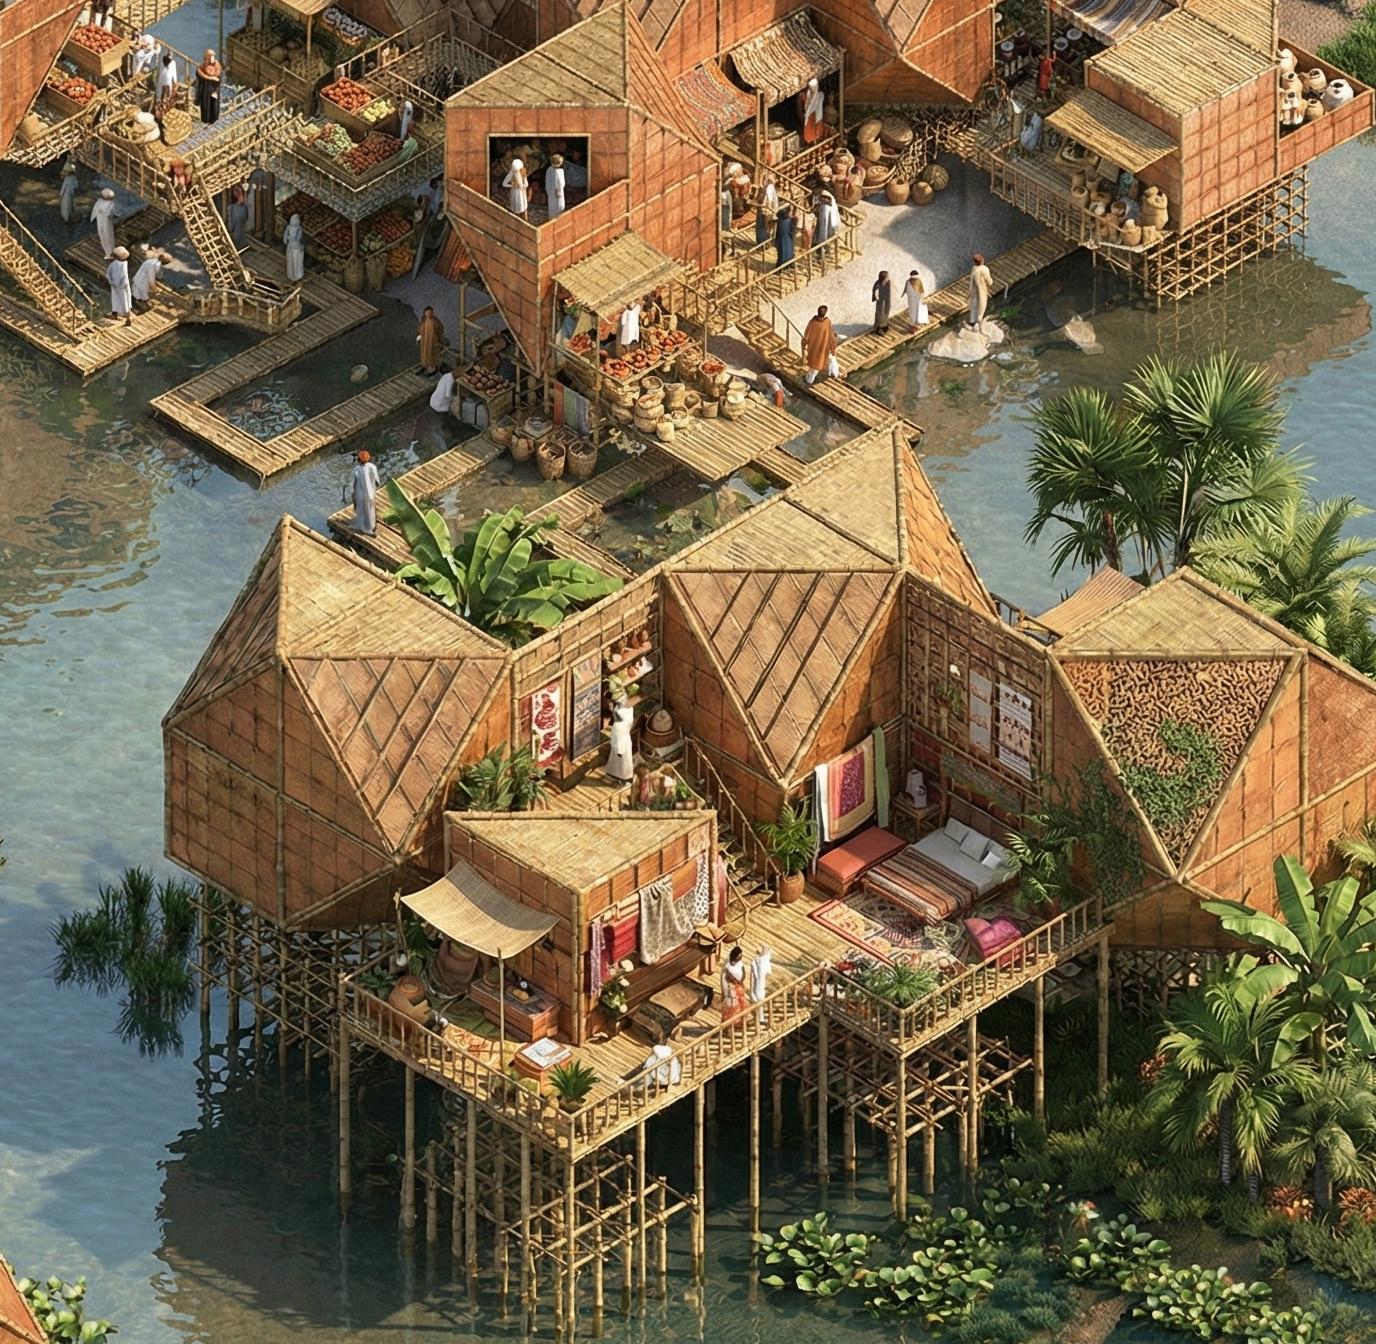
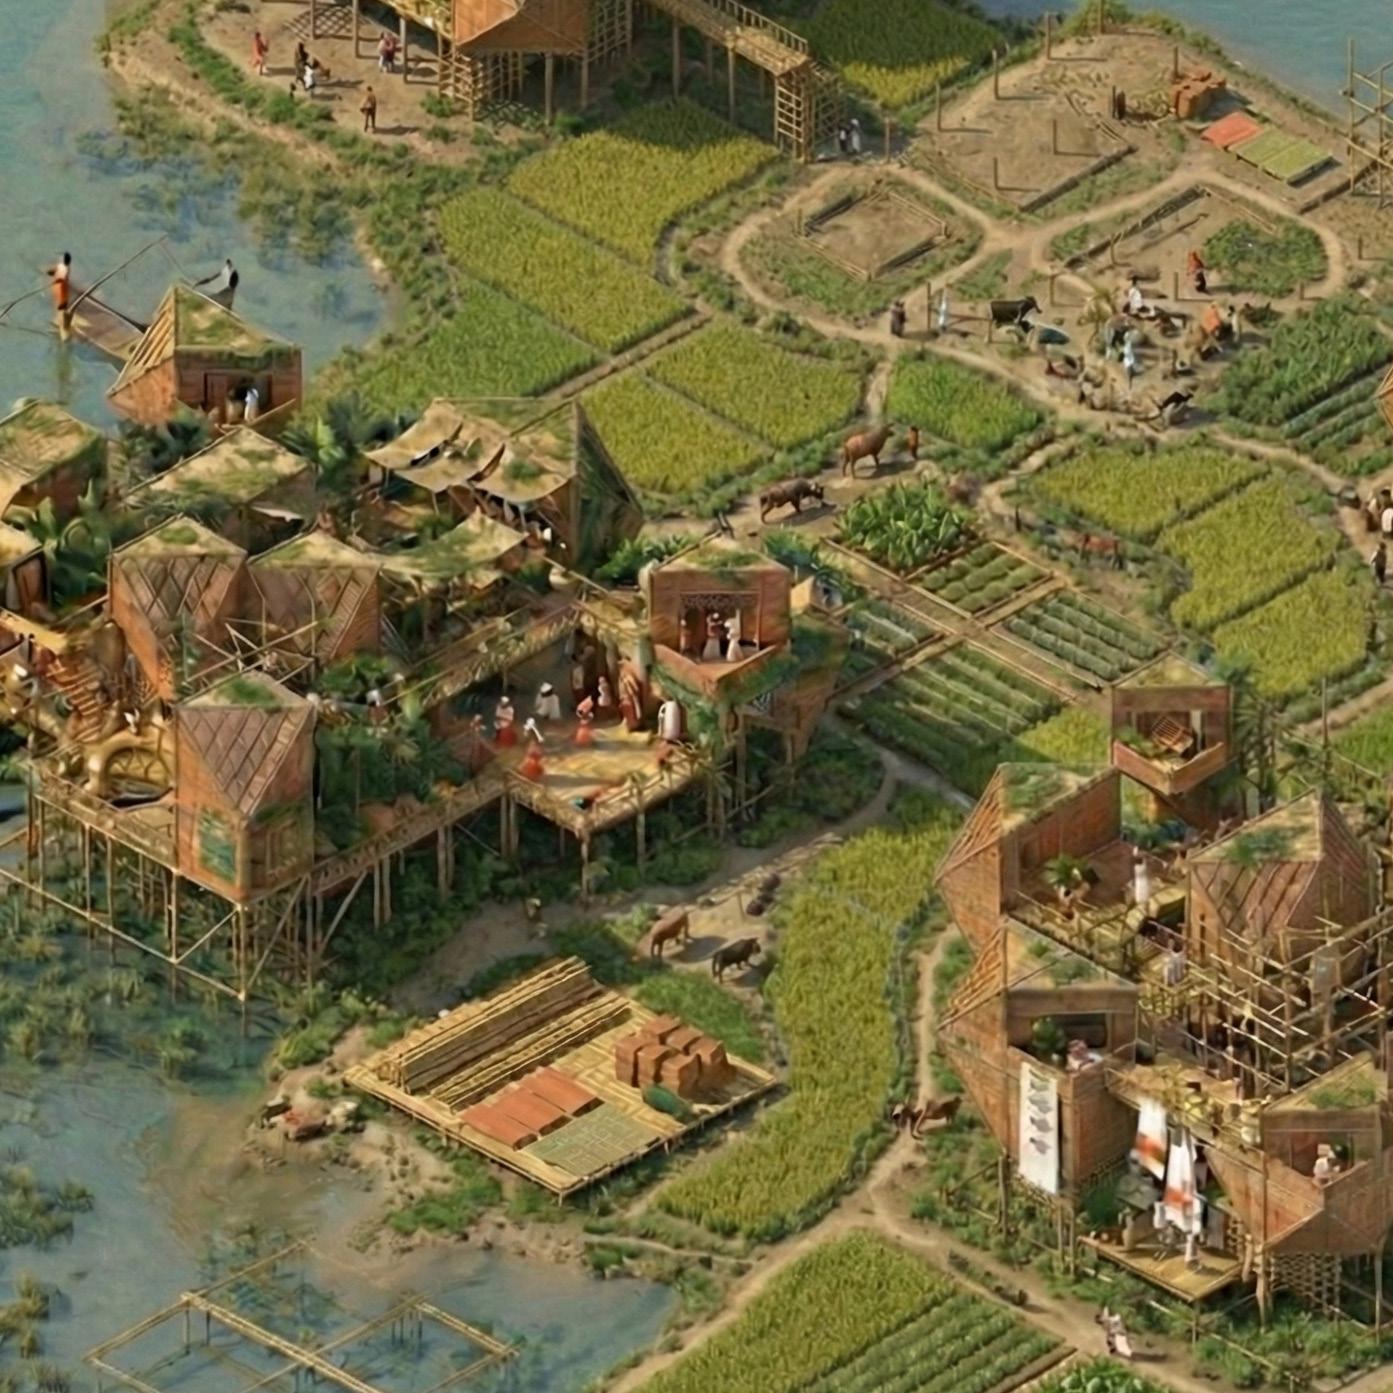
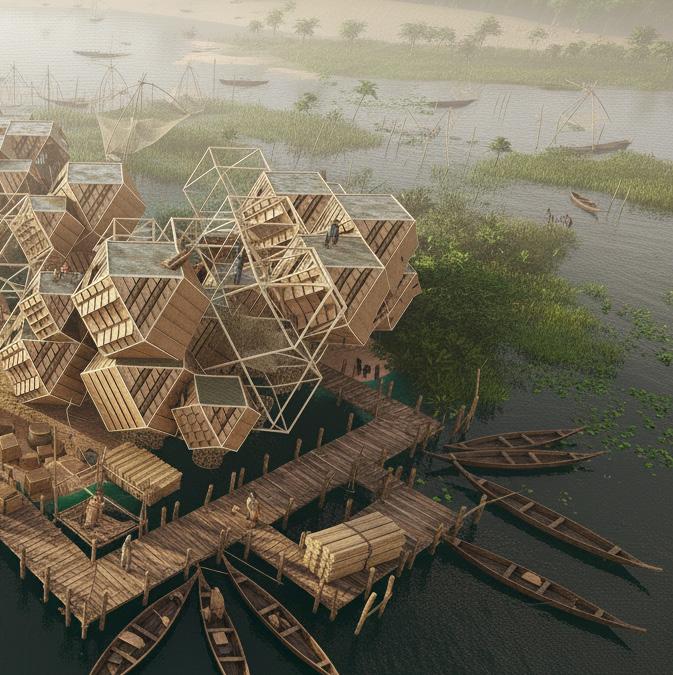
Fig. 31 : Tourism Zone – Cultural Village Perspective, Created by Author
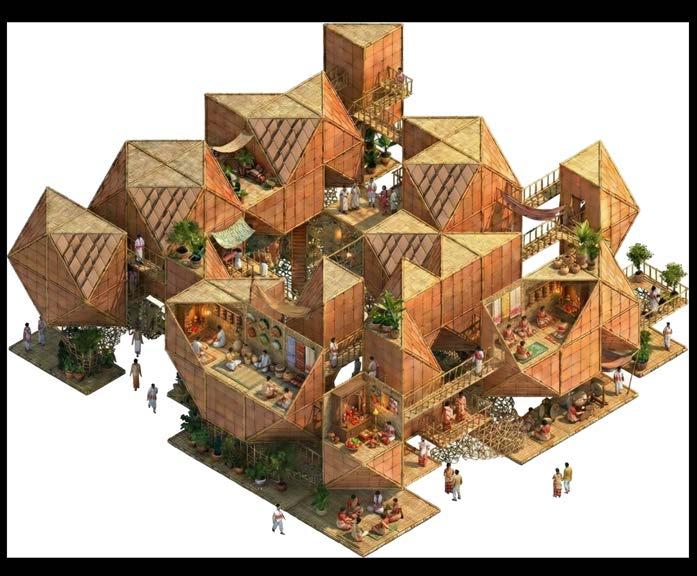
Fig. 32 : Market Zone – Community Trade and Interaction Space, Created by Author
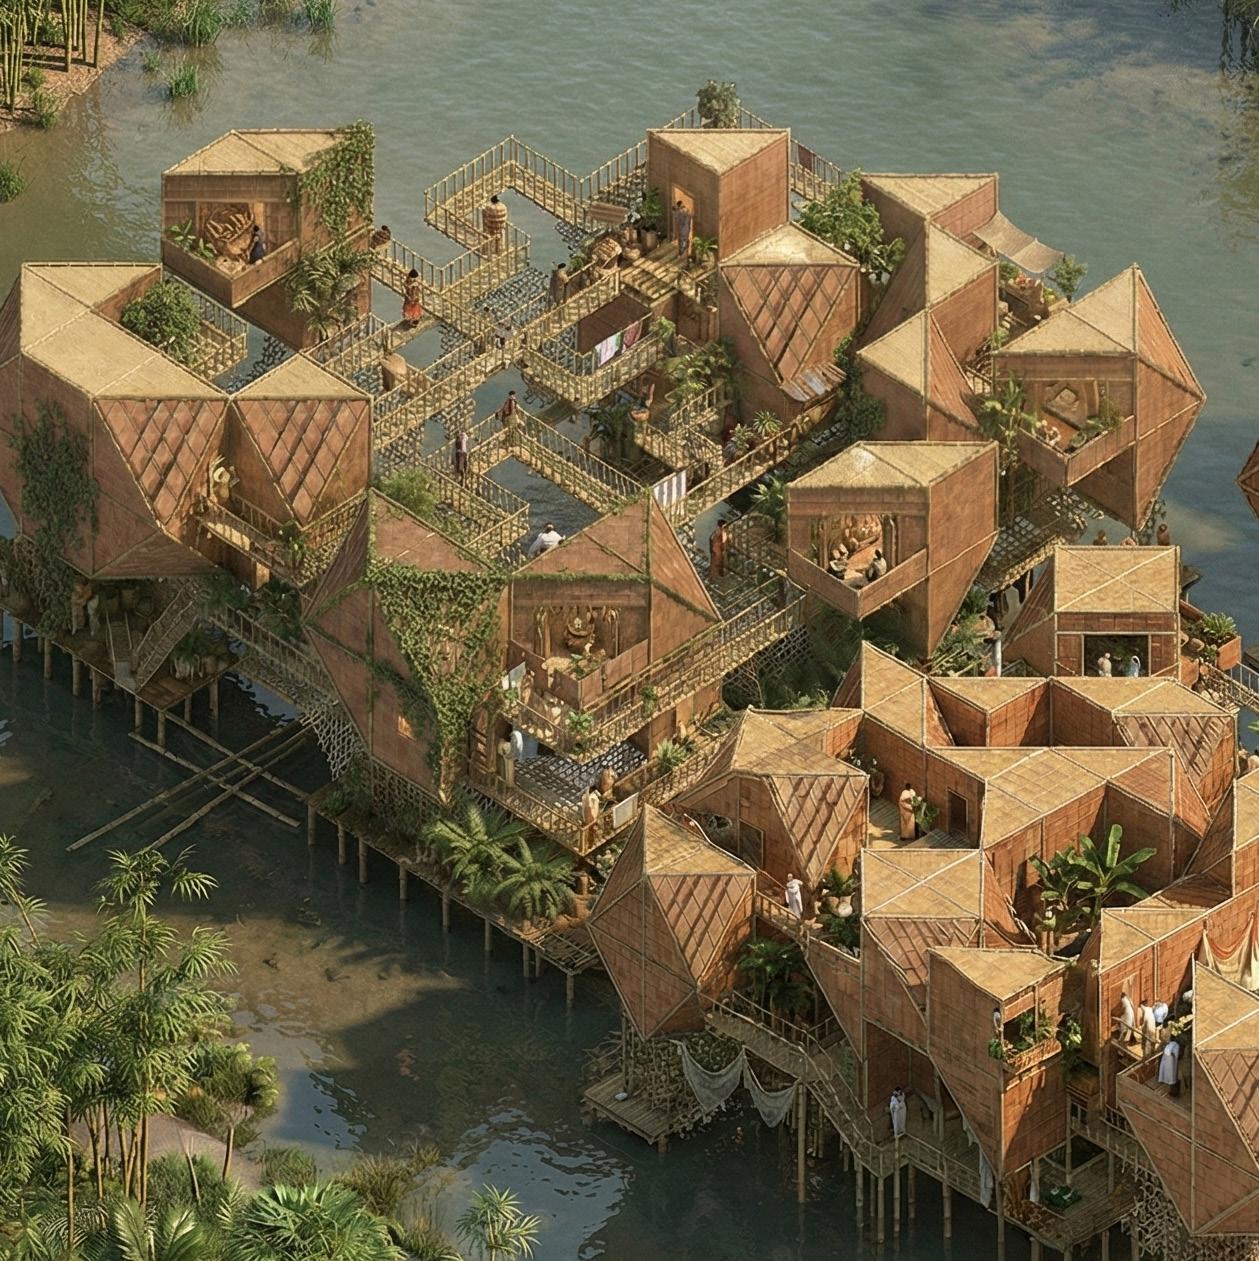
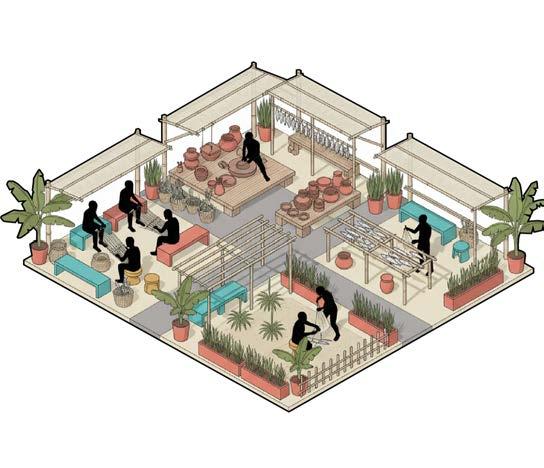
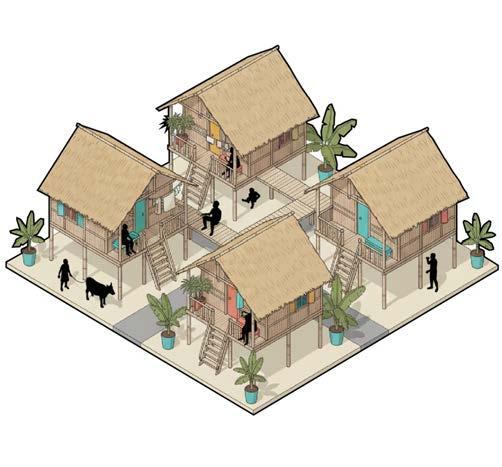
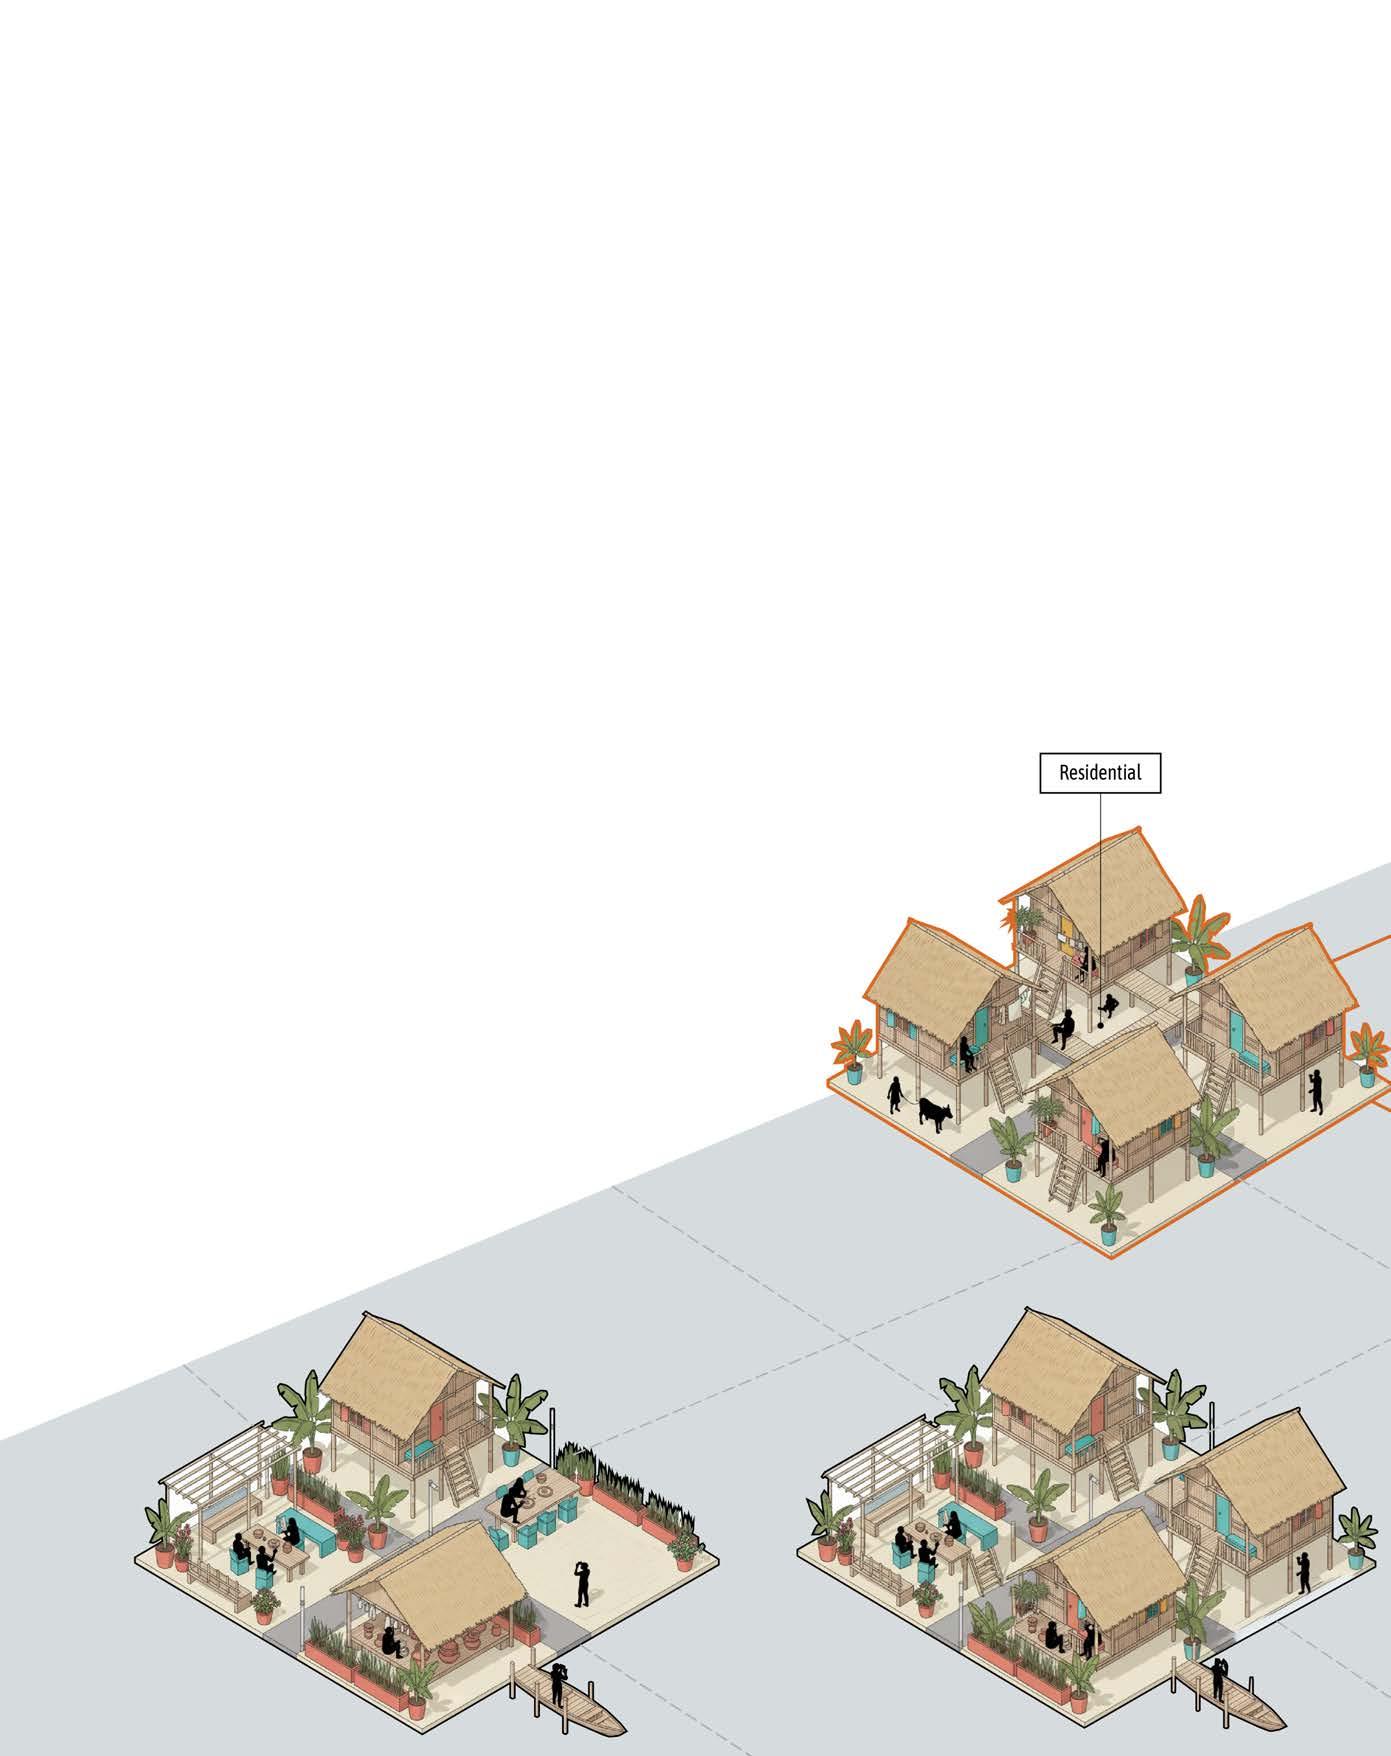
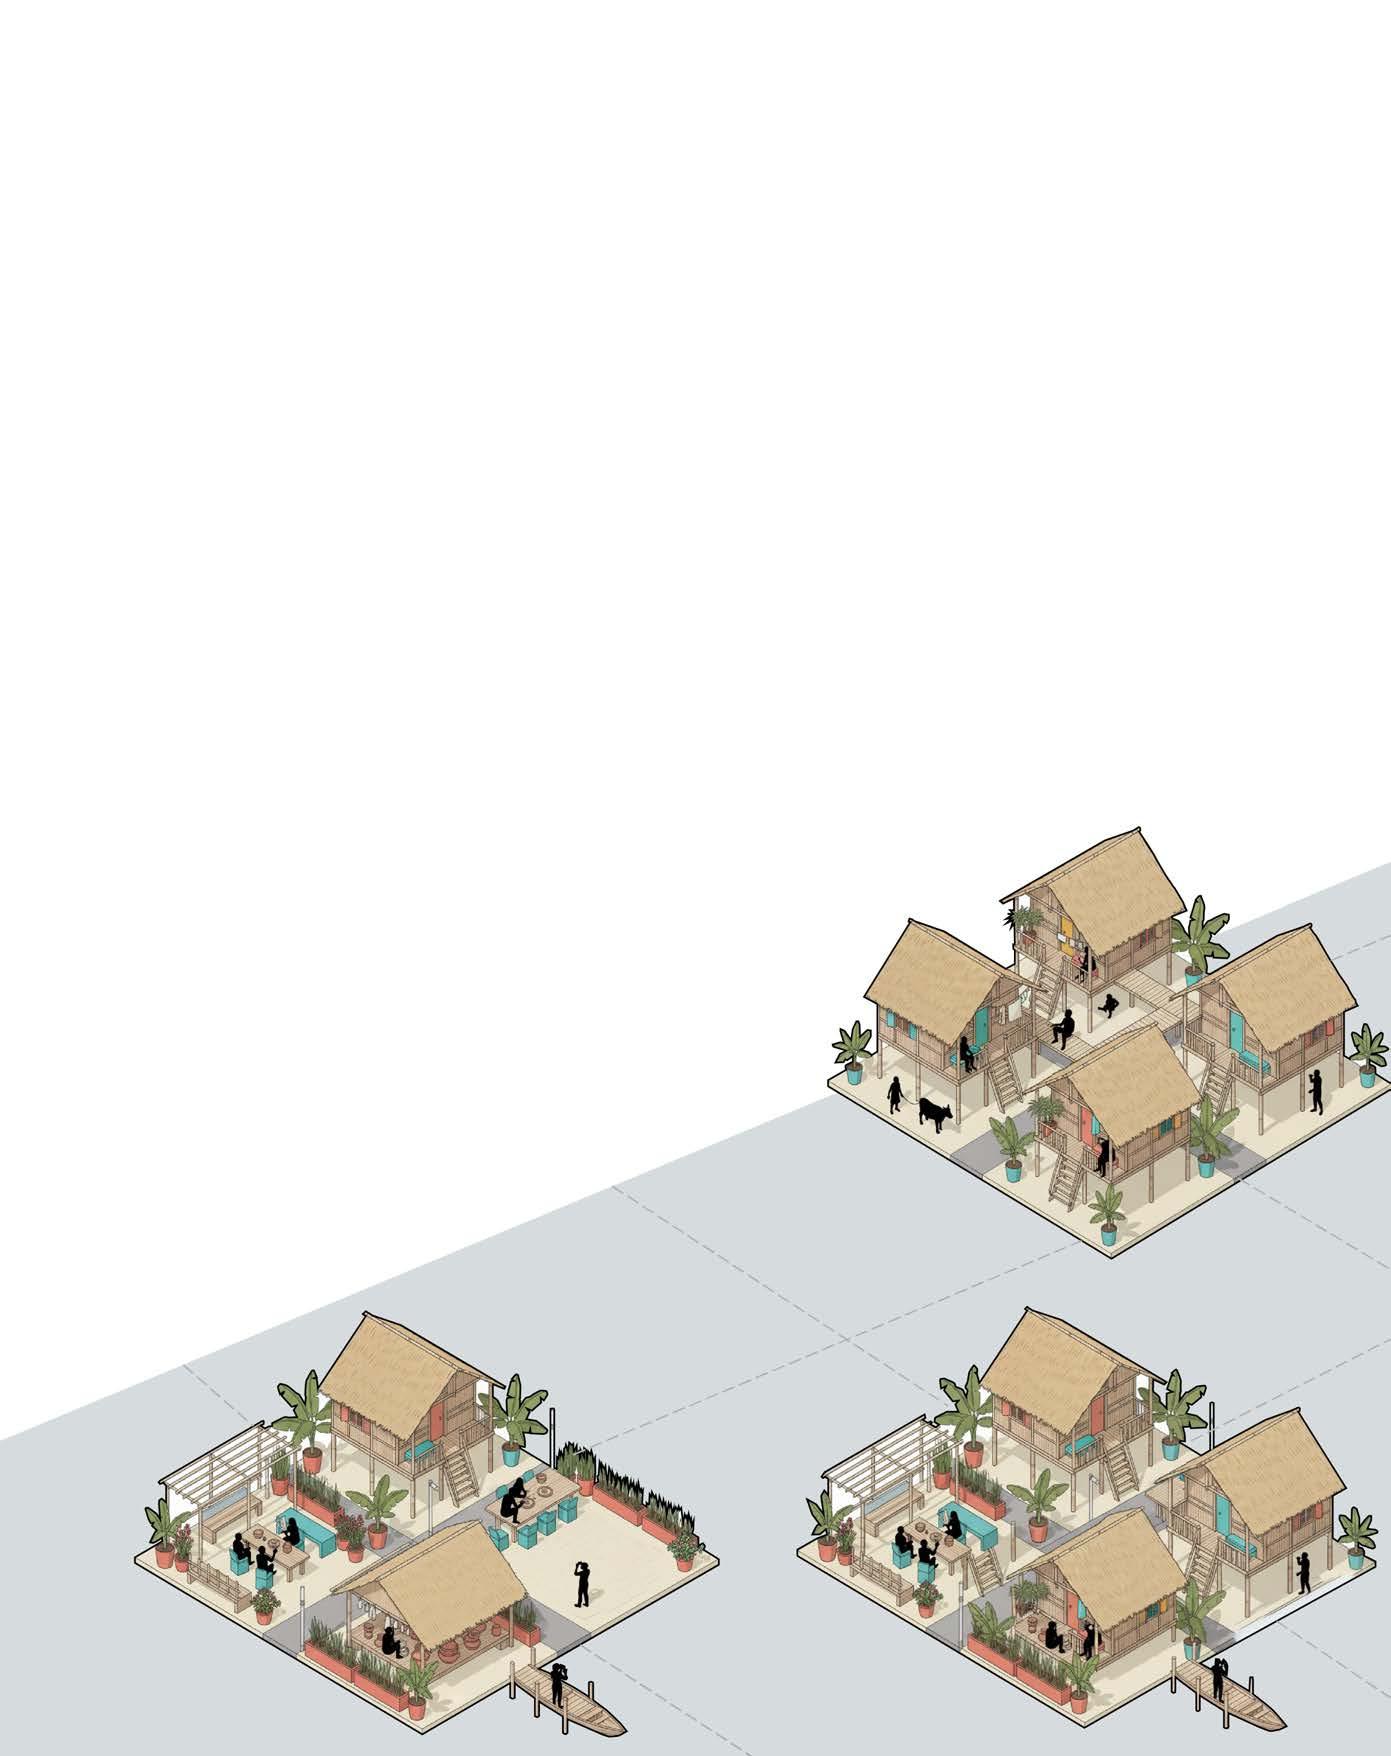
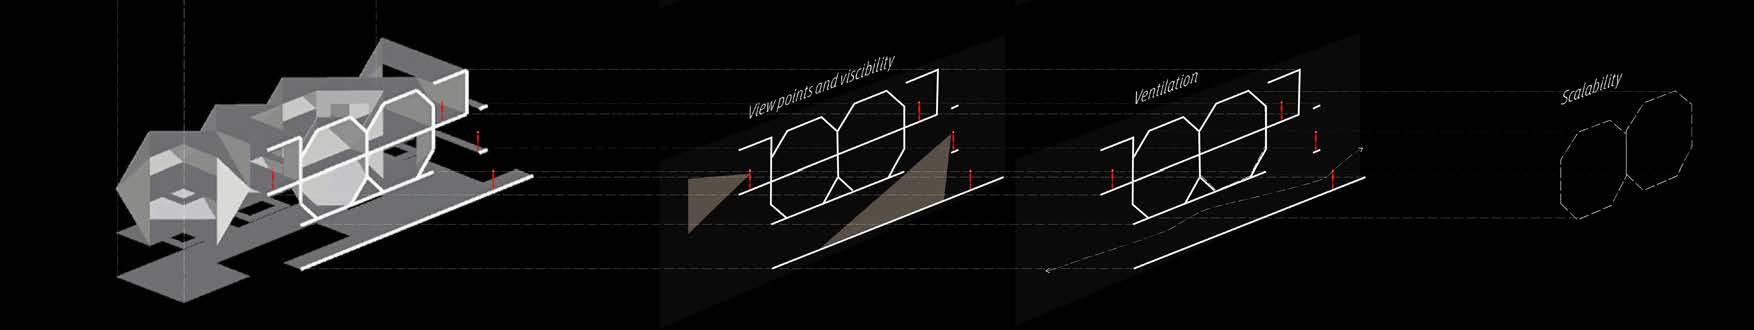
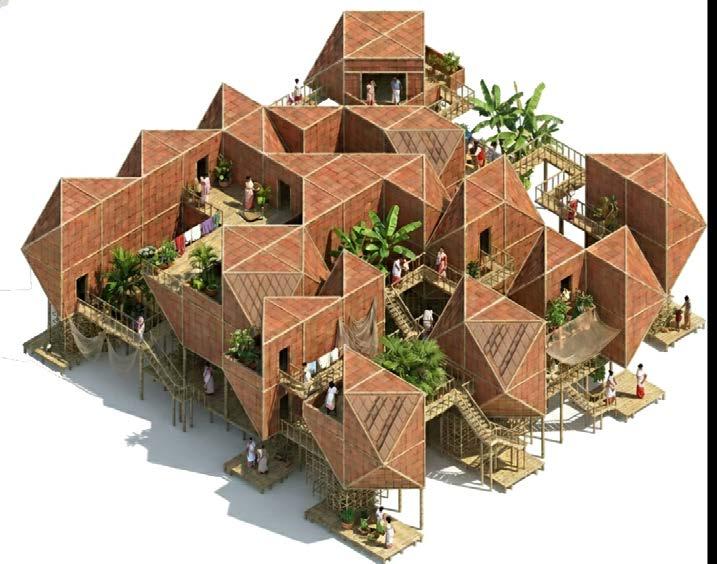
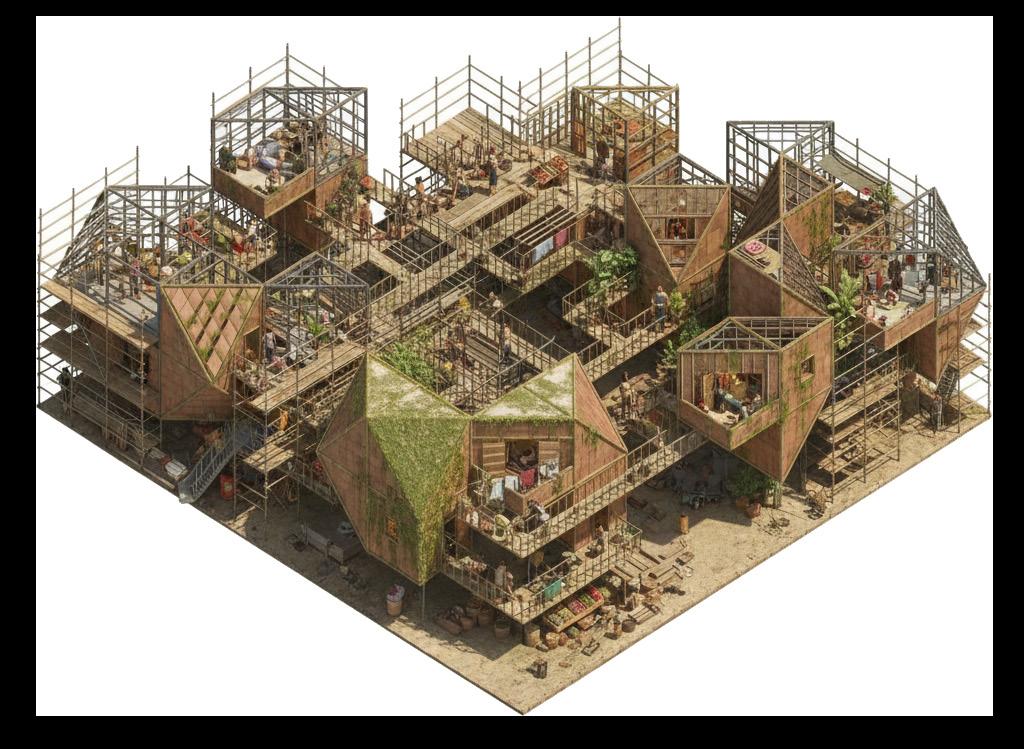
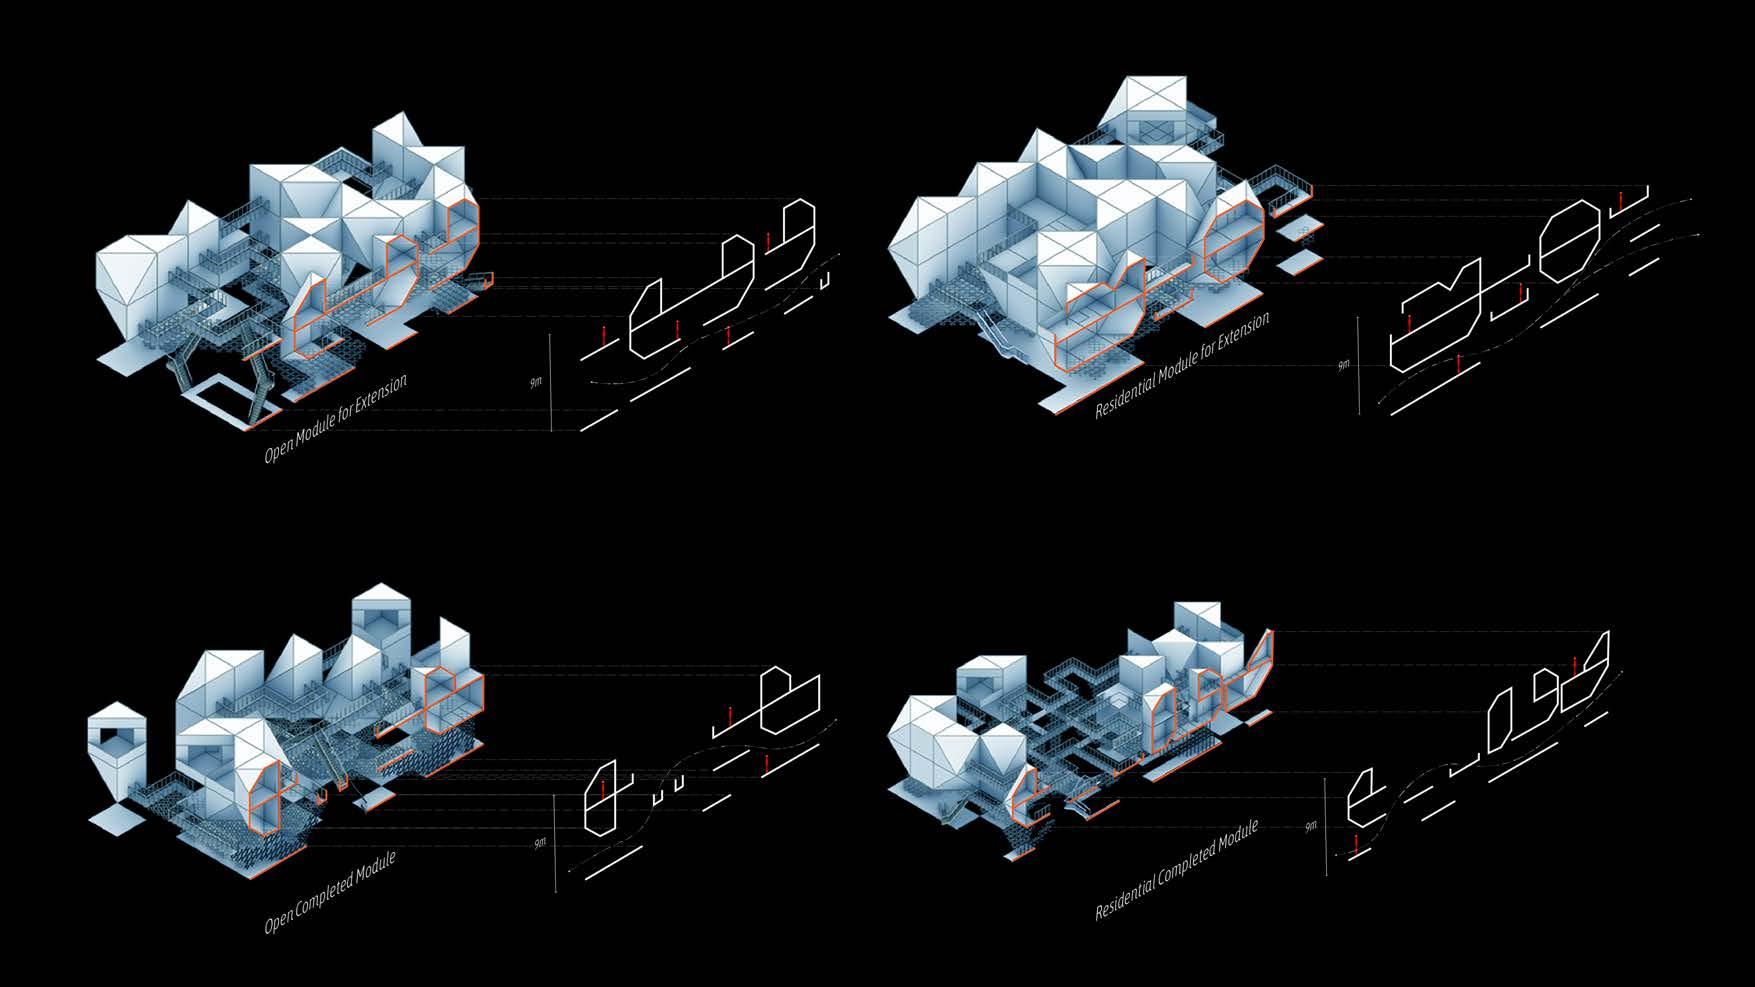
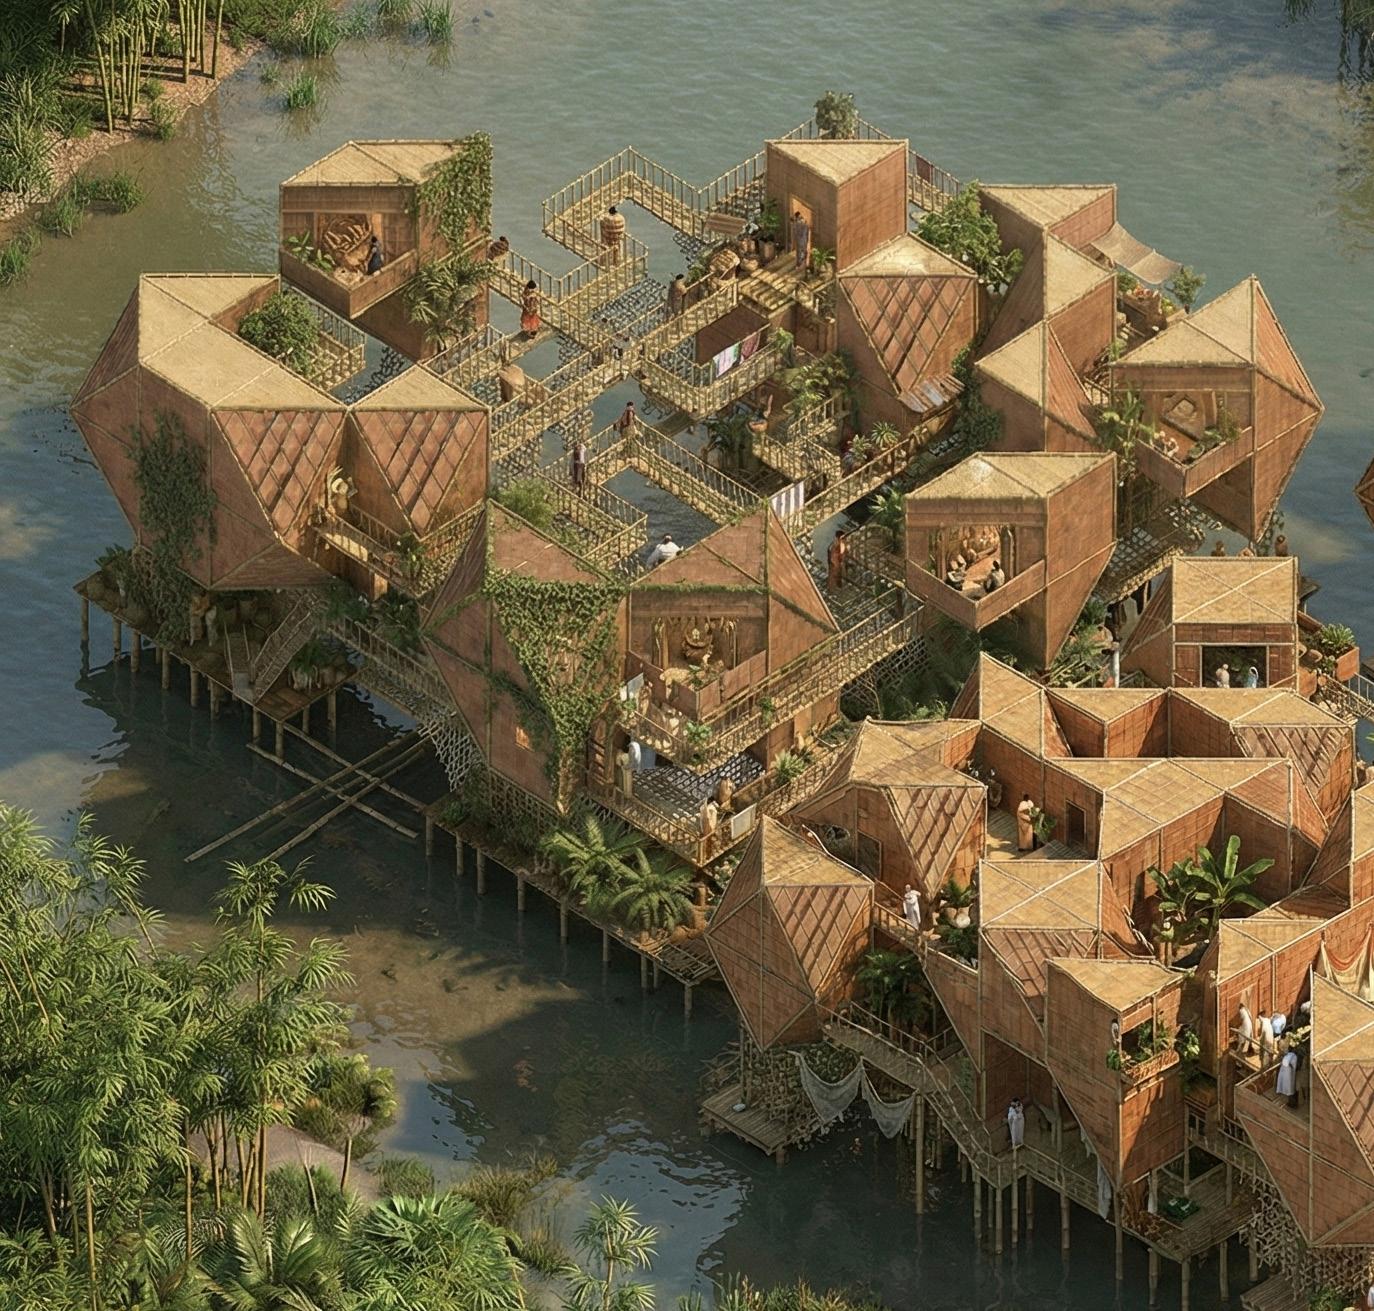
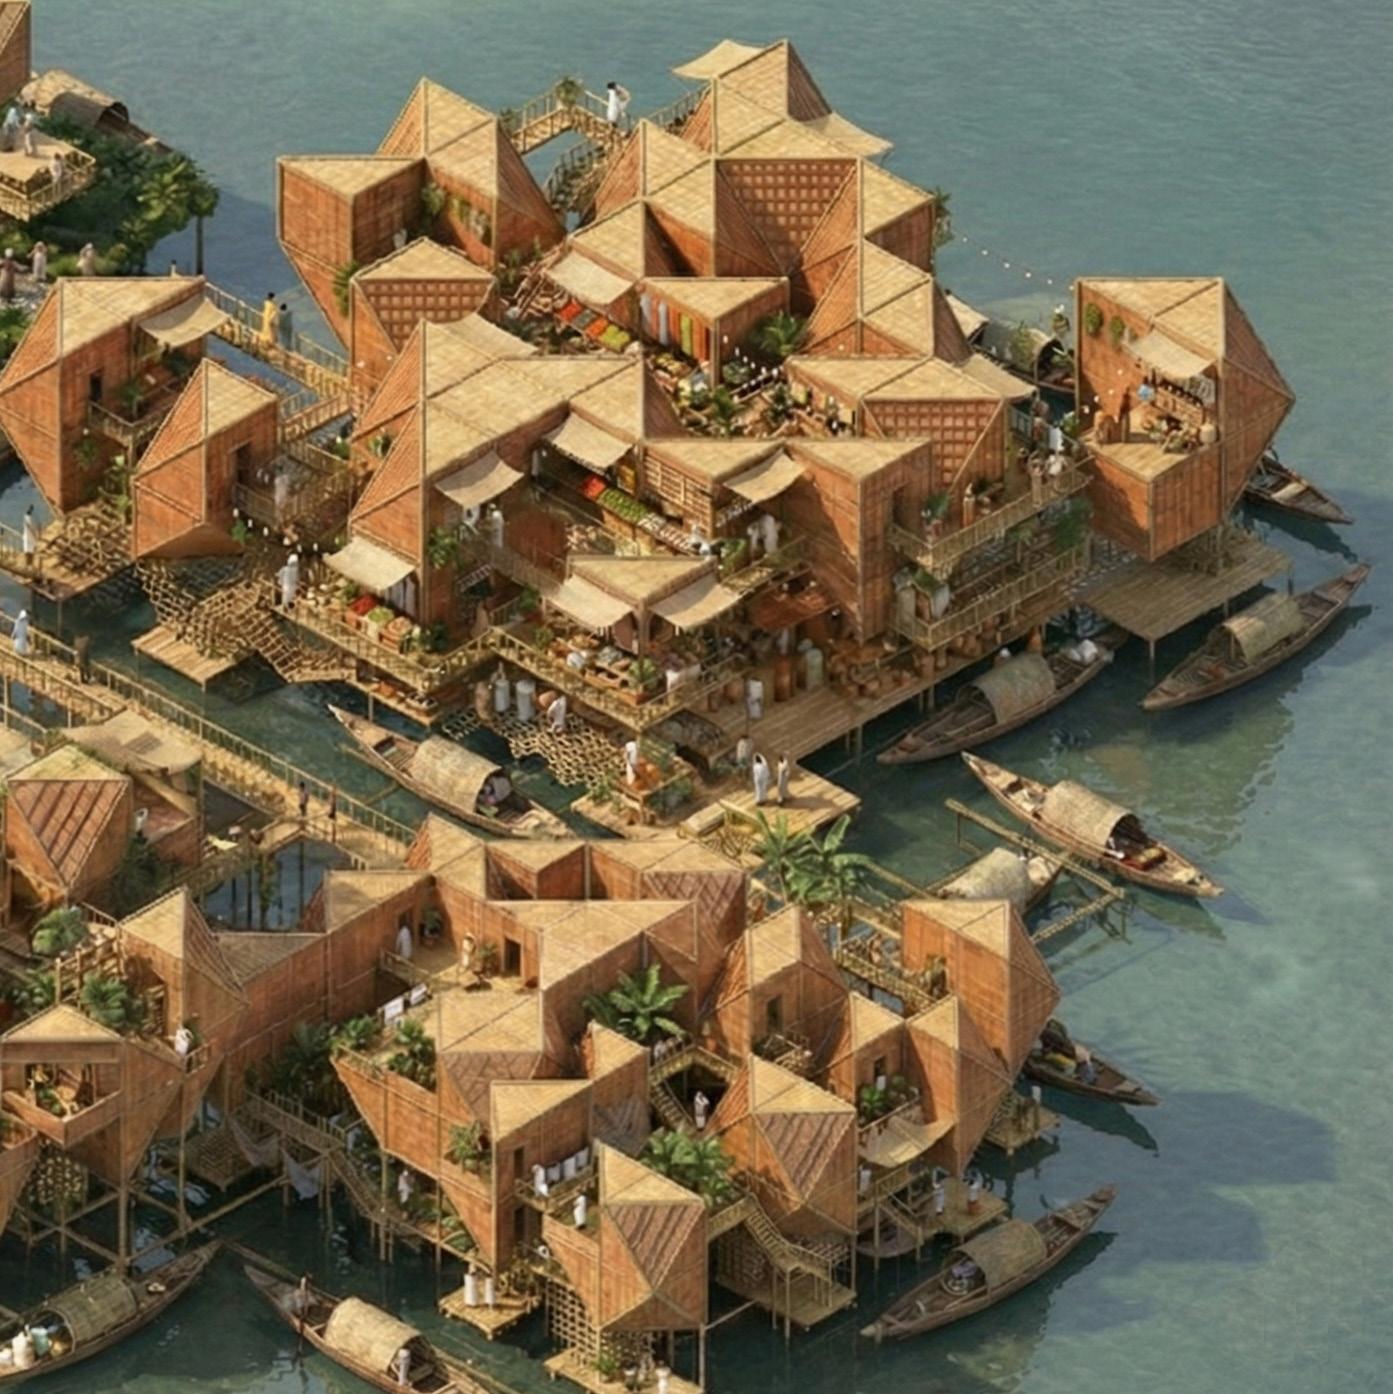
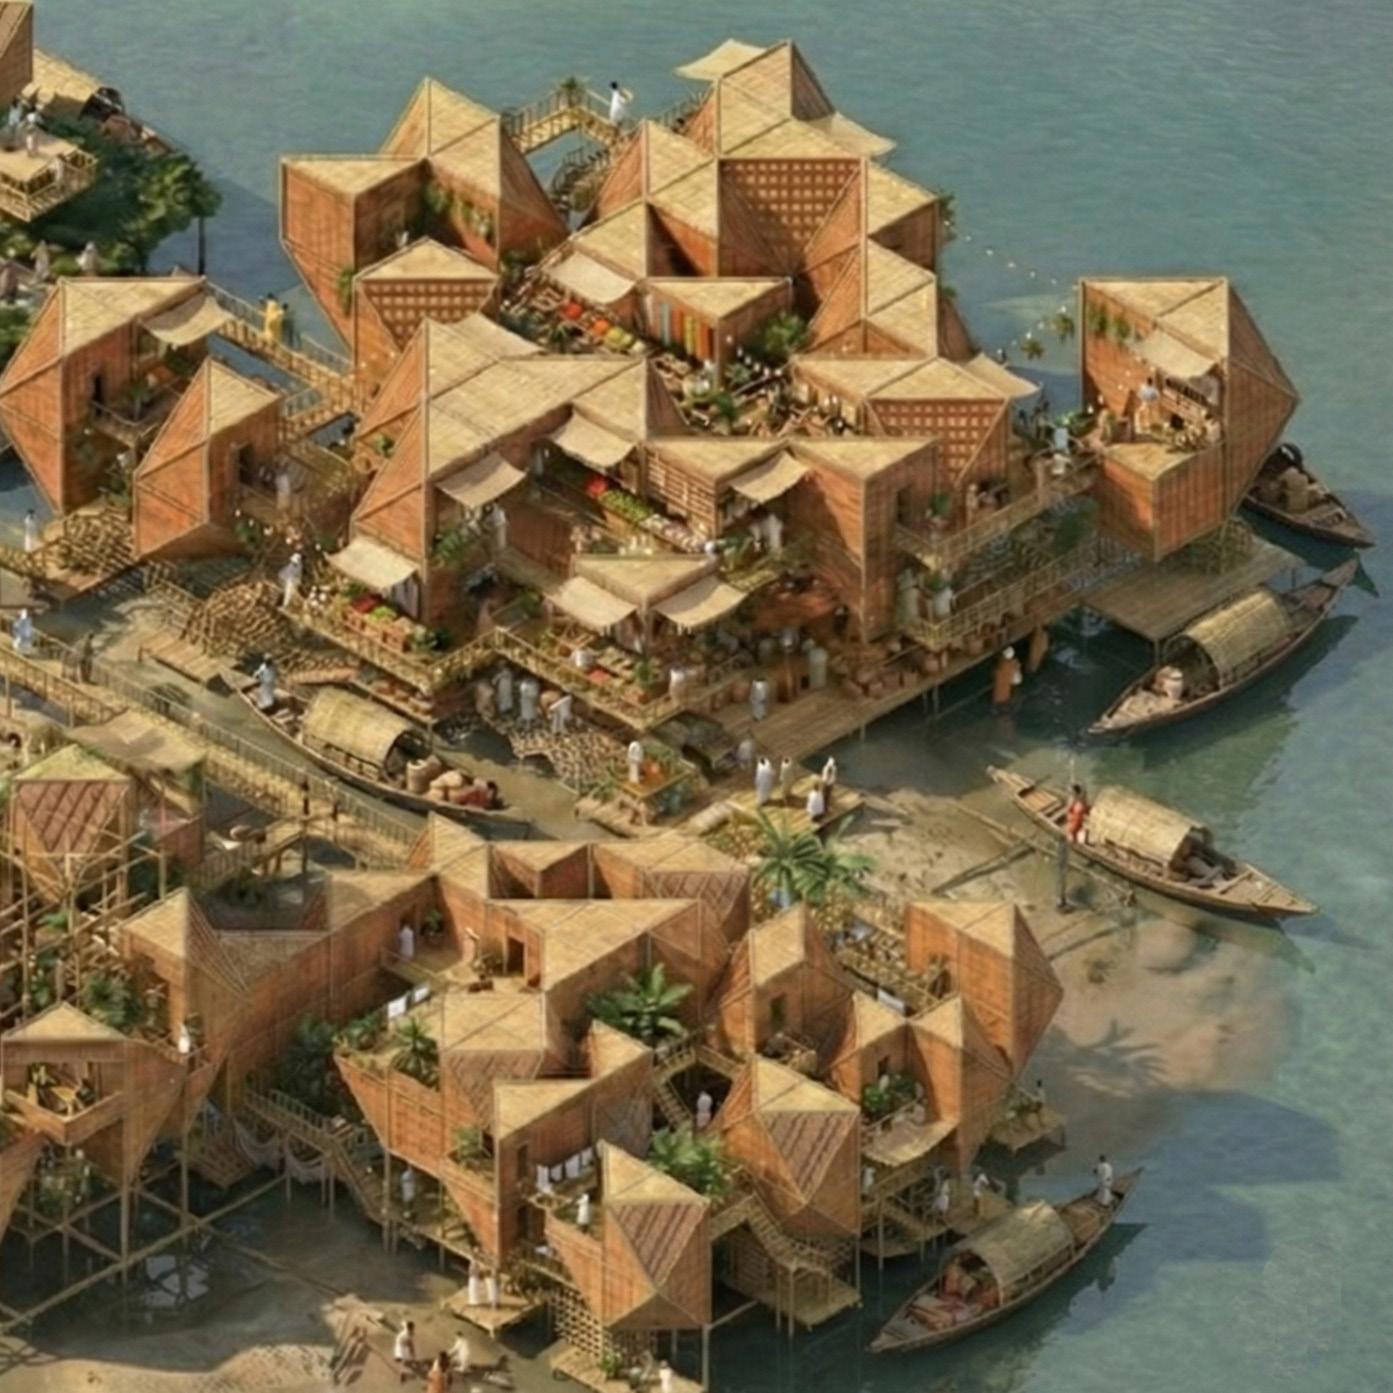
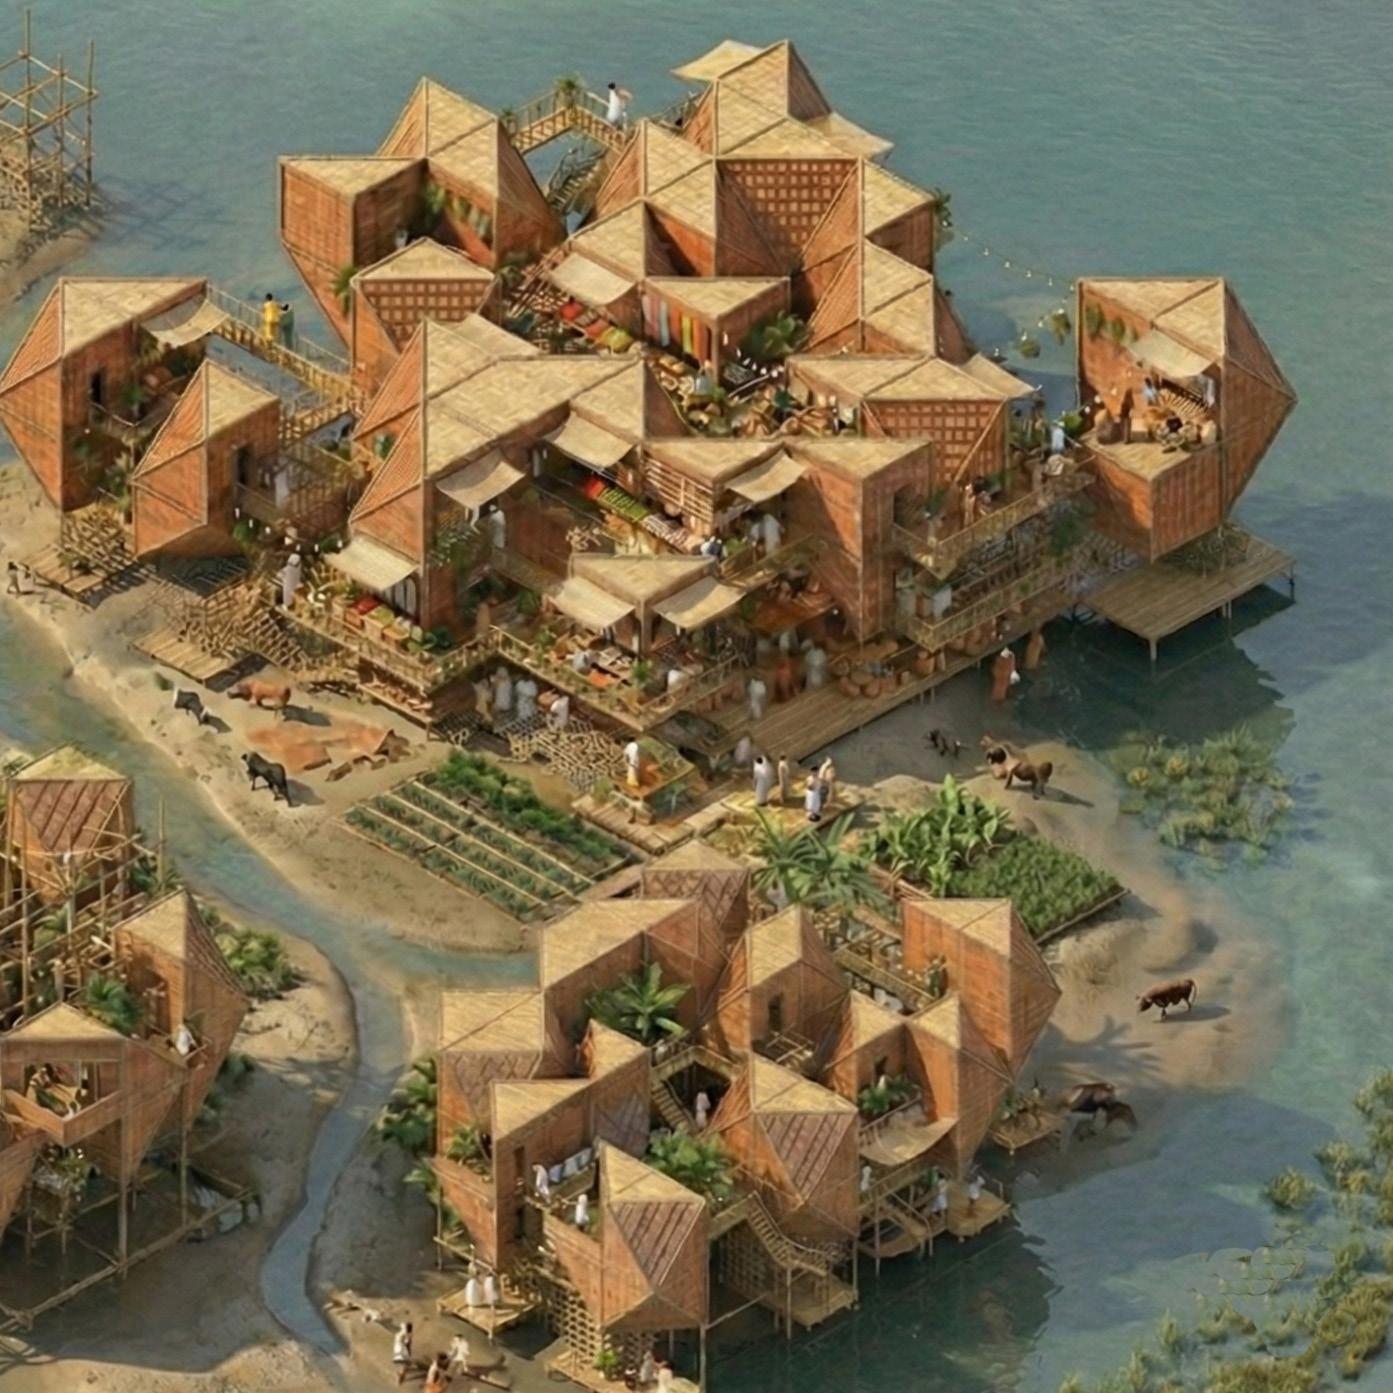
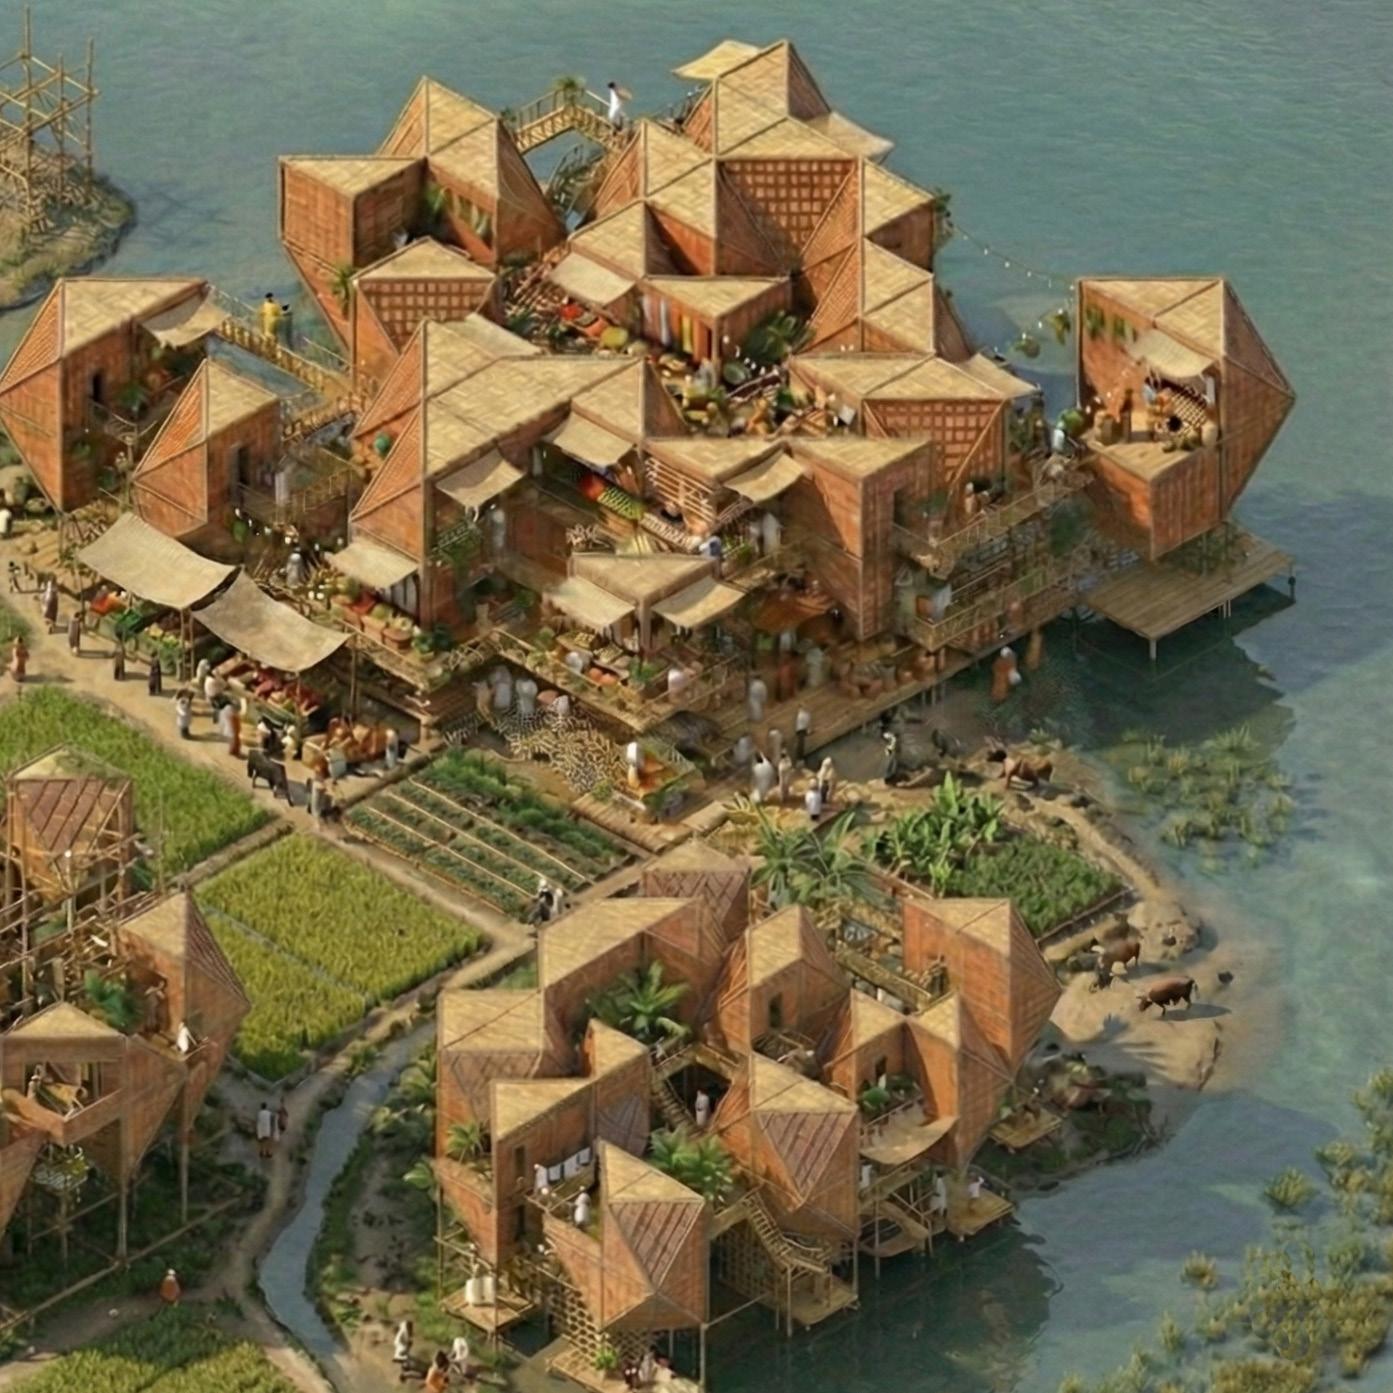
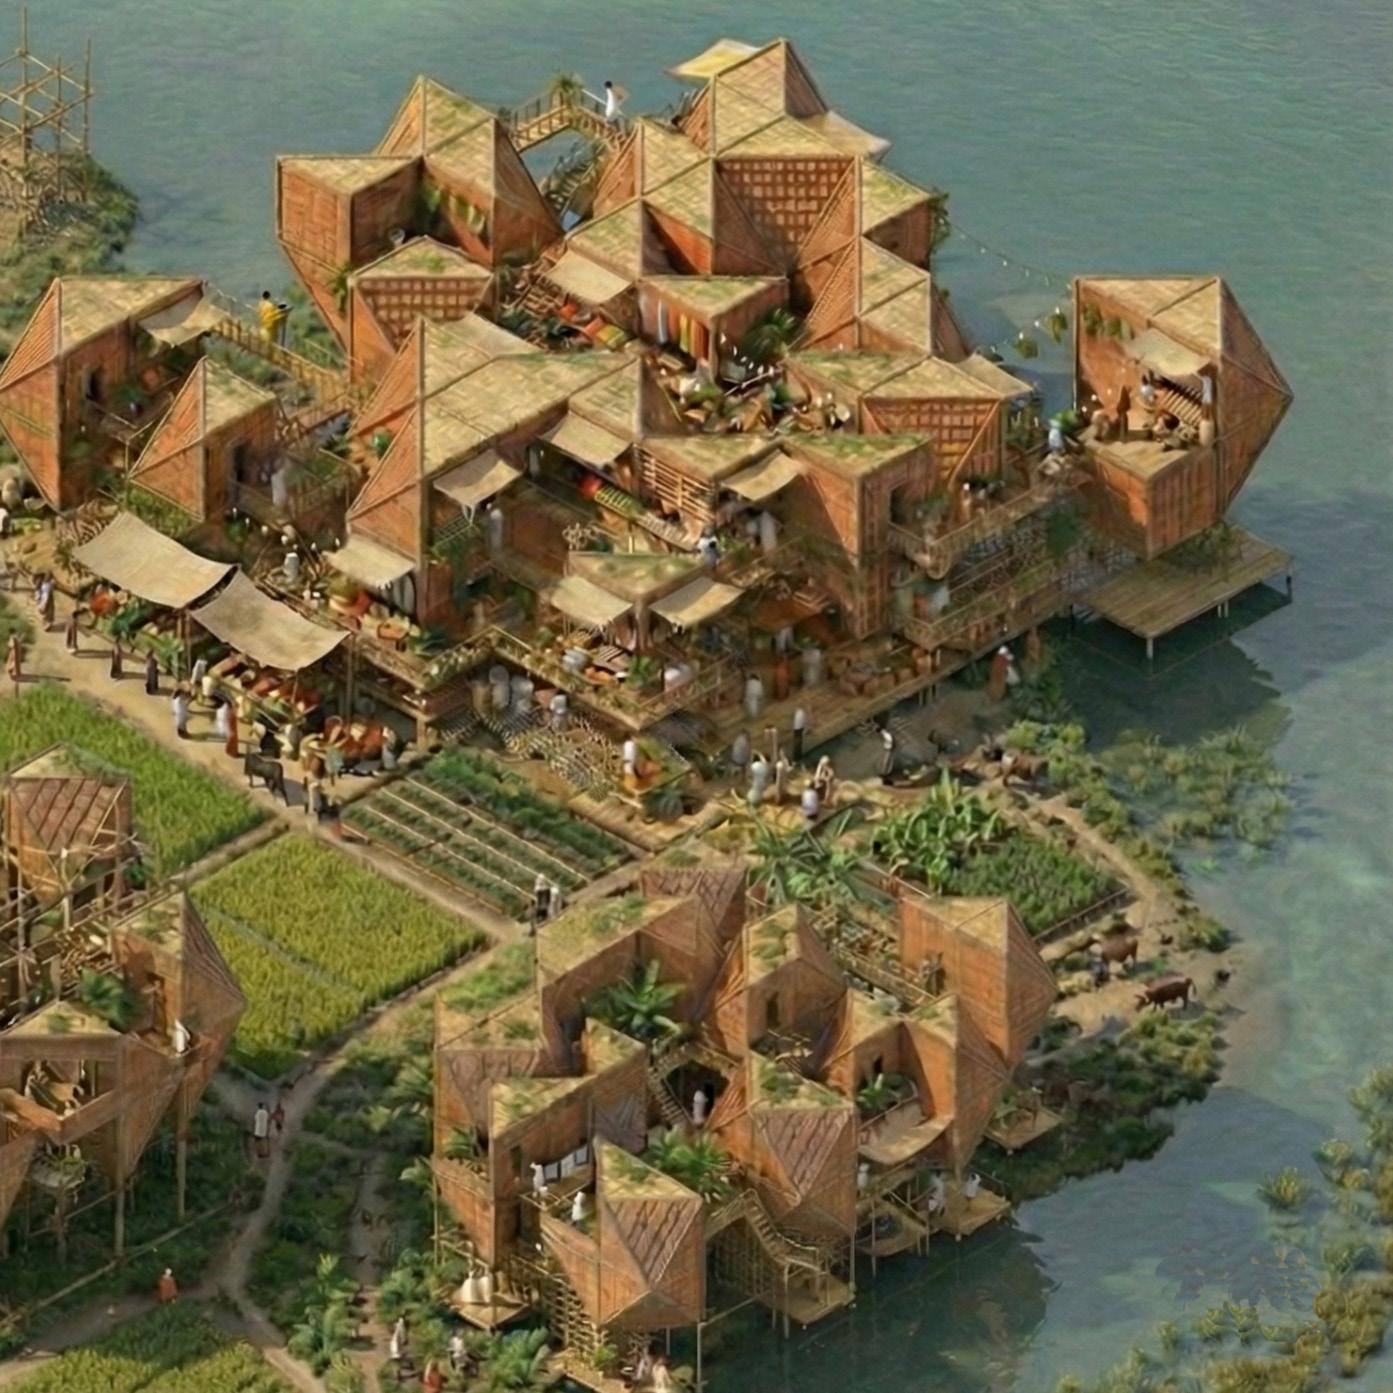
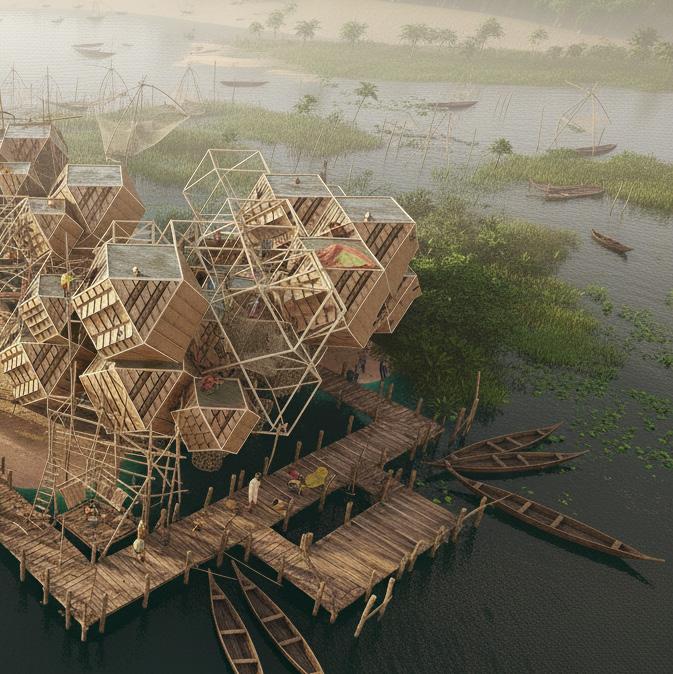
The residential zone is dedicated to long-term habitation and stability, serving permanent and semi-permanent residents as its primary users. Around 90% of occupancy is by the local population, with only 10% tourist presence, establishing a ratio of 9:1. Key activities include family living, domestic routines, and accommodation for students or artist residencies. The spatial configuration prioritizes privacy and clustering, with shared courtyards supporting everyday social interaction. Architecturally, the zone allows incremental growth, enabling dwellings to expand or adapt over time as land conditions stabilize, reinforcing residence as the most consolidated and permanent layer of the settlement.
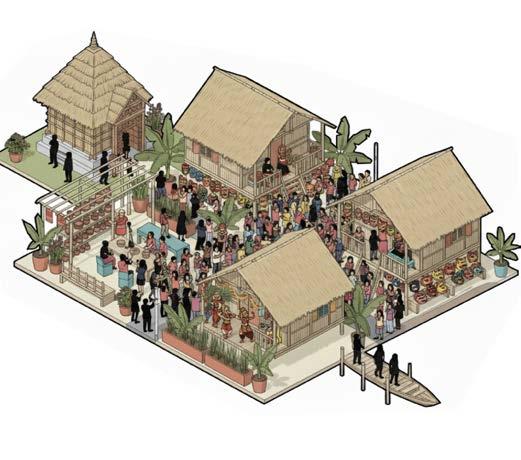
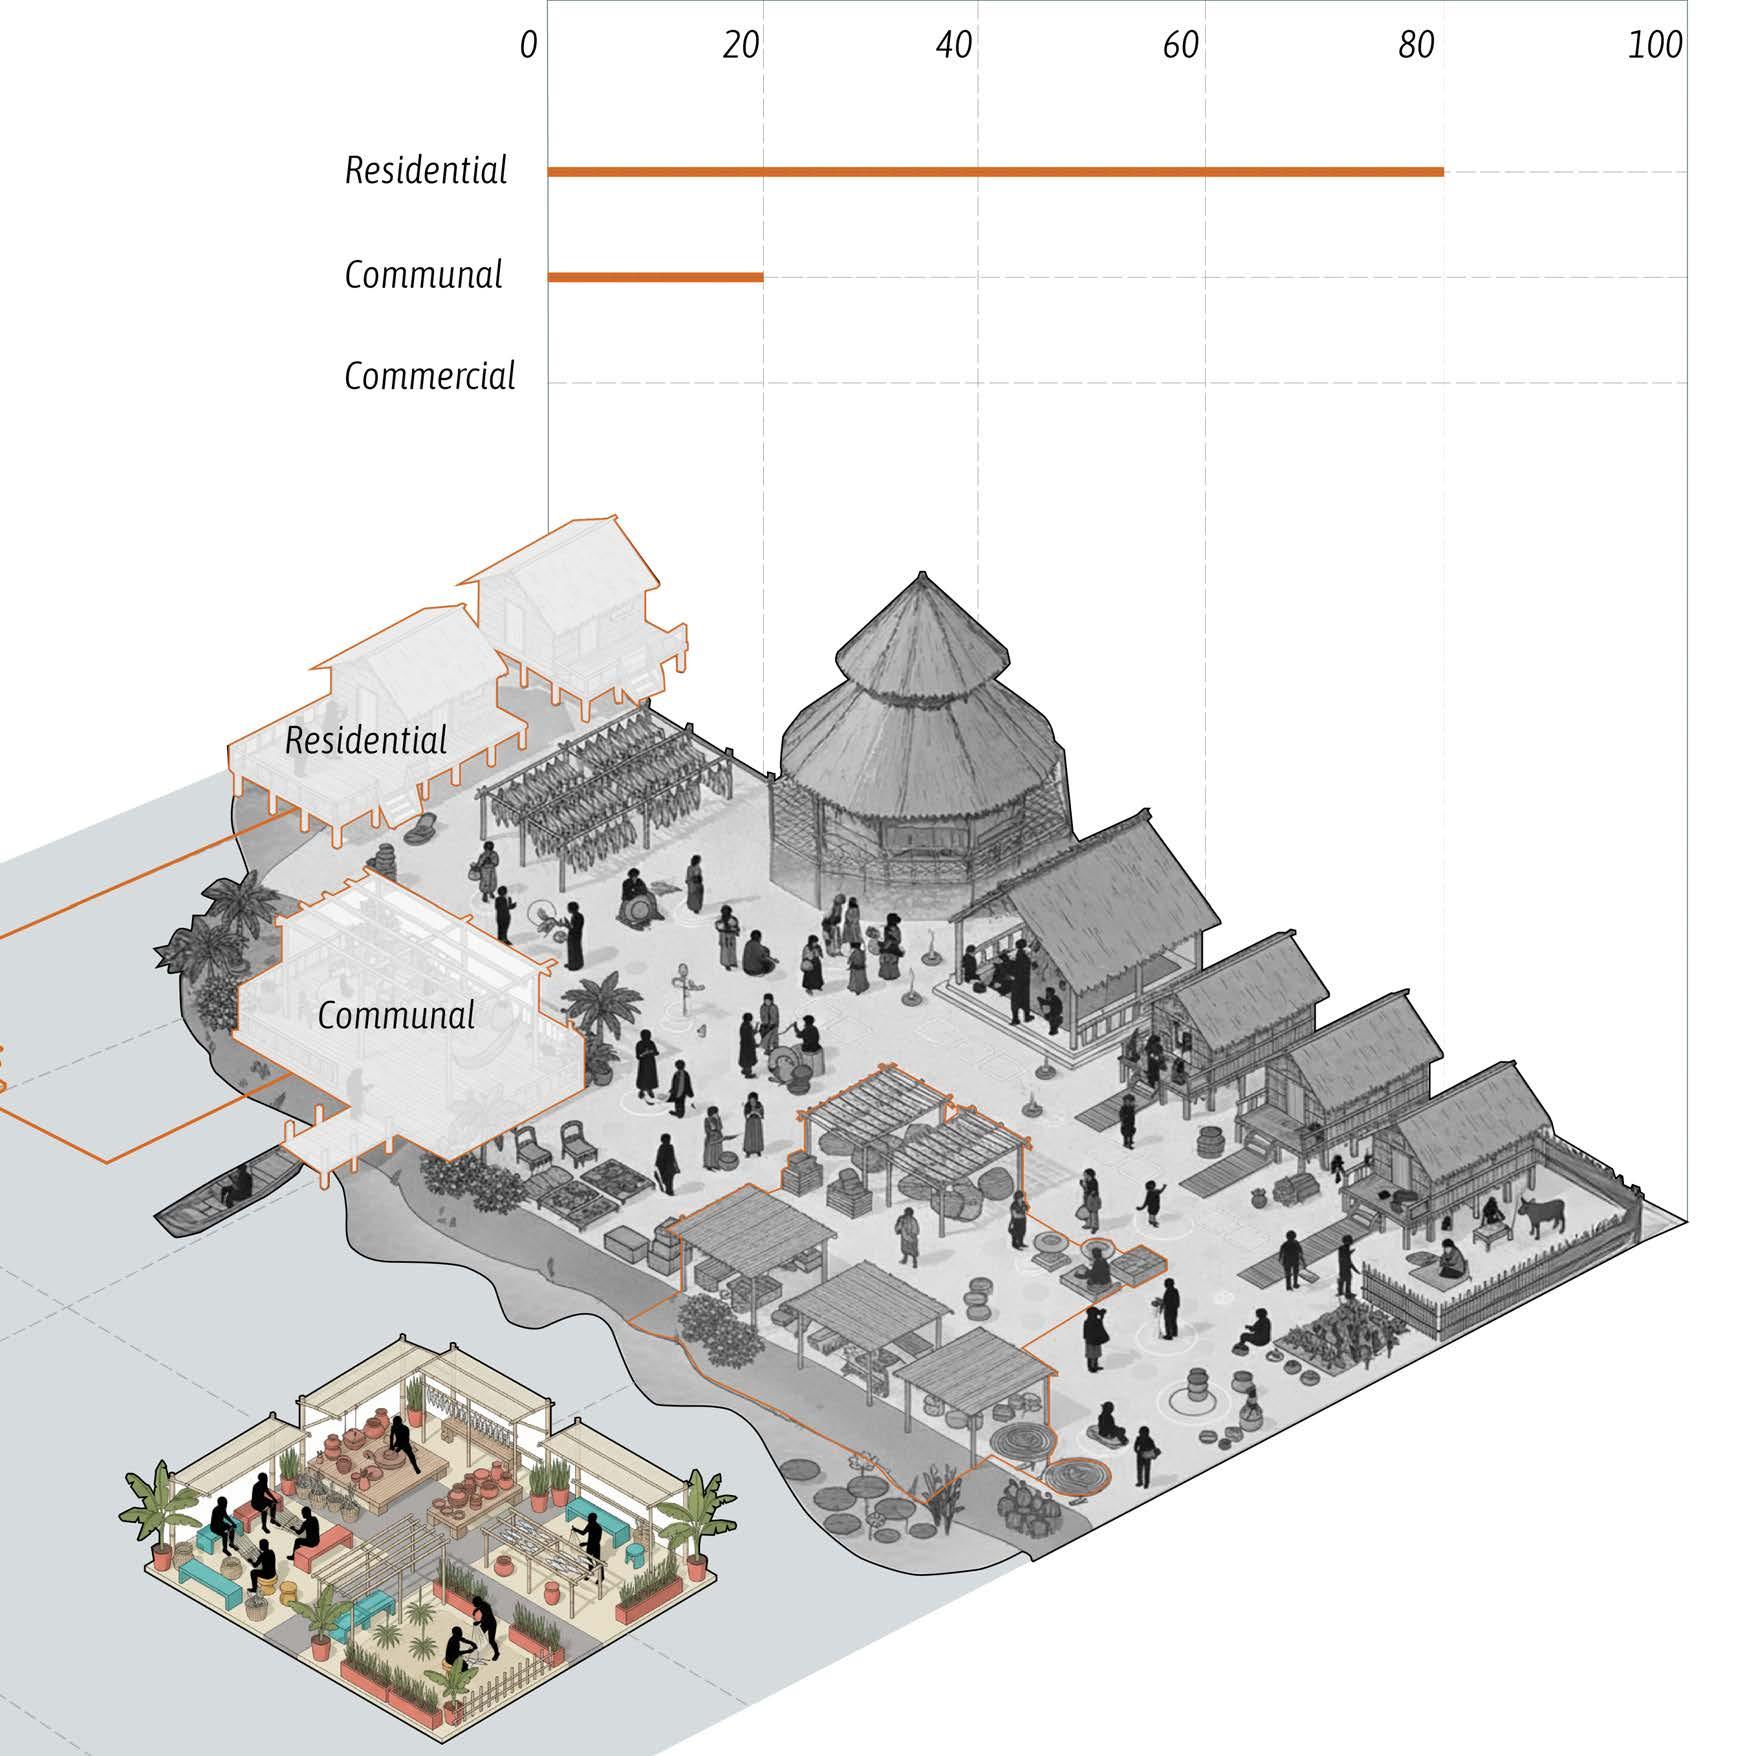
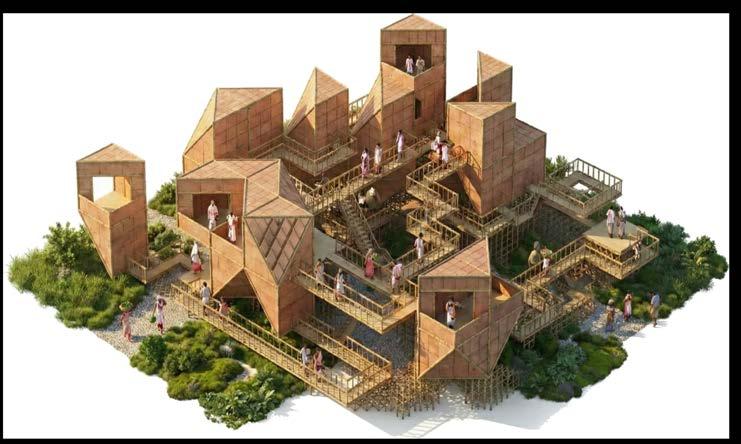
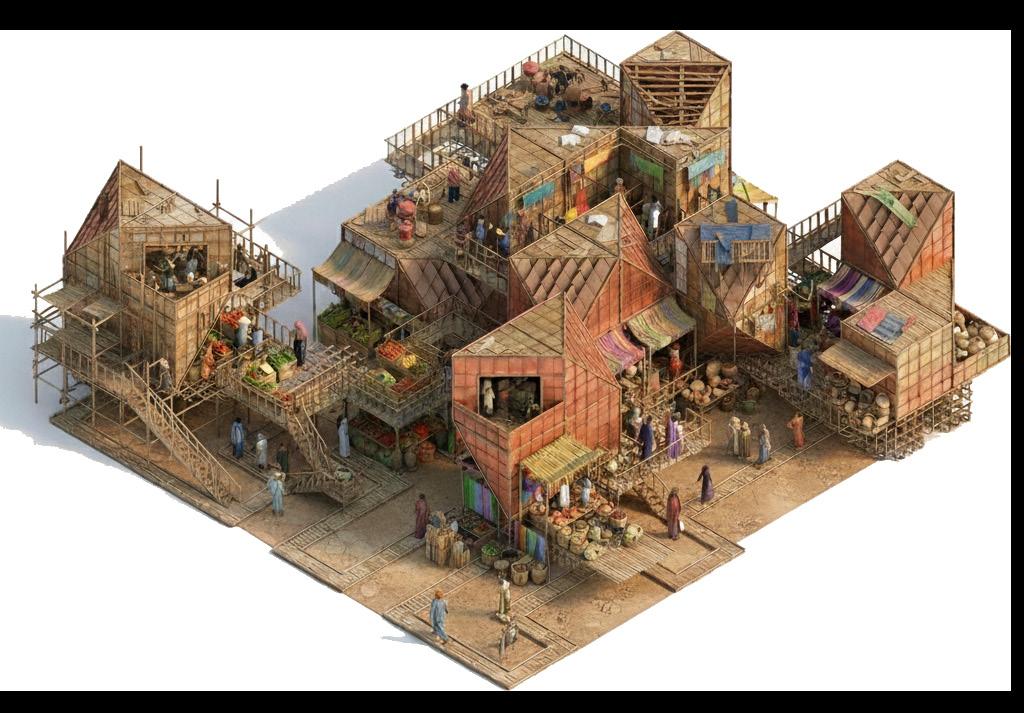
The communal zone serves as the social and cultural core of the settlement, primarily used by village residents with a limited presence of visiting guests. Approximately 80% of users are from the local population, while tourist flow remains around 20%, maintaining a ratio of 4:1. This balance ensures that daily life remains community-driven rather than visitor-oriented. Key activities include daily gatherings, community meetings, shared cooking, and Nam Ghar–related functions, reinforcing collective identity and social cohesion. Architecturally, the space is designed to be open and flexible, allowing it to accommodate both everyday use and periodic intensification during festivals or communal events without disrupting local rhythms.
Residential
Communal
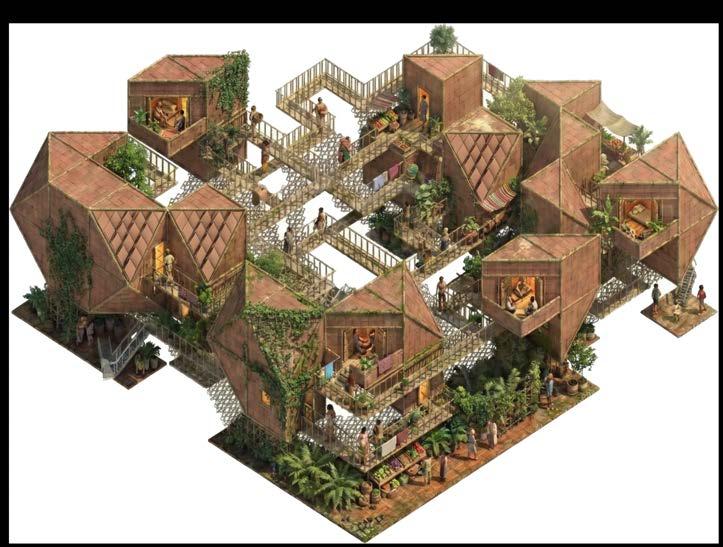
Fig. 33 : Residential Zone – Clustered Housing Typology, Created by Author
Fig. 34: Communal Zone – Shared Social and Cultural Space, Created by Author
Living Patterns: Residential
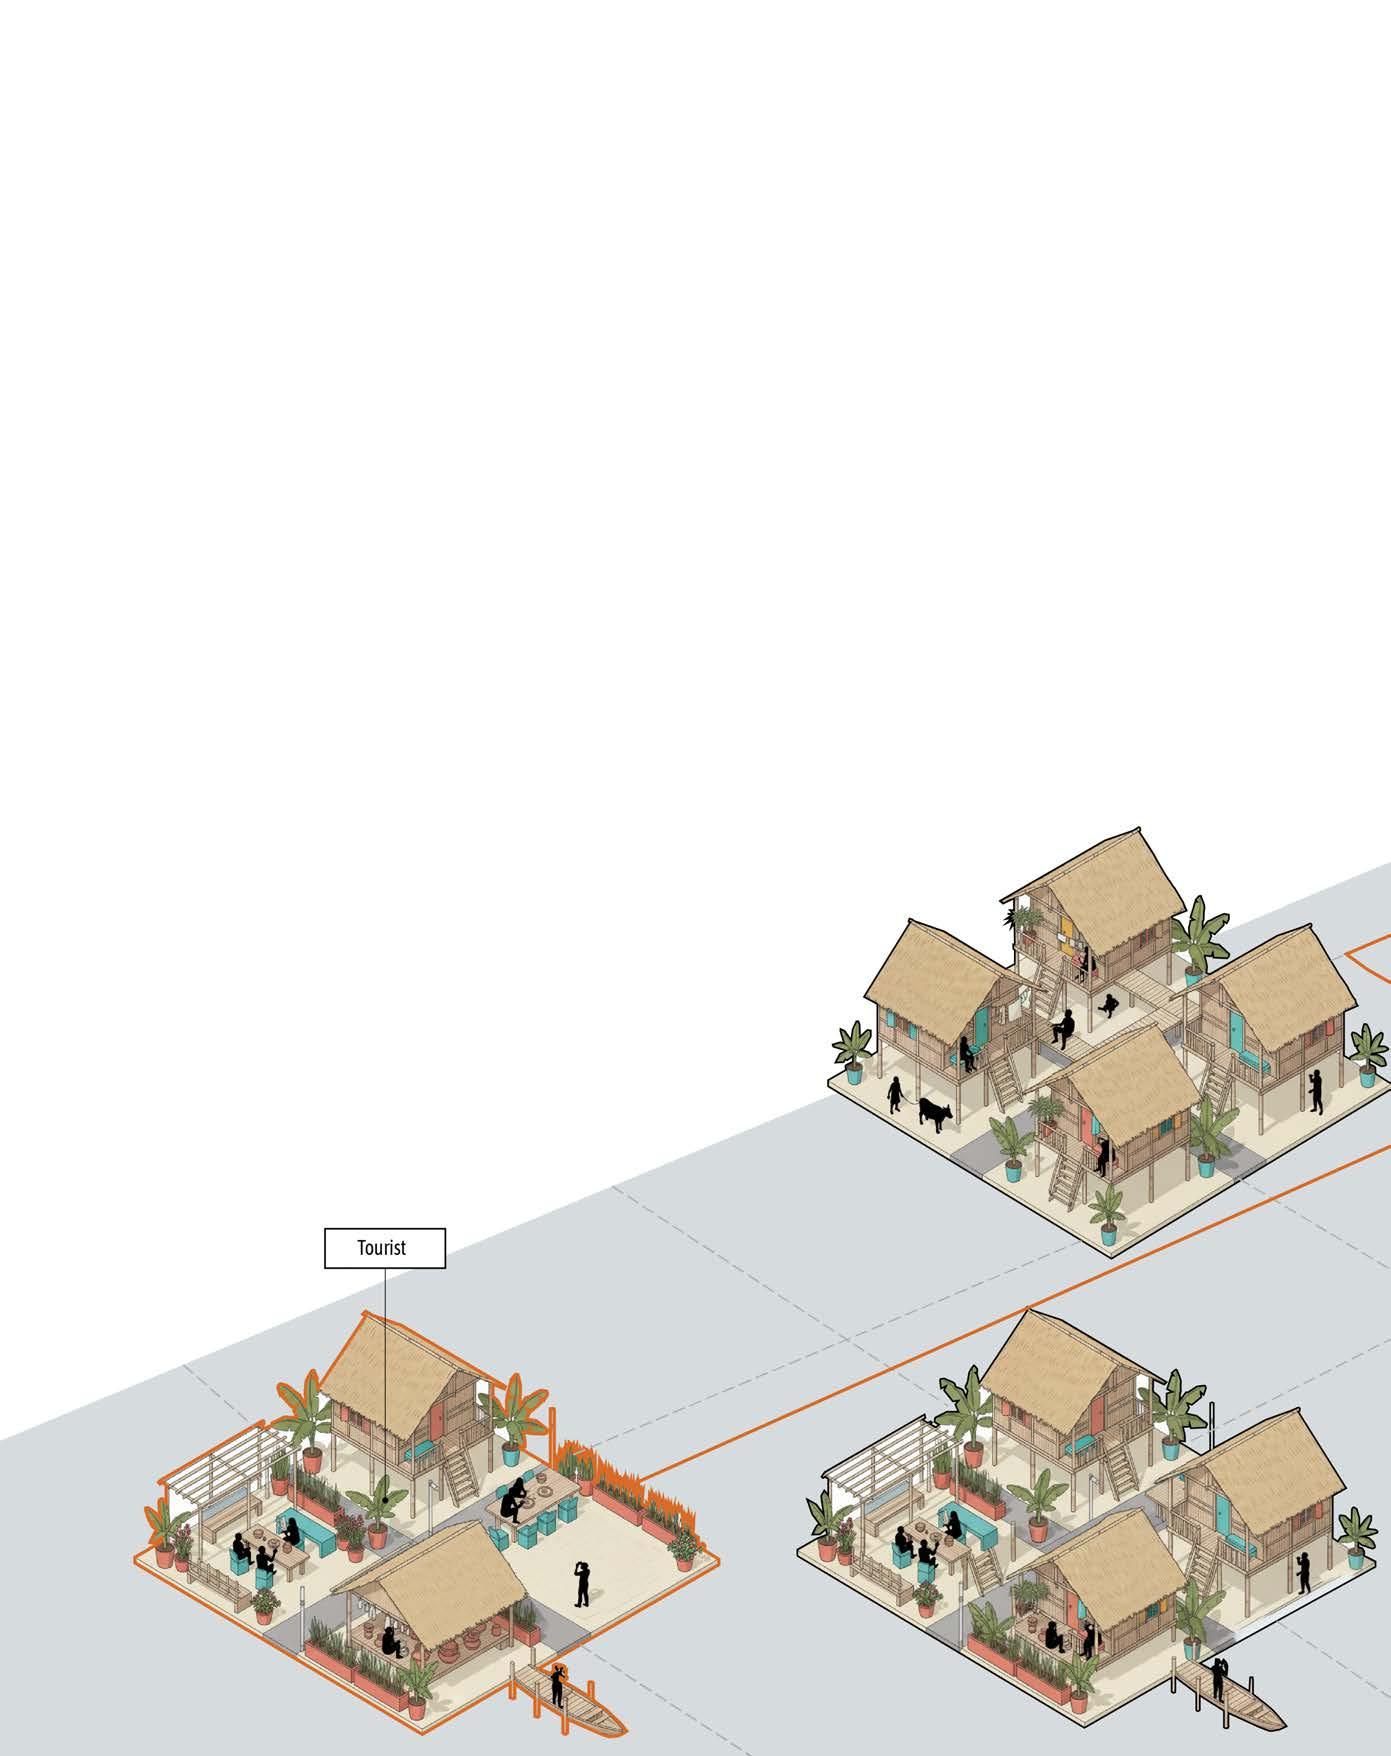
Majuli’s settlement structure emerges from a complex entanglement of ecological conditions, cultural traditions, and socio-economic demands. The island’s spatial organisation is not the product of rigid zoning but rather of an adaptive spatial ecology in which communal, market, residential, and tourism typologies coexist in a finely balanced system. These typologies do not operate as discrete zones; instead, they form an interdependent network capable of supporting both the steady rhythms of daily life and the episodic intensification produced by cultural festivals and seasonal migrations.
Each typology exhibits distinct spatial behaviours: communal areas serve as the nucleus of collective life, market zones enable the circulation of goods and cultural exchange, residential clusters stabilise long-term settlement continuity, and tourism spaces accommodate fluctuating external populations. Together, they constitute a resilient organisational framework that allows Majuli to absorb demographic variability without compromising cultural integrity
Fig. 35 : Spatial Relationship of Residential, Communal, and Commercial Zones in the Settlement, Created by Author
Living Patterns: Communal
The demographic composition across these zones highlights a carefully maintained equilibrium between local residents and visitors. Communal areas retain an overwhelmingly local character, with an 80:20 residentto-tourist ratio that preserves them as spaces of social cohesion and ritual continuity. Market areas demonstrate a more dynamic balance, with a 60:40 ratio reflecting their dual function as economic engines for locals and cultural interfaces for visitors. Residential zones housing permanent and semi-permanent inhabitants exhibit minimal tourist infiltration, reinforcing their role as protected environments for daily domestic life, apprenticeship traditions, and intergenerational knowledge transmission. Conversely, tourism zones invert this demographic pattern, with visitors forming the majority presence. These asymmetries reveal a spatial choreography in which resource allocation, access control, and infrastructural provision are strategically modulated to safeguard the island’s cultural and social stability
Fig. 36 : Spatial Relationship of Residential, Communal and Commercial Zones in the Settlement, Created by Author
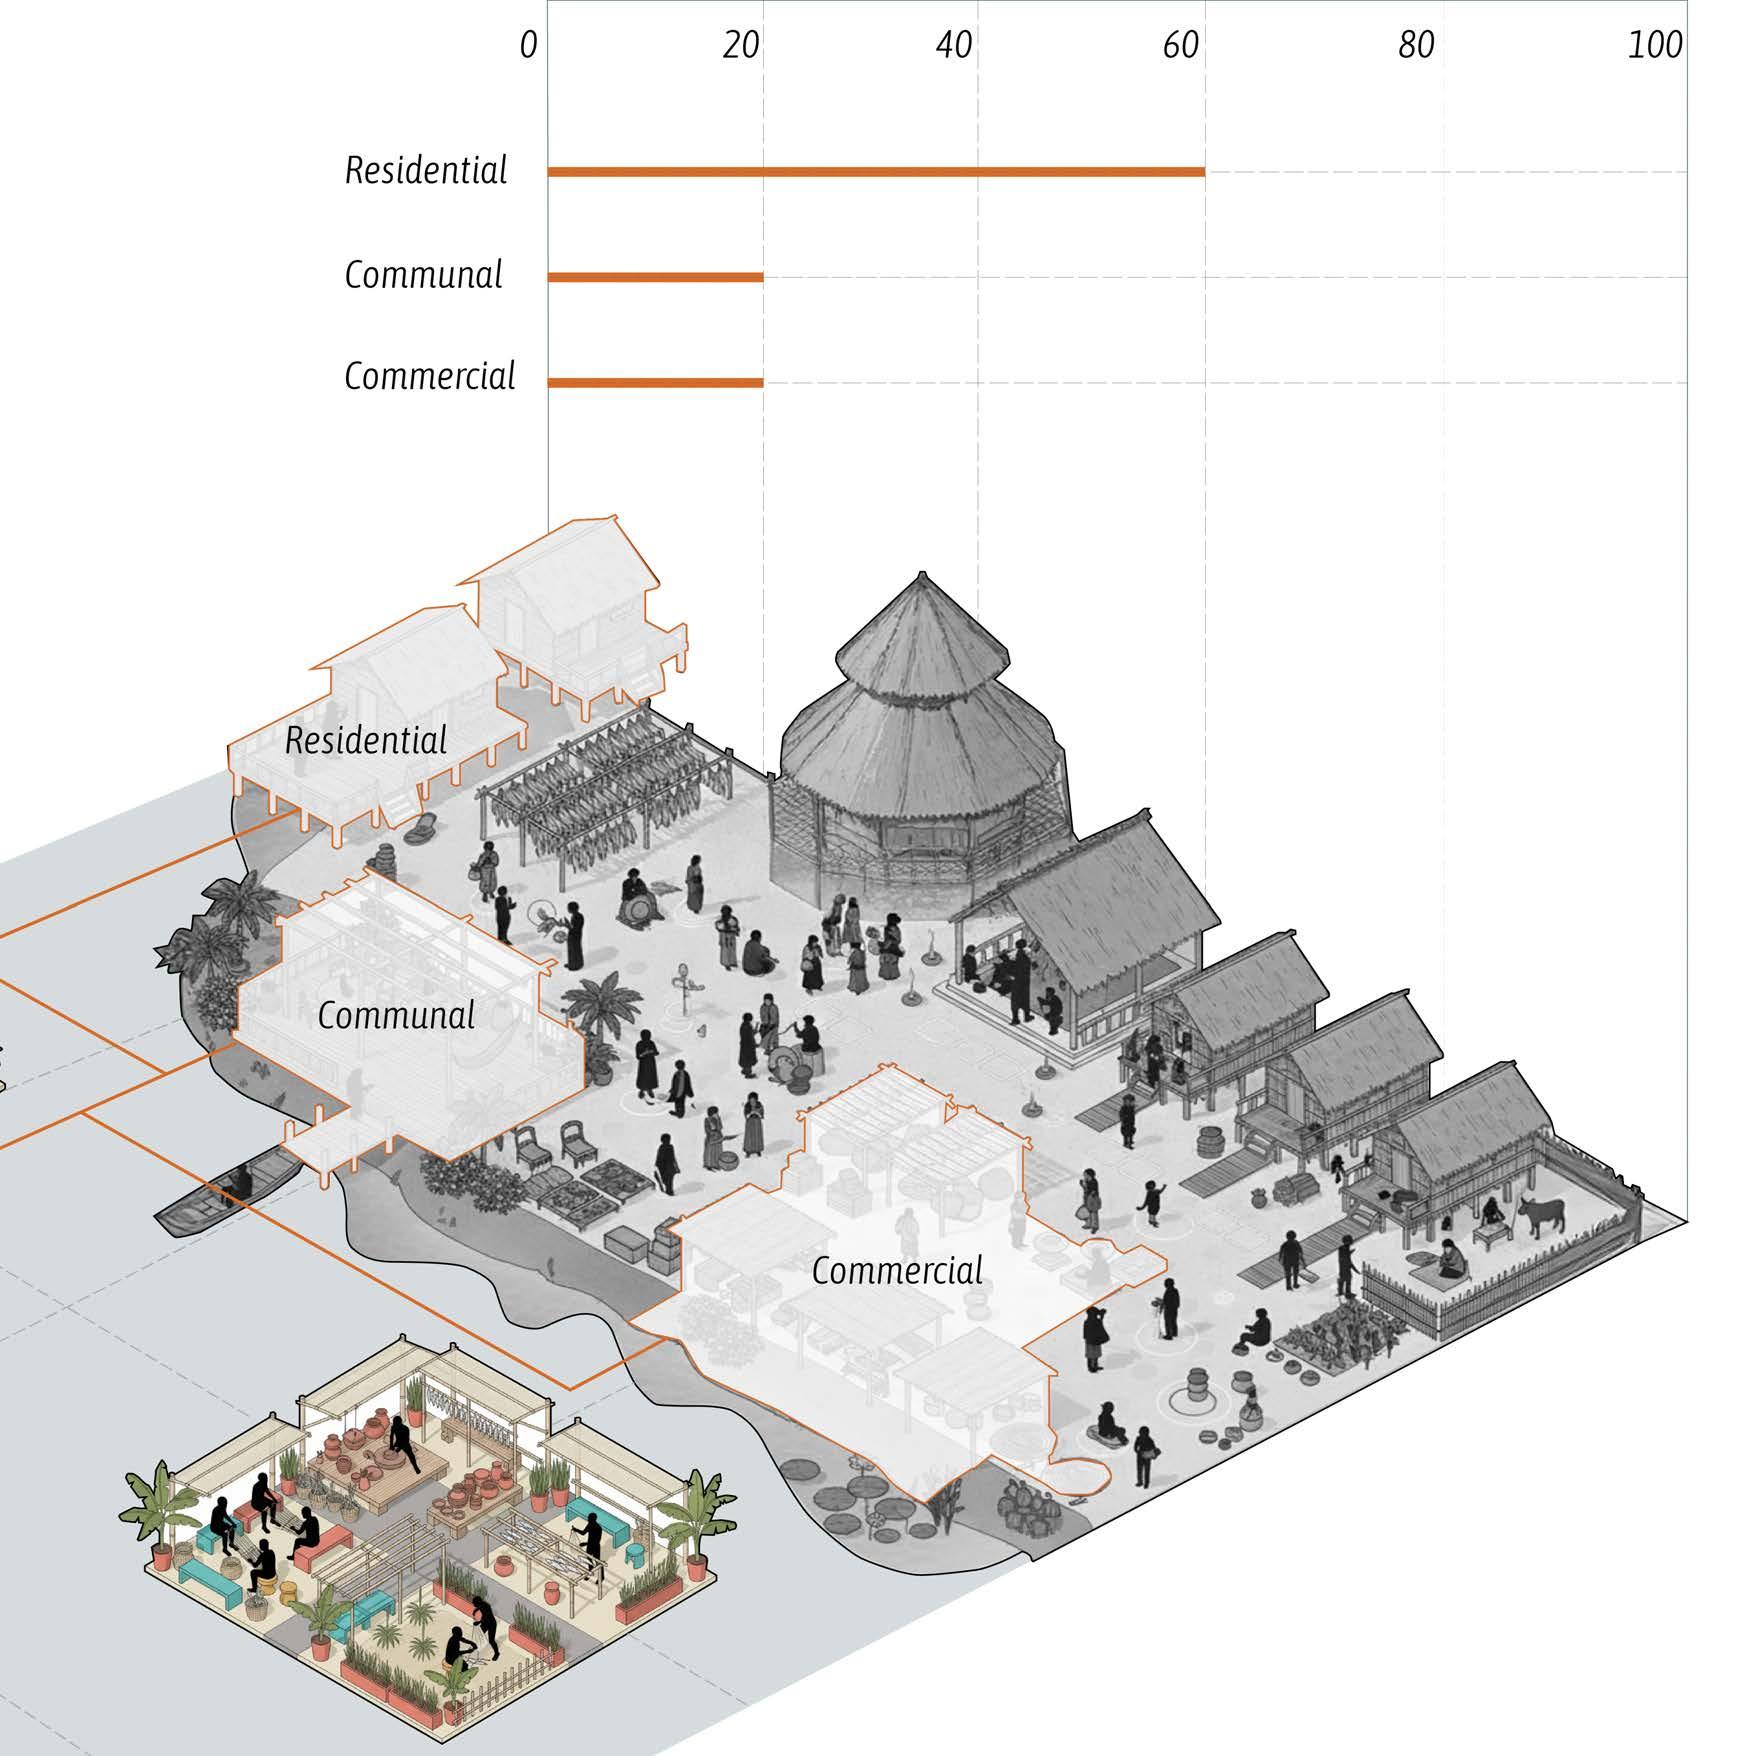
Living Patterns: Commercial
Majuli’s occupational landscape further reinforces its spatial resilience. Traditional practices such as mask-making, weaving, fishing, bamboo craft, horticulture, and agriculture form a distributed labour ecology tied closely to both place-based knowledge and environmental cyclicality. These activities are not merely economic pursuits; they operate as cultural infrastructures that structure daily routines, shape built form, and sustain communal identity. Artisanal production requires semi-open spaces, shaded work platforms, and material storage areas embedded within residential or communal clusters. Agricultural and fishing practices, by contrast, adapt to hydrological cycles, generating spatial patterns that shift between monsoon retreat and dryseason expansion. These occupational systems produce a landscape where craftsmanship, subsistence, and cultural performance are mutually reinforcing, forming a robust socio-economic foundation for future spatial interventions.
Fig. 37 : Spatial Relationship of Residential, Communal, and Commercial Zones in the Settlement, Created by Author
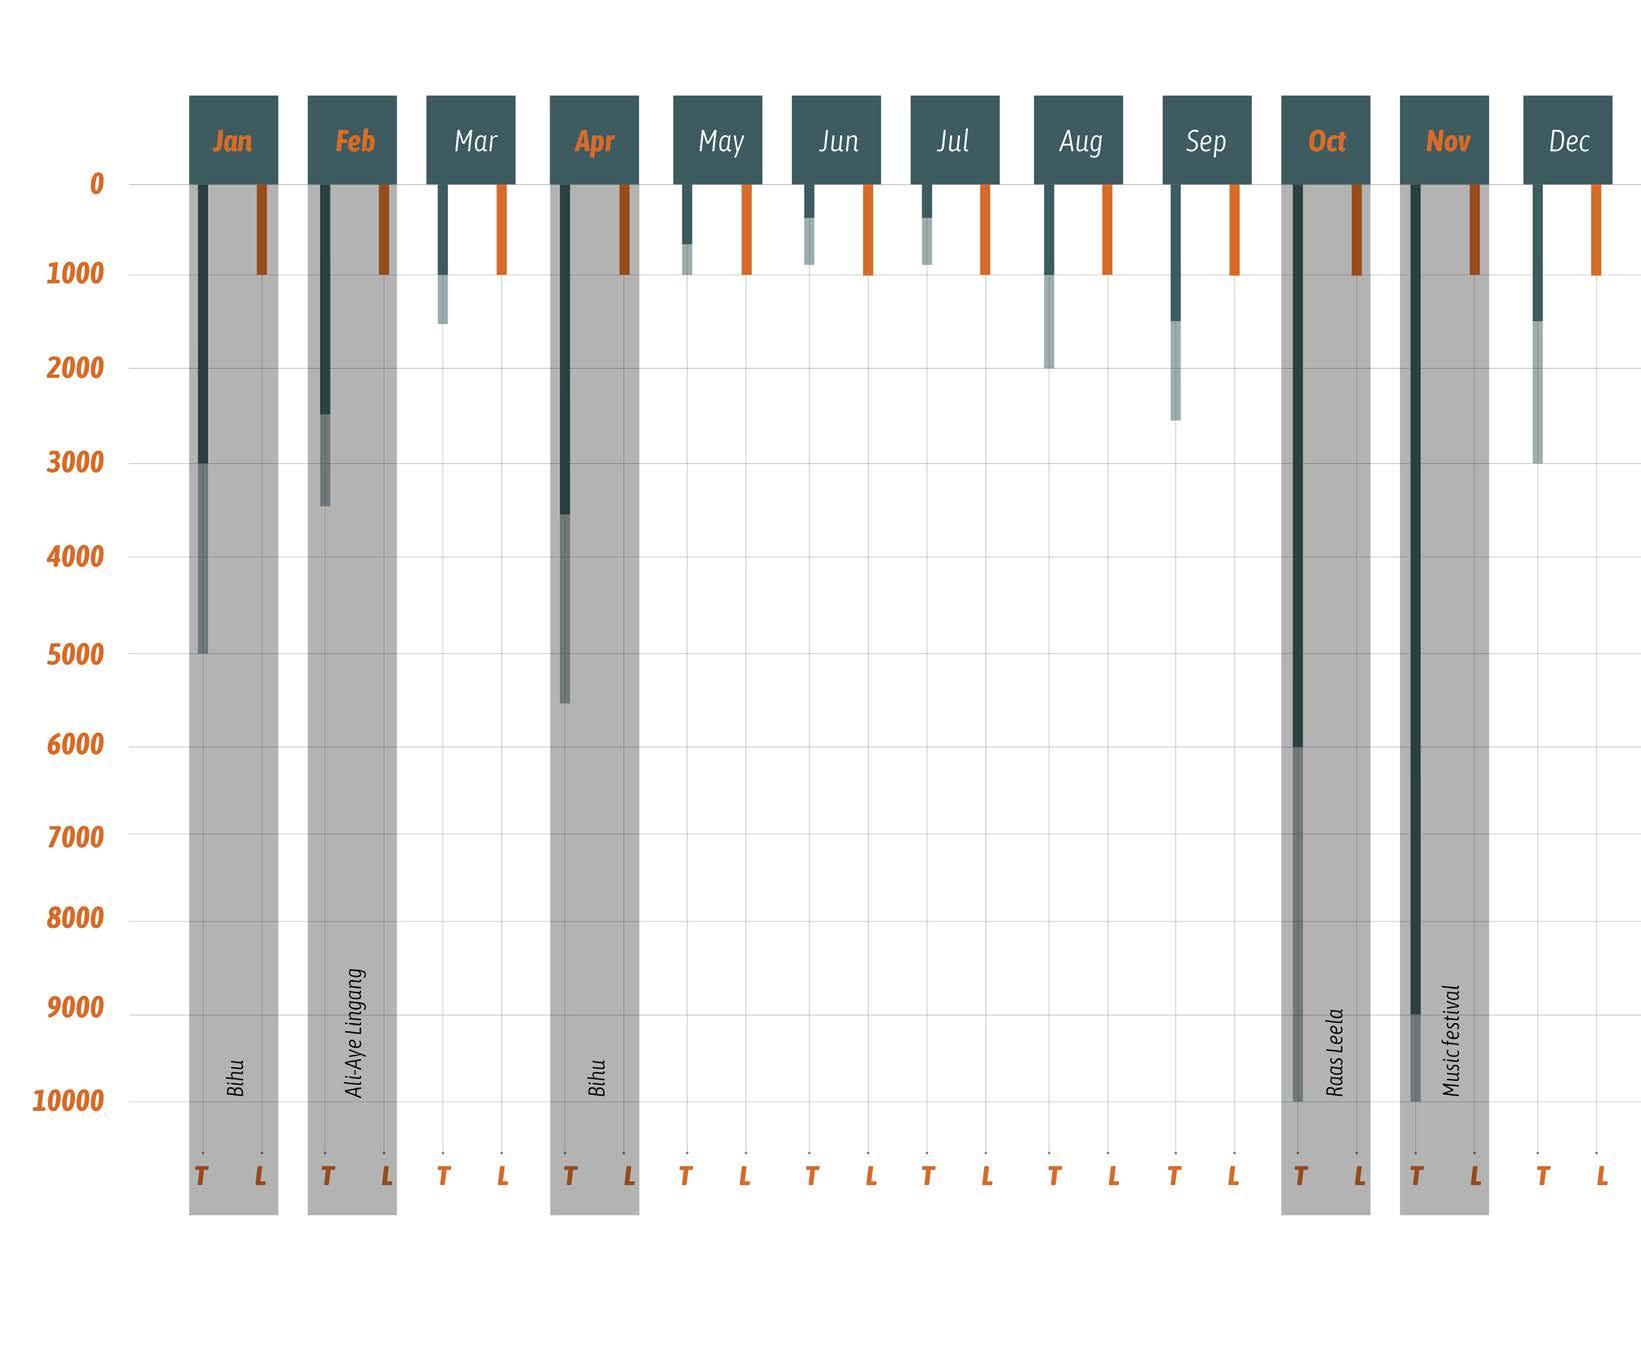
Understanding the footfall
The movement of people across the island follows a familiar seasonal rhythm, swelling during key moments in the cultural year. January, February, April, October, and November draw the highest numbers of visitors, coinciding with festivals such as Bihu, Ali-Aye-Ligang, Raas Leela, and the Music Festival. These periods of heightened activity are not experienced as disruptions but as natural extensions of everyday life. The settlement’s spatial fabric defined by open courtyards, permeable edges, and generously shared grounds allows it to stretch and settle with ease. Spaces take on new roles during festivals and quietly return to their daily rhythms afterward. This gentle oscillation between intensity and calm reflects a deeply rooted adaptability, where built form, landscape, and cultural time remain in constant, responsive dialogue.
Fig. 38 Spatial Adaptability of the Settlement to Festival-Driven Intensity, Created by Author
Fig. 39 : Understanding Seasonal Footfall Patterns, Created by Author
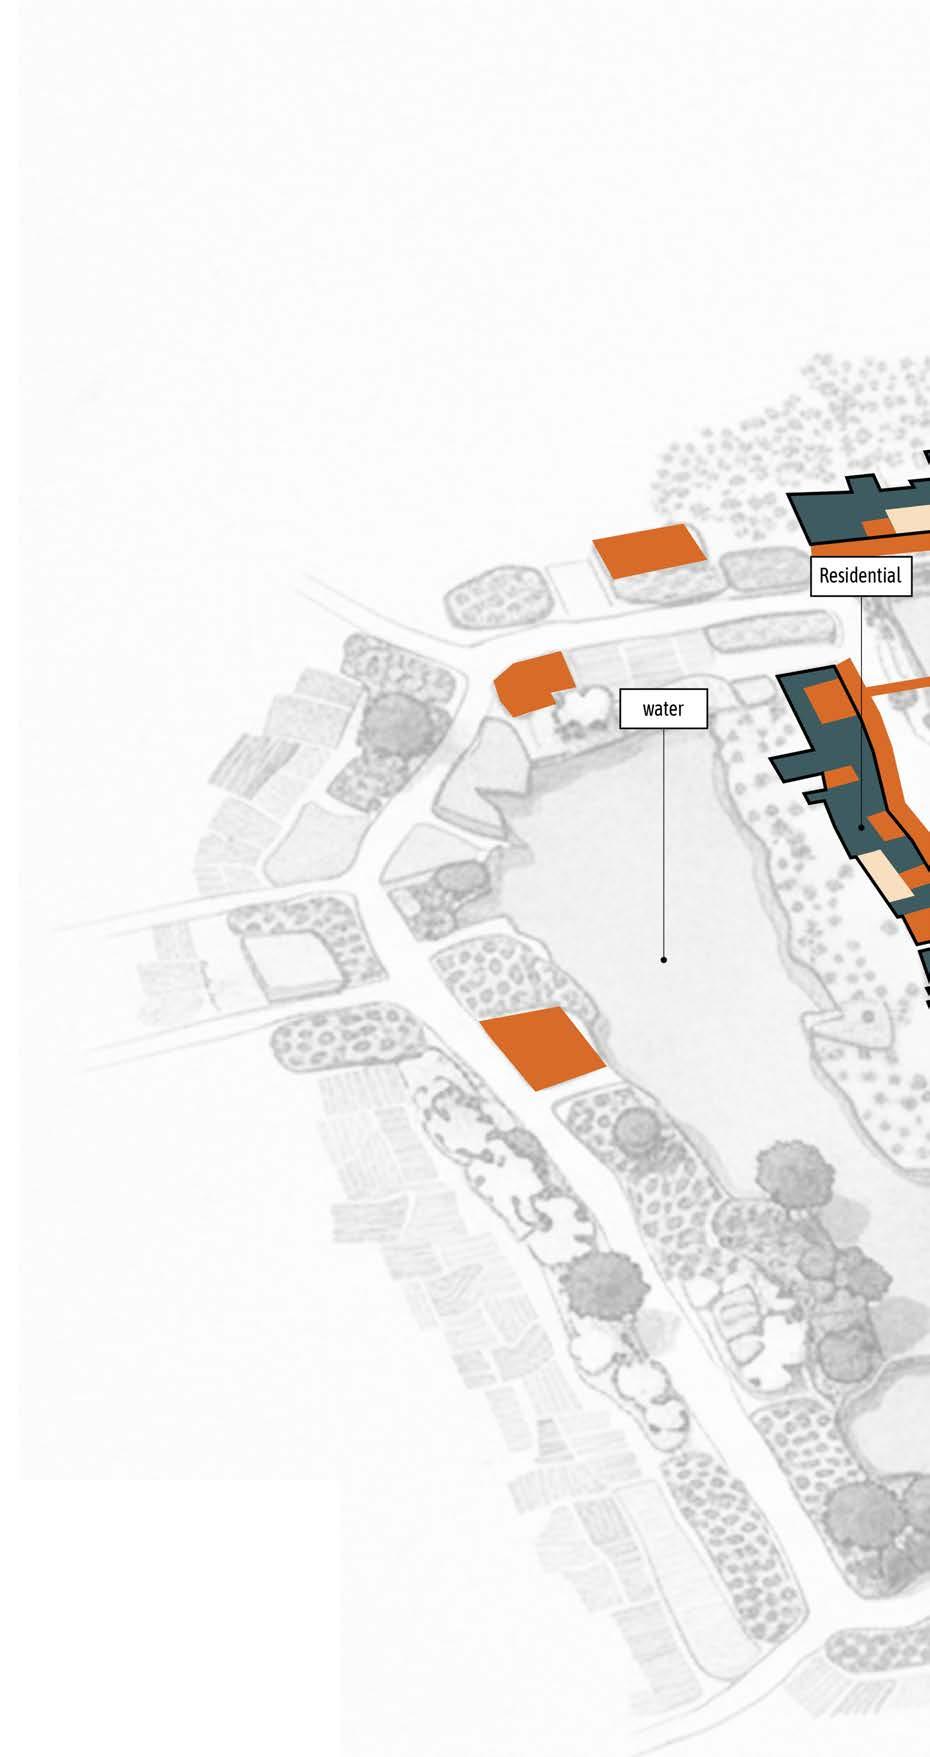
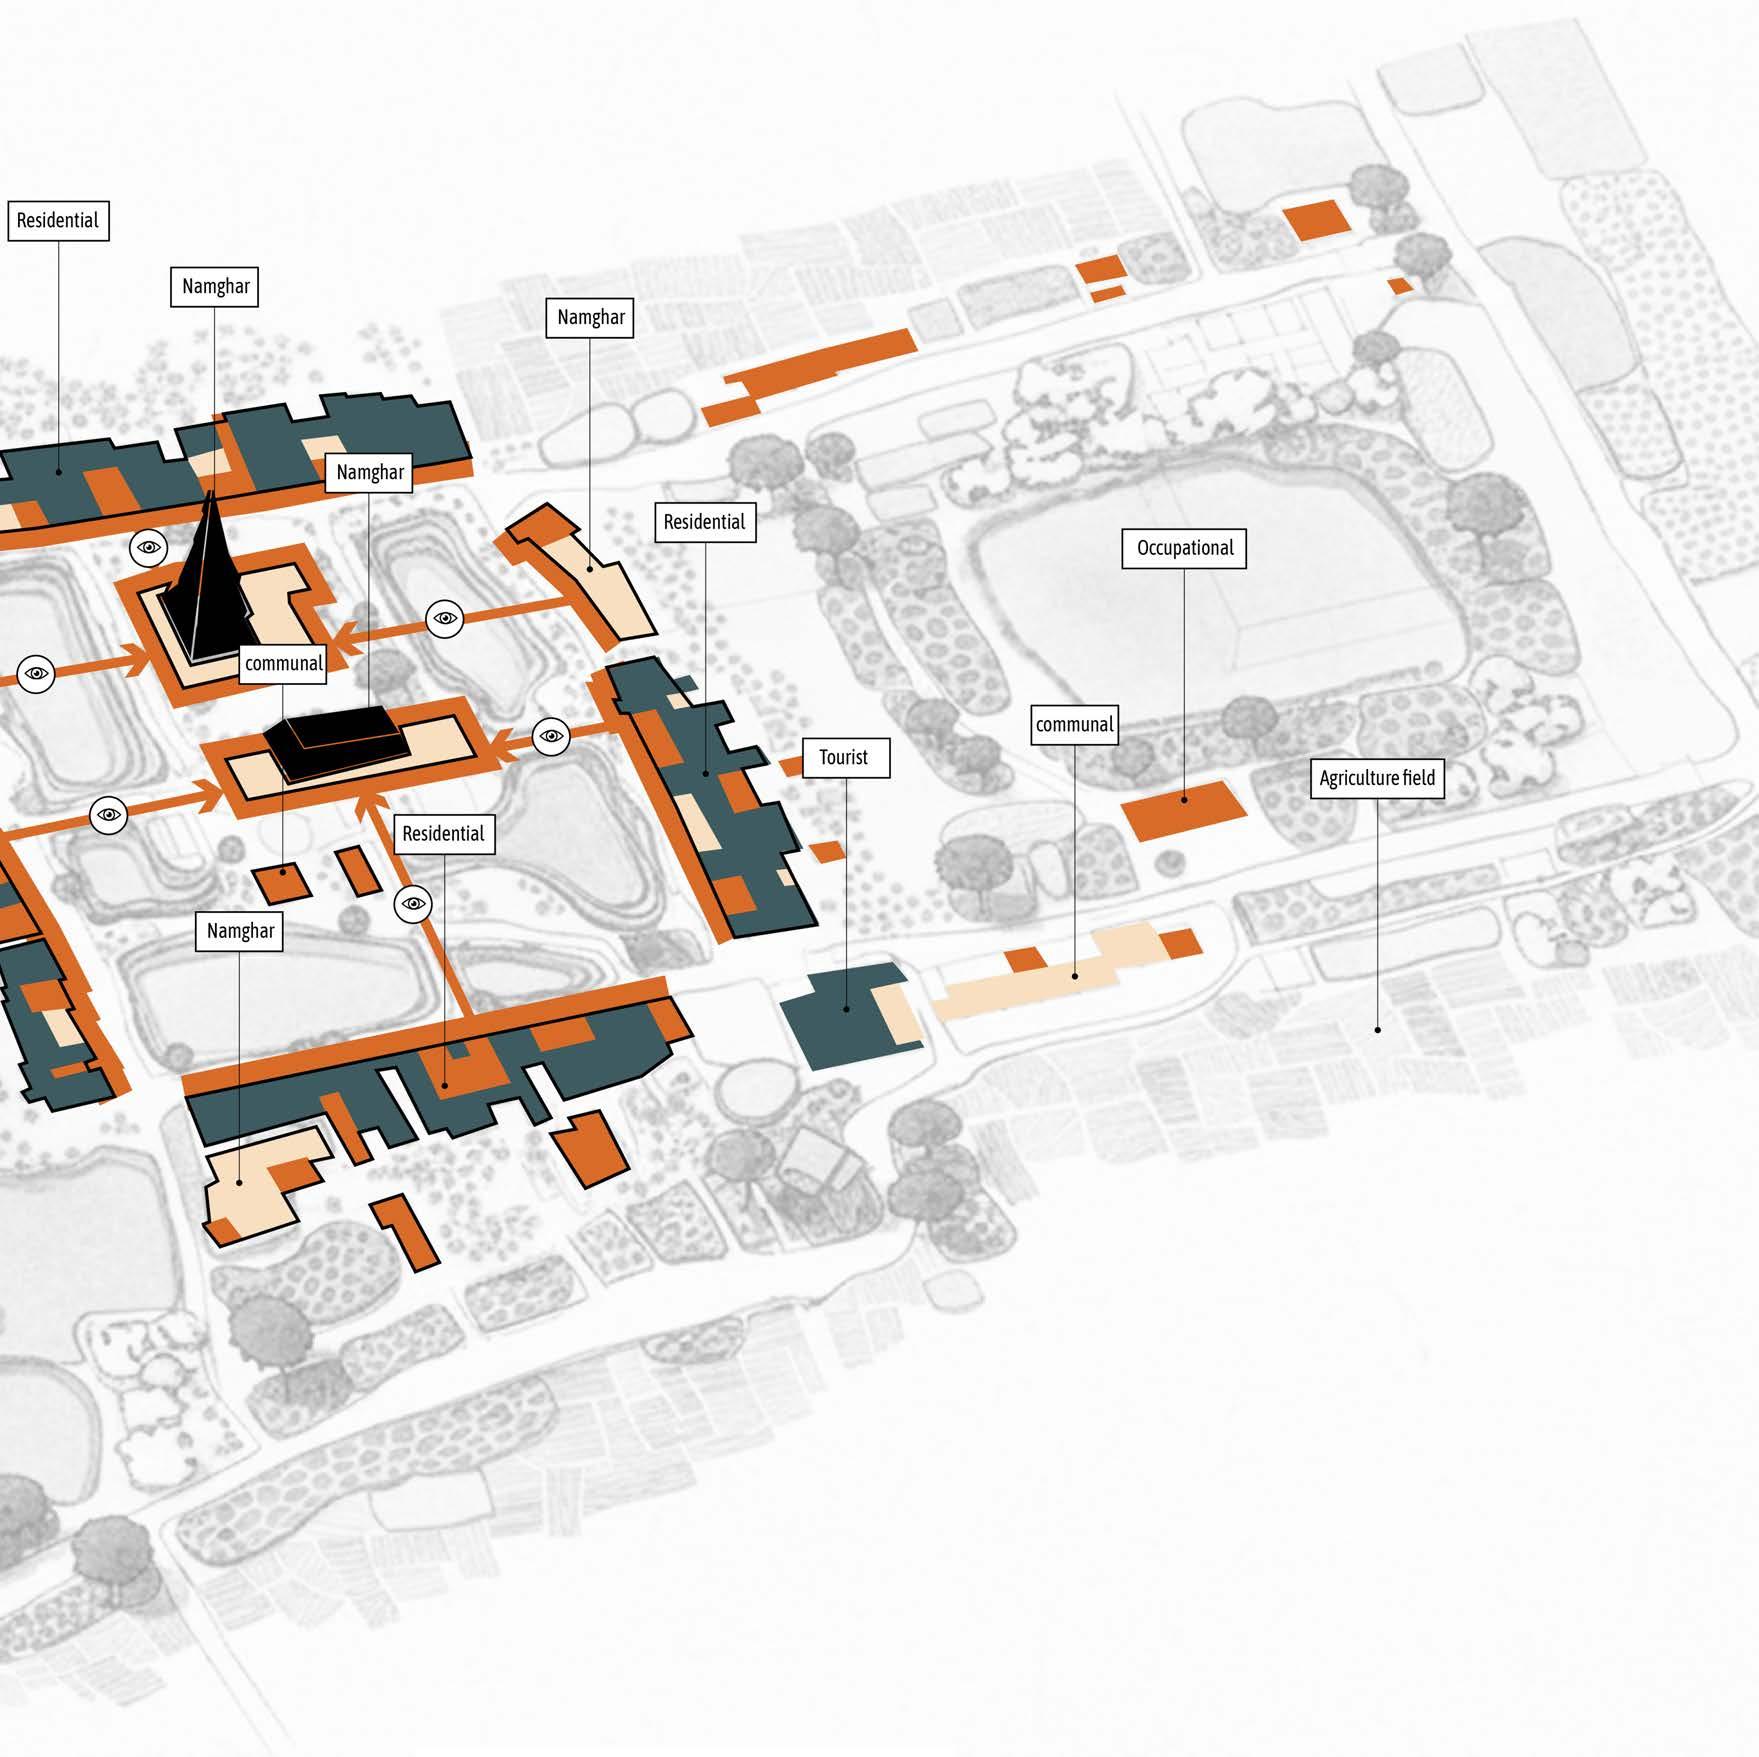
The existing urban fabric of Majuli exemplifies a polycentric and porous spatial organisation shaped by topography, hydrology, and community structure. The Namghar forms the gravitational centre of social and ritual life, around which residential clusters, ponds, commercial stalls, and agricultural areas are organised. Circulation threads through these elements in a manner that balances accessibility with ecological sensitivity, allowing for fluid transitions between domestic activity, ritual engagement, and occupational labour. This configuration allows the settlement to sustain high footfall during peak festival periods, as its open spaces and interconnected networks can absorb additional population without requiring permanent structural enlargement. The fabric’s logic is inherently resilient, emerging from centuries of adaptation to flooding, shifting riverbanks, and cultural necessity.
Spatial divisions across the site illustrate a coherent functional logic that integrates residential, communal, commercial, and tourism zones into a balanced framework. Residential clusters occupy the most stable terrain, ensuring protection from seasonal flooding while enabling consistent daily routines. Communal spaces are centrally located to maximise collective accessibility, reinforcing their role as socio-cultural anchors. Commercial corridors align with primary routes, facilitating efficient movement and economic exchange. Tourism facilities, positioned at transitional edges, mediate between local life and visitor engagement, enabling controlled cultural interaction without imposing strain on the settlement’s core functioning. This equilibrium reveals an intuitive planning system where spatial proximity aligns with social relevance and environmental pragmatism.
Understanding Spatial Logic
Fig. 40 : Spatial Logic and Functional Zoning of the Settlement, Created by Author
Underlying this organisation is a sophisticated spatial logic defined by nodal gathering points, hierarchical circulation patterns, and ecological integration. Pathways radiate outward from the Namghar, stitching together ponds, courtyards, agricultural plots, and residential clusters into a cohesive functional system. Water bodies are intentionally woven into movement networks as cooling, buffering, and ecological stabilising elements. Communal platforms act as elevated refuges and gathering points during flooding, while agricultural zones form flexible edges capable of absorbing seasonal change.
This adaptive logic demonstrates how Majuli’s built environment has evolved as a responsive and resilient system ,one that aligns cultural continuity with ecological adaptation. A comprehensive framework for comprehending Majuli as a living cultural environment rather than just a settlement is provided by the island’s geographical, demographic, occupational, and cultural dynamics taken together. Centuries of social cooperation, cultural expression, and environmental negotiation are reflected in its spatial logic. Any proposed solutions must thus engage with this embedded intelligence enhancing resilience, promoting cultural vitality, and boosting the adaptive processes that sustain life on the island.
Understanding Spatial Logic
Research Methodology
Overview
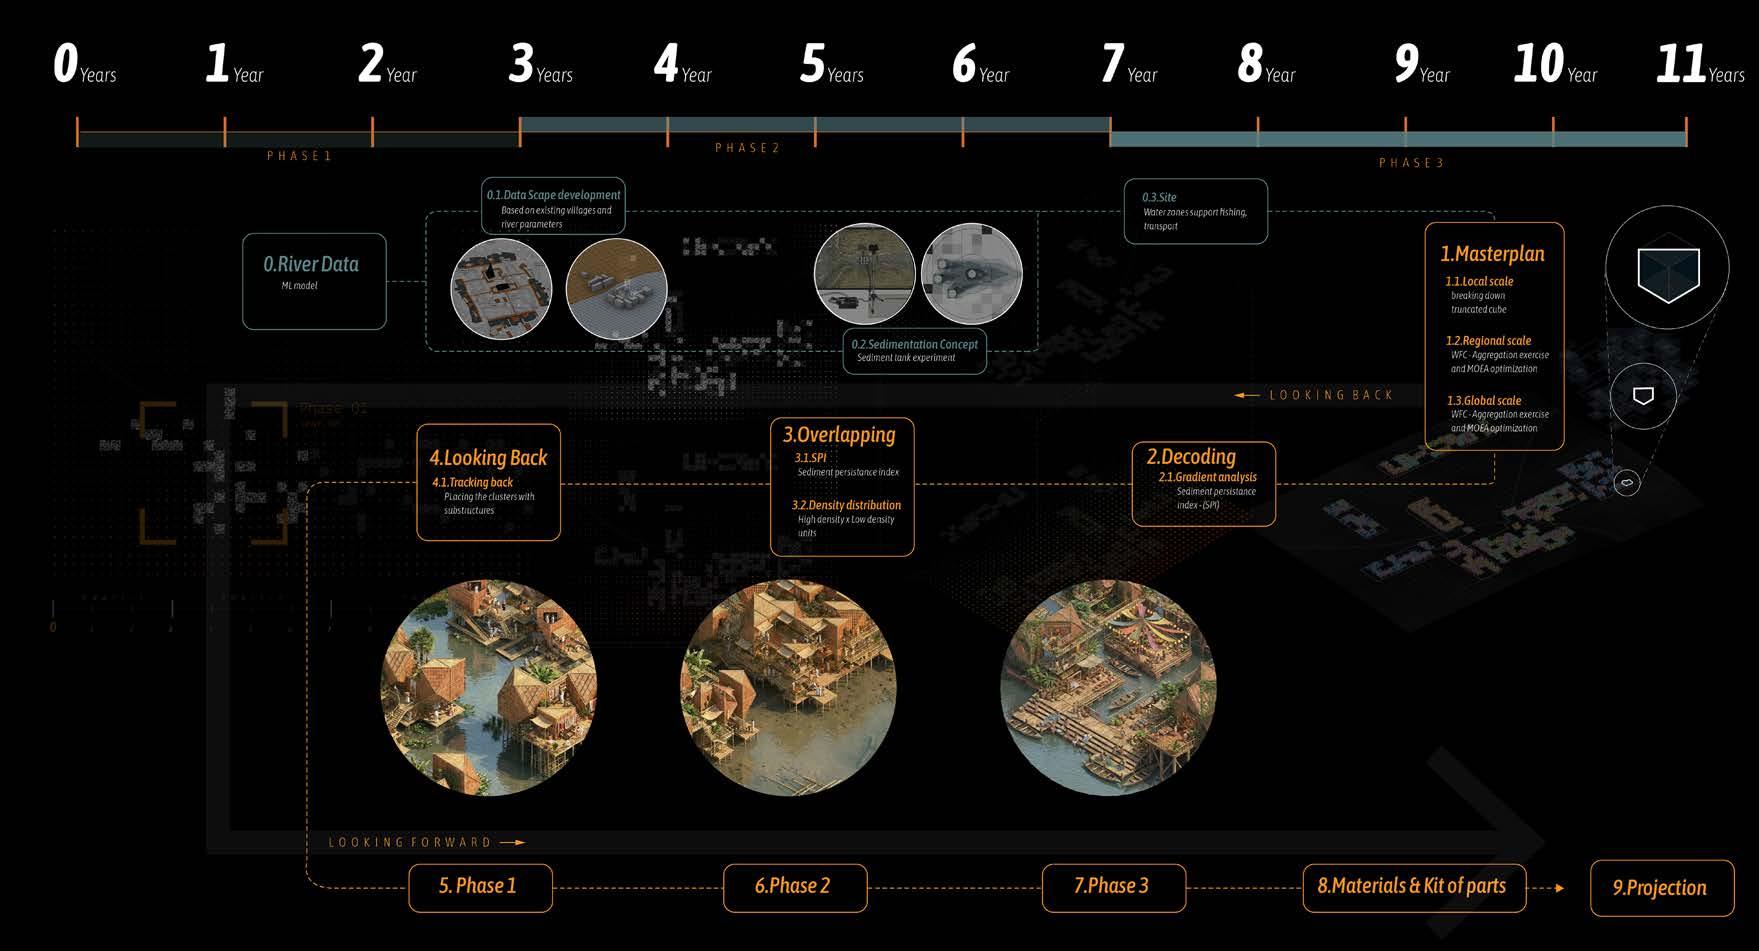
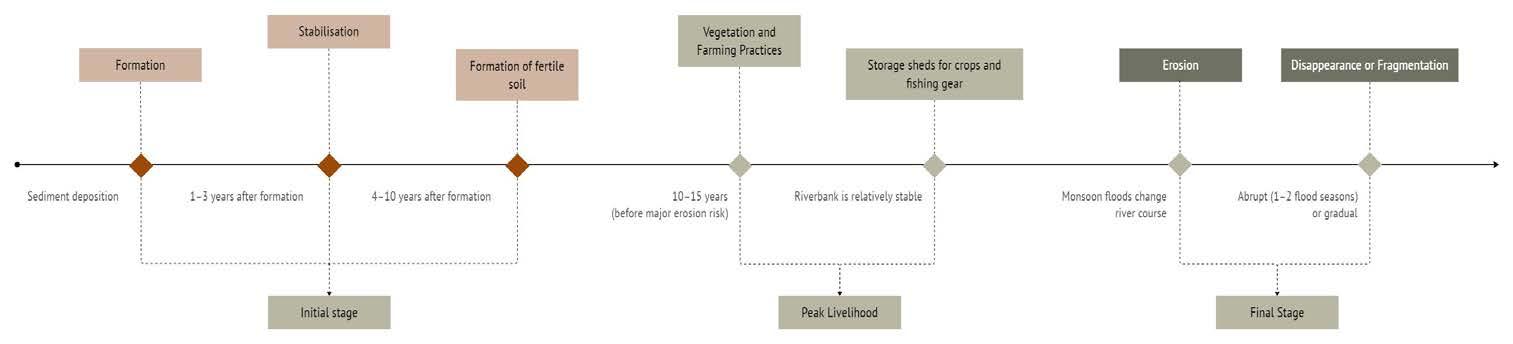
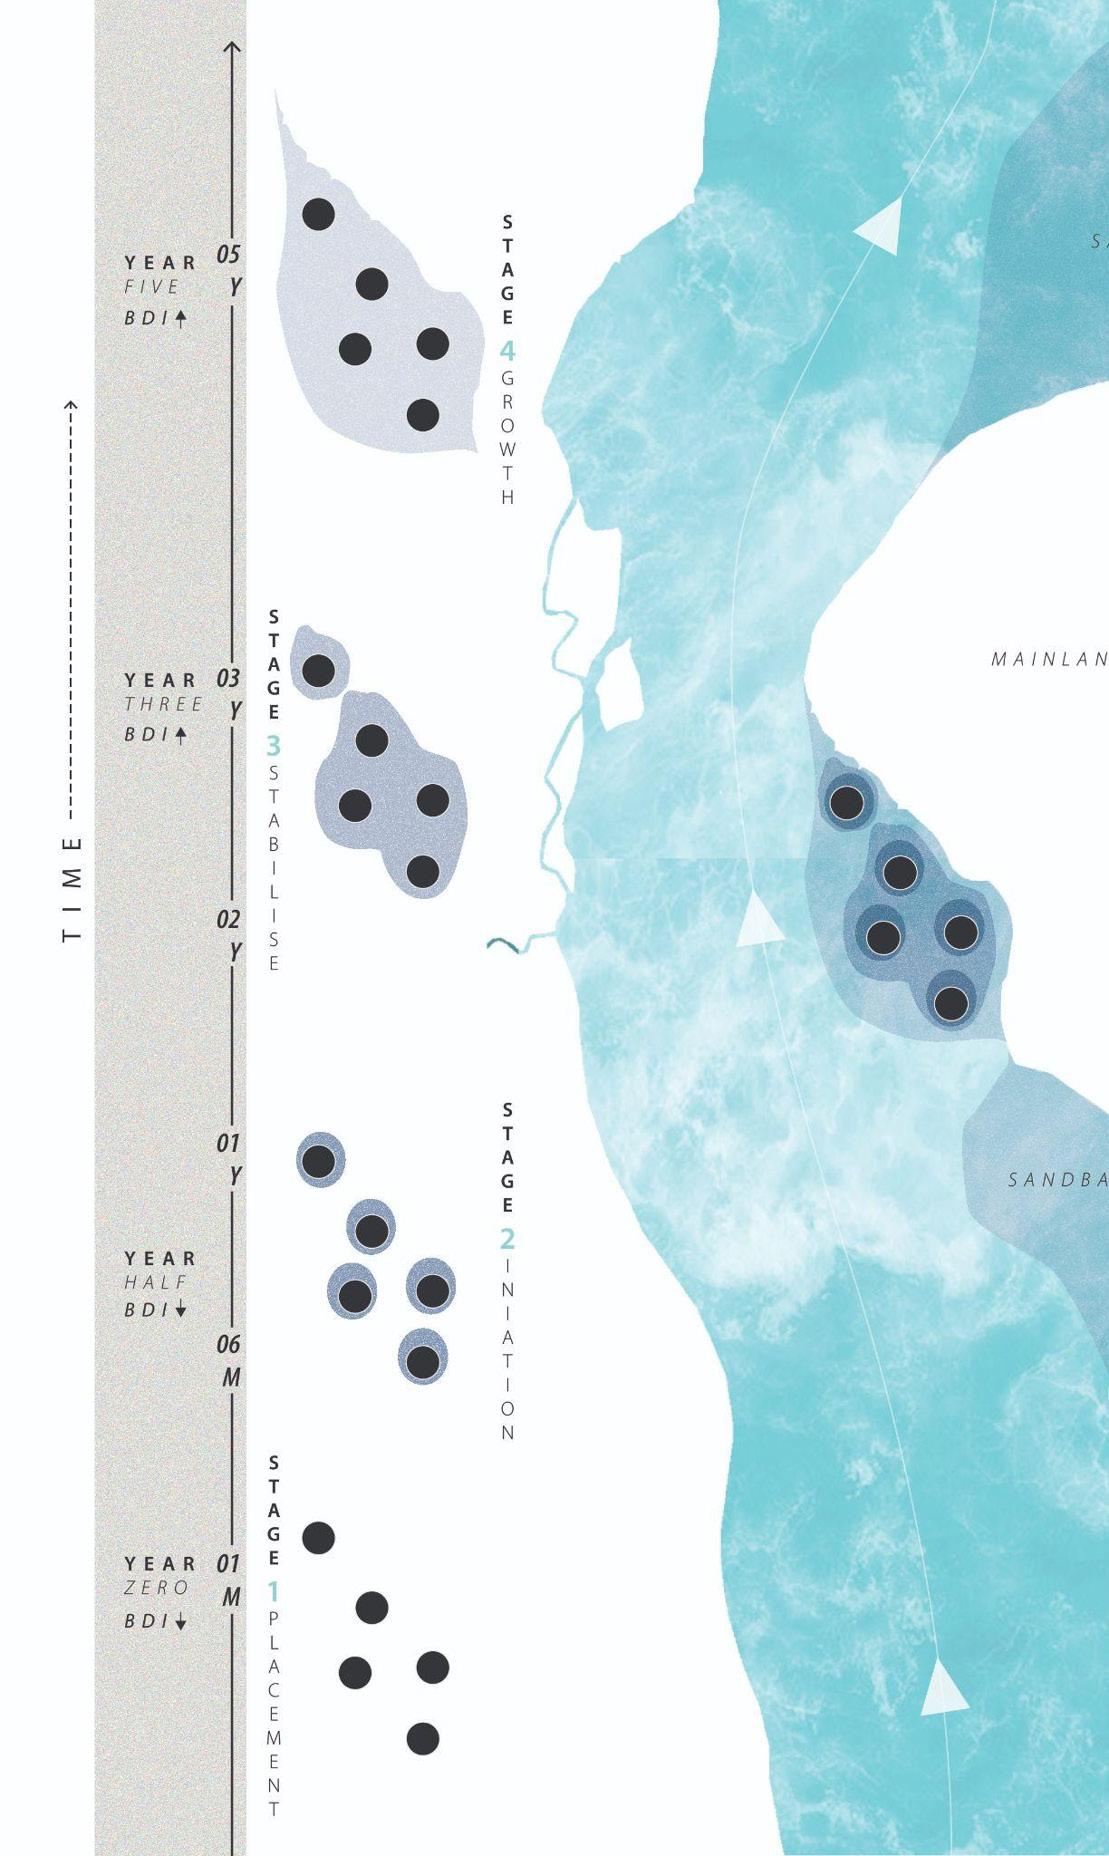
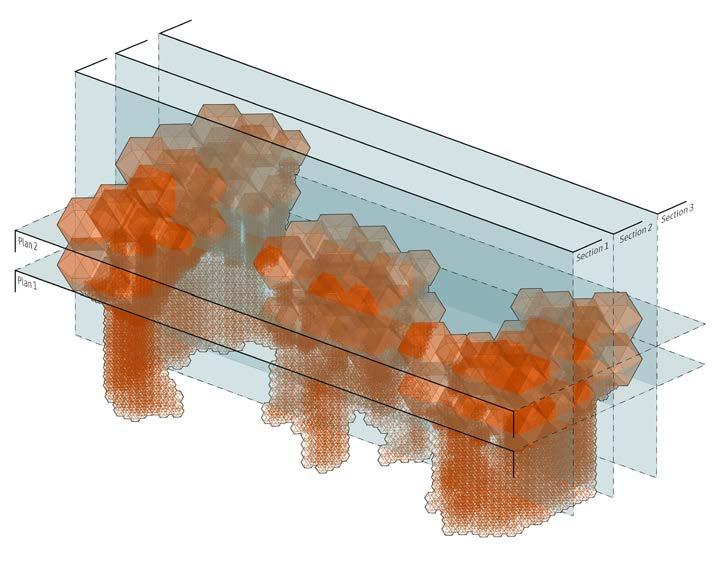
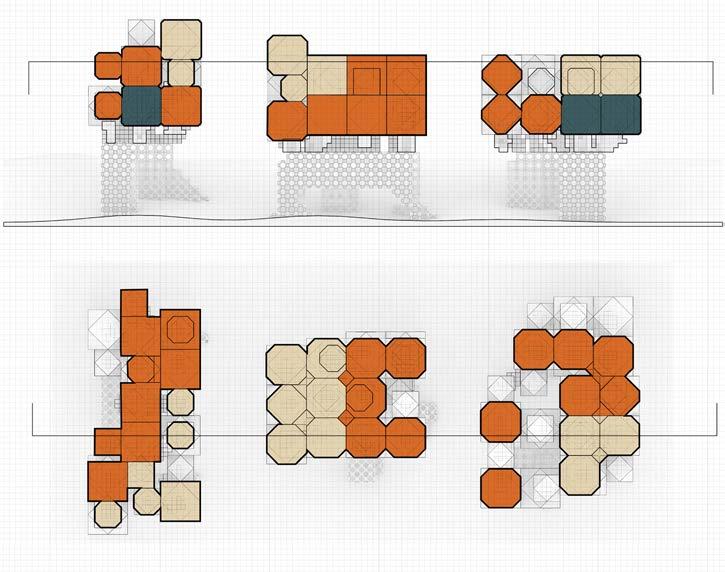
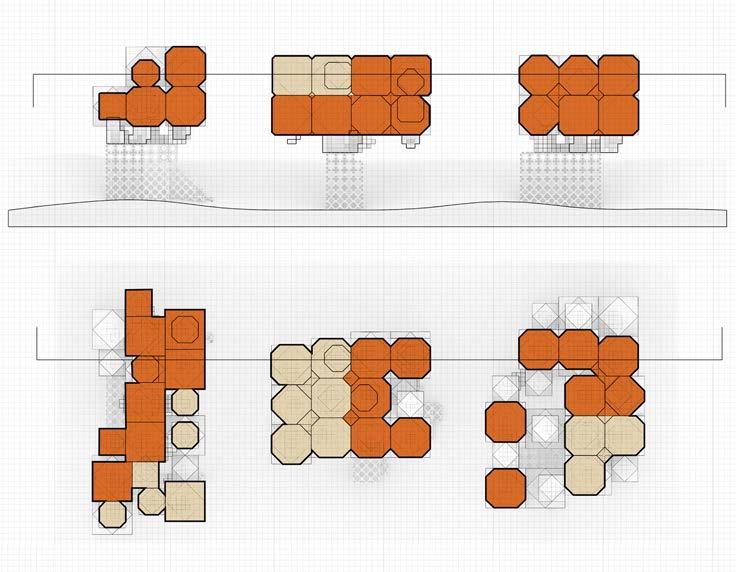
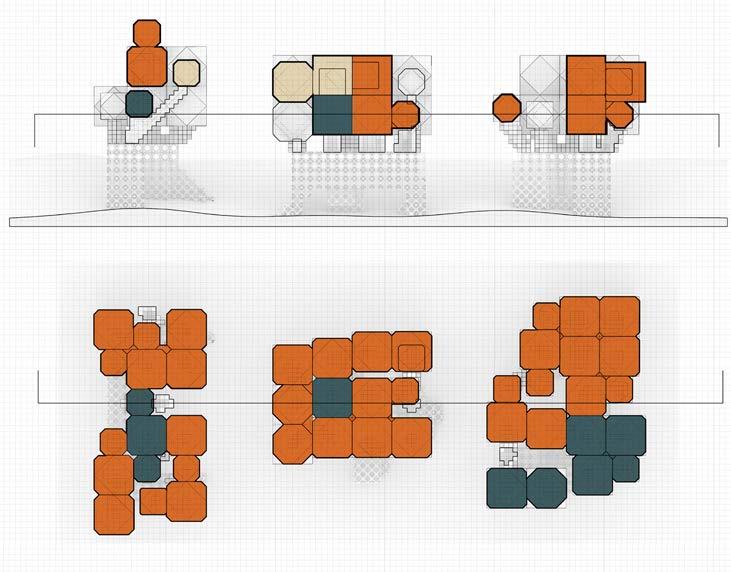
TIn Majuli, time operates as an active design medium rather than a passive backdrop. Seasonal flooding, sediment deposition, and erosion continuously reshape the island, making permanence an unstable condition. This project responds by embedding temporality into the architectural and spatial system, allowing settlement to emerge gradually through interaction with hydrological processes and human occupation.
The architecture is conceived not as a finished object, but as a long-term adaptive system unfolding over approximately a decade. Each phase of development responds to changing ground conditions, water flow, and sediment stability, ensuring that spatial form evolves in parallel with environmental transformation.
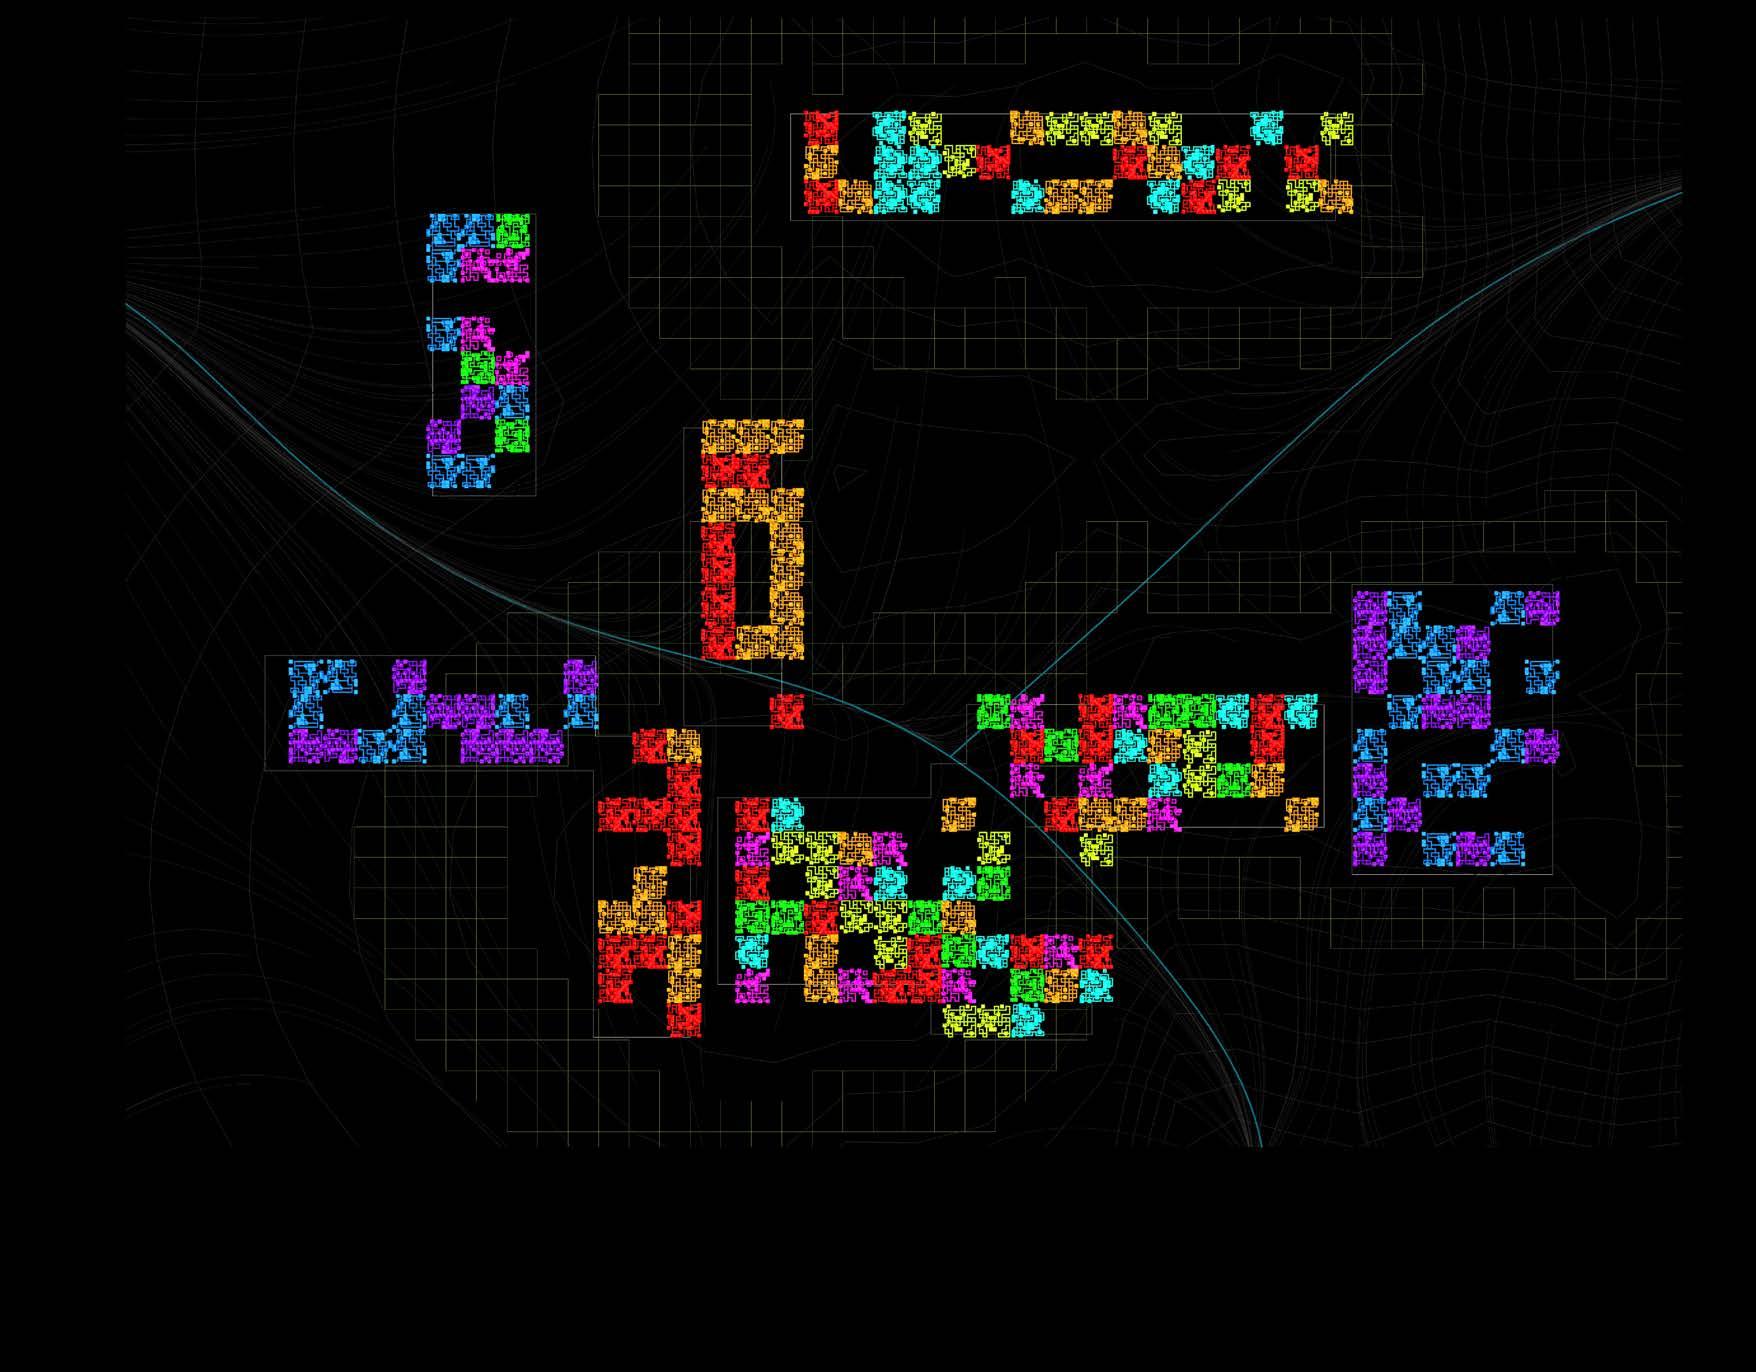
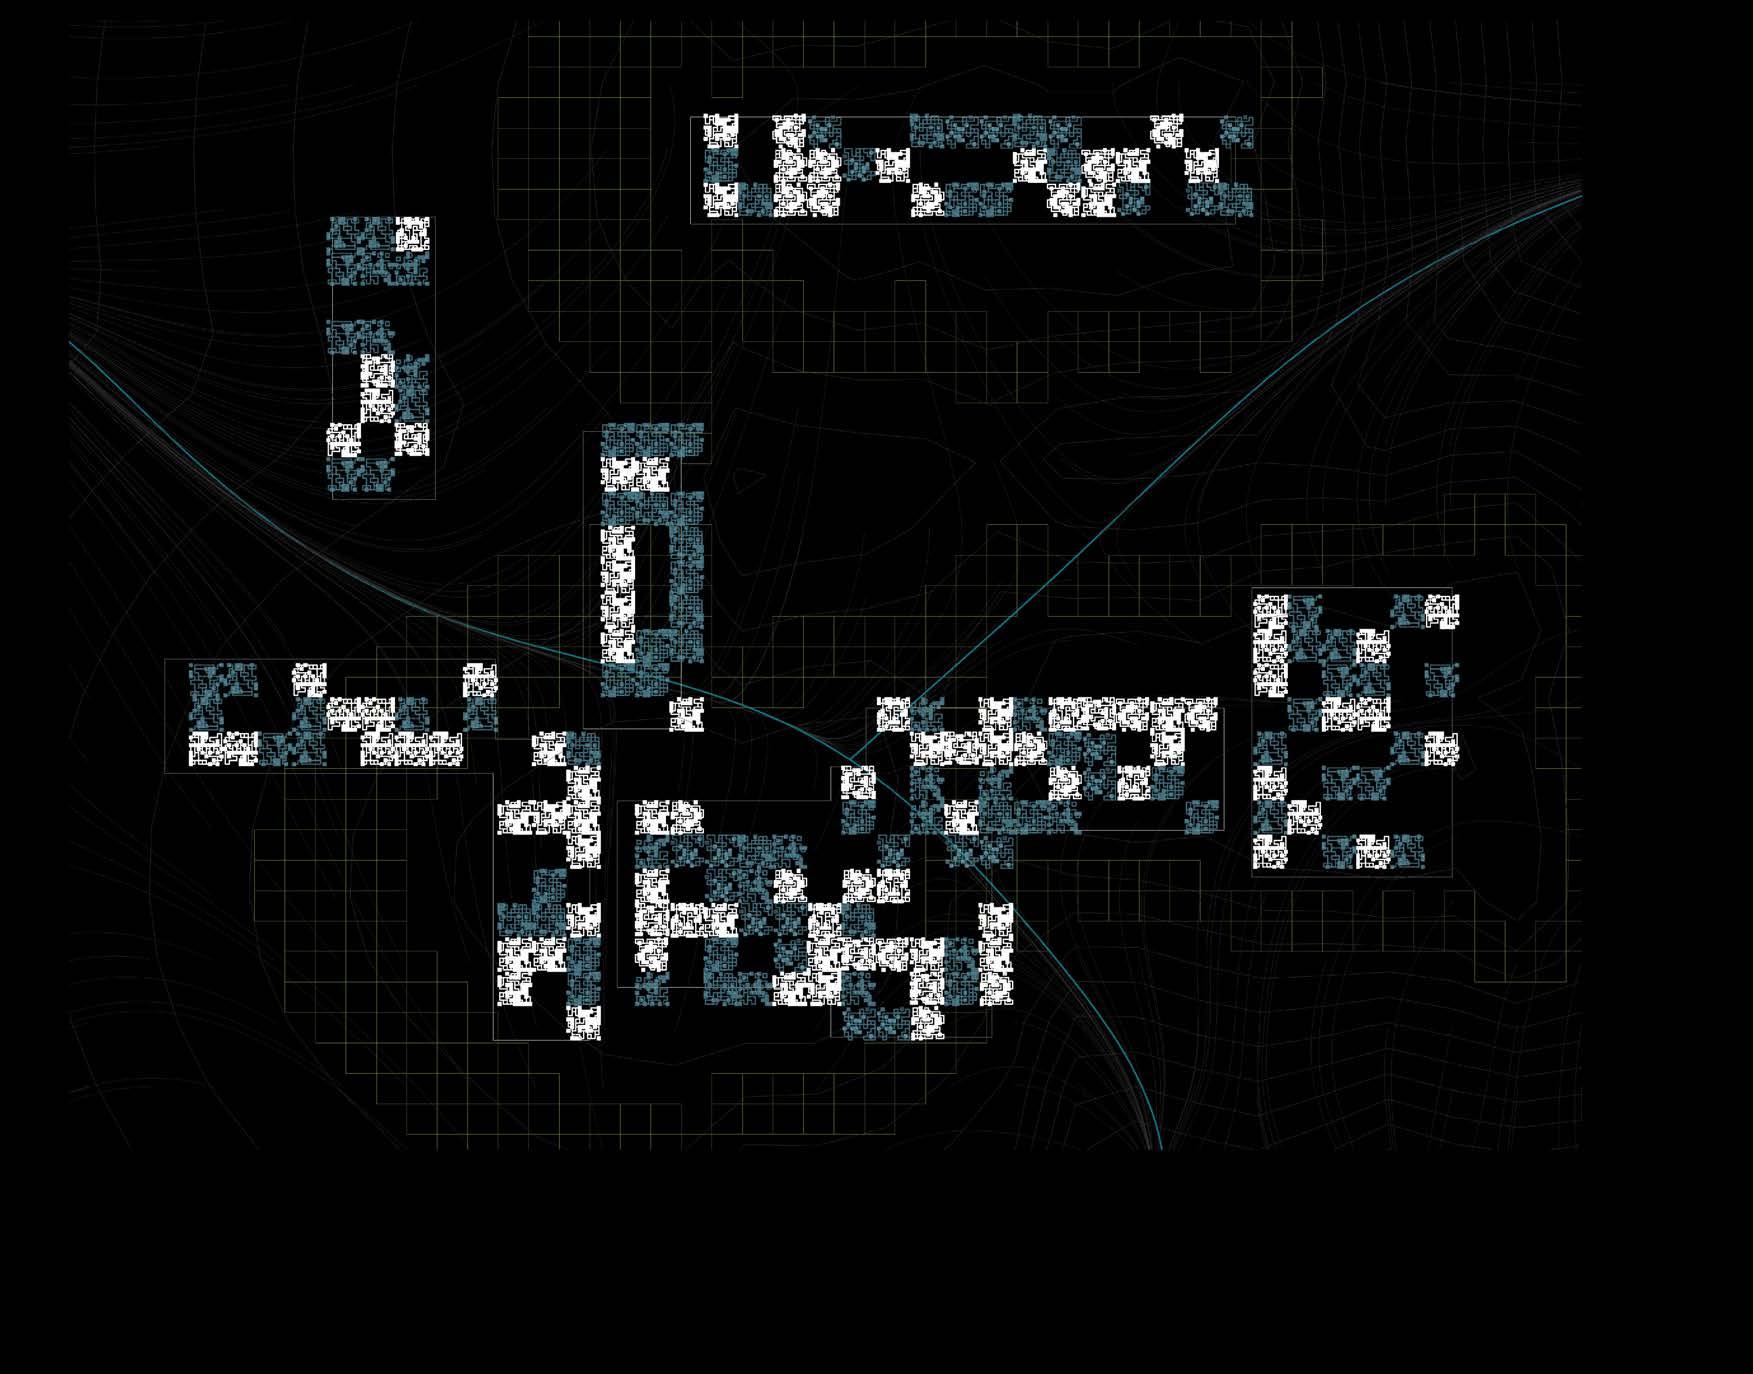
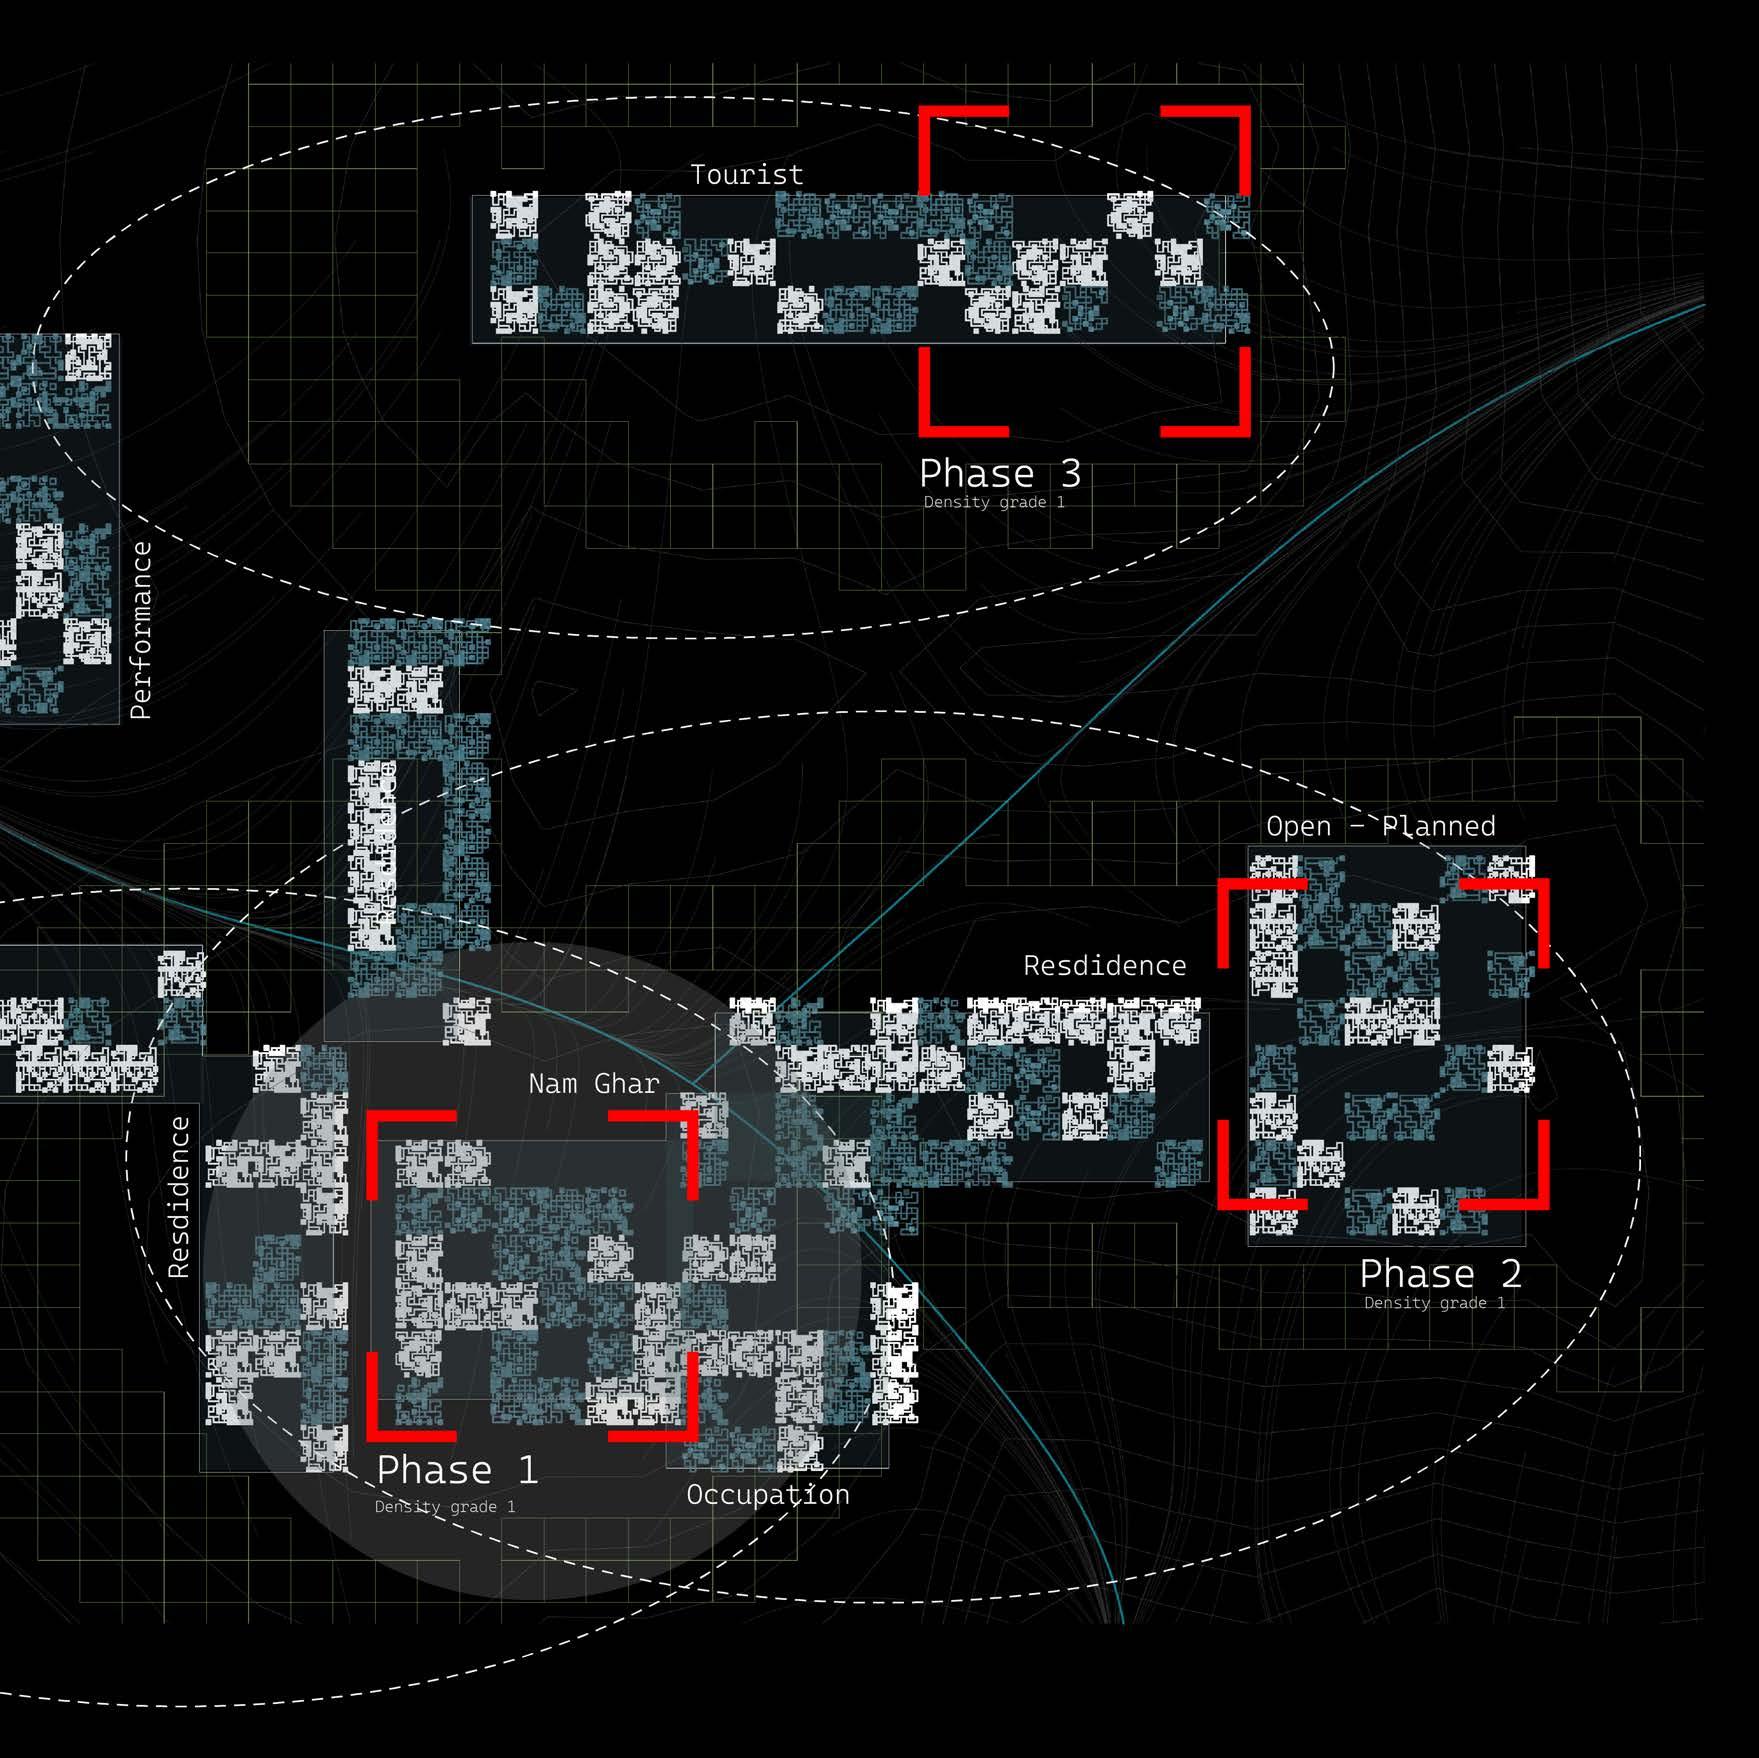
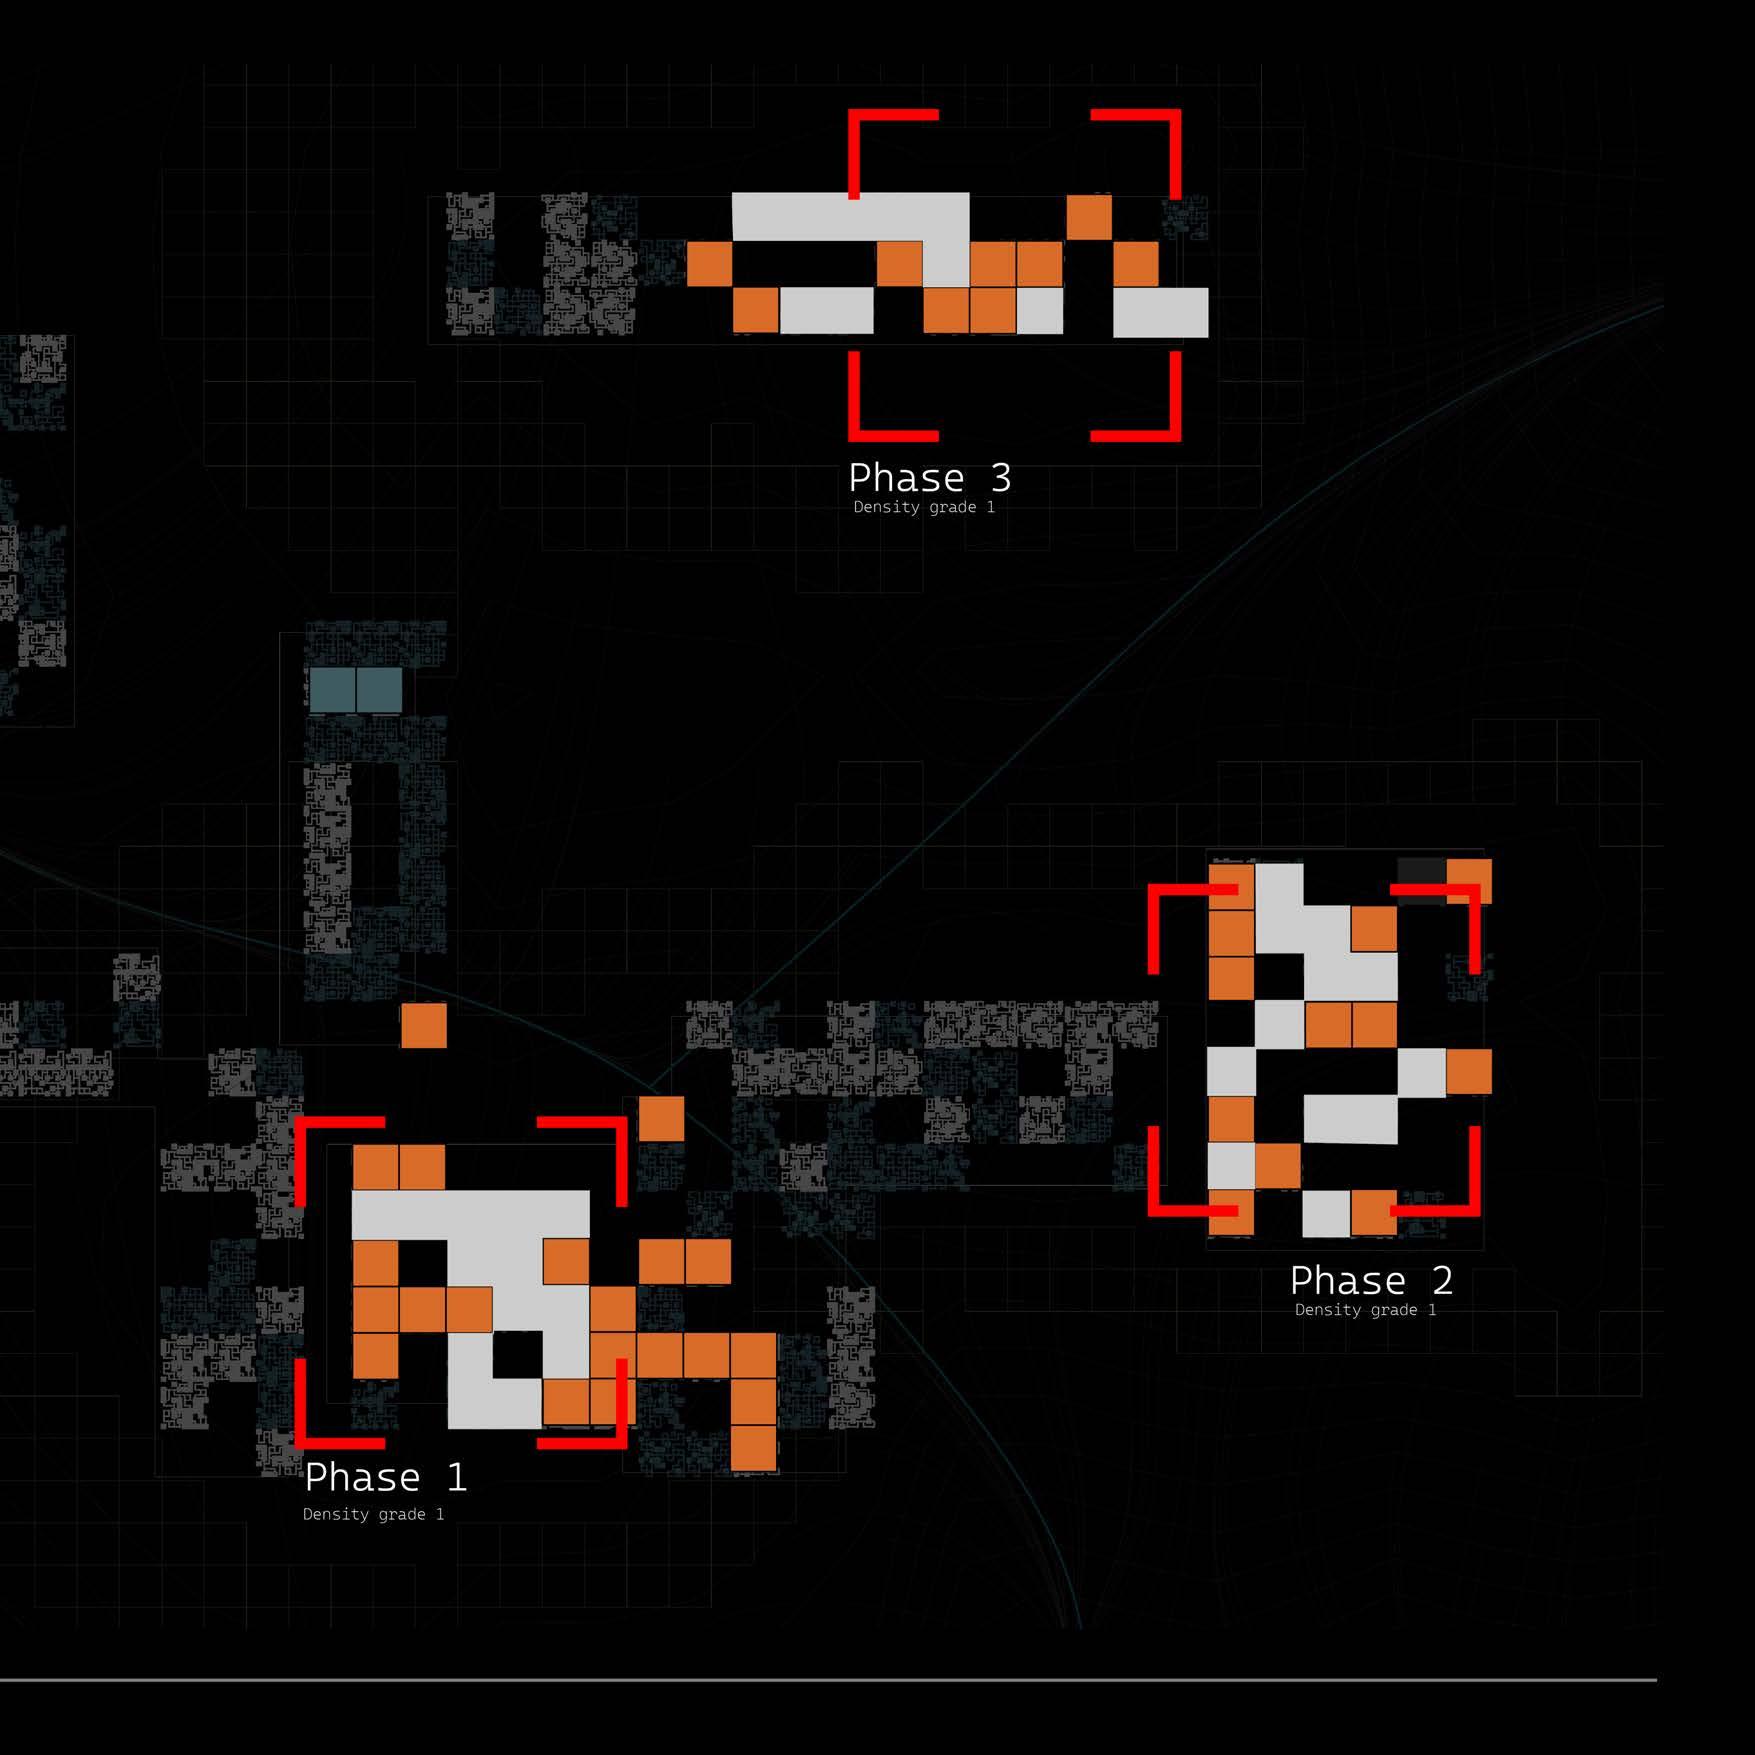
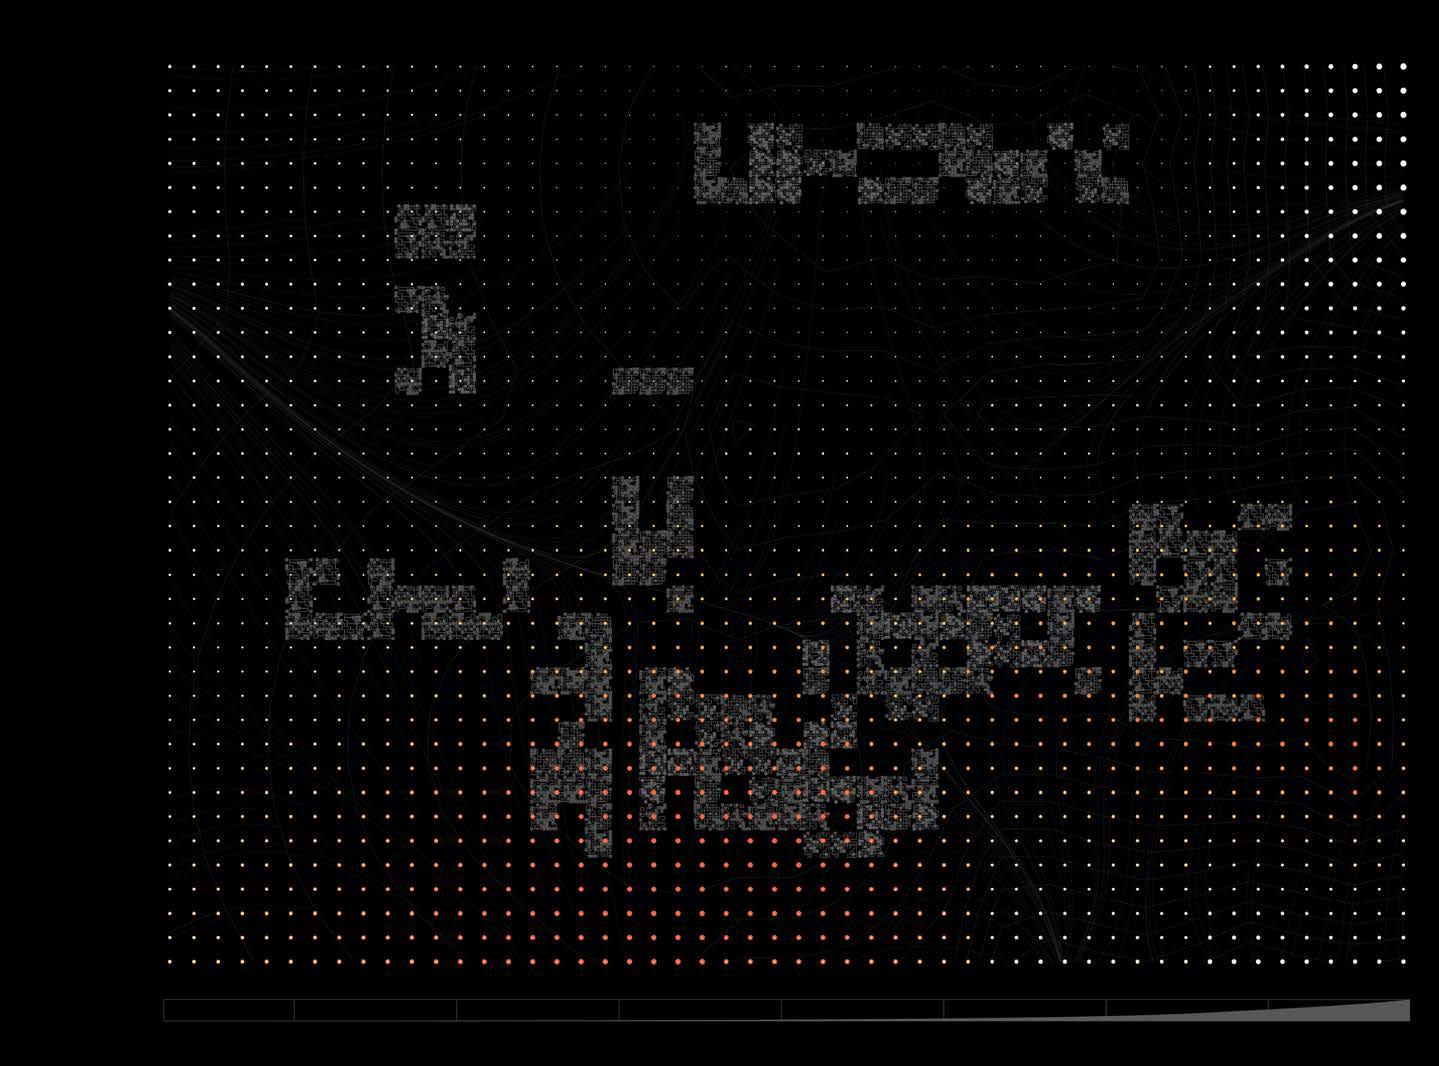
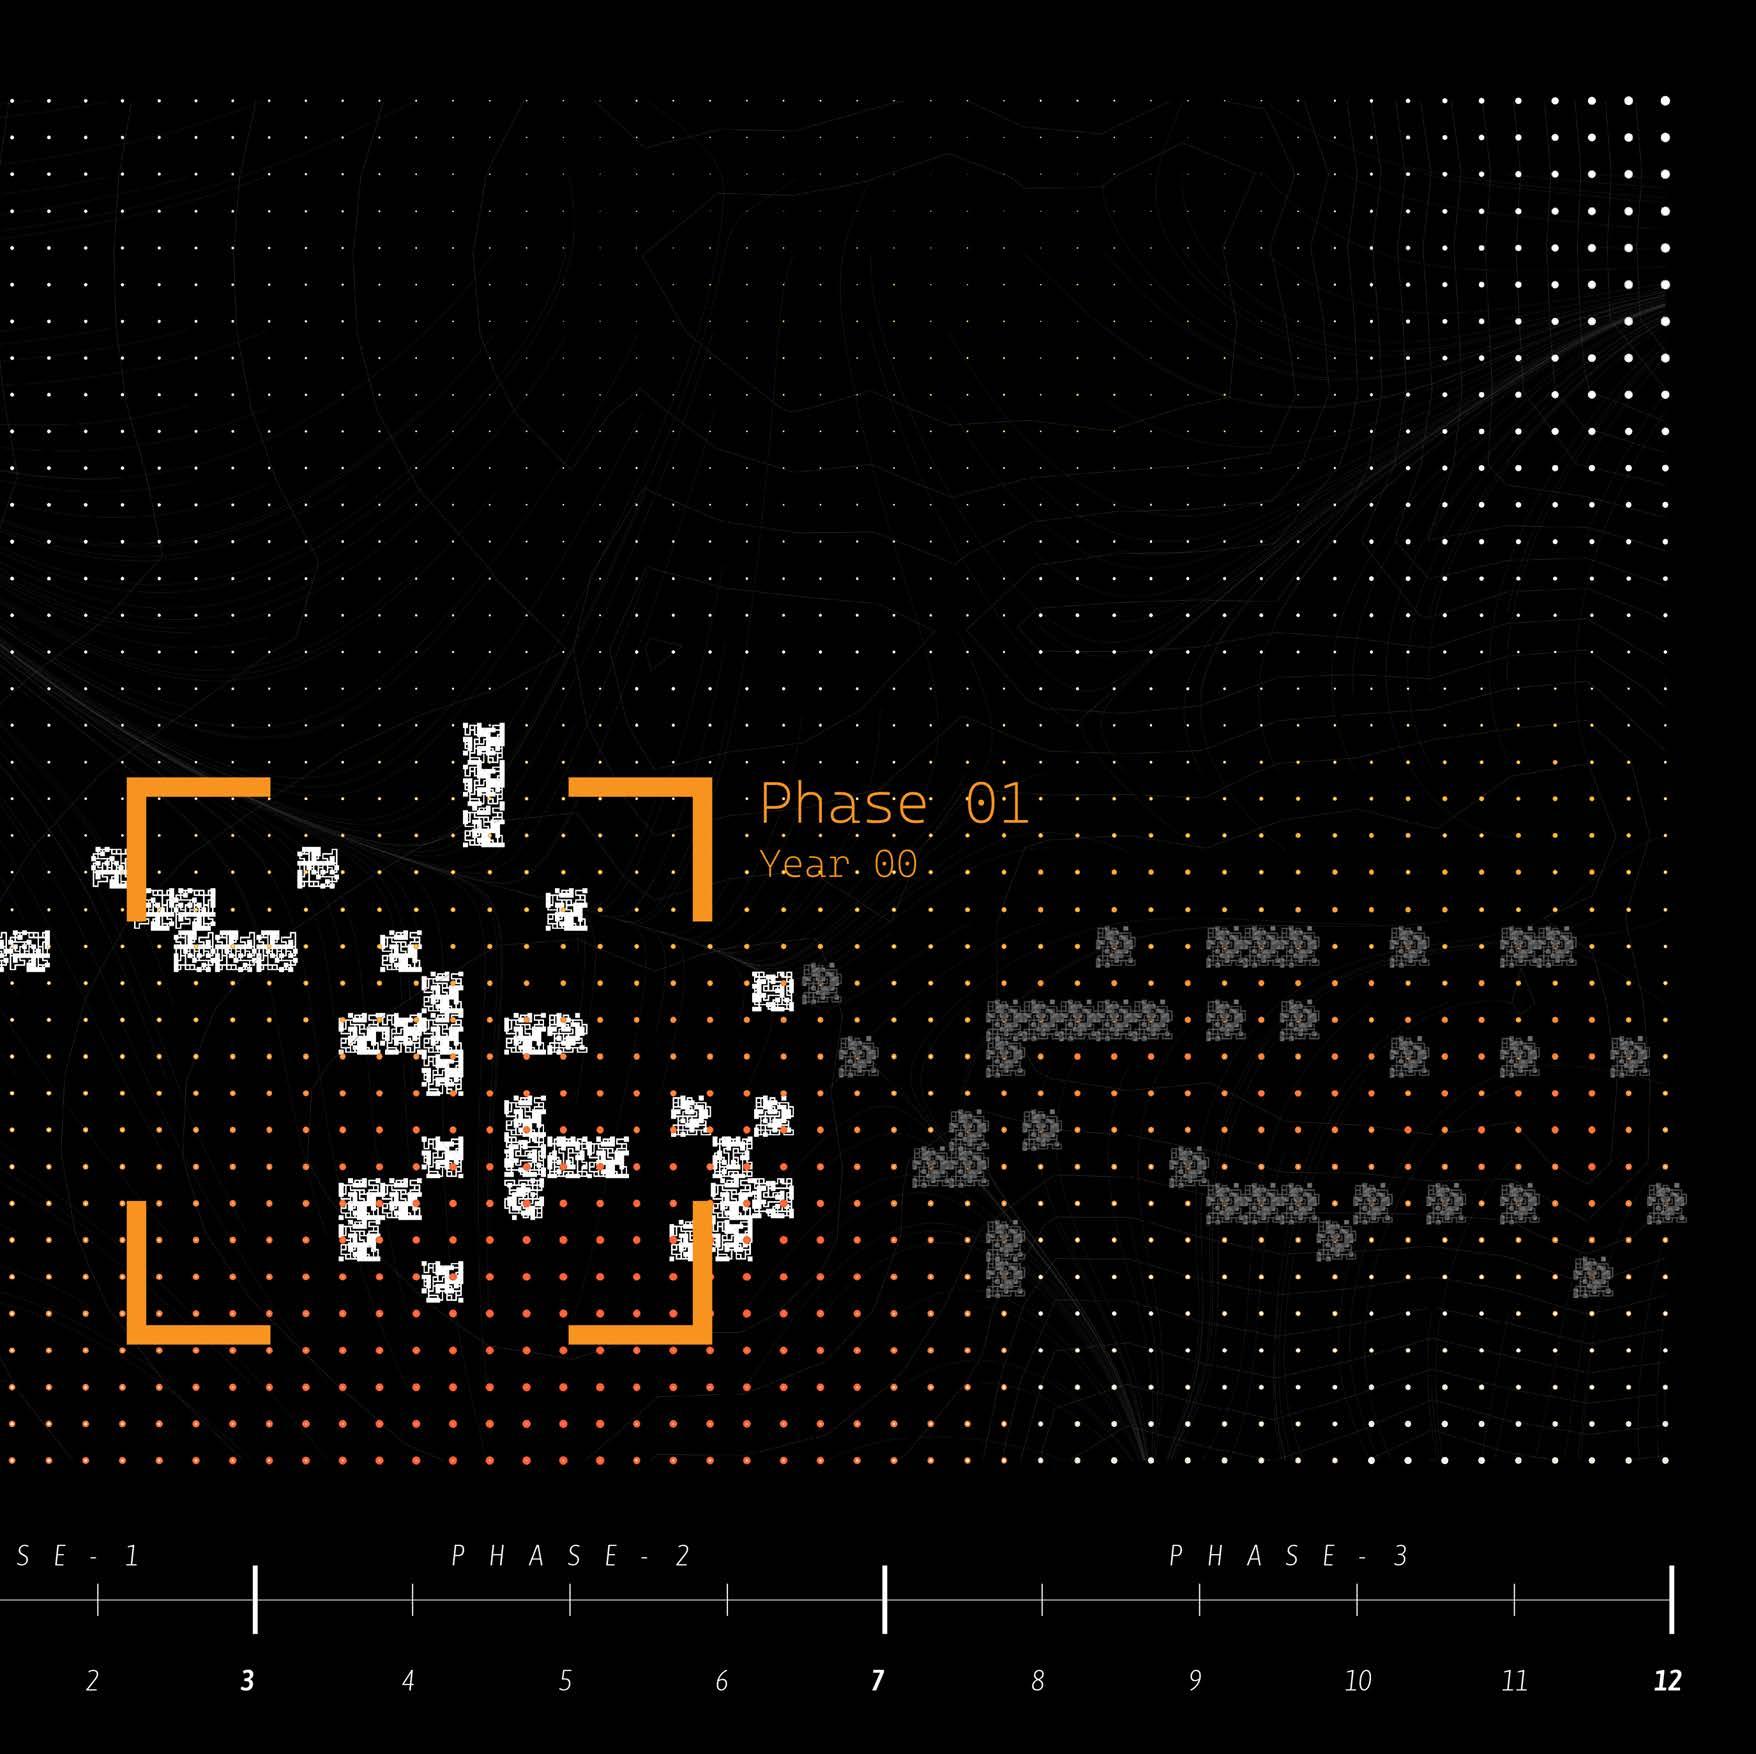
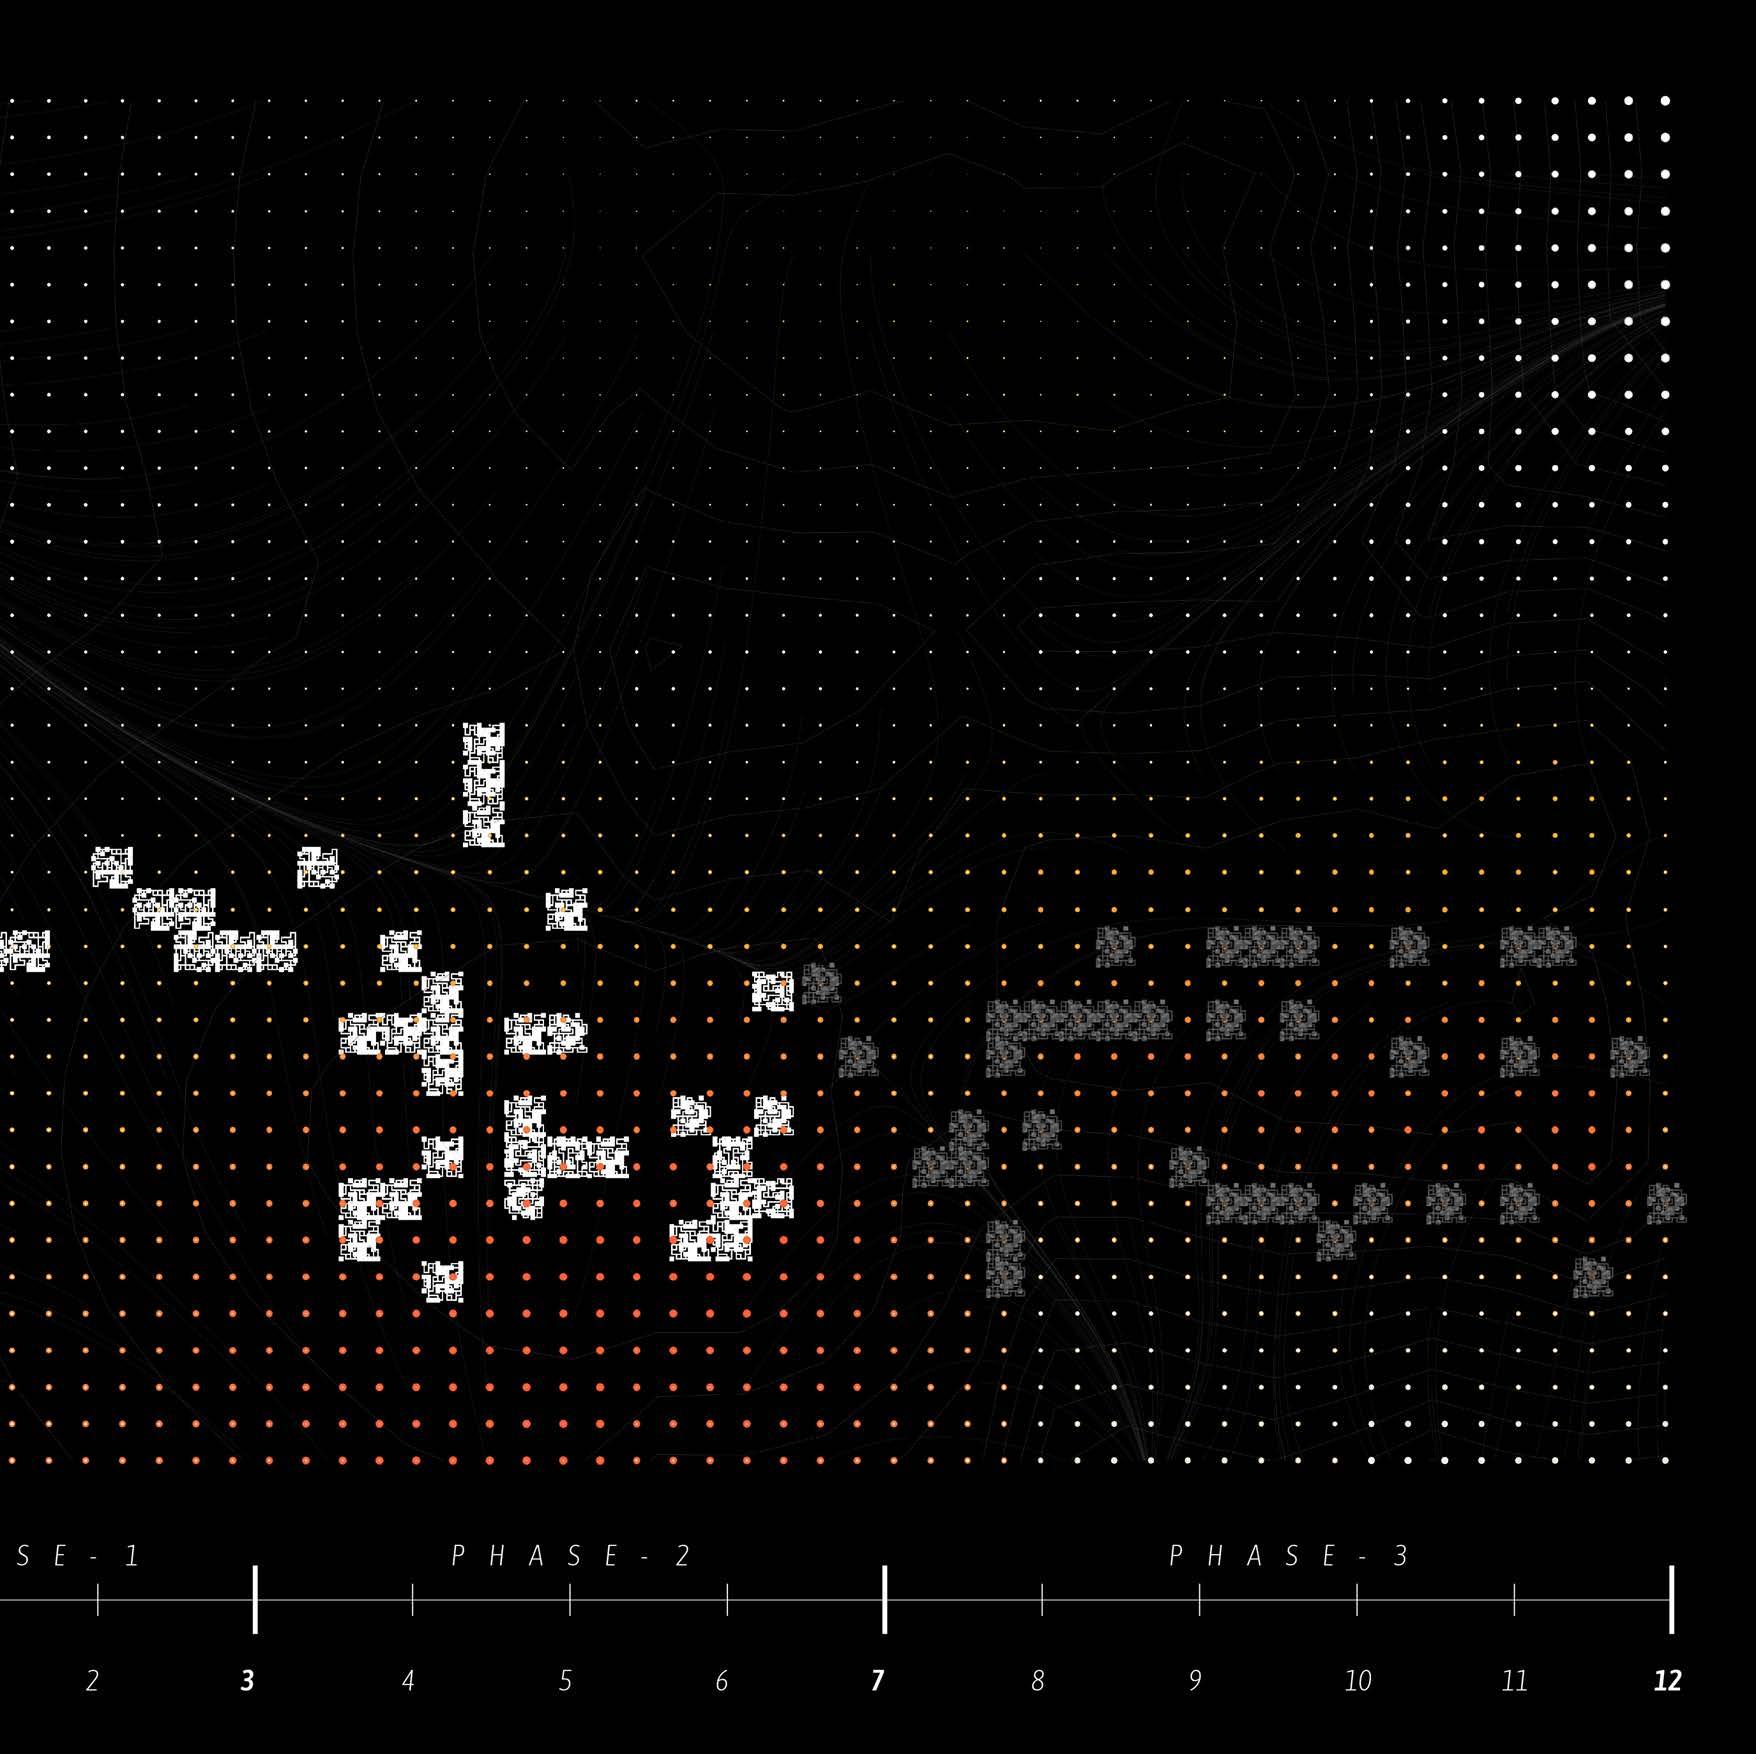
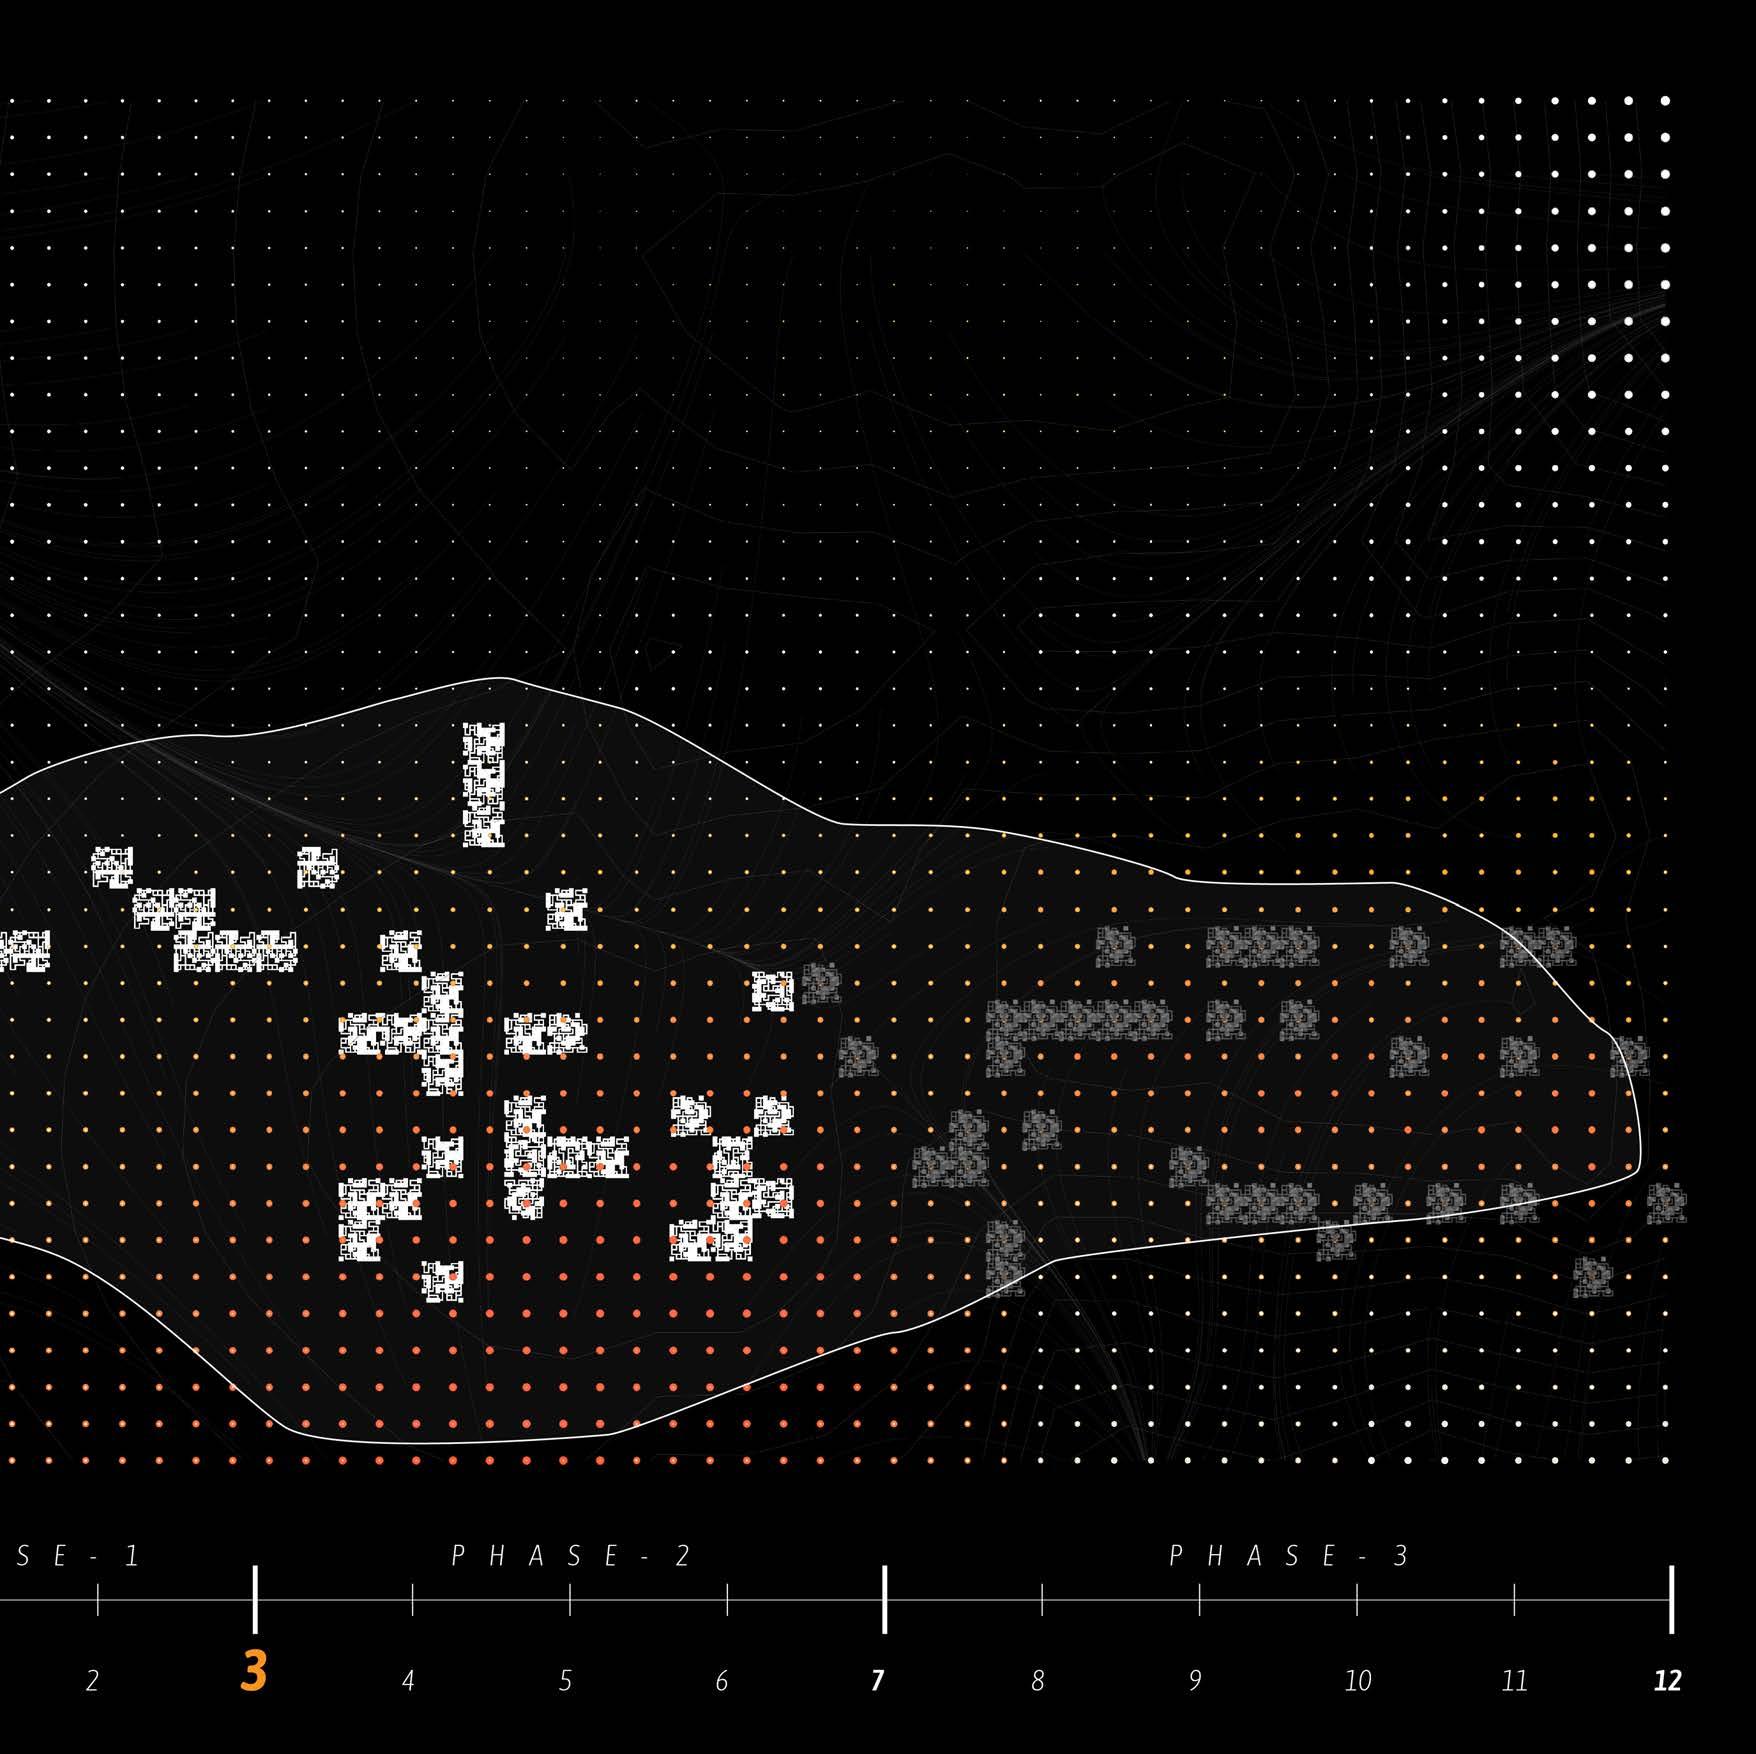
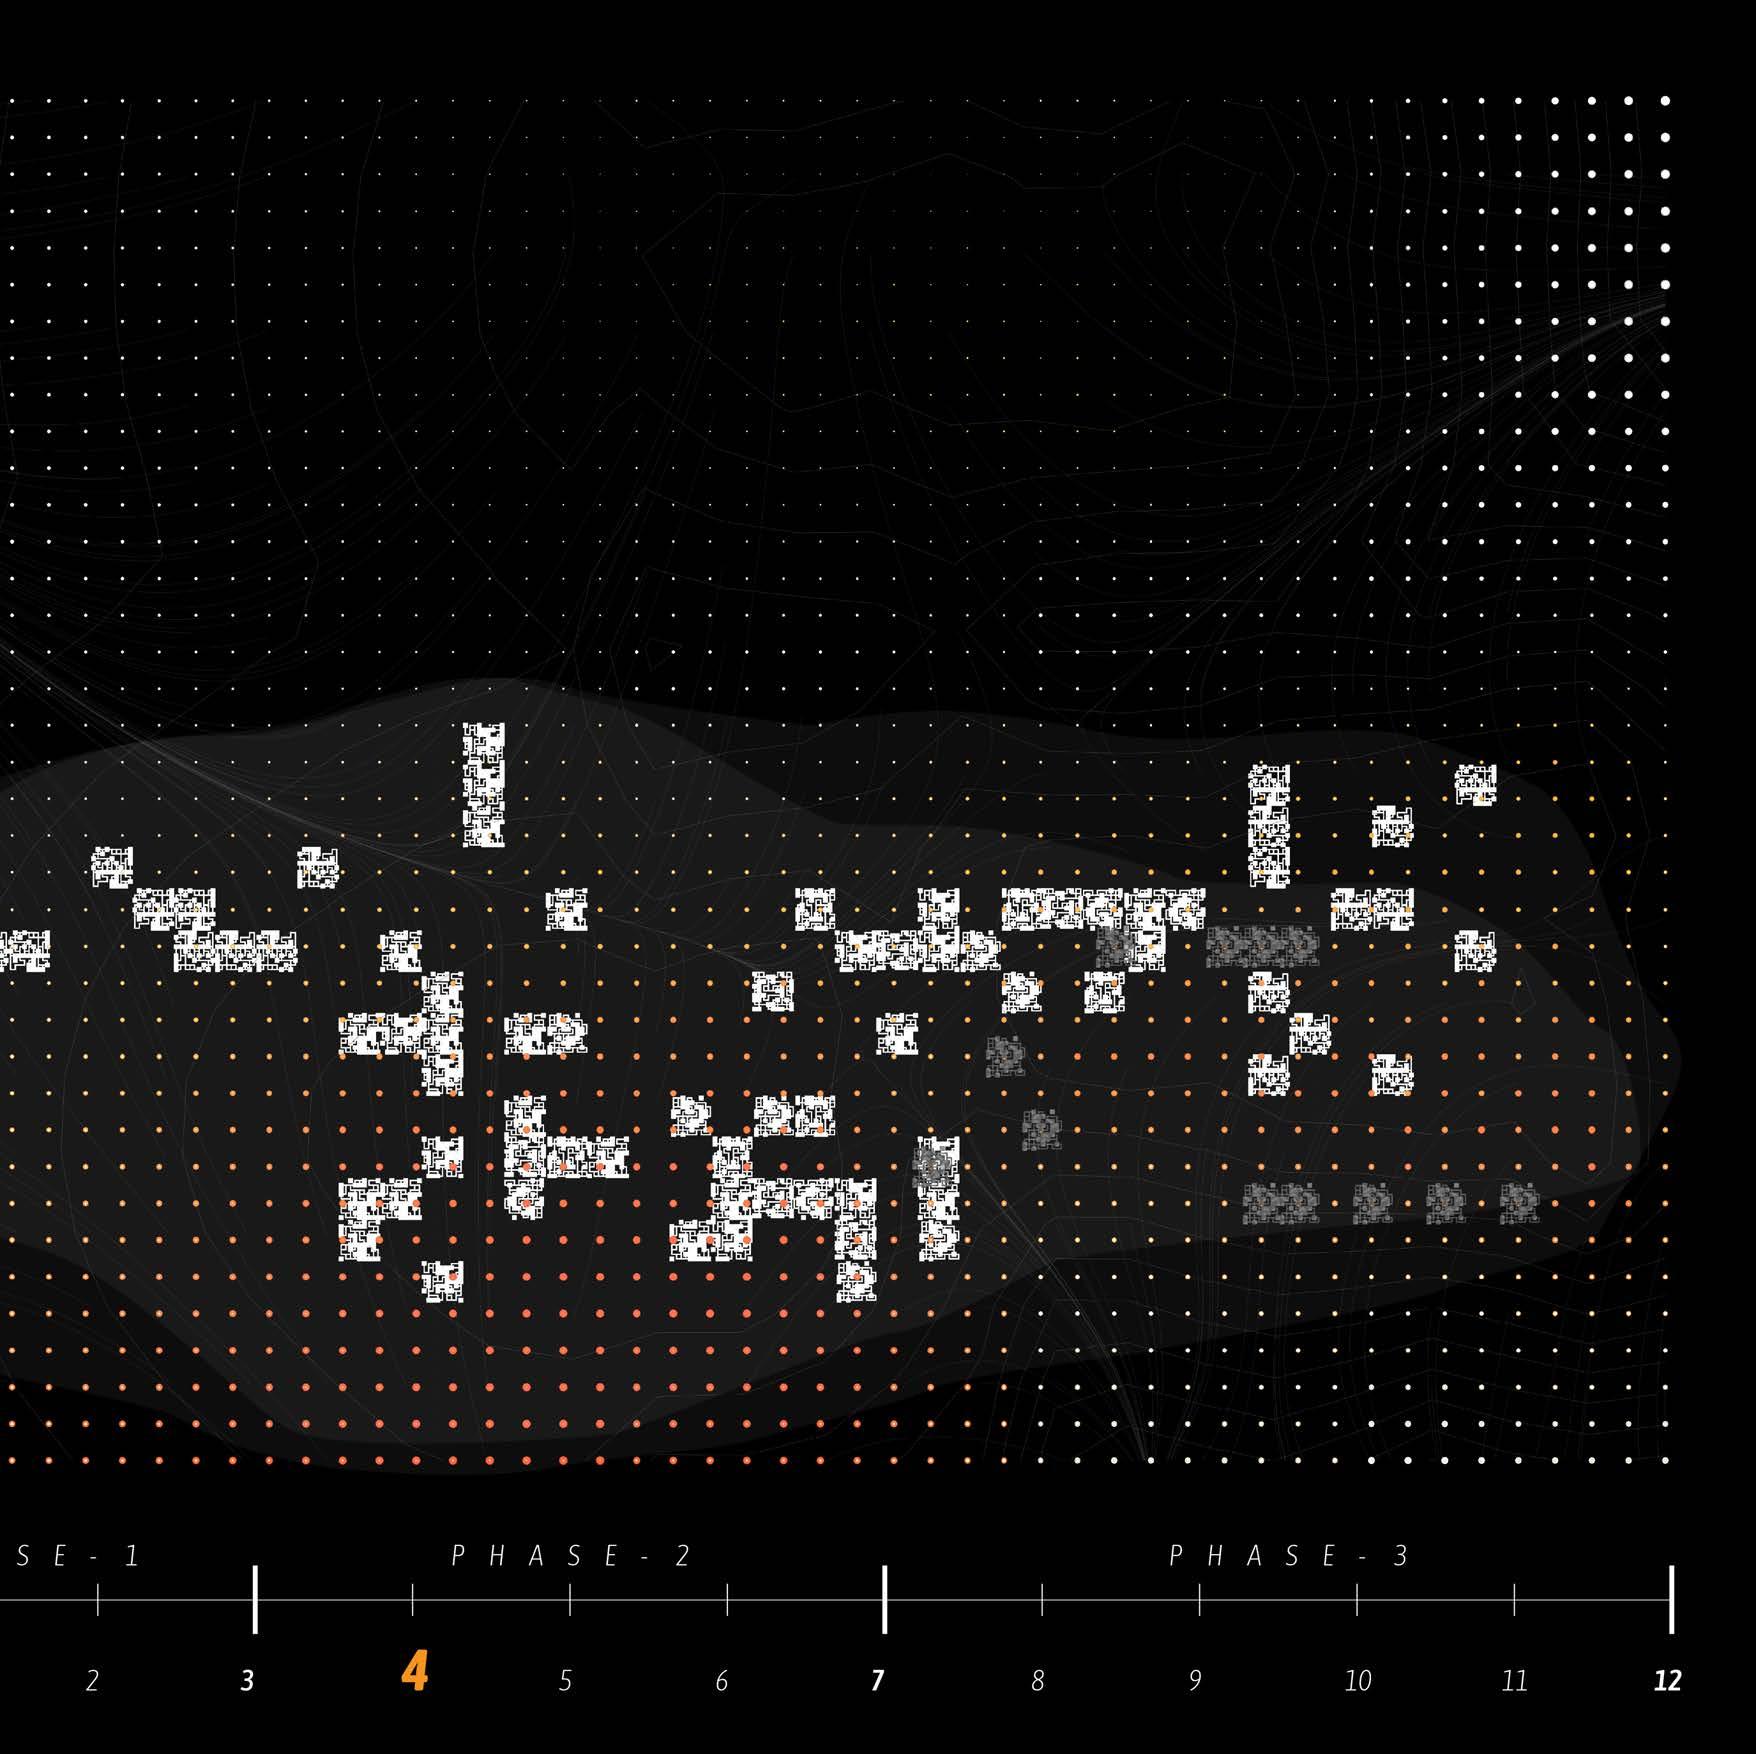
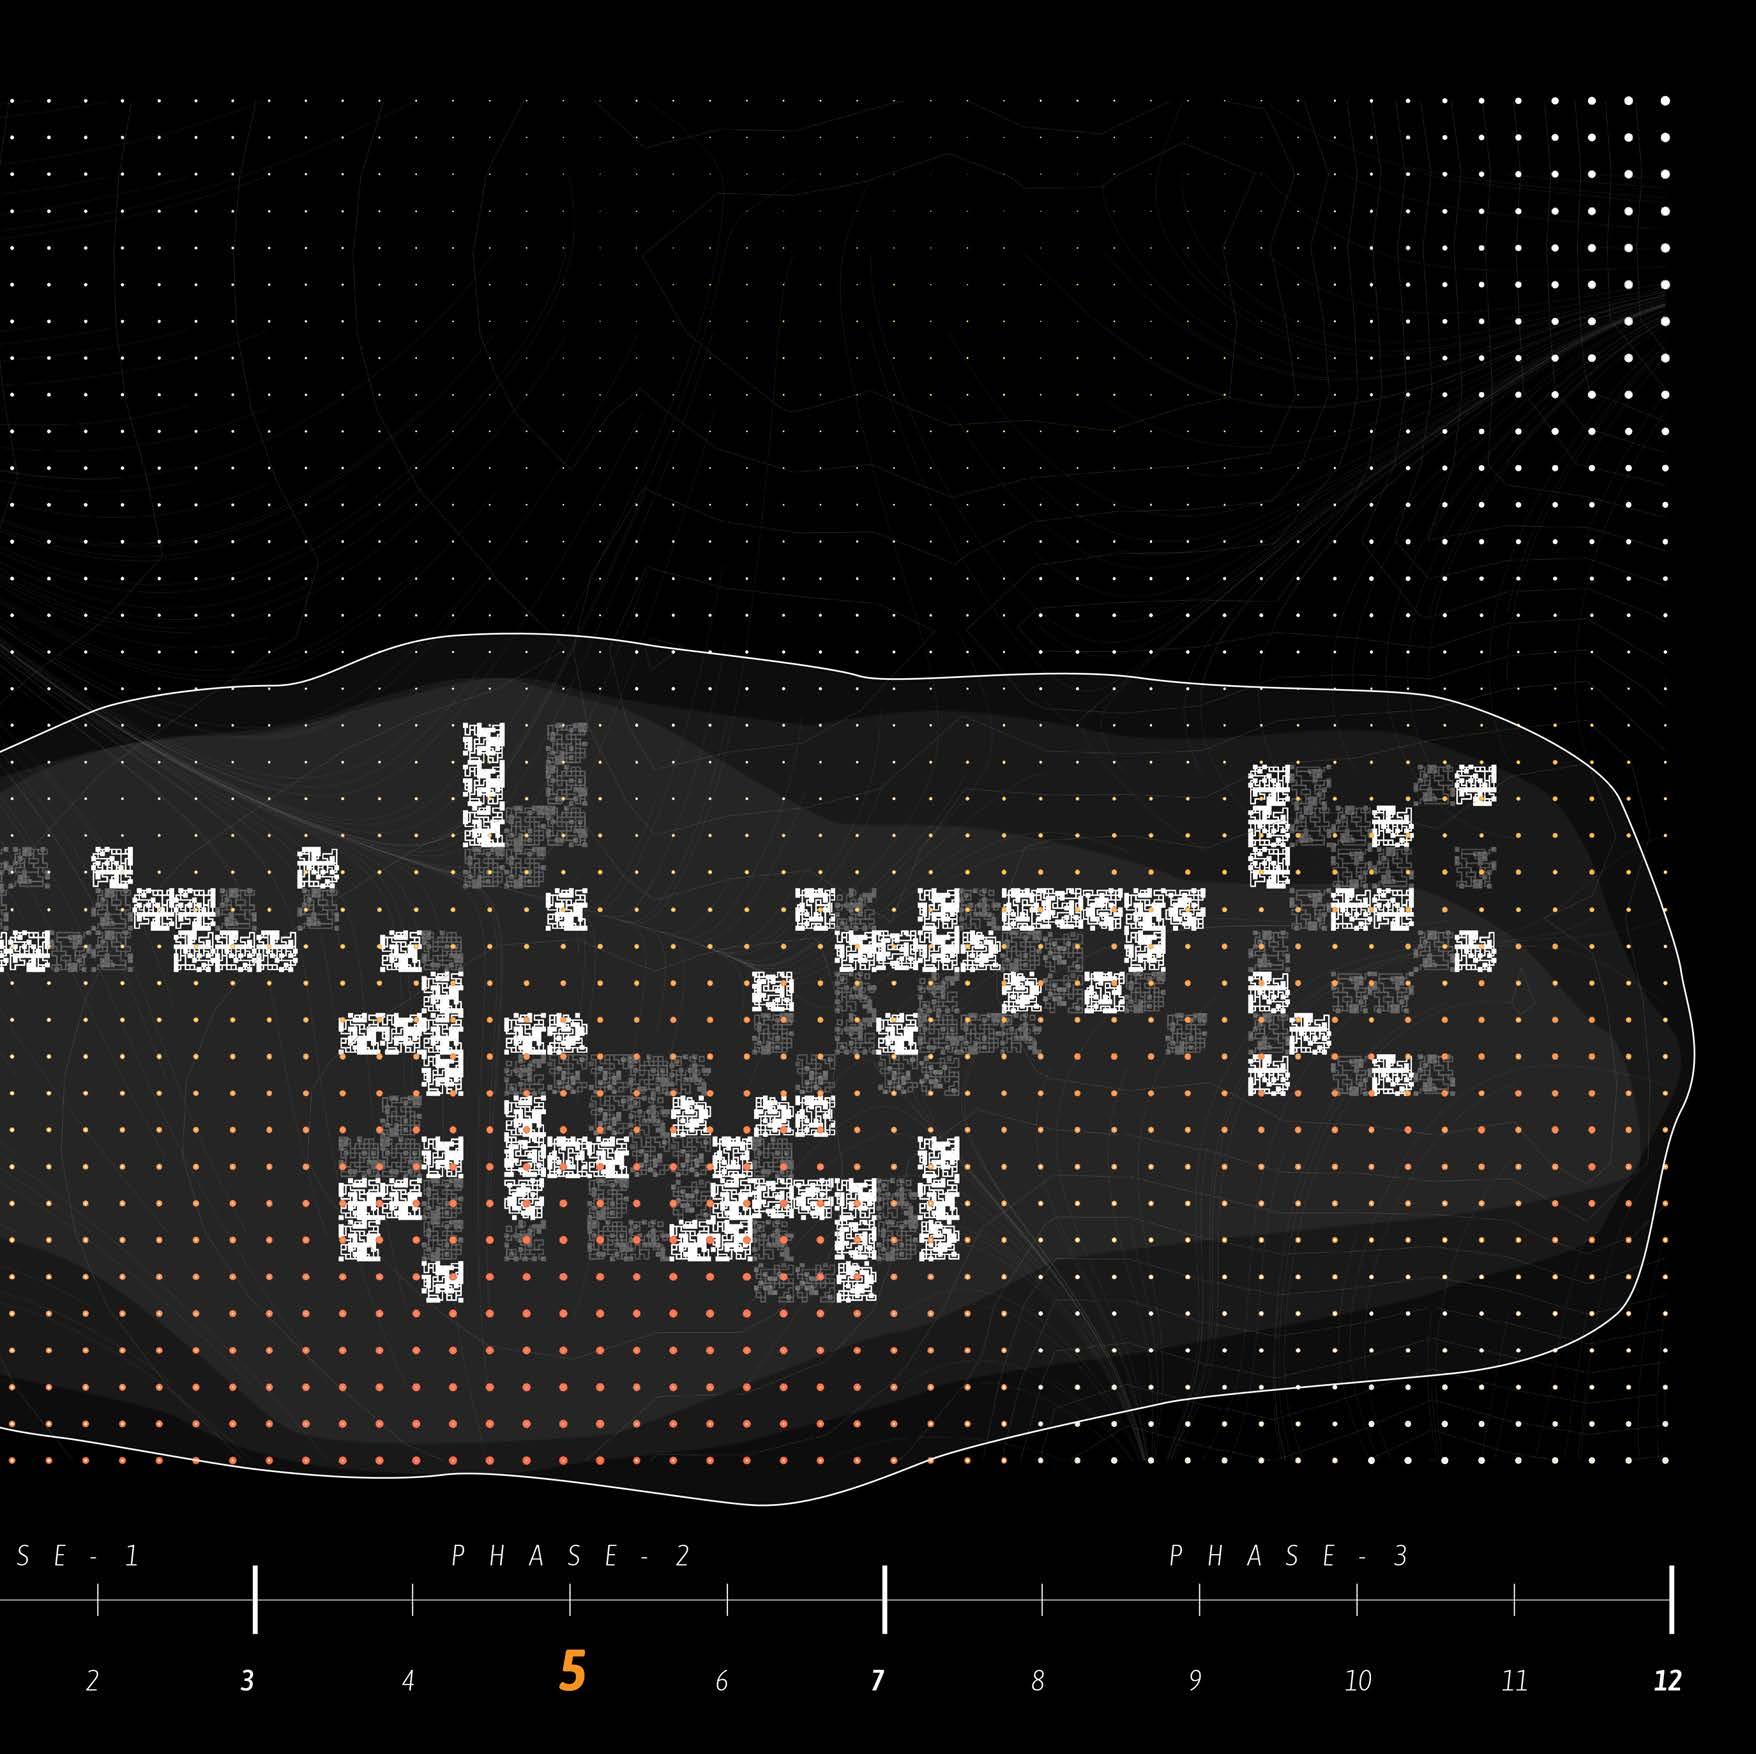
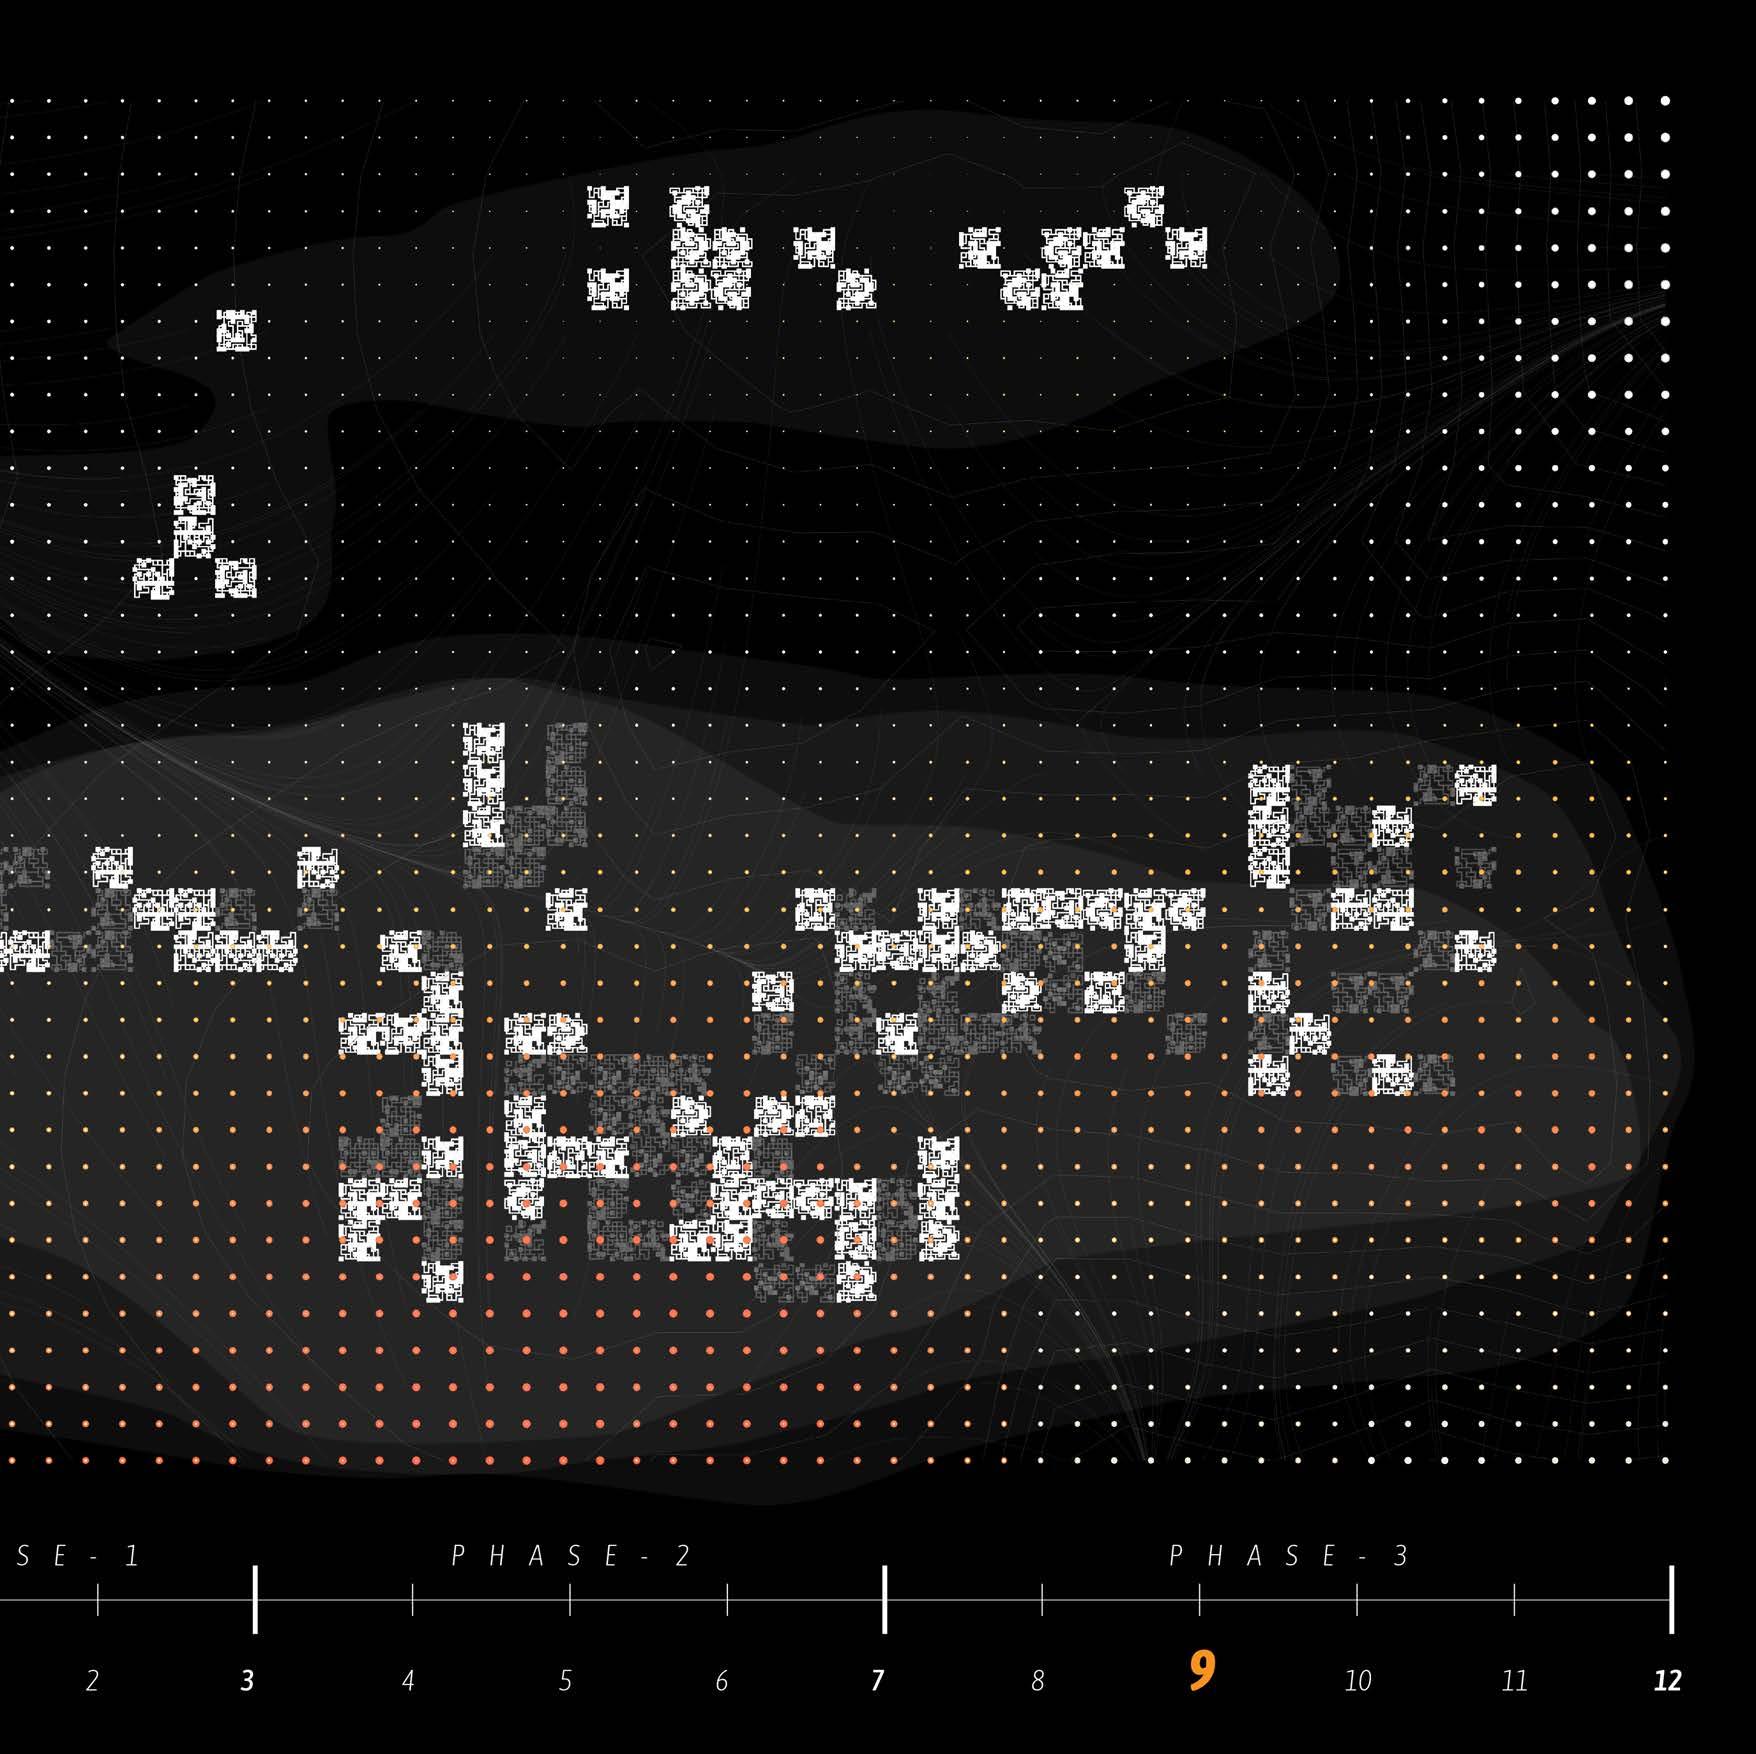
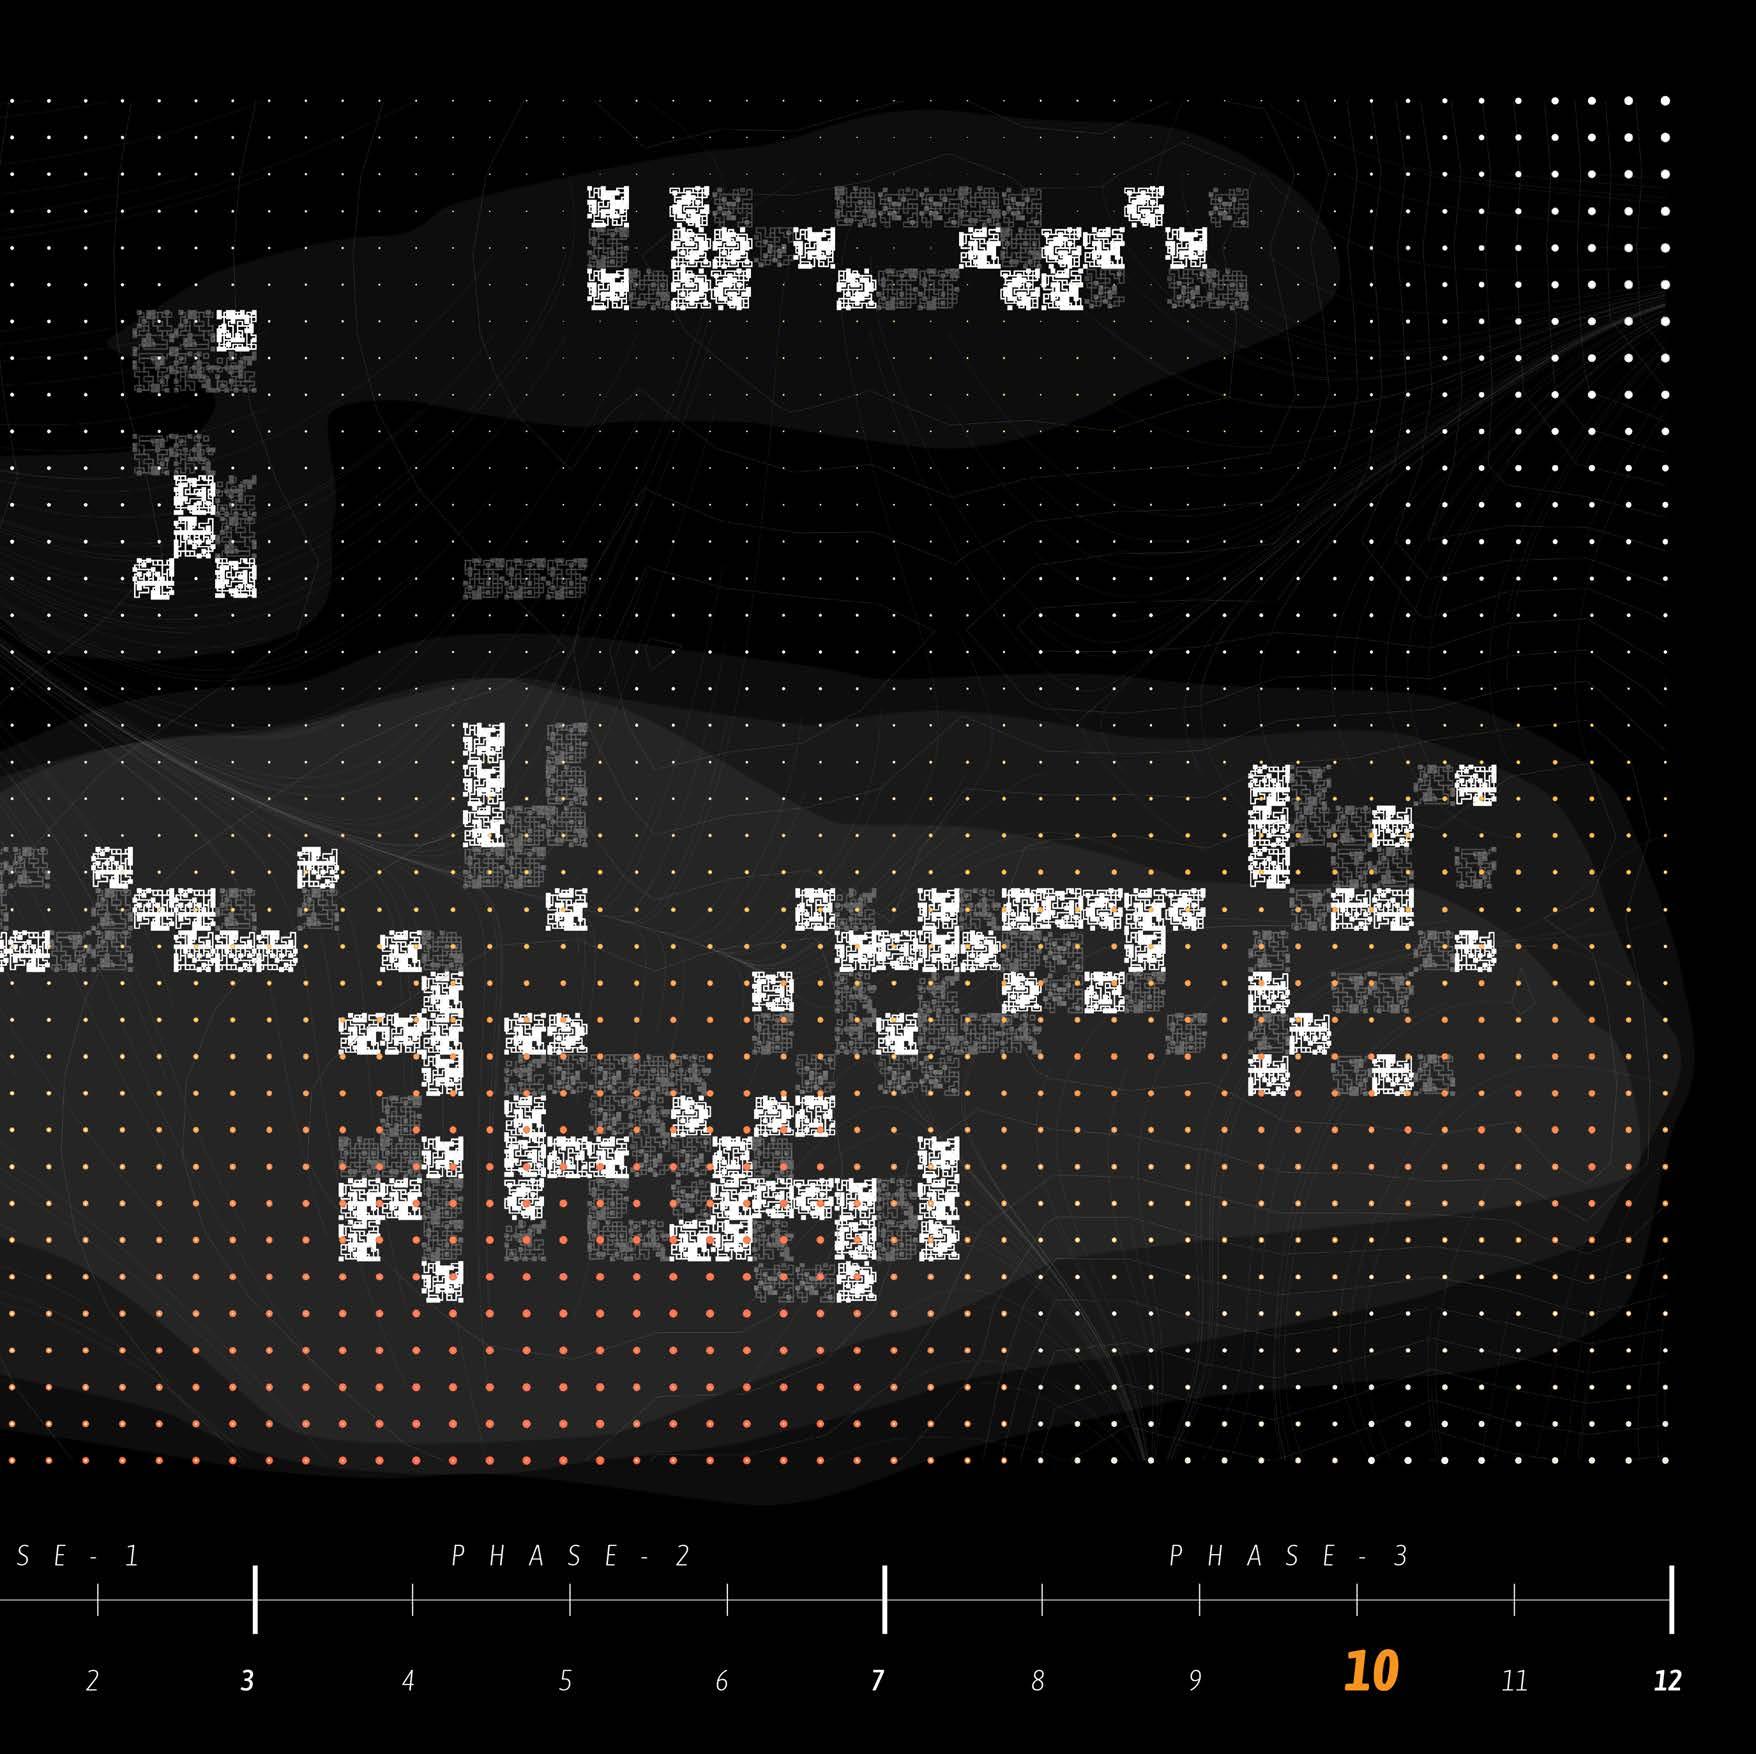
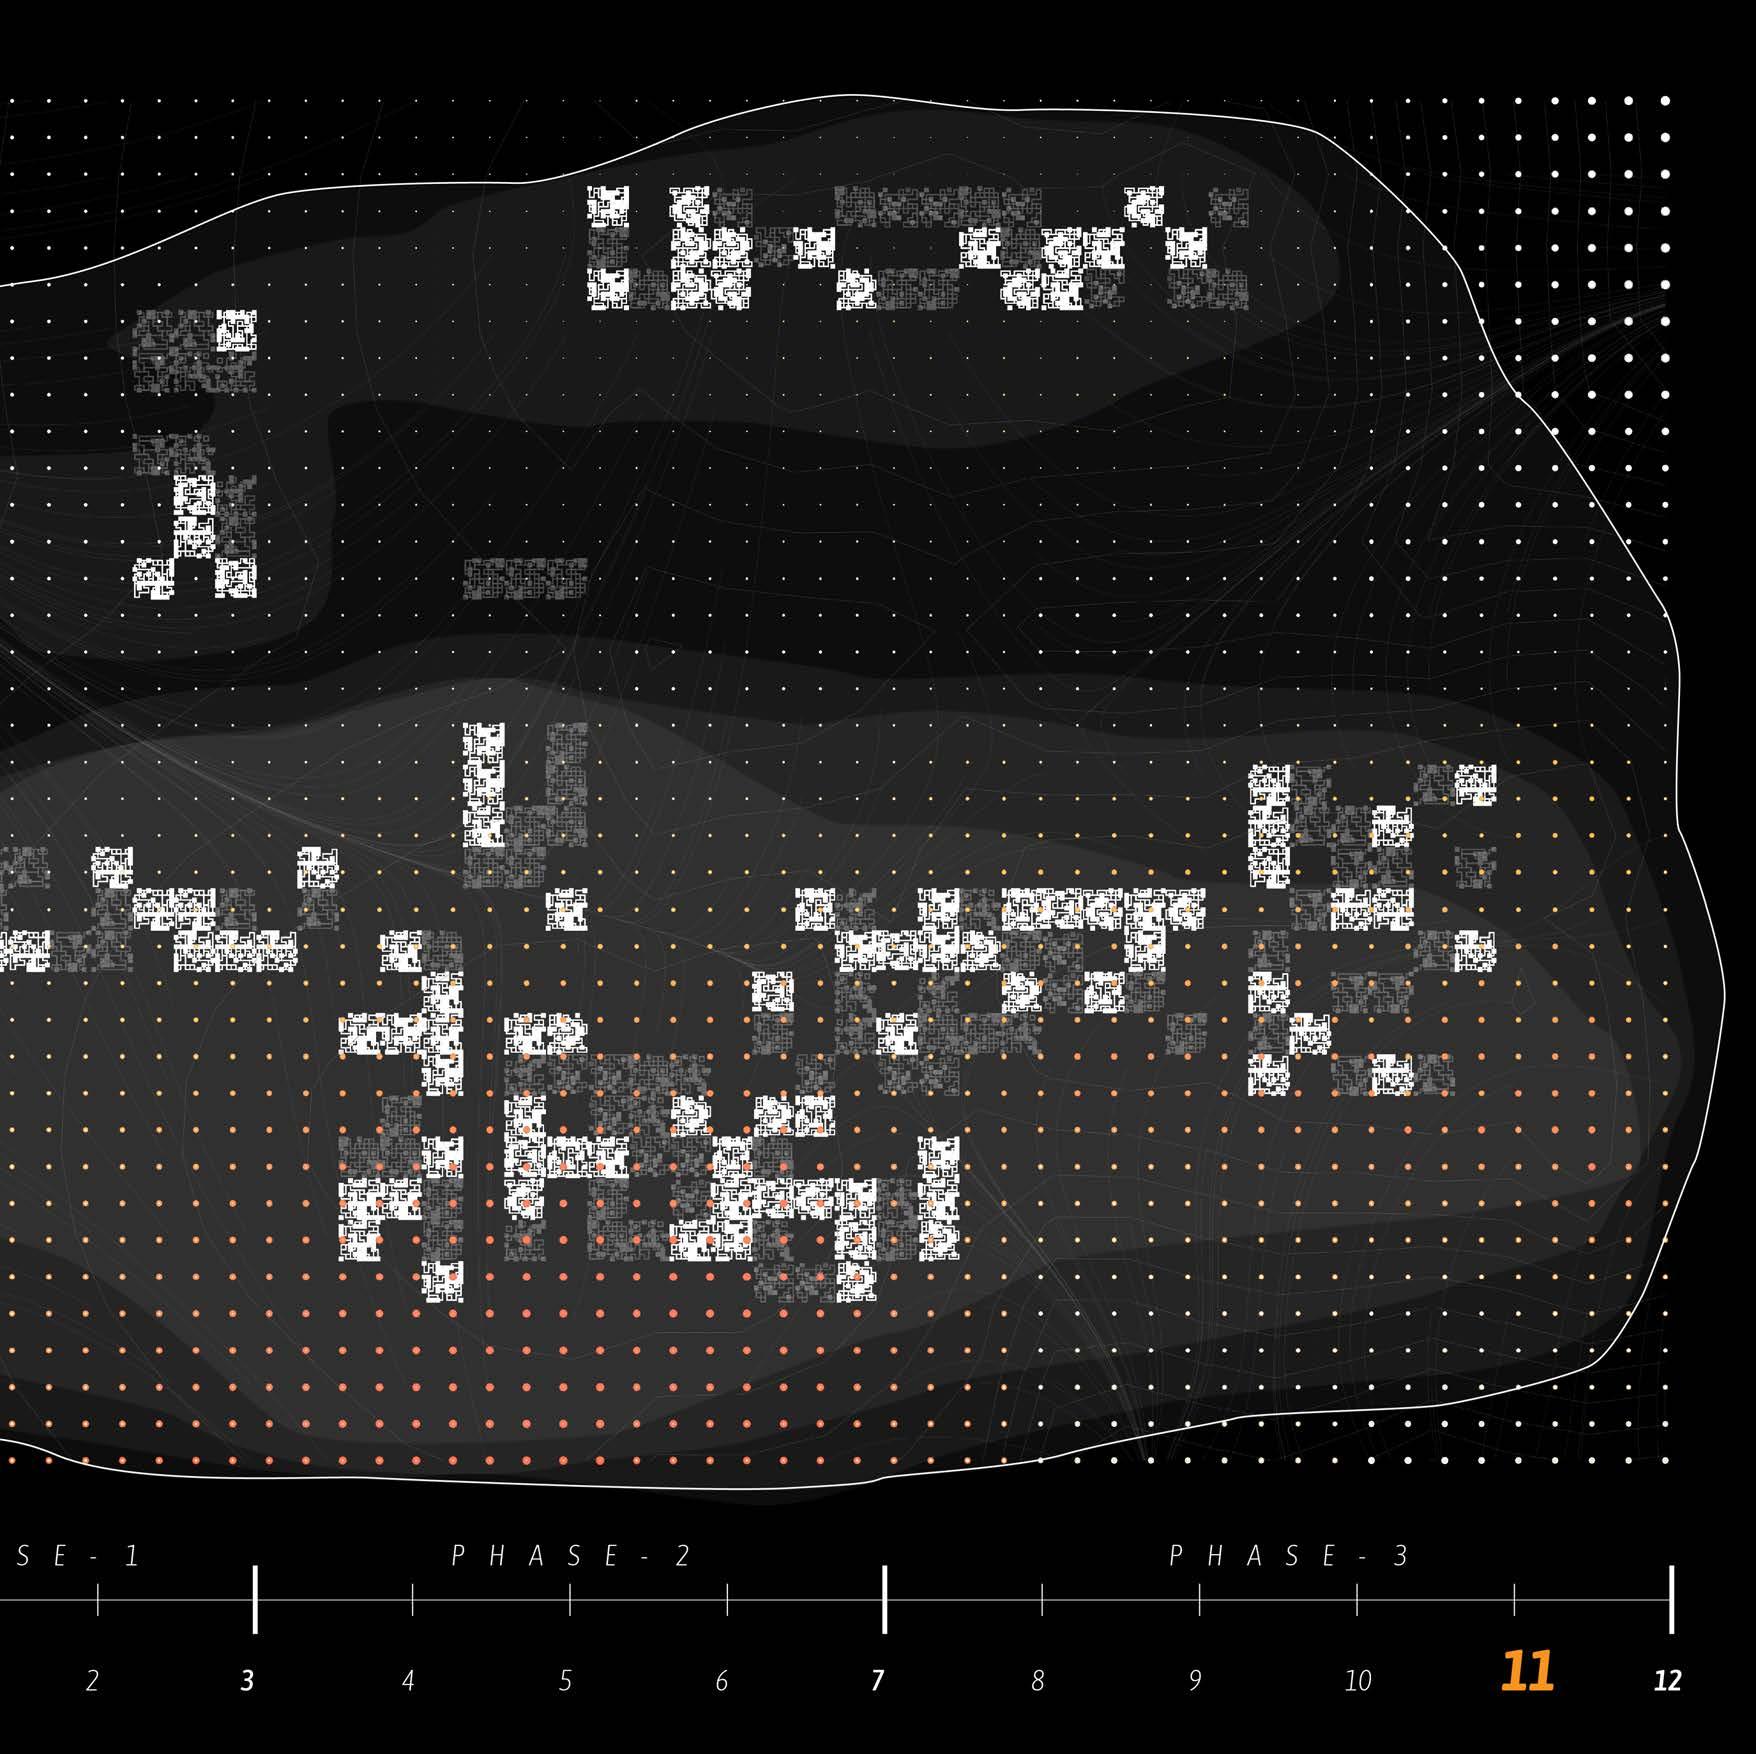
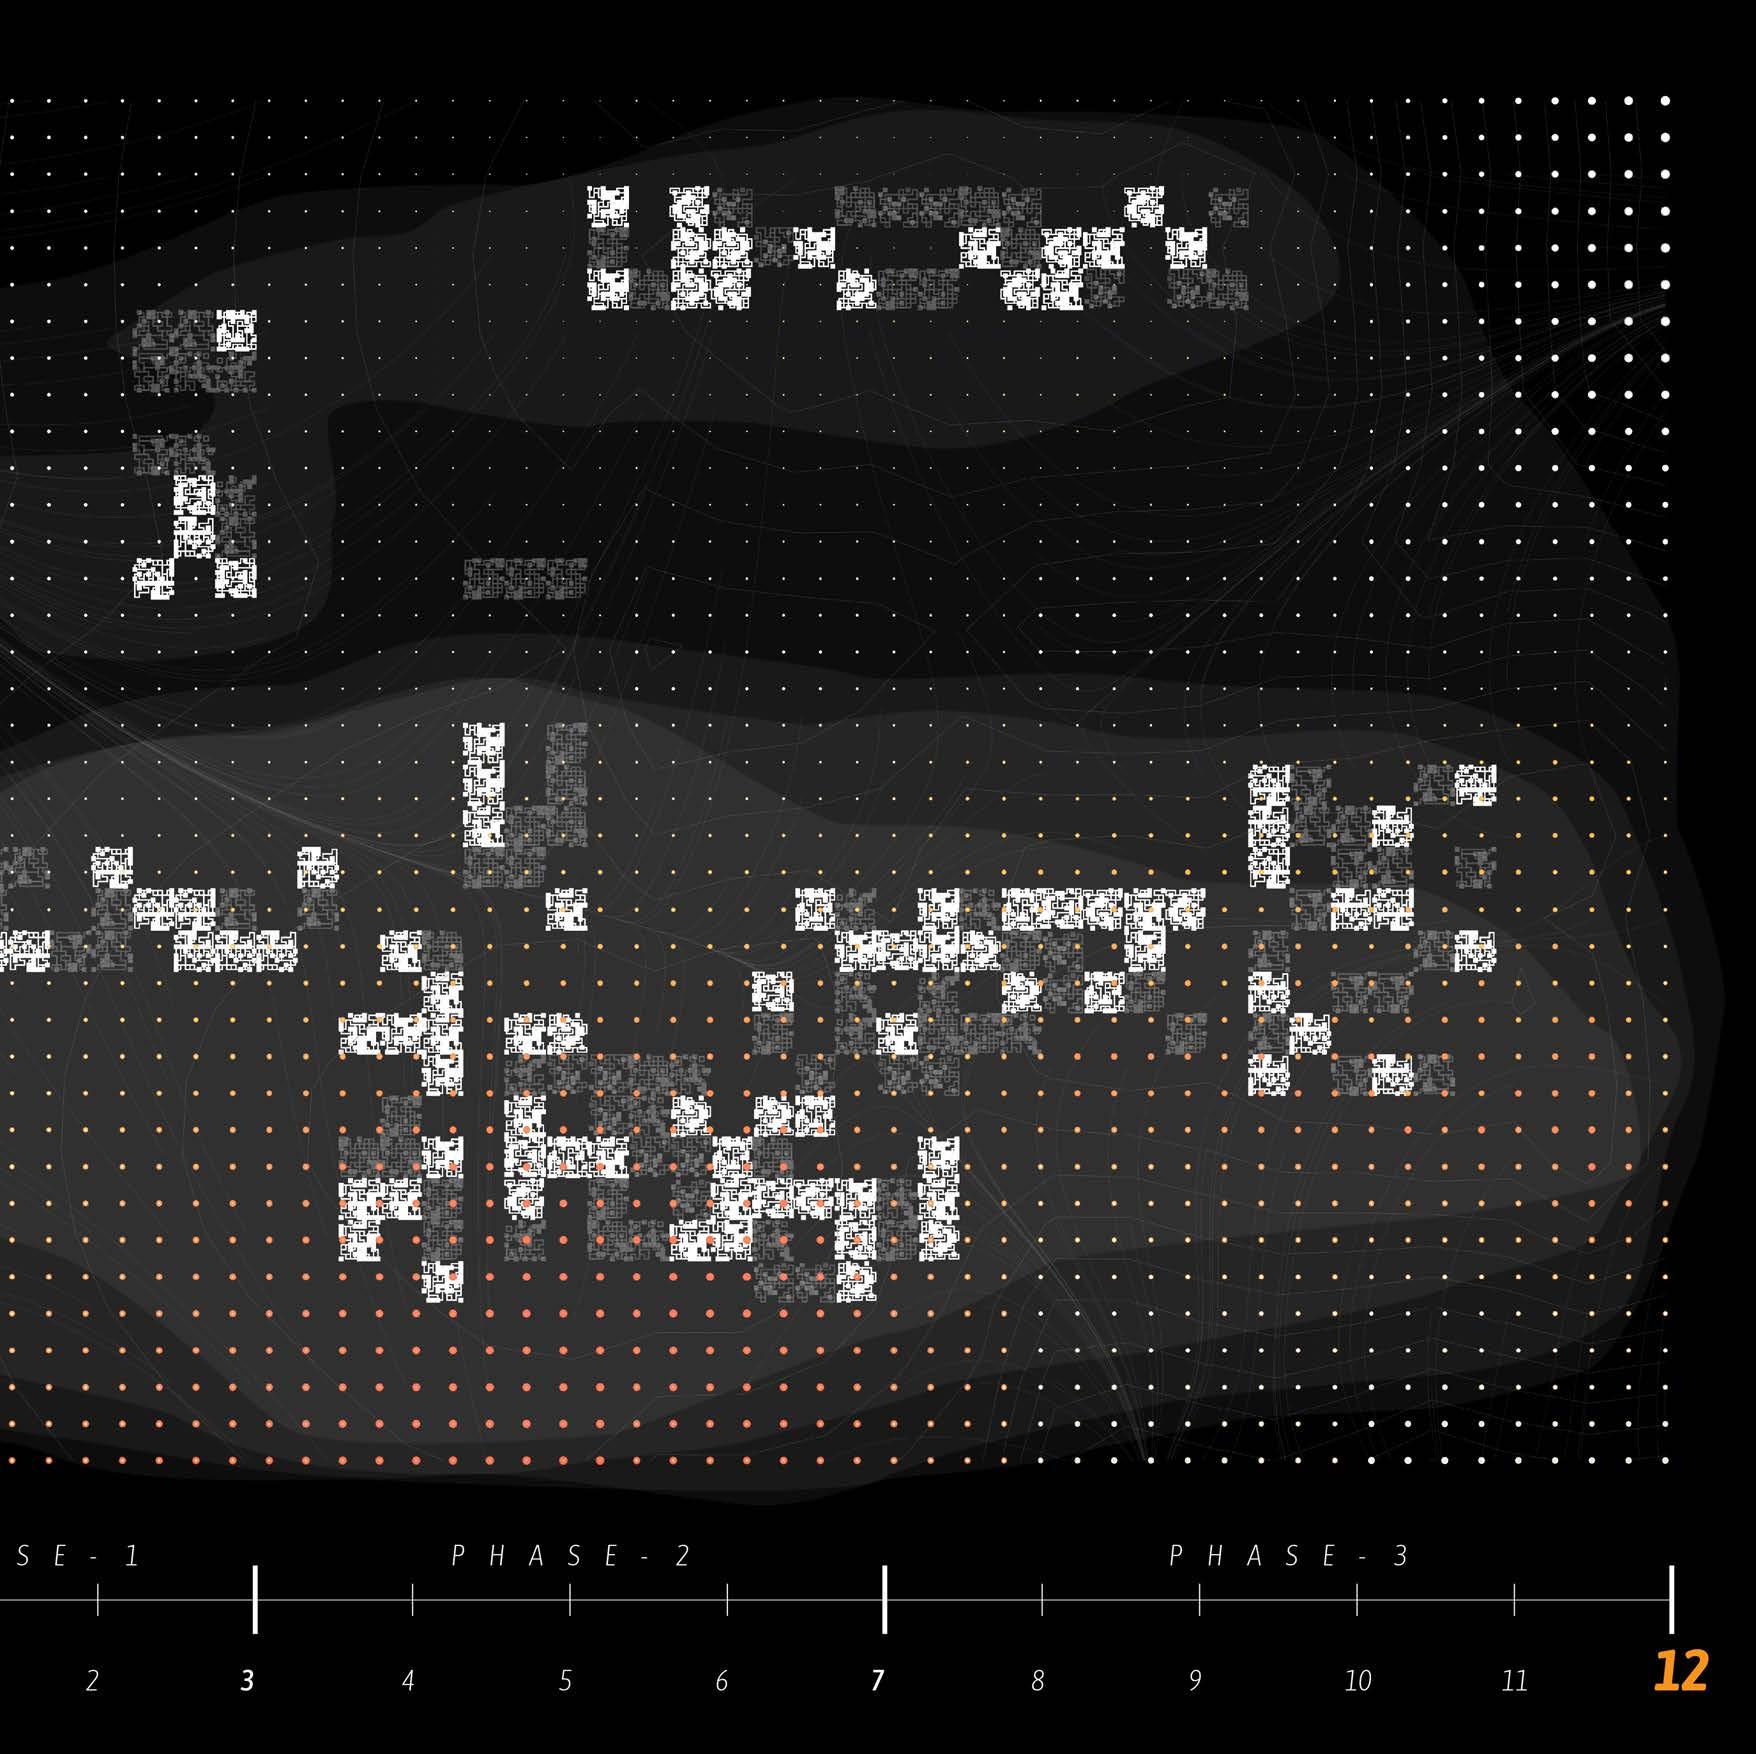
Phase-Based Time Structure
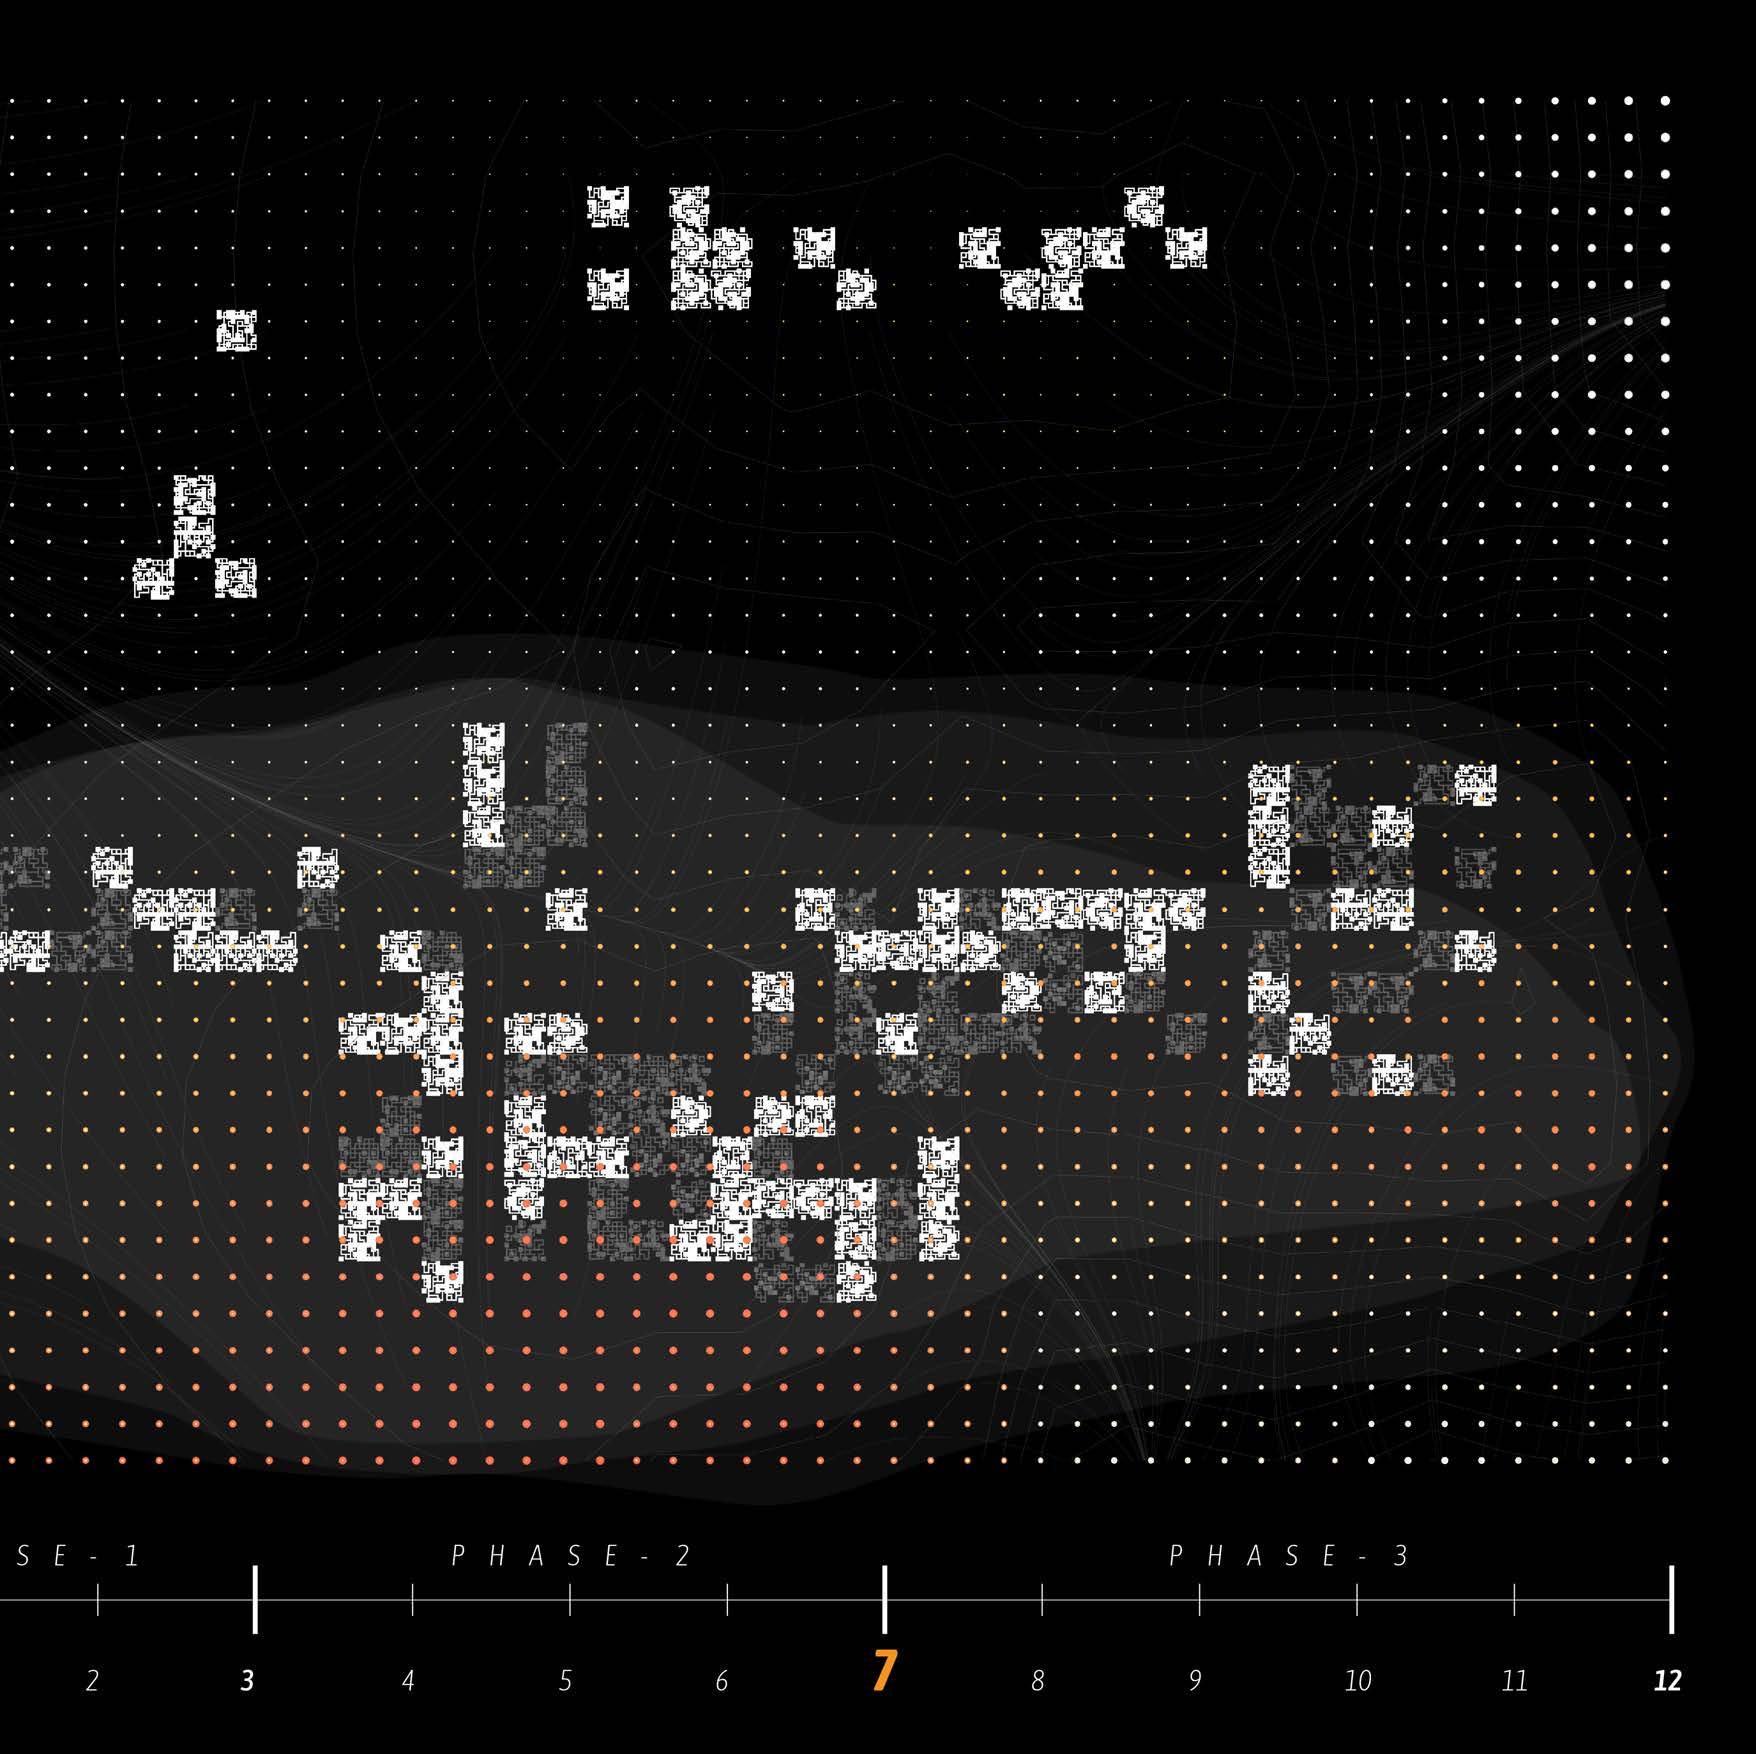
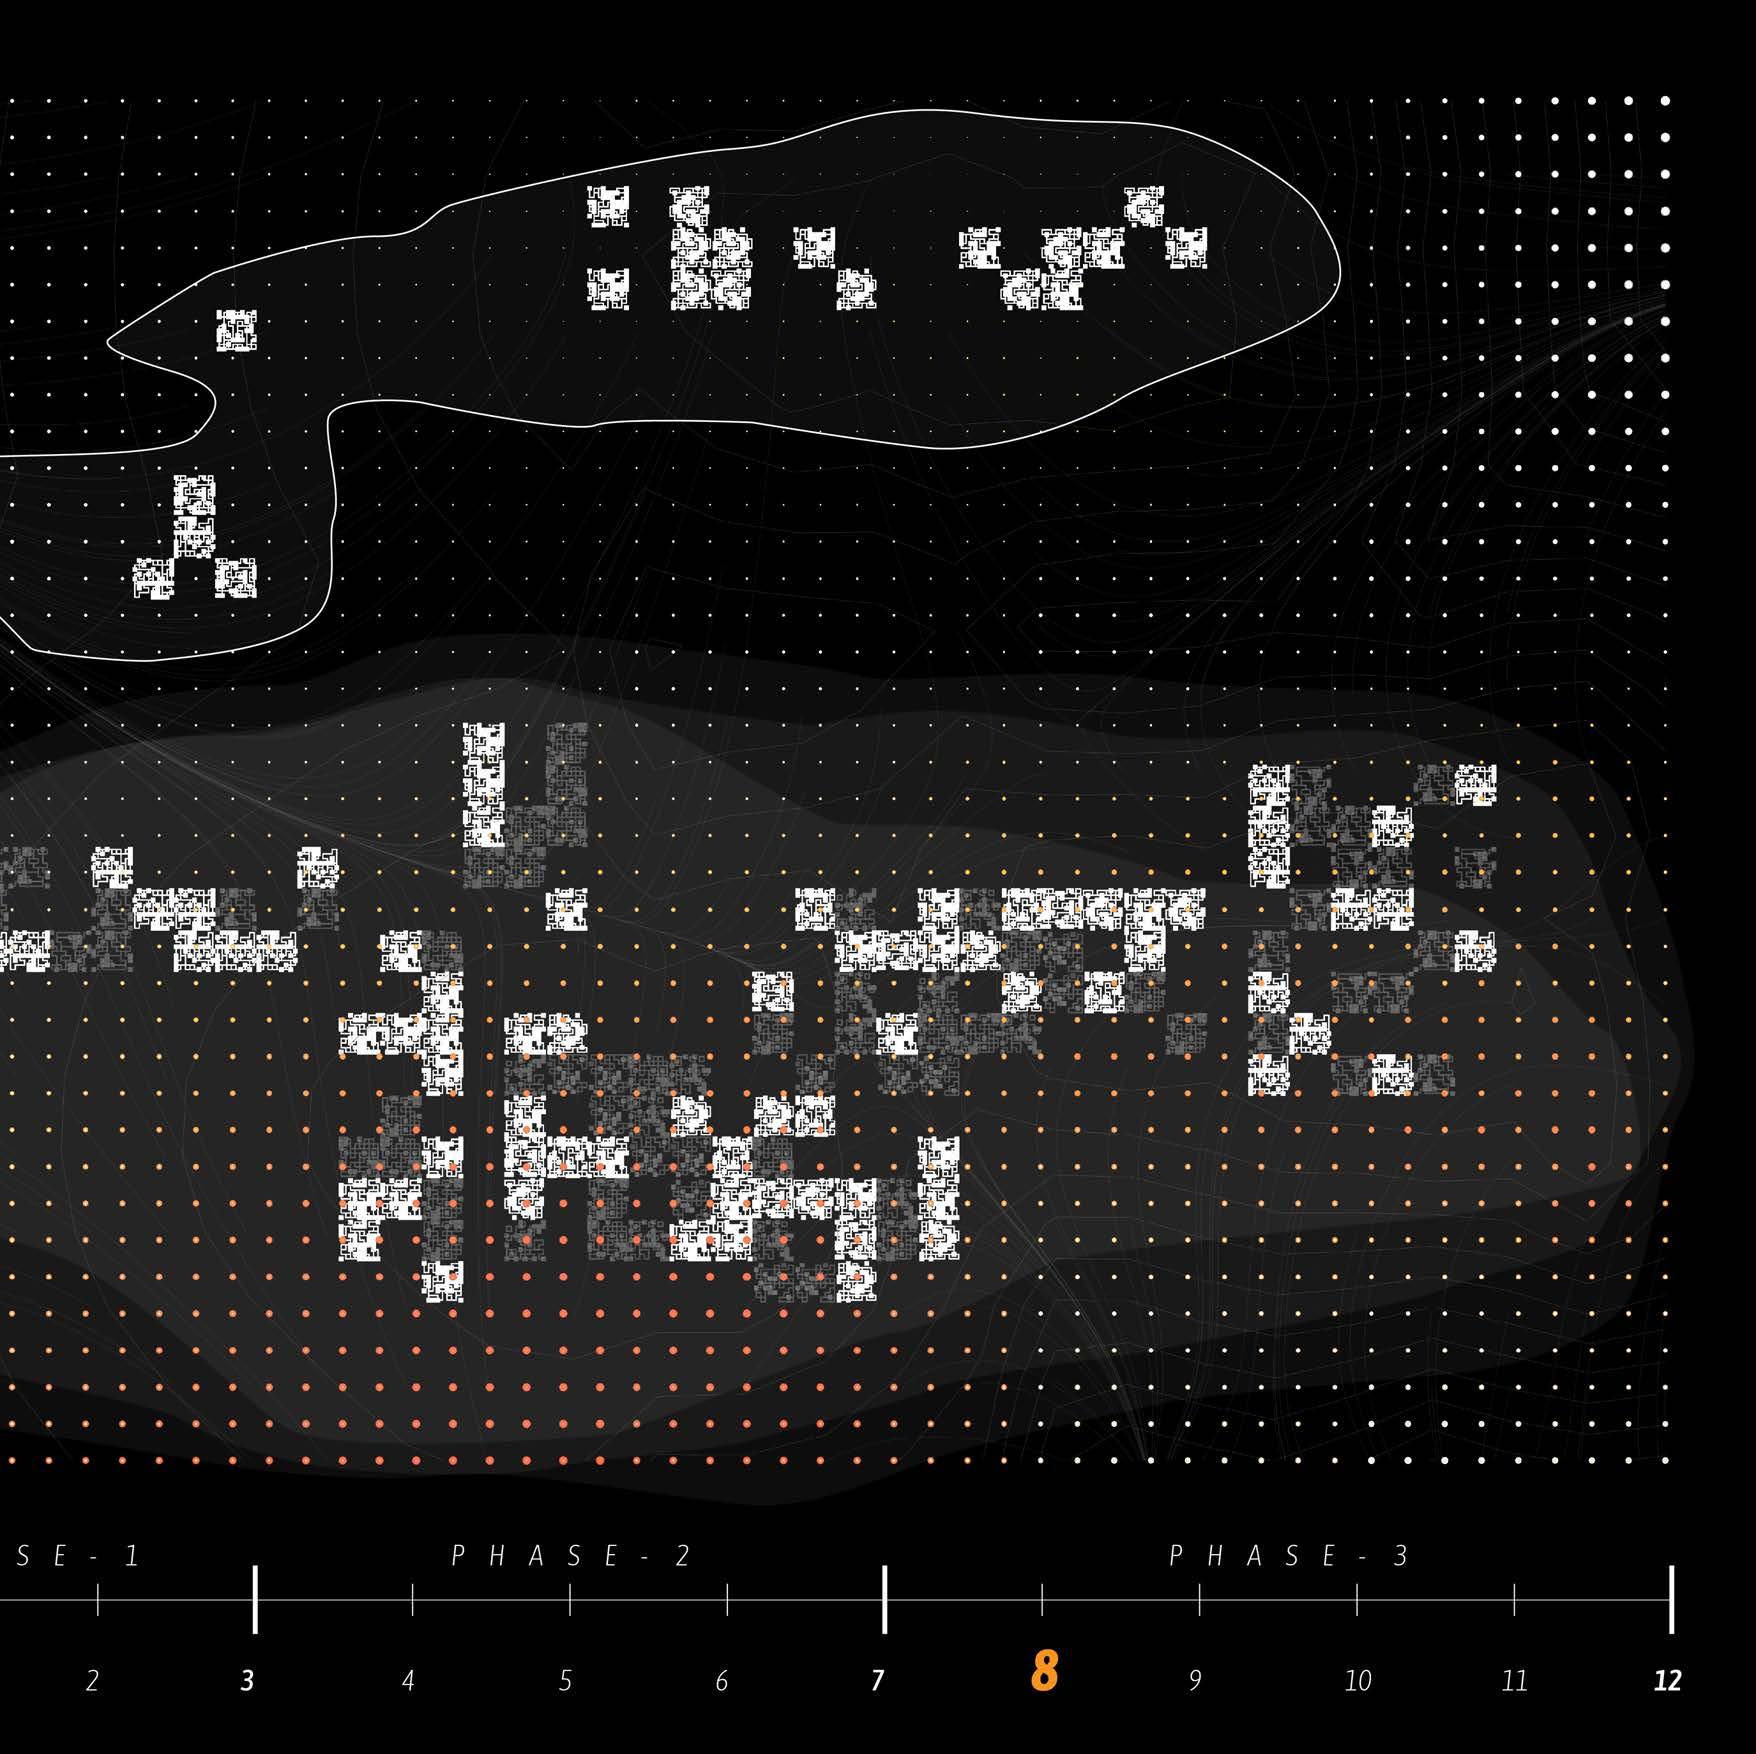
The settlement develops through three temporal phases, each defined by a distinct relationship between land, water, and inhabitation.
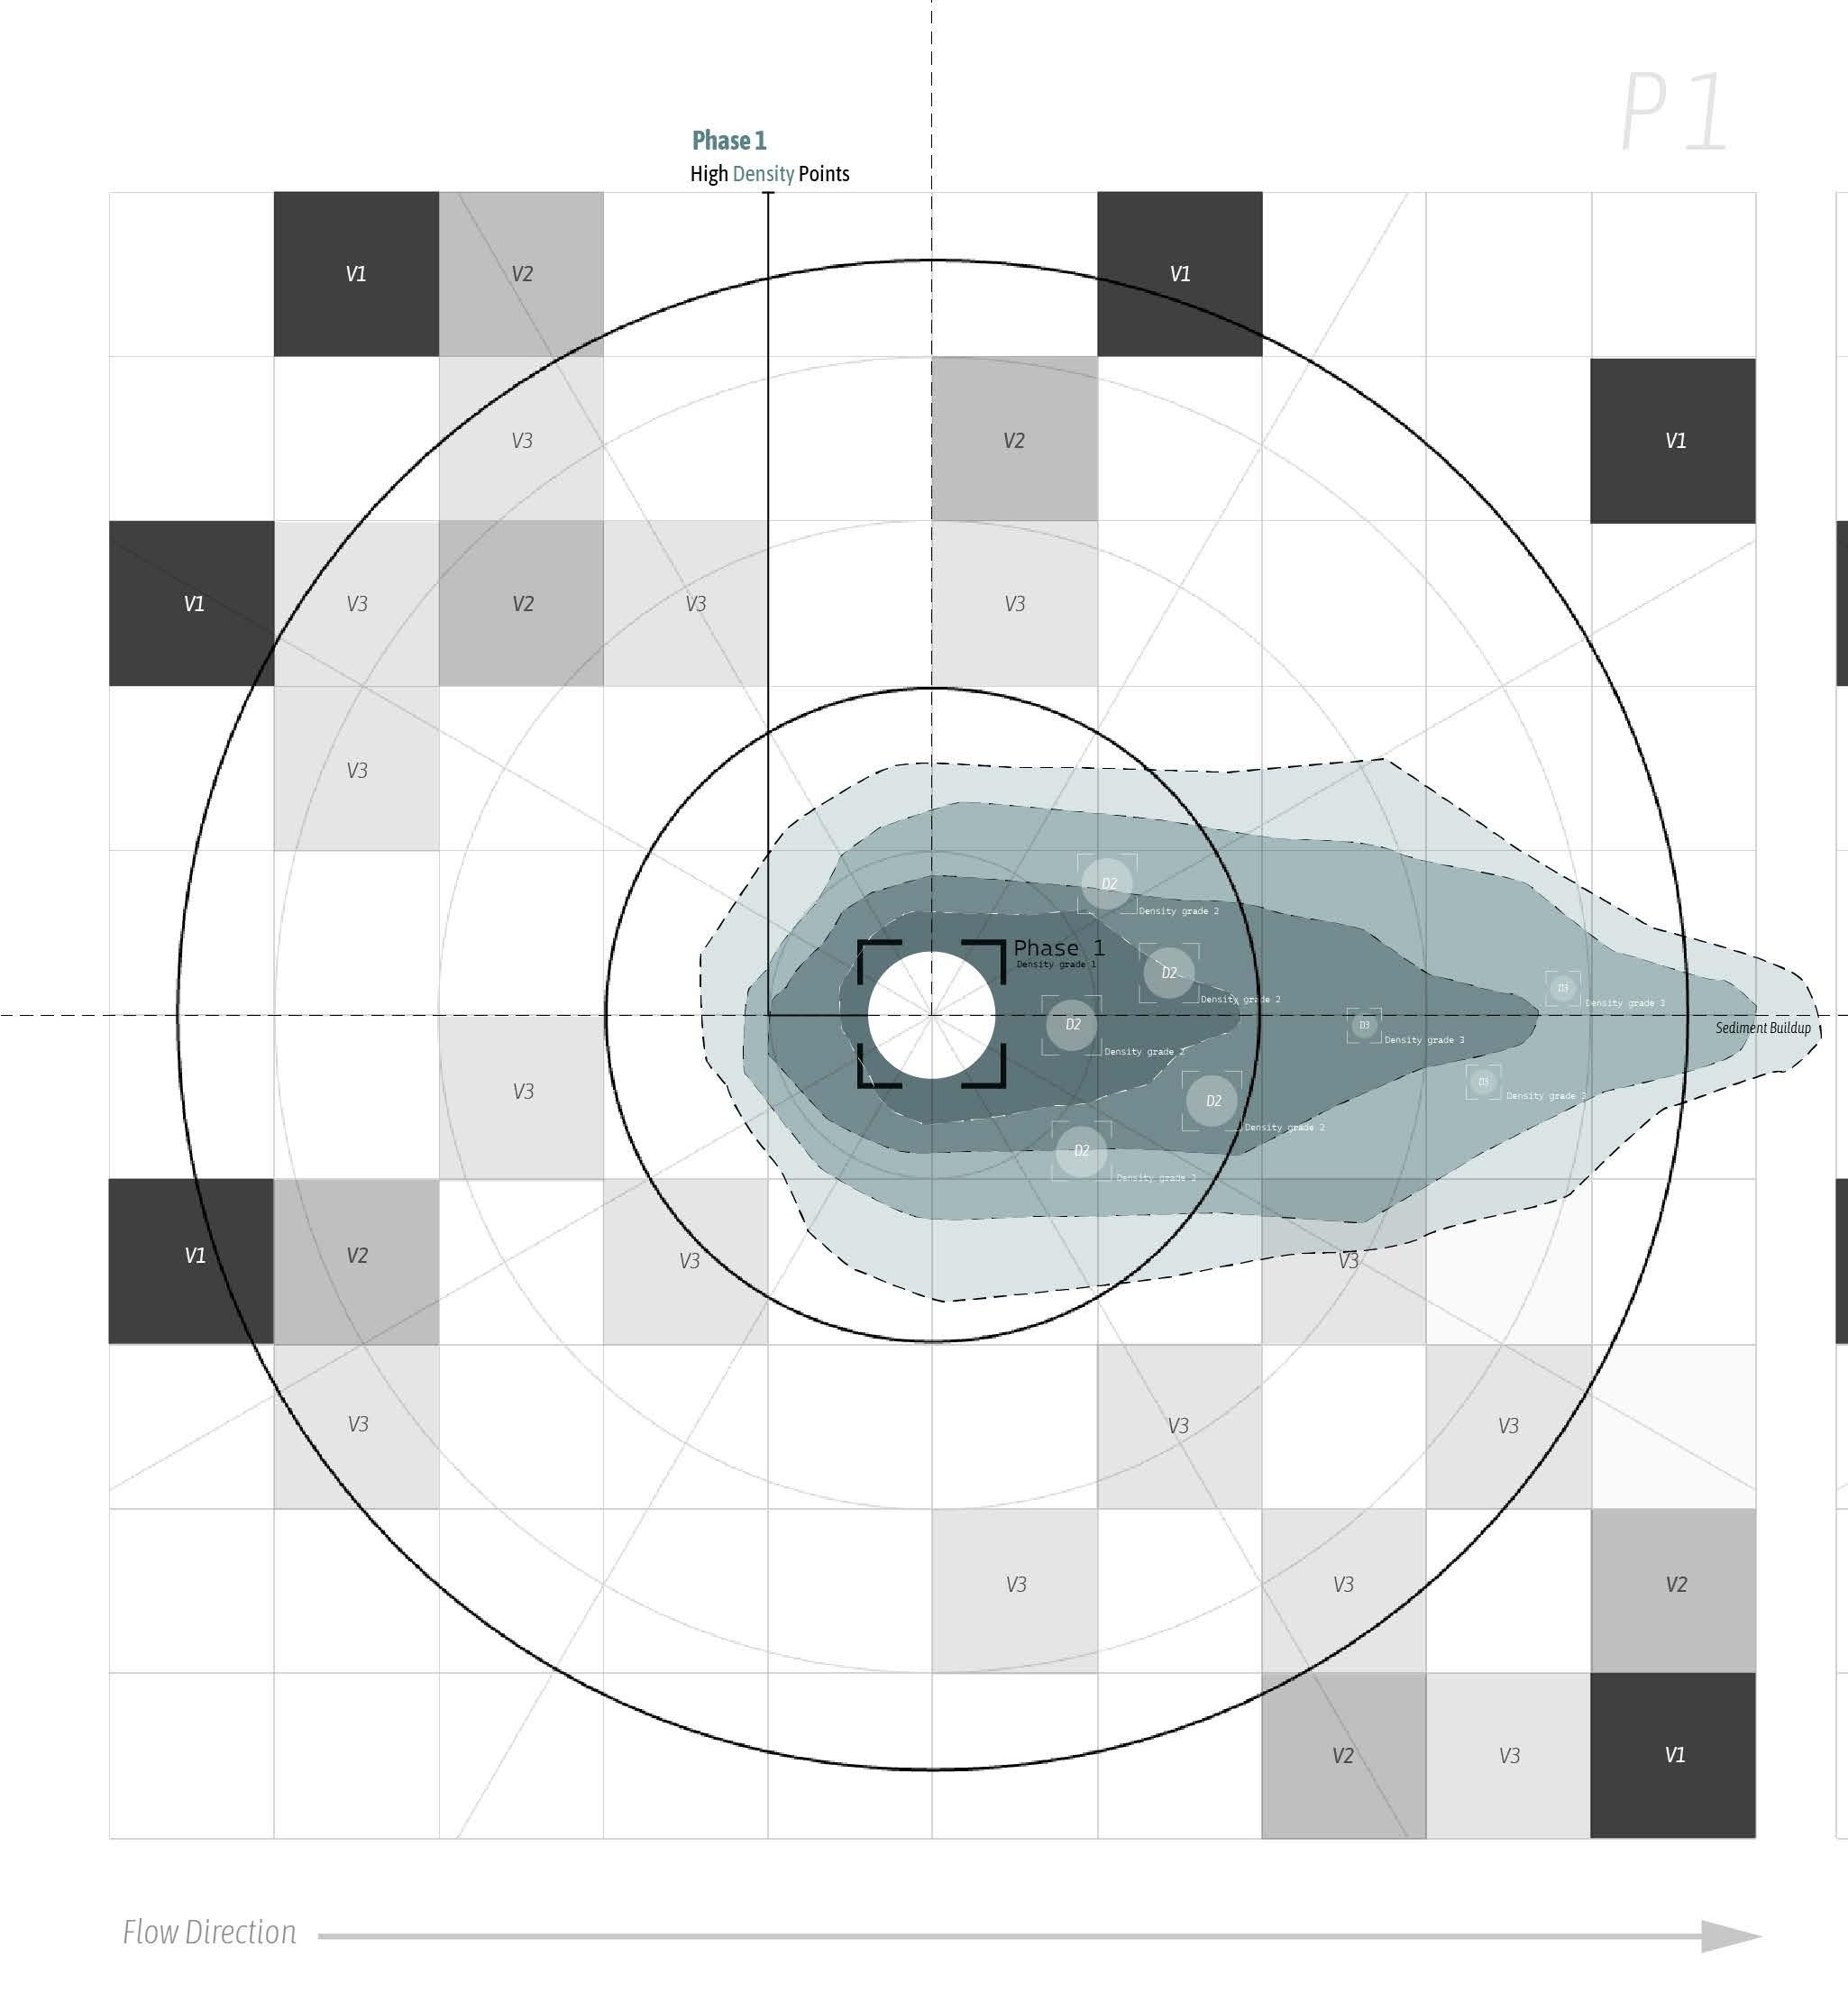
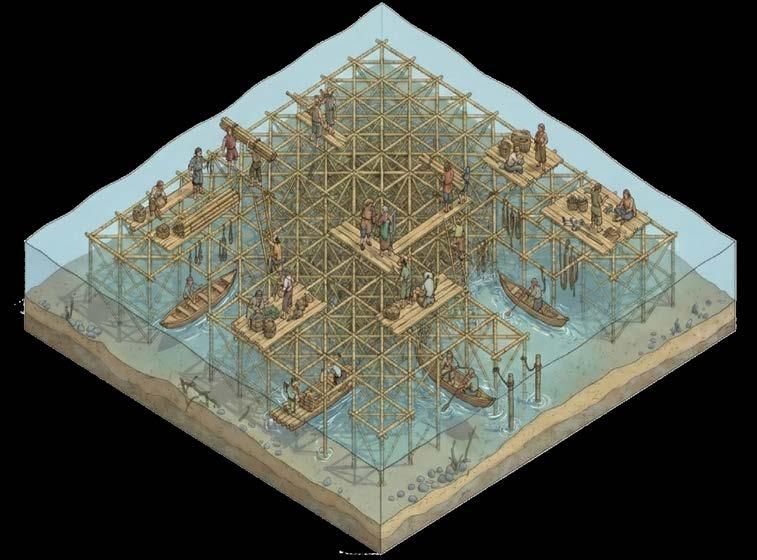
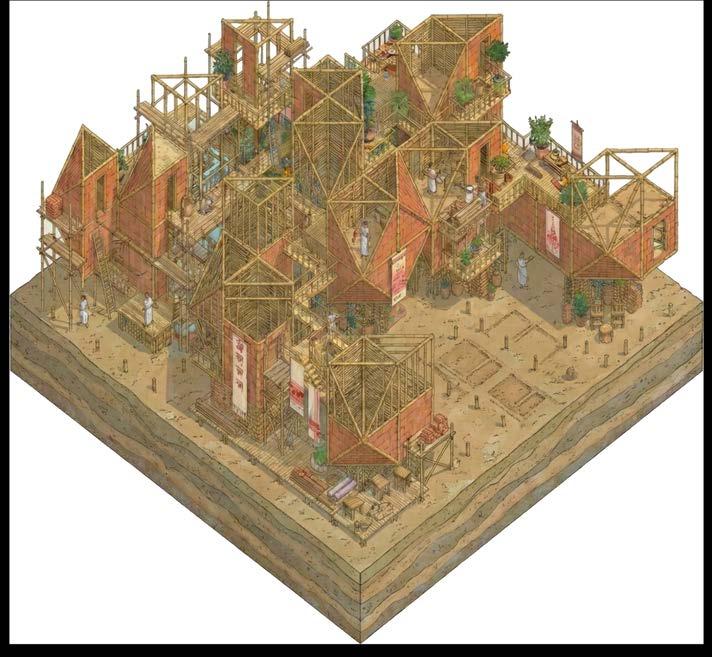
Phase 1: Proto-ground Formation (Years 0–3)
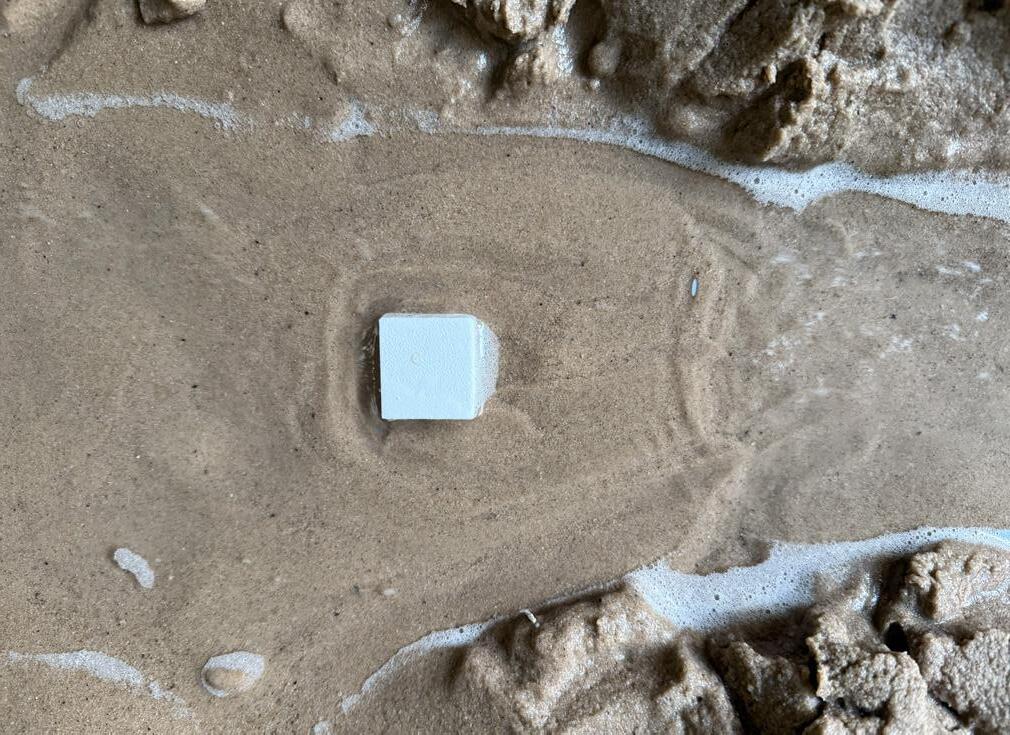
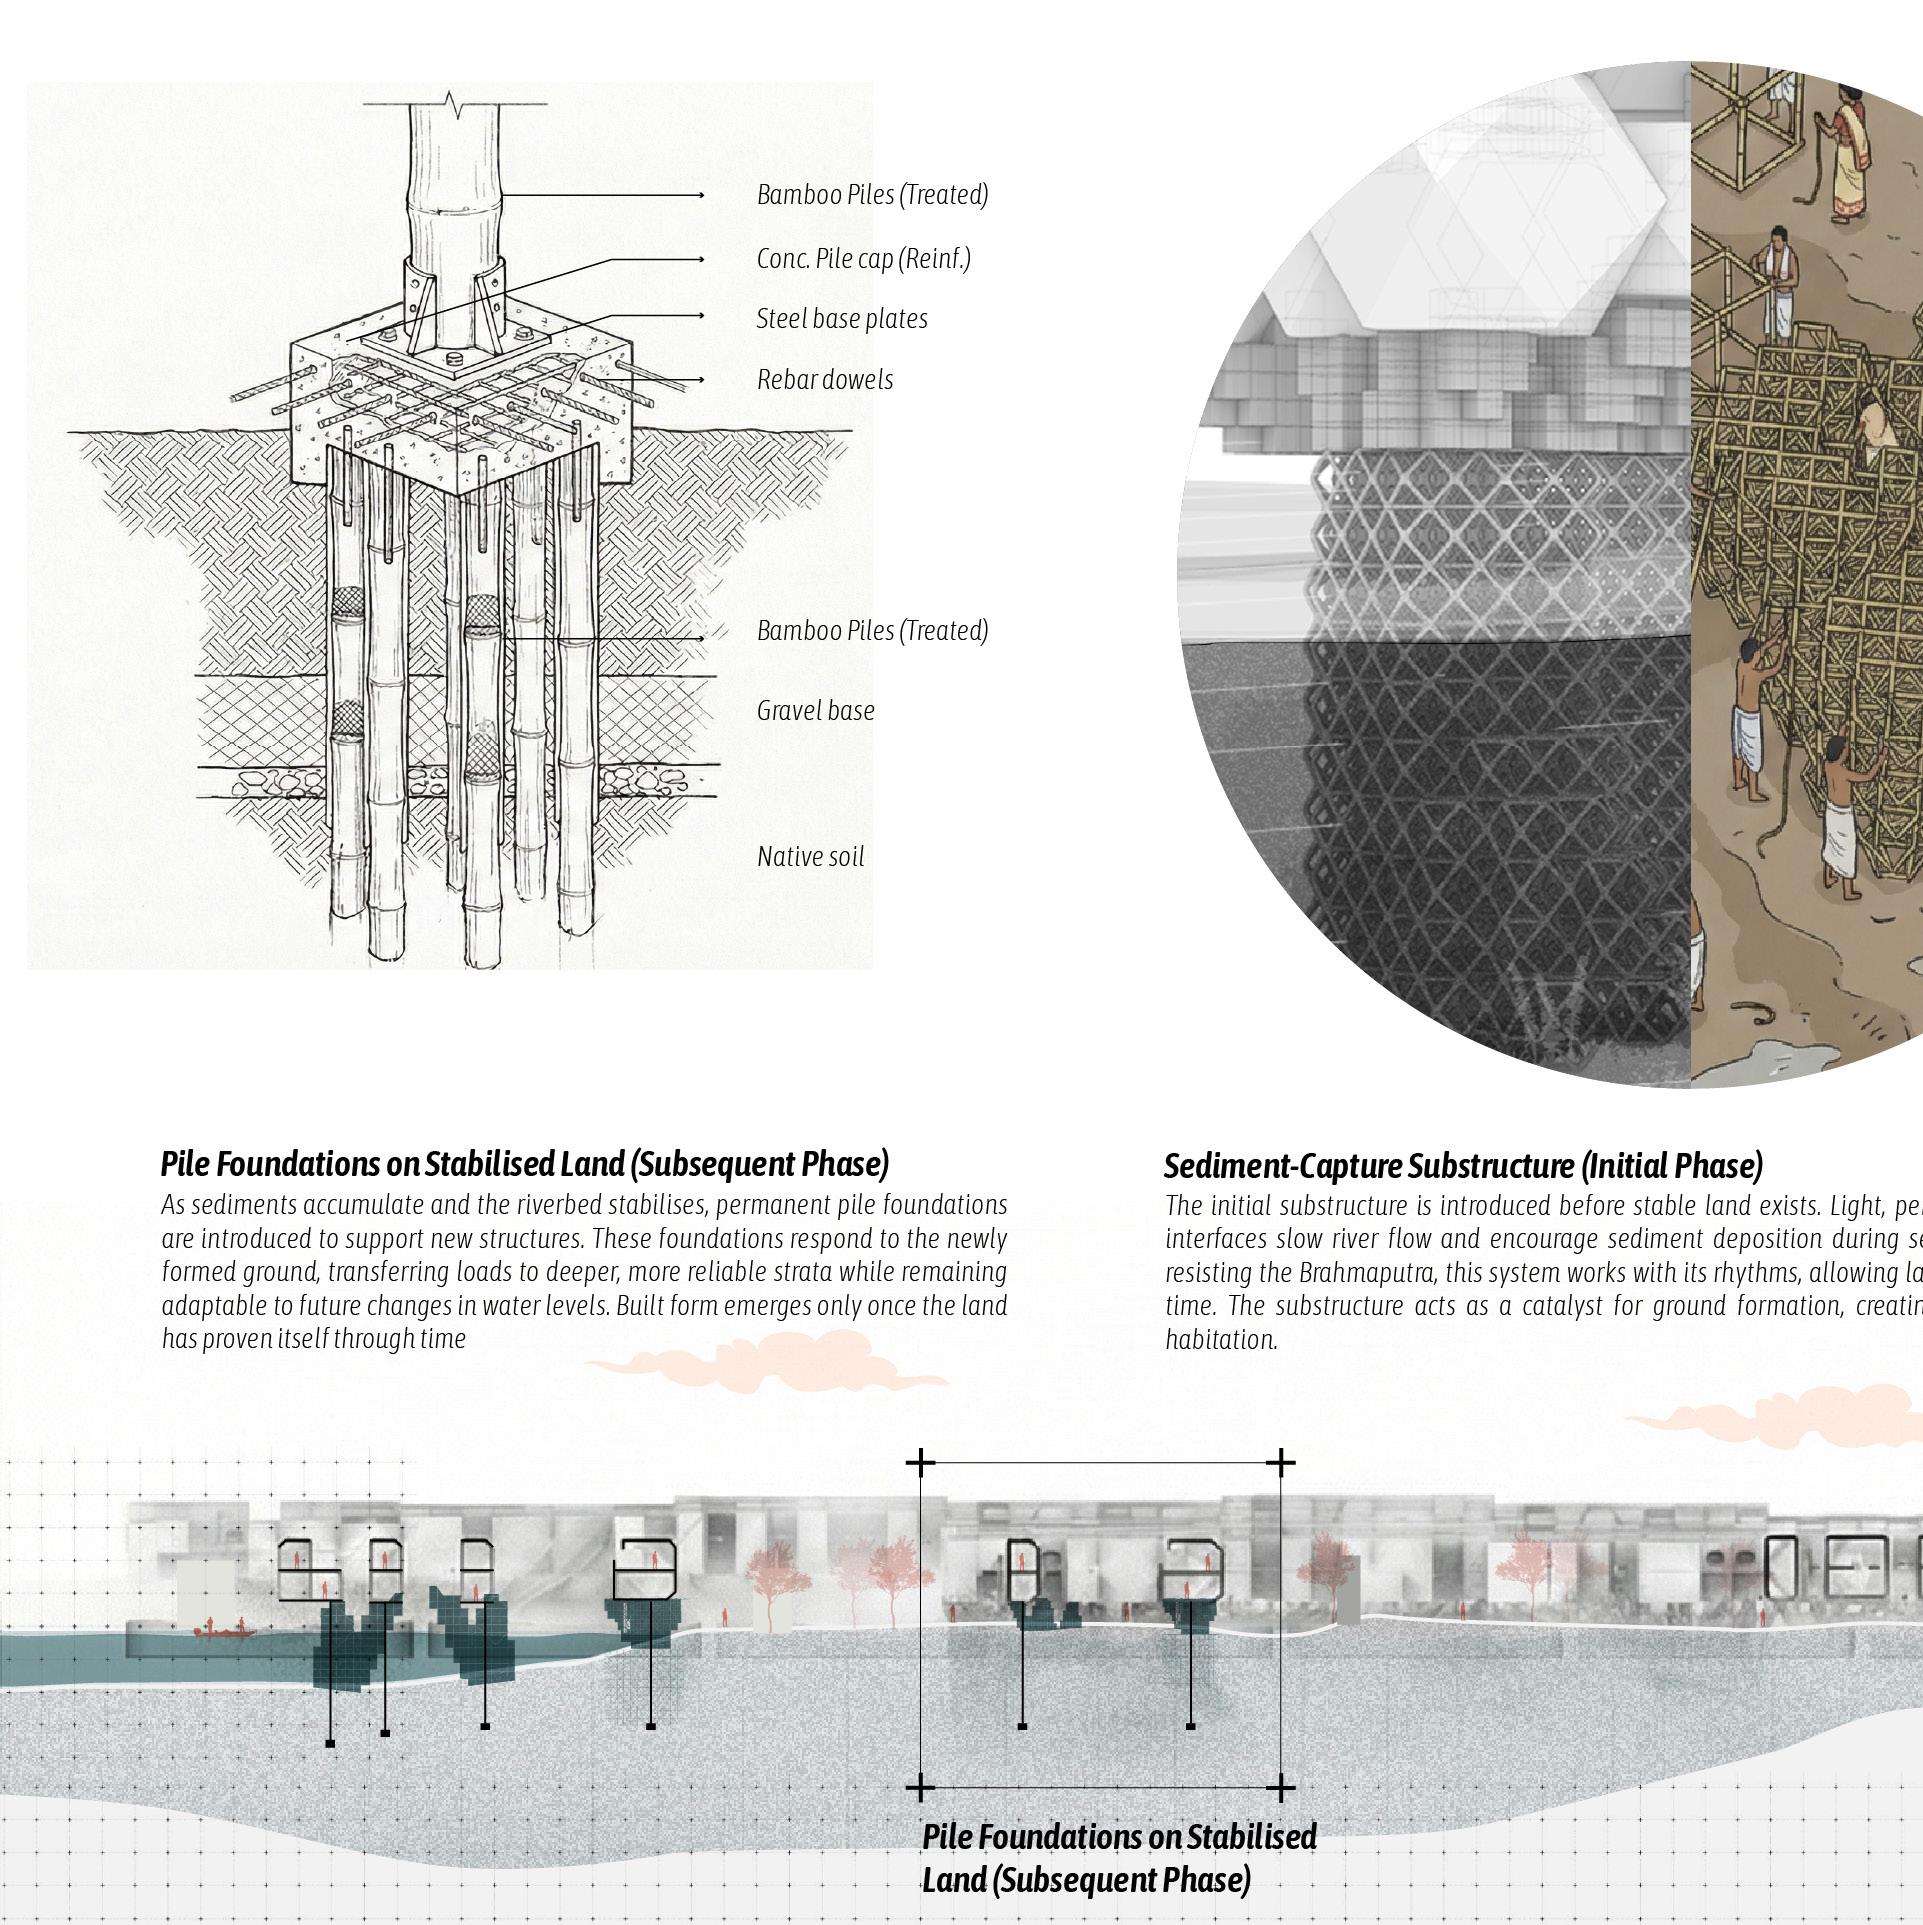
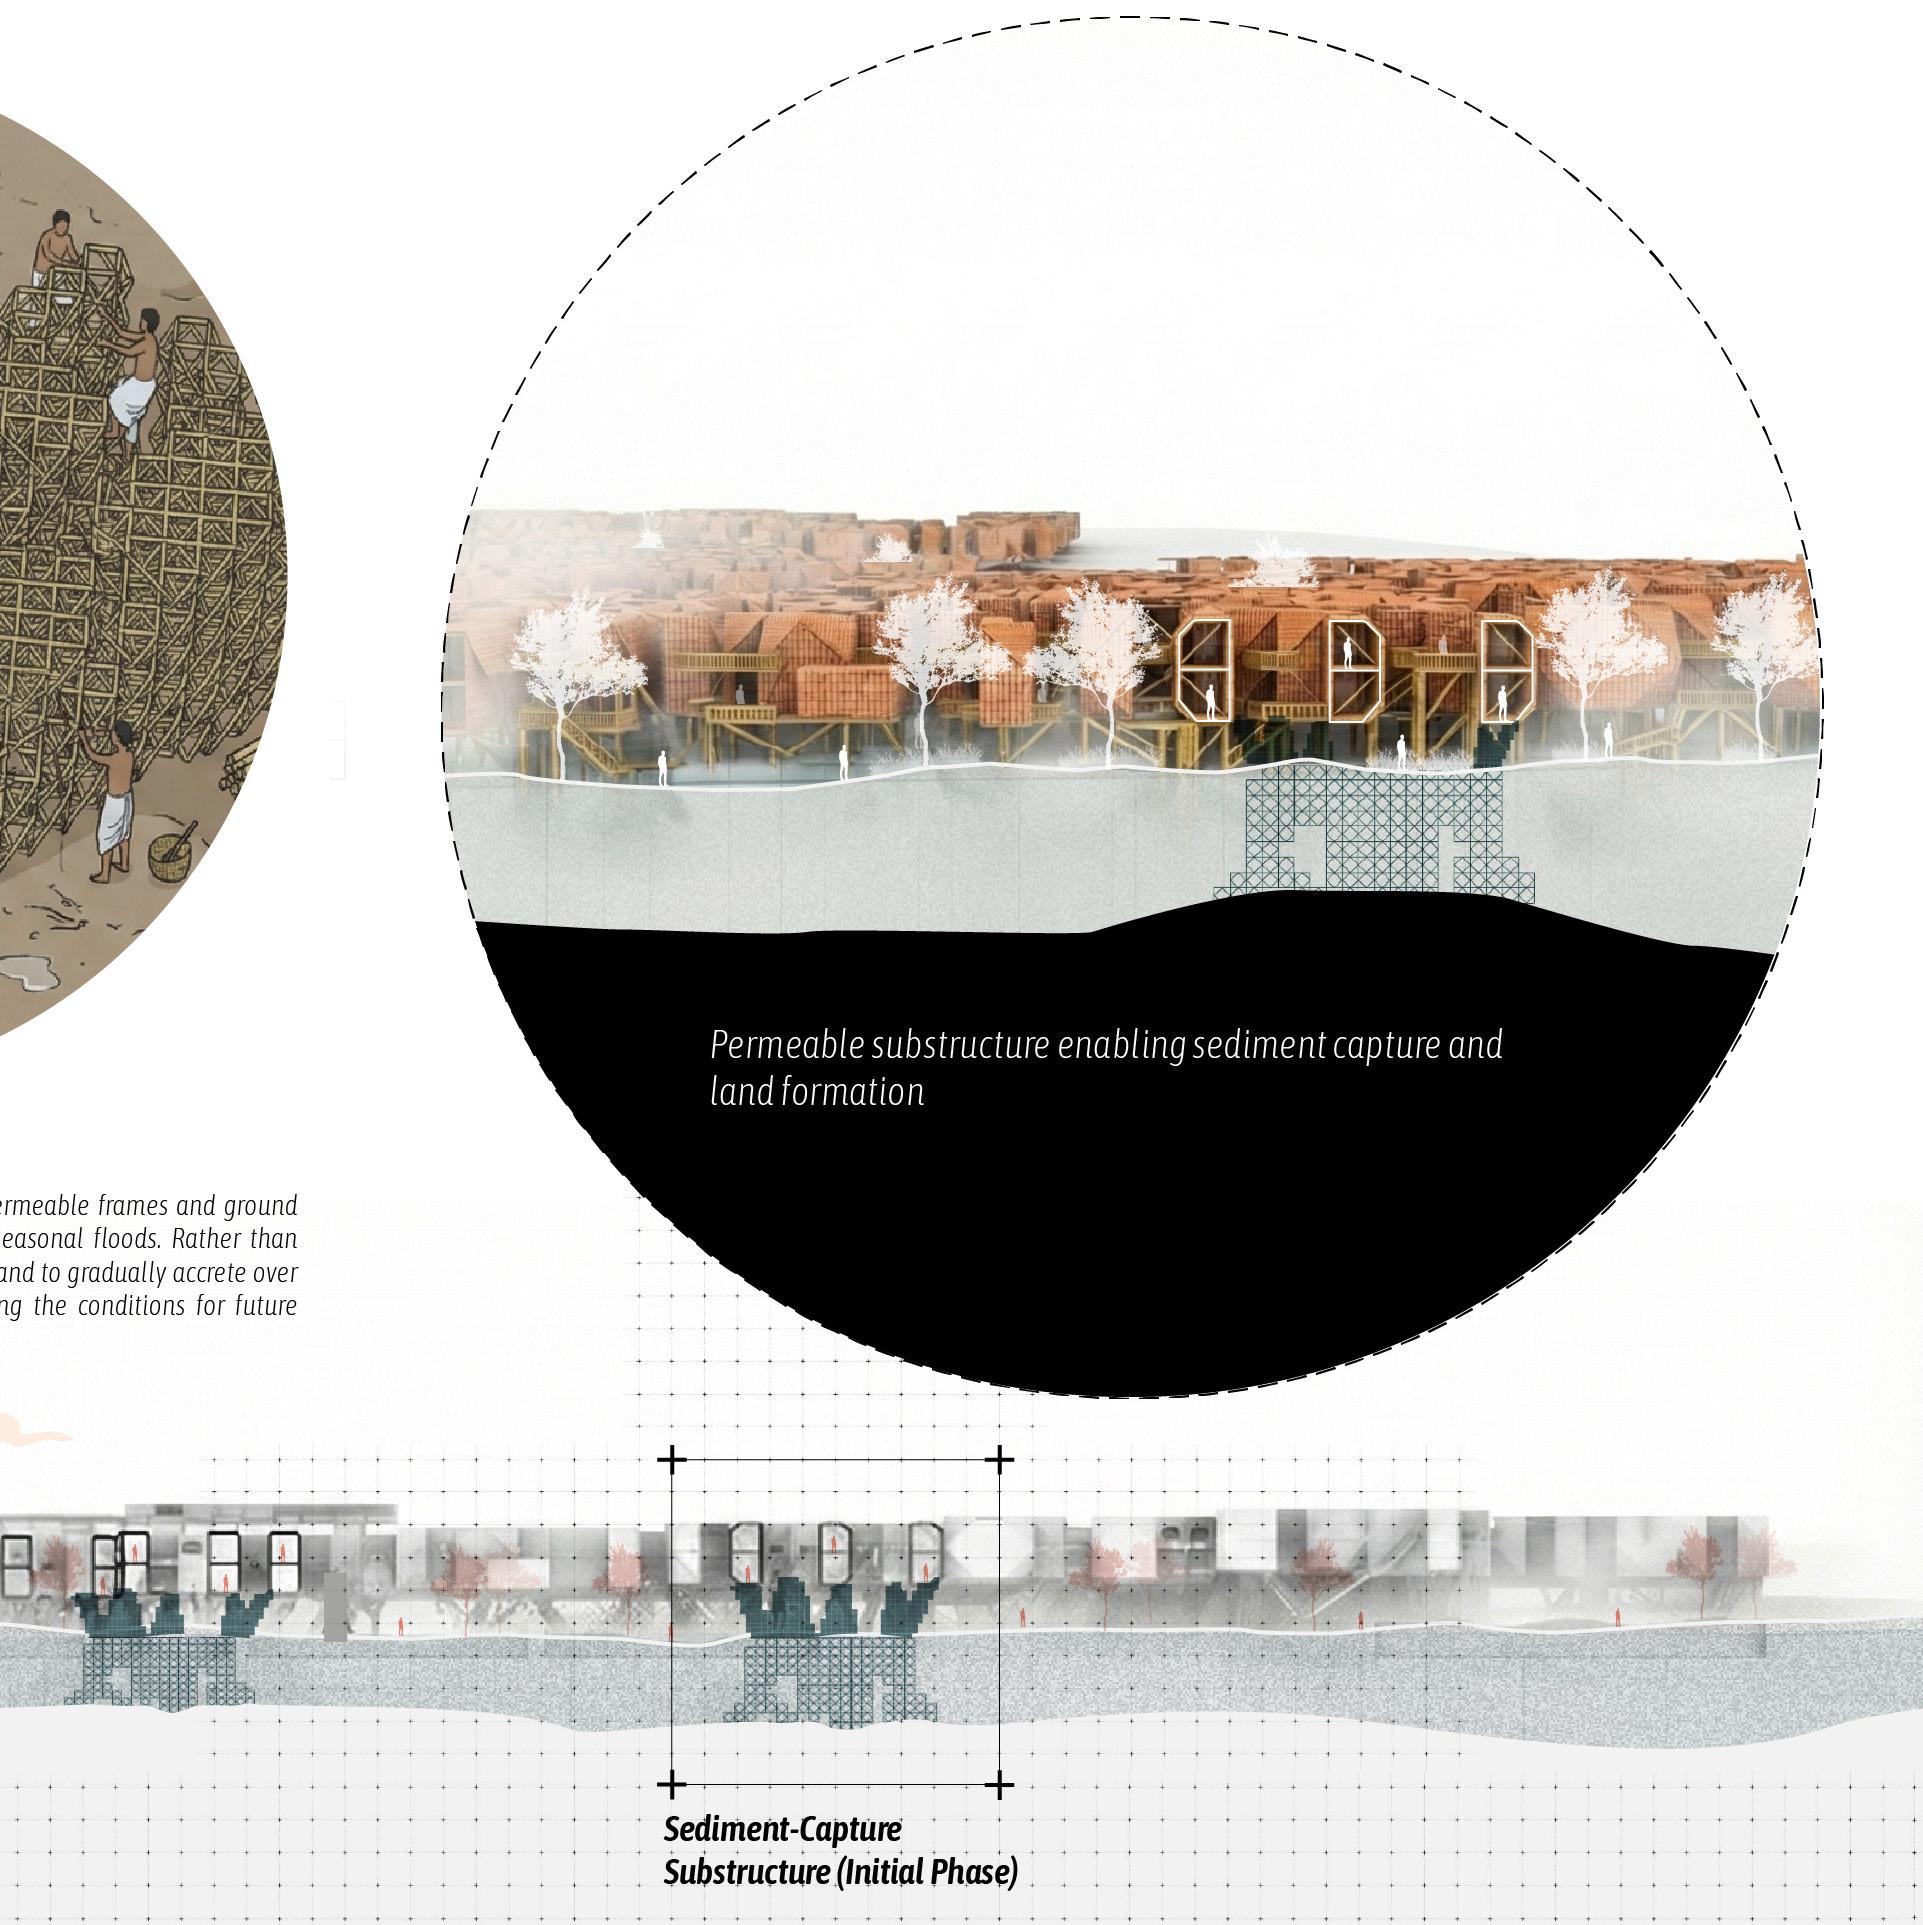
The site remains largely aquatic. Lightweight substructures are introduced within low-velocity zones to interrupt flow and initiate sediment capture. These elements function as sediment traps rather than habitable architecture, allowing silt to accumulate gradually. The ground remains unstable and is repeatedly reworked during monsoon cycles. Human interaction is limited and seasonal, and architecture is designed to withstand submersion and displacement rather than resist them.
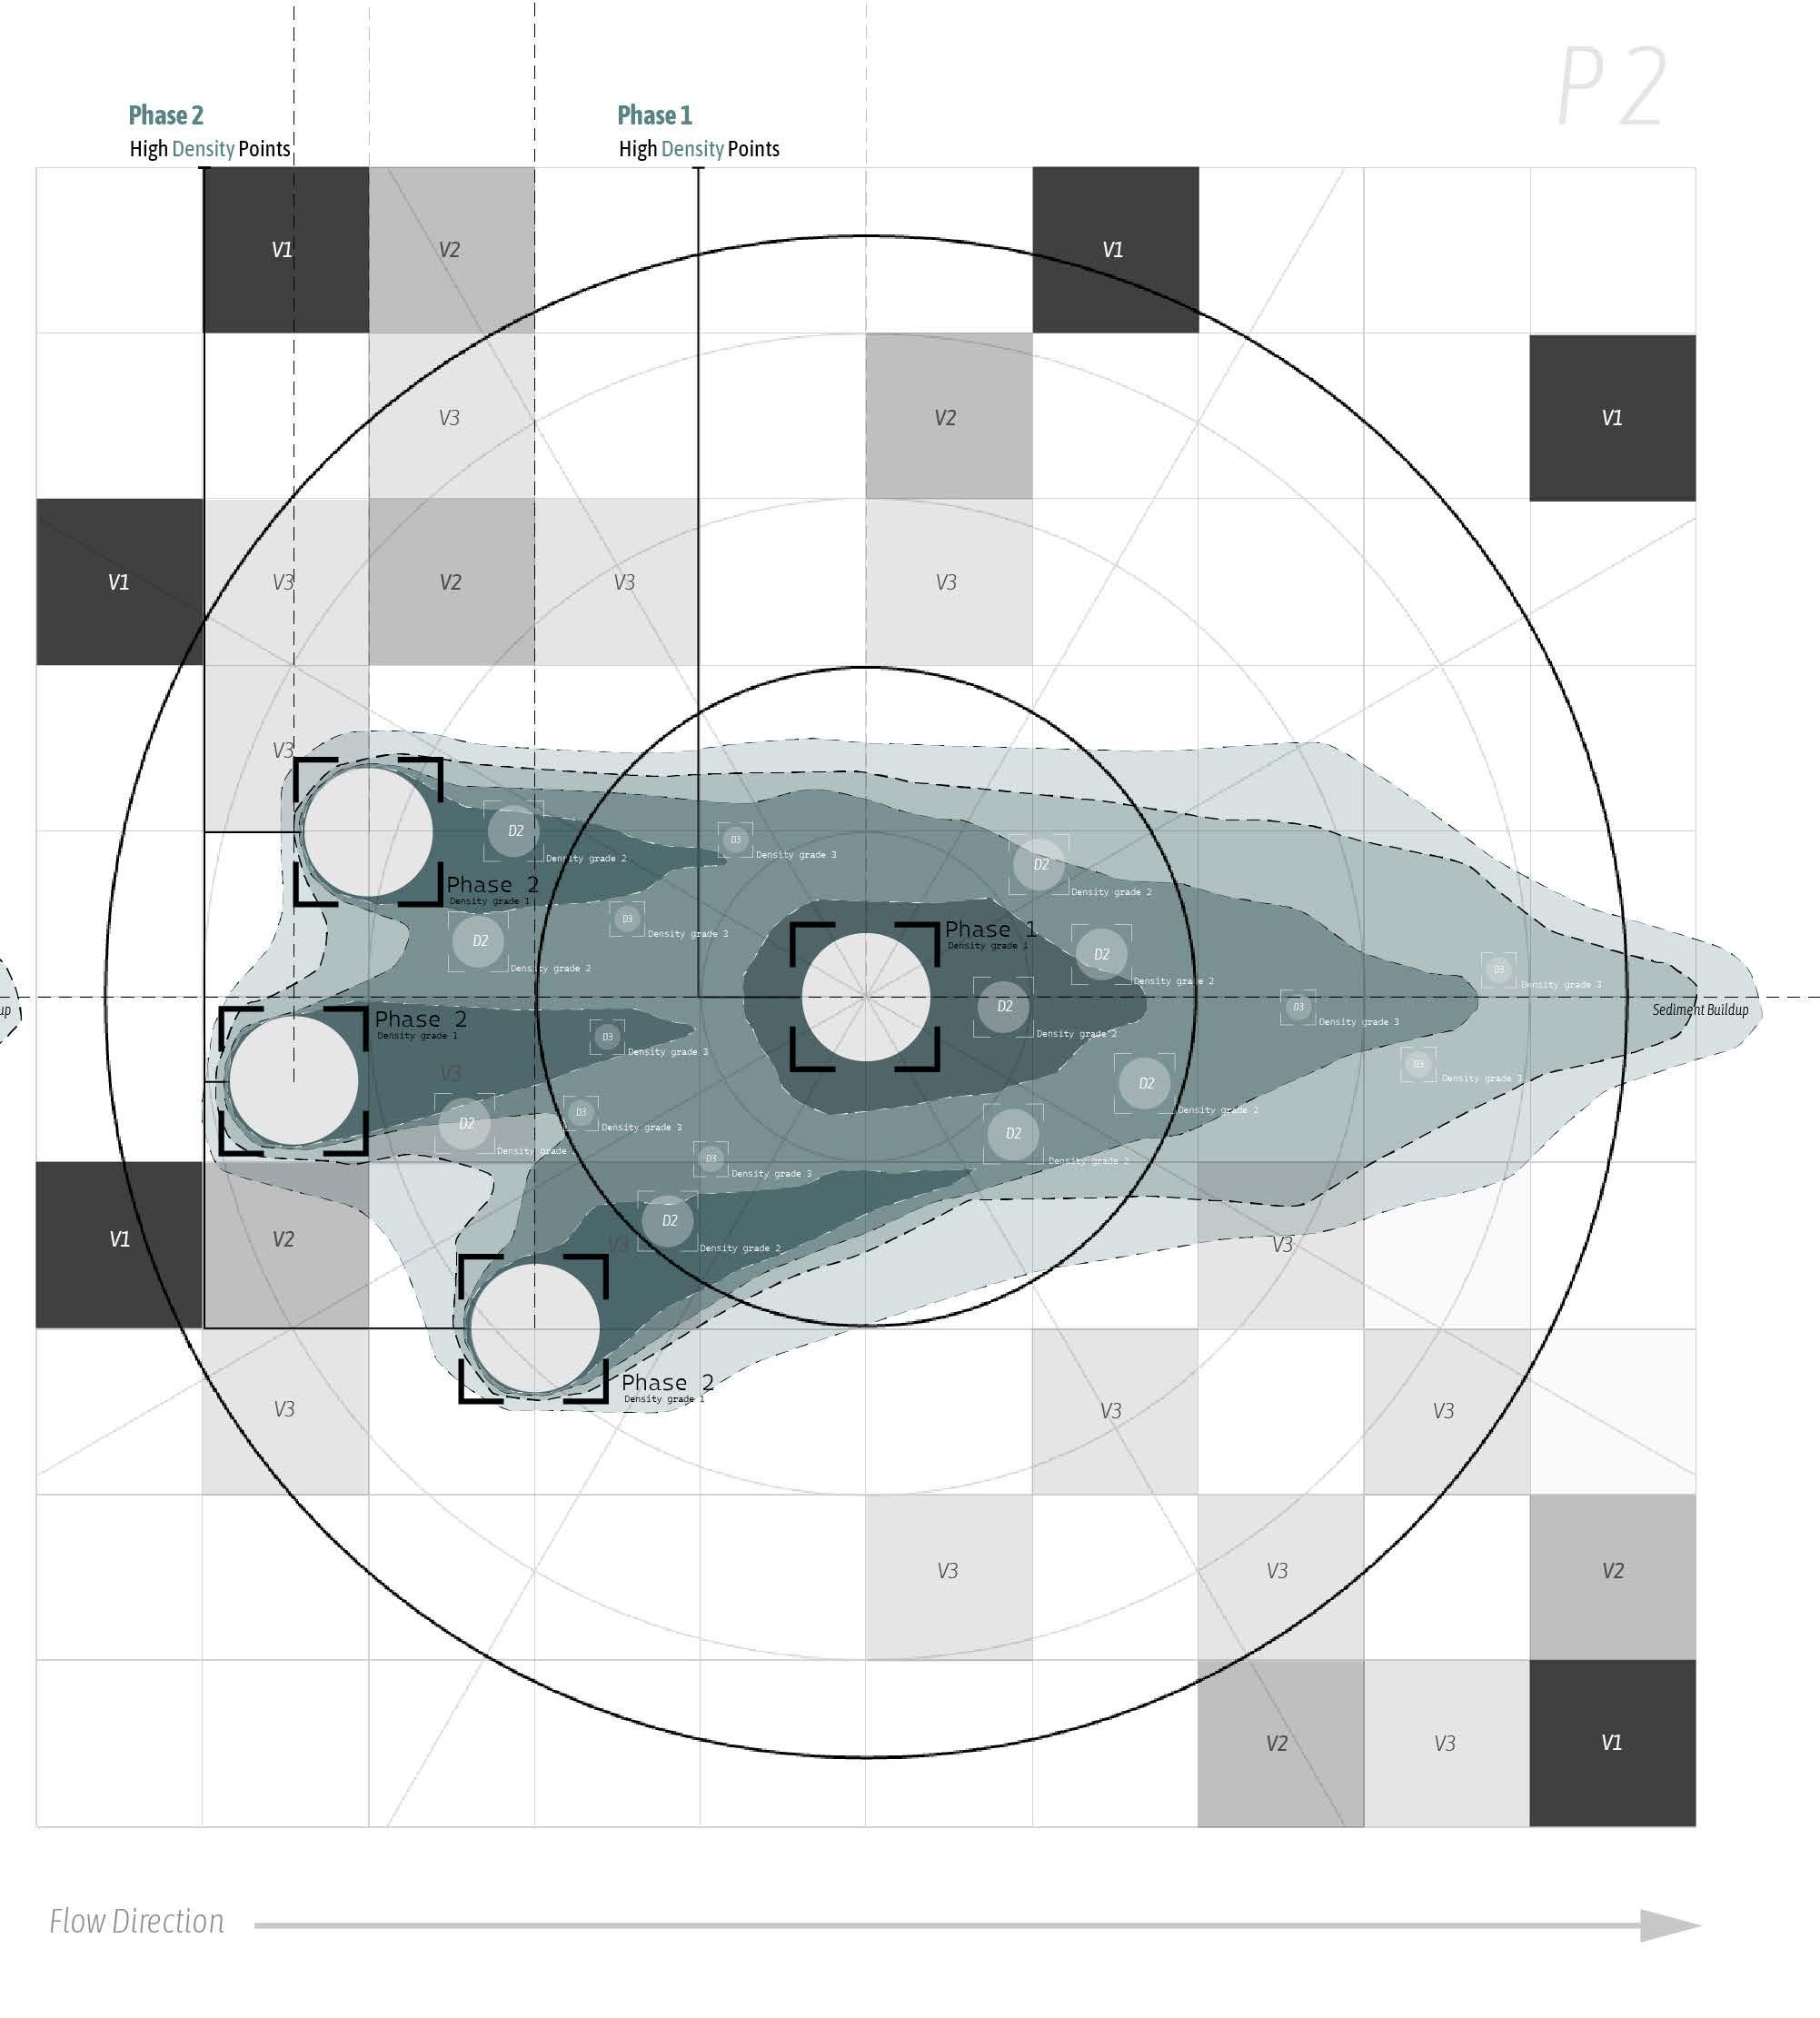
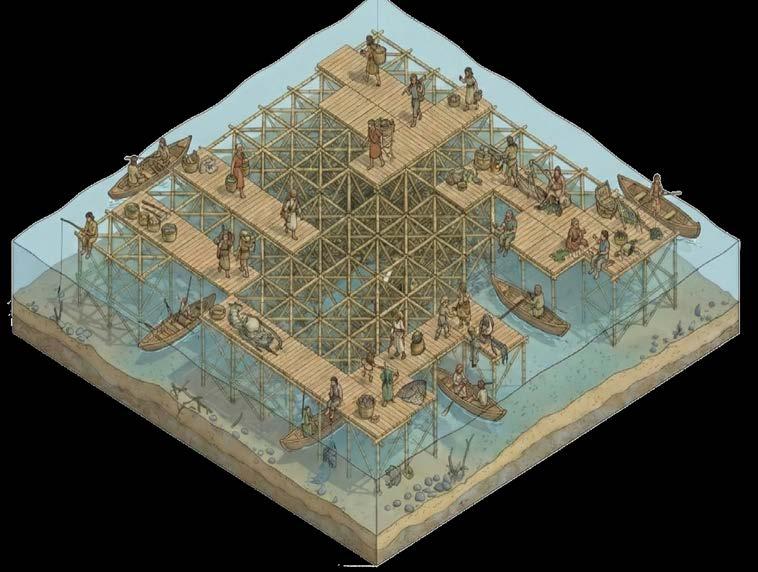
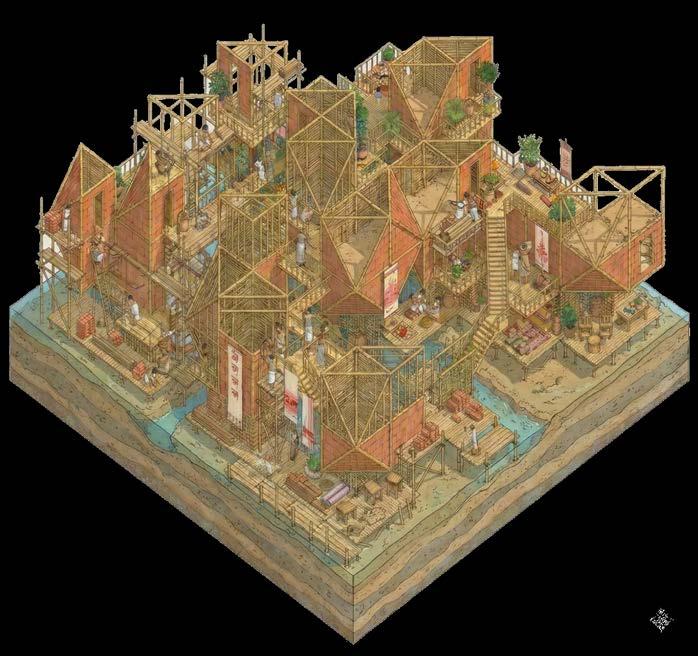
Phase 2: Transitional Stabilization (Years 3–7)
As sediment depth increases, the ground begins to intermittently support human weight. This marks a transitional condition in which land is neither fully fluid nor fully stable. Community-driven processes such as filling, edging, and reinforcing sediment patches occur seasonally, gradually consolidating the terrain.
Architecture remains incremental and adaptable, responding to partial flooding and shifting boundaries. Temporality during this phase is cyclical, shaped by alternating periods of erosion and consolidation.
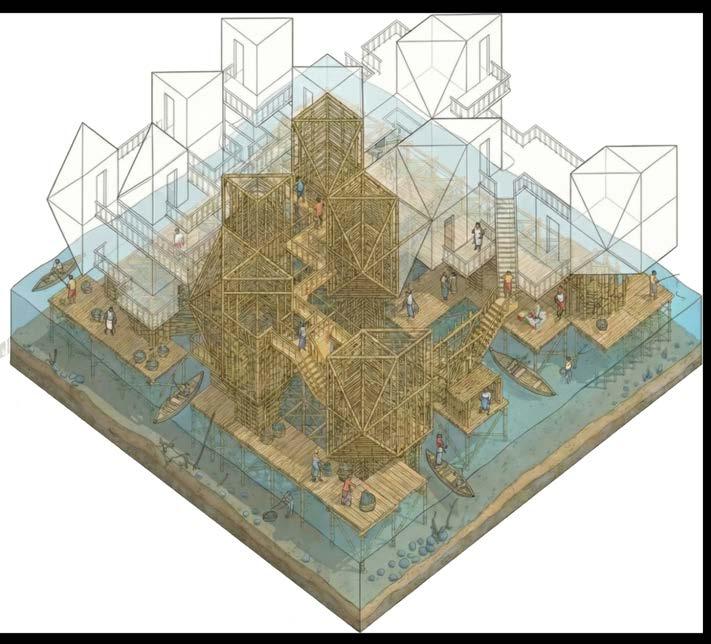
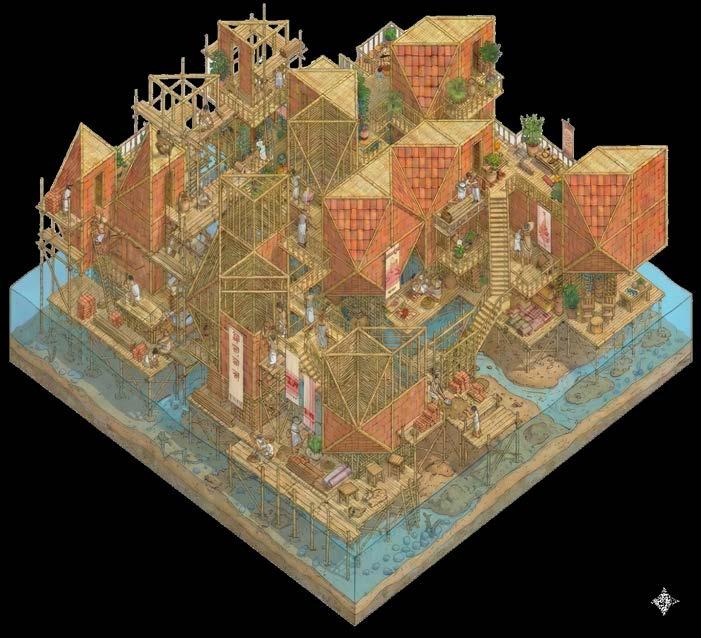
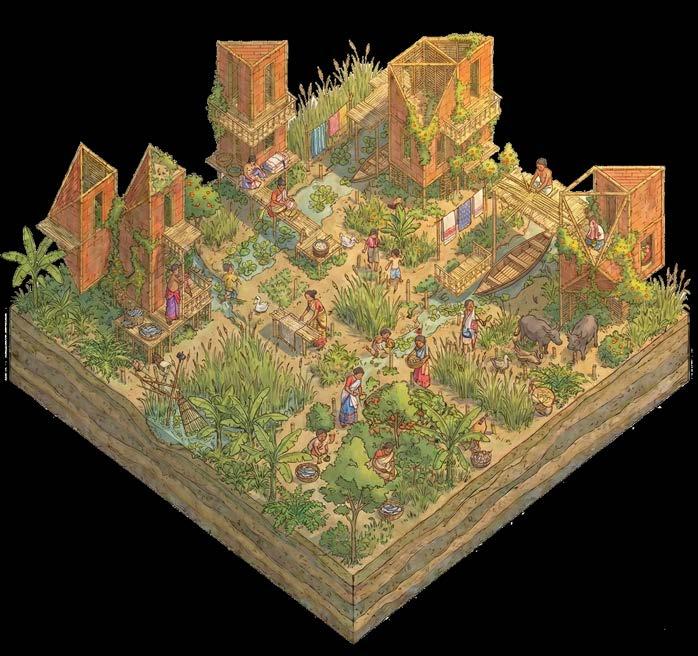
Phase 3: Consolidation and Integration (Years 7–11)
With continued sediment accumulation and vegetative anchoring, the terrain stabilizes sufficiently to support long-term occupation. A small-scale hydrological management system is introduced to regulate flow paths and sediment distribution. Architecture and landscape begin to merge, allowing permanent programs such as housing, cultural spaces, markets, and agriculture to take root. Time shifts from cyclical adaptation toward gradual consolidation.
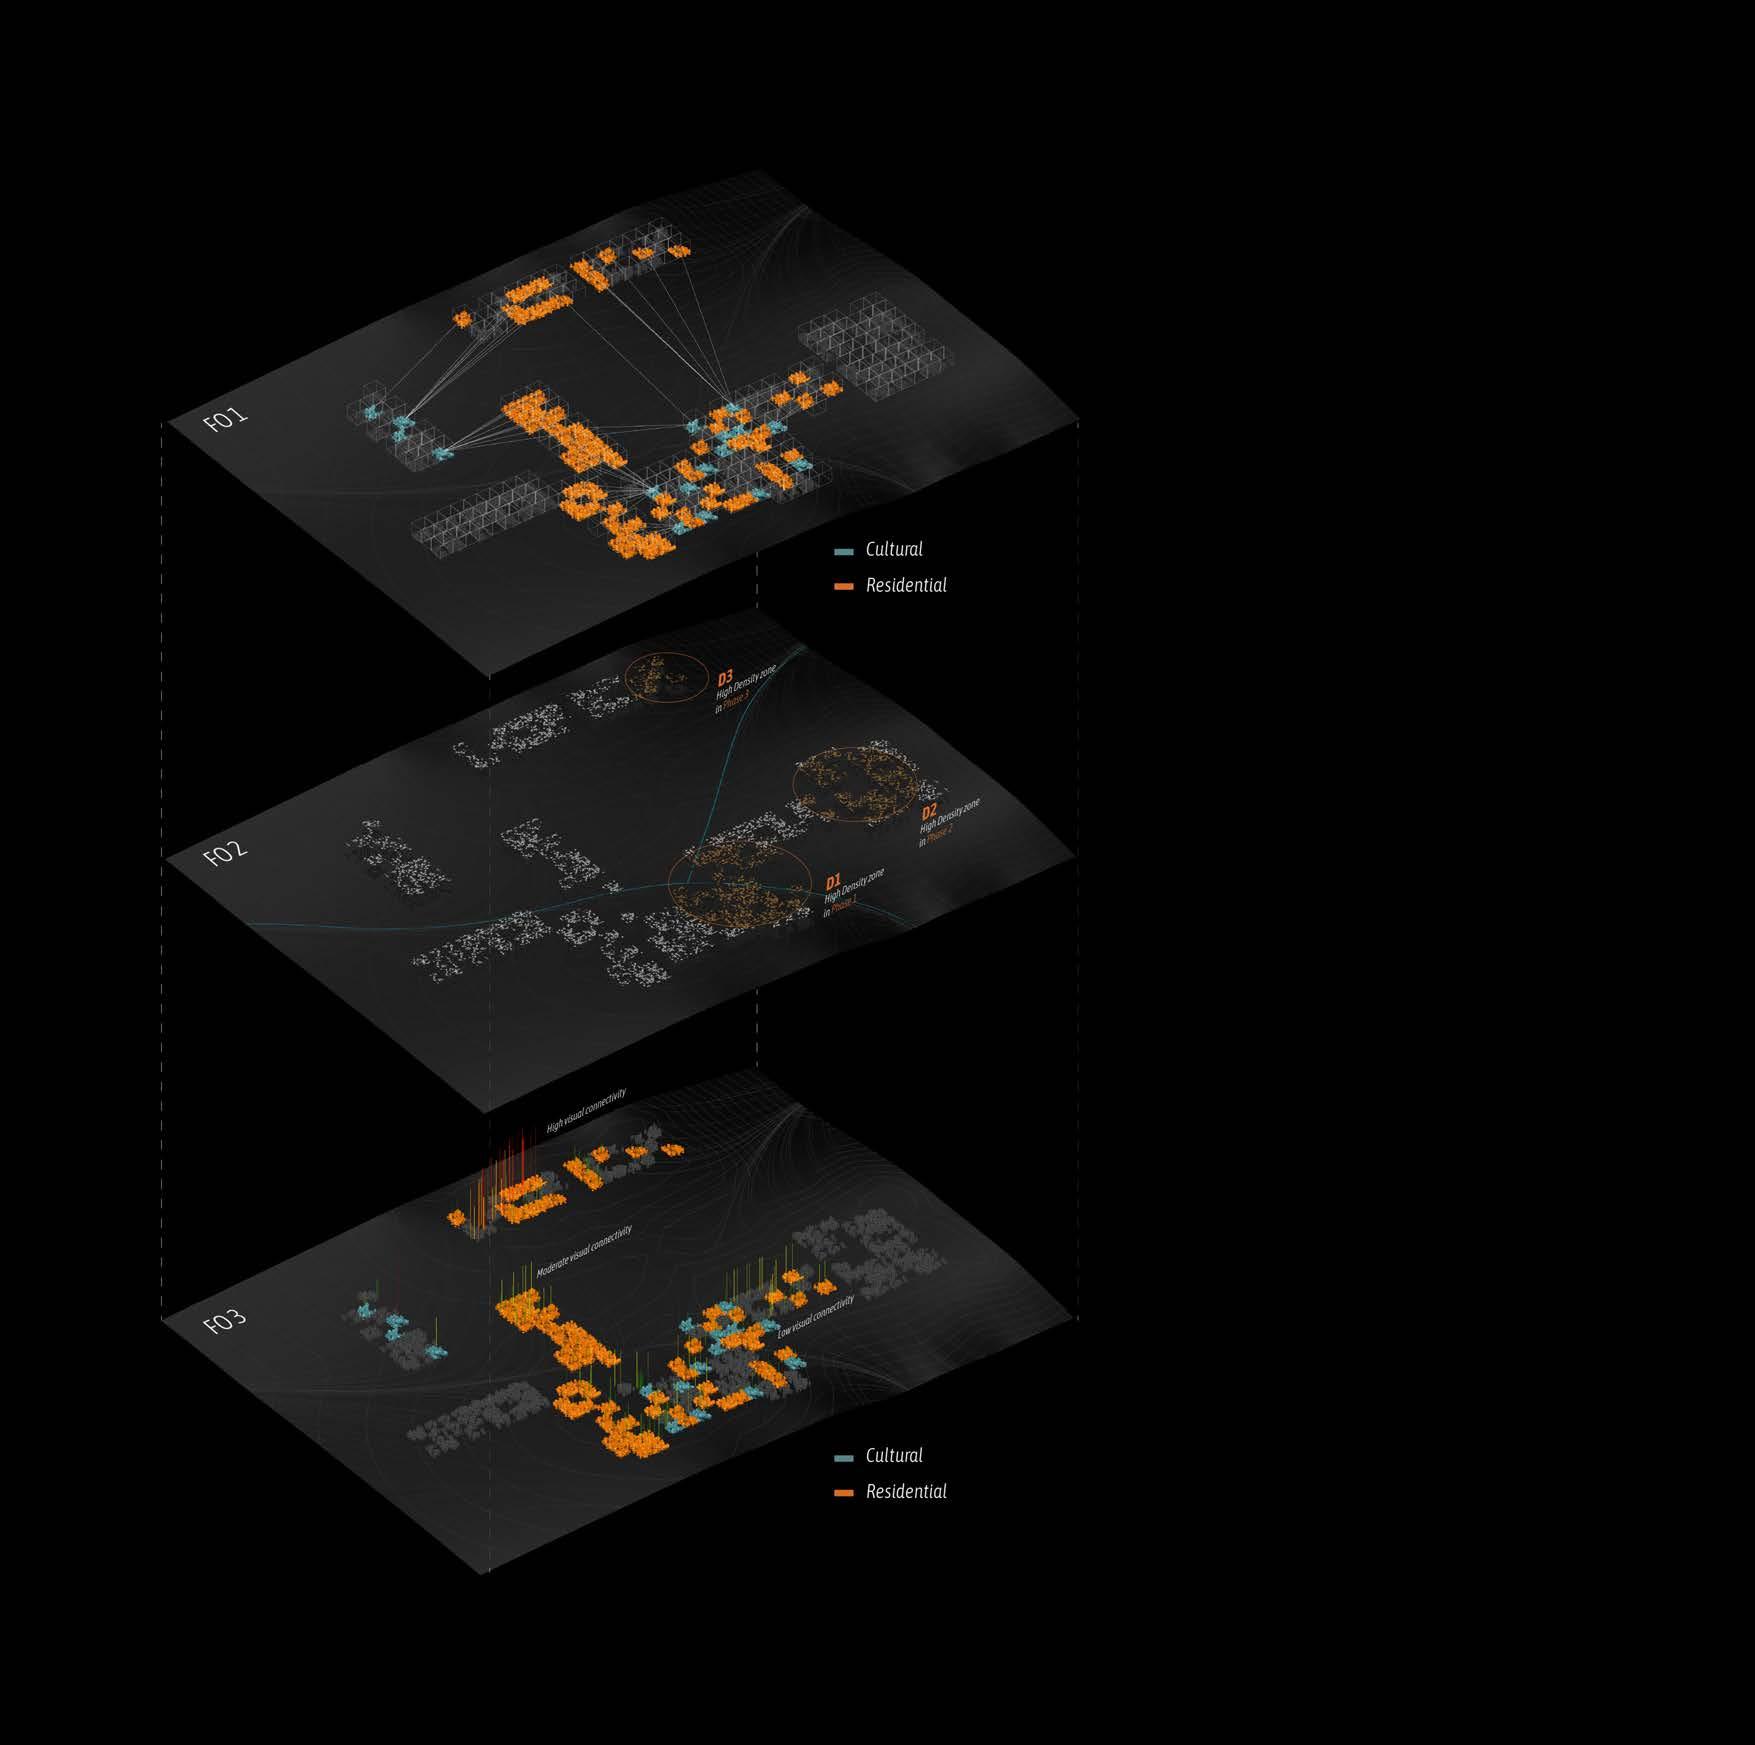
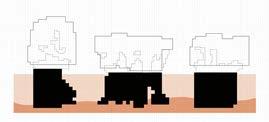
The final spatial configuration is not an endpoint but a record of its own formation. Patterns of density, clustering, circulation, and program distribution observed in later stages encode the environmental and spatial logic that produced them. These patterns can be read retroactively to inform the initial placement, density, and typology of early substructures, allowing future conditions to guide early design decisions.
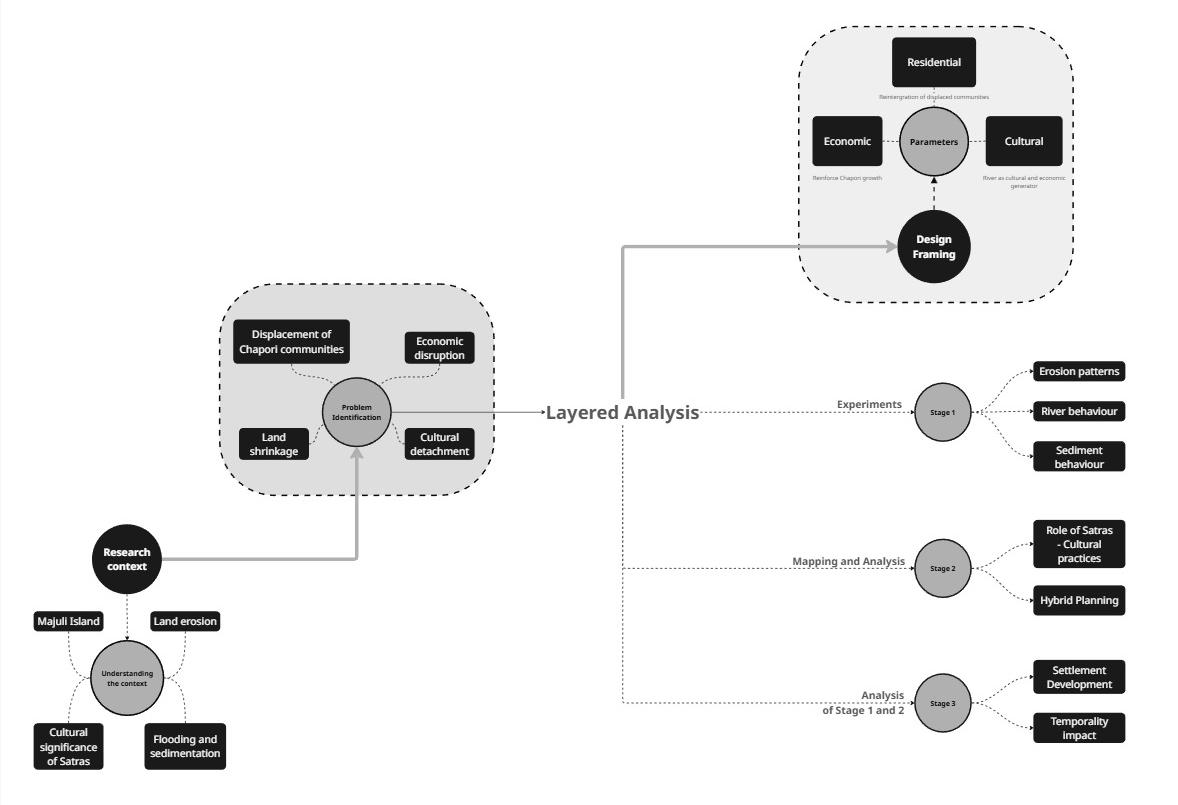
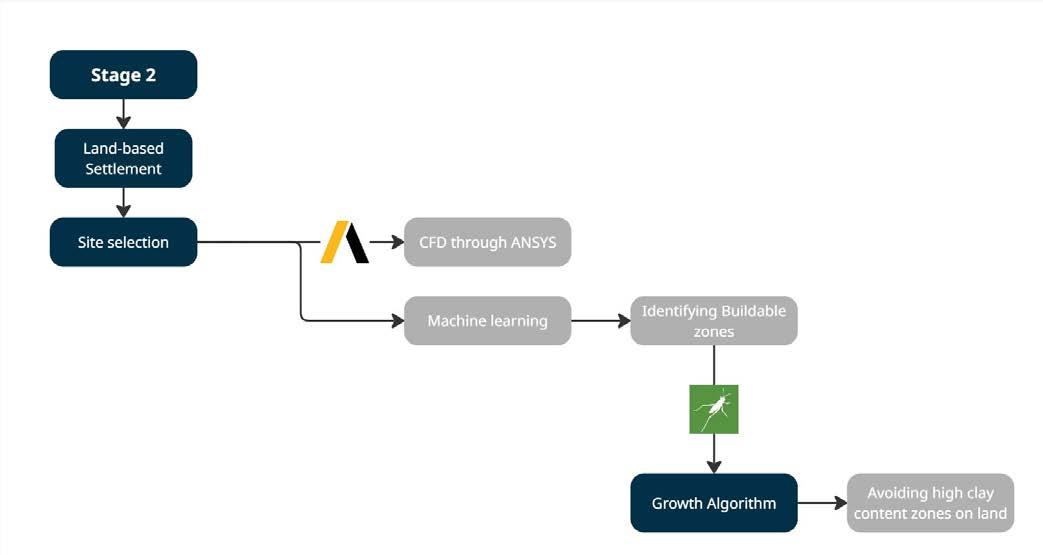
Program Identification
The project is based on Majuli Island’s natural and cultural background, where land and livelihoods are constantly changing due to erosion, flooding, and sedimentation caused by the Brahmaputra. Rapid land loss has caused Chapori villages to be uprooted, upsetting economic systems and eroding deeply ingrained cultural links, especially those connected to the Satras.
A multi-layered analytical framework is used to comprehend these situations. While social mapping concentrates on settlement buildings, hybrid landwater practices, and cultural institutions, environmental studies study
dynamics, river behaviour, and erosion patterns. The integrated research shows how social structures and environmental factors interact throughout time to affect the stability and transformation of settlements.
A multi-layered analytical framework is used to comprehend these situations. While social mapping concentrates on settlement buildings, hybrid landwater practices, and cultural institutions, environmental studies study sediment dynamics, river behaviour, and erosion patterns. The integrated research shows how social structures and environmental factors interact
41
Fig.
: Problem identification, Created by Author
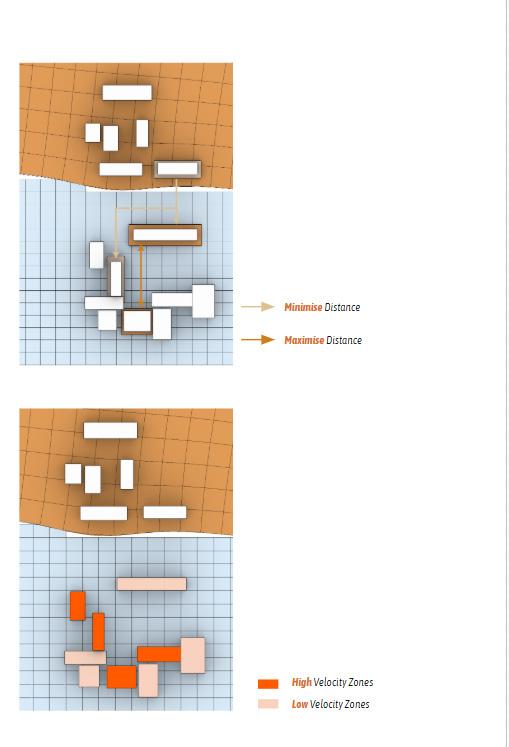
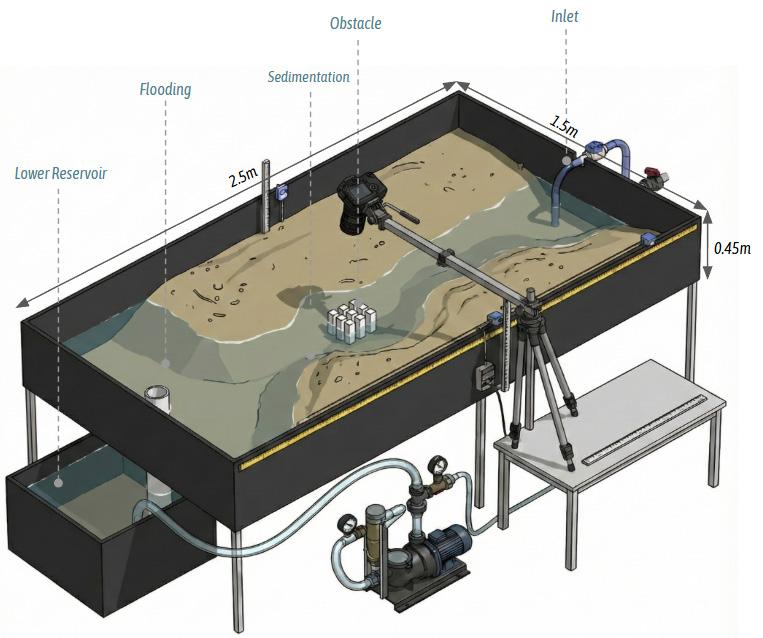
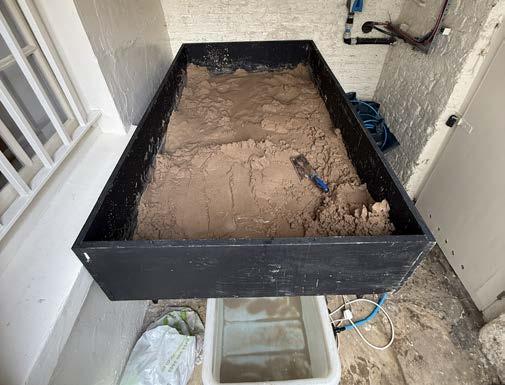
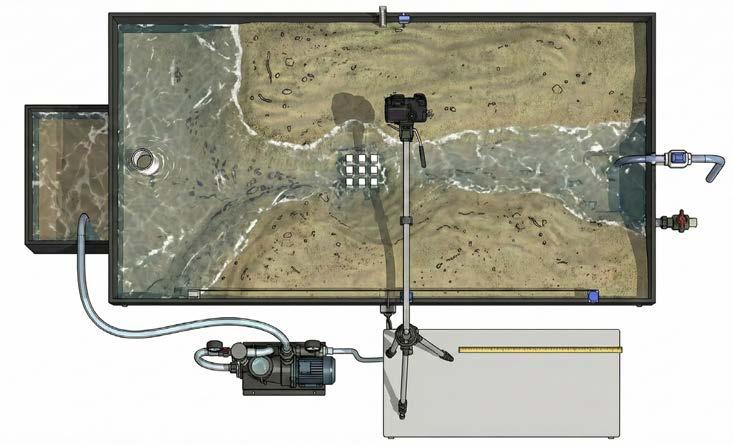
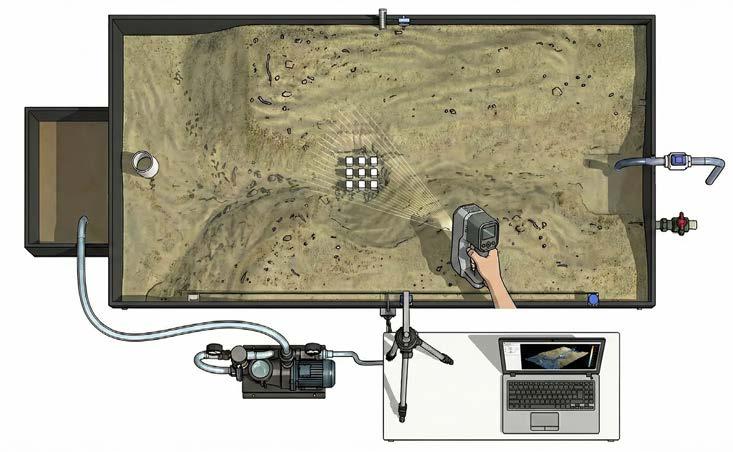
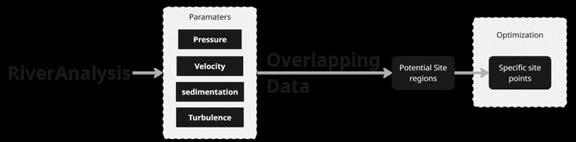
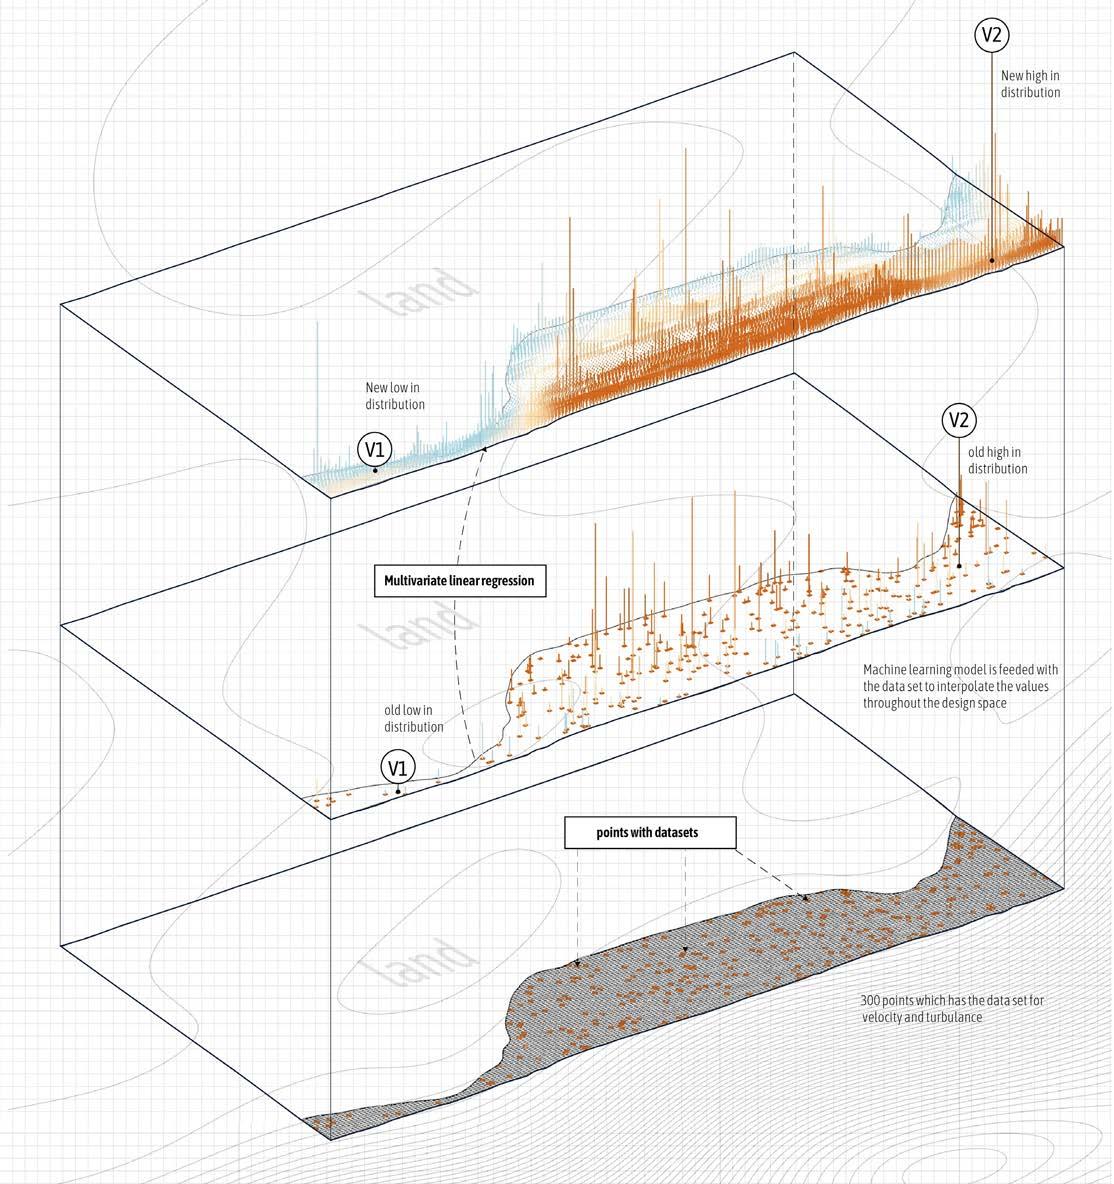
Datascape Experiment Setup
Extracting the principles from the existing settlements in and around Majuli , we have extracted the design principles into measurable performance goals to optimize spatial relationships, minimize travel distances between areas and to analyse environmental factors like the flow and velocity of the river for better building performances . We had developed a rule based system that organises the zones with respect to their adjacency and distances with other spaces , ensuring spatial relationships reflect Majuli’s functional hierarchy and contextual balance. The boundaries were 250m each side for the land based settlement and 450m for the settlement that is placed on the water
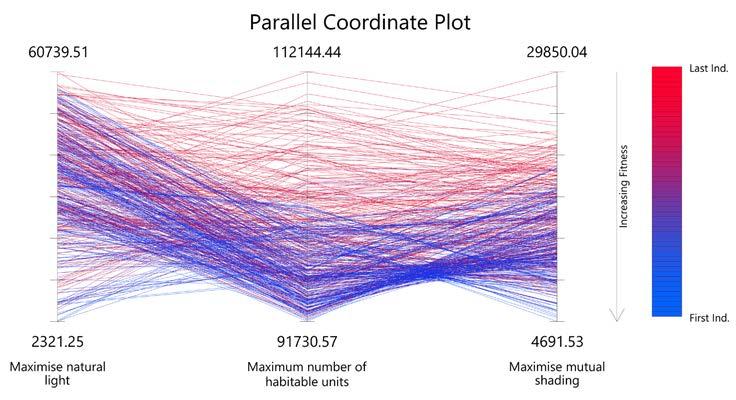
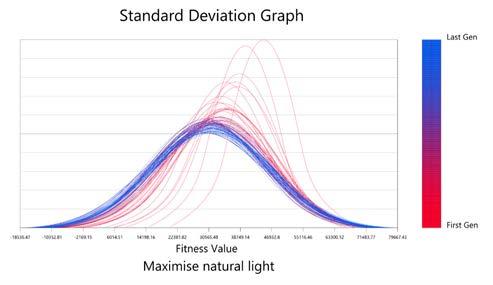
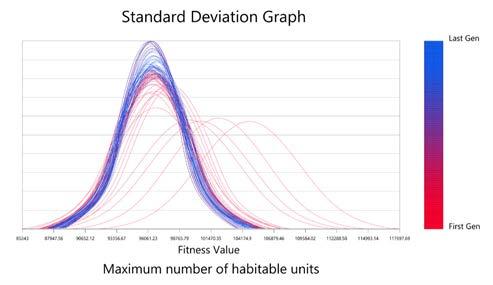
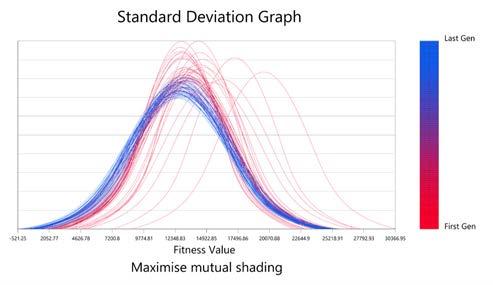
Fig. 42: Performance Goals of MOEA for Datascape , Created by Author
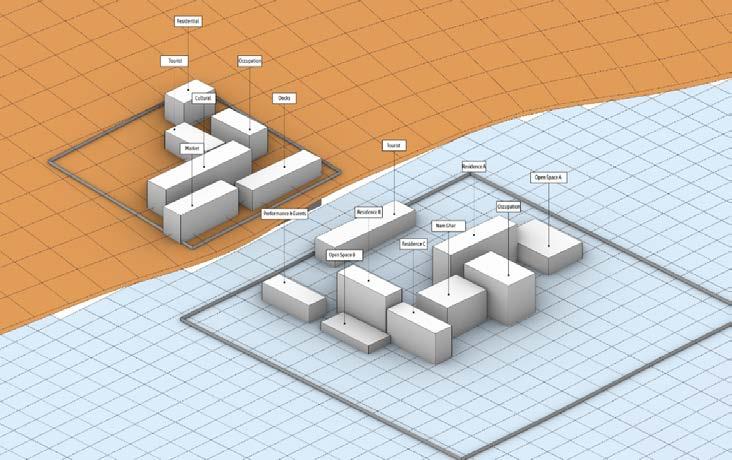
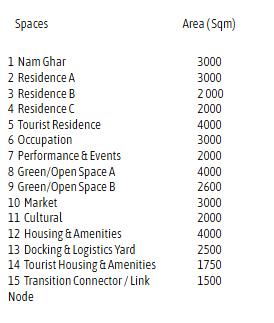
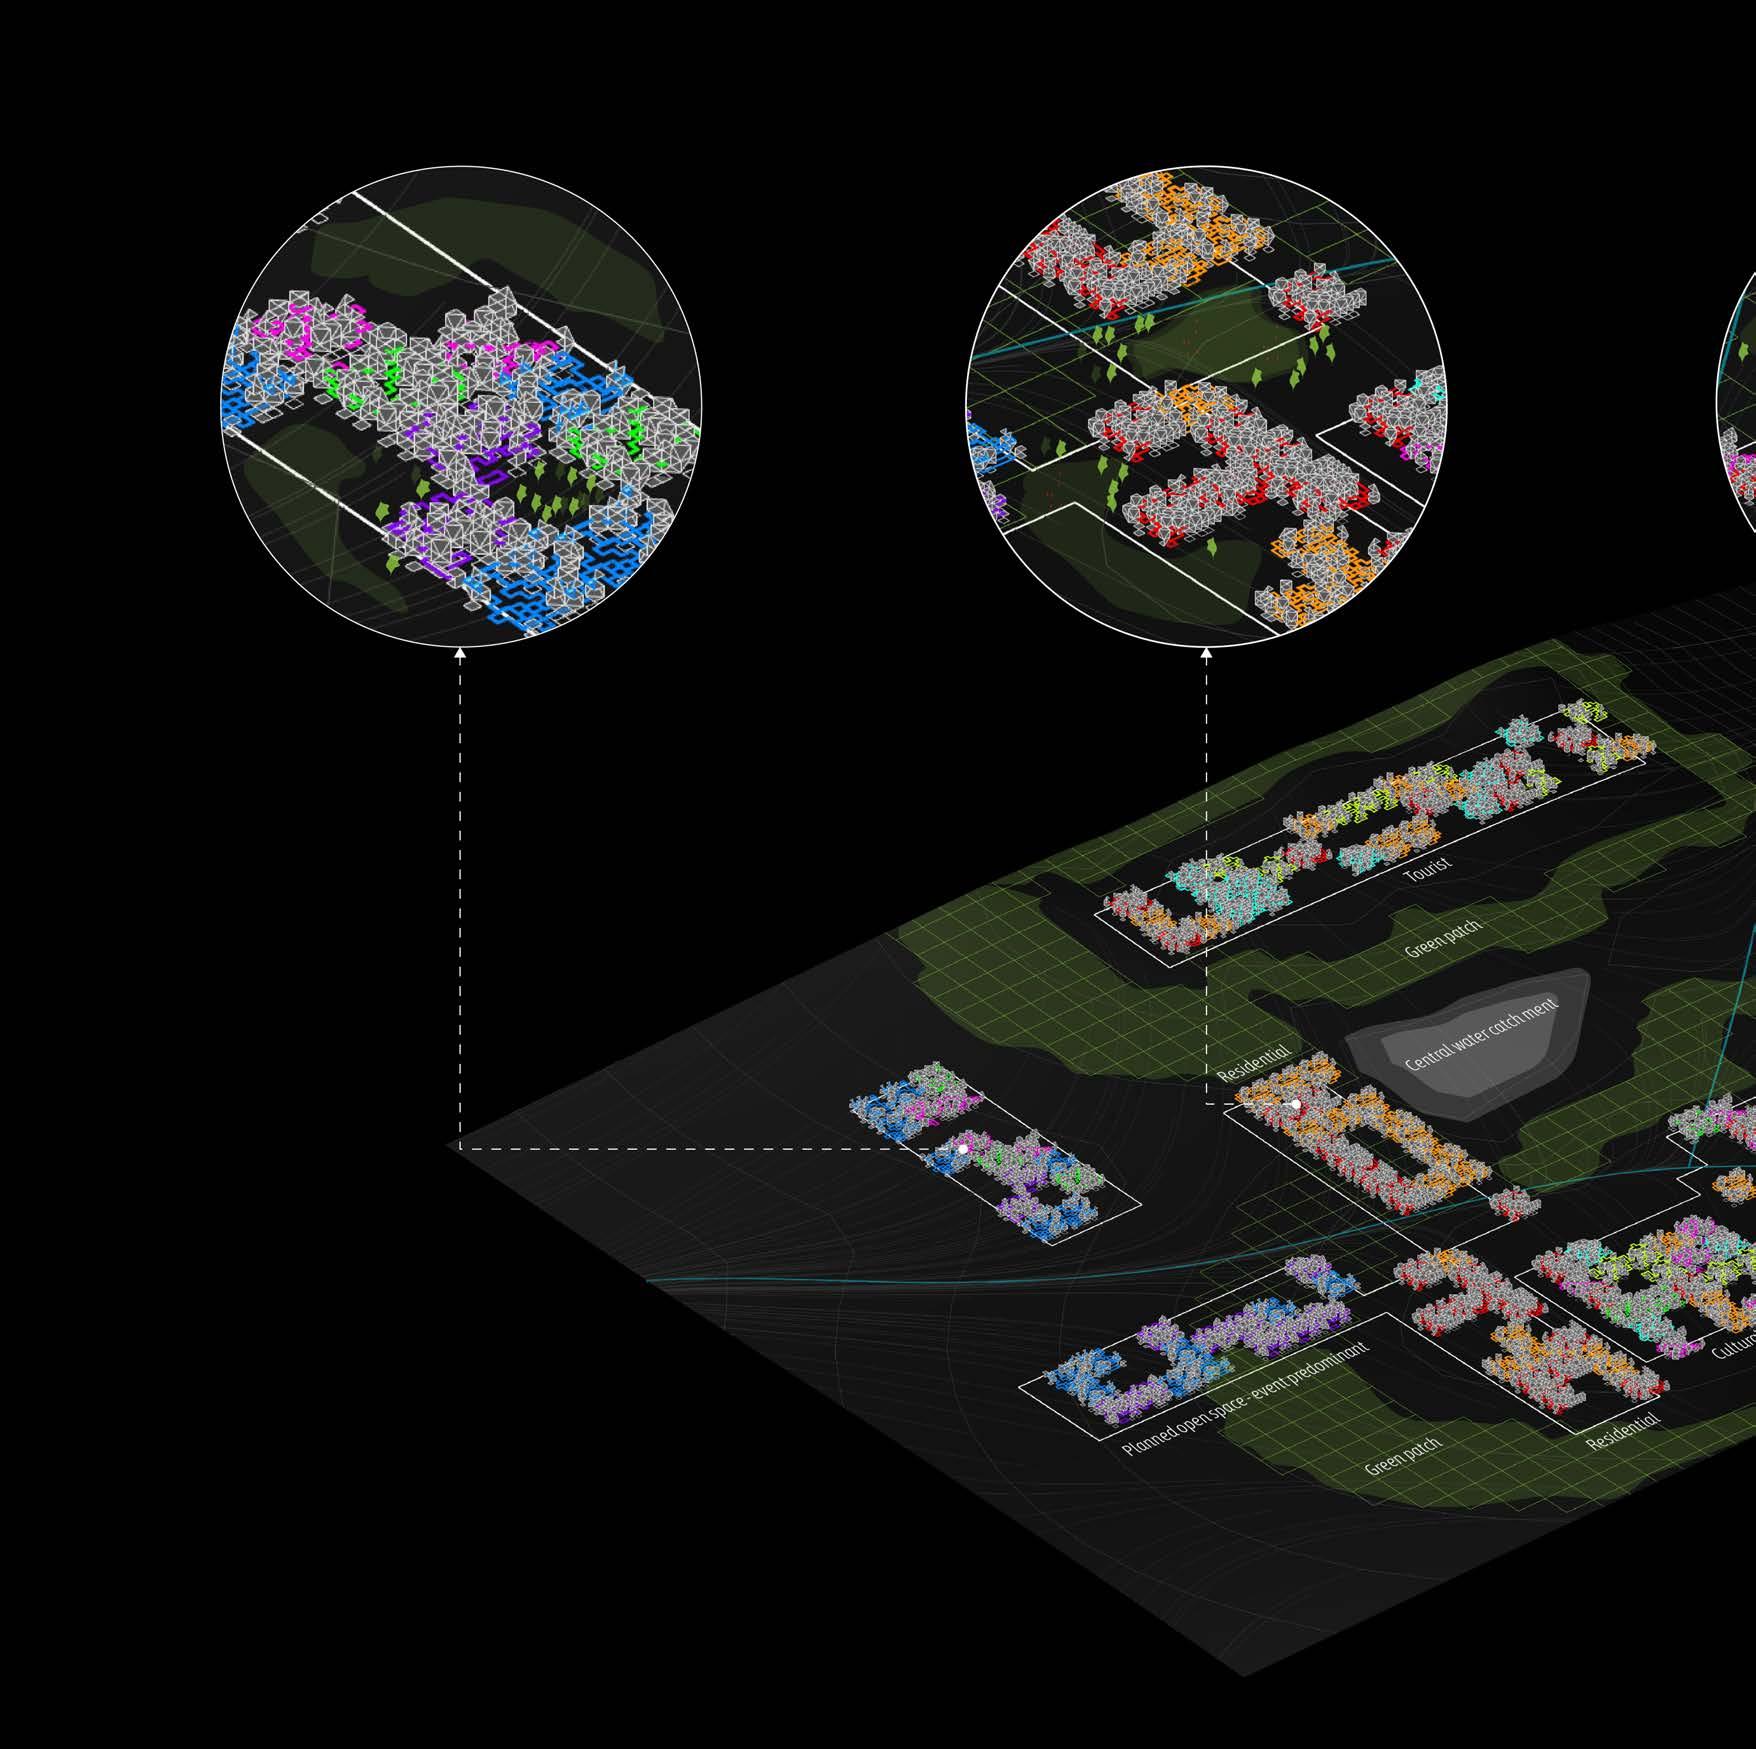
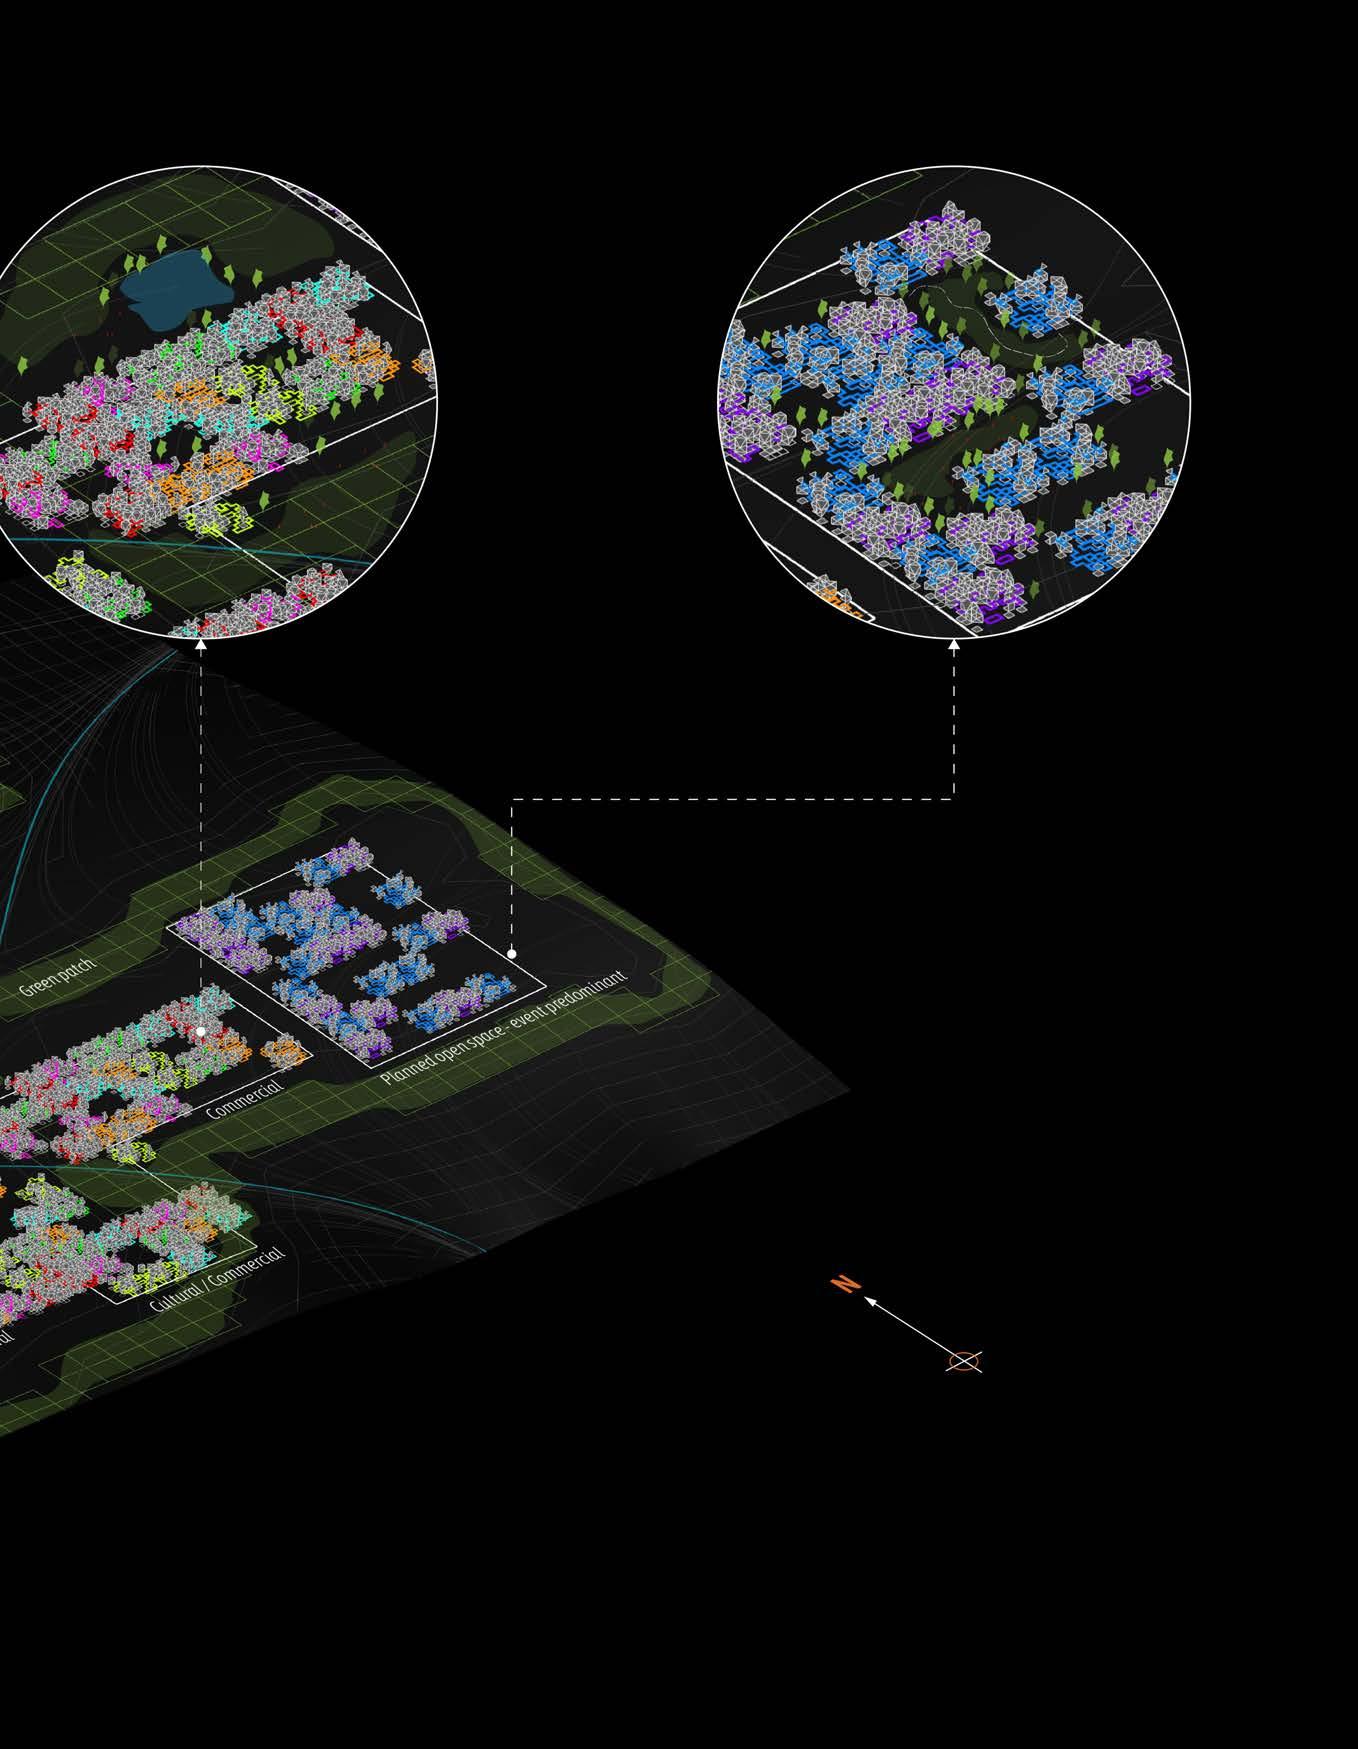
The spatial framework is organised across two primary extents: approximately 250 metres on land and 450 metres along the water edge, reflecting Majuli’s linear relationship with the river. This elongated dimension allows the settlement to unfold gradually, aligning everyday life, cultural activity, and visitor movement along a continuous ecological and social gradient.
Within this field, residential clusters are located closer to the inland edge, maintaining proximity to the Namghar and other daily cultural anchors. These clusters are compact yet porous, organised around shared courtyards that support both private life and communal gathering. Cultural and performance spaces occupy the central band of the site, where open grounds of varying sizes—ranging from 2,000 to 3,000 square metres allow programs to expand during festivals and recede during non-peak periods.
Tourist housing and amenities are positioned toward the water-facing edge, responding to increased accessibility and seasonal footfall. Larger programmatic elements such as tourist residences and cultural facilities extend up to 4,000 square metres, while supporting functions including markets, docking and logistics yards, and service areas are calibrated between 1,500 and 2,500 square metres. These dimensions ensure that high-intensity uses remain legible and contained, without overwhelming the finer residential grain.
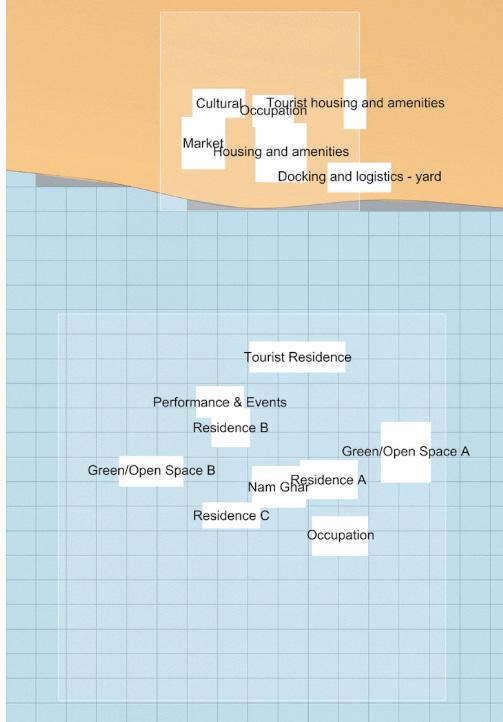
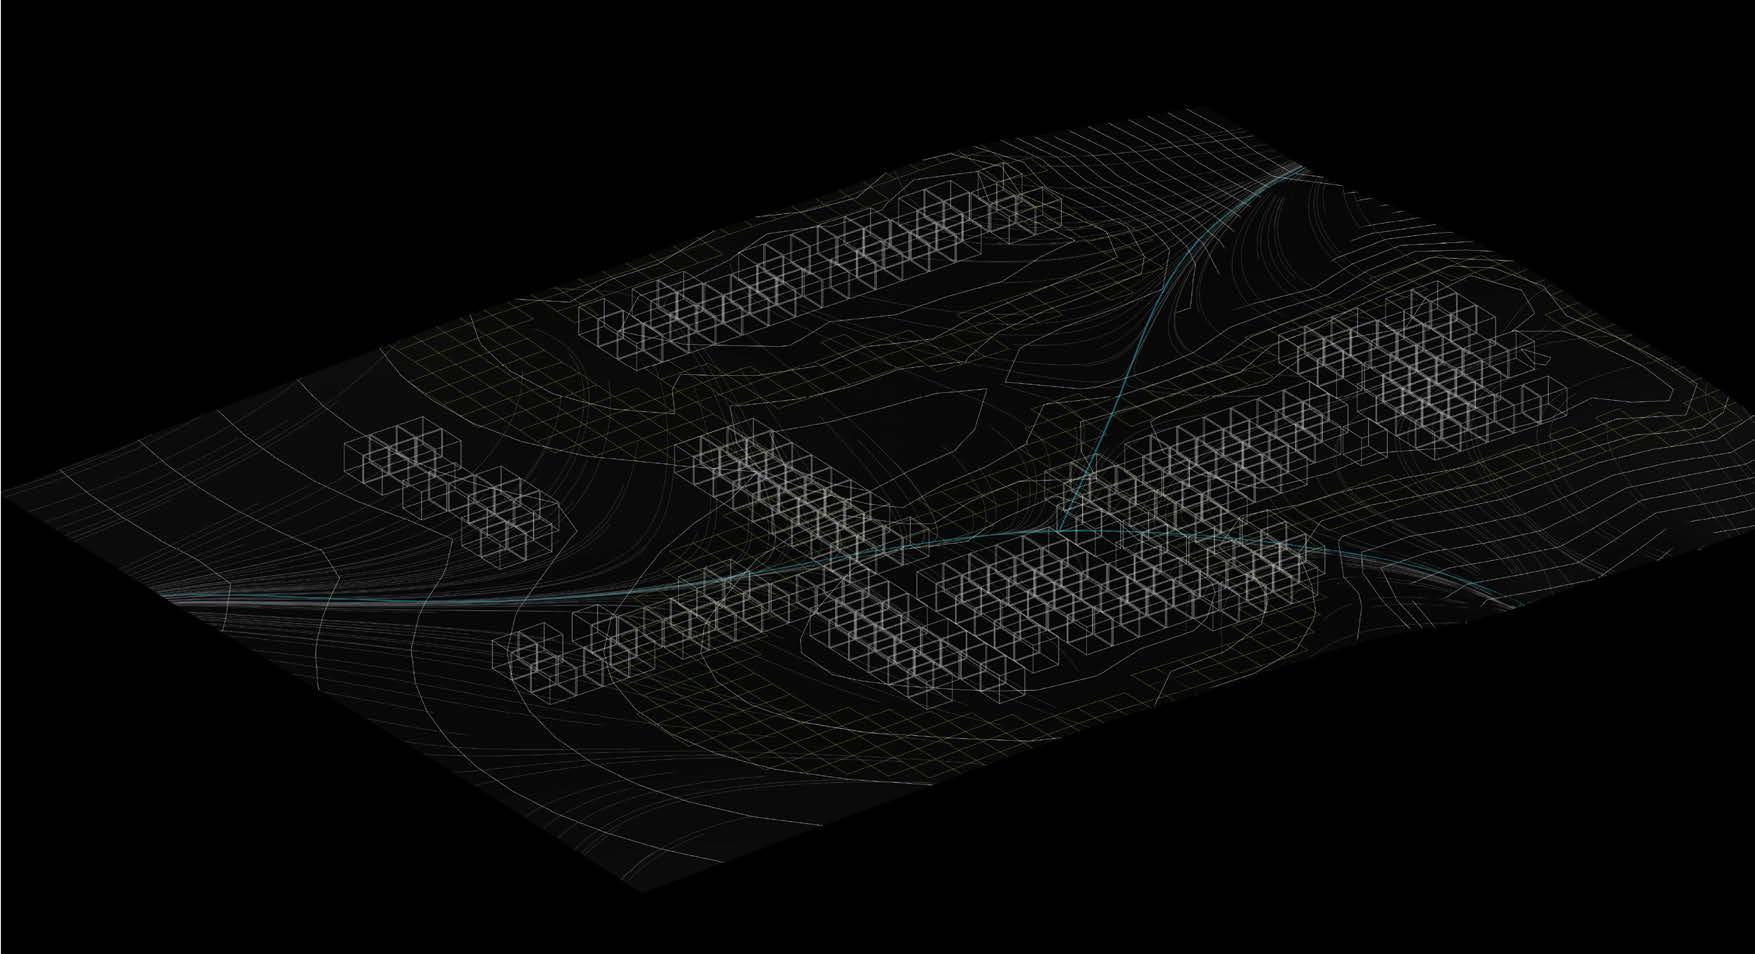
Fig. 44 : Datascapes on land and water , Created by Author
Fig. 43 : Majuli’s functional hierarchy, Created by Author
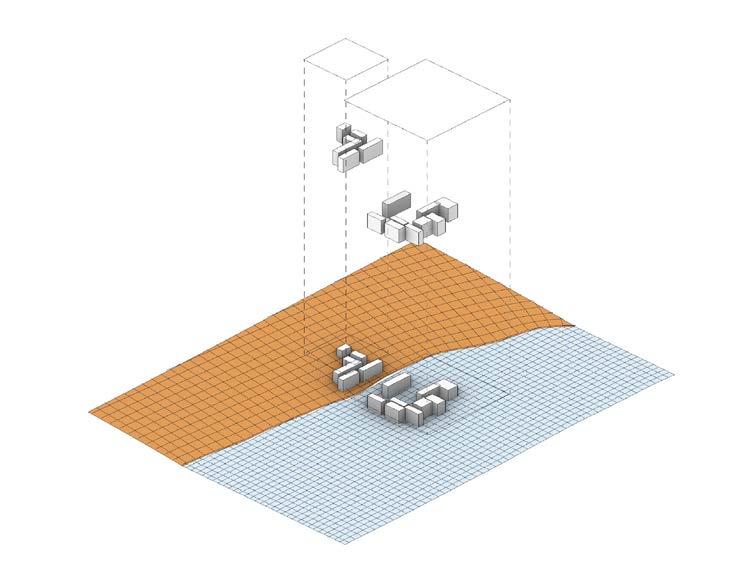
Research Methodology
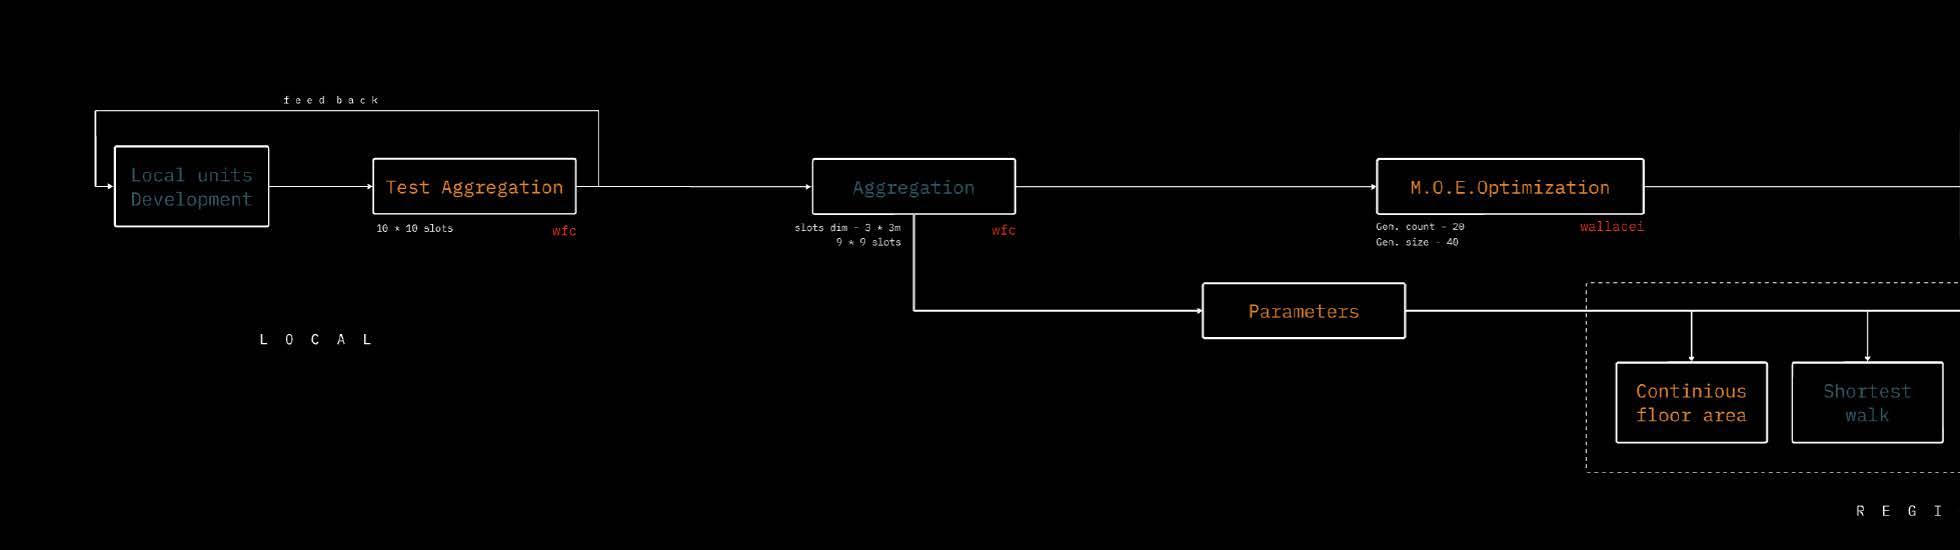
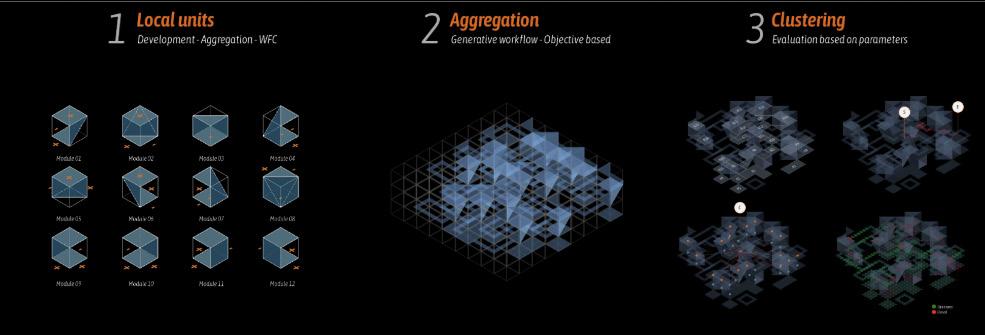
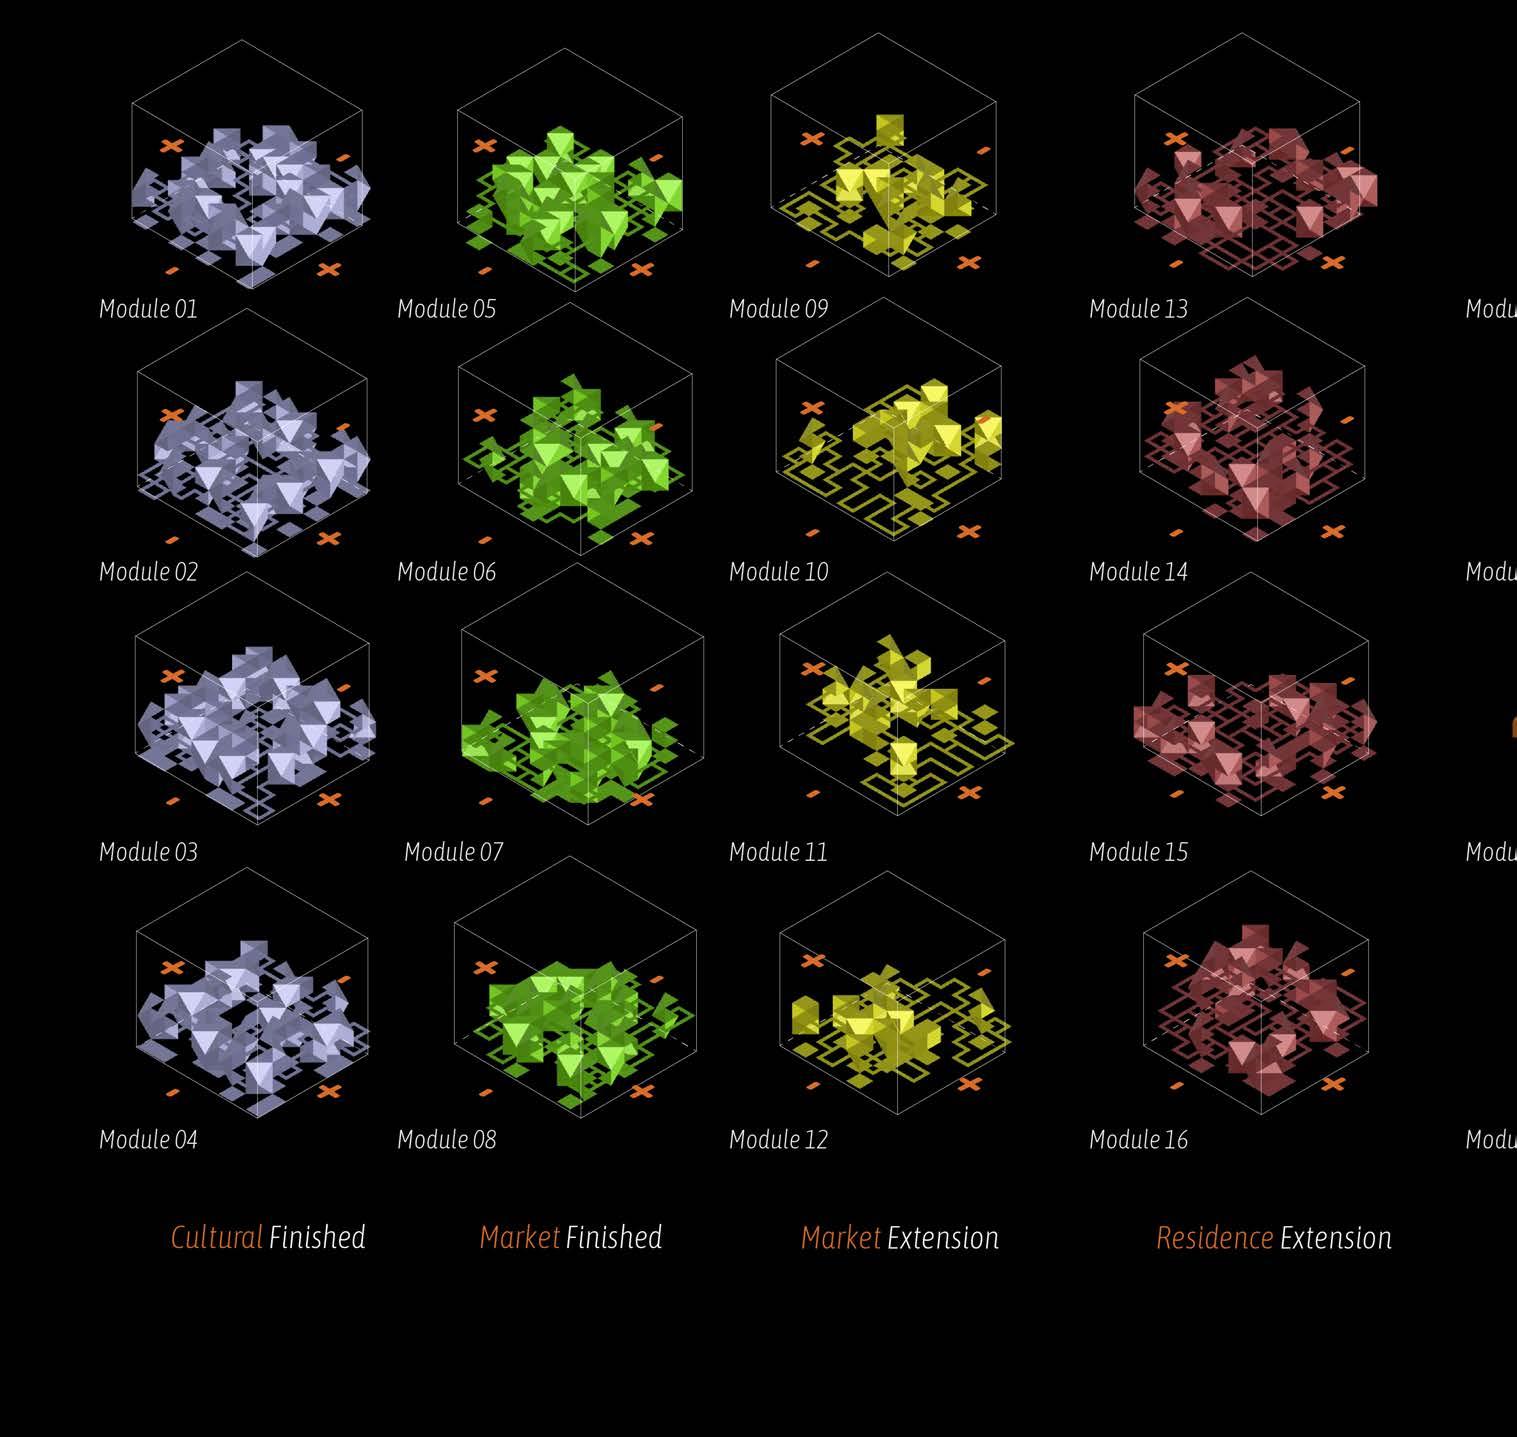
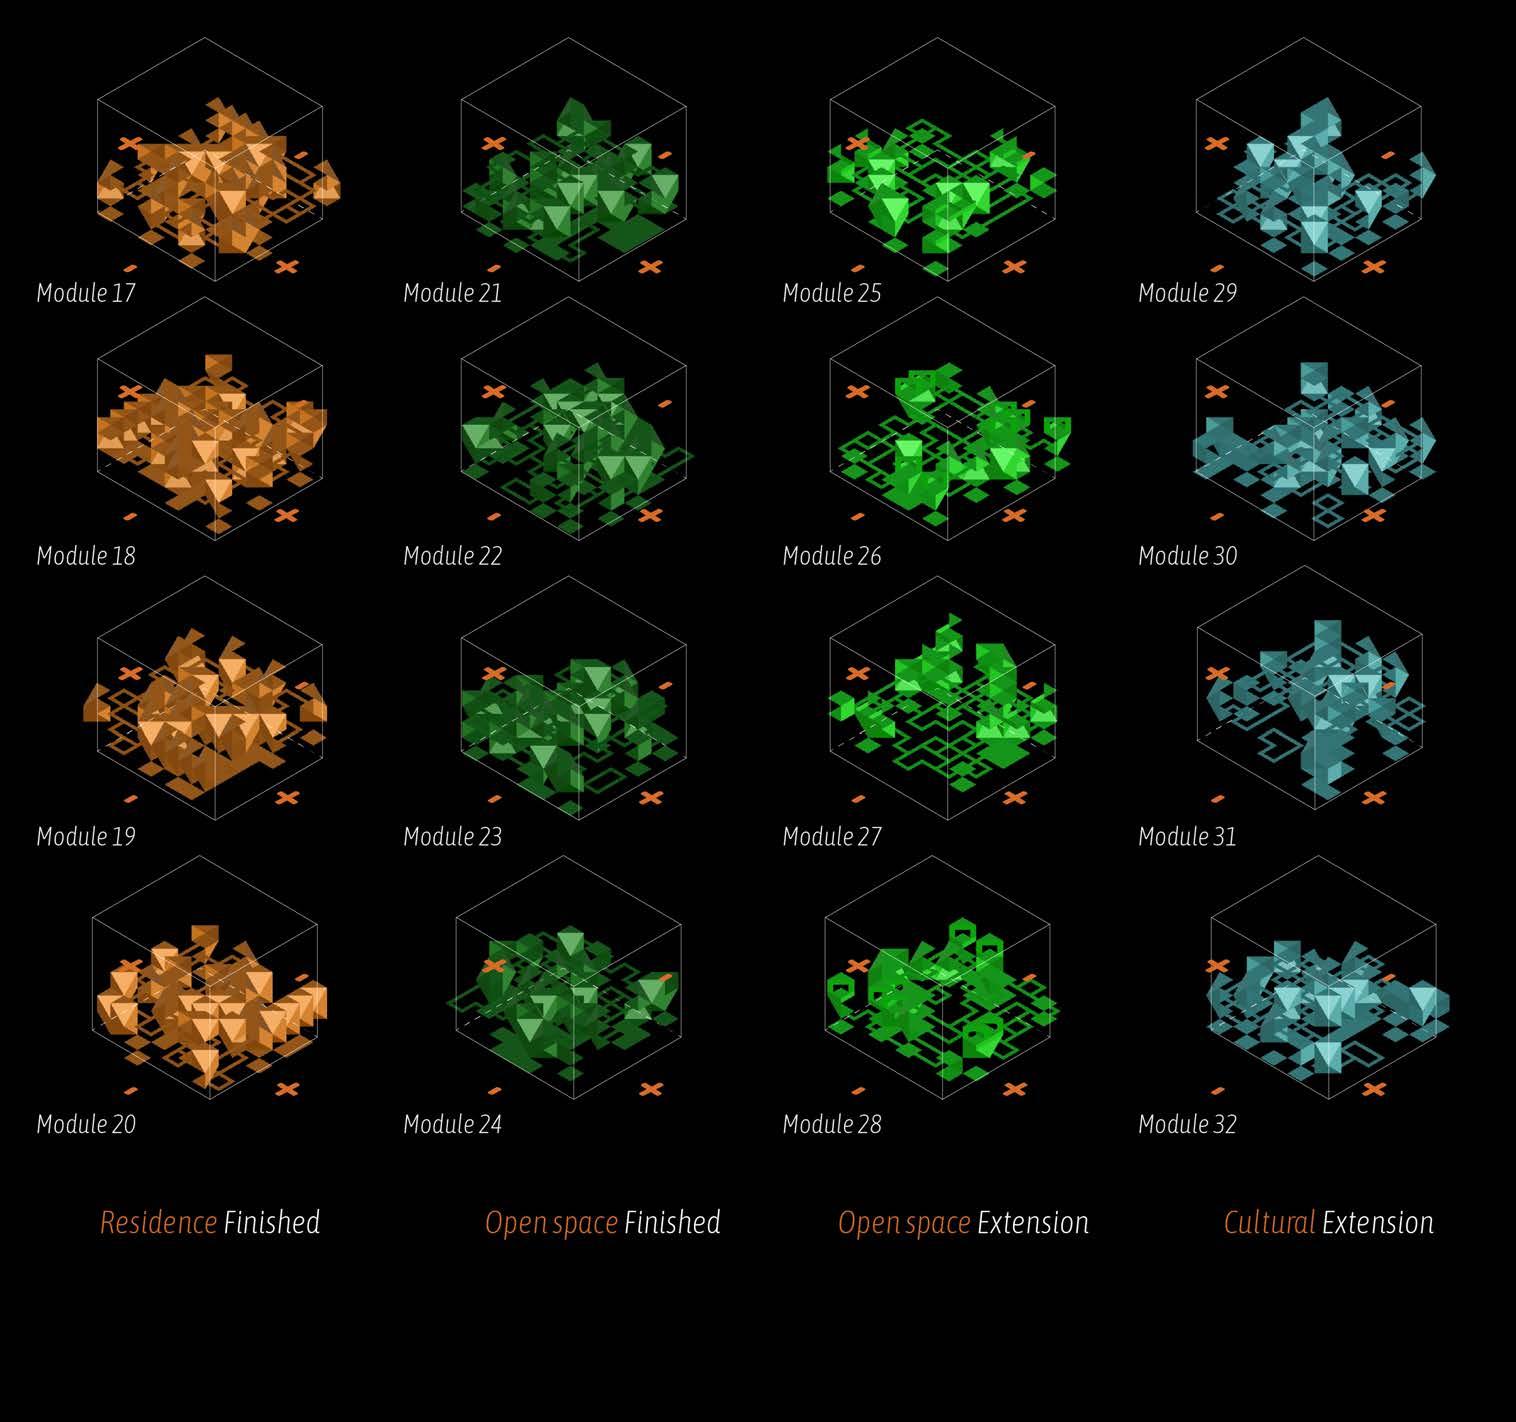
The spatial arrangement is the result of a unique C# rule-based framework. The system does not impose set architectural shapes and operates within a predetermined territorial limit of 250 meters on land and 450 meters over water. Rather, it subtly separates the field into flexible portions that react to environmental factors, closeness, and scale. Every program is given a target area, which ranges from roughly 1,500 square meters for transition nodes to 4,000 square meters for large cultural facilities and visitor lodging. Rules governing buffer distances, overlap tolerance, and adjacency govern these programs. While tourism, service, and logistics operations are focused on edge conditions and access points, residential units are urged to stay near to cultural anchors, strengthening social continuity and daily interaction. Flexible areas that may accommodate transient, festival-scale occupancy without necessitating long-term structural extension are known as open grounds.
The spatial layout is mostly shaped by proximity rules. High-intensity or service-oriented programs are purposefully placed farther apart to minimise conflict and preserve functional clarity, whereas cultural and residential activities are weighted to cluster closely. Iterative optimisation cycles are used to continuously assess and readjust these relationships, which are not fixed. An extra layer of spatial intelligence is introduced by environmental inputs. The rule set incorporates data on exposure, seasonal flow variance, and water velocity. Programs that need long-term stability are directed towards lowvelocity zones, whereas locations with more environmental variability are allowed for flexible or transient applications. Instead of trying to oppose Majuli’s ecological processes, this guarantees that spatial decisions are in line with them.
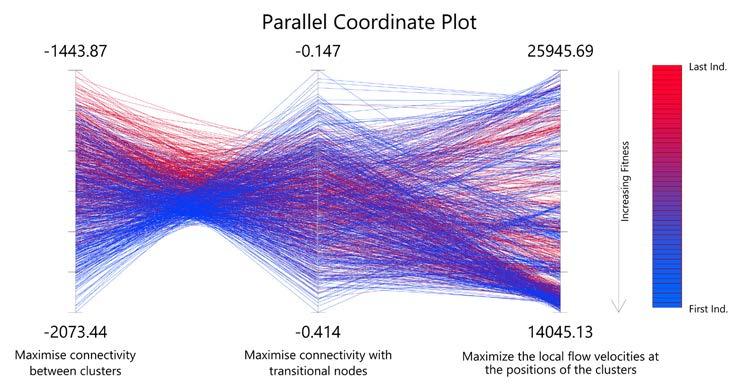
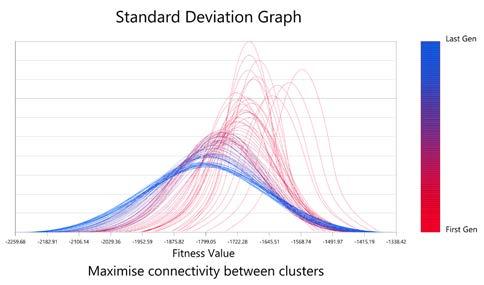
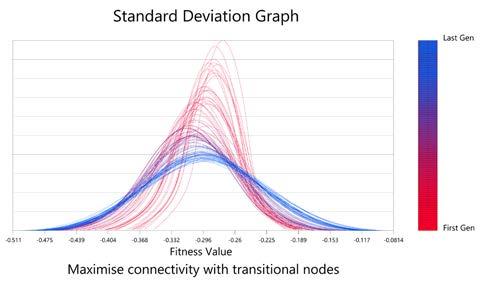
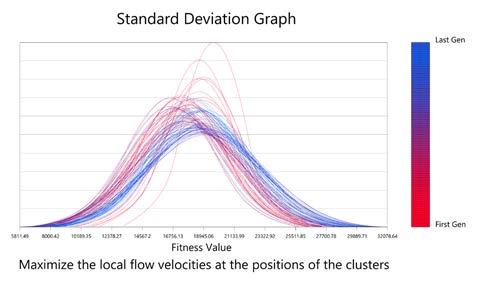
Through the integration of Wallacei’s evolutionary solver with the C# rule logic, the system investigates a variety of spatial configurations, choosing configurations that strike a compromise between cultural and functional proximity and environmental responsiveness. Instead of a single solution, the result is an optimal spatial equilibrium that is nevertheless flexible in Majuli’s environment.
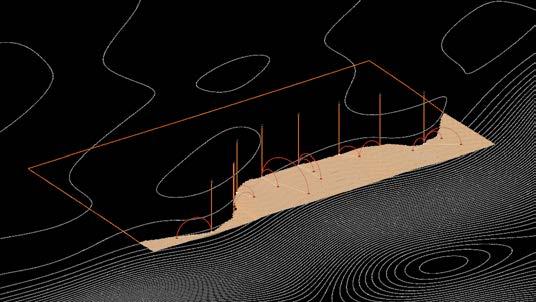
Fig. 45 : Datascape Experiment setup, Created by Author
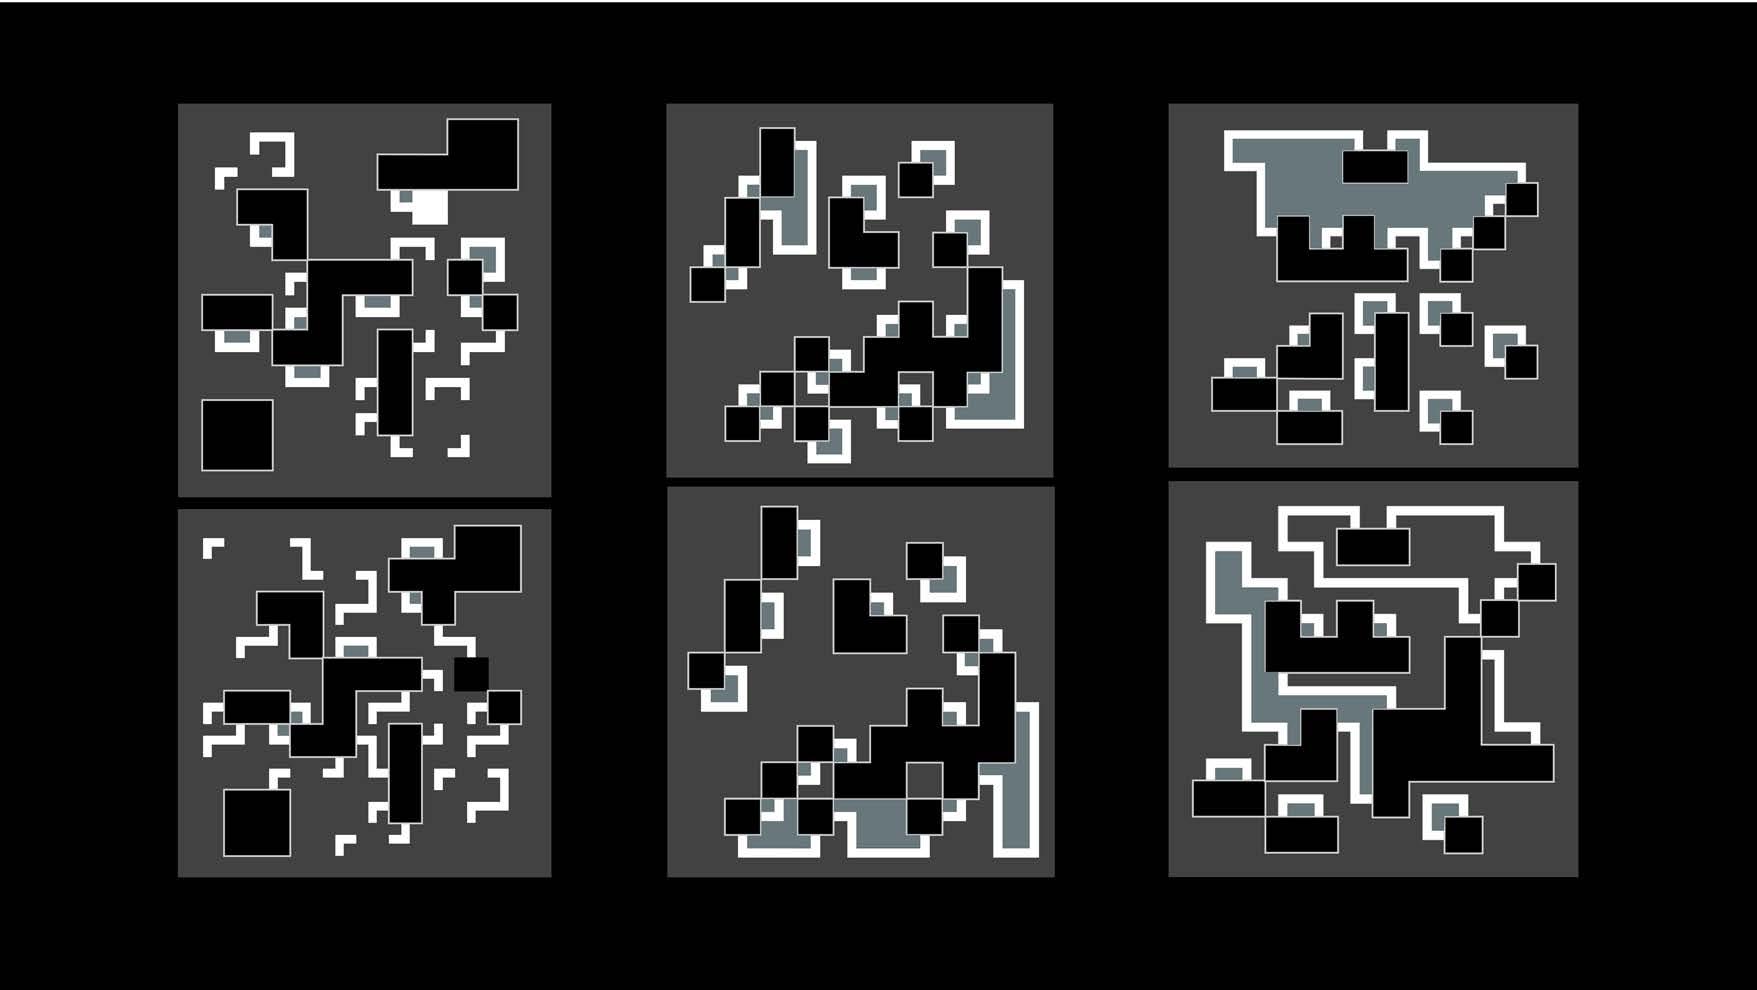
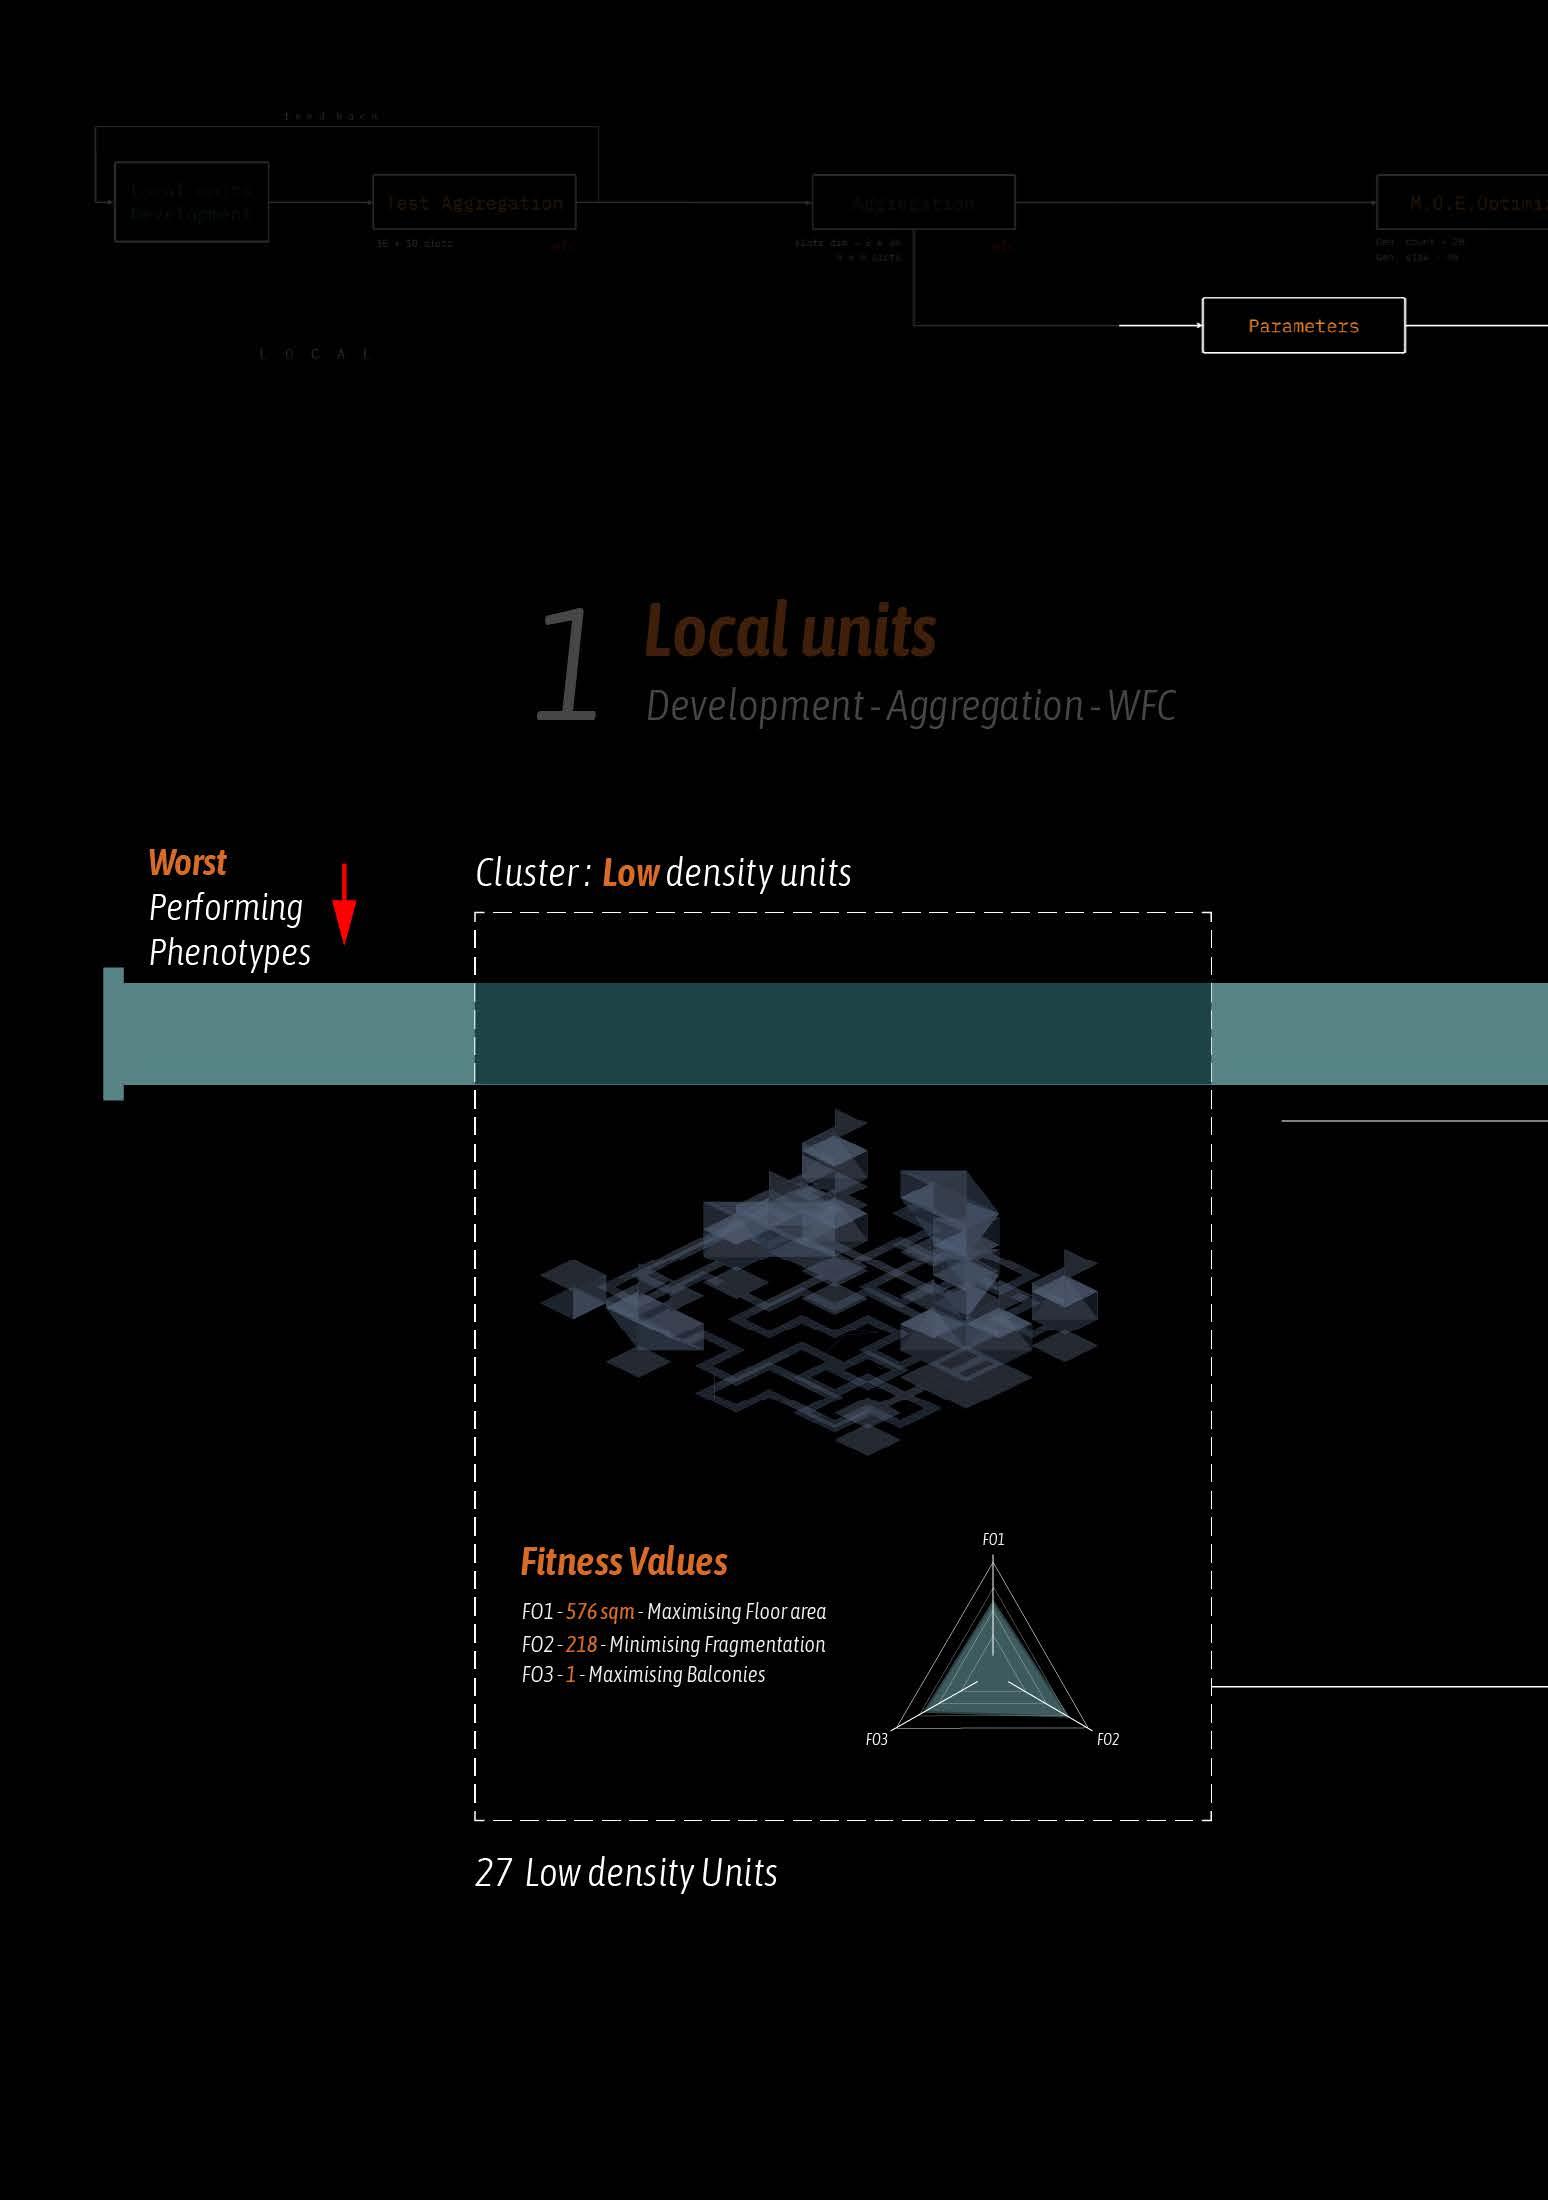
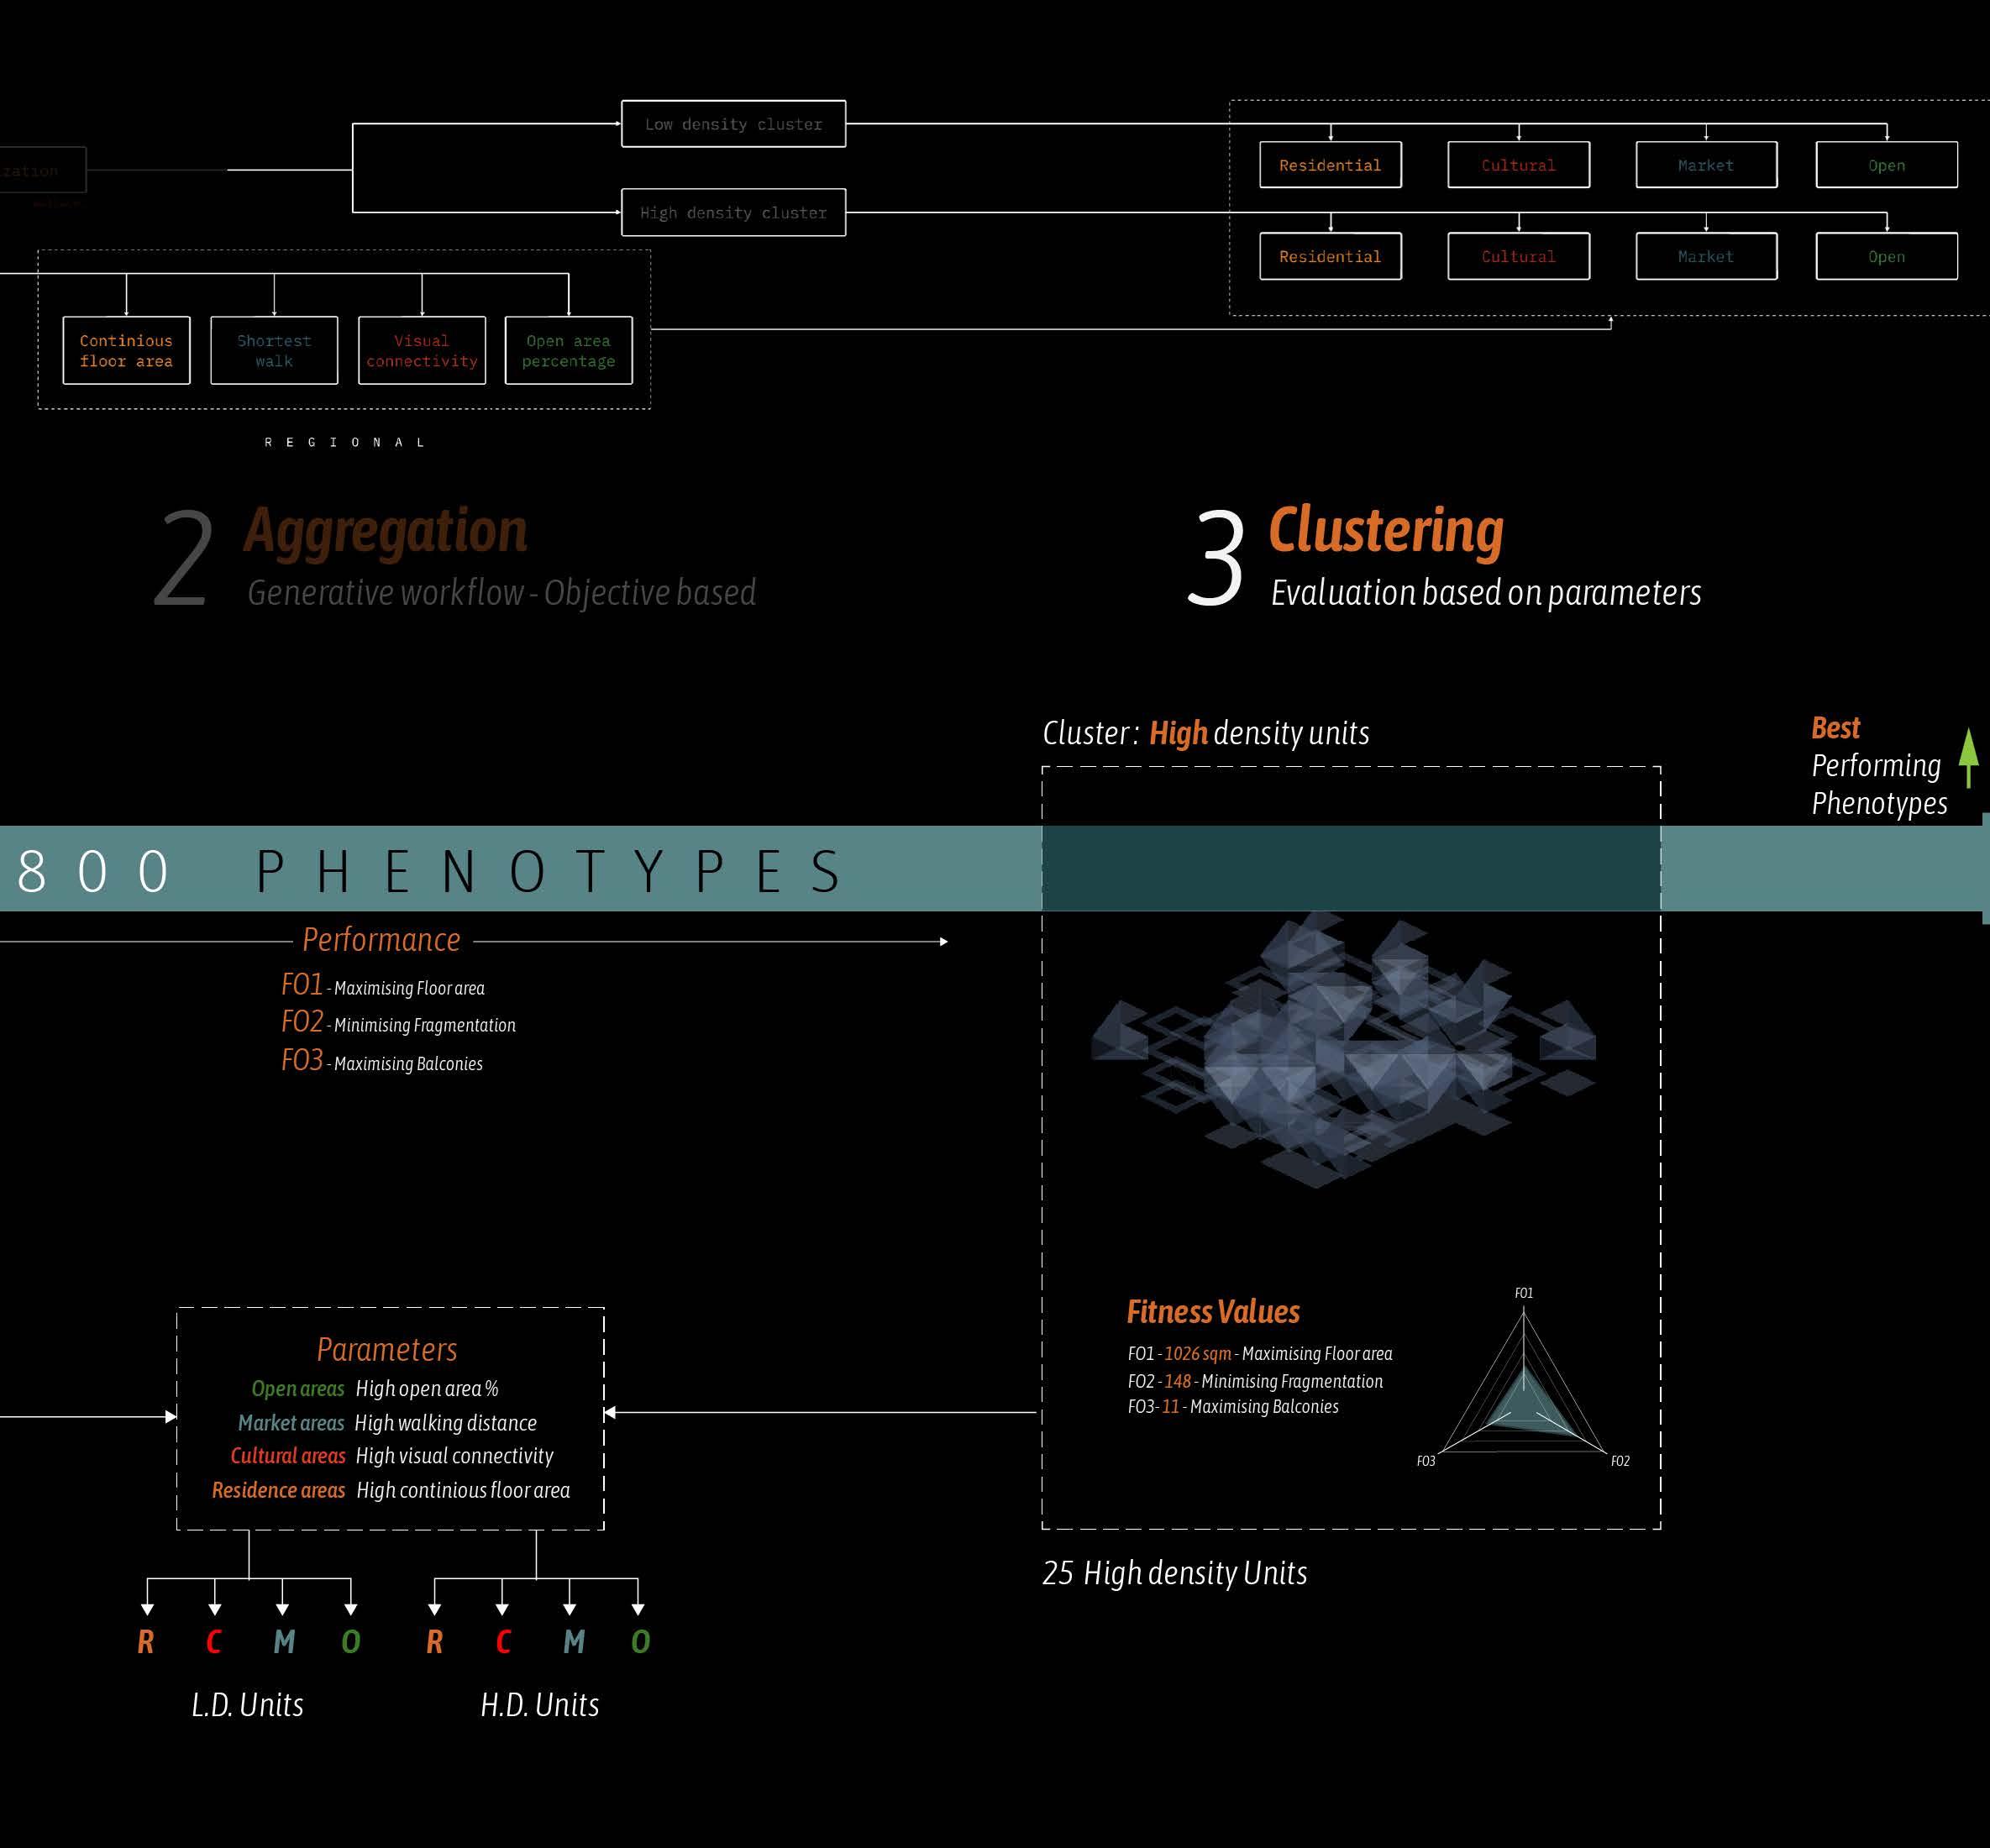
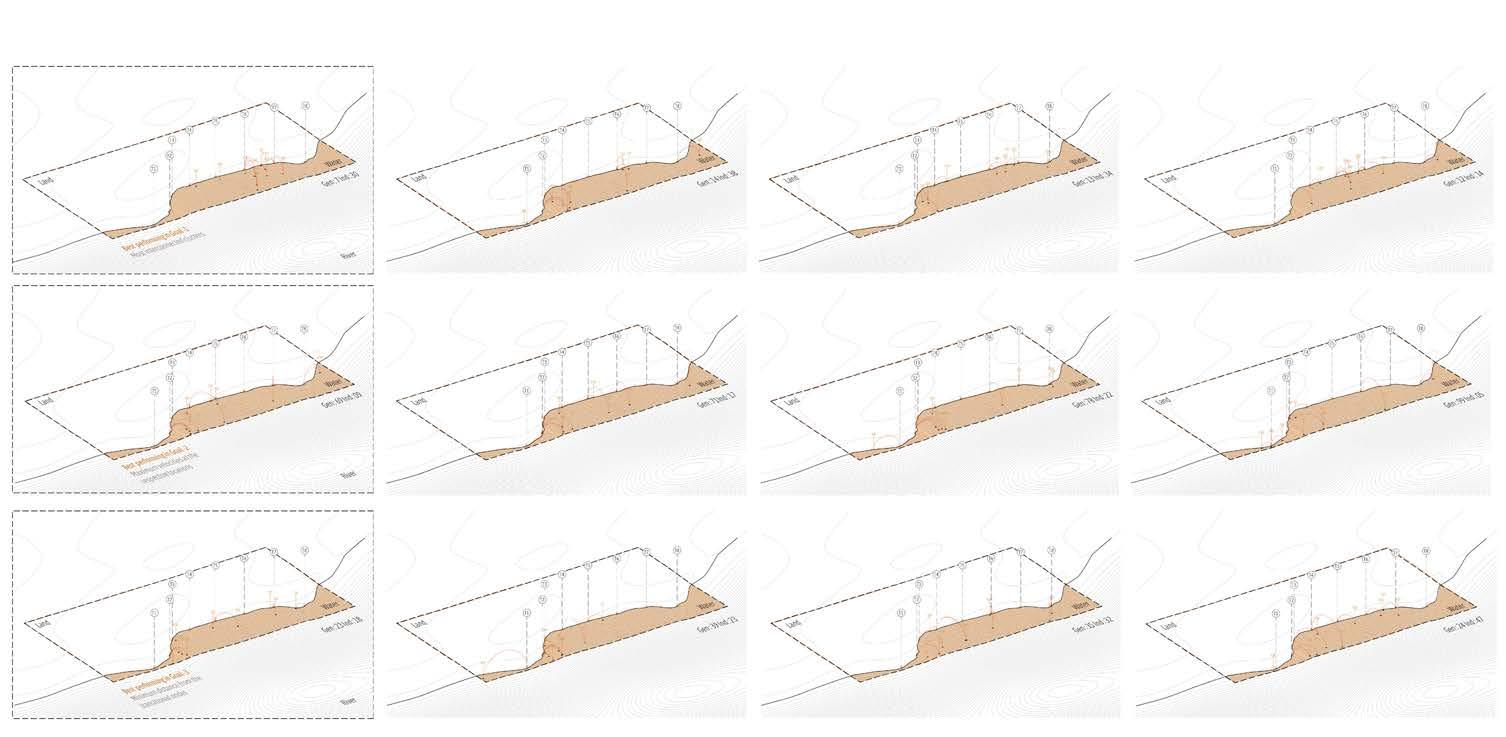
K-Means Clustering of Pareto Fronts for Selecting Optimal Spatial Configurations
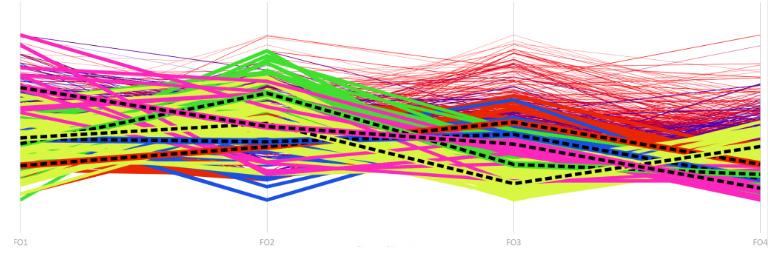
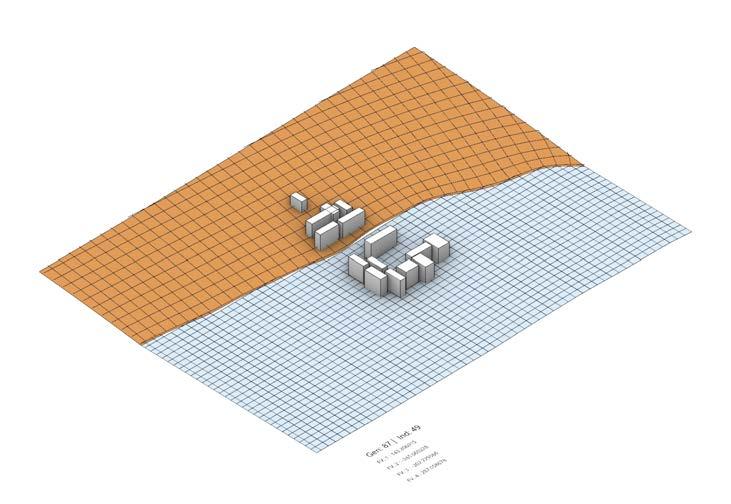
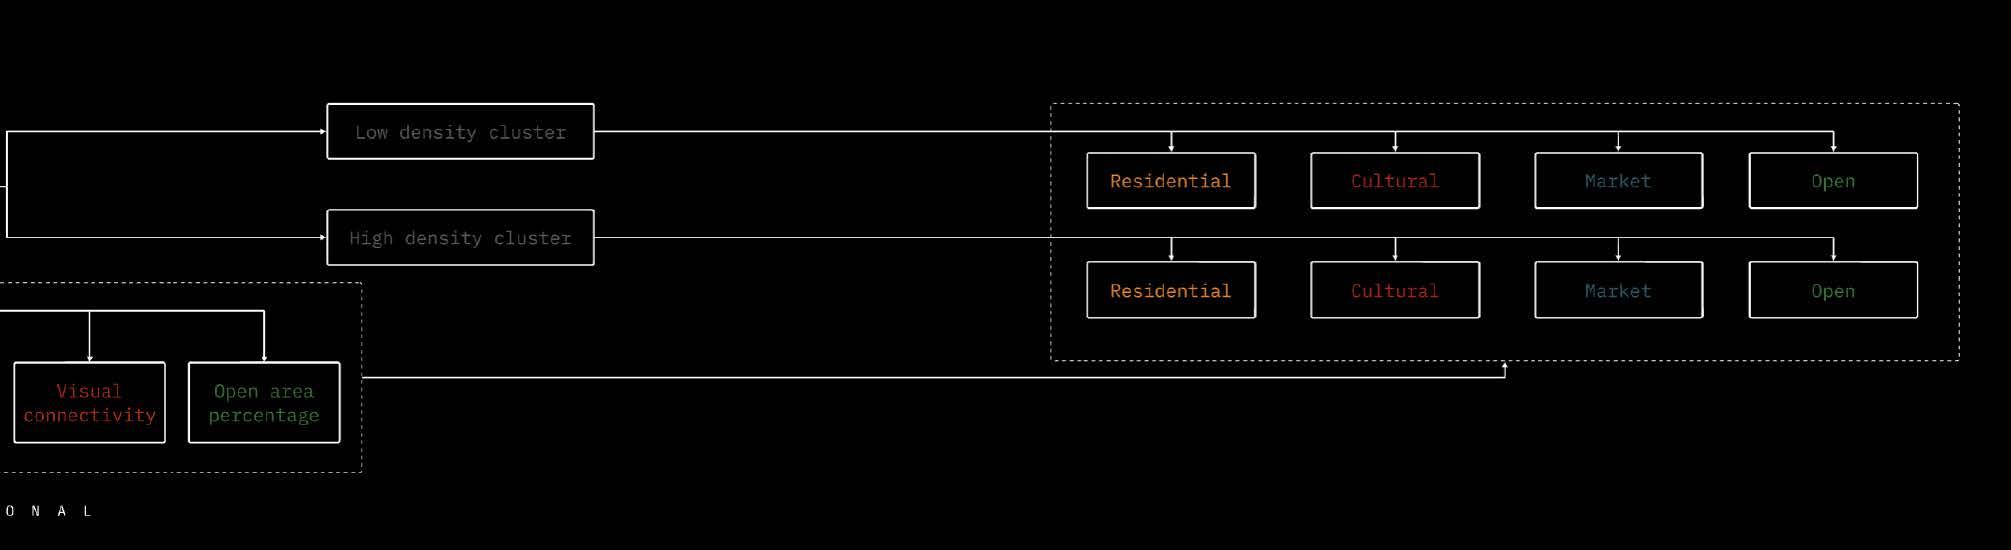
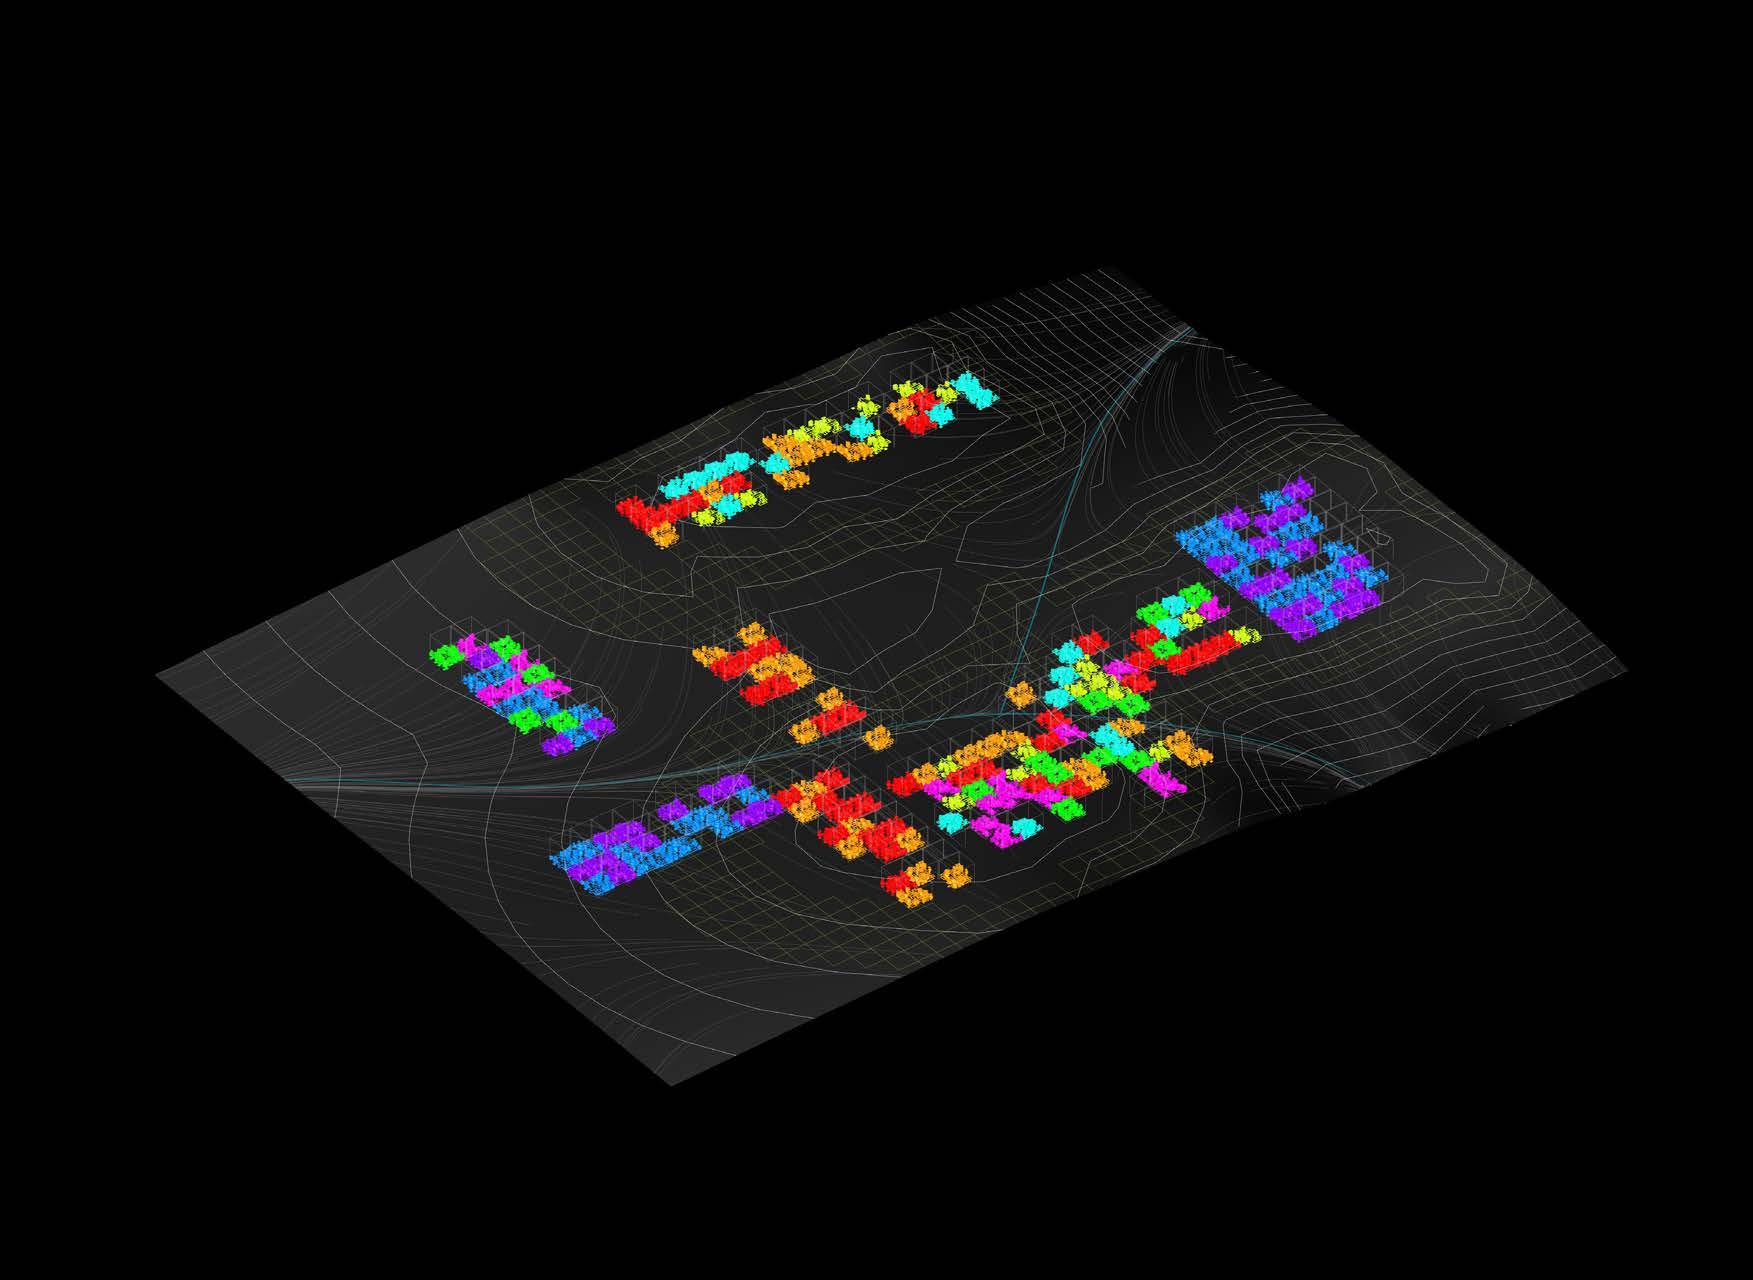
After generating a large set of design solutions through multi-objective optimisation, the resulting Pareto front contains many spatial configurations that cannot be improved in one objective without reducing performance in another. Instead of manually choosing from dozens of equally valid candidates, the study applies K-means clustering to group these Pareto-optimal solutions into meaningful families based on similarity.
This clustering step reduces visual and analytical complexity. Each cluster represents a distinct design tendency such as compact neighbourhood cores, elongated linear arrangements, or mixed-density fabrics. From every cluster, the configuration that performs best within its group is extracted. This ensures that the final selection is not biased toward a single region of the Pareto front but captures the full diversity of viable urban layouts.
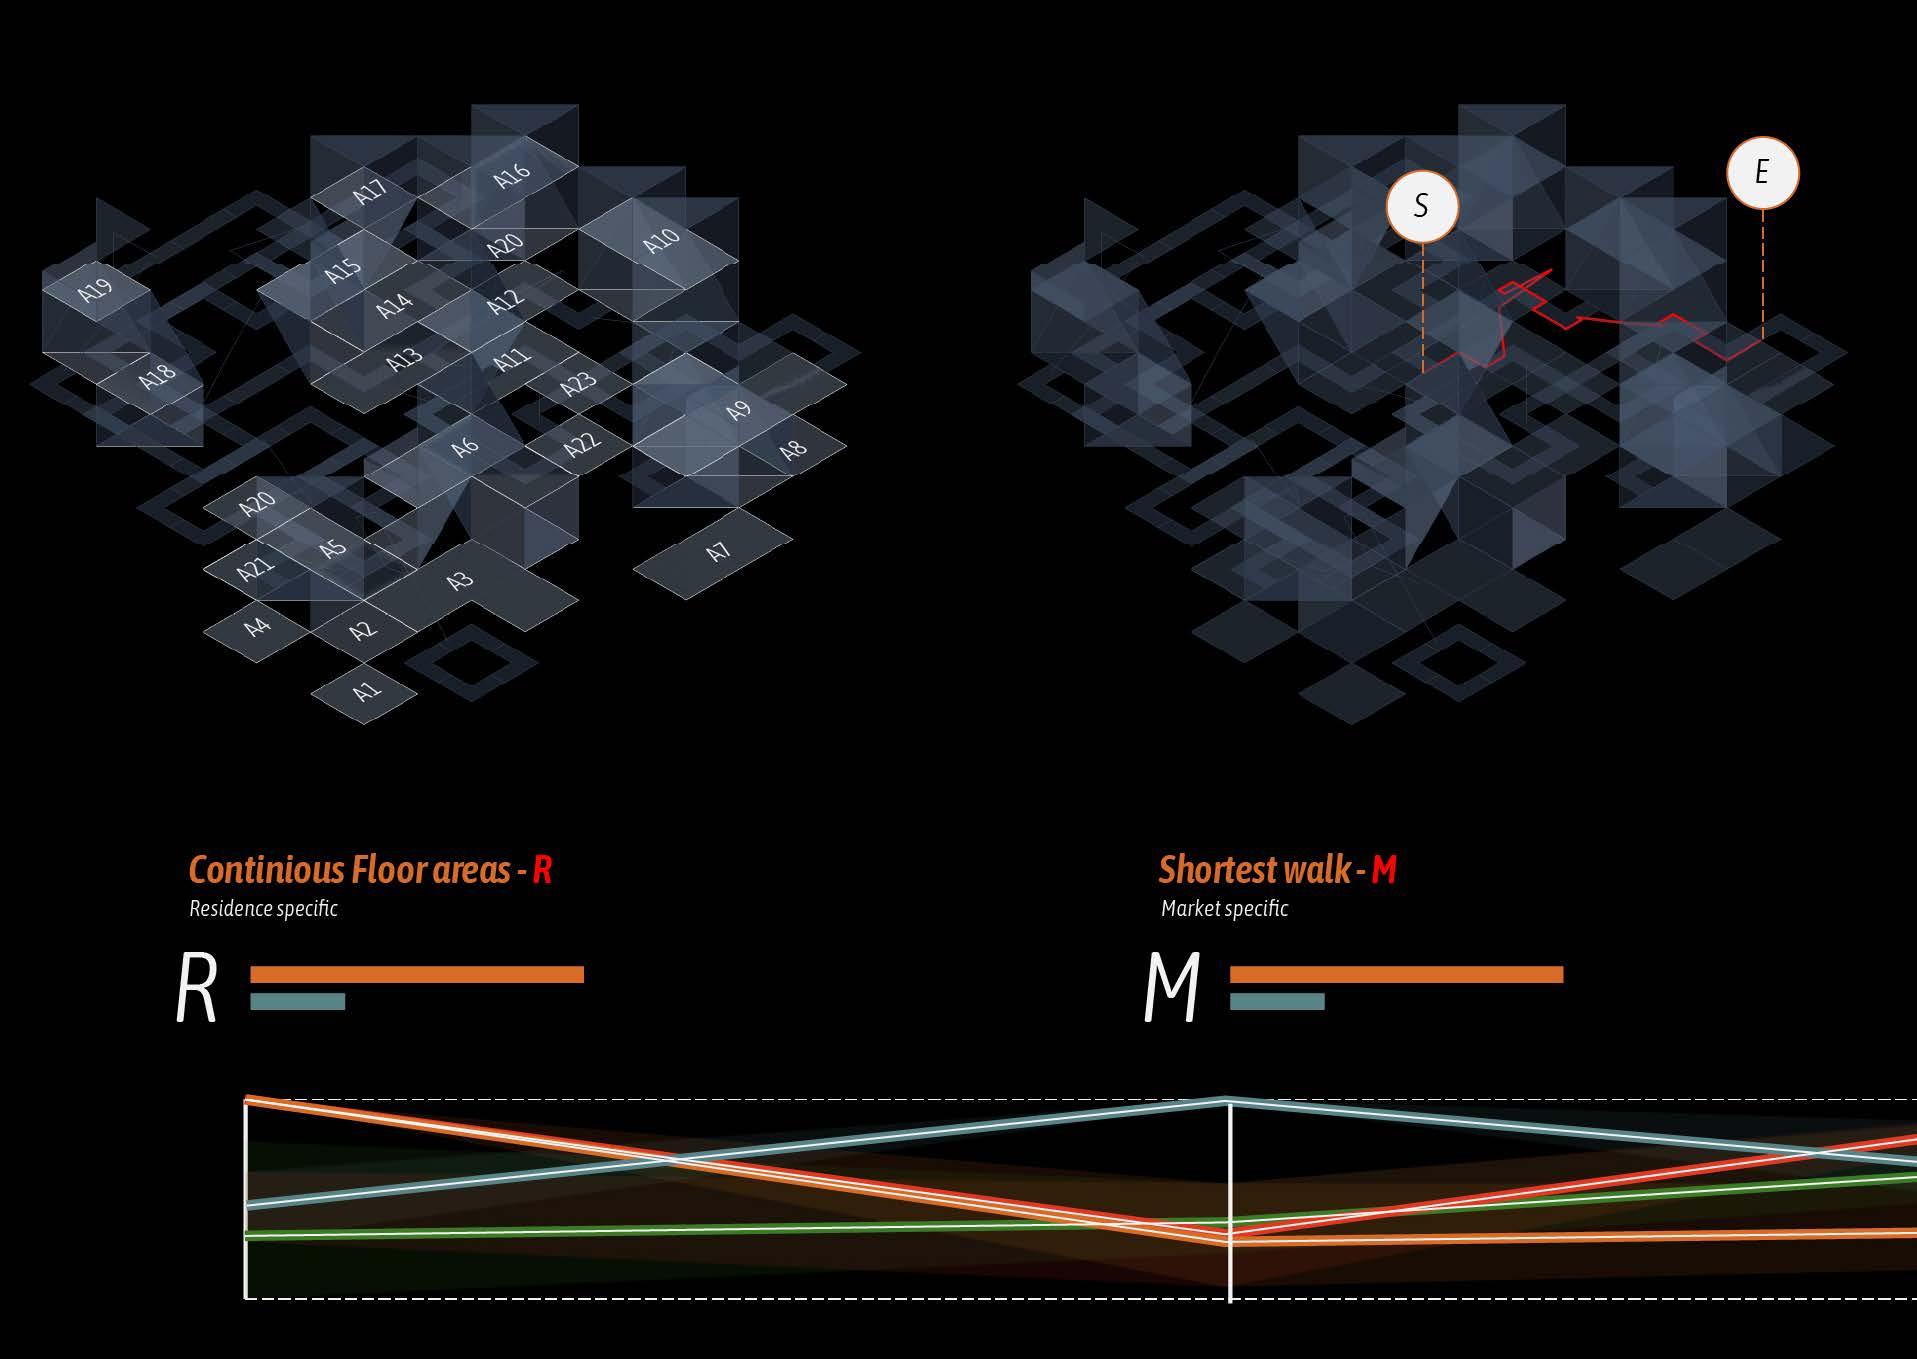
The shortlisted solutions are then ranked using a weighted evaluation matrix. The weights reflect the project’s design priorities, balancing environmental performance and human experience. Criteria include flow velocity (to understand how movement or water dynamics interact with the built form), accessibility and walkability (distance to key amenities within the 10-minute framework), and spatial relationships between residential, communal, and tourist zones (ensuring functional coherence and social sustainability).
By combining statistical clustering, multi-objective optimisation, and designdriven weighting, the method produces a small, rigorously justified set of configurations. These become the foundation for subsequent massing development, zoning refinement, and simulation-based testing, creating a transparent and repeatable pathway from computation to design decision.
1.High Velocity
2.Distance from Docks ( on land ) to Residence B , Performance ( On Water )
3.Distance from Nam Ghar to Tourist Residence ( On water )
4.Low velocity
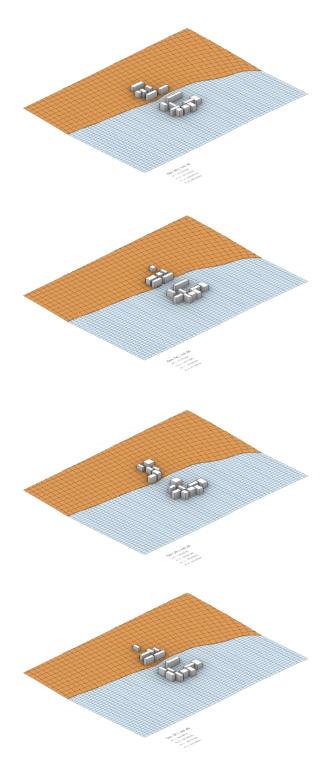
Fig. 46 : Best forming data scapes, Created by Author
Fig. 47 : K-Means Clustering of the MOEA for the data scapes , Created by Author
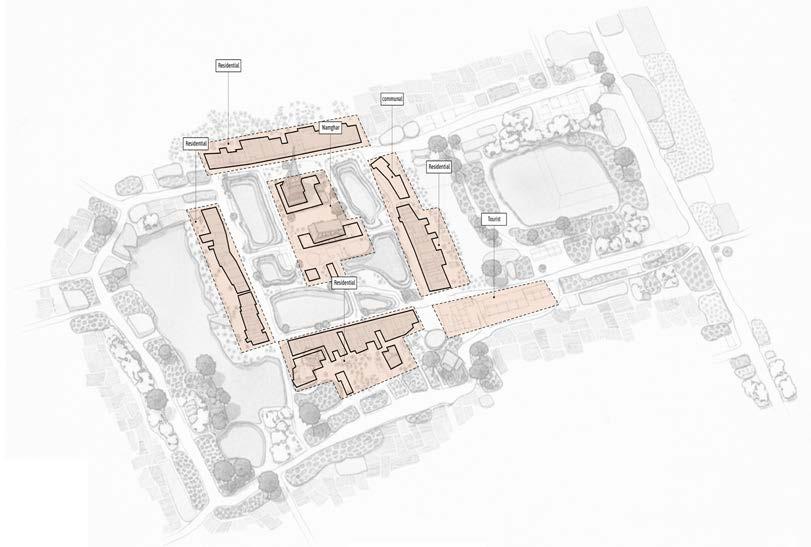
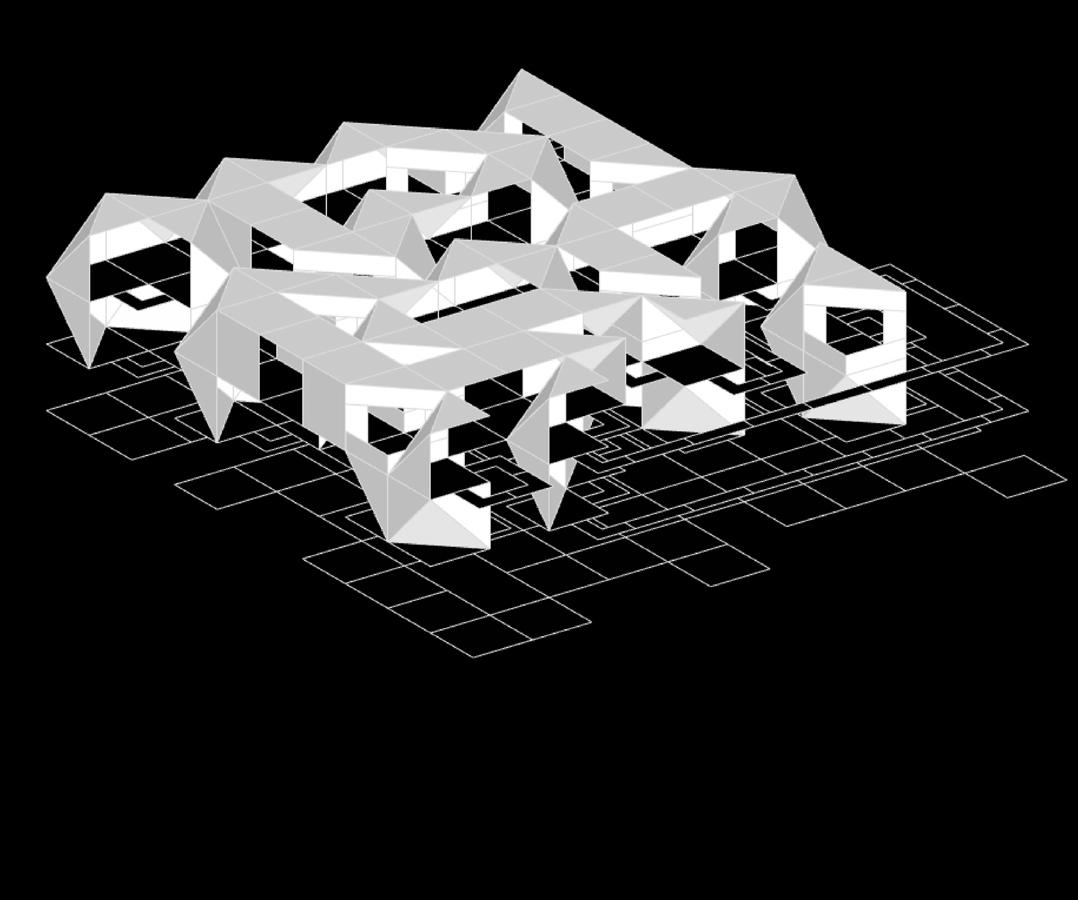
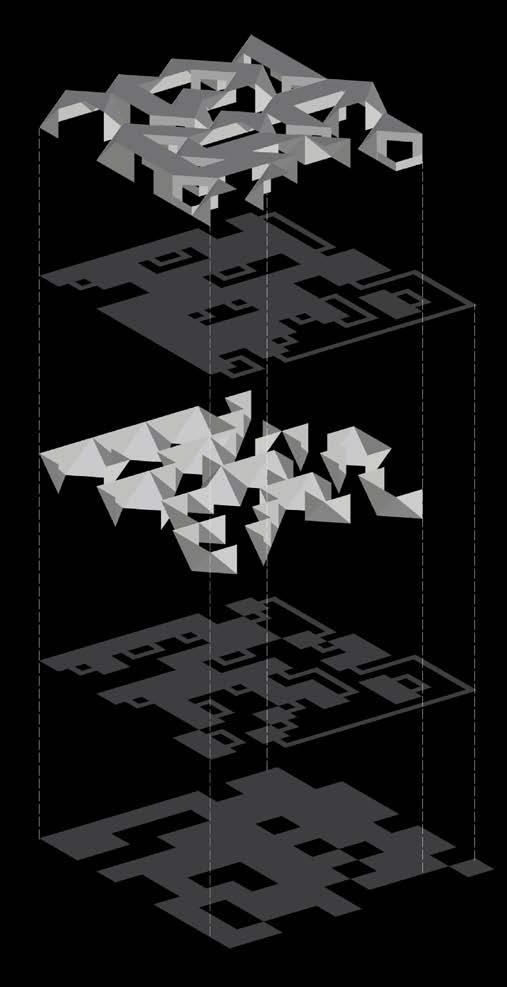
From a computational perspective, Kamalabari’s existing organisational logic is reinterpreted through generated spatial architecture. The traditional monastic–residential–communal structure is translated into data-driven spatial rules informed by proximity, movement velocity, and footfall intensity. These behavioural parameters allow the model to anticipate patterns of movement between residential, religious, and tourist zones, producing a layout shaped by lived dynamics rather than fixed tradition. In contrast, the present settlement fabric reflects a historically layered framework shaped by cultural customs and long-term environmental adaptation. Comparing these two logics reveals how computational reasoning can extract the core principles of an established settlement while projecting more adaptable growth trajectories for Majuli’s future.
Derived Plan
Existing Plan
Fig. 48 : Derived Datascape , Created by Author
Fig. 49 : Exisiting Kamalabari Plan,Created by Author
Research Development
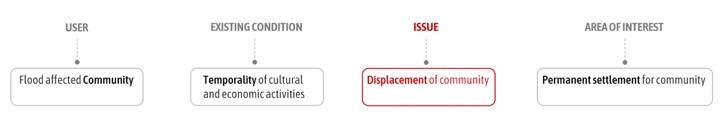
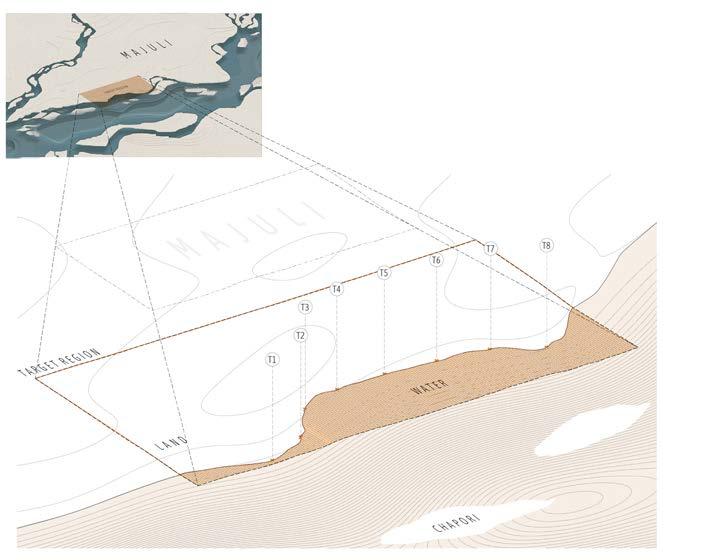
Area of Intervention
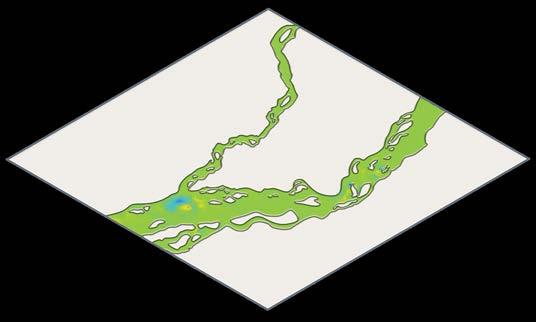
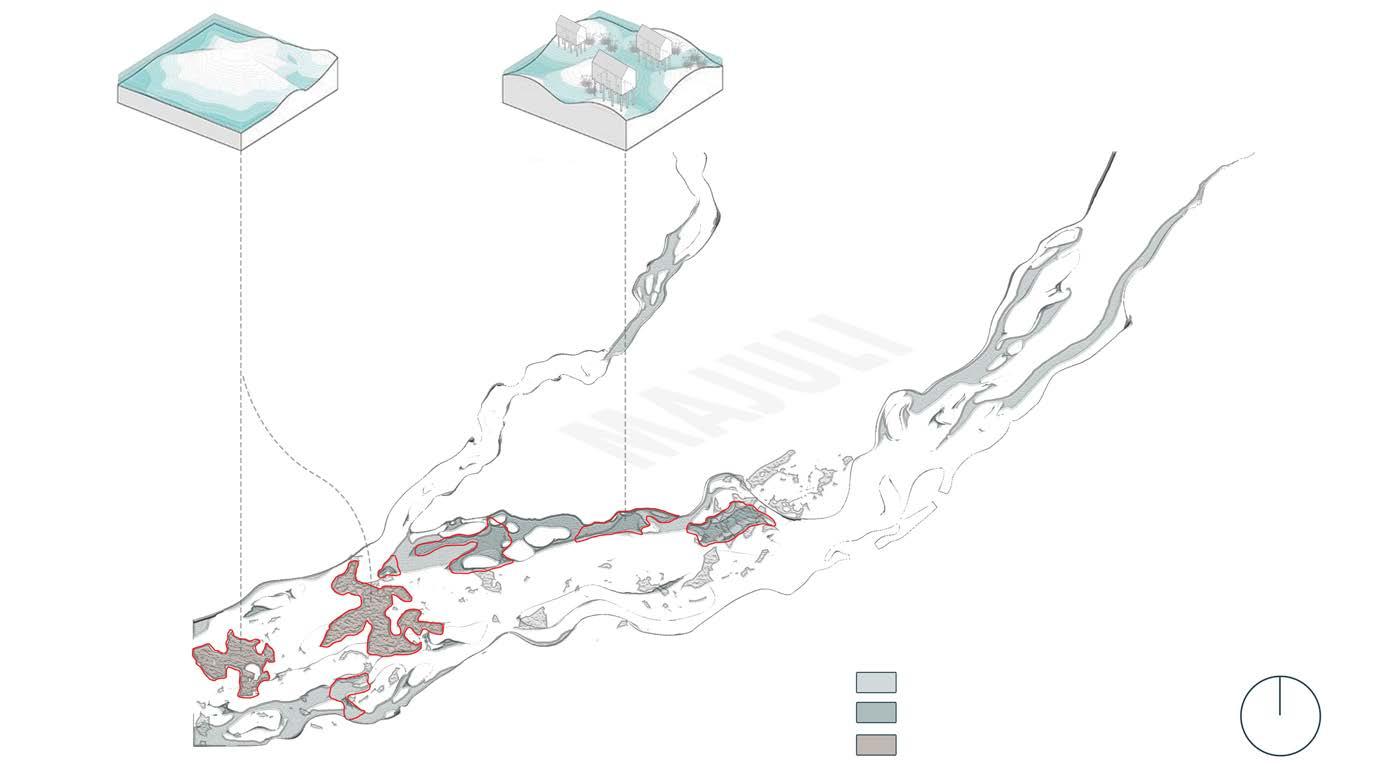
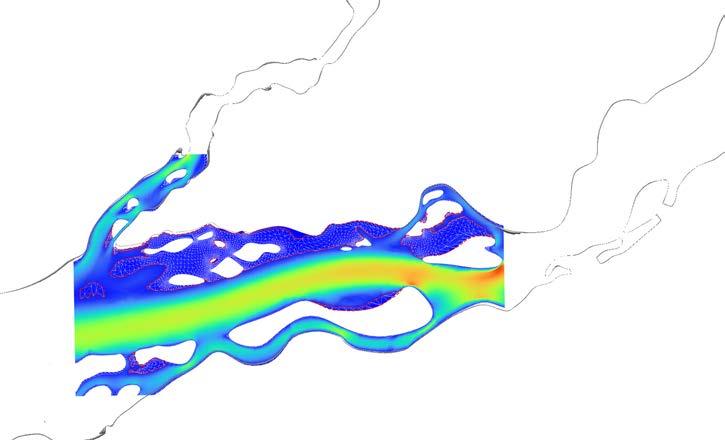
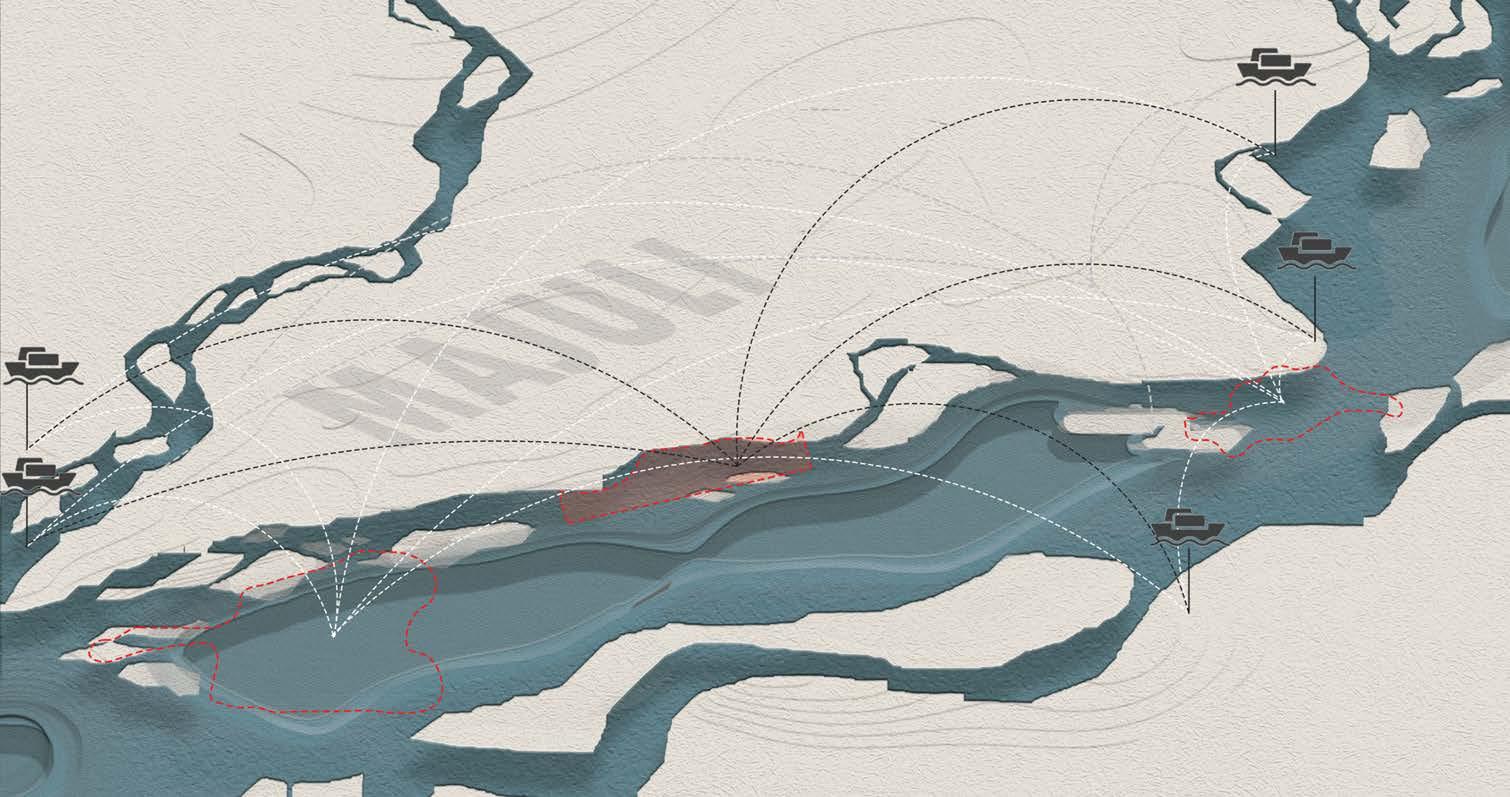
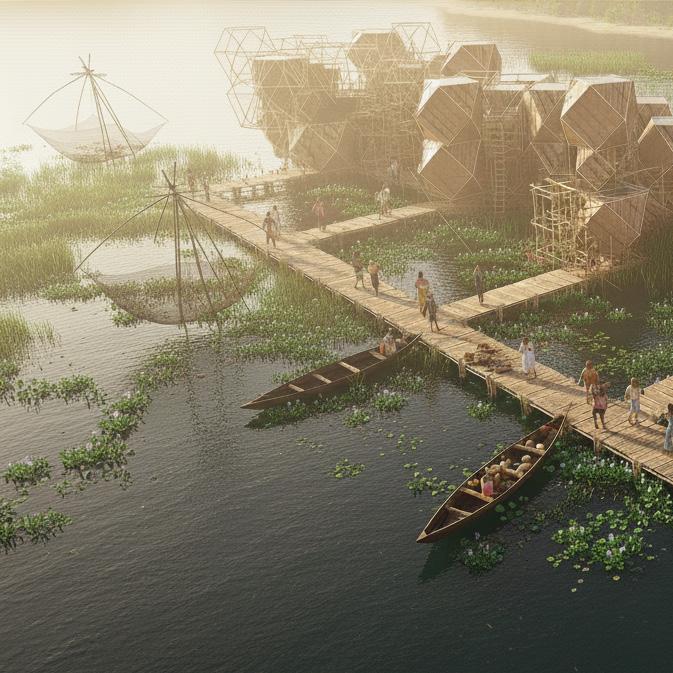
Recognising the recurring nature of floods and the instability they bring, the area of intervention focuses on the dynamic edge of the riverbank in Majuli, where displacement has become an annual reality for many. This stretch of land, although vulnerable, is deeply tied to the community’s way of life, economically, spiritually, and socially. Rather than relocating populations away from the river, the intervention proposes to embed resilience within the existing landscape by creating a permanent settlement system that works with the river and not against it. The objective is to offer continuity, to ensure that even during high flood events, residents can remain close to their land, sustain their livelihood practices, and participate in cultural rituals, especially those associated with the Satras and seasonal festivals. The project aims to convert flood risk zones into adaptive living environments through spatial rethinking and ecological integration.
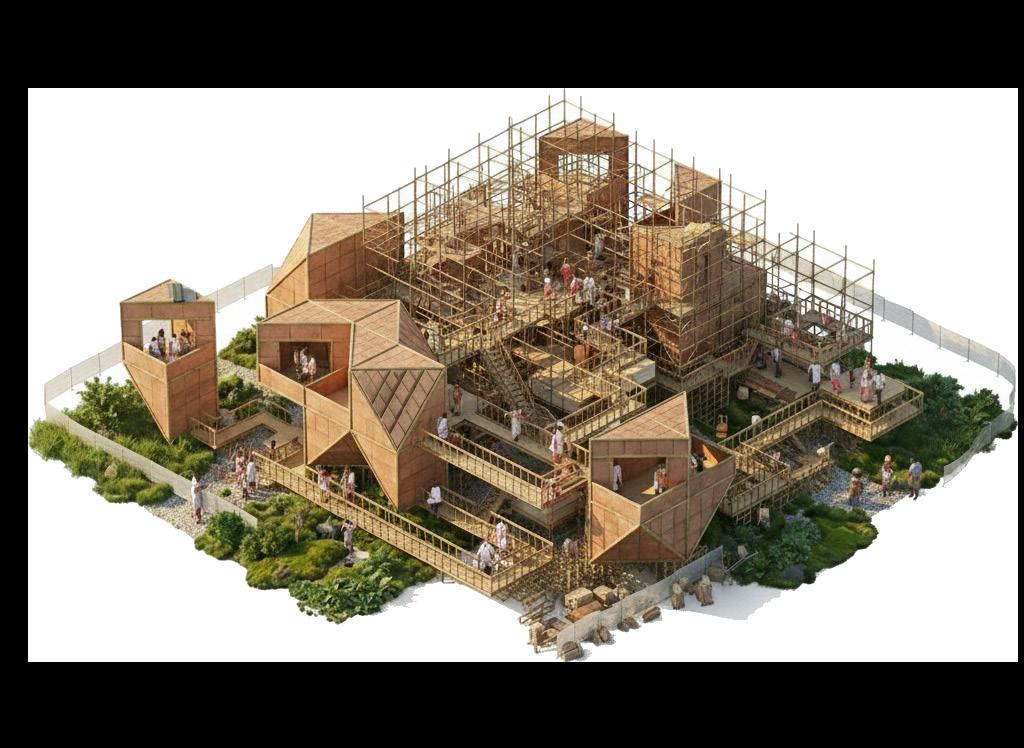
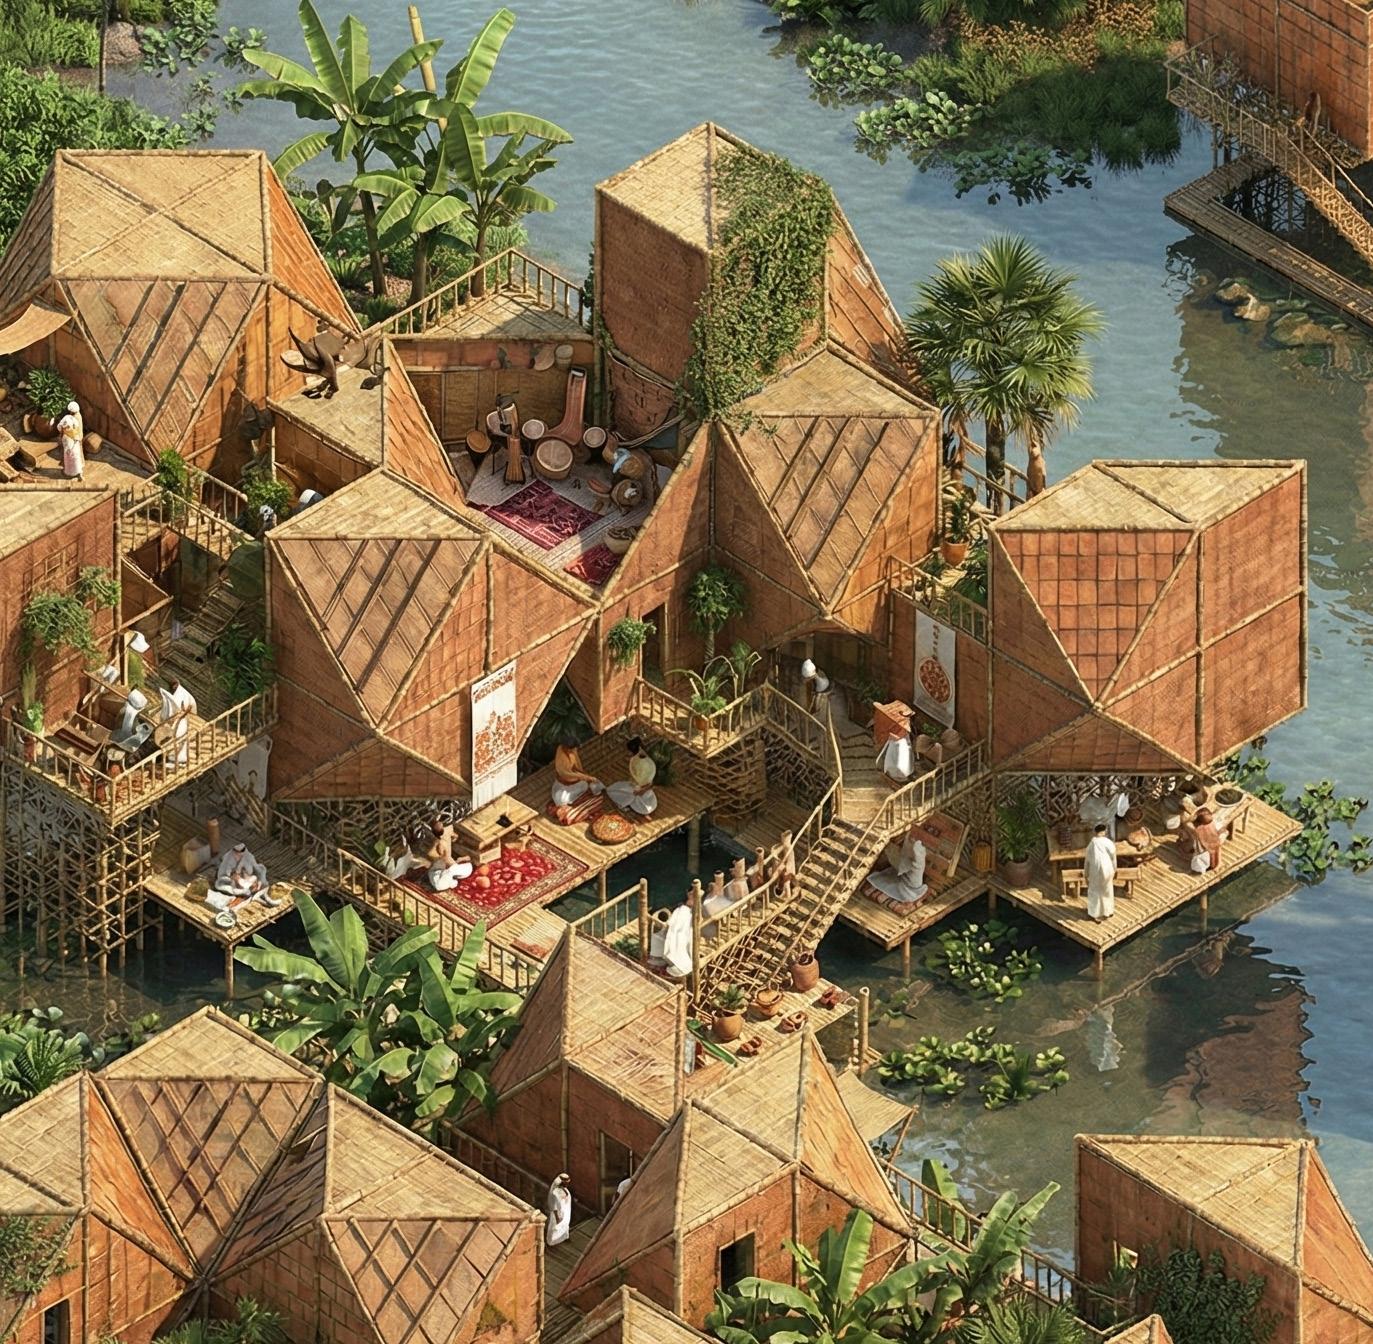
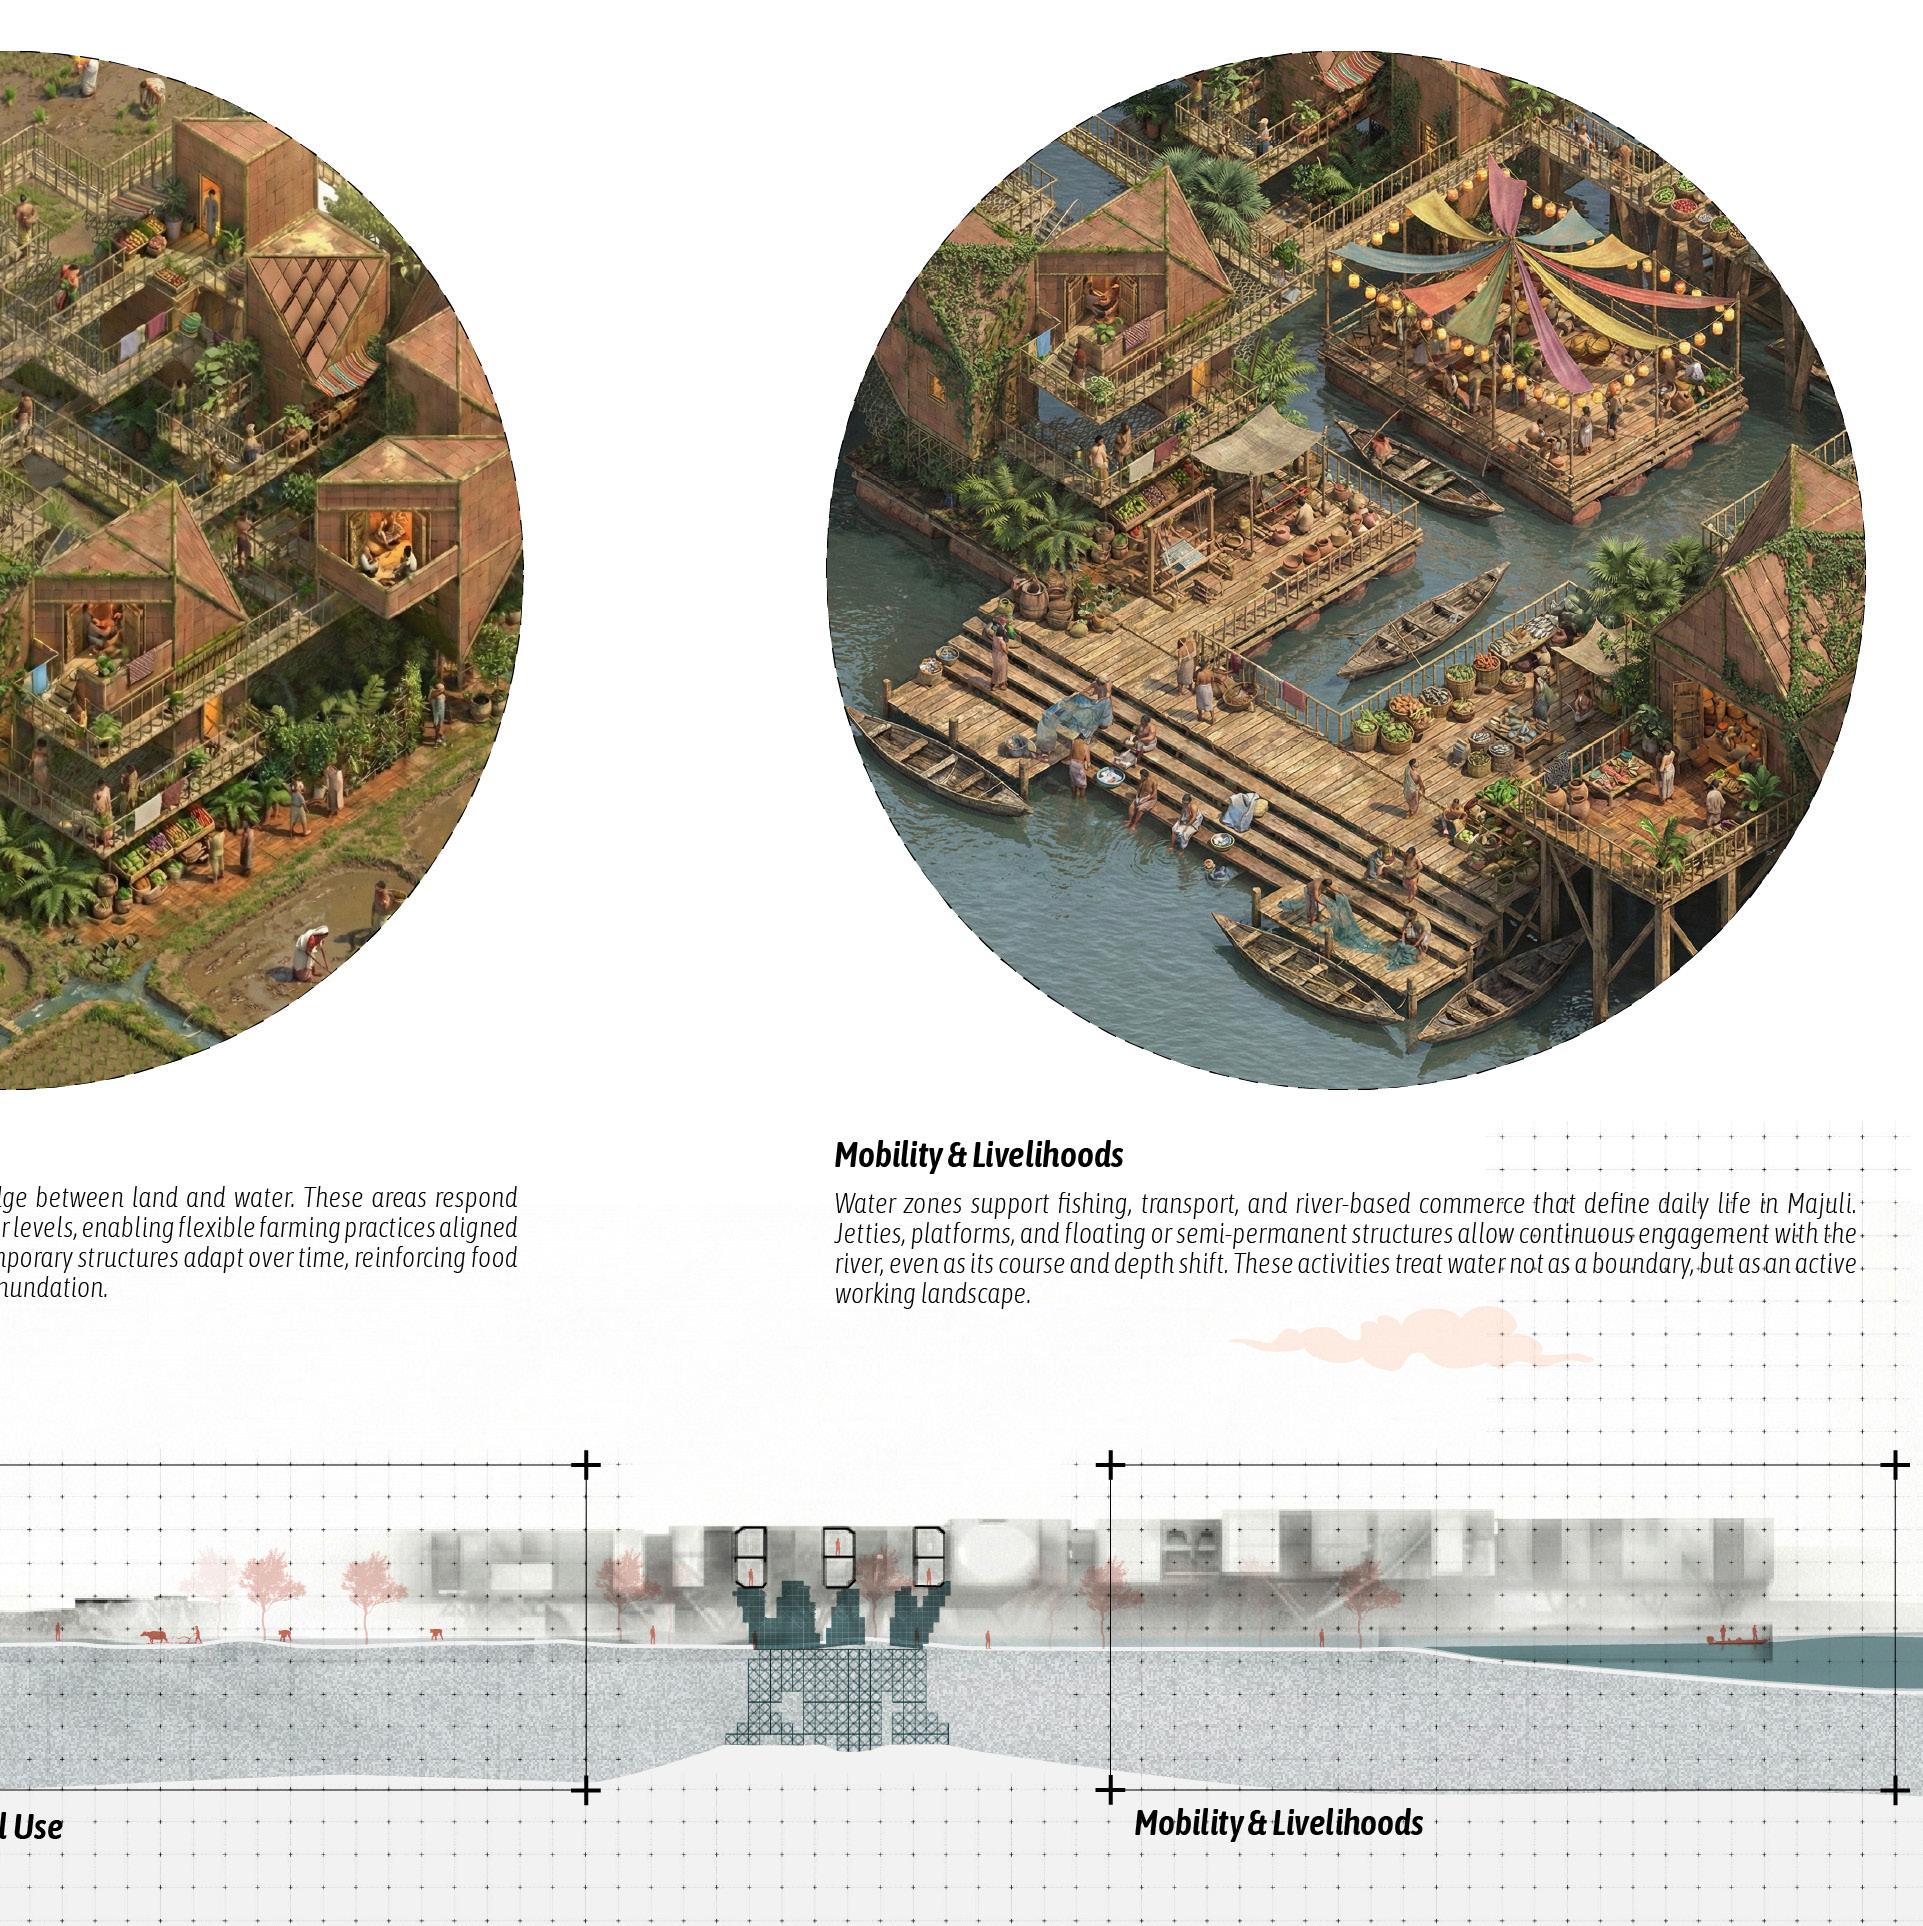
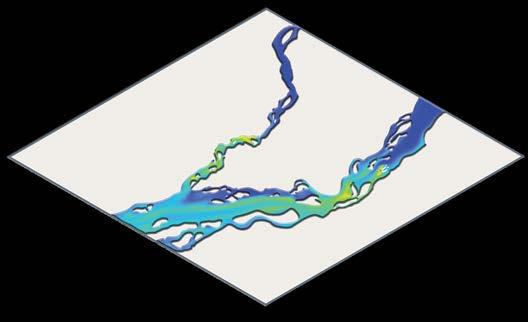
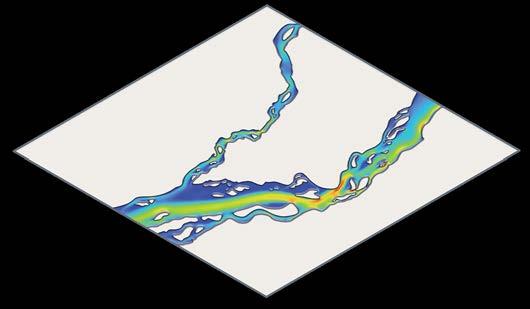
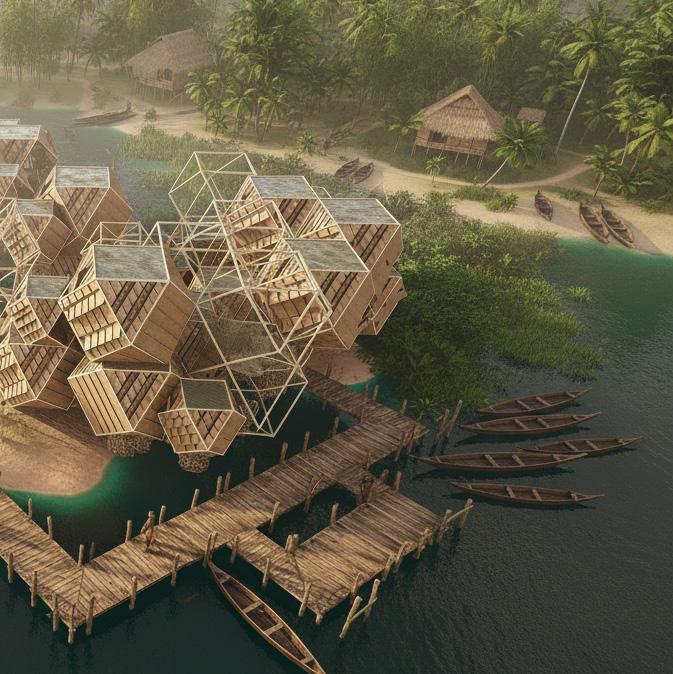
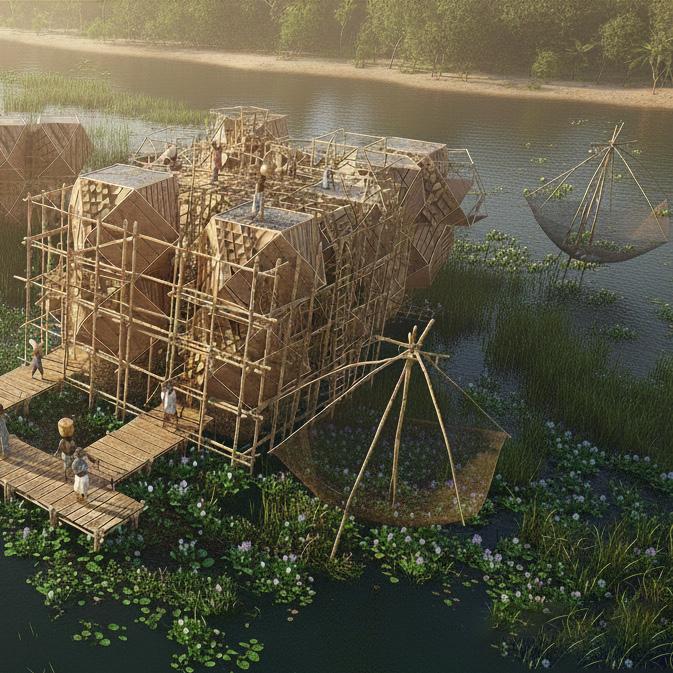
The design is sited along sediment-stable river patches identified through hydrodynamic simulations and soil analysis, ensuring safe and buildable ground. The design program consists of modular housing clusters elevated on treated bamboo stilts, integrated with aquaculture systems and productive landscapes. Each cluster is organised to maintain proximity to cultural nodes like Satras, facilitating continued participation in spiritual and communal life. Shared communal spaces, such as prayer decks, floating gathering platforms, and seasonal performance spaces, are embedded within the cluster layout, ensuring cultural continuity. This integrated approach ensures that the settlement remains functional, self-sufficient, and culturally rooted, even in the face of environmental uncertainty.
Fig. 38 : Area of intervention and identification of core issue, Created by Author
Fig. 50 Area of intervention and identification of core issue, Created by Author
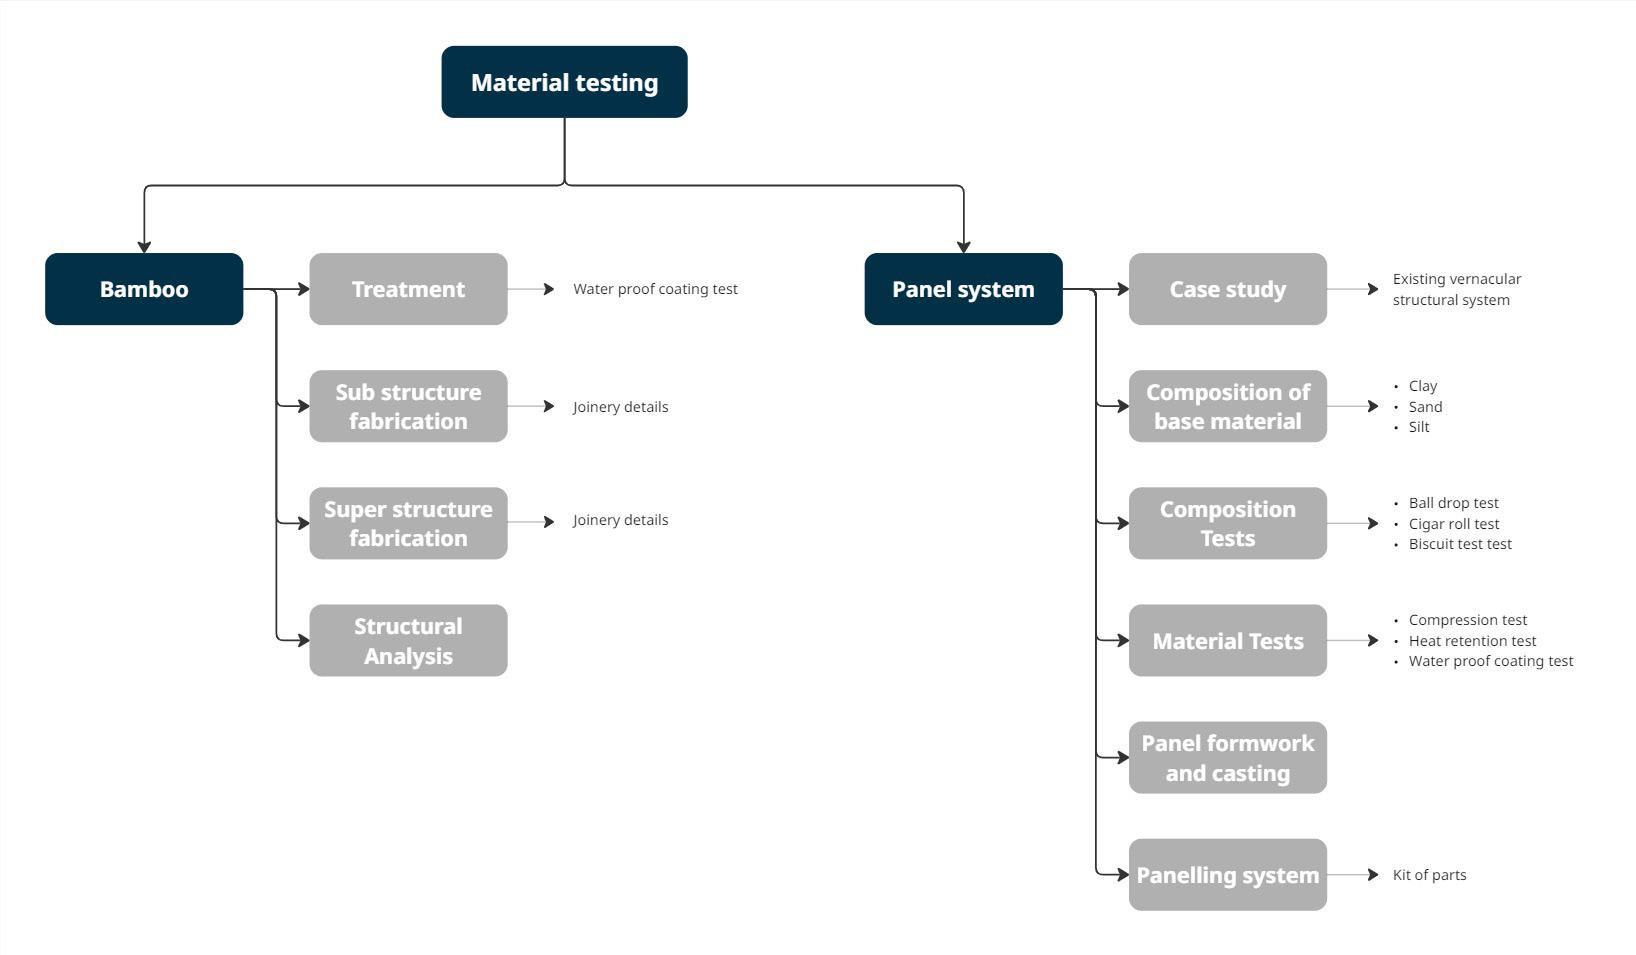
Material Experimentation and Prototyping
Existing materials of interest in Majuli
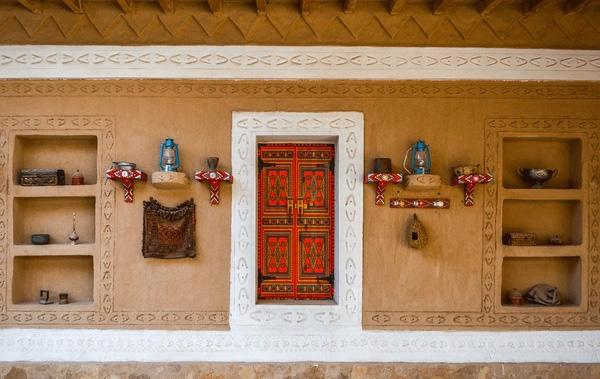
Clay: Vernacular Adaptation and Ecological effects
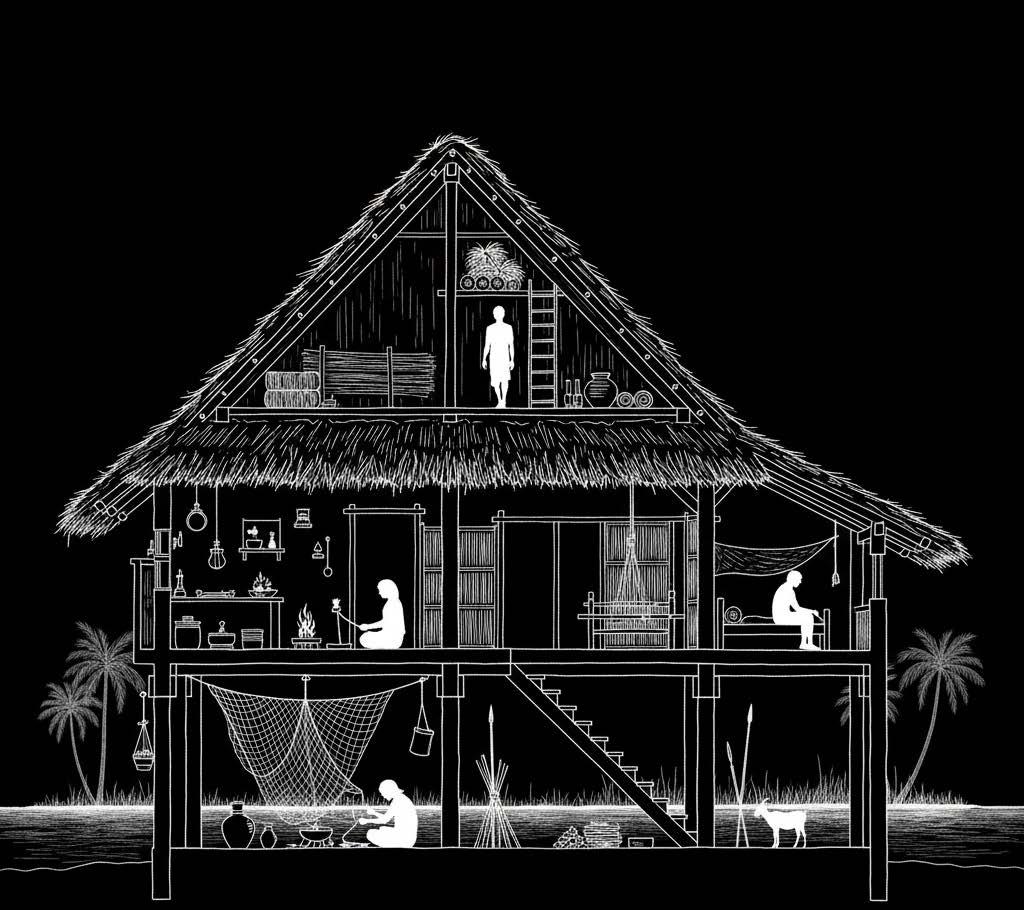
The traditional architecture of Majuli island has historically relied heavily on clay from the abundant alluvial deposits of the Brahmaputra. In the Chang Ghar homes of the Mishing community, clay is frequently mixed with straw or cow dung to plaster bamboo frameworks, making them more fire and bug resistant (Sharma, 2016).
Clay's readily available nature and low embodied carbon footprint continue to be important benefits as climate change speeds up erosion and flooding. According to research, clay's resistance to water damage can be further increased while maintaining its ecological and cultural advantages by adding stabilisers such as lime or local ash (Goswami, 2014). While adjusting to the demands of the future climate, these improvements may help preserve Majuli's legacy of traditional architecture.
Source : Sharma, S. (2016). Traditional Housing of the Mishing Tribe: A Study on Architectural Techniques. Journal of Architecture and Society, 8(2), 15–23. Ahmed, I. (2013). Vernacular Houses of Assam: Typologies and Construction. Assam Heritage Publications.
Saikia, D. (2018). Bamboo and Vernacular Housing in Assam: Lessons from Majuli Island. Built Heritage Journal, 4(1), 77–86.
Goswami, R. (2014). Indigenous Materials in Traditional Houses of Assam: A Case of Majuli. International Journal of Indigenous Knowledge, 2(1), 41–49.
Fig. 52 : Existing traditional clay walls Credits:bijoy_thomas :
Silt : River-Borne Resource and Vernacular Resilience
The Brahmaputra’s periodic floods replenish Majuli’s plentiful supply of silt. This thin soil has historically been used with bamboo frameworks as filler or plaster. Silt applied over woven bamboo walls with organic fibres or binders increases strength and reduces vulnerability to wind and rain (Goswami, 2014). In Mishing Chang Ghars, silt-rich mud plaster creates a multi-layered barrier against shifting weather.
Silt finishes are easy to repair after floods, as residents collect and reapply fresh deposits annually without costly materials, reflecting a cyclical vernacular response (Saikia, 2018). Its fine particles aid smooth application, and with stabilisers like lime or cow dung, silt resists cracking and improves water resistance (Ahmed, 2013).
Beyond practical benefits, silt use holds cultural value, linking communities to the river’s rhythms. As climate change intensifies flooding, it remains a low-impact, regenerative solution. Hybrid stabilisation with minimal cement-lime blends could extend durability while preserving identity and sustainability (Sharma, 2016).
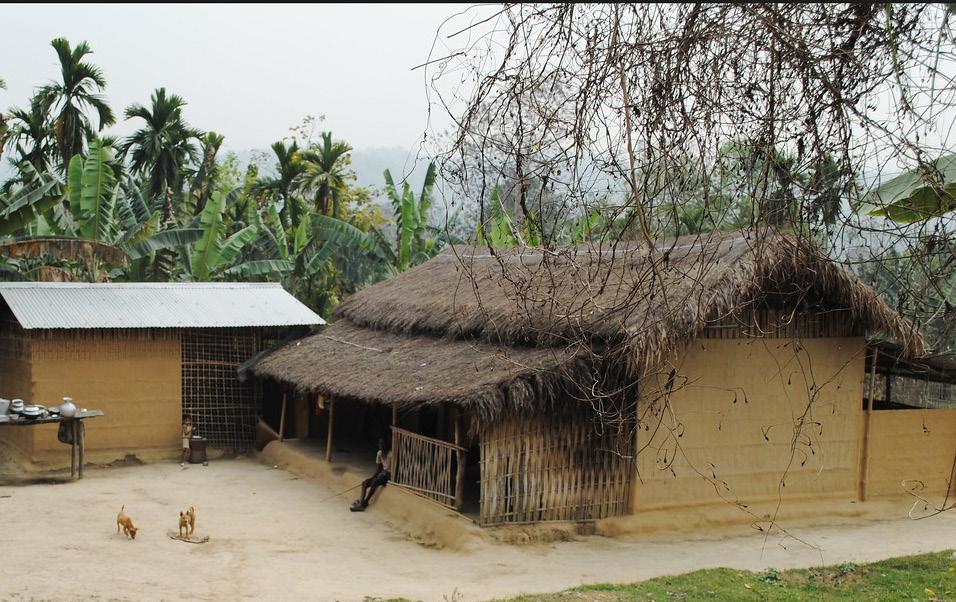
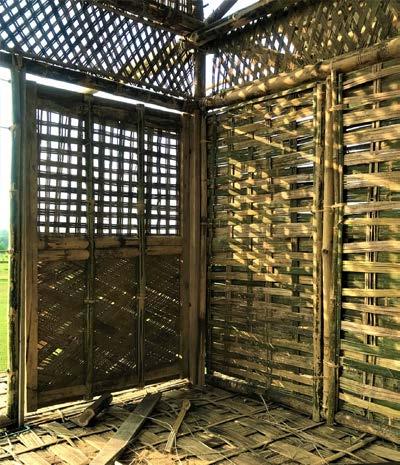
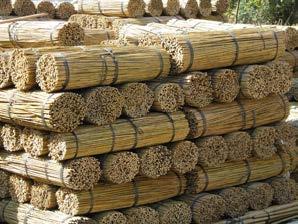
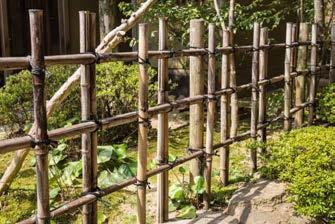
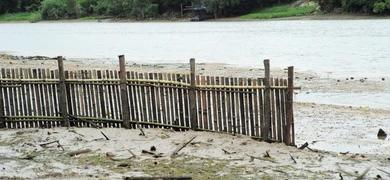
Bamboo : Structural Backbone of Vernacular Heritage
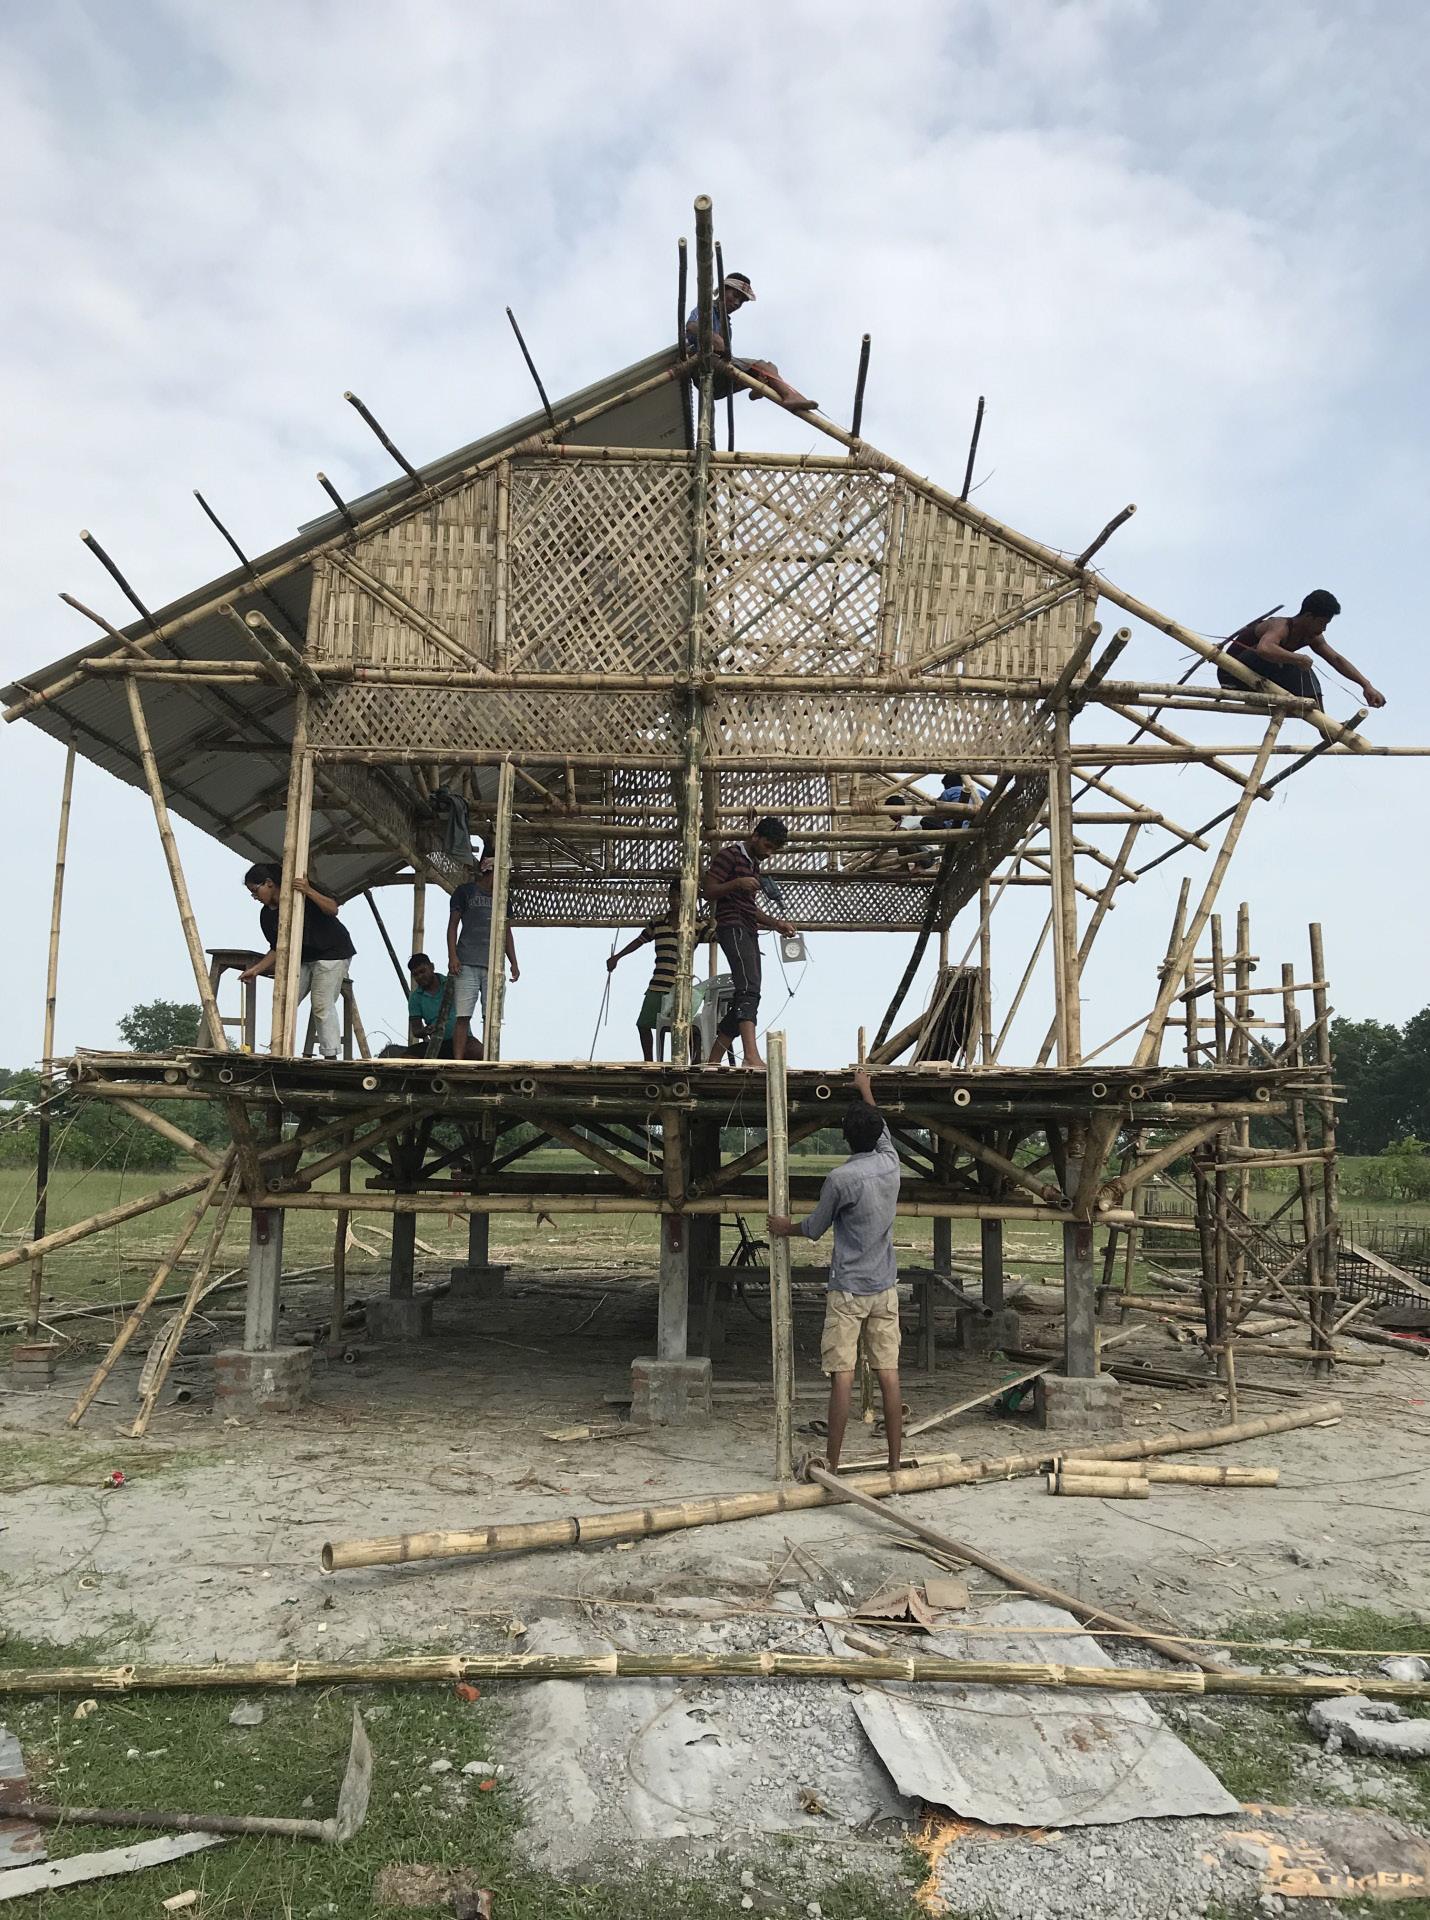
Bamboo remains one of the most critical materials in Majuli’s construction practices due to its tensile capacity, rapid renewability, and durability in humid climates. Cultivated extensively along the Brahmaputra floodplains, it forms the primary framework of Chang Ghar (stilt houses)(Saikia, 2018).
Structurally, bamboo’s high strength-to-weight ratio allows frameworks to flex under flood pressure or wind loads, reducing catastrophic failure. Beyond performance, bamboo encourages decentralised construction methods. Its light weight and workability with simple tools allow local communities to harvest, assemble, and repair structures independently, minimising costs and reliance on external resources. Recent advances explore hybrid systems, using natural preservatives, resin coatings, or mechanical fasteners to extend service life without undermining ecological or cultural value (Sharma, 2016).
Fig. 53 : Existing traditional Woven bamboo mats and frames in Majuli, Credits Vicky Achnani, Oscar Espinosa
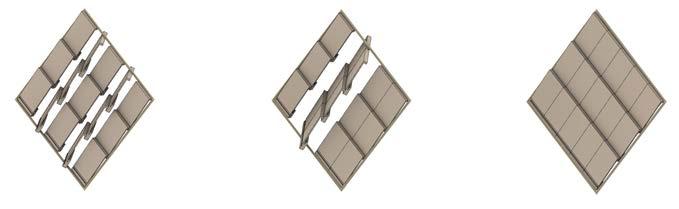
Fig. 54 : Existing Vernacular construction method
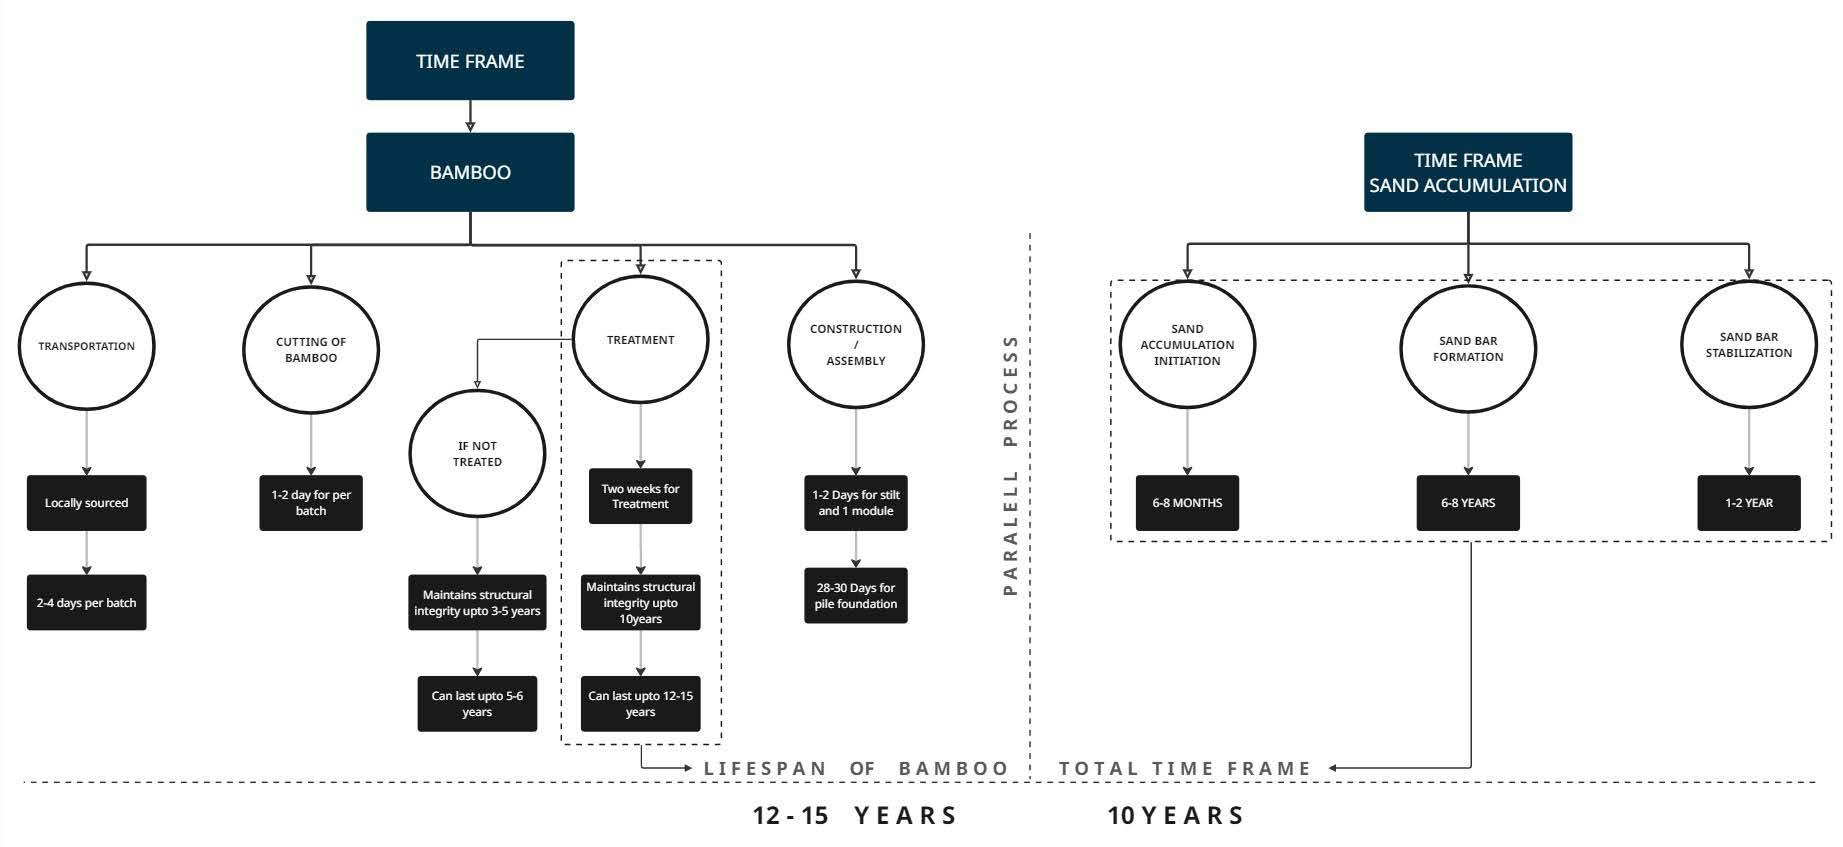
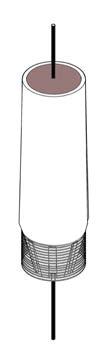
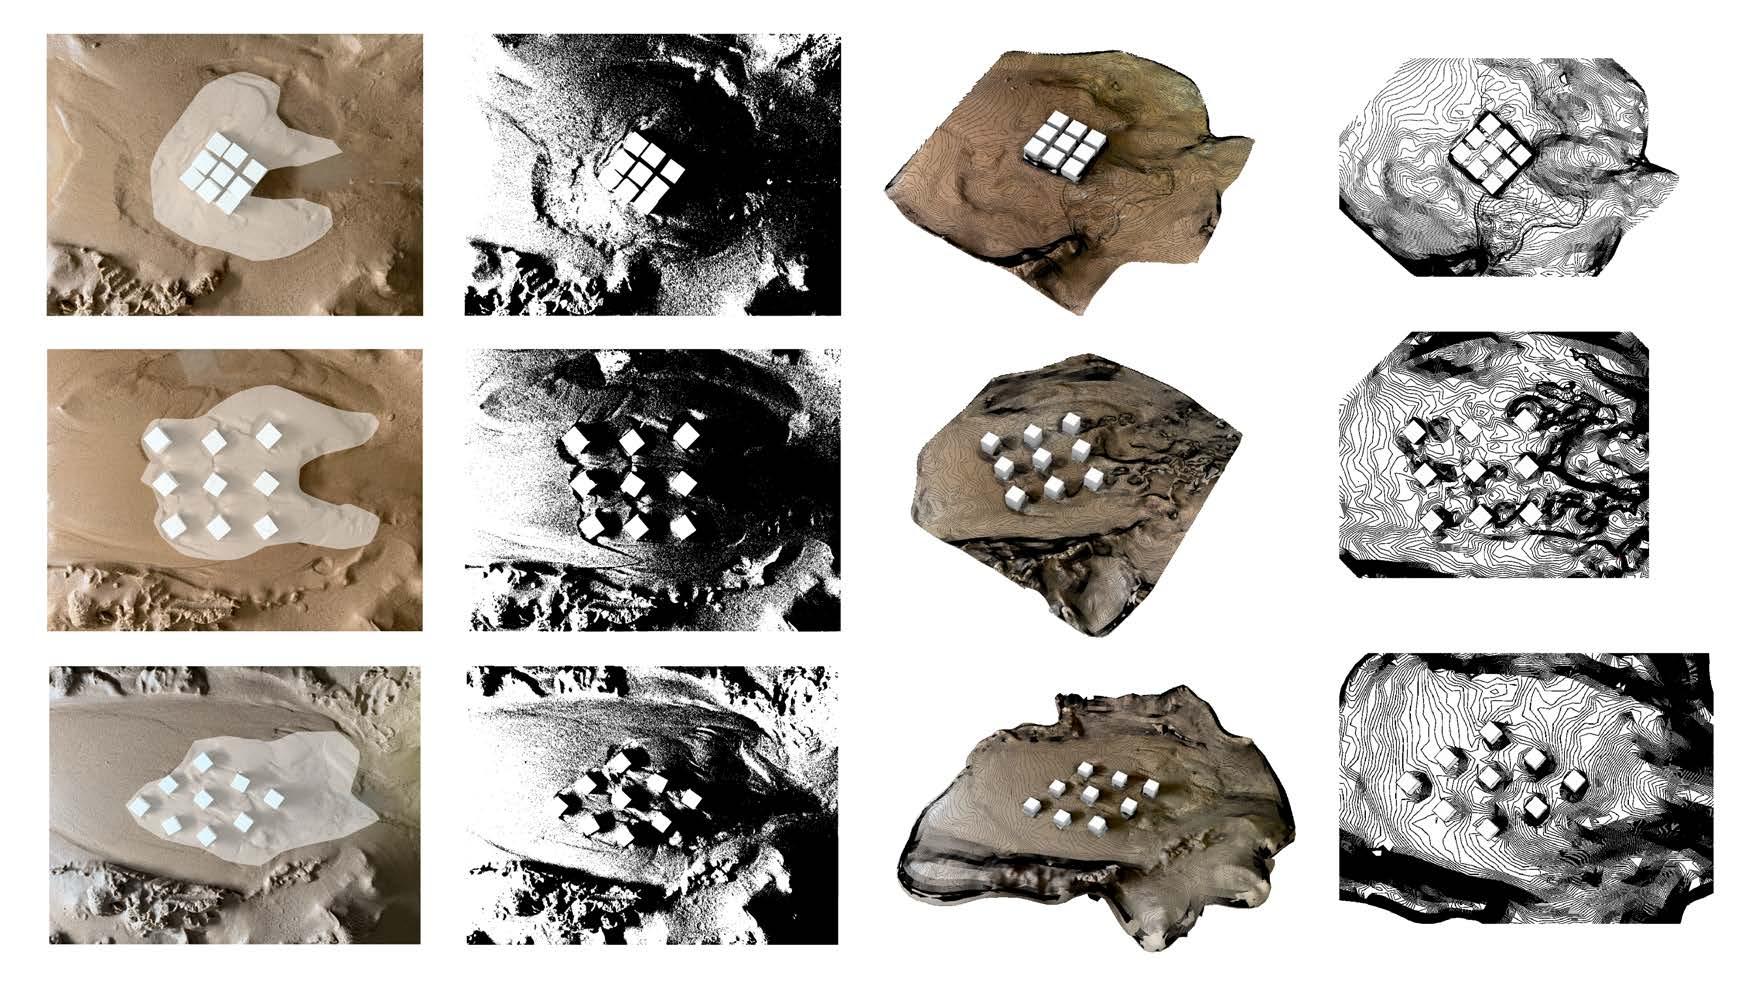
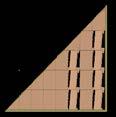
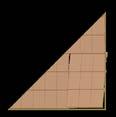
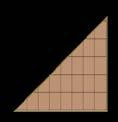
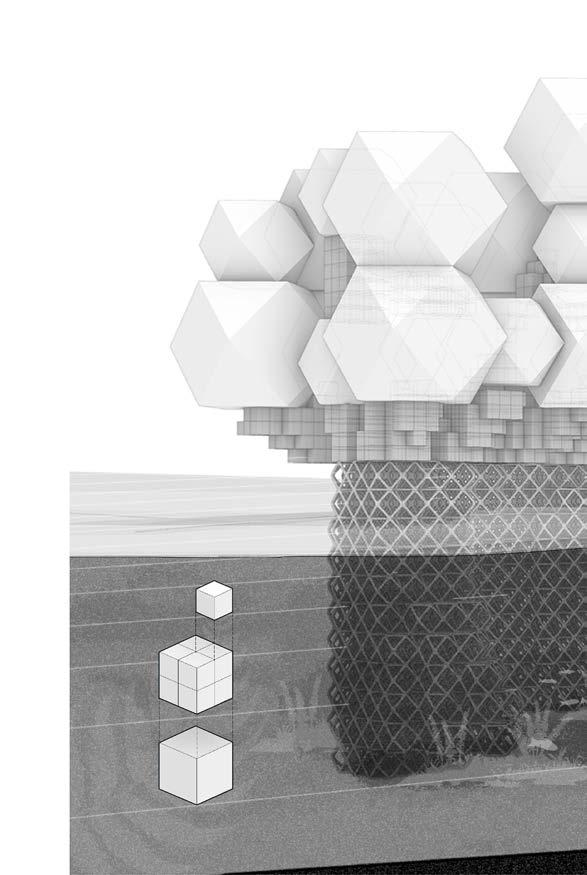
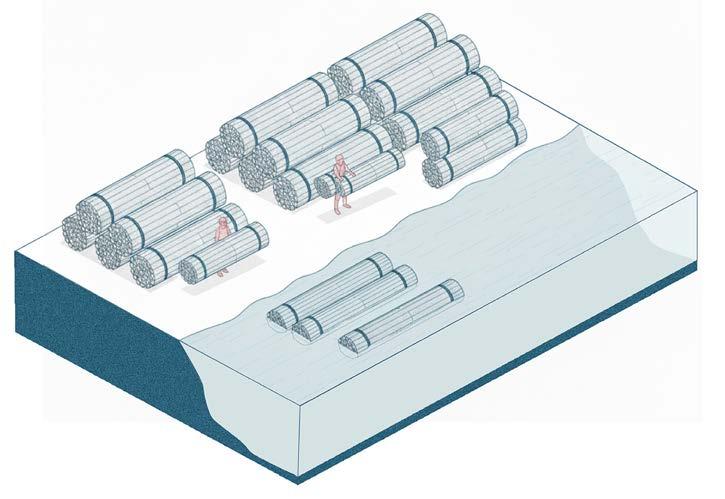
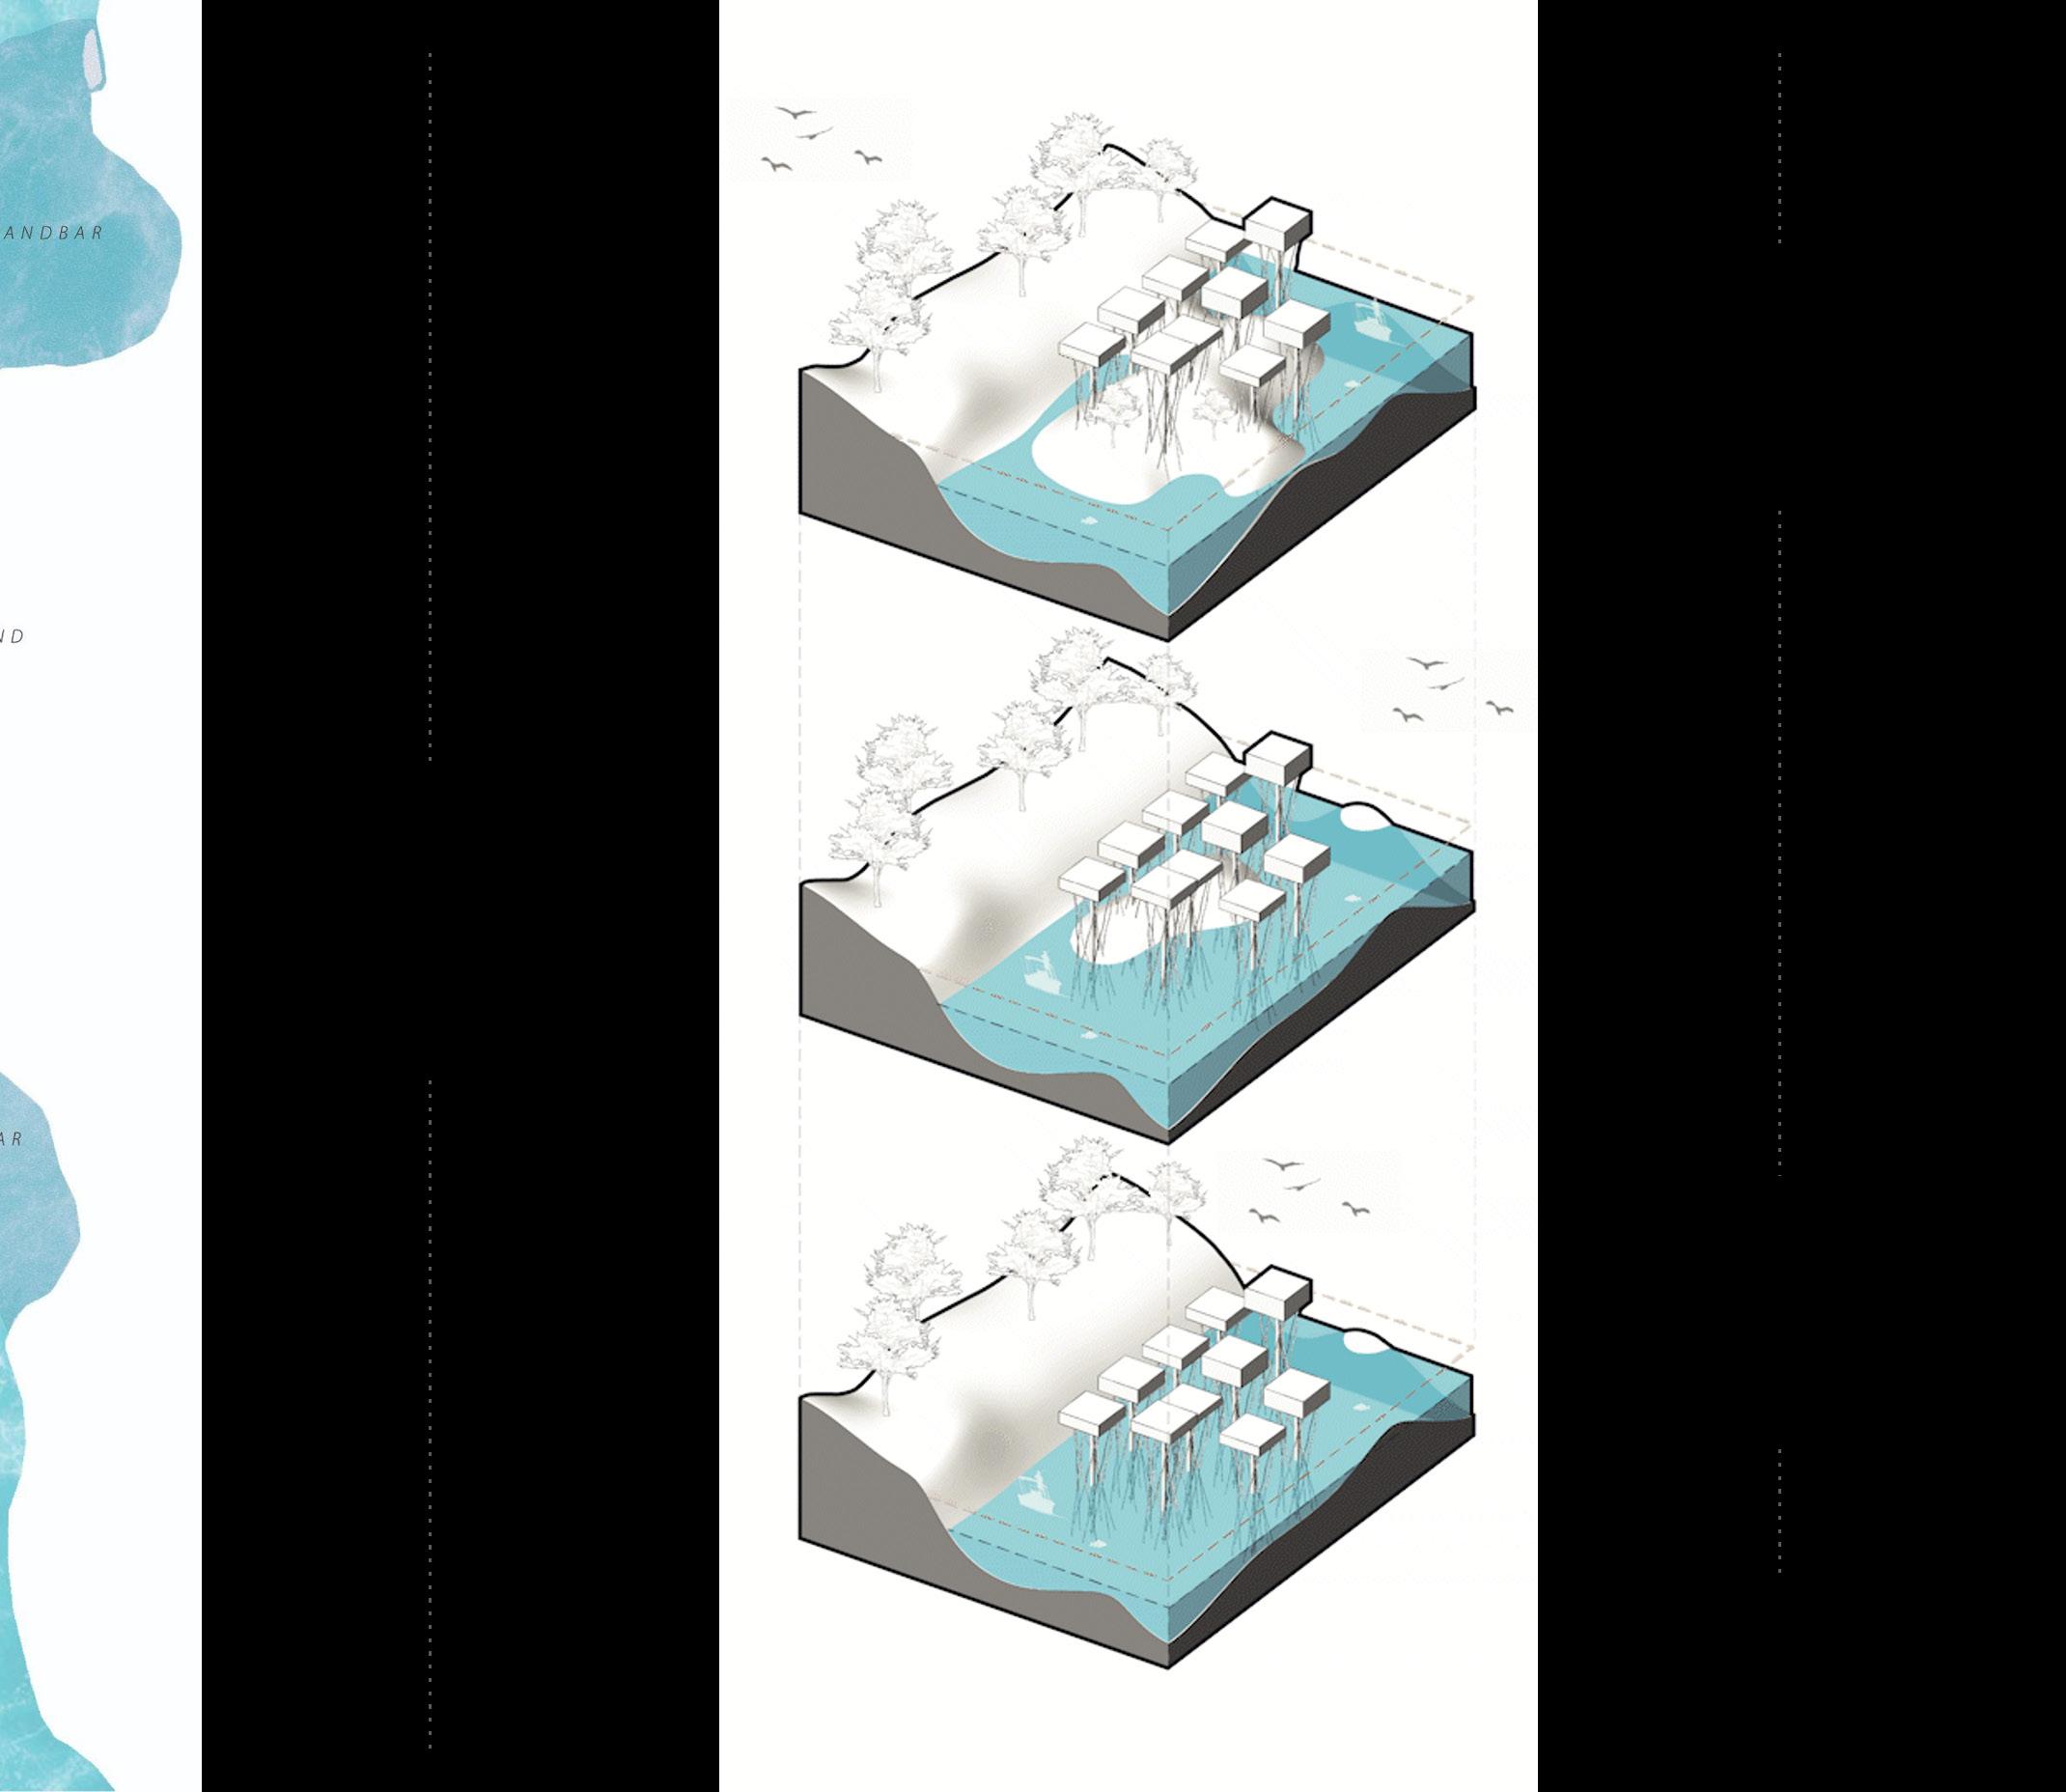
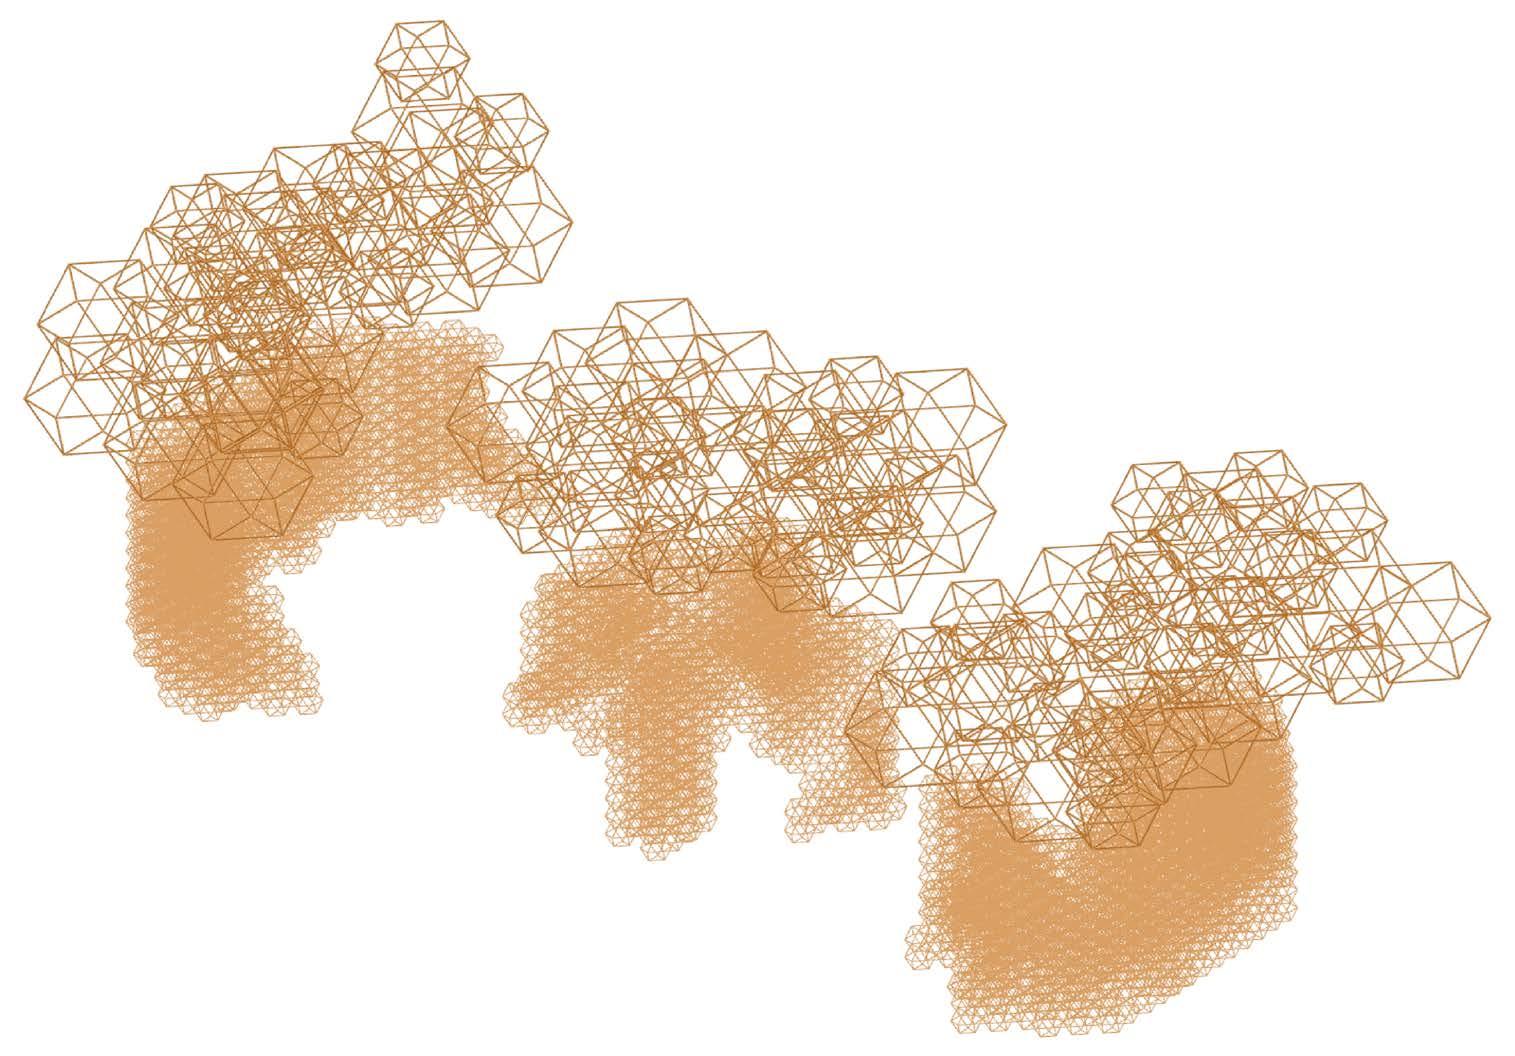
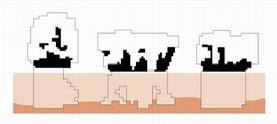
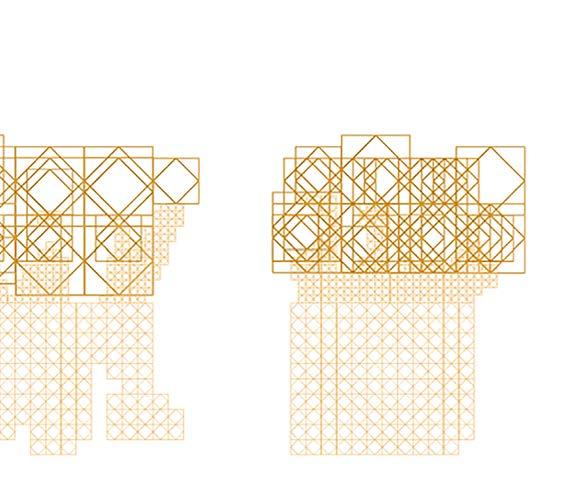
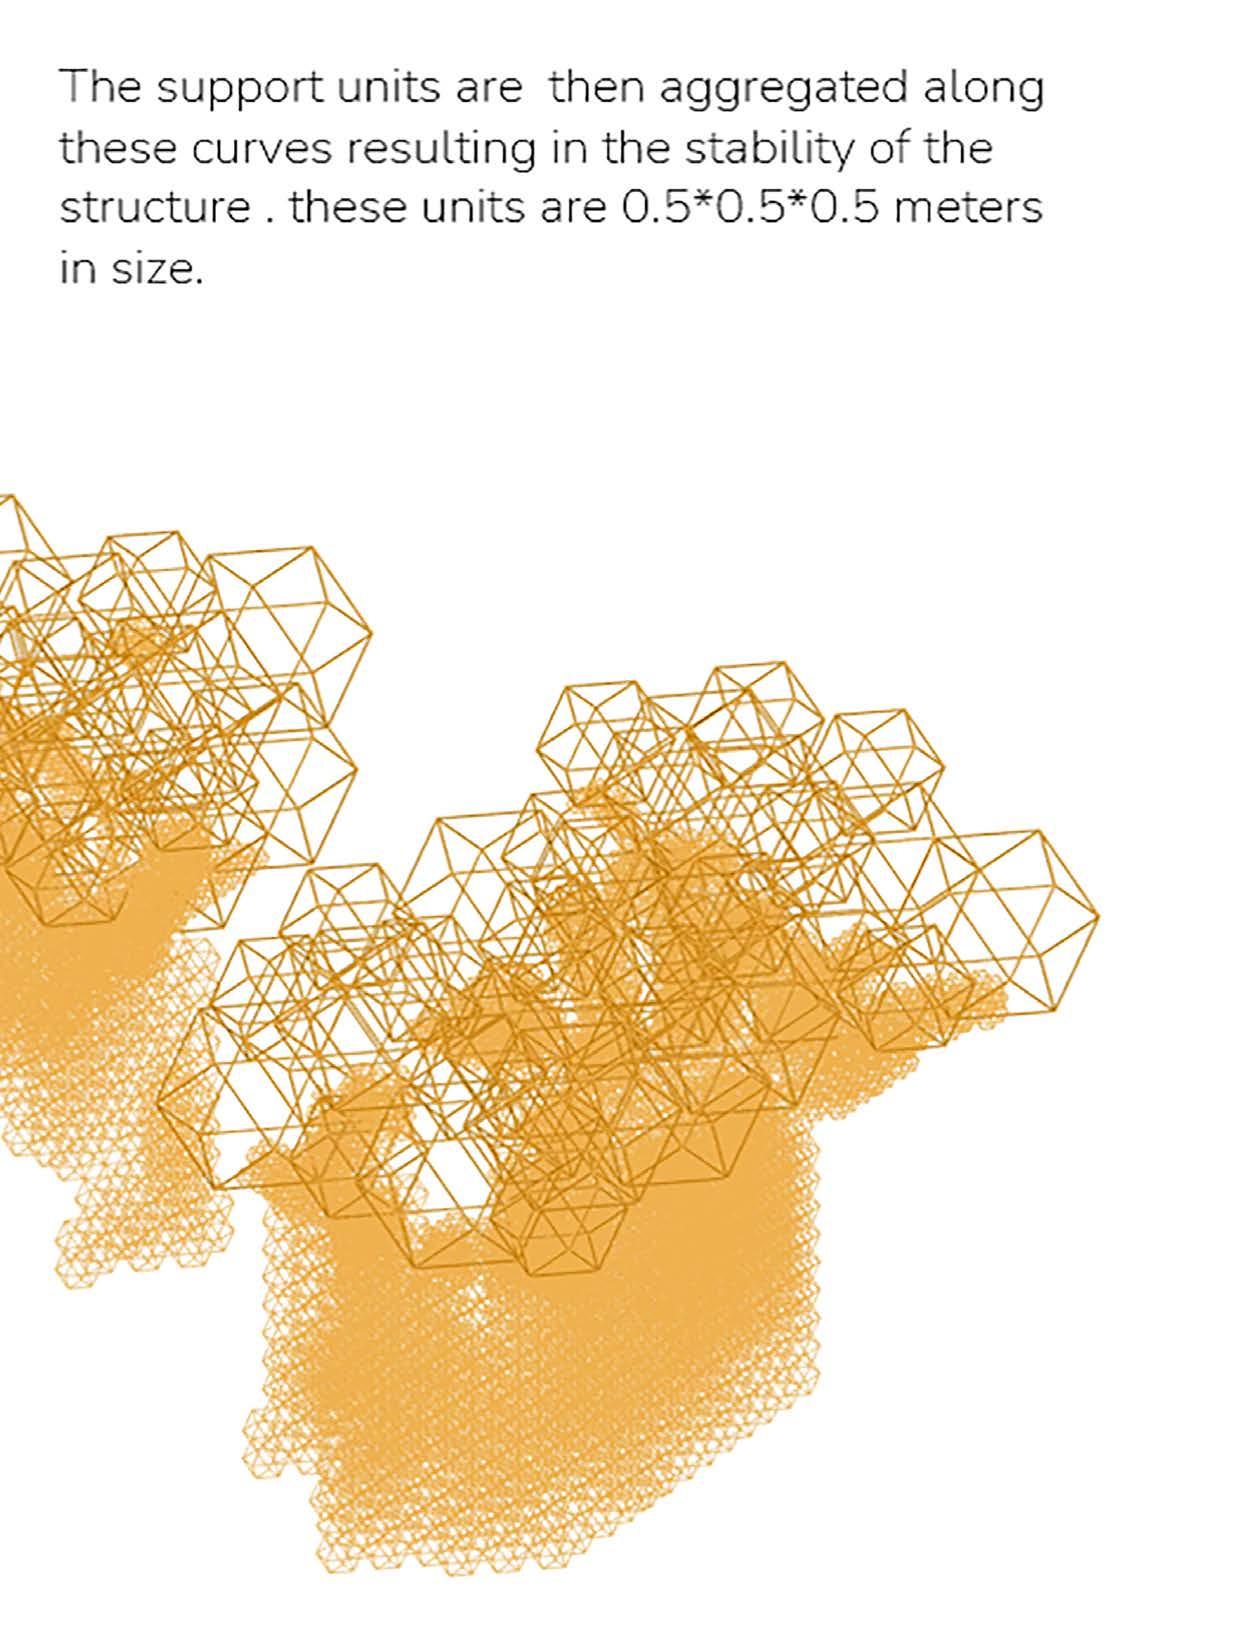
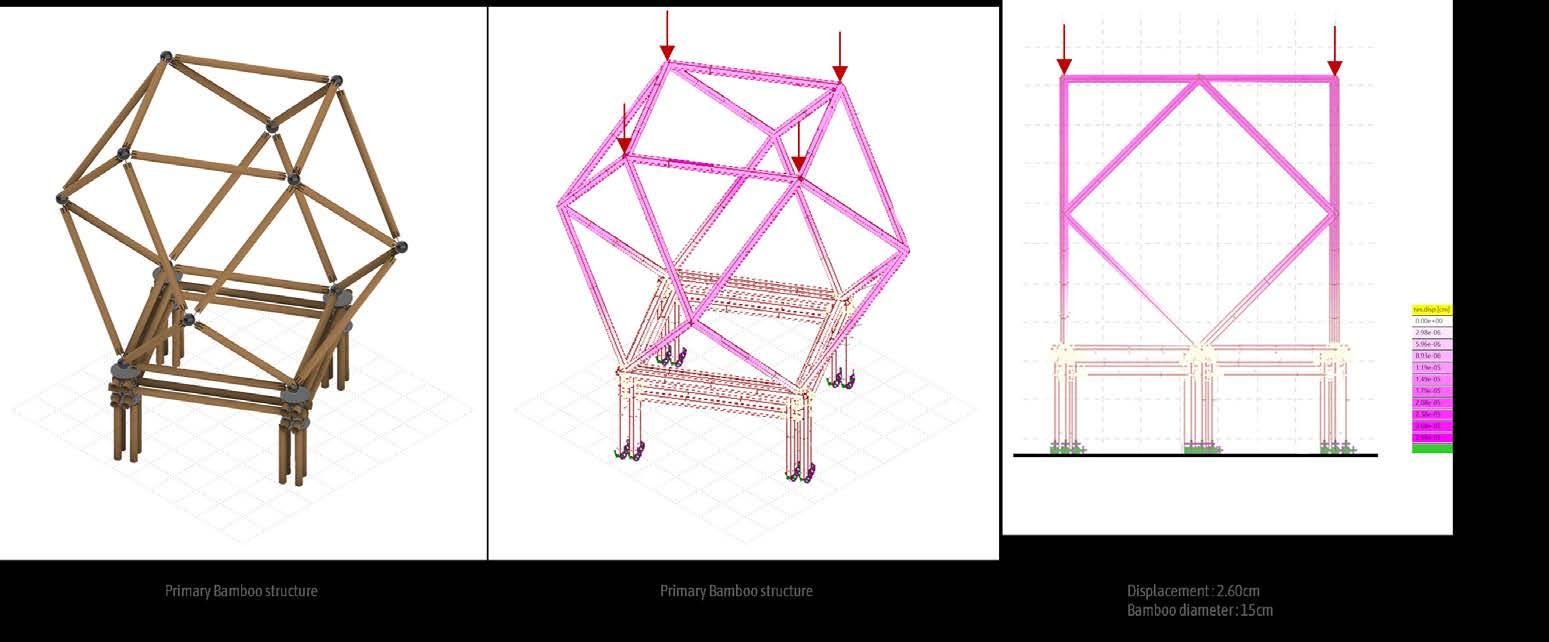
The bamboo structure and the natural cycle of sand accumulation in the water depict a parallel timeline and are intentionally aligned to work together. The bamboo construction process begins with local sourcing, cutting, treatment, and assembly. When treated, bamboo can last 12–15 years before it starts to degrade. This lifespan sets the overall timeframe for the structure’s functional use in water which is basically associated with the sediment deposition.
On the other hand, the sand accumulation process follows its own natural process. It begins with initial sediment deposition over the first 6–8 months, followed by sandbar formation over the next 6–8 years, and finally sandbar stabilisation in the last 1–2 years. By the end of this 10-year cycle, large-scale sediment build-up takes place, and the soil starts to stabilise.
Fig. 55 Evolutionary process timeline, Created by Author
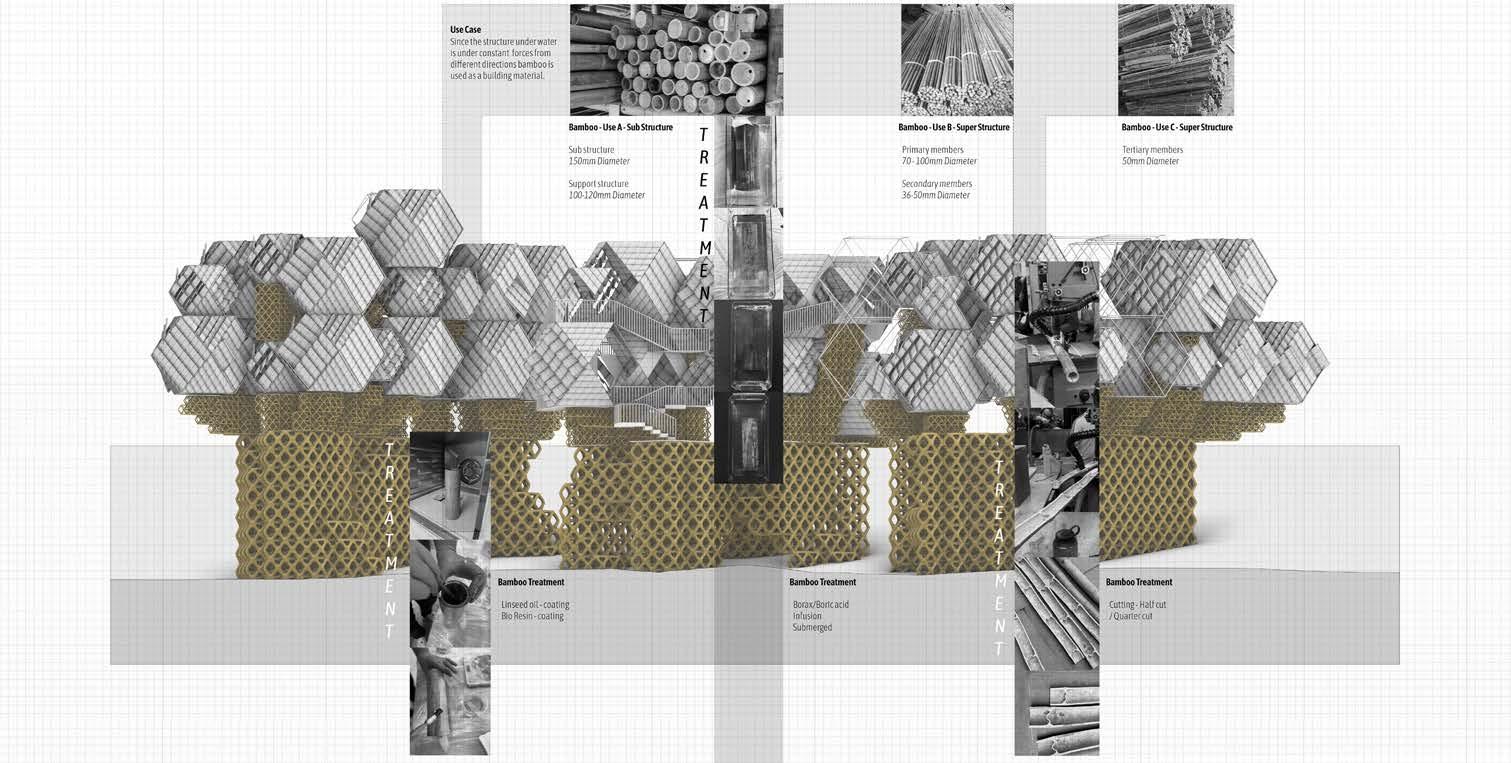
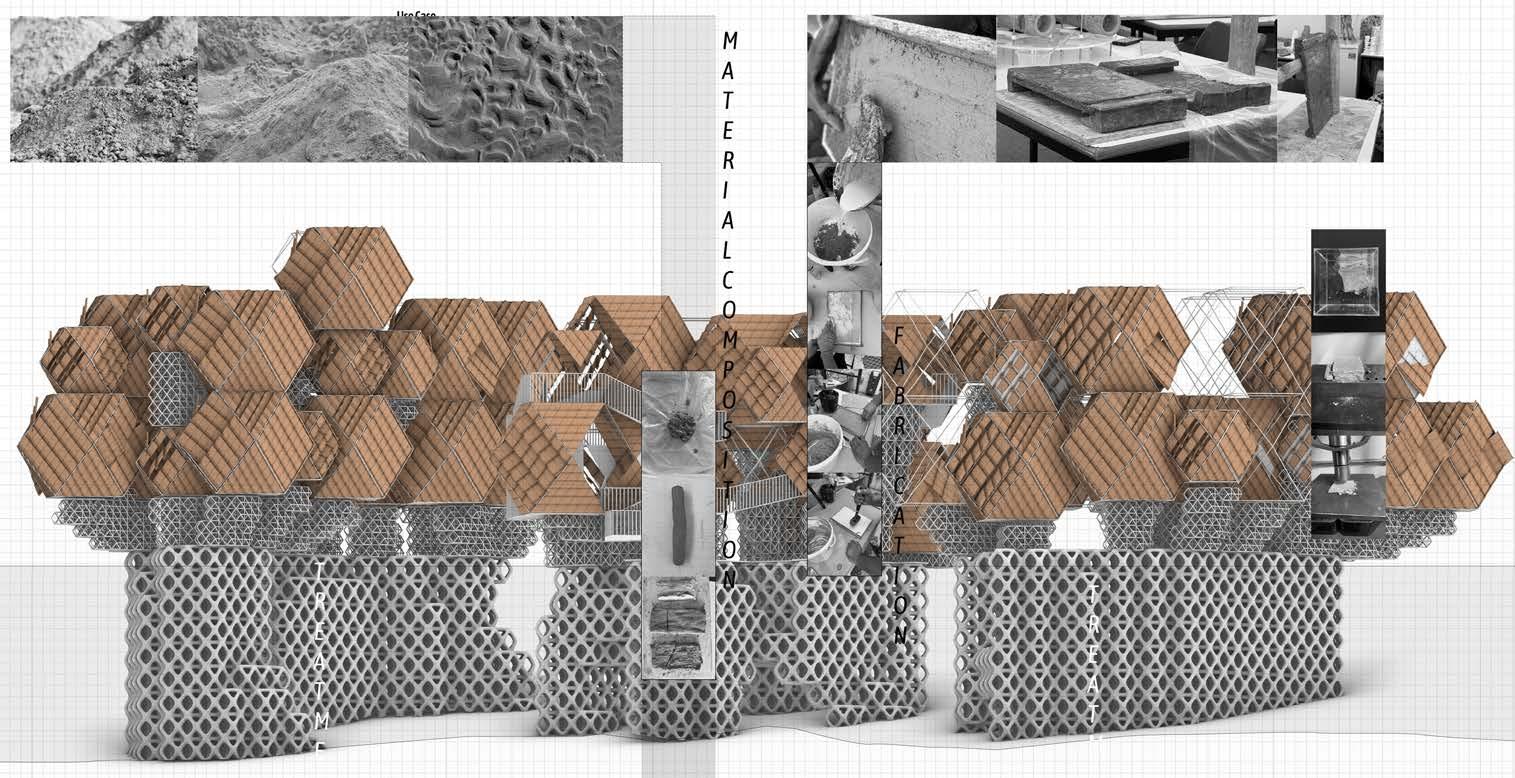
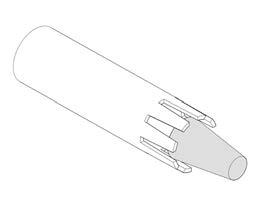
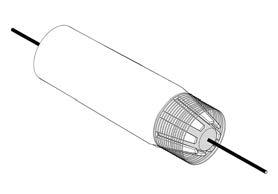
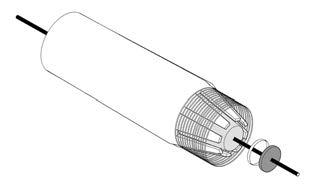
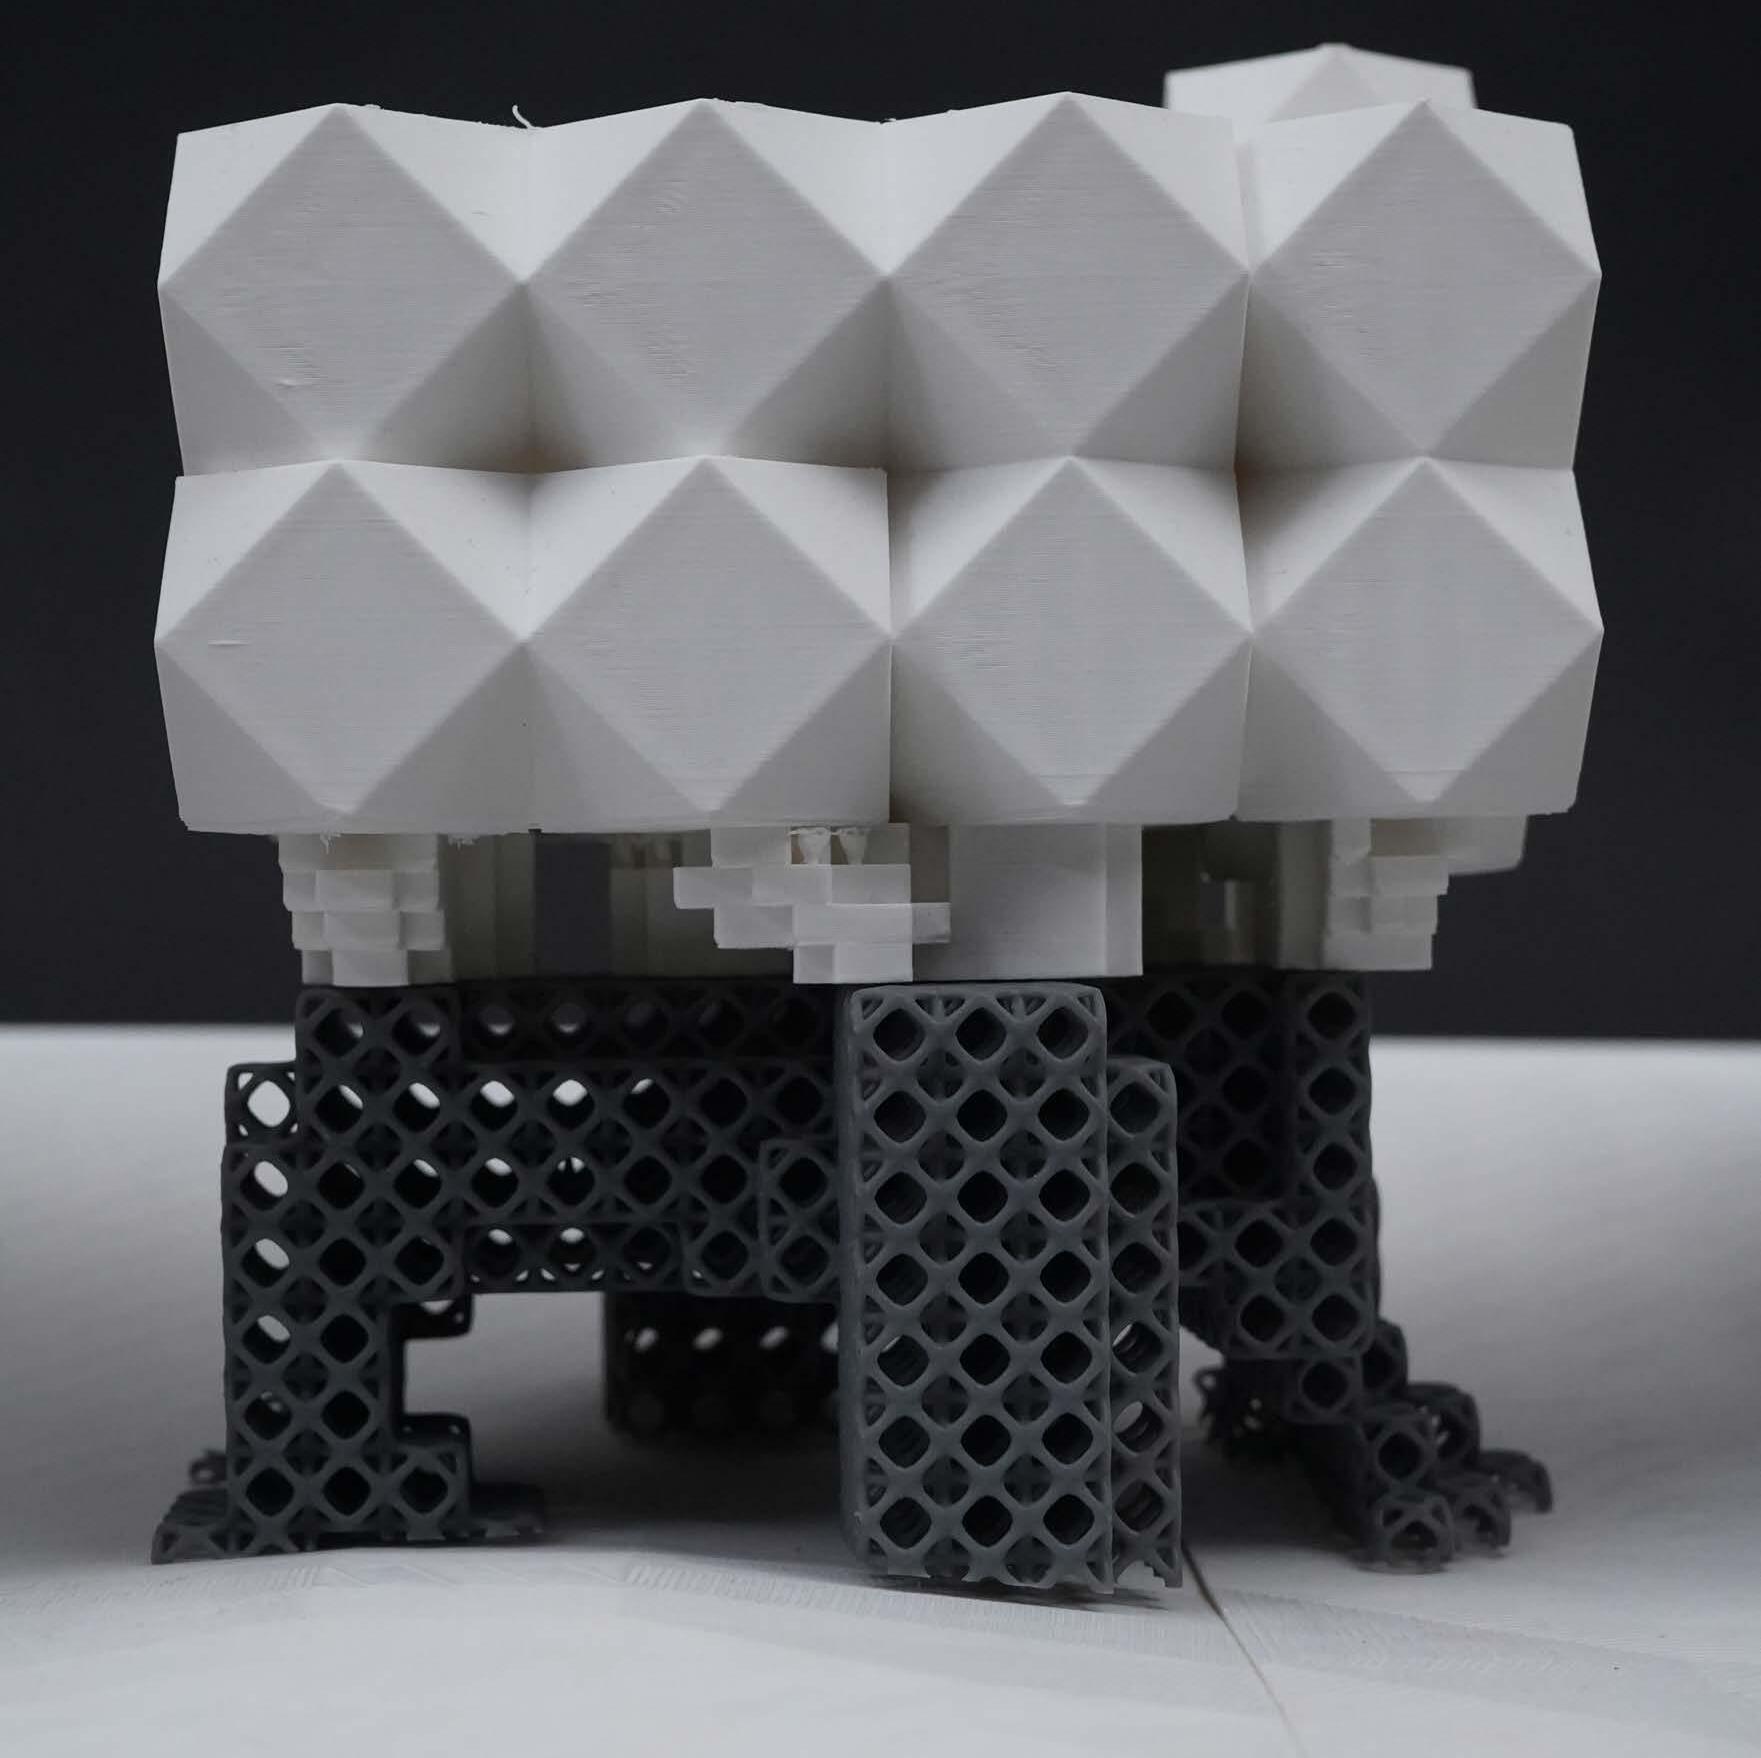
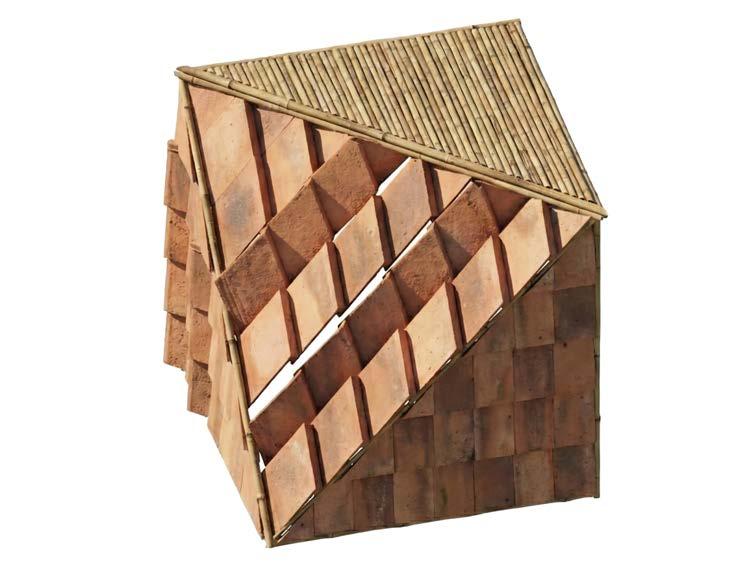
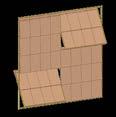
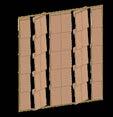
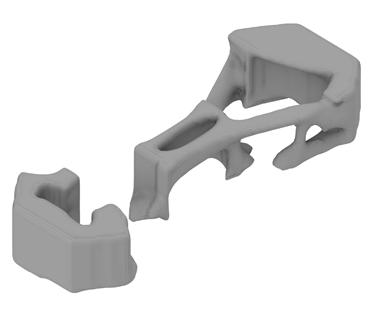
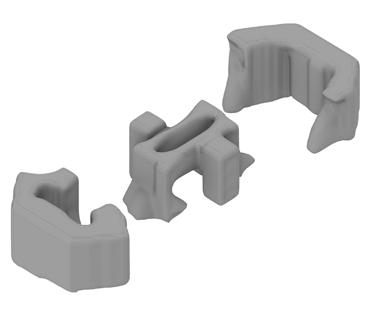
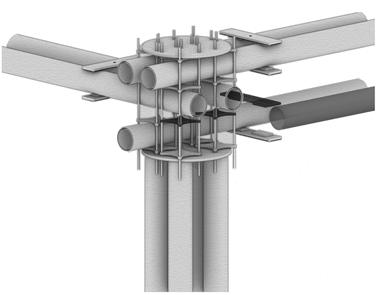
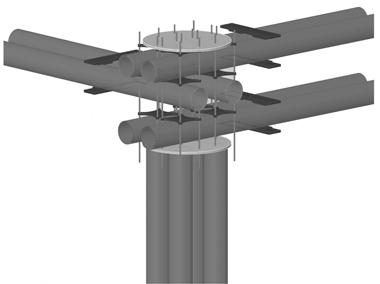
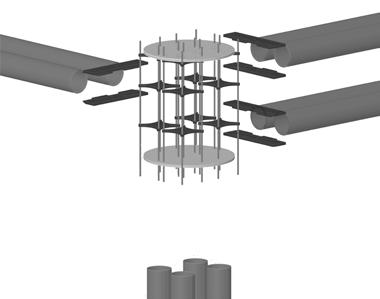
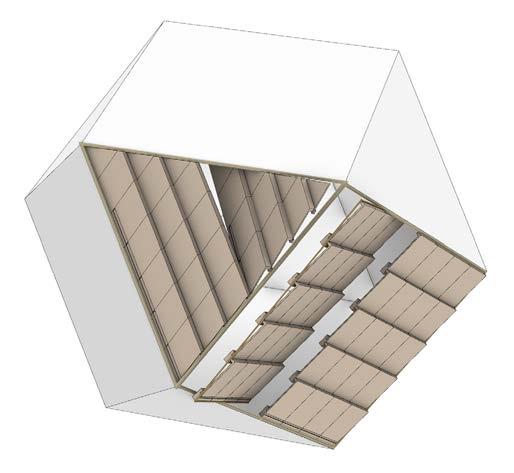
Fabrication and Composition :
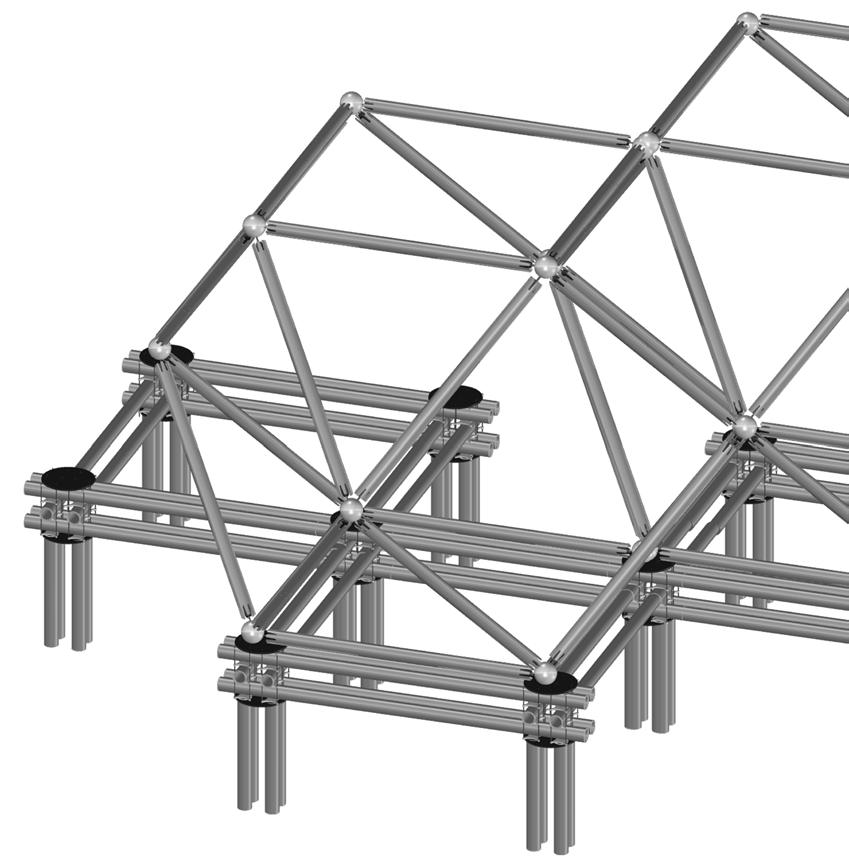
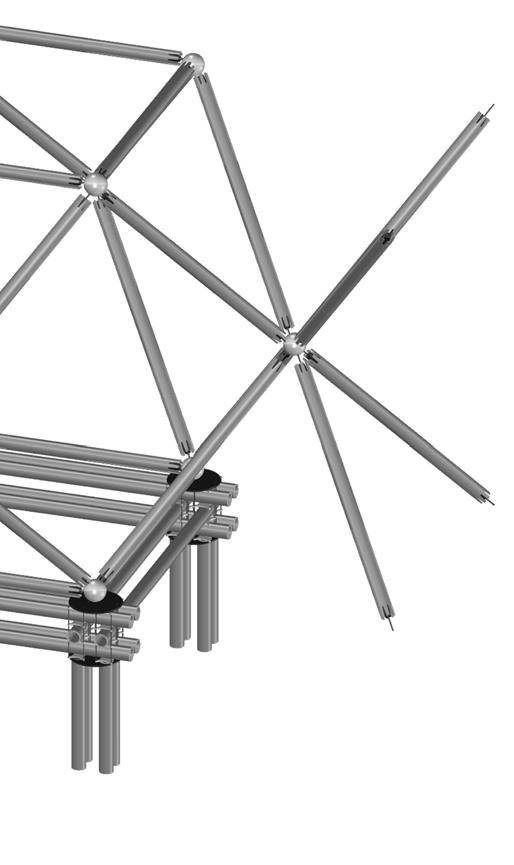
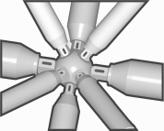
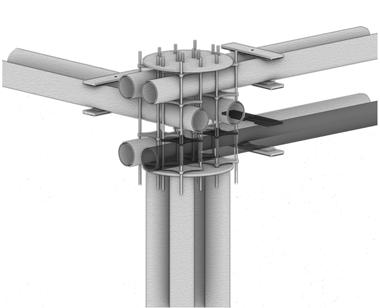
Bamboo Structure
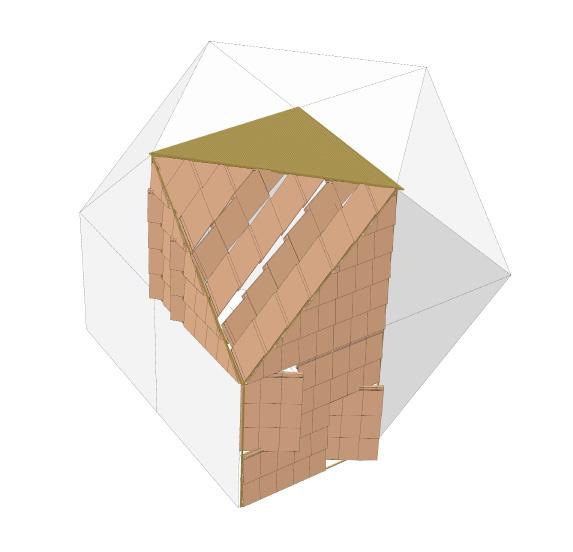
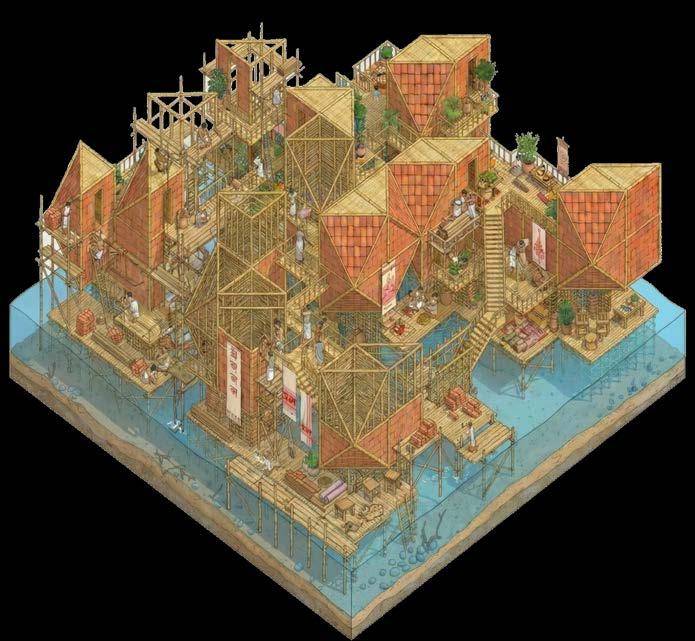
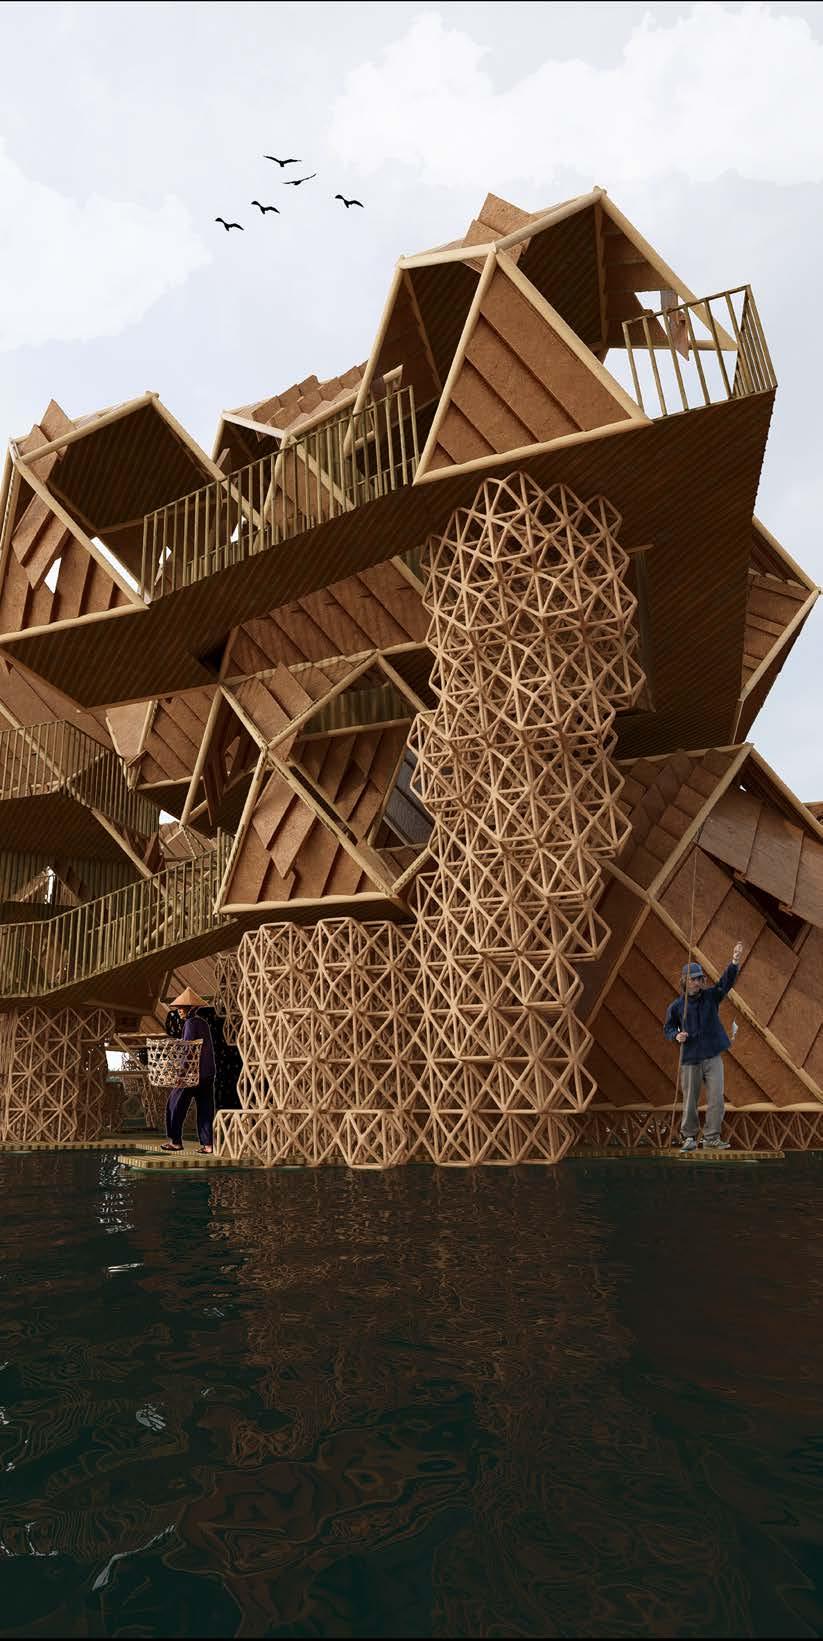
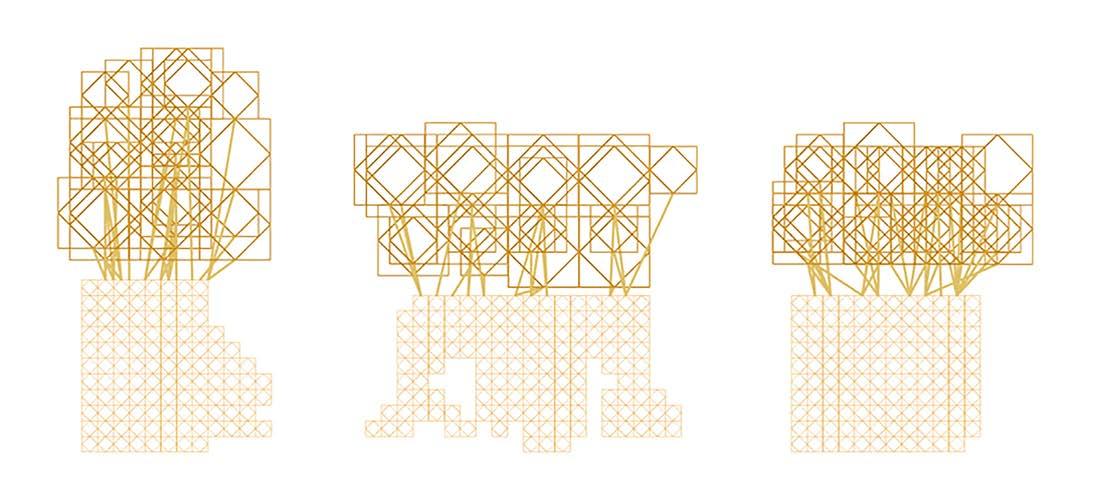
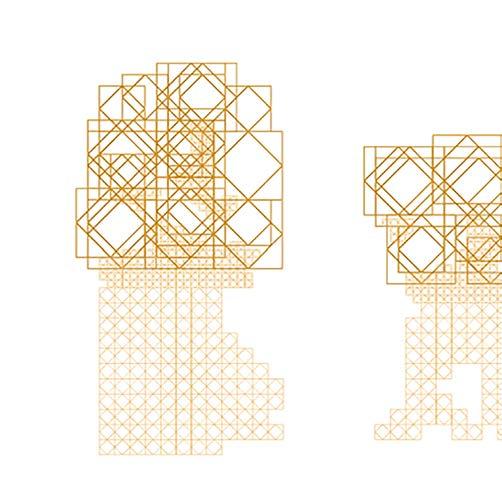
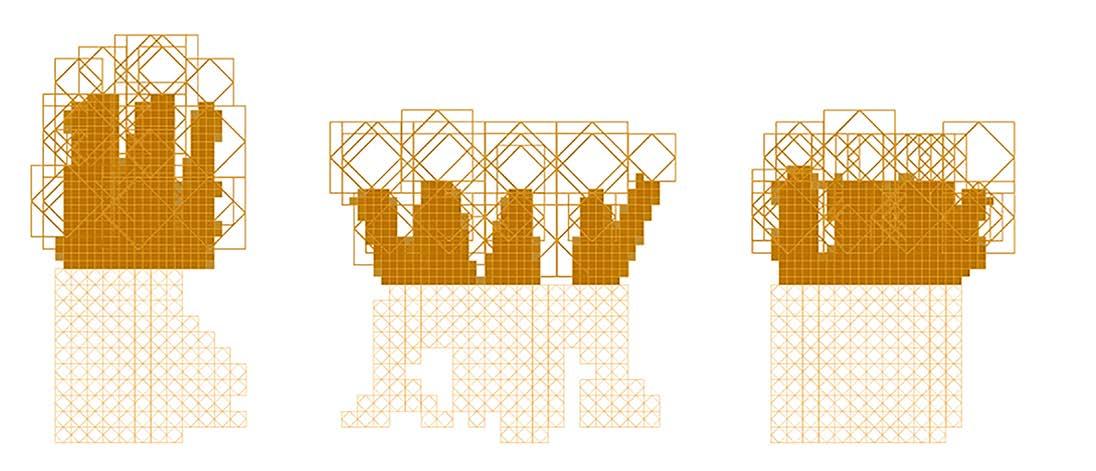
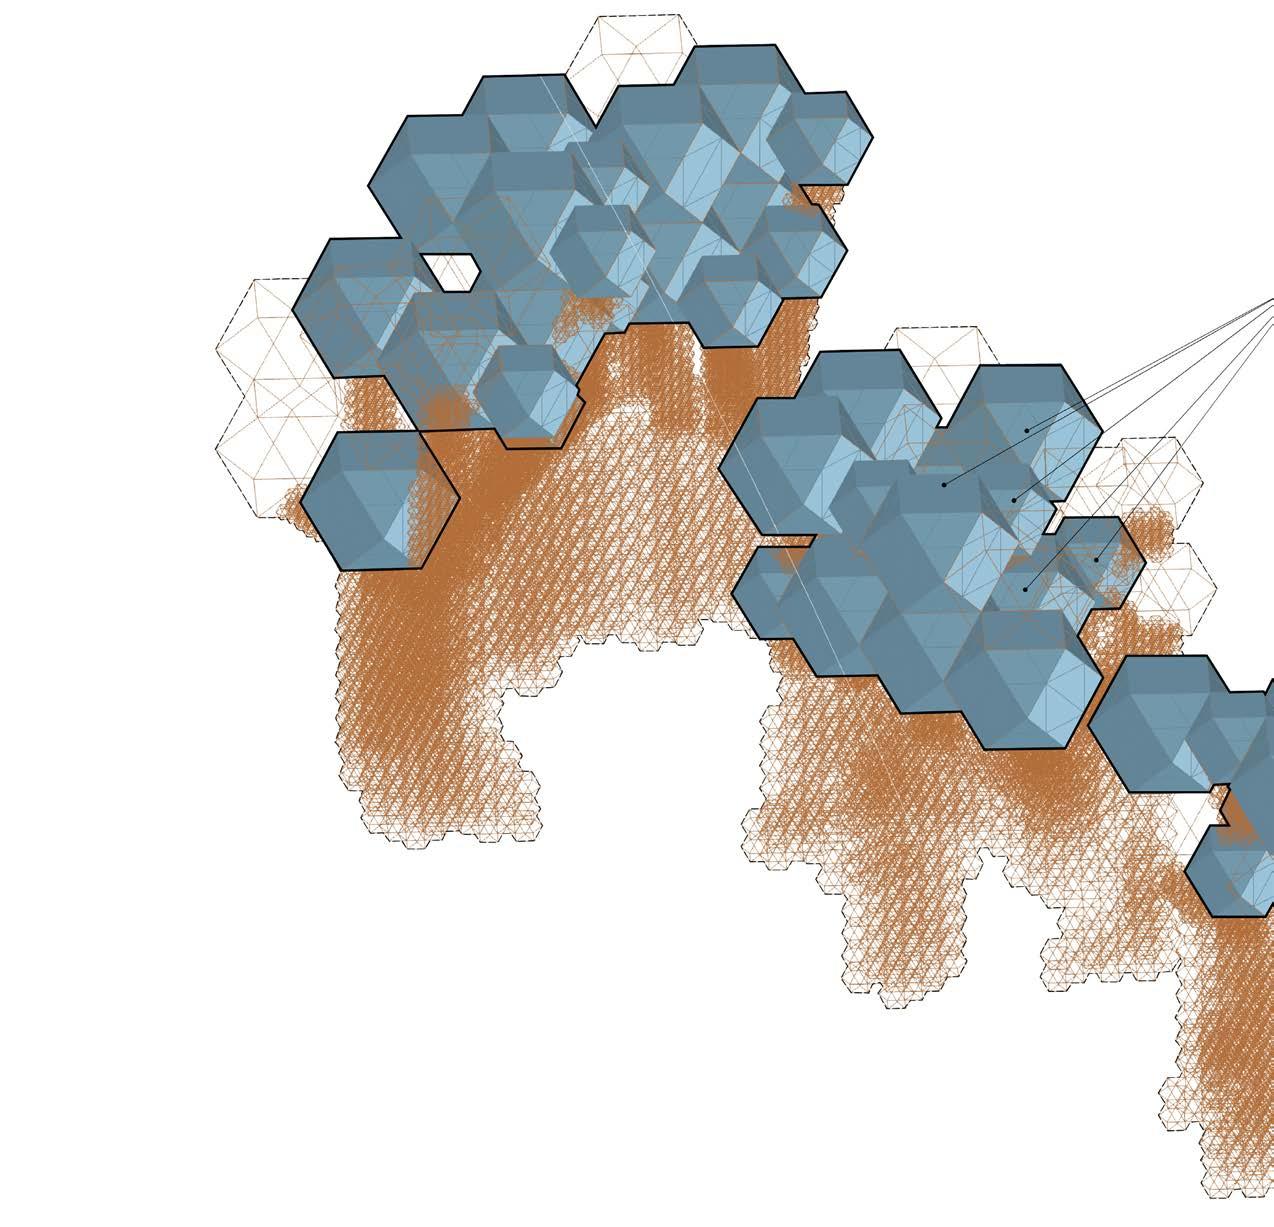
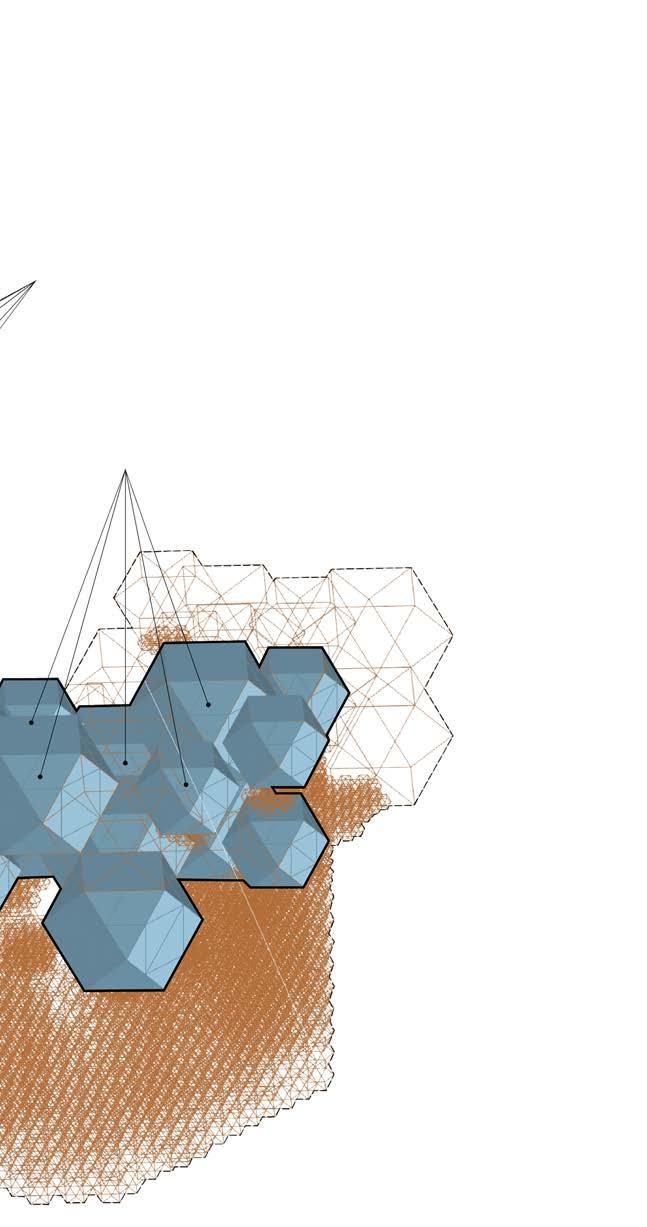
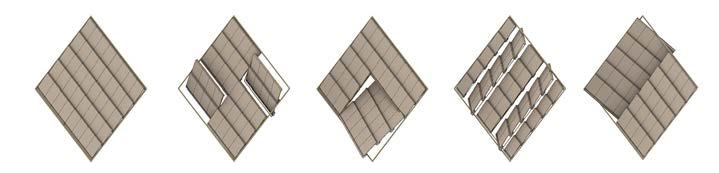
The key design logic is that by the time the bamboo structure approaches the end of its lifespan, sediment deposition will have reached a mature stage. This means the submerged substructure will naturally merge with the accumulated sand, becoming embedded in the stabilised ground. The bamboo will degrade without obstructing sand movement, allowing the newly formed land to integrate seamlessly with the settlement area.
In effect, the gradual degradation of bamboo aligns with the pace of natural land formation, allowing the settlement to evolve from stilt-based structures in water to stable, land-based habitation. This synchronisation ensures a seamless transition that supports environmental processes rather than disrupting them.
Fig. 56 : Bamboo, Created by Author
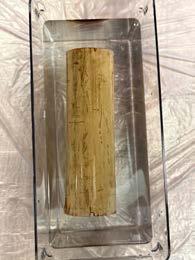
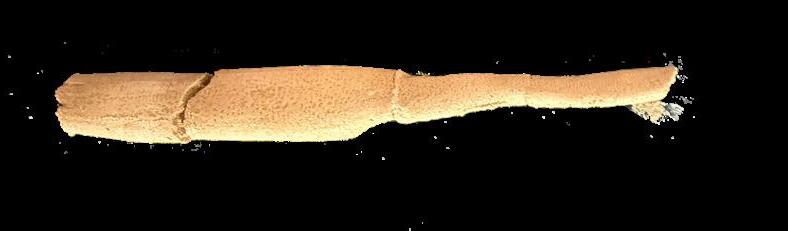
Bamboo Treatment
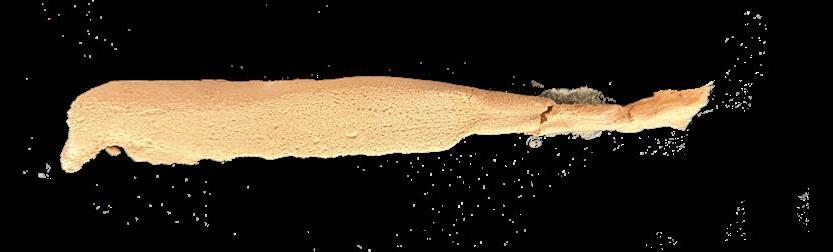
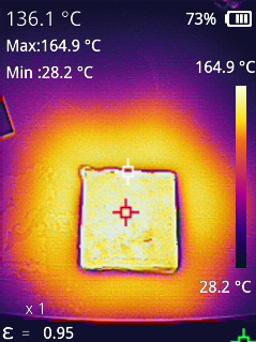
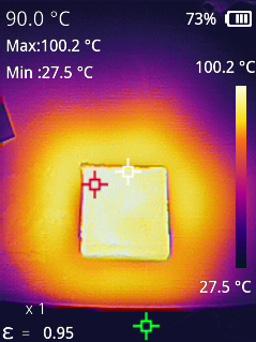
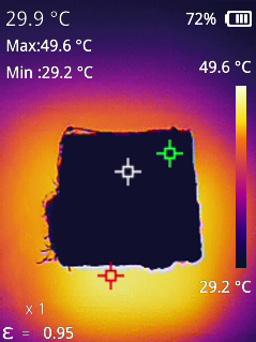
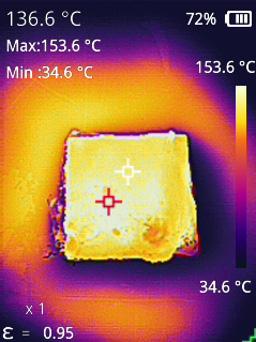
Since the bamboo will be placed in areas with continuous water flow and frequent water contact, it requires thorough treatment to protect it from decomposition. To achieve a durable state of bamboo, a four-week water immersion test was conducted. For bamboo coating, Bio-resin and linseed oil were used as protective layers. The results clearly showed that bio-resin coating provided the highest level of protection. Bamboo treated with bio-resin absorbed the least amount of water, with only a 20 g increase in weight over the entire period. It maintained its structural integrity and showed no signs of surface damage or fibre swelling.
Bamboo coated with linseed oil performed moderately well, absorbing more water than the bio-resin sample, with a 65 g weight gain. While it offered some resistance, the surface showed slight softening and darkening, indicating partial water penetration over time.
The untreated bamboo absorbed the most water, gaining 118 g in weight. This high absorption rate led to visible degradation, including swelling, splitting of fibres, and early signs of fungal growth.
These findings confirm that bio-resin coating is the most effective treatment for preventing water absorption and extending the lifespan of bamboo in wet or flood-prone environments, followed by linseed oil as a less durable alternative.
1. Bio-resin coated
Weight Before Submerging - 290g
2. Linseed oil coated
Weight Before Submerging - 275g
3. Untreated
Weight Before Submerging - 300g
Fig. 57 : Bamboo treatment, Created by Author
Observations
Weight After Submerging - 310g
Weight After Submerging - 340g
Weight After Submerging - 418g
1. Bio-resin coated
2. Linseed oil coated
3. Untreated
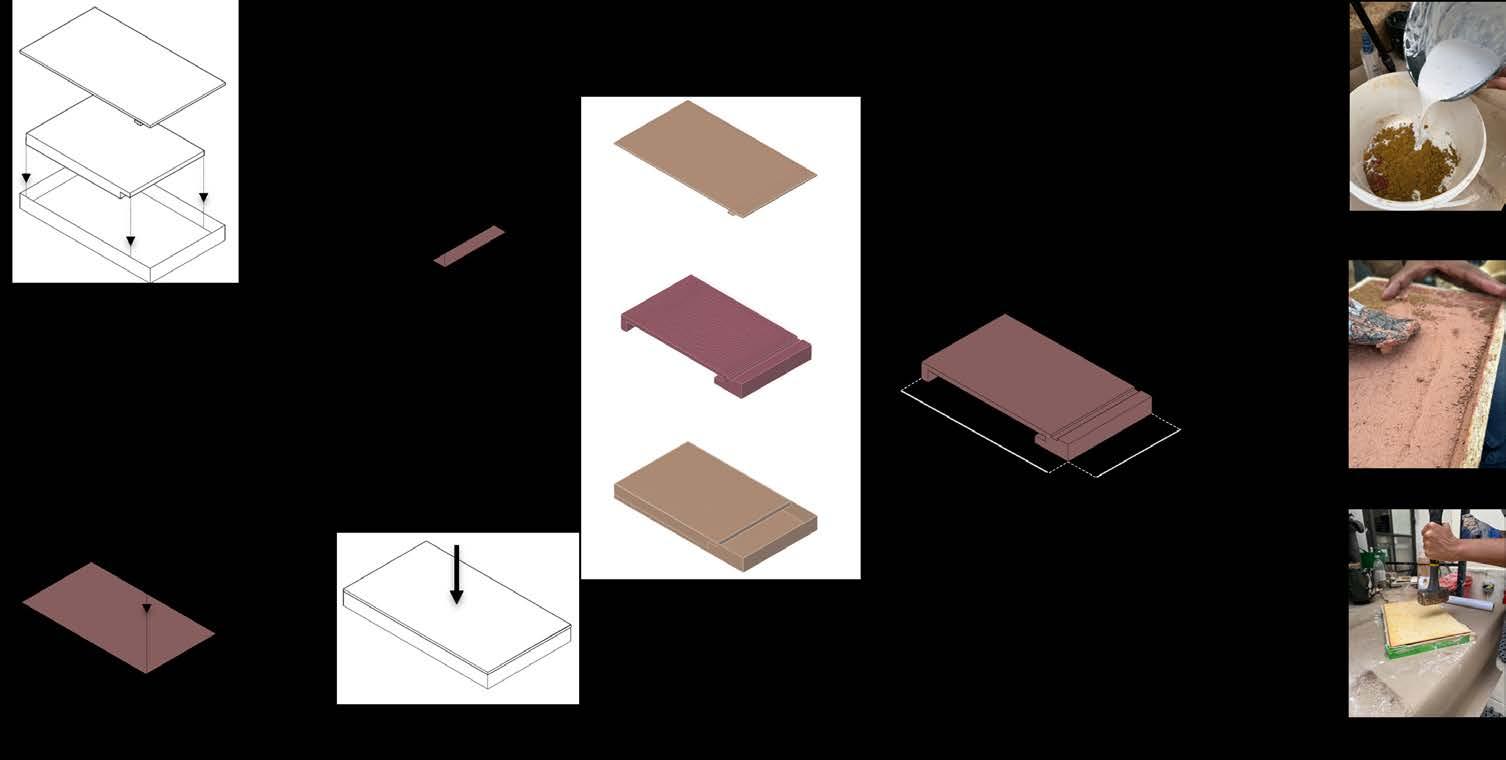
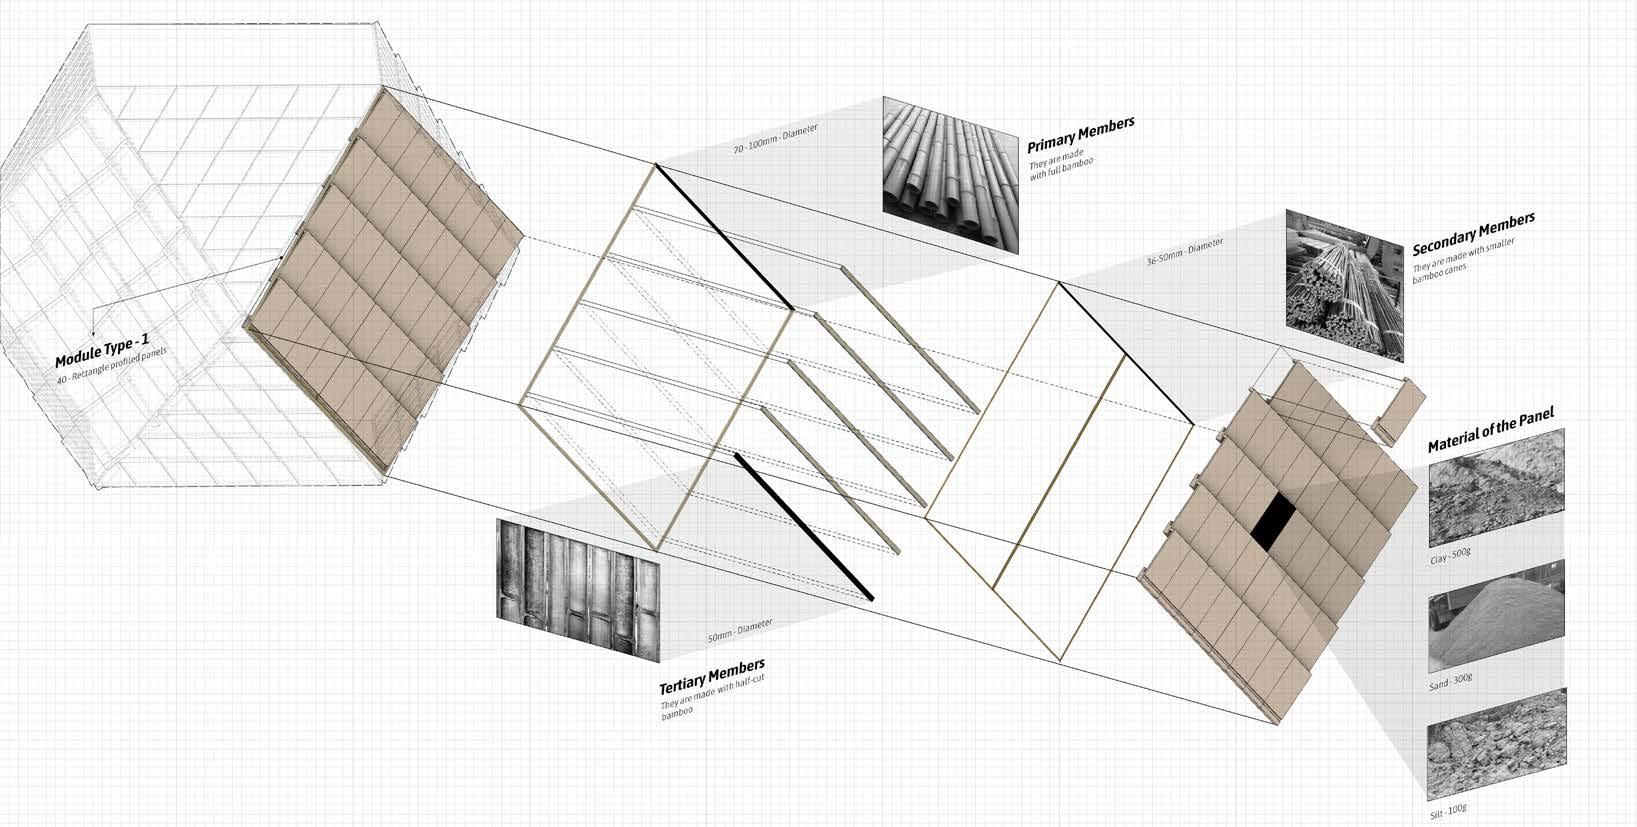
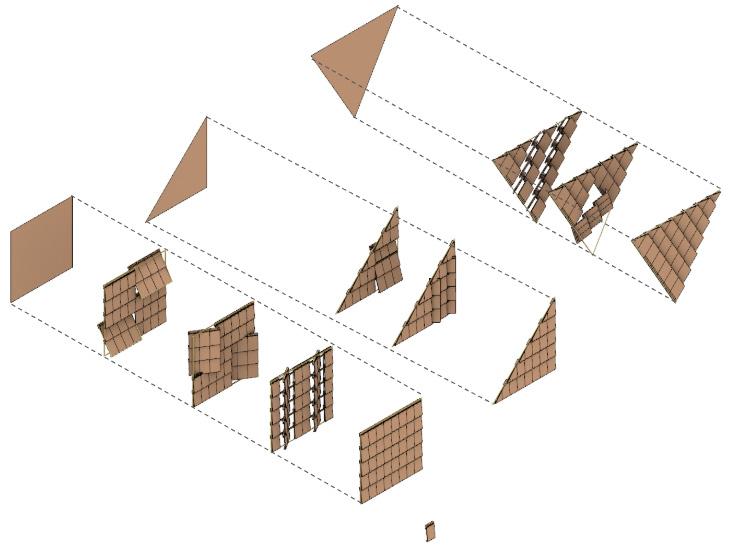
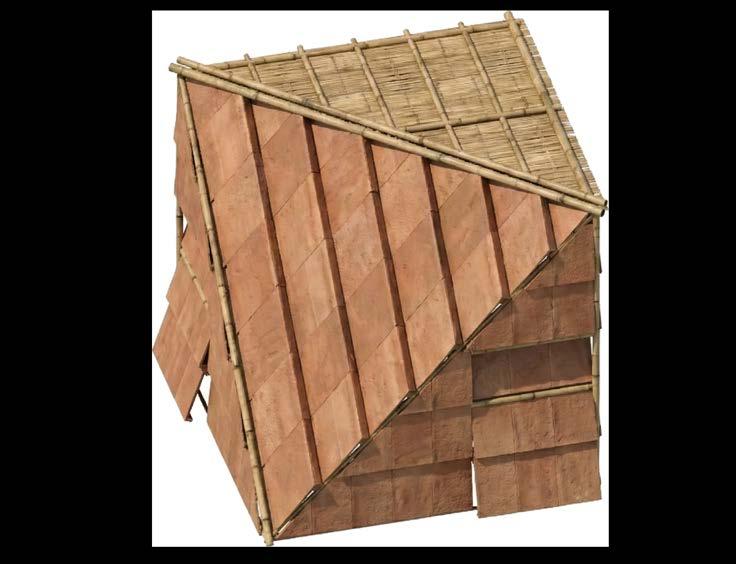
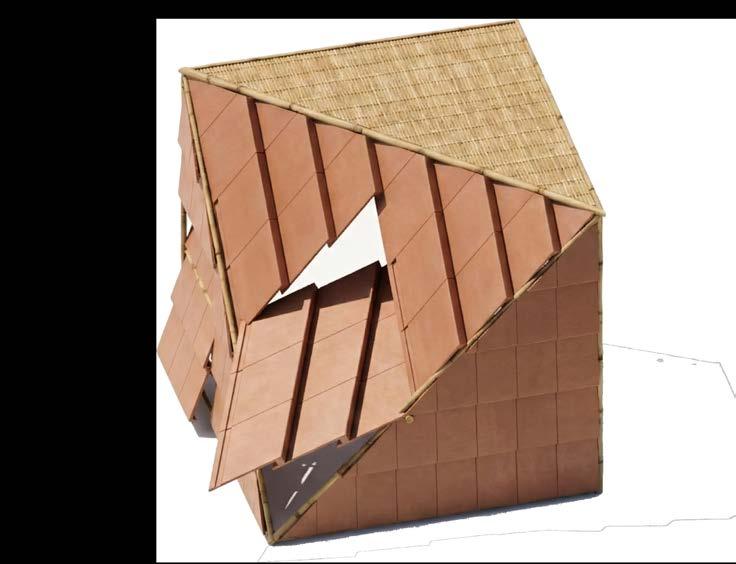
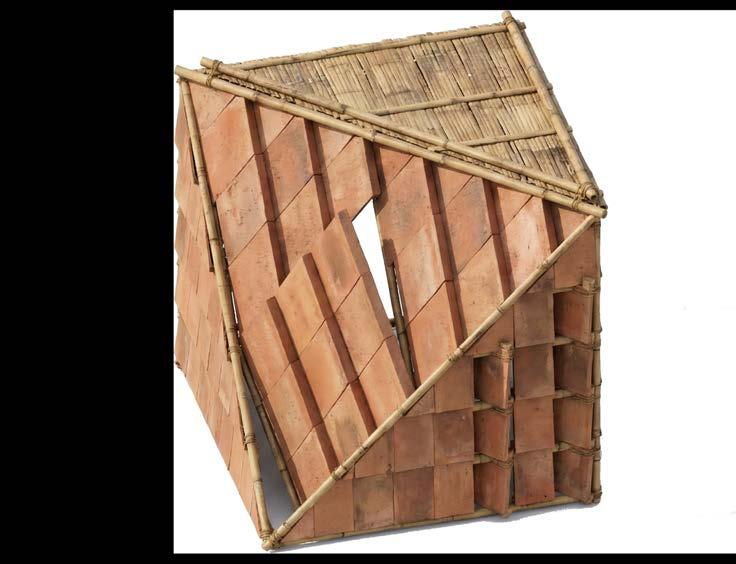
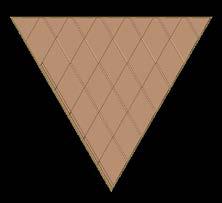
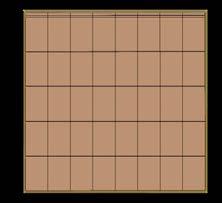
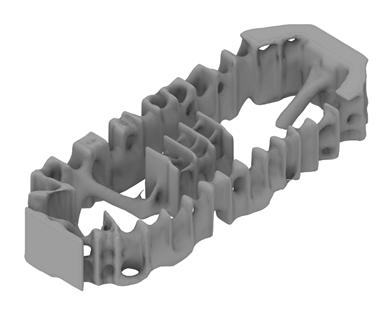
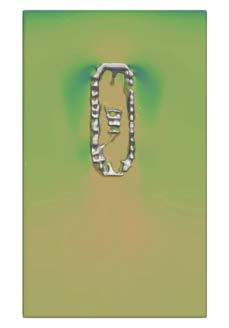
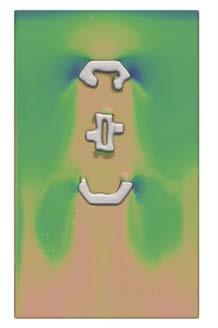
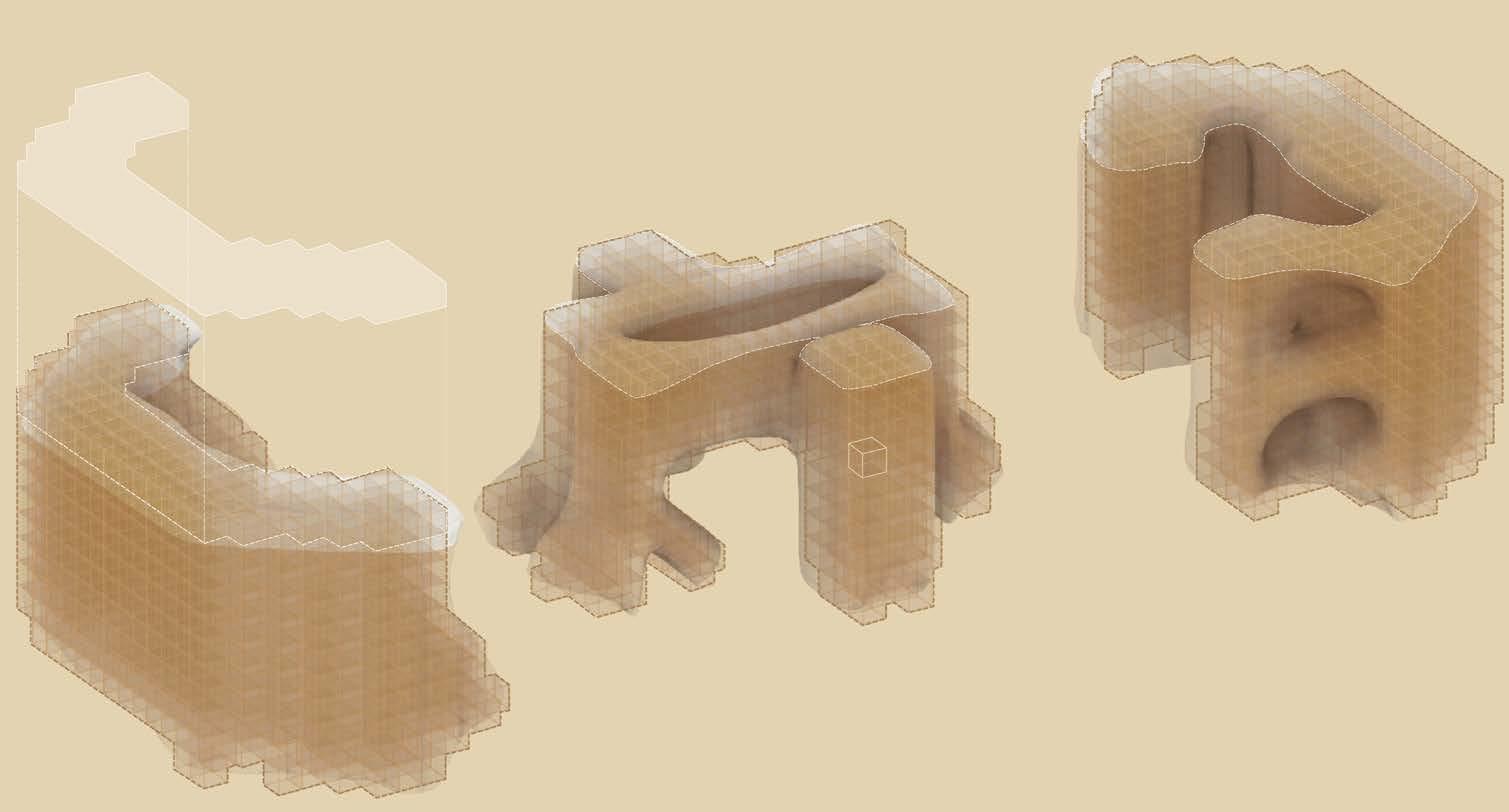
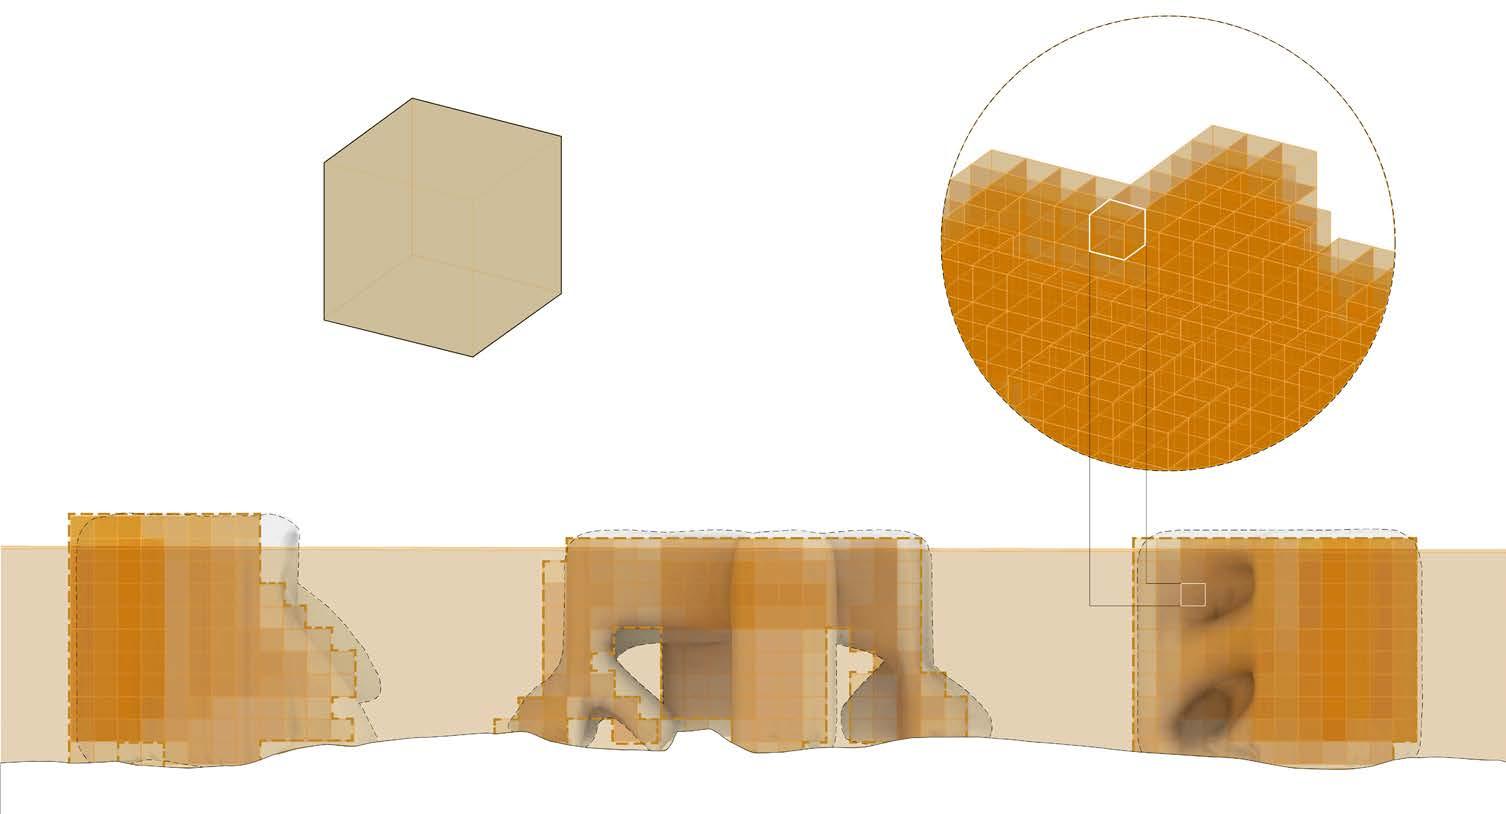
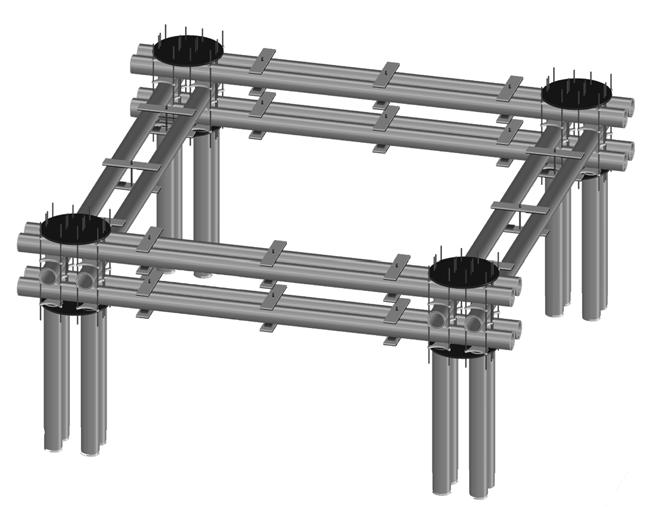
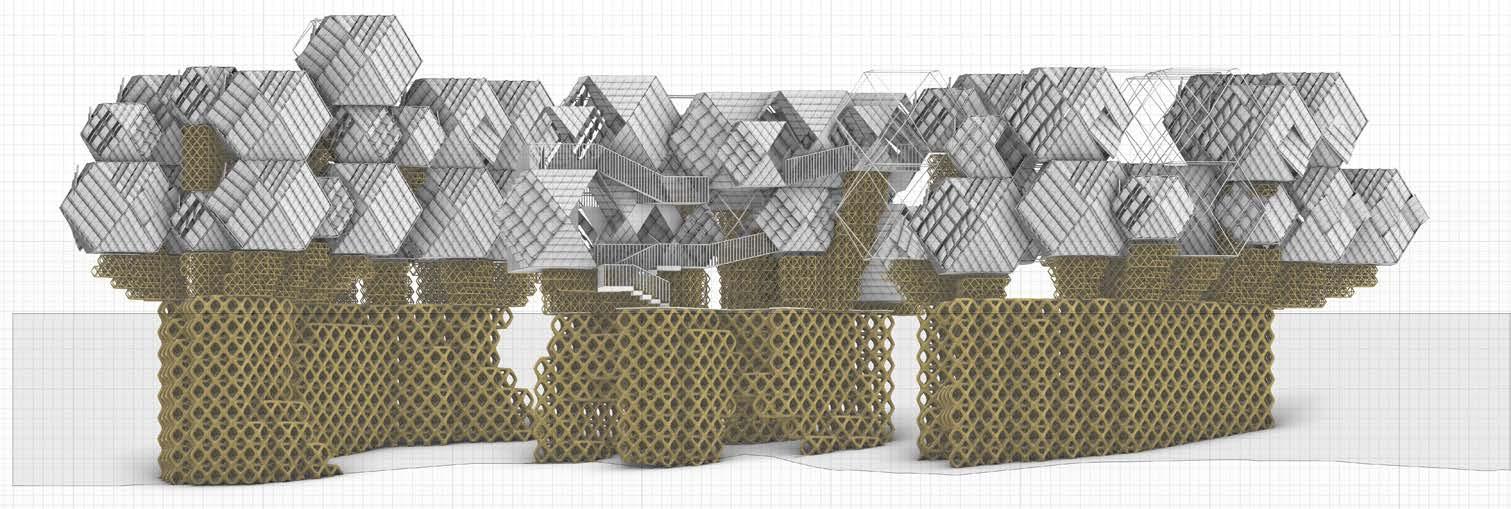
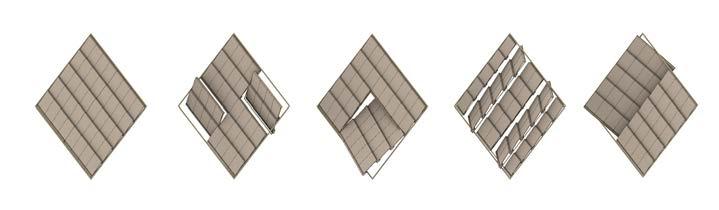
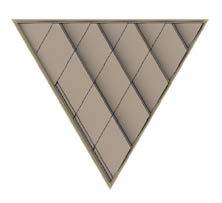
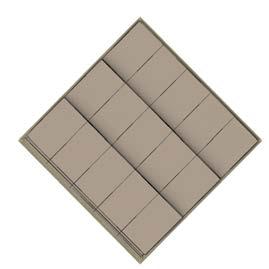
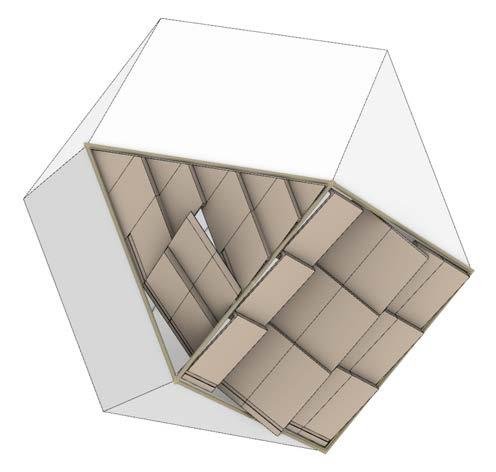
Fabrication and Composition :
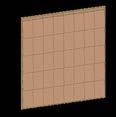
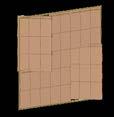
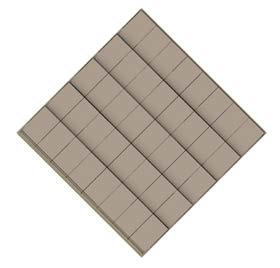
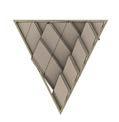
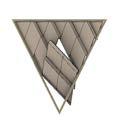
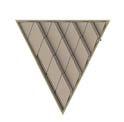
Super structure Panels
Fig. 58 : Super structure panels, Created by Author
Composition and Fabrication : Panel system
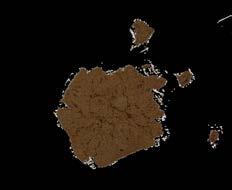
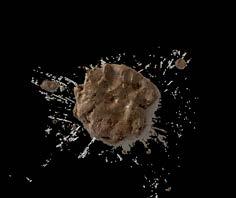
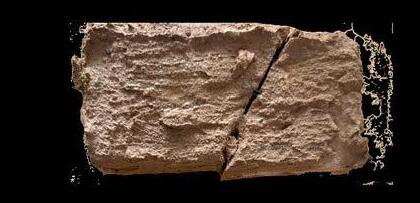
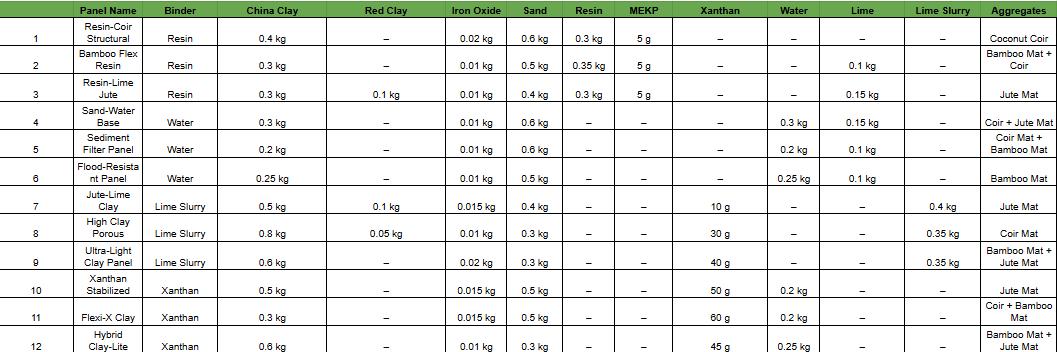
Base material mix
After completing the case study analysis, materials that are locally available and practical for use in Majuli were identified and tested. Several combinations of clay, sand, and silt were prepared and tested to understand their composition, strength, and overall performance.
These tests were carried out using traditional & reliable methods. The ball drop test was attempted to assess cohesion and strength, the cigar roll test was carried out to check plasticity and workability, whereas the biscuit test to evaluate drying and cracking behaviour.
Each mix was carefully observed for signs of brittleness, the presence of voids, and how well it could hold its shape under different conditions.
From all the samples, Mix C which is 45% Clay, 50% Sand and 5% Silt, proved to be the most effective. It had the right balance between the three materials, minimising internal voids, resisting brittleness also delivering consistent results across all tests. This made it the optimal choice for further development and integration into the construction system.
Fig. 59 : Composition of base materials, Created by Author
Ball drop test
Cigar roll test
Biscuit test
Mix A
Clay: 30% Sand: 65% Silt: 5%
Mix B
Clay: 25% Sand: 60% Silt: 15%
Mix C
Clay: 45% Sand: 50% Silt: 5%
Aggregates
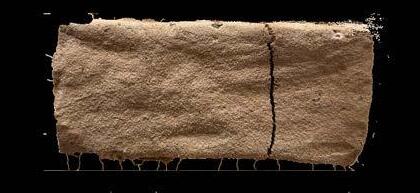
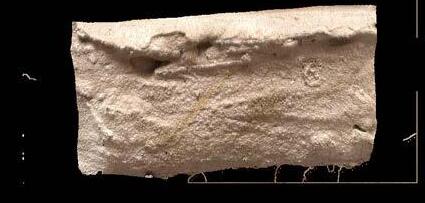
Once Mix C was finalised as the optimal composition, it was paired with different natural reinforcement materials to further enhance its performance. The aggregates for this mix were incorporated using coir mats, jute mats, and bamboo mats, each serving as a reinforcing layer that improved strength, reduced cracking, and added structural stability.
Out of which :
Coir mats provided excellent tensile reinforcement due to the natural strength and flexibility of coconut fibres, making the material more resistant to deformation.
Where as Jute mats offered a tightly woven structure that helped bind the mix but degrade quickly in humid conditions.
Similarly Bamboo mats acted as a rigid framework, distributing loads evenly but bare heavier and require treatment against decay.
By combining the earthen mix with locally available biodegradable mats, the building components achieved greater structural strength while remaining sustainable and low-cost. Among the tested options, Coir mat was identified as the most effective reinforcement, offering durability and compatibility with the composite system.
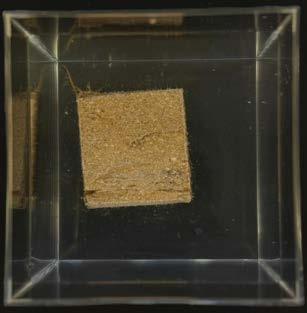
Sample 1
Sand :600g
Clay 400g
Silt :100g
Binder : 300g
Aggregates : Coir
Casted weight : 1565g
Weight after curing : 1349g
Time required to dry : 2 days
Water loss percentage : 14%
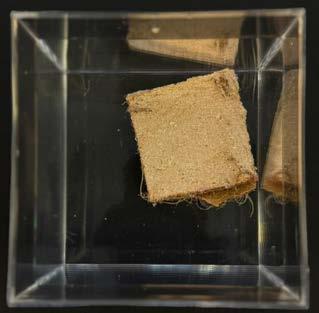
Sample 2
Sand :500g
Clay :300g
Silt :100g
Binder :350g + lime 100g
Aggregates Bamboo + coir
Casted weight : 1700g
Weight after curing :1380g
Time required to dry : 2 days
Water loss percentage : 19%
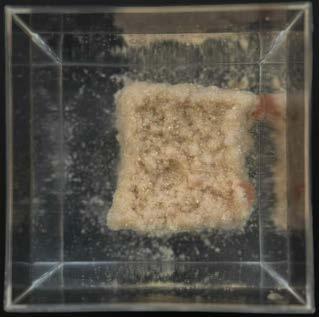
Sample 4
Sand :600g
Clay : 300g
Silt :150g
Binder 300g+ Lime 150g
Aggregates : Coir + Jute
Casted weight : 1420g
Weight after curing : 745g
Time required to dry : 12 days
Water loss percentage : 47%
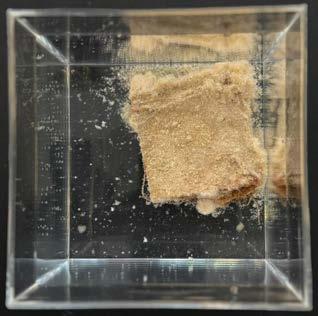
Sample 7
Sand :400g
Clay : 600g
Silt :50g
Binder 400g
Aggregates : Jute+Coir
Casted weight : 1450g
Weight after curing : 1038g
Time required to dry : 10 days
Water loss percentage : 28.5%
Sample 5
Sand :600g
Clay :200g
Silt :150g
Binder :350g+ Lime 150g
Aggregates Bamboo + Coir
Casted weight 1475g
Weight after curing :1017g
Time required to dry : 12 days
Water loss percentage 31%
Sample 8
Sand :300g
Clay :800g
Silt :50g
Binder 350g
Aggregates : Coir
Casted weight : 1430g
Weight after curing :943g
Time required to dry : 10 days
Water loss percentage : 34%
Sample 3
Sand :400g
Clay 300g
Silt :100g
Binder : 300g + Lime 150g
Aggregates : Jute
Casted weight : 1650g
Weight after curing :1353g
Time required to dry : 2 days
Water loss percentage : 18%
Sample 6
Sand :500g
Clay : 350g
Silt :150g
Binder : 300g + Lime 150g
Aggregates Bamboo
Casted weight 1352g
Weight after curing :888g
Time required to dry : 12 days
Water loss percentage 34%
Sample 9
Sand :300g
Clay : 600g
Silt :50g
Binder 350g
Aggregates : Bamboo + Jute
Casted weight : 1400g
Weight after curing :760g
Time required to dry : 10 days
Water loss percentage : 46%
Bio Resin
slurry Water
Fig. 60 : Panel casting with binder options, Created by Author
Sample 10
Sand :500g
Clay 500g
Silt :100g
Binder 50g + Water
Aggregates : Jute
Casted weight : 1550g
Weight after curing : 788g
Time required to dry : 15 days
Water loss percentage : 50%
Sample 11
Sand :500g
Clay :300g
Silt :100g
Binder 60g + Water
Aggregates : Coir + Jute
Casted weight : 1430g
Weight after curing :860g
Time required to dry : 15 days
Water loss percentage : 37.5%
Sample 12
Sand :500g
Clay 600g
Silt :100g
Binder 45g + Water
Aggregates : Bamboo + Jute
Casted weight : 1455g
Weight after curing : 903g
Time required to dry : 15 days
Water loss percentage : 38%
Binders
Following the aggregate reinforcement trials, a series of binder tests were conducted to determine which binding agents would deliver the best structural and durability performance when combined with the selected mix. The materials were cast into panel-shaped formworks, as the intention was to use them as lightweight cladding walls instead of conventional heavy brick construction. Four binders were compared, bio-resin, water, lime slurry, and xanthan gum, each evaluated for their shrinkage rate, weight retention, crack formation, and material bifurcation (splitting or separation of layers).
The tests revealed that Samples 10 and 11, both prepared with xanthan gum as the binder, consistently outperformed the others. These samples showed minimal shrinkage, developed fewer and less severe cracks, and maintained a stable weight even after drying. Xanthan gum’s natural viscosity and adhesive properties helped create a more cohesive mix, which improved bonding between particles and enhanced overall strength. To further improve performance, jute aggregates and a coir–jute hybrid aggregate were integrated into these xanthan gum samples. This combination significantly boosted tensile strength, reduced the risk of breakage under stress, and improved long-term stability.
Observations
Twelve material samples were prepared using four binder types: Bio Resin, Water, Lime Slurry, and Xanthan Gum. Water and lime slurry samples showed high shrinkage and surface cracking during curing. Bio resin samples resulted in smooth finishes and high strength, but required complex mixing and longer setting time. The Xanthan gum samples, especially Sample 11 with added coir and jute, showed minimal surface cracks, better compaction, and lower water loss (37.5%) indicating good internal bonding and even drying.
Conclusion:
Xanthan gum mixed with coir and jute proved to be the most effective binder system, offering easy preparation and less curing time offering the stability required.
Xanthan gum
Sample 10
Aggregates :
Sample 11
Aggregates :
Fig. 61 : Heat retention performance, Created by Author
Thermal Testing: Heat Retention Performance
Observations
Thermal images were recorded at intervals during both the heating (30s and 60s) and resting (60s, 300s, 600s) phases. Sample 10 (Jute only) reached a peak surface temperature of 164.9 °C at 60 seconds, but dropped rapidly to 63.7 °C after 10 minutes. Sample 11 (Coir + Jute) reached a higher peak of 170.6 °C, and retained more heat over time, maintaining 70.9 °C at the 600-second mark.
Additionally, Sample 11 showed slower heat loss and more even surface radiation, indicating better insulation and thermal retention.
Conclusion
The inclusion of coir along with jute in Sample 11 significantly improved heat retention capacity. The denser fiber structure likely contributed to slower heat dissipation, making this composite more suitable for taking it further as a building material where heat retention is required.
Water proof coating test
Observations
Three samples : No Coated, Sodium Silicate, and Bio-Resin Coating, were submerged in water for 24 hours.
• The uncoated sample fully disintegrated, showing high water absorption and loss of integrity.
• The sodium silicate-coated sample partially retained its form but showed visible surface erosion and fiber swelling.
• The bio-resin-coated sample remained largely intact with minimal material breakdown, though minor edge deterioration was observed.
Conclusion
While sodium silicate offered limited protection, the bio-resin coating provided the most effective water resistance, maintaining structural integrity over 24 hours. This suggests that bio-resin is a viable waterproofing layer for clay–fiber composites in wet or flood-prone environments
No Coating
Sodium Silicate
Bio-resin Coating
Fig. 62 : Water proof coating test, Created by Author
Compression Test
Observations
Both samples underwent compression and lateral shear tests to assess structural integrity under load. Sample 10 (Jute only) exhibited early surface cracking and delamination under axial pressure. Failure occurred at 1.1 kN, with brittle shear failure under lateral load.
Sample 11 (Coir + Jute) demonstrated higher load-bearing capacity, withstanding up to 2.8 kN before structural failure. The failure mode was more ductile, with fibers resisting delamination and absorbing greater stress during the shear test.
Conclusion
The addition of coir alongside jute significantly improved the material’s compressive strength, shear resistance, and failure behavior. Sample 11’s higher strength and ductility gave an insight for the further material experimentation as a building material.
Sample 10
Aggregates : Jute
Sample 11
Aggregates : Coir + Jute
Fig. 63 : Compression test, Created by Author
Material tests Conclusion
Among all tested formulations, Sample 11, composed of sand, clay, silt, and a coir–jute aggregate bound with xanthan gum and water, demonstrated the best overall performance. It achieved a strong balance between compressive strength, durability, and thermal retention, while remaining lightweight compared to conventional masonry materials.
When coated with bio-resin, the sample exhibited exceptional water resistance, maintaining its structural integrity after 24 hours of submersion and showing minimal surface degradation. The coir–jute reinforcement contributed both to mechanical strength and improved insulation properties, making it a versatile and sustainable alternative to conventional cladding.
Its relatively fast drying time, moderate weight loss during curing, and the use of locally available, biodegradable materials further enhance its suitability for Majuli’s environmental and economic context. These results confirm Sample 11 with bio-resin coating as the most reliable and context-appropriate solution for lightweight, water-resistant, and thermally efficient cladding panels.
Panels Formwork and Casting method
For the fabrication of the panels, the mix composition that showed the highest performance in compression tests was adopted: 500 g sand, 300 g clay, 100 g silt, and 60 g xanthan binder, combined with water and reinforced using natural coir and jute fibres. The fabrication began with preparing the mixture, which was then evenly layered into reusable moulds. Each layer was compacted with a 65 kg load to minimise voids and ensure material density.
The prototypes were produced at 700 × 400 × 25 mm, a scale that balances structural performance with practicality in handling. Their modular dimensions enable easy transportation, assembly, and direct on-site casting without reliance on heavy machinery, as demonstrated in the fabrication process images.
Fig. 64 : Panel casting process, Created by Author
Bamboo Casting method
Similar to the reusable panel formwork system, the bamboo reinforcement process is designed to improve durability and structural performance. The procedure begins with Phase 1, where the bamboo module is cut using a precision tool to create a uniform edge. In Phase 2, a MS bar is carefully inserted into the hollow bamboo core, creating an internal anchor point.
Phase 3 introduces rope wrapping around the bamboo’s exterior while an MS bar is inserted through the central cavity. This dual action of rope and steel provides additional frictional resistance and distributes loads effectively. Phase 4 further secures the system, as the rope is tightened around the bamboo and the metal insert, mechanically locking the elements together and reducing the risk of joint failure.
In Phase 5, the cavity is filled with the final selected mixture, as shown in the reference image. This mixture acts as a sealant and binder, preventing water ingress, protecting against biological degradation, and enhancing compressive strength.
This method ensures that bamboo can serve not only as a sustainable and locally available material but also as a technically reliable structural element. By integrating traditional craftsmanship with engineered reinforcement strategies, the process allows communities to assemble resilient structures with minimal reliance on prefabricated industrial components.
Fig. 65 : Bamboo reinforcement, Created by Author
Phase 01
Cutting of bamboo
Phase 02
Metal piece insertion
Phase 03
Rope Wrapping around bamboo and insertion of MS bar
Phase 04
Securing with rope around bamboo and metal section
Phase 05
Filling with selected Mixture
Final selected mixture
Sedimentation Tank Experiment
Understanding Sedimentation and its patterns
The sedimentation tank experiment is a laboratory-scale model designed to simulate sediment transport and deposition under controlled hydraulic conditions. The tank is a rectangular, open-channel system measuring approximately 2.5 meters in length, 1.0 meter in width, and 0.45 meters in depth, mounted on a rigid frame to ensure stability during operation. A water–sediment mixture is introduced through an adjustable inlet at one end of the
tank, while an outlet and lower reservoir at the opposite end allow water to recirculate continuously through a pump system. This closed-loop setup enables precise control of flow rate and water depth throughout each experiment.
Fig. 66 Sediment Tank experiment Setup, Created by Author Credit : Tank setup with guidance from Eduardo Rico, Co-Director of Landscape Urbanism, AA.
As water flows through the tank, it transports sediment across the surface, where variations in flow speed, depth, and obstruction generate erosion, deposition, and channel formation. Obstacles interrupt the current, creating wake zones, flow splitting, and downstream pockets of accumulation. These interactions produce measurable patterns of scour and deposition that evolve over time, revealing how turbulence, eddies, and velocity gradients shape sediment organization. The system can be paused at any stage, allowing the surface to be scanned and documented in detail, capturing subtle shifts in terrain as they develop.
Inside the tank, a sediment bed of uniform thickness is prepared before each run, and modular obstacles can be placed to study how flow interacts with structural interruptions. As water moves across the surface, sediments are eroded, transported, and deposited in response to changes in velocity, depth, and obstruction. The transparent and accessible design allows the experiment to be paused at any moment for surface scanning and documentation, capturing the gradual formation of channels, bars, and depositional layers. By combining a well-defined physical setup with adjustable parameters, the tank provides a clear and repeatable way to link fluid dynamics to the development of sedimentary patterns and landforms.
By varying the number, spacing, and density of obstacles, the experiment demonstrates how small geometric changes intensify flow interactions and lead to increasingly complex sediment patterns. Higher obstacle density generates stronger turbulence, sharper channels, and thicker zones of deposition, resulting in richly textured miniature landscapes. Through this setup, long-term geological processes are compressed into observable laboratory timescales, offering a clear and readable link between flow dynamics, material behavior, and the emergence of structured sedimentary forms.
Fig. 67 : Tank experiment setup Created by Author
Fig. 68 : 3D Scanning the sediments , Created by Author
The pattern studies examine how the spatial arrangement of obstacles shapes sediment behavior as water flows across the surface. Individual blocks interrupt the current, creating wake zones, flow separation, and downstream areas of reduced velocity where sediment accumulates. As obstacles are repositioned or grouped, these wake zones begin to overlap, causing flows to split, collide, and rejoin. This interaction produces layered deposition, defined scour edges, and branching channels, making visible how subtle changes in geometry can reorganize sediment into coherent, readable patterns that mirror natural sedimentary formations.
Understanding Spatial Logic
Fig. 69 : Understanding the sediment pattern ( Placement pattern ) Created by Author
The density studies focus on how increasing the number of obstacles intensifies flow disturbance and sediment organization. Low-density configurations result in isolated deposition pockets and softer terrain shifts, while higher densities generate stronger turbulence, deeper channels, and thicker zones of accumulation. Closely clustered blocks concentrate sediment capture, producing sharper contrasts between erosion and deposition. These experiments reveal how incremental increases in obstacle density can rapidly escalate pattern complexity, transforming simple flow responses into richly structured miniature landscapes.
Together, the pattern and density experiments provide a clear framework for understanding how obstacle placement governs sediment formation. By comparing different configurations, the system helps determine optimal cluster densities and arrangements for phase-wise development across the datascape. The findings translate fluid behavior into actionable spatial logic, allowing informed decisions about where and how clusters should be introduced over time to guide structure, stability, and growth within an evolving landscape system.
Fig. 70 :Understanding the sediment pattern ( Density of obstacles ) , Created by Author
Design Development
Workflow
The creation of proto-units based on site research, material logic, and programmatic aim is the first step in the design development process, which is an organised yet flexible workflow. Wave Function Collapse (WFC) organises these proto-units, which serve as basic building blocks, to produce coherent cluster structures. In order to ensure responsiveness to environmental restrictions and settlement performance objectives, cluster development is directed by spatial distribution logics and further optimised using multi-objective evolutionary algorithms (MOEA). Micro-community cluster detailing is informed by WFC at a finer scale, allowing for controlled variation while preserving spatial coherence.
This procedure contributes to the definition of high-density and low-density units, which are then broken down into substructure and superstructure components of the cluster, resulting in habitable areas and structural frameworks. Phase-wise development methods are informed concurrently by density-driven SPI generation, which enables the settlement to gradually change over time. This workflow culminates in a versatile kit-of-parts system that combines phasing, structural, and geographic methods to support adaptive growth across land and water in response to Majuli’s changing social and ecological conditions.
Fig. 71 Design develeopment workflow, Created by Author
The sedimentation concept translates observed flow and deposition behavior into a spatial logic that can guide design decisions. Each phase builds outward from an initial core, responding to flow direction, accumulation intensity, and
zones of stability revealed through the experiments. The diagrams illustrate how sediment spreads asymmetrically downstream, thickening near areas of low velocity and gradually thinning toward the edges. Concentric fields
Fig. 72 : Sediment Concept Phase 1 Created by Author
and directional gradients help map influence zones, showing how individual clusters affect their surroundings over time. As phases progress, additional nodes are introduced where sediment patterns indicate structural capacity and continuity, allowing growth to remain responsive rather than imposed.
Fig. 73 : Sediment Concept Phase 2 , Created by Author
Fig. 74 : Sediment Concept Phase 3 , Created by Author
Fig. 75 : Phased growth, Created by Author
Sedimentation Concept & Overlays
When overlaid onto the datascape, these sediment-derived fields act as a decision-making framework rather than a fixed masterplan. Areas of higher accumulation align with zones suited for denser clustering, while transitional edges support lighter or adaptive interventions. The overlays demonstrate how phase-wise development can follow the logic of sediment behavior starting compact, reinforcing stable cores, and gradually extending into peripheral zones as conditions allow. This approach ensures that spatial development remains legible, scalable, and informed by underlying flow dynamics rather than arbitrary distribution.
Fig. 76: Spatial Sedimentation Gradient Created by Author
Fig. 77:Datascape Overlays, Created by Author
When overlaid onto the datascape, these sediment-derived fields act as a decision-making framework rather than a fixed masterplan. Areas of higher accumulation align with zones suited for denser clustering, while transitional edges support lighter or adaptive interventions. The overlays demonstrate how phase-wise development can follow the logic of sediment behavior—starting compact, reinforcing stable cores, and gradually extending into peripheral zones as conditions allow. This approach ensures that spatial development remains legible, scalable, and informed by underlying flow dynamics rather than arbitrary distribution.
Together, the sedimentation experiments and conceptual mappings provide a method to determine appropriate cluster density and placement across different phases of development within the datascape. By reading sediment patterns as indicators of stability, capacity, and interaction, the system supports informed, phase-wise growth that adapts to evolving conditions. This process links physical behavior to spatial strategy, ensuring that development density is calibrated, responsive, and grounded in the logic of the landscape itself.
Sediment capture initiates land formation beneath submerged bamboo structures. Over 1, 3, 5, 8, and 11 years, sediment gradually accumulates and stabilizes, allowing vegetation to expand from core zones toward the periphery. Each phase introduces higher-density planting points, increasing ecological resilience and guiding the transition from nascent sediment beds to mature, habitable land.
Green Patch Development
Fig. 78 : Green Patch Development Across Sedimentation Phases, Created by Author
Arkora
Green Patch Development
Fig. 80 :Green patches Created by Author
Regional Scale Development
This project is structured as a multi-scalar generative workflow, moving from elemental components to aggregated urban formations. The workflow establishes a clear hierarchy: elemental units form modules, modules aggregate into clusters, and clusters ultimately define settlement patterns. Rather than prescribing a final form, the system relies on rule-based generation. Spatial principles are extracted from the design intent and embedded into each stage of the workflow, allowing the system to evolve adaptively. This approach enables growth patterns to emerge through relationships, constraints, and feedback rather than fixed geometry. The workflow creates a framework capable of responding to environmental, programmatic, and spatial pressures while maintaining internal coherence across scales.
At the modular scale, the project focuses on how individual units interact to form larger spatial organizations. The process is divided into three main stages: local unit development, aggregation, and clustering.Local units are first developed and tested in isolation. These units are then aggregated using an objective-based generative workflow. Finally, the resulting aggregations are evaluated and grouped into clusters based on performance parameters. This layered approach ensures that decisions made at the smallest scale remain legible and influential at the level of the overall settlement.
Modular Scale Overview: Local Units to Clusters
Local Units: Development and Classification
The local unit system is based on a modified cube form, chosen for its simplicity, strength, and flexibility. This basic shape is divided into smaller units, each designed to support a particular type of space or activity.
These units fall into two main groups: bound units and circulation units. Bound units create enclosed or partially enclosed spaces, helping to shape how open or compact the overall structure feels. Circulation units connect these spaces, providing paths for movement through stairs, platforms, and passages that allow the system to grow and adapt over time.
Each unit follows a set of simple connection rules that guide how it can link with others. Together, these rules ensure the system remains coherent while still allowing many different spatial arrangements to emerge as units are combined.
The modular system develops from a truncated cube that is systematically broken down into a family of proto-modules. Each unit is defined by rules of connection, orientation, and openness, allowing it to perform a specific spatial role within a larger aggregation. Bound units regulate enclosure and density, shaping how spaces open or compress, while circulation units establish both vertical and horizontal movement through slabs, stairs, and connectors. Rather than functioning as fixed objects, the modules act as relational components, designed to combine, repeat, and adapt. Together, they form a flexible connectivity framework capable of supporting multiple configurations, enabling scalable growth while maintaining spatial continuity and clear organizational logic across the system.
Fig. 81: Proto panels W, Created by Author
Spatial Simulation ,Grid and Testing Environment
To explore how the modules interact, a controlled simulation environment is set up using a simple grid of 10 × 10 cells, each measuring 3 × 3 meters. This grid provides a clear and flexible framework for testing spatial relationships, with each cell acting as a possible placement location for a module.
The grid allows different configurations to be tested through repeated iterations. Early tests reveal disconnected pathways and fragmented spaces, highlighting the need for additional modules and refined connection rules. As the process continues, pathways become more connected, gaps are reduced, and spatial relationships begin to stabilize.
Through successive iterations, the system gradually achieves a balance between movement and enclosure. In this way, the grid functions not only as a testing ground, but as an active design tool—guiding the development toward configurations that support continuity, scalability, and coherent spatial organization.
Fig. 82 : Spatial Simulation Grid Setup, Created by Author
Spatial
Configuration Experiimnet :
In order to efficiently occupy a bounded field while preserving logical linkages between components, discrete modular units can be linked, rotated, and arranged in this spatial distribution experiment. The study investigates how local placement principles produce global patterns by repeatedly testing various configurations, exposing regions of density, overlap, and residual gaps ( Possible Courtyard Spaces ). By highlighting discrepancies between available
modules and necessary spatial circumstances, the difference between “have” and “need” elements enables the system to determine where more links or transformations are required. Overall, the experiment provides insight into adaptive layout strategies for complex, constraint-driven systems by showing how little changes in spatial logic can drastically affect emergent structure.
1st Set of Iteration
Initial iteration revealed unconnected pathways, requiring the introduction of additional modules to establish spatial continuity.
2nd Set of Iteration
Pathways were successfully connected, but several spatial gaps remained, disrupting overall coherence.
Through successive iterations, the spatial logic is tested rather than assumed. Early arrangements expose moments of separation and excess, making clear where continuity breaks down. Adjustments are made incrementally, adding or redistributing elements only where necessary, allowing connections to strengthen without over-definition. The resulting configuration is not a final form in isolation, but the outcome of accumulated decisions, where scalability and continuity emerge as byproducts of a measured, iterative process.
3rd Set of Iteration
Final configuration achieved balanced connectivity and enclosure, meeting the desired spatial and functional criteria.
Fig. 83 : Iteration of spatial simulations , Created by Author
Building on the improved planar logic, the system is expanded into three dimensions, where depth, layering, and vertical connection are used in addition to adjacency to resolve spatial relationships. Volumes rise, overlap, and interlock over several layers according to the 2D configurations, which serve as a generative framework. The same laws of continuity and connectivity that were previously established give rise to vertical organisation, which permits circulation and enclosure to organically translate into three-dimensional space rather than forcing form. This change
signifies the transition from spatial arrangement to architectural expression, where form, movement, and structure develop from a common underlying logic.
Fig. 84 : 3D volumes of the spatial simulation, Created by Author
Fig. 85: Structural form and vertical organization., Created by Author
Fig. 86 Sections of spatial simulations, Created by Author
As the system develops in section, spatial hierarchy becomes legible through vertical relationships rather than plan alone. The sectional drawings reveal how shared activities are anchored at the lower levels, remaining open, accessible, and closely connected to the ground, while private spaces are lifted above, gaining separation without losing connection. Movement between levels is continuous, allowing daily activities to unfold gradually across the section. Environmental factors such as ventilation, light, and flood response are embedded within this vertical organization, using height and openness as active spatial tools. The section therefore acts as a mediator, translating spatial logic into lived experience, where structure, climate, and occupation are resolved together.
Fig. 87 : Exisiting sectional layout in majuli region, Created by Author
Aggregation: Objective-Based Generative Process
Aggregation is conceived as an objective-based generative process rather than a random assembly of parts. Each aggregation is produced through a workflow guided by clearly defined performance criteria, allowing the system to evaluate outcomes and refine them over time.
The optimization unfolds across multiple generations, with each generation generating a population of possible configurations. Solutions that perform better against the chosen objectives are retained and recombined, while less effective ones are discarded. Through this iterative process, the system progressively converges toward spatial arrangements that are both efficient and coherent.
By relying on simple local rules coupled with performance-driven selection, the method enables complex spatial structures to emerge organically. Exploration and refinement remain in constant balance, ensuring adaptability while steadily improving overall spatial quality.
Optimization Objectives and Spatial Behavior
Three primary objectives guide the optimization process: maximizing continuous floor area, minimizing spatial fragmentation, and increasing the number of balcony units, which act as thresholds or stopping conditions for expansion. Together, these objectives encourage compact yet legible aggregations. Continuous floor area promotes spatial continuity, fragmentation minimization reduces isolated elements, and balcony units introduce controlled porosity and limits to growth. The interaction of these objectives produces diverse yet comparable spatial outcomes, revealing how different priorities shape architectural form.
Aggregation
P3: Maximising Floor Area
P3: Minimising Fragmentation
P1: Maximising Balconies
Clustering and Performance Evaluation
Following optimization, the resulting solutions are clustered based on performance. From a total population of 800 phenotypes, outcomes are sorted into low-density and highdensity groups, representing opposite extremes of spatial behavior.
Low-density clusters exhibit dispersed formations with higher fragmentation, while high-density clusters demonstrate compactness and stronger spatial continuity. These clusters allow direct comparison between contrasting spatial logics emerging from the same rule set.
Clustering transforms raw generative output into an interpretable design space, enabling informed selection and further refinement.
Parameter-Based Functional Assignment
Each clustered solution is evaluated against four key parameters: continuous floor area, shortest walking distance, visual connectivity, and open area percentage. These parameters correspond to different programmatic priorities. Based on their strongest parameters, spatial units are assigned functions such as residential, cultural, market, or open space. Importantly, multiple units can share the same function, reinforcing redundancy and spatial richness rather than strict zoning.This method ensures that program emerges from spatial performance, not from predetermined allocation.
Integrated Outcome: From System to Urban Logic
The final outcome is not a single fixed design, but a system capable of producing varied yet consistent urban formations. The workflow demonstrates how modular elements, governed by local rules and evaluated through objective criteriAa, can QA complex spatial organizations. By linking geometry, performance, and program within a single generative framework, the project proposes an alternative approach to settlement design— one that is adaptive, scalable, and responsive to both spatial logic and human use.
High visual connectivity
High continuous and usable floor areas
High open space ratio
High circulation distance
Clusters: Programmatic Differentiation Through Density
At the cluster scale, the generative system begins to express clear programmatic identities. While all clusters originate from the same modular logic and rule set, variations in density and parameter weighting produce distinct spatial behaviors. Cultural, residential, open, and market clusters emerge not as predefined types, but as differentiated outcomes of performance-driven aggregation. This section compares low-density and high-density versions of each cluster type, demonstrating how spatial character shifts while maintaining systemic coherence.
Cultural Clusters: Low Density vs High Density
Cultural clusters are defined by high visual connectivity and strong spatial continuity. In low-density configurations, these clusters grow outward and upward with generous voids, terraces, and gathering platforms. Circulation is extended and exploratory, encouraging movement, overlap, and informal interaction between workshops, exhibition spaces, and communal areas.In high-density cultural clusters, the same principles are compressed vertically. Continuous and usable floor areas increase, visual connections intensify, and spatial layering becomes more pronounced.
Despite higher density, open space ratios remain significant, preserving permeability and visibility across levels. Increased circulation distance supports exploration and reinforces the cultural function as a place of encounter and exchange.
Fig. 88 :Low Density Cultural Unit,created by author
Fig. 89:High Density Cultural Unit, created by author
Clusters - Cultural Units
Clusters -Residential Units
High visual connectivity
High continuous and usable floor areas
High open space ratio
High circulation distance
Residential Clusters: Controlled Density and Enclosure
Residential clusters prioritize continuity, privacy, and efficient movement. In low-density residential configurations, units are arranged around shared courtyards and semi-private circulation paths. Visual connections are moderated, balancing openness with enclosure to support domestic use.
High-density residential clusters consolidate these relationships into tighter formations. Circulation distances are reduced, continuous floor areas increase, and spatial hierarchies become more legible. The resulting clusters are denser and more inward-focused, reinforcing a sense of enclosure while maintaining access to shared outdoor spaces. Across both densities, residential clusters remain spatially compact and efficient.
Fig. 90 :Low Density Residential Unit, created by author
Fig. 91 :High Density Residential Unit, created by author
High visual connectivity
High continuous and usable floor areas
High open space ratio
High circulation distance
Open Clusters: Horizontal Expansion and Porosity
Open clusters are characterized by high open space ratios and strong visual connectivity. In low-density versions, built volumes are dispersed, allowing landscape, vegetation, and circulation to dominate the spatial experience. Structures act as anchors within a largely open field, supporting flexible use and movement.
High-density open clusters increase built volume while preserving porosity. The system stacks and interlocks modules without closing off visual or spatial connections. Circulation distances increase, reinforcing exploration and flow. These clusters demonstrate how openness can be maintained even as density rises, provided the underlying spatial logic remains consistent.
Fig. 92:Low Density Open Unit, created by author
Fig. 93 :High Density Open Unit, created by author
Clusters - Open Units
High visual connectivity
High continuous and usable floor areas
High open space ratio
High circulation distance
Market Clusters: Circulation-Driven Aggregation
Market clusters emphasize movement, exchange, and visibility. In lowdensity configurations, stalls and units spread horizontally, creating clear paths and generous thresholds between public and semi-public spaces. Circulation networks are explicit and legible, supporting ease of navigation.
High-density market clusters intensify this logic. Units stack and interlock around central circulation routes, increasing activity concentration and visual overlap. Circulation distance increases as paths weave through multiple levels, reinforcing the market’s role as a dynamic, highly interactive environment. Despite higher density, access and openness remain central to the cluster’s performance.
Fig. 94 :Low Density Market Unit, created by author
Fig. 95:High Density Market Unit, created by author
Clusters - Market Units
Cluster Adaptability and Incremental Growth
Across all cluster types, low-density configurations are intentionally designed for ease of extension. Structural logic, circulation paths, and open interfaces allow clusters to grow, reorganize, or adapt over time in response to environmental, social, or programmatic change.
This capacity for incremental growth ensures that clusters are not static objects but evolving systems. Expansion does not disrupt existing spatial relationships; instead, new modules plug into established logics, preserving coherence while enabling transformation.
Cluster Growth Logic: Modules for Extension
The extension diagrams illustrate how each cluster type accommodates growth. Modules are designed to open outward along predefined edges, allowing additional units to attach without compromising circulation or structural clarity. Cultural, market, open, and residential clusters each expose different extension opportunities based on their functional priorities.
This growth logic enables the system to respond dynamically to changing needs. New units can be added, removed, or reprogrammed, reinforcing the idea of architecture as a living framework rather than a fixed composition.
Fig. 97:Low Density Residential Unit for expansion , created by author
Fig. 96 :Low Density Cultutal Unit for expansion , created by author
Consolidation into Stable Configurations
As clusters mature, extensions consolidate into stable spatial configurations. Circulation networks become more defined, structural systems regularize, and programmatic relationships settle into functional layouts. Importantly, this stability does not eliminate flexibility.
Even in consolidated states, clusters retain the capacity for future reorganization or expansion. The system balances resolution with openness, ensuring long-term adaptability without sacrificing spatial clarity or performance.
Fig. 99:Low Density Open Unit for expansion , created by author
Fig. 98:Low Density Market Unit for expansion created by author
Fig. 100: Sections of the clusters , Created by Author
Fig. 79 : Datascape and Green patches , Created by Author
Global Scale Development
At full scale, the project reads as a constellation of clustered systems distributed across the datascape. Rather than a single continuous mass, development appears as interconnected fields shaped by performance criteria, environmental constraints, and phased growth.
This global configuration reflects the underlying logic of the generative process: complex spatial structures emerging from simple rules, continuously negotiated through evaluation, selection, and adaptation. The result is a resilient and responsive spatial system, capable of evolving while maintaining coherence at both local and territorial scales.
At the global scale, the project begins by establishing a datascape that maps density, programme, and environmental conditions across the site. This datascape acts as a spatial framework, guiding how development potential is distributed rather than prescribing fixed outcomes. The objective is to understand how density and function can emerge in relation to terrain, flow lines, proximity, and visual connectivity.
To support this process, the site is subdivided into a grid of standardized spatial slots, each measuring 27 × 27 × 27 metres. These slots are aligned to the underlying topography and environmental flows, creating consistent reference points for insertion and evaluation. By maintaining uniform slot dimensions, different spatial configurations can be compared objectively in terms of performance and spatial behaviour.
Clusters are then selected from a predefined library based on their functional characteristics and suitability for specific zones within the datascape. Each insertion responds to local conditions, allowing programme distribution to adapt to terrain dynamics while maintaining coherence at the larger scale. The attachment of clusters follows a logic defined by functional relationships, ensuring continuity of movement, shared flows, and coordinated performance across adjacent areas.
Global Scale: Clusters, Functions, and Modules
At the next level of resolution, the system defines a family of modular clusters derived from eight primary typologies. These typologies are translated into multiple module variations by adjusting key parameters, producing a diverse yet controlled set of spatial configurations. Every module is designed to fit precisely within the predefined slot dimensions, allowing seamless aggregation across the site.
Each module represents a specific functional condition such as residential, cultural, market, or open space and exists in both finished and extension states. This distinction allows the system to encode not only present use but also future growth potential directly into the spatial logic. Rather than treating expansion as an afterthought, adaptability becomes an intrinsic property of each module.
Fig. 101: Distinct unit typologies, Created by Author
Proximity
Distances between the zones based on the functions
Density Zones
These are the zones where the substructures are present in the respective phases of development
Visual connectivity
Visual connections of spaces with the cultural zones
Fig. 102 : Goals for the global scale aggregation , Created by Author
A multi-objective evolutionary algorithm is employed to generate spatial aggregation by evaluating multiple performance criteria in parallel. Functional proximity governs distances between programmatic zones based on their relationships, density zones define where substructures emerge across successive phases of development, and visual connectivity assesses lines of sight between spaces, particularly in relation to cultural zones. The algorithm is executed over 100 generations with a population size of 50 individuals per generation, allowing candidate solutions to be iteratively evaluated, selected, and recombined. Through this process, trade-offs between competing objectives are progressively negotiated, enabling a spatial configuration to emerge from performance-based rules rather than from a predefined formal structure.
Performance and Events
Aggregation Rules and Spatial Hierarchies
The aggregation of modules follows a set of rules derived from spatial hierarchy and functional density. Certain programmes require greater proximity or continuity, while others benefit from openness or separation. These relationships establish an ordering from residential to cultural, market, and open functions that guides how clusters attach and grow.
Proximity constraints regulate distances between zones based on programme requirements, ensuring functional compatibility and efficient movement. Density zones indicate where development intensifies or loosens, reflecting different phases and intensities of occupation. Visual connectivity further informs placement, reinforcing spatial relationships between cultural anchors and surrounding spaces.
Through these layered criteria, aggregation becomes a negotiated process rather than a fixed composition, allowing spatial order to emerge through rule-based interaction.
Central Zone
Nam Ghar , Residential & Occupational zones
Open Area
Mostly open area , for agricultural practices and further development
Mapping the Initial Phases
Once functional and density rules are established, the system maps initial development phases across the site. Functional overlays illustrate how different programmes distribute spatially, while density overlays distinguish between fully developed modules and those reserved for future expansion.
High-density areas indicate zones that have reached spatial maturity and are therefore constrained from further growth. These areas are identified as part of the initial development condition and retain their internal substructures. In contrast, lower-density zones remain open-ended, signalling capacity for future adaptation.
By overlaying function and density, the system identifies stable cores and flexible edges, establishing a clear spatial logic for phased development.
Fig. 103 : Function overlay on the generated settlement , Created by Author
Fig. 104: Density overlay on the generated settlement , Created by Author
Density and Sedimentation
To refine early-stage development strategies, density distributions are overlaid with sedimentation patterns. Sedimentation here refers to the accumulation of spatial intensity over time, influenced by performance, connectivity, and occupation. This comparison allows precise identification of areas best suited for early intervention.
Phased zones emerge from this analysis, each corresponding to a distinct density grade. Phase 1 areas represent foundational clusters with strong performance and occupation potential. Phase 2 zones support intermediate expansion, while Phase 3 areas accommodate later growth with lower initial density requirements.
Rather than expanding uniformly, development progresses through sedimented layers, reinforcing successful spatial conditions before extending outward.
Fig. 105: Density distribution, Created by Author
Phase-Wise Development Strategy
Development unfolds incrementally through clearly defined phases. Initial phases introduce low-density substructures that establish circulation, access, and functional anchors. Subsequent phases build upon these foundations, increasing complexity, density, and programme diversity.
Each phase strengthens spatial continuity while preparing the system for the next level of growth. Circulation networks evolve alongside built form, ensuring that expansion does not compromise coherence or performance. The result is a development model that grows through accumulation rather than replacement, preserving spatial logic across time.
Fig. 106 : Phasewise development , Created by Author
Gradient map Overlays
The gradient overlays establish a direct relationship between hydrological processes and proposed spatial interventions by integrating sedimentation data derived from riverine parameters with the architectural framework of the site. The sedimentation gradient, generated through a machine-learning model captures patterns of sediment behavior over time and translates them into a spatially legible format. When overlaid with the sediment gradient produced from the proposed spatial plan, this approach enables a comparative reading of natural sediment dynamics against planned structural configurations.
Fig. 107: Sedimentation gradient vs Settlement Density gradient , Created by Author
Sediment Persistence Index (SPI)
The Sediment Persistence Index (SPI), which synthesises several layers of site data into a continuous geographical gradient, offers a thorough depiction of subsurface sediment behaviour. This gradient makes it easy to compare regions of different stability since it shows how the site’s sediment conditions are constantly maintained. Sediments that exhibit long-term continuity and resistance to disturbance are represented by zones with higher SPI values. These sediments are more suitable for substructure placement and have a greater capability to support structural loads.
On the other hand, regions with lower SPI values show more unpredictability and uncertainty in sediment conditions, which may increase geotechnical risk and necessitate further research or engineering intervention. The SPI serves as a decision-support framework, directing foundation design, site planning, and risk management by coordinating constructed interventions with the ground’s natural behaviour by combining intricate subsurface data into a single, understandable index.
Fig. 108 : Sediment Persistence Index (SPI). , Created by Author
Phase wise Development : Phase 1
WYear 0 : Initial Intervention
The initial intervention in an unstable fluvial terrain occurs during the first phase. A sparse set of primary nodes is inserted directly into the river system instead of building on presumptive ground. These components serve as ecological and spatial anchors that are positioned to interact with suspended sediment and current flow patterns. Currently, architecture serves as a framework for infrastructure rather than as a form that can be inhabited.
Phase wise Development : Phase 1
Year 1 : Early Seeding
Additional units are incrementally deployed around the initial anchors. Their distribution remains porous, maintaining water permeability while gradually reducing flow velocity. At this stage, the settlement behaves as an ecological scaffold, prioritising sediment capture over occupation.
Phase wise Development : Phase 1
Year 2 :Emergent Ground
Sediment begins to accumulate as a continuous field rather than as discrete deposits. Zones of stillness and resistance start to appear in the riverbed, creating proto-land conditions. Architecture and terrain change in tandem, with man-made elements impacting the topography beneath them.
Fig. 111: Year 2 - Phase 1, Created by Author
Phase wise Development : Phase 1
Year 3 : Core Formation
The most resilient zones see an increase in structural density as deposition stabilises in specific locations. These areas, which can sustain transient activities without depending on long-term foundations, make up the settlement’s initial identifiable core.
Phase wise Development : Phase 2
Year 4 : Accretive Expansion
Growth extends along newly formed sediment ridges rather than following a predetermined geometry. The settlement footprint expands unevenly, guided by hydrological behaviour and material accumulation. Spatial organisation remains adaptive, responding to the river’s shifting logic.
Fig. 113: Year 4 - Phase 2, Created by Author
Phase wise Development : Phase 2
Year 5 :Ground Stabilisation
More continuous habitation is possible with thicker sediment layers. Both seasonal variability and recurrent spatial patterns are supported by the growing land. Because the ground is temporary, architecture is still lightweight.
Fig. 114: Year 5 - Phase 2, Created by Author
Phase wise Development : Phase 2
Year 6 :Vertical Differentiation
Vertical layering starts to appear as horizontal expansion slows. While higher levels facilitate living and storage, substructures continue to interact with water and sediment. As a result, a sectional hierarchy with depth-dependent permanence is introduced.
Fig. 115 : Year 6 - Phase 2, Created by Author
Phase wise Development : Phase 2
Year 7 :Peripheral Clustering
New clusters form beyond the primary settlement, responding to localised sediment build-up elsewhere in the river system. These secondary formations operate independently, testing how the land-building logic adapts to different hydrological conditions.
Phase wise Development : Phase 2
Year 8 : Secondary Stabilisation
Peripheral clusters begin to generate their own stable ground. Multiple sediment fields now exist simultaneously, transforming the project from a singular settlement into a distributed territorial system.
Fig. 117 : Year 8 - Phase 2, Created by Author
Phase
wise Development : Phase 3
Year 9 :Networked Landscape
Cluster relationships become visible in space. Without official infrastructure, the area is naturally structured by water channels, migration routes, and ecological corridors. Instead of acting as a core, the colony operates as a network.
Phase wise Development : Phase 3
Year 10 :Programmatic Differentiation
Programmatic variation increases as uneven ground conditions stabilise. While more recent zones continue to be seasonal and flexible, areas with longer sediment histories enable higher densities and longer occupations.
Fig. 119 : Year 10 - Phase 3, Created by Author
Phase wise Development : Phase 3
Year 11 :Relative Equilibrium
Multiple sediment fields merge into a larger, continuous landmass. The settlement reaches a momentary balance between water, ground, and built form. Permanence here is conditional, rooted in accumulated sediment rather than fixed construction.
Phase wise Development : Phase 3
Year 12:Open System
Even after extended development, the settlement remains temporally open. Erosion, re-deposition, and migration are anticipated rather than resisted. Architecture is understood not as an end state, but as an evolving participant within the river’s long-term dynamics.
Fig. 120:Year 12 - Phase 3, Created by Author
Kit of Parts : Panelling system
The paneling system is designed as a modular kit of parts that integrates seamlessly with the bamboo structural framework, allowing for flexibility in assembly, disassembly, and repair.
Fig. 121 : Kit of Parts, Panelling system -Exploded view, Created by Author
The kit of parts consists of two key components, the panel system and the bamboo structural framework. The panel system focuses on reusable formwork and modular aggregation, allowing panels to be produced repeatedly with minimal waste and assembled in various configurations.
Each panel is designed to suit different habitable unit typologies, ensuring flexibility in how they can be arranged and connected. This modular approach enables easy assembly and disassembly, making it possible to adapt the layout over time, replace damaged sections, or expand living spaces as user’s needs change.
By integrating the bamboo framework with the panel modules, the system achieves both structural stability and design adaptability. The result is a construction method that is cost-effective, locally producible, and scalable, while also supporting long-term resilience.
It consists of three key structural members and the infill panels:
1. Primary Member (Bamboo Frame)
• Acts as the main load-bearing element of the panel module.
• Constructed from whole bamboo sections, it provides the overall frame and stability for the assembly.
• Designed to withstand both vertical and lateral loads, ensuring durability even in flood-prone conditions.
2. Secondary Member (Bamboo Slats)
• Positioned horizontally within the frame, these slats create a rigid support grid for attaching panels.
• Their spacing and arrangement help distribute loads evenly and reduce deformation.
• Bamboo slats also improve the panel’s resistance to bending under pressure.
3. Tertiary Member
• Functions as a connector or hinge element, allowing for precise alignment between adjoining panels.
• Enables easy assembly and disassembly without the need for specialised tools.
• Provides flexibility in modular aggregation, allowing the system to adapt to different building typologies.
Panels (70 × 40 cm)
• Cast using the tested earthen mix with coir–jute reinforcement and interlocking edges for stability.
• Designed as lightweight cladding units that can be easily replaced if damaged.
• The interlock design ensures tight connections, improving both structural performance and weather resistance.
Kit of Parts : Panelling system
Square Panels ( 3m per side )
Eqi.Triangle Panels ( 3.6m per side )
Right triangle Panels ( 3.2m ,2.6m ,1.5 m per side )
Fig. 122: Kit of parts - Panel types , Created by Author
Fig. 123: Kit of parts : Configurations , Created by Author
A compact, regulated set of planar components that may be repeatedly assembled to produce the overall form define the kit of parts. The predominant vertical and planar surfaces are formed by square panels, which serve as the main modular pieces. Equilateral and right-angled triangle components add slope, direction, and transition.
The reference diagram’s blown logic suggests that complexity arises not from custom pieces but from repetition, rotation, and recombination. A system that is modular, effective, and able to generate a variety of spatial outputs from a small family of components is reinforced by quantified parts and consistent dimensions.
Fig. 124 : Kit of parts : Panel A&B, Created by Author
40
Kit of Parts : Panelling system
With a greater focus on triangle modules as active form-givers, the same kit-ofparts reasoning is maintained. Together with square panels, these components articulate roof-like surfaces and angled walls, enabling the structure to change orientation while preserving a consistent design language.
Standardised dimensions and uniform surface treatment imply interchangeability throughout the system, where volume and enclosure are accomplished through assembly techniques rather than additional components. The end product is a coherent modular framework where the way components are assembled, stacked, and orientated determines spatial richness.
Fig. 125 : Kit of parts Panel C, Created by Author
24
The panelling system converts the same modular logic into a regulated set of planar components that specify enclosure, surface, and spatial articulation, building on the more general kit-of-parts approach. Triangular modules add diversity through slope, direction, and transition, while square panels form the main vertical and horizontal planes, ensuring structural regularity and dimensional consistency. When combined, these components strengthen the continuity between form, structure, and assembly by enabling walls and roofs to be articulated without deviating from the underlying system.
Rather than using custom parts, the panelling system’s complexity arises from repetition, rotation, and recombination. Deploying a small family of standardised panels in quantifiable sets allows for a variety of spatial results while preserving construction and fabrication efficiency. The approach facilitates flexibility in orientation and aggregation by emphasising interchangeability and consistent surface treatment, guaranteeing that spatial richness is attained through assembly logic rather than added complexity.
Kit of Parts : Panelling system
Fig. 126 Required panels for the cluster , Created by Author
Cultural Completed Unit
Total useable area : 450 m2
Fig. 127 : Cultural Cluster ,a completed unit , Created by Author
Incremental assembly
Ground preparation involves the fabrication and assembly of substructure modules on land prior to installation. These modules are produced in controlled conditions to ensure dimensional accuracy and structural consistency before being positioned on site. This stage establishes the foundational elements of the system, enabling efficient deployment and minimizing on-site intervention during subsequent phases.
The panelling system converts the same modular logic into a regulated set of planar components that specify enclosure, surface, and spatial articulation, building on the more general kit-of-parts approach. Triangular modules add diversity through slope, direction, and transition, while square panels form the main vertical and horizontal planes, ensuring structural regularity and dimensional consistency. When combined, these components strengthen the continuity between form, structure, and assembly by enabling walls and roofs to be articulated without deviating from the underlying system.
Stage 1 : Ground preparation
Stage 2: Substructure & Sediment Framework
Fig. 128 : Stage 1 : Ground preparation , Created by Author
Fig. 129 : Stage 2 : Substructure & Sediment Framework , Created by Author
Elevated platforms are constructed on top of the substructure to establish habitable surfaces above fluctuating ground and water levels. These platforms define circulation routes, communal spaces, and zones for occupation, forming the first clear spatial order within the settlement. Their modular arrangement allows incremental expansion while maintaining coherence across varying heights and orientations.
A primary structural frame is erected, providing the load-bearing skeleton for vertical and horizontal expansion. This frame establishes dimensional consistency and structural regularity while remaining open-ended, allowing additional components to be attached, removed, or reconfigured over time. It functions as a long-term infrastructural armature rather than a finished architectural form.
Stage 3: Development of platforms
Stage 4: Primary Structural Frame
Fig. 130 : Stage 3: Development of platforms , Created by Author
Fig. 131 : Stage 4: Primary Structural Frame , Created by Author
Incremental assembly
Occupation begins once the primary structural and platform systems are in place. Inhabitable units are incrementally added to the frame, using modular components that allow variation in enclosure, orientation, and height. Spaces are adapted by occupants over time, responding to social needs, environmental exposure, and access conditions. This stage marks the transition from infrastructure to lived architecture, where use and modification become integral to the ongoing formation of the settlement.
As the settlement becomes established, natural sediment deposition occurs around and beneath the structural system. The substructure is designed to accommodate this accumulation, allowing sediment to settle and consolidate without disrupting occupation above. Over time, this process contributes to ground stabilisation, reducing reliance on elevated structures and enabling new relationships between built form and the landscape.
Fig. 132 : Stage 5: Occupation & Adaptation Created by Author
Fig. 133 : Stage 6 Sediment deposition and stabilisation , Created by Author
Stage 5 : Occupation & Adaptation
Stage 6: Sediment deposition and stabilisation
Incremental assembly
Incremental assembly
With increased sediment build-up and ground consolidation, previously unstable areas become suitable for further construction. New platforms and structures extend onto stabilised land, allowing the settlement to expand beyond its initial footprint. This stage demonstrates how environmental processes actively support architectural growth, enabling expansion that remains structurally and spatially connected to the existing system.
As conditions and requirements change, parts of the settlement are selectively dismantled, adapted, or replaced. The modular system allows buildings and platforms to be removed without compromising overall stability, while new functions are introduced in response to evolving social or environmental needs. This stage reinforces the cyclical nature of the project, where permanence is achieved through adaptability rather than fixed form.
Fig. 134 : Stage 7: Stabilising Land and expansion Created by Author
Fig. 135 : Stage 8: Removal and addition of new functions , Created by Author
Stage 7: Stabilising Land and expansion
Stage 8: Removal and addition of new functions
At this stage, the settlement undergoes simultaneous expansion and reduction. Certain structures are extended, reinforced, or adapted to accommodate continued use, while others are dismantled as functions shift or become redundant. The modular structural system allows elements to be removed without destabilising adjacent construction, enabling controlled contraction alongside growth. This phase reflects the settlement’s capacity to respond to changing social, environmental, and spatial demands without requiring comprehensive reconstruction.
Regeneration occurs as built structures, landscape, and ecological processes reach a renewed balance. Reduced architectural density allows vegetation and ground systems to reclaim portions of the site, while remaining structures support new forms of occupation and use. Architecture transitions from a dominant construct to a supporting framework within a broader environmental system. This stage does not represent a final condition, but a moment of equilibrium within an ongoing cycle of adaptation, decay, and renewal.
Fig. 136 : Stage 9: Expansion / Removal
Fig. 137 : Stage 10 Regeneration Created by Author
Stage 9: Expansion / Removal
Stage 10: Regeneration
Incremental assembly
Initial Phase - Year 0
Phase 2 - Year 4
Phase 2 - Year 7
Phase 3 - Year 9
Phase 3 - Year 11
Discussion
I. Aggregation Breadth and Functional Variability
Limitation
The global and regional scale aggregation framework is robustly optimised and demonstrates coherent spatial logic across multiple scales. However, the project foregrounds a limited selection of representative outcomes from a significantly larger solution space generated by the optimisation process. While this approach ensures clarity and legibility, it constrains the explicit exploration of alternative morphologies and functional distributions that the system can produce. As a result, variations in programmatic ratios such as differing balances between residential, cultural, agricultural, and open systems remain underexplored within the presented work.
Future Work
Future development could incorporate a broader sampling of high-performing yet contrasting aggregation outputs to reveal the full behavioural range of the system. Presenting multiple scenarios with varying functional percentages would allow the framework to operate as a comparative design instrument, enabling evaluation of trade-offs between density, function, and spatial dominance. This would strengthen the project’s capacity to support informed decision-making rather than converging prematurely on a single resolved configuration.
II. Sedimentation Experiments and Their Architectural Translation
Limitation
The sedimentation tank experiments are conceptually and methodologically sound, successfully capturing sediment behaviour under controlled flow conditions. These experiments form a strong empirical basis for understanding deposition, wake formation, and scour. However, as the project progresses into superstructure development and masterplan-scale organisation, the influence of these experimental findings becomes less explicitly articulated. While sediment logic informs early substructure placement, its direct impact on architectural
aggregation, orientation, and spatial hierarchy is not consistently traceable at later stages.
Future Work
Future iterations could reinforce the feedback loop between sediment experimentation and architectural decision-making by establishing clearer rule-based or parametric translations. Experimental outcomes such as sediment accumulation gradients or wake extents could be directly mapped onto superstructure density, orientation, and cluster spacing within the masterplan. This would further position sedimentation not merely as an initiating condition, but as a continuous and active driver of spatial organisation across all scales of development.
III. Density, Porosity, and Spatial Performance
Limitation
The project visually articulates a nuanced gradient of density and porosity, suggesting a rich interplay between enclosed interiors, semi-open thresholds, and open communal or productive spaces. However, these qualities are primarily communicated through formal and morphological representation. The relationship between degrees of enclosure and the range of activities they support social, cultural, productive, or ecological is not critically unpacked in detail. As a result, the spatial performance of porosity remains suggestive rather than analytically grounded.
Future Work
Further work could involve explicitly mapping activities, temporal use, and climatic response onto the porosity spectrum of the settlement. By analysing how enclosed, semi-open, and open spaces support different forms of occupation and interaction, the project could more clearly demonstrate how spatial openness
mediates between social life, environmental comfort, and adaptive use. This would extend the reading of density beyond quantity and into qualitative spatial experience.
IV. Substructure Fabrication, Dedicated Space, and Logistical Integration
Limitation
The substructures are critical to the project’s sediment-capturing and landforming logic, yet their fabrication requires a dedicated, continuous workspace to operate efficiently and seamlessly. In the current proposal, this fabrication space is not explicitly allocated as a functional zone within the settlement system. Additionally, when fabrication is assumed to occur along the riverbank, questions arise regarding the logistics of material handling, transportation, and assembly particularly how prefabricated elements are moved, staged, and deployed within dynamic riverine conditions.
Future Work
Future development could explicitly integrate fabrication and assembly zones as part of the functional ecosystem of the settlement, treating them with the same spatial and programmatic importance as residential, cultural, or agricultural spaces. If located along the riverbank, these zones could be linked to waterbased transport networks, enabling prefabricated substructures to be floated, towed, or incrementally assembled in situ. Mapping fabrication, storage, and transportation workflows would strengthen the project’s realism and clarify how construction processes co-evolve with settlement growth over time.
Concluding Reflection
Collectively, these limitations do not indicate unresolved gaps but rather expose the open-ended nature of the proposed system. The project operates as an adaptive framework rather than a fixed masterplan, intentionally leaving room for expanded variation, deeper feedback loops, and logistical refinement. By framing these aspects as future directions, the work positions itself as a scalable methodology, capable of evolving in response to environmental forces, material constraints, and social practices rather than a singular, static architectural solution
Appendix
Appendix I :Designing the Substructure
Appendix II : Material Experimentation
Appendix III : Designing the Settlement
Appendix I : Designing the Substructure
Every cluster is arranged into three mutually dependent layers: the sub-structure, the intermediate framework, and the superstructure. The sub-structure engages directly with the river, capturing sediments and providing stability to the system. The intermediate framework connects the foundation with the upper layers, transfers loads, and stabilizes the form.
Super structure
Habitale and community space for the communites
Intermediate structure
Structural support frameowrk between sub-structure and super structure
Sub-structure
Structural framework for Sediment capture
Designed for habitation, the superstructure houses residential units while providing light, shade, and comfort. These components work together to form a robust and integrated cluster system.
Fig. 138 : Cluster system, Created by Author
Cluster System
Micro-community Cluster detail
Emergence of Sub-Structure
The development of the sediment-capturing sub-structure began with the study of precedent systems where local materials were used as passive hydraulic interventions. A key case study highlighted how bamboo bundles, when submerged in flowing riverbeds, act as low-tech but highly effective obstacles that reduce local flow velocity, leading to targeted sediment accumulation.
This naturally occurring process was observed in the Majuli context itself, where community-installed bamboo fences unintentionally stabilized silt bars. Given bamboo’s local availability and biodegradability it was selected as the primary material. However, its biological limitations such as rotting under prolonged submersion and short lifespan (5–7 years) were acknowledged early on, and further reflected while taking overall design into consideration.
Fig. 140 : Existing methods for sediment accumulation in Majuli, Created by Author
Source
Dipika Dutta, Anil Kumar Misra, and Amit Srivastava. “Assessing River Bank Erosion on Majuli Island for Strength and Stability in Resilient Protection.” Geomechanics and Geoengineering 20, no. 1 (September 2024): 1–15.
To transition from a material insight to a design framework, a critical question emerged,
Does
form affect sediment capture, and if so, how?
This led to a series of computational sedimentation simulations, where multiple geometries like square, circle, pentagon, rectangle, hexagon, elongated octagon were tested under identical river flow conditions. The goal was to evaluate their performance based on scouring behaviour, turbulent wake formation, and net sediment accumulation.
Methodology Overview
Fig. 141 : Methodology overview, Created by Author
Site Selection
To initiate the site selection process, the primary criteria was to analyse the environmental data of Brahmaputra river. It was carried by ANSYS Fluent, focusing on river dynamics such as flow velocity, turbulence, and sediment transport behavior. These simulations were used to identify zones where natural deposition is most likely to occur and where architectural interventions could effectively guide and stabilize sediment. The analysis highlighted areas along the Brahmaputra that showed potential for reduced velocity and lower turbulence which are the key indicators for favorable sediment settling conditions.
In parallel, the existing functional distribution of Majuli was mapped using Rhino3D, Grasshopper, and tools like DeCoding Spaces and Elk incorporating data on residential clusters, agricultural fields, aquaculture zones, and culturally significant institutions such as the Satras. These were analyzed to identify meaningful points of connection between ecological processes and social infrastructure. Areas with strong functional overlap and cultural relevance were prioritized to ensure that new interventions would support community reintegration and local livelihoods.
The integration of river behavior analysis and land-use mapping informed a composite strategy for site selection, focusing on locations where environmental processes and human systems can coexist and be mutually reinforced. These sites were then shortlisted for further design development and prototyping.
For the initial site selection, velocity and turbulence of the river were considered for sediment-guided interventions. River velocity directly influences both erosion and sand transport: high velocities lead to scouring and land degradation, while lower velocities encourage sediment deposition, which is essential for the formation of stable chaporis. On the other hand, turbulence poses a challenge to land regeneration, as it disrupts sediment settling, weakens natural anchoring systems like vegetation roots, and intensifies erosion.
Together, these parameters inform a strategy for selecting zones along the river where architectural interventions can be most effective, prioritizing areas of lower turbulence and moderate velocity where sedimentation is more likely to occur and stabilize over time.
Building on this understanding, the design intervention follows the strategy that when architectural elements, such as stilted structures or barriers, are introduced in high-velocity zones, they can locally reduce flow speed. This controlled reduction in velocity creates favorable conditions for sediment to settle, gradually enabling the formation and stabilization of new land.
Fig. 142 : Site selection parameters, Created by Author
The workflow integrates simulation, optimisation, and material testing to create a responsive architectural system. CFD in ANSYS first analysed river dynamics, identifying 300 velocity points that defined suitable zones for intervention. Further, the machine learning pprocess expanded this dataset to 6,541 points, enabling precise mapping of flow conditions. A Multi-Objective Evolutionary Algorithm then optimised cluster placement for high-velocity zones and strong connectivity.
For the next step, form-finding combined structural efficiency of bamboo with Flow-3D simulations for sediment deposition.The best-performing geometry was then topologically optimised in TOPOS and translated into a voxelised lattice system for modular assembly. To validate the structure’s efficiency under hydrodynamic forces, FEA with Karamba3D for performed iteratively.
Finally, the superstructure was developed as a hierarchical frame linked to the sub-structure, hosting livable units arranged for light, volume, and mutual shading, resulting in a cohesive, adaptive system grounded in river dynamics.
Fig. 143: Water based settlement proposed structure, Created by Author
Fig. 144 : Water based settlement structure, Created by Author
Building structural and Morphology
Stage 1 : Water-Based Spatial Distribution Tool set :
Transitional
node
The transitional node is the intermediate design space where the functions from water as well as land come together and form a hybrid environment. This zone acts as a spatial and functional mediator, enabling this environment that accommodates both terrestrial and aquatic activities. The logistic hub in the transitional node acts as a critical infrastructural spine that supports the dynamic operations of both land-based and water-based settlements. This hub performs as a material and production node facilitating the following:
• Construction and Assembly Yard: A semi-open workshop area equipped for the prefabrication, repair, and modular assembly of residential and communal units.
• Agricultural and Aquacultural Processing and Storage: Dedicated units for storage and processing of aquaculture harvests (fish feed, nets, floating cages) and agricultural produce (seeds, harvested crops, tools).
The Communal Ghat serves as a dedicated cultural and gathering space, anchoring the community’s rituals, festivals, and everyday interactions. Traditionally situated along the riverbank, these spaces have been increasingly threatened by recurring floods, rendering the original sites unsafe. In response, the ghat is reintegrated into the transitional node, ensuring its continued cultural relevance and accessibility while providing a resilient, elevated, and adaptive platform that protects both people and practices from flood-related disruptions.
The water catchment zones are strategically located within the existing natural catchment areas, aligning with the community’s ongoing aquaculture practices. Beyond supporting food production, these zones are designed to function as multi-purpose flood mitigation systems. By harnessing the landscape’s inherent hydrological behavior, they serve as hard defense mechanisms, absorbing and regulating excess water during flood events while maintaining their productive role in the local economy.
Fig. 145 : Transitional node, Created by Author
The development of land-based settlement combined soil suitability studies with computational growth and optimisation methods to define resilient zones for habitation. Detailed soil analysis revealed a stratification dominated by clay and silt, where areas with excessive clay content were excluded due to their poor load-bearing capacity and susceptibility to shrinkage. This filtering process established the first layer of constraints for potential expansion.
Building upon this, a growth algorithm was employed to simulate how settlements could naturally extend outward from transitional nodes, which act as anchoring points for community, logistics, and cultural activities. The algorithm integrated both environmental limitations and spatial requirements, generating a framework of buildable zones that are better aligned with the island’s ecological conditions.
Stage 2 : Land-Based Spatial Distribution Tool set :
Fig. 146 : Land based settlement future projection, Created by Author
Material experiments and Prototyping
The framework outlines two parallel investigations: bamboo and panel systems. Bamboo specializes in treatment, waterproofing, joinery for both sub- and superstructures, as well as structural analysis.
Panel systems evolve from vernacular case studies to the composition of base materials (clay, sand, silt), followed by basic composition tests and formal material assessments, compression, thermal, and water resistance. This transitions into panel casting and the creation of a modular kit-of-parts system.
Fig. 147 : Material Experimentation workflow
Design Ideology
The recurring displacement of communities on the Chaporis of Majuli stems from the physical destruction of houses during floods and more significantly from the degradation of livelihoods tied to agriculture, fishing, and cultural continuity. The cycle of land shrinkage, triggered by relentless erosion and sediment loss, undermines the very basis of settlement. Addressing this challenge requires moving beyond short-term protective measures and towards a design ideology rooted in regenerative land-making.
The proposed framework seeks to reduce land shrinkage by strategically encouraging sediment deposition and stabilisation. By guiding the natural hydrodynamics of the Brahmaputra, new Chaporis can be cultivated as sites of habitation rather than fragility. These emergent landscapes are envisioned not as temporary grounds to be abandoned, but as evolving foundations for settlement and livelihood. Architecture here becomes a catalyst in sediment capture, acting simultaneously as shelter and as an ecological device that enables land to grow beneath it.
The design ideology therefore operates on three interdependent axes:
• Ecological: redirecting and strategically adapting to water flows to promote soil accretion, thus transforming flood-prone zones into fertile ground.
• Social: securing the continuity of livelihoods by anchoring displaced communities to new landforms that support agriculture, aquaculture, and cultural practices.
• Architectural: embedding adaptability into structural systems, ensuring that shelters are not static artefacts but flexible components aligned with cycles of deposition, erosion, and renewal.
Fig. 148: Design ideology, Created by Author
Selection
Objective:
To simulate peak monsoon river flow conditions in a braided segment of the Brahmaputra River adjacent to Majuli Island, in order to assess variations in velocity, turbulence, and sediment deposition potential for informed site selection.
Fig. 149 : Experiment setup, Created by Author Site
Site Selection
To identify optimal zones for sediment-intervention strategies, four key hydrodynamic parameters were extracted using CFD simulations in ANSYS:
1. Pressure maps reveal flow acceleration and construction zones critical to structural placement.
2. Velocity between 0.2-1.6m/s was identified as the optimal range for sediment transport and controlled deposition.
3. Turbulence was analysed to avoid areas of excessive vortices that could destabilise structures.
These combined layers informed a multi-criteria site selection process.
Fig. 150 : Hydrodynamic parameters, Created by Au-
Following the hydrodynamic analysis, the velocity, turbulence, and sediment deposition data were layered and spatially correlated to identify zones where conditions most favour natural sediment accumulation. These areas, outlined in red on the map, indicate zones of stable flow and consistent silt deposition ideal for anchoring sediment-capture substructures and initiating long-term land formation.
The final site was selected through optimization of flow data and stability parameters, further refined by its proximity to existing ferry ghats. This ensures both favorable deposition conditions and strong connectivity
Fig. 151 : Identified optimised velocity,turbulence and sand deposition zones for sediment accumulation , Created by Author
Sediment deposition Zones of accumulated silt and sand carried by the river’s flow.
Potential site location Derived from layered analysis of velocity, turbulence, and sediment deposition data.
Velocity
Turbulence
Sediment deposit
To evaluate hydrodynamic behavior along the Brahmaputra near Majuli, the river stretch was discretised into a CFD mesh, enabling accurate simulation of complex flow interactions within braided river channels. Using ANSYS Fluent, four different simulation cases were initially tested each varying in terms of inlet flow rate, sediment load assumptions, boundary geometry. These variations were designed to capture seasonal fluctuations, flood-stage conditions, and potential structural impacts on velocity and turbulence fields. This mesh formed the computational basis for the final site simulation and was developed to resolve localised flow variations critical to understanding sediment deposition behaviour near Majuli.
To enhance near-bed accuracy, five prism layers were applied at the riverbed and bank interfaces, improving resolution of bottom shear stress and turbulence generation.
Element sizes in refined regions ranged from 1.5 m to 2.5 m, while deeper midchannel zones were meshed more coarsely to optimise computational load. The mesh maintained high-quality thresholds, ensuring numerical stability during transient flood-stage simulations. This mesh allowed precise extraction of data from zones where velocity dropped below 1.6 m/s and turbulence remained under 12% conditions that support natural sediment deposition.
The resulting simulation provided high-resolution insight into the interaction between channel morphology and flow dynamics, directly informing the location of structural interventions without excessive generalisation.
Fig. 152: Turbulence analysis , Created by Author
Fig. 153 : Velocity analysis , Created by Author
Instead of choosing the site based on available land or fixed boundaries, the selection process was shaped by how the river behaves. A series of simulations helped identify areas where key river conditions like flow speed, pressure, and sediment build-up came together. These areas reflected zones where the river itself suggested potential.
Once these broader regions were identified, specific site points were narrowed down by looking at other important factors how close they were to ferry routes, how easy they would be to reach and build on, and connectivity to nearby cultural and community spaces across Majuli. This layered decision-making helped to choose the final site
Fig. 154 : Site identification , Created by Author
Building structure and Morphology
Water-based settlement development
Transitional nodes
Transitional nodes are central to defining cluster locations, acting as anchors for community logistics, storage, cultural activities, and workshops. Their role is to connect individual clusters into a coherent system, ensuring accessibility and shared resources. Along the river boundary, eight nodes were positioned at intervals of 500–800 m, a distance chosen to maintain walkable connections while covering the full extent of the site. Their placement also considered floodsafe elevations, sedimentation zones, and livelihood opportunities, making them resilient cores for future community growth.
Identifying Micro-community cluster locations
Following the first digital experiment for identification of site, the results were advanced to the next phase of the process which is to determine the potential micro community cluster locations. The interpolated velocity field acted as a base to accurately differentiate stable deposition zones from high-energy corridors. This data was overlaid with design criteria to highlight areas that were most appropriate for positioning clusters, thereby ensuring that the placement of interventions was directly aligned with the river’s natural flow dynamics and sediment accumulation patterns.
A machine learning model leveraging Multivariate Linear Regression was trained on this dataset to determine the relationships between known measurement points and their spatial coordinates. The model, once validated, was applied across the entire river domain to interpolate velocity values for a number of locations that had not been measured. This resulted in a continuous velocity field for the study area, providing a much higher-resolution understanding of flow distribution than could be obtained through direct measurement alone.
The model’s output enabled the accurate identification of high-velocity zones, which are crucial for designing strategic interventions. The study offers a reframing of these turbulent, energy-intensive areas as opportunities for controlled sediment capture, rather than viewing them as constraints. The suggested constructions aim to locally decelerate the flow in these high-energy corridors, resulting in micro-environments of reduced velocity that induce sediment deposition in zones that are otherwise unstable.
Fig. 155 : Selected site with transitional nodes, Created by Author
Construction workshop Aquaculture activities and storage Assembly yard Agriculture storage
Fig. 156 : Identifying low and high velocity zones (Machine learning) , Created by Author
Macro - zoning : Spatial distribution
After the identification of high- and low-velocity corridors across the site, the next step in the process involves delineating how micro-community clusters are distributed spatially. The allocation is not random; rather, it is directed by a series of interconnected objectives based on environmental performance, specific site conditions, and the river’s changing dynamics. Within this framework, connectivity emerges as a key factor, guaranteeing that every cluster is both self-sufficient and connected to other clusters through a coherent network. The transitional nodes serve as anchors within the system. These nodes act as intermediaries between water-based and land-based activities, functioning as points for exchange, circulation, and the initiation of growth.
With the area program and water flow velocity zones defined through machine learning model, this stage of the design focuses on creating micro-community clusters and deciding how they should be arranged across the site.
First, clusters need to be located in areas with maximum water flow velocity,which directly influences the sediment deposition and ensures better conditions for activities like aquaculture and sediment control. Second, the design aimed to keep spaces within each cluster close together, so daily interactions and shared resources would be more efficient. Third, clusters were positioned to be wellconnected to transitional nodes, which are the key anchors where water and land activities meet, such as logistics hubs, cultural ghats, or communal spaces.
By feeding these objectives into a multi-objective evolutionary algorithm, the design tests a number of possible arrangements and gradually improves them through optimisation. The result is a spatial distribution that isn’t just visually appealing but also performs well in terms of environmental conditions, community connectivity, and access to shared facilities.
Fig. 157 : selected site with transitional nodes, Created by Author
Goal 1 :
Maximising the connectivity between Micro-community clusters
Increasing connectivity among micro-community clusters promotes resource sharing, social unity, and cultural continuity. This connectivity allows for adaptive growth, enabling the settlement to reorganize in response to environmental changes while maintaining its cohesion.
Goal 2 :
Maximising the connectivity with the Transitional nodes
Ensuring connectivity with transitional nodes secures access to shared resources, mobility, and exchange between land- and waterbased systems. These connections anchor the clusters within the larger settlement framework.
Goal 3 :
Maximising the local flow velocities at the positions of the clusters
Positioning clusters in areas of higher local flow encourages effective sediment deposition around the sub-structures. This not only supports land-building over time but also stabilises the clusters within the river’s dynamic system, aligning settlement growth with natural hydrological processes.
Fig. 158 : Goals for Multi objective Evolutionary algorithm, Created by Author
for all three objectives, Created by Author
Fig. 159 : Pareto front solutions highlighting the best performing
The parallel coordinate plot visualises the optimisation trade-offs between cluster connectivity, links with transitional nodes, and local flow velocities. Each line represents a solution, with colours shifting from blue (early generations) to red (later generations), showing how the population gradually converged towards fitter configurations that balance spatial and environmental objectives.
These Standard Deviation Graphs show how fitness values evolved over generations for three key objectives: cluster connectivity, connectivity with transitional nodes, and local flow velocity at cluster locations. In all three graphs, a clear shift from red (first generation) to blue (last generation) indicates improved optimisation over time.
The narrowing curves, especially in the first and third graphs, suggest strong convergence towards high-performing solutions with reduced variance. The second graph shows slightly broader variance mid-process, reflecting a wider range of possible outcomes before stabilising. Overall, the results demonstrate effective generational improvement across all objectives.
Fig. 161 Standard deviation graphs, Created by Author
Fig. 160: Parallel co-ordinate graph, Created by Author
Fig. 162 : Isometric representation of Optimised Micro community Cluster locations, Created by Author
Optimised Micro community Cluster locations
Sediment Deposition
Each geometry was tested in a computational sediment simulation environment through Flow 3D (CFD software). Geometries with sharp corners, like the square and pentagon, created turbulent wakes and strong downstream scouring, which led to unstable accumulation zones. Circular and rectangular profiles reduced turbulence but were unable to trap sediment effectively, causing material to disperse further downstream.
The elongated octagon proved to be the most balanced form, with parallel sides that helped stabilise flow separation and chamfered ends that softened vortices. This combination created a uniform wake region where sediment could consistently settle, making it the most suitable shape for further development based on simulation.
A whole lattice structure was first developed on the elongated octagon based on eight simulation runs, which initially showed strong performance in terms of stability and integration. However, the material demand for this system was excessively high, raising concerns about efficiency and potential ecological impacts, such as increasing resistance in water flow and contributing to river braiding.
Fig. 163: Sediment simulation for base geometries, Created by Author
Fig. 164 : Selected Base geometry and Geometry with Lattice structure, Created by Author
Voxelised lattice structure for selected base geometry
Selected base geometry
Topology Optimisation
To address the problem of excess material consumption in the lattice structure of the base geometry, topology optimisation was identified as an effective strategy to minimise the material use. Through topology optimisation, the base geometry was refined to address various underwater load conditions and reduce material usage. In the first scenario, asymmetric loads resulted in irregular struts that were angled to one side, illustrating the system’s adaptation to localized hydrodynamic pressures. The second scenario, involving uniformly distributed loads, resulted in a dense and continuous lattice that optimized redundancy and strength, albeit at the cost of increased material use. On the other hand, the third case involved a combination of symmetric and axial loads, resulting in a centralized spine with paired lateral supports.
This configuration presented a form that was stable yet lighter, representing the most effective compromise between structural clarity and material reduction.
Collectively, these scenarios demonstrate the way topology optimization converts applied forces into different structural logics. Every outcome emphasizes distinct design potentials: resilience when facing uneven pressure, robustness during uniform loading, and efficiency in the case of balanced compression. The development of the superstructure was guided by these optimised patterns, which indicated which areas had to be kept solid, which could be thinned out, and where structural anchoring would work best.
Fig. 165 : Topology optimisation trying to retain
geometry’s profile
The optimised substructures that resulted were evaluated not just for structural efficiency but also for their capacity to capture and hold sediment within the flow. This assessment centered on the impact of each geometry on local hydrodynamics through turbulence generation, current redirection, and the creation of wake zones with diminished velocity. The slower zones function as natural deposition pockets, permitting suspended sediment to settle and accumulate around the structure over time. Through the simulation of these conditions, it was possible to assess the performance of each substructure based on the volume and stability of sediment retained over time.
Distinct behaviours were observed among the three variations :
The first case demonstrated structural resilience but resulted in irregular deposition patterns and unstable accumulation zones, which posed a risk of scouring at the edges.
The second case, featuring a dense lattice, was effective at capturing larger sediment volumes; however, this came at the cost of excessive material consumption and overly complex deposition channels that compromised longterm stability.
The third case demonstrated the most balanced performance, establishing a consistent wake region where sediment accumulated uniformly and without notable downstream erosion. This form represented the most effective synergy between structural optimization and ecological function, making it the chosen basis for further development of the superstructure.
Fig. 166 Topology optimisation trying to retain the base geometry’s profile
While the above process improved material efficiency, it also introduced a critical challenge: the resulting geometry was highly irregular and complex, making it difficult to fabricate or translate into a repeatable construction system.
To address this limitation, the strategy was reinterpreted as a framework of 1 x 1 x 1 metre lattice grid enabling a modular assembly logic that could be scaled or reconstructed based on the evolving conditions of the riverbed . This lattice approach made the sub-structure easy to assemble by local communities using familiar techniques, ensuring feasibility within Majuli’s context.
Fig. 167 : Lattice structure for whole cluster, Created by Author
Bamboo members treated for water resistance formed the structural framework, enabling high precision while maintaining the environmental performance of the original geometry.
This voxelated substructure was designed for permanent submersion, functioning as both the anchoring foundation and sediment capture mechanism.
1x 1x 1m voxels are incorporated It functions as a spatial boundary within which the selected morphology is embedded, subsequently transforming into a structured lattice framework
Fig.168 Lattice structure, Created by Author
In this experimental investigation, three Archimedean-derived solids were systematically selected and evaluated through structural simulation and morphological analysis.
The chosen geometries were:
(i) a chamfered tetrahedron
(ii) a wedge-like pyramidal hybrid comprising trapezoidal and triangular facets (iii) a truncated cube.
Each geometry was subjected to a dual process of assessment: firstly, structural analysis under simulated hydrodynamic and live load conditions, and secondly, a comparative visual classification based on geometric redundancy with respect to the number of polygonal faces and their spatial distribution. This approach enabled the identification of inherent inefficiencies in terms of repetitive face counts and load-transferring capacity.
Among the tested configurations, the truncated cube demonstrated superior performance against the pre-established objectives. Its structural resilience, combined with a balanced distribution of load paths across its truncated square and octagonal faces, allowed for effective dissipation of external forces. Consequently, the truncated cube was selected as the optimal geometry for further application. The validated geometry was subsequently embedded into a voxelated framework, occupying a standardised 1 × 1 × 1 metre volumetric unit within the substructure. By integrating the truncated cube at the voxel scale, the system evolved into a holistic lattice assembly, wherein each unit functions both as a discrete structural module and as part of a continuous network. This lattice configuration ensures global stability by counteracting hydrostatic and hydrodynamic pressures generated by riverine flow, while simultaneously supporting live loads transmitted from above. The outcome is a structurally efficient and resilient framework capable of long-term deployment in aquatic contexts
Fig. 169 : Geometry options and their structural analysis, Created by Author
By integrating the truncated cube at the voxel scale, the system evolved into a holistic lattice assembly, wherein each unit functions both as a discrete structural module and as part of a continuous network. This lattice configuration ensures global stability by counteracting hydrostatic and hydrodynamic pressures generated by riverine flow, while simultaneously supporting live loads transmitted from above.
Fig. 170 : Final geometry for lattice structure, Created by Author
Fig. 171 : Initial Structural analysis, Created by Author
The geometry went through several iterations of structural analysis to refine its performance. In the early stages, the focus was on identifying reinforcement points, evaluating stress concentrations, and eliminating unstable areas that could compromise overall stability. These initial assessments highlighted zones of weakness under applied load cases, which informed adjustments in the distribution of material and the placement of support members.
Fig. 172 : Optimised Structural analysis, Created by Author
Subsequent iterations moved towards optimising the geometry to reduce excess material while maintaining strength, gradually achieving a more efficient balance between structural stability and materially optimised.
Super structure :
The habitable superstructure was designed using Wasp field aggregation in Grasshopper. This method enabled the above-water components to respond to spatial and environmental field inputs such as sunlight exposure, wind flow, and mutual shading requirements.
Units were aggregated in a non-linear, field-responsive pattern above the voxelated substructure, ensuring alignment with load-bearing nodes and maintaining balance between density and environmental comfort.
Field based aggregation
The aggregation is taking place within the field provided for better control
The sub structure serves as a base for the development of the super structure and this development is done through a field based geometric aggregation as shown.
The substructure serves as a base and a platform for the development of the habitable space
Fig. 173 : Field based aggregation for super structure, Created by Author
After the aggregation of Wasp, voids were formed within the framework that could disrupt circulation routes, fragment habitable volumes, and reduce overall spatial efficiency. In order to tackle this issue, a supplementary gap-filling approach was implemented. This involved the strategic insertion of smaller units into residual spaces, so as not to disturb the original aggregation logic. This secondary layer had various functions: it augmented the usable floor area, guaranteed smoother transitions among clusters, and bolstered the continuity of the overall structure.
Simultaneously, the design prioritised the preservation of essential environmental attributes, including daylight ingress, natural airflow, and framed sightlines, ensuring the structure did not become over-densified.
Further, the aggregation process begins with larger units connecting to other larger units at their square faces, establishing the primary framework. Following this, small units link with other small units at matching square faces, forming intermediate layers within the structure. In the final stage, small units attach to bigger ones in a specific orientation, allowing continuity and integration across scales. Thus, through this sequential process, a coherent framework emerges, balancing structural stability with spatial adaptability.
Fig. 174 : Geometry Packing and connecting logic , Created by Author
Big units attach with big units at square faces
Small units units attach with small units st the square faces
Small units attach with bigger units at the square faces at a specific manner
Fig. 175 : Super structure and sub structure in a cluster, Created by Author
Intermediate Structure
As the superstructure was developed, the structural framework became a vital element that needed to be concentrated on. The integration of the substructure and superstructure was particularly challenging in terms of effective load transfer, as they were designed using entirely different strategies. One based on hydrodynamic and sediment capture performance, and the other based on spatial and inhabitation requirements. An intermediate structural framework was introduced to serve as a mediating system between the two layers in order to address this.
This intermediate framework starts at the lattice of the substructure, securing itself within its optimized geometry, and extends upward into the superstructure, where it branches and adjusts to support habitable volumes. Its main function is to ensure system stability by facilitating smooth load transfer, averting stress concentrations in specific areas, and improving overall rigidity.
Aside from its structural function, the framework creates interstitial spaces that are purposefully designated for utilities, vertical circulation, and service functions. The design achieves greater efficiency by embedding these non-habitable requirements into the structural system itself, freeing up the main spatial volumes for habitation while ensuring structural clarity and continuity.
Following the aggregation of the superstructure modules, a subsequent connective layer is established to integrate these units with the platform level which is the uppermost portion of the substructure positioned above the waterline. This layer serves both structural and spatial purposes, ensuring continuity across the system and enhancing the overall stability of the assembly.
To achieve this integration, a secondary aggregation process is employed. In this stage, the previously validated truncated cube lattice geometry is deployed along a defined curve. This curve traces the spatial path between the base of the superstructure units which vary in scale, including 3 × 3 × 3 metre and 4.5 × 4.5 × 4.5 metre modules and the corresponding nodes on the platform level. For this bridging aggregation, smaller truncated cube variants are used, each inscribed within a 0.25 × 0.25 × 0.25 metre bounding volume. This finer scale allows the system to adaptively fill the spatial voids between the larger modules, thereby ensuring a continuous and load-bearing connection.
Fig. 177 Framework guided by the paths, Created by Author
Fig. 176: Paths identified for intermediate structures, Created by Author
These micro-scale units act as structural mediators, enabling seamless transitions between scales and contributing to the overall integrity of the lattice network. This multi-scalar approach highlights the functional differentiation within the system where larger units provide habitable space and primary structure, and smaller units serve as connective tissue, enhancing adaptability, load distribution, and structural redundancy. The result is a hierarchically organised framework that responds efficiently to both architectural and environmental demands.
Fig. 178 : Final Intermediate structure framework Created by Author
The support units are aggregated along from the platform level and these member become the guide for the supporting units these curves resulting in the stability of the structure . these units are 0.5*0.5*0.5 meters in size.
Fig. 179 : Cluster system with final Intermediate structure, Created by Author
Integration of Habitable units
Fig. 180 : Integration of habitable units, Created by Author
Once the structural framework was established, the integration of habitable units was directed by a series of environmental and spatial performance objectives. The main aim was to maximize the entry of natural light, so that the clustered arrangement would be well illuminated in natural circumstances. The diagrams illustrate that unit placement was assessed for its effectiveness in preserving daylight access throughout the overall cluster, ensuring that deep interior areas do not become poorly lit.
Simultaneously, the number and allocation of units were taken into account in order to balance the demand for additional liveable space with the necessity of preventing over densification. To facilitate efficient circulation and connectivity, the clusters were grouped according to their proximity, resulting in coherent formations resembling neighborhoods. Finally, the idea of mutual shading was presented as a crucial element, leveraging the level differences within the aggregation. The framework accomplished a balance between solar protection and thermal comfort by permitting adjacent units to cast controlled shadows on each other, leading to habitable volumes that are both efficient and environmentally responsive.
Goals for Multi objective Evolutionary algorithm
The first objective sought to maximize the entry of natural light across the clustered arrangement. By doing so, the system ensured that even the deeper interiors of the aggregation remained sufficiently illuminated, reducing dependence on artificial lighting. The parallel coordinate plots and deviation graphs illustrate how unit configurations were assessed for their ability to preserve daylight access across varying depths of the cluster.
The second objective addressed density and liveability. While the algorithm aimed to maximize the number of habitable units, it simultaneously avoided over-saturation, which could compromise environmental quality and circulation. Configurations were tested for their ability to balance compactness with spatial porosity, producing neighbourhood-like clusters that allowed coherent movement and social interaction.
The third objective focused on mutual shading. By exploiting level differences within the aggregated system, units were allowed to cast controlled shadows on adjacent volumes. This not only mitigated excessive solar gain but also enhanced thermal comfort within the cluster. The outcome was a set of optimized configurations where shading acts as a spatial and environmental regulator.
Fig. 181: Objectives for congifurations, Created by Author
The parallel coordinate graph illustrates the trade-offs between natural light, number of habitable units, and mutual shading. Each line represents a solution, with the colour gradient showing generational progress. The convergence of lines highlights zones where the algorithm balances the three objectives of the experiment, revealing optimal trade-off configurations rather than a single best outcome.
Through this experiment, it becomes evident that when solutions from different generations are compared, distinct convergence patterns emerge that reveal the system's adaptation to balance competing objectives.
Solutions that optimise natural light often lessen mutual shading, while those with greater unit density risk over-compaction and degradation of environmental quality. This variability is underscored by the standard deviation graphs, which illustrate where trade-offs are most prominent. The results highlight the significance of multi-objective optimisation: rather than favouring one parameter.
Fig. 183 : Standard deviation graphs, Created by Author
Fig. 182 : Parallel co-ordinate graph, Created by Author
Habitable units configuration detail
To comprehend how the three-dimensional volumes that serve as habitable spaces interact and how liminal thresholds arise between them, the aggregated cluster undergoes a series of sectional examinations utilizing clipping planes. More than just a visual slicing of form, this method serves as a diagnostic tool that uncovers the internal organization of volumes, the relationships between solid and void, openness and enclosure, and the transitions that arise when spaces intersect and overlap. One can gain insight into the layered spatial conditions that may not be apparent from the exterior perception of the form by cutting through the cluster.
The sectional readings emphasize the development of diverse spatial typologies, from fully enclosed private units to semi-enclosed interstitial spaces that promote circulation, social interaction, or environmental buffering. It is crucial to note that the liminal zones serve as active mediators of spatial quality rather than being secondary or residual; they choreograph movement, frame views, regulate light and ventilation, and establish varying levels of porosity within the cluster.
Therefore, the act of “reading through” clipping planes converts the cluster from a single aggregated form into a catalogue of spatial conditions, each with its own unique affordances.
Fig. 184 : Clipping plane for Plans and Sections, Created by Author
Fig. 185 : Spatial distribution , Created by Author
The three-dimensional framework of the cluster is first evaluated to assess spatial capacity, circulation potential, and structural constraints. This evaluation involves the study of plans and sectional profiles across multiple levels, providing a comprehensive understanding of usable volumes and connectivity. Informed by this analysis, habitable living spaces are strategically positioned within the system to optimise functionality, accessibility, and overall performance.
Fig. 186 : Spatial distribution Created by Author
Fig. 187 : Spatial distribution Created by Author
Parameters to identify Buildable zones
For a land-based settlement in a flood-prone area, both environmental and contextual factors must be considered. Soil strength, agricultural land, natural drainage, and topography all shape resilience and long-term sustainability. The chosen site, once home to settlement development with Satras at its core, was abandoned after repeated floods eroded soil, damaged heritage, and displaced residents. Re-establishing here demands a strategy that addresses past vulnerabilities, reinforcing soil, protecting farmland, preserving drainage routes, and adapting layouts to terrain.
Soil Geographic Data
Majuli’s soils reflect the Brahmaputra’s shifting force, with coarse sands marking fast currents and fine silts recording calmer flows. The selected site, shown by the red arrow, lies in a clay- and silt-rich zone, dense, moisture-heavy, and slow to drain. While such conditions pose challenges for stability, the project reframes them as an asset: the high silt content enables effective sediment capture, gradually strengthening the ground and supporting water-based development.
Fig. 188 Soil geographic data of Majuli, Created by Author
Appendix II : Material Experimentation
This table presents the material experimentation matrix developed to test a range of composite panel prototypes by varying binders and stabilizers. The intention was to balance strength, porosity, and water resistance while relying on locally available resources.
Panels were grouped into three primary categories:
- Resin-based panels (Resin–Coir Structural, Bamboo Flex Resin, Resin–Lime Jute), which integrated synthetic resin with natural fibers and clay to enhance tensile performance and durability.
- Water or lime-slurry panels (Sand–Water Base, Sediment Filter Panel, Flood Resistant Panel, Jute–Lime Clay, High Clay Porous, Ultra-Light Clay Panel),
which explored low-tech clay–sand composites stabilized with water or lime slurry, designed for filtration, lightweight handling, and modular application. - Xanthan-stabilized panels (Xanthan Stabilized, Flexi-X Clay, Hybrid Clay-Lite), where the addition of biopolymer provided enhanced binding capacity, crack resistance, and flexibility for panels with higher clay content.
Each prototype combined different ratios of china clay, red clay, sand, iron oxide, and water with binders such as resin, lime slurry, or xanthan, alongside natural fibers (coir, jute, bamboo mat) or modifiers. The comparative trials enabled evaluation of which material mixes could achieve structural stability, ease of fabrication, and resilience in wet conditions, informing further refinement.
Fig. 189 : Panel casting process, Created by Author
Fig. 190 : Comparative analysis of existing vernacular wall system and proposed wall panel system, Created by Author
The prototype bamboo structure, developed using the proposed modular joinery system, demonstrates a maximum displacement of 2.60 cm with members of 15 cm diameter. Structural analysis verifies that load transfer occurs efficiently through the nodal connections, distributing forces into the foundation without inducing instability.
The performance indicates that the joinery system not only maintains geometric integrity under load but also provides sufficient stiffness for modular aggregation. This confirms the potential of the bamboo framework to act as a scalable primary structure, where local assembly can be achieved without compromising structural strength.
Fig. 191 : Structural analysis for bamboo assembly, Created by Author
Structural Analysis : Bamboo assembly
Fabrication and assembly
Super structure
After treatment and fabrication, the bamboo members are connected through multi-directional space-frame nodes that allow the system to aggregate in several directions, both horizontally and vertically. This flexible geometry makes the framework adaptable to different spatial and structural requirements, accommodating growth or reconfiguration of the modules over time. Each joint is secured with steel-reinforced joinery and precision-engineered clamps that not only align the bamboo members but also distribute loads evenly across the structure, reducing stress concentrations that could lead to premature failure.
The joinery system is designed with a clear emphasis on rapid assembly and disassembly. Its modularity enables trained local workers to erect a unit within a few hours, without the need for heavy machinery or advanced technical expertise. This efficiency is especially valuable in flood-prone regions, where temporary relocation or re-anchoring of units may be necessary. In terms of maintenance, the clamp-based system introduces resilience: if a bamboo member cracks, decays, or reaches the end of its service life, it can be quickly replaced on site without dismantling the entire structure.
Module Aggregation (On Water )
Fig. 192 : Super structure bamboo fabrication, Created by Author
Multi-directional Space Frame Node
Bamboo Foundation assembly
Efficient Replacement of Bamboo
Bamboo Assembly
Bamboo Joinery Assembly
Fabrication and assembly
Sub-structure
The bamboo sub-structure system is designed as a modular base where clustered bamboo members provide the primary foundation strength. These clusters are connected through a set of custom joinery types such as linear, angled, and multi-directional, that allow for flexible yet stable configurations. By enabling members to connect at different orientations, the joinery system ensures adaptability in assembly and supports variations in form without compromising structural strength.
The joints are proposed to be fabricated from Natural Fibre Reinforced Polymer (NFRP), a biodegradable material that combines sustainability with performance. NFRP enhances the tensile capacity of the connections, secures the bamboo members against shear and rotational stresses, and offers long-term resistance to water exposure. Together, the clustered base and NFRP joinery creates a scalable system that can be easily assembled by local communities, while also protecting the structure from degradation in the challenging hydrological environment.
Fig. 193 : Sub structure bamboo fabrication, Created by Author
Type 01
Type 03
Fig. 195 : Sub structure bamboo fabrication detail, Created by Author
The paneling system is designed to work with two distinct module types, each tailored to different construction needs while maintaining a unified assembly method.
Module Type 1 uses larger panels (3.2 m square and triangular units) to cover wider areas quickly, reducing the number of joints and creating cleaner, uninterrupted surfaces.
Fig. 196 : Kit of parts : Module type 1, Created by Author X 40
Module Type 2 features smaller panels (2.1 m square and triangular units), which are lighter and easier to handle. This allows for greater precision during installation, especially in complex geometries or smaller-scale structures where adaptability is key. The reduced size makes them more manageable for local fabrication and on-site assembly, while still ensuring a precise fit.
Both module types use the same interlocking panel detail and integrate directly with the bamboo structural frame, meaning panels can be swapped or replaced without dismantling entire sections. This modular approach supports quick construction, adaptability to different housing typologies, and long-term maintenance, all while using locally sourced, sustainable materials.
Fig. 197 : Kit of parts Module type 2, Created by Author
15
The configuration of the panels is directly informed by the solar radiation analysis, ensuring that each surface adapts to its specific environmental exposure. The analysis provides a gradient of radiation intensity across the framework, which then determines the type, density, and orientation of panels to be used. In high-radiation areas, panels are designed with denser layering and integrated shading features to effectively reduce heat gain and maintain interior comfort. Conversely, in areas receiving lower levels of solar exposure, lighter and more permeable panels are deployed to optimise daylight penetration and encourage cross-ventilation,
This logic enables the facade to act as a climate-responsive skin, dynamically tailoring its performance to different environmental conditions within the same cluster. Beyond thermal comfort and natural lighting, the system also contributes to material efficiency by deploying resources where they are most needed rather than uniformly across the structure. Moreover, by aligning with the modular kit-of-parts strategy, panels can be reconfigured, replaced, or upgraded over time, allowing the superstructure to adapt to seasonal variations or evolving community needs.
Fig. 198: Solar Radiation, Created by Author
Fig. 199: Configuration of panels, Created by Author
Appendix III : Designing the Settlement
Custom CFD C# Script For Datascapes
Credits : Author
using System; using System.Collections; using System.Collections.Generic; using Rhino; using Rhino.Geometry; using Grasshopper; using Grasshopper.Kernel; using Grasshopper.Kernel.Data; using Grasshopper.Kernel.Types; using System.Drawing; using System.Linq;
/// <summary>
/// This class will be instantiated on demand by the Script component.
/// </summary>
public class Script_Instance GH_ScriptInstance
{ #region Utility functions
/// <summary>Print a String to the [Out] Parameter of the Script component.</summary>
/// <summary>Gets the current Rhino document.</summary> private readonly RhinoDoc RhinoDocument;
/// <summary>Gets the Grasshopper document that owns this script.</summary> private readonly GH_Document GrasshopperDocument;
/// <summary>Gets the Grasshopper script component that owns this script.</summary> private readonly IGH_Component Component;
/// <summary>
/// Gets the current iteration count. The first call to RunScript() is associated with Iteration==0.
/// Any subsequent call within the same solution will increment the Iteration count.
/// </summary> private readonly int Iteration; #endregion
/// <summary>
/// This procedure contains the user code. Input parameters are provided as regular arguments, /// Output parameters as ref arguments. You don’t have to assign output parameters, /// they will have a default value.
/// </summary>
private void RunScript(List<Brep> Land, List<Brep> Obstacles, Vector3d FlowDir, double Speed, int Resolution, double Influence, double Decay, int StreamGridX, int StreamGridY, bool Reset, ref object FlowPts, ref object FlowVects, ref object
BoundingBox bb = Land[0].GetBoundingBox(true); double dx = bb.Diagonal.X / StreamGridX; double dy = bb.Diagonal.Y / StreamGridY; List<Point3d> gridPts = new List<Point3d>(); List<double> streamParam = new List<double>(); Vector3d baseVec = new Vector3d(FlowDir); baseVec.Unitize(); baseVec *= Speed; Vector3d flowUnit = baseVec; flowUnit.Unitize();
// 2. Build grid + flow projection---------------------------------for (int i = 0; i < StreamGridX; i++) { for (int j = 0; j < StreamGridY; j++) { double x = bb.Min.X + i * dx; double y = bb.Min.Y + j * dy; Point3d testPt = new Point3d(x, y, (bb.Min.Z + bb.Max.Z) / 2.0); Point3d projectedPt = Land[0].ClosestPoint(testPt); // Skip points inside any obstacle bool inside = false; foreach (Brep obs in Obstacles) { if (obs.IsPointInside(projectedPt, 0.01, true)) { inside = true; break; } } if (inside) continue; gridPts.Add(projectedPt); // Flow direction sorting parameter double t = Vector3d.Multiply((projectedPt - bb.Min), flowUnit); streamParam.Add(t); } }
// 3. Sort grid points along flow direction-------------------------------List<int> order = new List<int>(); for (int n = 0; n < gridPts.Count; n++) order.Add(n); order.Sort((a, b) => streamParam[a].CompareTo(streamParam[b]));
double maxVel = 0.0; Dictionary<int, double> sedimentMap = new Dictionary<int, double>(); Dictionary<int, bool> affectedMap = new Dictionary<int, bool>();
List<Point3d> flowPts = new List<Point3d>(); List<Vector3d> flowVels = new List<Vector3d>(); List<Color> flowColors = new List<Color>(); List<Point3d> sedPts = new List<Point3d>(); List<Color> sedCols = new List<Color>();
/// <summary>Gets the current Rhino document.</summary> private readonly RhinoDoc RhinoDocument;
/// <summary>Gets the Grasshopper document that owns this script.</summary> private readonly GH_Document GrasshopperDocument;
/// <summary>Gets the Grasshopper script component that owns this script.</summary> private readonly IGH_Component Component;
/// <summary>
/// Gets the current iteration count. The first call to RunScript() is associated with Iteration==0. /// Any subsequent call within the same solution will increment the Iteration count. /// </summary> private readonly int Iteration; #endregion
/// <summary>
/// This procedure contains the user code. Input parameters are provided as regular arguments, /// Output parameters as ref arguments. You don’t have to assign output parameters, /// they will have a default value.
/// </summary>
private void RunScript(List<Brep> G, int N, ref object Pts)
{ { if (G == null || G.Count == 0 || N <= 0) { Pts = new List<Point3d>(); return; }
List<Point3d> points = new List<Point3d>(); foreach (Brep b in G)
{ if (b == null) continue; foreach (BrepFace f in b.Faces)
using System; using System.Collections; using System.Collections.Generic; using Rhino; using Rhino.Geometry; using Grasshopper; using Grasshopper.Kernel; using Grasshopper.Kernel.Data; using Grasshopper.Kernel.Types; using System.Linq;
/// <summary>
/// This class will be instantiated on demand by the Script component.
/// </summary>
public class Script_Instance GH_ScriptInstance
{
#region Utility functions
/// <summary>Print a String to the [Out] Parameter of the Script component.</summary>
/// <summary>Gets the current Rhino document.</summary> private readonly RhinoDoc RhinoDocument; /// <summary>Gets the Grasshopper document that owns this script.</summary> private readonly GH_Document GrasshopperDocument;
/// <summary>Gets the Grasshopper script component that owns this script.</summary> private readonly IGH_Component Component;
/// <summary>
/// Gets the current iteration count. The first call to RunScript() is associated with Iteration==0.
/// Any subsequent call within the same solution will increment the Iteration count.
/// </summary> private readonly int Iteration; #endregion
/// <summary>
/// This procedure contains the user code. Input parameters are provided as regular arguments, /// Output parameters as ref arguments. You don’t have to assign output parameters, /// they will have a default value.
List<Tuple<int,int,string,string>> rules = new List<Tuple<int,int,string,string>>(); foreach (string r in Rules)
{ if (string.IsNullOrWhiteSpace(r)) continue; string[] p = r.Split(‘-’); if (p.Length < 4) continue; if (!idx.ContainsKey(p[0]) || !idx.ContainsKey(p[1])) continue; rules.Add(Tuple.Create(idx[p[0]], idx[p[1]], p[2].ToLower(), p[3].ToLower())); }
Func<string, Vector3d> dirVec = d => { if (d.Contains(“right”)) return Vector3d.XAxis; if (d.Contains(“left”)) return -Vector3d.XAxis; if (d.Contains(“above”)) return Vector3d.YAxis; if (d.Contains(“below”)) return -Vector3d.YAxis; return Vector3d.Zero; };
int maxIter = 180; double step = 0.35;
double repelK = 0.4 * Spacing; for (int it = 0; it < maxIter; it++)
{ List<Point3d> target = new List<Point3d>(centers); int[] counts = new int[n]; for (int i = 0; i < n; i++) counts[i] = 0; foreach (var rule in rules)
{ int a = rule.Item1, b = rule.Item2; string prox = rule.Item3, dir = rule.Item4; Vector3d v = dirVec(dir); double gap = Spacing + 0.5 * Rects[a].Width + 0.5 * Rects[b].Width; if (prox.Contains(“far”)) gap *= 1.5; if (prox.Contains(“near”)) gap *= 0.8;
Point3d t = centers[a] + v * gap * AdjStrength; if (counts[b] == 0) target[b] = t; else target[b] = new Point3d( (target[b].X * counts[b] + t.X) / (counts[b] + 1), (target[b].Y * counts[b] + t.Y) / (counts[b] + 1), 0); counts[b]++; } target[anchor] = siteCenter; for (int i = 0; i < n; i++)
{ if (i == anchor) continue; Vector3d pull = target[i] - centers[i]; centers[i] = centers[i] + pull * step; } bool overlapFound = false; for (int i = 0; i < n; i++) { for (int j = i + 1; j < n; j++) { double wi = Rects[i].Width, hi = Rects[i].Height; double wj = Rects[j].Width, hj = Rects[j].Height; BoundingBox bi = new BoundingBox( new Point3d(centers[i].X - wi * 0.5, centers[i].Y - hi * 0.5, 0), new Point3d(centers[i].X + wi * 0.5, centers[i].Y + hi * 0.5, 0)); BoundingBox bj = new BoundingBox( new Point3d(centers[j].X - wj * 0.5, centers[j].Y - hj * 0.5, 0), new Point3d(centers[j].X + wj * 0.5, centers[j].Y + hj * 0.5, 0));