


General Strategies
Figure Types
Question Types
Reasoning and Research Summary Questions
Non-Data Representation Questions
Conflicting Viewpoints Questions
The Science Test on the ACT is a unique experience. For many students, science is already an intimidating subject, and the wide scope of concepts that might appear on the ACT can make it quite scary. Furthermore, the entire format will be new for students who are transitioning from the SAT to the ACT, as the SAT has no counterpart similar to ACT Science. But once you get to know it a bit better, the Science Test won't seem nearly so frightening. Soon, you and Science will grow to understand each other, respect each other, perhaps even love each other.
The Science Test is composed of 40 questions in 35 minutes. It has no subscores, so you will only get a single score, from 1 to 36. The test is divided into 7 passages. Each passage will focus on concepts taken from one of four major fields of science taught in high school: Biology, Chemistry, Earth Science, and Physics. There will be at least one and no more than two passages from each field.
The passages will be made up of collections of data, results of experiments, or sets of hypotheses, and the questions will ask you to identify, analyze, or draw conclusions from that data. Usually, a passage will be accompanied by some set of tables, graphs, or other figures. Each passage will be one of three types: Data Representation, Research Summaries, or Conflicting Viewpoints. These passages may appear in any order, but the number ofquestions and passages will always be the same:
• Data Representation: These will present either a single set ofdata or several sets ofdata referring to the same situation or set of facts. Questions about these passages are often fairly straight forward and simply require you to read and interpret the information presented. Two or three of the seven passages will present you with some sort of graph or chart. The questions that follow will ask you to interpret the information given and to draw conclusions from it.
• Research Summary: These will present a series of different experiments which share a common topic ofinvestigation. In addition to questions about the data, you will find questions asking about the design of the experiment and how a hypothesis is tested, confirmed, or refuted. Two or three of the seven passages will present you with some sort of graph or chart. The questions that follow will ask you to interpret the information given and to draw conclusions from it.
• Conflicting Viewpoints: This passage will present a single set ofcircumstances and give several competing hypotheses that attempt to explain those circumstances. Questions will ask you to understand the hypotheses, both on their own and in relation to each other. One passage will give you two statements to read. The statements will deal with some controversial scientific question. The scientists who wrote the statements disagree with each other. You will be asked to evaluate the arguments of each, identify the points of disagreement, and recognize the evidence that each scientist cites in favor of his. viewpoint. You will not be asked to decide who is right.
Within each group of questions, the level of difficulty is graded. The first questions in the group are the easiest; as you go further into the group, the questions will call for deeper levels of under- standing. Three cognitive levels are tested in each group:
Understanding. These questions, about two in each group, test only your ability to know what the passage is saying. If it is a graph, do you know what the variables are and what values of them are presented? If it is an experiment, can you identify the nature of the
experimental problem and the kind of data that were taken? If it is a controversy, do you know what are the points at issue?
Analysis. About three questions will ask you to find the deeper meanings in the passage. If it is a graph, can you tell how the variables relate to each other and what is implied by the relationship? If it is an experiment, were controls adequate, and what conclusions logically flow from the data? If it is a controversy, how well do the arguments flow from the facts presented by each scientist?
Generalization. What further study might be suggested by the graph, experiment, or controversy? How do the results impact society at large? What does the study imply for systems that were not part of the study itself?
Science Facts
Students often associate the Science Test with the Math Test. After all, math and science are best friends, right? They go together. There's English & Reading, then there's Math & Science, right?
But in terms of the way you do questions, the ACT Science Test is vastly different from the Math Test. Sure, you'll see numbers here. The tables and graphs will be covered with numbers. But you won't have to do math very much. Calculators are neither allowed nor necessary on the Science Test. There will be no algebra, no arithmetic, no geometry. You won't have to solve equations for x or cross-multiply ratios or find the length of the third side of a triangle. While you might occasionally have to do some light addition or multiplication, usually the most you'll have to do with all these numbers is to judge relative quantity. Questions such as:
• Can you find a point on a graph?
• Given two numbers, which one is bigger?
• Given a list of numbers, do the values go up or down?
• Which answer choice is between two numbers?
In fact, the Science Test is a lot more like the Reading Test. Like reading passages, science passages will present some information and ask questions about the information presented. And like on the Reading Test, questions can be answered simply by going back to the passage and looking up the information you need.
Furthermore, questions on the Science Test will tell you where to go. Most questions will specifically mention which figure, table, or experiment contains the information you have to find. And even those that don't will have clues that can help you find the answer.
That brings us to the big secret: For the grand majority of questions on the Science Test, YOU DO NOT NEED TO KNOW SCIENCE. Very few questions expect you to know facts about science other than what's actually presented in the passage. And even these questions don't require a nuanced, sophisticated understanding of a concept; usually you don't need to know much beyond the definition of a word. Questions that require outside knowledge generally make up 5-10% of all questions. That means 90-95% of the questions can be done purely based on the information on the page.
In fact, you often don't even have to understand the passage itself! Because so many of the questions simply ask you to look up values in a table or graph, you don't have to understand what those values mean. You just have to match a weird word in the question to the same weird word in the figure.
Why is that? Why would they give me a science test that doesn't require me to know
science? Well, there's too much science in the world to be able to test it all in one 35-minute
section. If you've ever taken a science AP test or SAT Subject test, you know how many concepts are involved. And those tests each cover just one topic-the ACT Science Test covers four: biology, chemistry, physics, and earth science.
Instead, the ACT tests scientific thinking. You don't have to know specific concepts, but you have to know how to read the results of an experiment. You have to be able to tell whether the data supports a particular hypothesis. You have to understand why an experiment was set up in this way, not that way.
There is a special skill to taking a multiple-choice test. In some cases, there is even a danger of getting the "wrong" answer by knowing too much. This is because it may be possible to read into the question some subtle idea that did not occur to the person who wrote the question. Good item-writers try to avoid this pitfall, but they do make mistakes. In this test, the candidate who gets the right answer is not necessarily the one who knows most about the subject. It is the one who understands the passage thoroughly and bases the choice of answer strictly on the contents of the passage. Extraneous information can lead you to confusion and misinterpretation of the question.
But so many of those things simply require looking at the data. That's the very definition of science. You have a theory about the world, so you look at the world and see what happens. Then you write down what you saw and check whether it matches your theory. Bam! You just did science!
Now, we don't want to mislead you: you will most likely see some questions that expect you to know facts of science that are not given in the passage. And there will be some questions for which the necessary facts are given to you in the passage-so you don't need to know them-but the question is a lot easier if you already do. Yes, the more you remember from your science classes, the more comfortable you'll be. Our point is that unless you're trying to score above 32, your knowledge of science facts is not what will make or break you your score on this test. Because the test draws from so many different fields, there's no way of knowing which topics will be the ones you see. Don’t study for this test by cramming three years' worth of science textbooks. Your ability to read and interpret data will have a much greater impact on your score.
As we saw on the Reading Test, timing on the Science Test can be very tight. You've got 40 questions to do in 35 minutes. Many questions involve nothing more than looking up a number in a table and can be done very quickly, but even easy questions can take time when they're surrounded by Fancy Science Words. And the pressure of tight timing can lead to careless mistakes. There are several things that can help you move faster and improve accuracy.
Don't read the passage.
One reason science passages take so long is that reading the passages is a burden. They're long, they use confusing words, and they discuss complex issues that can go completely over your head. But most questions on the ACT simply ask you to retrieve or analyze the data on the tables and figures, so you don't need a deep understanding of the concepts involved.
When you first get to a new passage, don't read it. Dive into the questions. You can get a lot of questions just by matching the values and key words given in the question to the same values and terms in the figures. We realize that sometimes it can be scary to jump into the questions without knowing what the passage is about. If you like, you can skim it to get a sense of what's going on, but do so quickly. Just get a general sense of what's going on. If you don't understand some concept or detail, skip it and move on.
Obviously, not every question will just rely on looking up numbers; sometimes you will have to read and understand the content of the passage. But when that happens, you can always go back. Don't try to absorb all the information from the beginning-worry about that information when you need it, when you're asked about it. You don't have a lot of time on this test. Don't spend time trying to understand something unless a question asks you to understand it.
One slight exception here is the Conflicting Viewpoints passage. These passages tend to be more text-heavy and use far fewer tables and figures than the other passage types. Instead, they present several different hypotheses and explanations for a given set of facts and circumstances.
For questions on these passages, you will generally need some understanding of the difference between the various hypotheses. 3 | P a g
But often you just need a bare understanding of what the hypotheses are-the main ideas. These passages are written in clear, direct language, so the main idea is usually given in the first sentence. So just underline the first sentence of each viewpoint. Skim or ignore the rest. That should give you a good summary, and you' II be ready to start the questions.
Use Target Numbers.
Our general rule for the ACT as a whole still applies: accuracy is more important than bulk. This is the idea behind Target Numbers: only do a certain number of questions and guess randomly on the remainder. That way, you'll have fewer questions to do in the same amount of time. Therefore, you'll have more time for each question, you'll have a better chance of being accurate on the ones you do, and you'll get more points overall.
On the Science Test, that means it may be to your benefit to skip an entire passage. The following table shows you the target scores you can get if you skip 1 or 2 entire passages on the Science Test
The scores listed here are approximations. These are not guarantees; they're goals. Here are a few things to keep in mind about this table:
As always, you must never leave any questions blank. The above calculations assume that you guessed randomly on the questions you skipped and got about 25% ofthem right These numbers may vary depending on how lucky you were in these guesses. Remember: there is no penalty for guessing There is no possible drawback to guessing randomly on questions you skip.
The first row in the table shows the high end ofwhat you can achieve, assuming you get all the questions you do correct, plus a few random guesses. But you probably won't get 100% ofthem right The second row shows what your scores will look like if you miss 1 question in each passage you do.
The scores are shown as ranges because different passages have different numbers of questions, so the total number of questions you skip may vary. If you skip more questions, you have a lower maximum possible score, but you'll have more time to get the questions you do.
- In the Skip 1 column, the low number assumes you skip a Conflicting Viewpoints (7 questions) and the high number assumes a Data Representation (5 questions).
- In the Skip 2 column, the low number assumes you skip a Conflicting Viewpoints and a Research Summaries (7 + 6 = 13Q) and the high assumes two Data Representation passages (5 + 5 = 10Q).
- Remember that each test form has its own particular scoring table. We computed these figures by looking at past real tests and finding the average final score for a given raw score. But the scoring table for the real ACT you take will vary. A raw score of30 (that is, getting 30 questions right) might give you a final score of 25 on one test but a final score of27 on another test
To repeat: these numbers are not exact. They are approximations.
So how many passages should you skip? Think about your starting score and your goal. For example:
- Say you're currently getting around a 17 on the Science Test. You can skip 13 questions over 2 passages, get a bunch ofquestions wrong, and still get a 22, a 5-point score increase. That's great!
- Say you're getting a 21. You could skip 1 passage, miss 5-6 questions, and end up with a 26. You could skip 2, but you would have to be sure you get most of them right to get up to that range.
- Say you're getting a 25. You can skip 1 passage, get nearly all ofthem right, and get a 30.
- If you want to get above a 30, you need to do all the passages. But you may consider doing the passages in a different order in order to maximize your chances. So which passage should you skip? There are a few possibilities:
Skip the last passage.
This is the easiest method to remember. Don't worry about the content or structure of the passage, just skip the last one. While the ACTdoes not release information about howit orders individualquestions on the Science Test, our anecdotal evidence seems to suggest that passages (not the questions) are ordered by difficulty. That is, the last passage pollen features the most complicated reasoning, unconventional graphs, or difficult subject matter. So that might make it a good passage to skip.
Skip the Conflicting Viewpoints passage.
The Conflicting Viewpoints passage-the one with 7 questions that asks about multiple theories on the same topic-is generally very light on figures and heavy on text. That means it will generally have fewer questions involving simple data lookup or comparison. As a result, even if the Conflicting Viewpoints passage isn't necessarily harder than other passages, it will be more of a time suck.
The downside to skipping the Conflicting Viewpoints passage is that it means you will skip more questions - 7 instead of 5 or 6.That extra skipped question means you're saving more time, but it also means your maximum possible score will be a bit lower. If you're trying to get a score above 29, you may not want to skip that many questions. Consult the chart above for more details.
Skip the passage on the subject you like the least.
The passages will draw from the fields of biology, chemistry, physics, and earth science. Within these subjects are a variety of subtopics; for example, a biology passage could be about genetics, zoology, cellular structure, or other topics. If say, you particularly hate, fear, or are bad at genetics, you may want to skip a passage that discusses genetics.
However, it's dangerous to use this to decide what to skip because you can't predict which sub-topics will appear on any given test. You might not see any genetics on the test. You might see two passages on two different topics that you hate. Unless you're a science enthusiast (i.e. nerd), chances are there will be multiple passages on topics that you struggle with. That's okay! Again, this is not a test of your science knowledge. But if you're not sure which passage to skip, you can use your love and/or knowledge of a subject as a tie- breaker.
You may also want to use these guidelines to consider doing the passages in a different order. For example, say you're having timing problems, but you're trying to get a score above 30. You might want to skip the Conflicting Viewpoints passage and come back to it at the end. The other passages will feature more data questions that can be done quickly and easily. That way you'll make sure you get to those questions before you spend a large chunk of time reading a dense passage.
Similarly, if you're low on time and have a whole passage left that you want to do, do the data questions first. Questions that just ask you to look up values in figures and tables can be done quickly without any kind of deep understanding of the passage. One way to tell is to look for questions that have numbers in the choices. Those generally go more quickly than questions involving a lot of reading.
Start by scanning the passage
Read the passage or look at the data presentation quickly, just to get a rough idea of what it is all about. This should take no more than 20 seconds. Do not stop to study in detail any part that you do not understand. With this background, you are ready to move into a more careful study of the passage.
Read the passage again
Now you can take as much as a minute or even more to understand the passage thoroughly. Feel free to mark up the test booklet with notes. Underline key words.
Answer the first question in the group
In most tests, it is a good policy to skip questions you cannot answer immediately, but there is an exception in this test. The first question in each group will probably be a simple test of understanding. If you cannot answer it, you may well get the others wrong also. If necessary, go back to the passage to find the answer. If you cannot answer the first question, skip the whole passage and come back to it later.
Skip the hard questions
After you have answered the first question, do not initially spend more than 30 seconds or so on any question. If you have time at the end, you can come back and reread the questions you could not get the first time around.
Read all the choices
If you think you have found the right answer at once, do not stop reading. You may discover that there is some idea that has not appeared in the one you think is right. Think of the process as one of eliminating the incorrect answers, rather than selecting the right one. You may find that you can throw out three of the four choices quite easily.
Don’t Leave Anything Blank
When you have finished doing the easy questions, go back and try again on some that you skipped. If you have only 30 seconds left at the end, turn to the answer sheet, find those questions you have not answered, and mark them at random. However, be careful not to give more than one answer to any question. There is no penalty for guessing, but an item will be marked wrong if you have given two answers.
Remember that tough biology test for which you had to memorize dozens of facts about photosynthesis? When you sat down to take the test, you either knew the answers or you didn't. Well, that's not the case on the science portion of the ACT. Even though the word science appears in the title, this test doesn't resemble the sci ence tests you've had in high school. The ACT Science Reasoning test presents you with science-based reading passages and requires that you answer questions about them. Sounds just like the Reading test, doesn't it? That's because it is just like the Reading test. Rather than test your knowledge of science, it's supposed to test your ability to "think about science."
Of course, a little science knowledge doesn't hurt. If a passage is about photosynthesis, you'll undoubtedly do better if you know something about photosynthesis. But remember, the information you need to answer each question is contained within the passage itself. So if science has never been your strength, don't worry. In this chapter, we're going to show you techniques that will help you master scientific reasoning, even if you don't know anything about photosynthesis, bacteria, the periodic table, or quantum mechanics.
Again, you don’t need to be a science whiz to take the ACT Science test. This test is more like a Reading test whose sole subject matter is science. What you do need is an understanding of the scientific method and of how to interpret charts, graphs, and tables. The topics on the test vary widely no one has taken all these classes in school. If you haven't learned anything about genetics, or if you can't remember what you did learn, don't panic. You are not the only one. Remember that this is an open book test-everything you need to answer the questions is right there in the passage. Just find the information for each passage and you'll do fine.
The Science Reasoning test has seven passages, each of which is followed by five to seven questions. The passages cover material drawn from bi- ology, chemistry, physics, and the physical sciences (including geology, astronomy, and meteorology). They vary in organization and difficulty, as well as in the scientific reasoning skills they test.
Sound intimidating? It really isn't-all you need is the ability to answer questions strategically.
You've already developed some of these skills during science lab in school. Others you can borrow from what you learned in the ACT Reading section. (If you had any trouble mastering those skills, this is a good time to review them and make them stick.) The only additional skill you'll need is a basic understanding of math to help you read and
interpret charts, figures, and graphs. You are not allowed to use a calculator on the Science Reasoning test. Luckily, you won't need one.
What Are the Passages Like?
All of the passages fall within three basic categories.
1. Charts and Graphs (aka Data Representation)- 15 questions, 3 passages
These passages provide you with one or more charts, tables, graphs, or illustrations, and are intended to test your ability to understand and interpret the information that's presented. There are three charts and graphs passages per test, and each one has five questions. (Chapter 20 covers charts and graphs.)
2. Experiments (aka Research Summaries)- 18 questions, 3 passages
These passages describe several experiments-and their results-to see whether you can follow the procedures in each experiment (or experiments) and interpret them. There are three experiments passages per test, each with six questions. (Chapter 22 covers experiments.)
3. Fighting .Scientists (aka Conflicting Viewpoints)- 7 questions, 1 passage
These passages present (usually) two or three conflicting views on a research hypothesis. Typical topics include: "Is There Life on Mars?", "Where Did the Dinosaurs Go?", and "What's Fire?" Frequently, the fight is over something that has already been resolved (such as "What's Fire?" ). You will be asked about the conflict and the evidence supporting each view. The ACT test writers may also ask you to figure out what kind of evidence might actually resolve the conflict. There will be only one fighting scientists passage per test, and it will have seven questions. (Chapter 23 covers fighting scientists.)
Here is a basic four-step method for answering just about any Science question. Below, we outline the steps along with some frequently asked questions about what to do when the steps don't work as well as you planned. Keep in mind that these steps can be followed robotically. Don't think too much. The point of these steps is to demonstrate that for most questions you don't have to understand the passage or the deep meaning of the question.
1. Identify and underline which Figure or Table you need.
Most questions will specify which table or figure you're talking about. Underline the figure's name in the question and find it in the passage. Make sure you're looking at the right figure when you answer the question.
Q: Do I have to do this? Like, do I have to actually underline it?
YES. You have to actually underline it. If this seems unnecessarily specific and meticulous, you're half right. Yes, it's meticulous, but it is entirely necessary. So much of the test is just about locating the information you need, so you must be doubly, triply, and quadruply sure that you do so accurately. Careless mistakes can and will happen.
Q: What if the question lists two figures?
Underline both of them: you'll probably need both! One of them might wind up being more important than the other, but both should be relevant.
Q: What if the question doesn't list any figures or tables?
This does happen. Sometimes instead of listing a figure, the question will say something like "Based on the information provided". That is usually a clue that the information you need will be in the introductory paragraphs, not in the figures and tables.
Also, sometimes a passage will only have one figure or table. In those cases, the figure or table often won't be listed in the questions. They'll assume you know where to go.
For Conflicting Viewpoints passages, rather than listing the name of a table or figure, questions will specify which students or scientists they're asking about. If a question doesn't name a student or scientist, it's often because the point of the question is to ask which student or scientist would agree or disagree with a piece ofinformation. For these questions, continue on to step 2.
2. Identify and underline any key words in the question.
Look for words that give you information you need to answer the question. These are words that tell you what you know, or what you want. For example, if the question is:
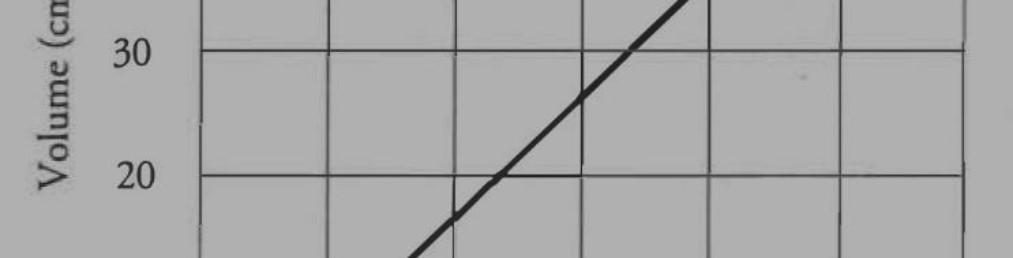
- According to Table 1, when the chamber had a temperature of 10°C what was the volume of nitrogen?
I notice that you already underlined "Table 1". Well done.
The words that tell us what we know are "temperature" and "10°C". We want the "volume" of "nitrogen". These are all key words that tell us where in Table 1 to look. When you find words that look like they will help you, underline them. You will need these words later.
- According to Table 1, when the chamber had a temperature of 10°C what was the volume of nitrogen?
Don't worry about what these words mean yet. We're just identifying which words are important. We don't care what they mean yet. For example, if the question is:
- According to Table 1, when the chamber had a tinstaffle of 10 gorr, what was the gravilax of flextane?
You probably don't know what these words mean. That's because we made them up. But we can still tell that "tinstaffle", "10 gorr", "gravilax", and "flextane" are the key words. We'll go to Table 1 and look for those words.
Q: How do you know if a word is a key word?
Some students get a little too happy with underlining. Don't underline everything in the sentence, just the key words. Questions will often be padded with extra words that don't actually help you find the answer. Anything that sounds like an Important Science Word (like "volume" or "capacitance" or "propanoic acid") might be a key word that helps you. Ask yourself: what do you know, and what do you want? Find any information in the question that might help you when you go back to the figures.
Certainly anything with a number attached to it is potentially important. But not every number winds up being important. Sometimes questions give you extra information that isn't necessary to solve the question. For example, the example question above mentioned "the chamber had a temperature of 10o C." That seems important. But if everything in Table 1 is at 10o C, that information doesn't actually add anything new. In that case, we'd just want to find the volume of nitrogen, period.
Ultimately, the point is to try to highlight the important information and ignore the filler. You won't always know right away what the important stuff is, and some things you underline may not be important in the end. But you'll get better with practice.
Q: This question is total nonsense. I'm really confused. What do I do if I can't find any key words?
If the question is too confusing, try reading the choices. Sometimes the question will be densely phrased or will rely on a deep understanding of the passage, but the choices are a simple list of values or statements. Look for key words in the choices: units, names of variables, or anything that might help you figure out where in the passage to look.
Q: That didn't help. Now what?
Go on to step 3. Look in the figure or table. Check the labels in the relevant figure to see if they match any words in the sentence. Look at the labels on the axes, the headers on the table, the names associated with different lines in the graph, or any other words that appear.
If that still doesn't help, certain types of questions have to be done in different ways. See the discussion of question types below.
3. Go to the Figure or Table identified in step 1 and circle the key words identified in step 2.
We've identified the key words. We know where in the passage to look for them. Now we have to find them. Circle or underline the key words in the Figure or Table itself. If the question gave you a specific value, find that value.
For example, let's return to the earlier question:
- According to Table 1, when the chamber had a temperature of 10o C what was the volume of nitrogen?
Q: The key words aren't in the figure. That's not a question.
Q: What do I do if the key words aren't in the figure?
Excellent question! Sometimes you'll find a key word in the question, but the words on the figure won't literally match. If so, there are several other places to look for your key word.
Maybe you don't need that word. Note that "nitrogen" was one of the key words we underlined, but it doesn't appear in the table. That's okay. We found all the other key words here, so we probably have all the information we need. If we read the introductory paragraph before the table, it will likely tell us that the entire table refers to nitrogen.
Check the units. "Units" are the thing that the quantity is measured in, like meters, kilograms, seconds, etc. Perhaps there's one key word in the question and a different key word on the axis in the figure, but both give values in "g/L". That's a clue. The two words might refer to the same thing.
Use common sense. Think about what the axes on the represent, and think about what your key word means.
For example, say the question asks you for the temperature at sea level in Figure 3. You go to Figure 3 and find "temperature" on the horizontal axis, but the vertical axis just says "depth of ocean (m)". The words "sea level" don't appear anywhere.
Well, what does "sea level" mean? It's the level of the surface of the sea. The vertical axis gives the depth: that means how far below the ocean you are. Therefore, "sea level" means you have a depth of 0, so we want a point with a value of 0 on the vertical axis.
Look in the passage. When Fancy Science Words are used in a passage, the introductory paragraphs often define them for you. Look in these paragraphs-both in the first introductory paragraphs and in the paragraphs directly above your figure-to find the key words you need. You don't necessarily have to read the passage in detail; just skim the paragraphs to see if your key word shows up (much like we did in the "Word Search Drill" in the Reading chapter). The passage even helps you: when key words are defined in the paragraphs, they are often italicized, which makes them much easier to find.
Similarly, if a key word is italicized in the question, then it's probably defined for you right there in the question. In these cases, the question is introducing a new term that you 're not expected to know; you're just expected to use that new information with respect to the passage.
If a simple word search doesn't help, you might have to read the passage in more detail. Sometimes you really do need a deeper understanding of the passage. It's unfortunate, but it happens.
You might need outside knowledge. Some questions do require you to know the definitions of terms that aren't defined. Ifa question asks you about the "density" of the objects in the experiment, and the word "density" wasn't mentioned anywhere in the graphs or tables or the descriptive paragraphs, the question is probably just testing whether you know what "density" means. As we said, these questions are a small fraction of the test, but they do occur.
Keep in mind that even if you don't know the definitions of these outside words, you can often still eliminate. Look at the choices and check if any are clearly false based on the data you know.
4. Match values you know to the value you want.
Okay, we're almost done. Here's where you actually answer the question. You know where to look, you know what you're looking for. Match the value of the key word you know to the value of the key word you want. Barn. You're done.
The volume is 0.85 L .
That's your basic method for most questions. Underline, underline, circle, matchy-matchy, done. But there are some types of questions that may make things slightly more complicated.
Q. The value given in the question (or choices) isn't on the figure. What do I do?
This is an Inferred Data question. Rather than looking up data points that are on the graph, it asks you to look up points that aren't on the graph. Where would a given data point go if it had been included on the graph. We'll talk more about these when we get to the discussion of question types.
Inferred data questions don't usually involve math. They're just a matter of taking the value in the question and seeing if it's bigger, smaller, or in between the values in the table. However, you may see some questions where you'II have to do a little bit of math. Don't freak out: it's just light math that you can do in your head. You'll have to take the values in the table and cut them in halt: or multiply them by 10. If you're adding a string of five two-digit numbers, you're probably doing it the hard way.
Q. The value I know is not on the same figure as the value I want. What do I do?
This is a Combination question. The thing you know and the thing you want occur on different figures; you'll have to find a way to connect them. Look for a value you can use as a bridge between the two. We'll talk more about these when we get to the discussion of question types.
Q: The choices are all say "Yes" or "No" in them. What do I do?
This is a Reasoning question. The question presents you with a statement or hypothesis about the subject of the passage, and the question asks whether the data in the figures supports this statement. The choices first say "Yes" [the data supports the statement] or "No" [the data does not support the statement], followed by evidence that demonstrates why the data does or doesn't support the statement.
You can do these questions in two steps. First, ignore the statement in the question. Just look at the choices and eliminate choices that are false. That is, they give information that does not match the information in the figures and tables. If you have more than one choice remaining, then you can worry about whether that information proves or disproves the statement in the question. We'll talk more about these when we get to the discussion of question types.
Although the Science Test does not involve very much actual math, some of the techniques we discussed for the Math Test can also help you here.
Backsolve
As we said in the four-step method, many of the questions involve going back to the passage, looking up the information we know, and matching it to the information we have.
But we can also work the other direction. Start with the choices, look up those values in the passage, and then see which one matches the information given in the question. For example:
In Experiment 2, the gases in tanks 3 and 7 had the same pressure at which of the following temperatures?
A. 30oC
B. 45oc
C. 60oC
D. 75oC
Obviously, we can't actually do this problem since we don't have the results of Experiment 2 handy. Regardless, we can tell that one way to do this problem is to look at the figures associated with Experiment 2 and find the temperatures at which the tanks had the same pressure.
But what if it's not that easy? What if the data in Experiment 2 is spread across two figures? It may be hard to compare tanks 3 and 7 directly. So instead, we can work directly off the values in the choices. Look up the pressure of tank 3 at the temperatures listed and write them next to the choices. Then do the same for tank 7 and see which choice gives the same values. Something like this:
tank 3 tank 7
A. 30 ° c 80 50
Backsolve can show up all over the test on all sorts of different question types. It may or may not be faster than looking up the values directly. More often than not, it takes about the same amount of time to do it in either direction, so ultimately it comes down to whatever you're more comfortable with. So, if you're having trouble dealing with the information in the question, try using the choices instead.
Guesstimate
On the Math test, the idea behind Guesstimate was that we can learn a lot by looking at the figure. Well, half of the Science Test involves nothing more than looking at figures! Practically everything we do with figures is a kind of Guesstimate. We look at the picture, look at the numbers on the picture, and find the values we need.
Like Guesstimate on the Math Test, when you look at figures on the Science Test, you do not have to be exact. Look at the figure and get a range of possible answer for the value you need. This point looks like it's between 40 and 50. Look at the choices and eliminate anything that's not between 40 and 50.
If more than one choice works out, then you can go back and try to be more precise. Where between 40 and 50 is it? Is it right in the middle, like 45? Closer to 40, like 42? Closer to 50, like 48? How can you tell? Visually. Look at the picture and see where the point is.
Obviously, if the data is in a Table instead of a Figure, you're not going to be able to solve it visually. And when you look up a value on a table, the exact number you need is already written down for you. However, even with tables there are times when you should approximate. For example, inferred data questions ask you where on a table a new point would occur. These questions don't ask for precise numbers, just ranges of values. Whenever possible, start with broad values and get more precise only when necessary
Calculation takes time, and you should avoid it whenever possible. You can usually eliminate three obviously wrong choices quite 12 | P
easily. For example, suppose a graph shows that an object has traveled 32 meters in seven seconds, and you are asked to find its speed. You are given these choices:
A. 220 m/s
B. 40 m/s
C. 4.6 mis
D. 1.4 m/s
You know that 32 divided by 7 will be a little over 4, so you can pick out C as the answer without doing the calculation.
RTFQ stands for "Read the Full Question." It's a common mistake on the Math Test, a mistake that's based on carelessness. You're working too quickly and accidentally solve for x instead of y, or find the percent of books that were sold instead of the percent that were not sold.
Carelessness is very much a problem on the Science Test. We often talk about how easy many of these questions are at heartjust look up the number on the table that they give you! But if it's all so easy, why do so many students struggle with the test? Because there's a lot of information, and it's incredibly easy to lose track of it all.
RTFQ mistakes occur frequently on the Science Test, but it's not just the question that's the problem. Other common mistakes include RTFT (Read the Full Table), RTFF (Read the Full Figure), and RTFP (Read the Full Passage).
Here are some common careless mistakes that students make:
Reading the wrong column in a table
Reading the wrong row in a table
Looking at the wrong axis in a figure
Looking at the wrong curve or line on a figure with multiple lines
Looking at the wrong figure entirely
Thinking the values in the figure go up when they actually go down (or vice versa)
And many, many more. These kinds of mistakes are the main reason that we stressed underlining key words and figure names when doing the question. Just taking a few extra seconds to be sure of yourself on eve1y question can make a big difference on your score. Breathe!
It's very easy to get overwhelmed on the Science Test, especially if you don't have a strong science background. If you start to feel overwhelmed by a question, a figure, a passage, or anything, just take a second to stop and compose yourself There may be some hard stuff on the test, but there is a lot of stuff that you can get.
As we mentioned on the Reading Test, sometimes there' II be a question that just gets to you. You can't figure out what it's asking. You can't figure out how it relates to the passage. You can't figure out what the passage means. And it's driving you crazy and freaking you out. We call these Black Hole Questions, because they suck up all your time and you cannot escape their pull. Don't get trapped. If you've been spending 5 minutes on a single question, skip it. Just guess something (randomly, if necessary) and move on to the next one. You don't want to ruin an entire section because of one question.
Did You Know That You Have Access to Free Test Prep Boot Camps? Through This Online Interactive Class,Live Capstone Instructors Will Show You All The Strategies You Need to Maximize You Test Score. Click Here To Register for Free!
• Start by scanning the passage. Read the passage or look at the data presentation quickly, just to get a rough idea of what it is all about. This should take no more than 20 seconds. Do not stop to study in detail any part that you do not understand. With this background, you are ready to move into a more careful study of the passage.
• Read the passage again. Now you can take as much as a minute or even more to understand the passage thoroughly. Feel free to mark up the test booklet with notes. Underline key words.
• Answer the first question in the group. In most tests, it is a good policy to skip questions you cannot answer immediately, but there is an exception in this test. The first question in each group will probably be a simple test of understanding. If you cannot answer it, you may well get the others wrong also. If necessary, go back to the passage to find the answer. If you cannot answer the first question, skip the whole passage and come back to it later.
• Skip the hard questions. After you have answered the first question, do not initially spend more than 30 seconds or so on any question. If you have time at the end, you can come back and reread the questions you could not get the first time around.
• Read all the choices. If you think you have found the right answer at once, do not stop reading. You may discover that there is some idea that has not appeared in the one you think is right. Think of the process as one of eliminating the incorrect answers, rather than selecting the right one. You may find that you can throw out three of the four choices quite easily.
• If the answers are numerical, estimate. Calculation takes time, and you should avoid it whenever possible. You can usually eliminate three obviously wrong choices quite easily. For example, suppose a graph shows that an object has traveled 32 meters in seven seconds, and you are asked to find its speed. You are given these choices:
• 220 m/s
• 40 m/s
• 4.6 mis
• 1.4 m/s
You know that 32 divided by 7 will be a little over 4, so you can pick out C as the answer without doing the calculation.
• Pace yourself. With 35 minutes to answer the questions for seven passages, you have just five minutes for each passage. If you find yourself spending more than that on one passage, skip it and come back to it later. On average, you should spend about two minutes reading each passage and 30 seconds answering each question.
• Answer every question. When you have finished doing the easy questions, go back and try again on some that you skipped. If you have only 30 seconds left at the end, turn to the answer sheet, find those questions you have not answered, and mark them at random. However, be careful not to give more than one answer to any question. There is no penalty for guessing, but an item will be marked wrong if you have given two answers.
Once you've scanned the passage, you should move on to the questions. To which category does each question belong? Identify each as either an understanding, analysis, or generalization question. Why? Because knowing the question type will help you eliminate distracters and zero in on the right answer.
Some of the questions will require you to do some pretty simple calculations. Sometimes you can come up with the right answer choice by "guesstimating," which means making a rough estimate. (Remember chis from Chapter 14, on geometry?) This technique works particularly well on problems chat require you to interpret graphs.
As on all tests on the ACT, you should use POE co eliminate incorrect answer choices. Once you have eliminated a couple of answer choices, you'll be able to spend a little time on the remaining choices and make a pretty good guess.
After practicing all three passage types, you may find that you are best at charts and graphs passages. Or perhaps you really like the fighting scientists. Whatever you like best, make sure to do the passages that are easiest for you first. Leave the passages that give you the most trouble for last. The ACT Science Reasoning test always comes at the end when you're already tired. By prioritizing the passages, you give yourself the best chance to get the most points that you can.
Since so much of the test depends on tables and figures, let's take a closer look at how they work. There are many different types of tables and figures that may appear in ACT Science passages. All of them are simply ways of representing information. The key to almost all figures is matching-match a row to a column, match one axis to another.
Tables are the most common way of presenting data on the ACT. In general, the test will have about as many tables as all other figures combined. You probably have some experience with tables already, and most of them are straightforward. Just match up the rows and the columns:
Table 2
When the time was 0 minutes, the temperature was 50oC and the volume (of whatever it is we're talking about) was 85 mL. At 5 minutes, the temperature was 57° C and the volume 83 mL. And at 10 minutes, the temperature is 64 C and the volume 80 mL.
Most tables will show numbers in their fields. But some might give verbal descriptions instead:
Table 4
Dog
Britney Large Brown
Thick fur Friendly Fido Medium Black Short hair Friendly Robespierre Medium Black and white Short hair Friendly
Nelson Small Brown Long hair Aggressive
Even though there aren't any numbers, the table can be read exactly the same way. Britney is a large, friendly dog with thick brown fur. The only small dog is Nelson. Fido and Robespierre both have short hair. Just match up rows and columns.
Sometablesmightjust"checkoff'acharacteristic.InTable5,an"x"indicatesatoppingispresent:
Table5
PizzaSample
Topping PepperoniSausageMushrooms
Table5presentsfourtypesofpizza.PizzaAhasnotoppings.PizzaBhaspepperoniandsausagebutnomushrooms.PizzaC hassausageandmushroomsbutnopepperoni.PizzaDhasallthreetoppings.
Really,there'snotalotofvariationinhowtablesarepresented.They'reallprettymuchthesame-ifyoucanreadone ofthem,youcanreadallofthem.Figures,ontheotherhand,comeinlotsofdifferentshapesandsizes,withlines,dots, areas,anddrawings,amongothers.Let'stakealookatafew.
ScanningaTable:LookattheVariables
Justasyoudidwithgraphs,lookatthetableorcharttofigureoutwhatthevariablesare.Youwanttoknowwhat'sbeingcompared withwhat.Asyoureadthechart,takethetimetounderstandhowthesevariablesarerelatedtoeachother(don'tskimponthis part).Let'slookattheexampleonthefollowingpage.
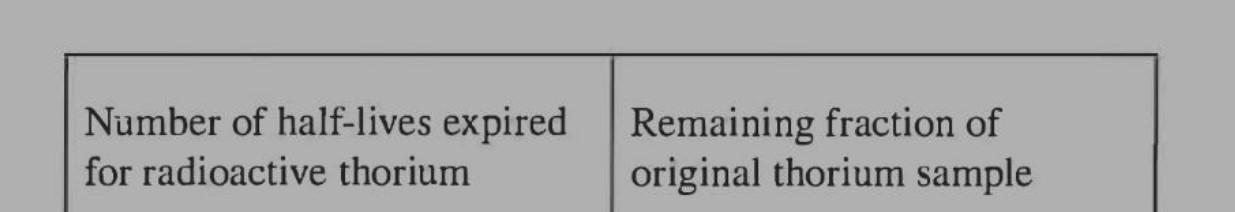


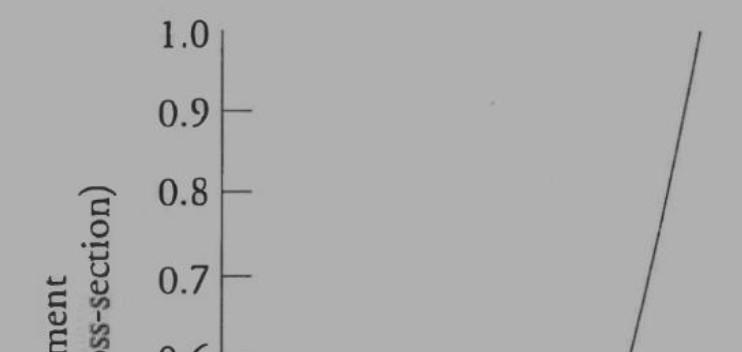
Thistablehassomethingtodowiththeradioactiveelementthorium,whichhassomethingcalleda"half-life."Whatarethe variables?Theyare
A.the number of half-lives expired B.the remaining fraction of the original thorium sample
As you can see, the more half-lives that expire, the less we have of the original thorium sample.
The majority of figures on the ACT can be read just like the xy-coordinate plane we saw on the math questions. There are two axes, one horizontal (the "x-axis") and one vertical (the ''y-axis"). Sometimes questions will refer to the x- or y-axis, but they'll usually just use labels. The axes will correspond to different values that are discussed in the passage. Each axis will be labeled, so you can easily see what the numbers mean.
When we deal with graphs on the Math Test, we have a lot to think about. The axes are labeled x and y, there are equations and slopes and intercepts, there are lines and parabolas and all sorts of algebra, and it's easy to get overwhelmed. However, on the Science Test, graphs won't feature variables and equations the way Math Test problems do. Don't be scared: there won't be any algebra. As with tables, the key to reading a graph is matching. Let's look at an example:
Figure 1
Try this question: - What is the concentration of Substance A at 30 minutes?
WhatistheConcentrationofSubstanceAat30minutes?
InFigure1,thehorizontalaxisrepresentstimeinminutesand theverticalaxisrepresentstheconcentrationofSubstanceAinppm.Weknow thetimeinminutes-that'sthehorizontalaxis.Findthemarkfor30onthe horizontalaxis.Followitstraightupandmarkthespotwhereithitsthe line.Nowgostraightlefttoseewherethatspotliesontheotheraxis.It's atthe100mark.So,whenthetimeis30minutes,theconcentrationis100 ppm.
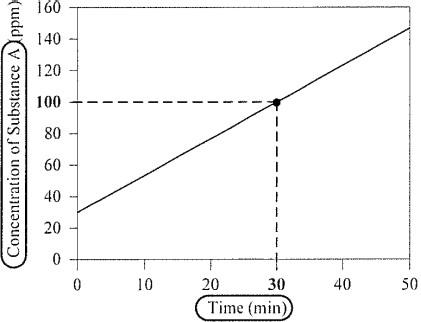
Figure1hasgridlinesthathelpyoufollowthevaluesfromtheaaxistothegraphline,butnoteveryfigurewill.Andthepoint thatwe'relookingforwon'talwaysbelyingalongthosegridlines.Ifyouhavetroubleconnectingthevalueontheaxiswith thepointontheline,usetheedgeofyouranswersheettodrawastraightline. Wecanputevenmoreinformationinthefigure.Graphswilloftenfeaturemorethanjustoneline:
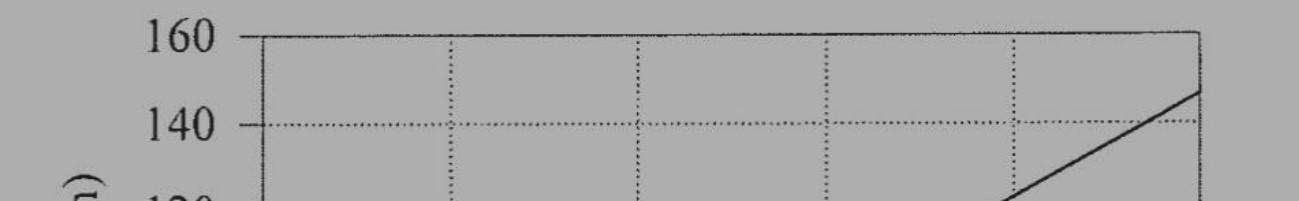

InFigure2,theverticalaxisnowjustshows"concentration",andtherearetwolinesrepresentingdifferentsubstances. Thekeyabovethegraphtellsuswhichlineiswhich:thesolidlinereferstoSubstanceAandthedashedlinerefersto SubstanceB.Nowyouhavetomatchthreethings:time,concentration,andsubstance.Thedifferentsubstanceshave differentconcentrationsatanygiventime:
Whenthetimeis30minutes,SubstanceAhasaconcentrationof100ppm,butSubstanceB hasaconcentrationof80ppm.
Thetwosubstanceshavethesameconcentrationwhenthetimeisabout15minutes.Because thelinescross,thesamepointoccursonbothlines.So,bothsubstanceshavethesame concentration.
Foralltimeslessthan15min,SubstanceBhasagreaterconcentration.Foralltimesgreater than15,SubstanceAhasagreaterconcentration.
The main difference between graphs and tables is that graphs are graphic-they can be grasped visually. A table only shows numbers. On figures, a lot of information is immediately obvious. Just by looking at the picture we can see:
- Concentration always increases as time increases.
- The concentrations do not increase at a constant rate but taper offat the end.
- The concentration of Substance G is always greater than that of Substance H.
And so on. On the table, you can still figure that out, but you have to do some mental arithmetic to see it.
ln Figures 5 and 6 above, each set of points seems to make a relatively smooth curve. We could probably draw that line using some kind of equation ifwe wanted (but we don't). However, collections of points don't always look that smooth. They could be scattered more randomly, as in Figure 7. If we connect the points, we get a jagged line, sometimes going up and sometimes going down, as in Figure 8.
You may see graphs with a trend line on the ACT, but you don't have to know anything special or do anything differently. It's just a way to show that even though the values go up and down from point to point, there's still a noticeable relationship; as one value increases, the other also increases.
All the figures we've seen have had linear scales. That means that each space you move on the axis represents the same amount. In Figure 9, for example, each gridline on the x-axis represents an increase of 10 minutes: 0, 10, 20 ... Each gridline on the y-axis represents an increase of 20 ppm: 0, 20, 40 ... This is how the grand majority ofACT graphs are drawn.
But there's no rule that says we have to use a linear scale on our axis. We could use a nonlinear scale.
As long as you always read carefully, you shouldn't have any trouble getting thedata you need.
All the graphs we've seen so far have two axes: one horizontal and one vertical. Sometimes a graph may reproduce the values on both sides ofthe graph, putting the same vertical axis on the left and the right.This doesn't change the graph at all; it just makes it easier to read.
For larger graphs in particular, it can be tricky to follow a point on the rightmost side all the way over to the left axis to get the value.
But sometimes a graph will have entirely different axes on opposite sides of the graph. This is a way to get additional information on the same graph. There are several ways this can happen.
Not Every Graph Is a Bar Graph The ACT is filled with graphs. There are different types of graphs, so you must learn how to read not only bar graphs, but also graphs in general. We started with bar graphs because they're usually easy to understand. But all graphs illustrate how one variable relates to another. Now let's look at another of the ACT test writers' favorite graphs: the coordinate graph.
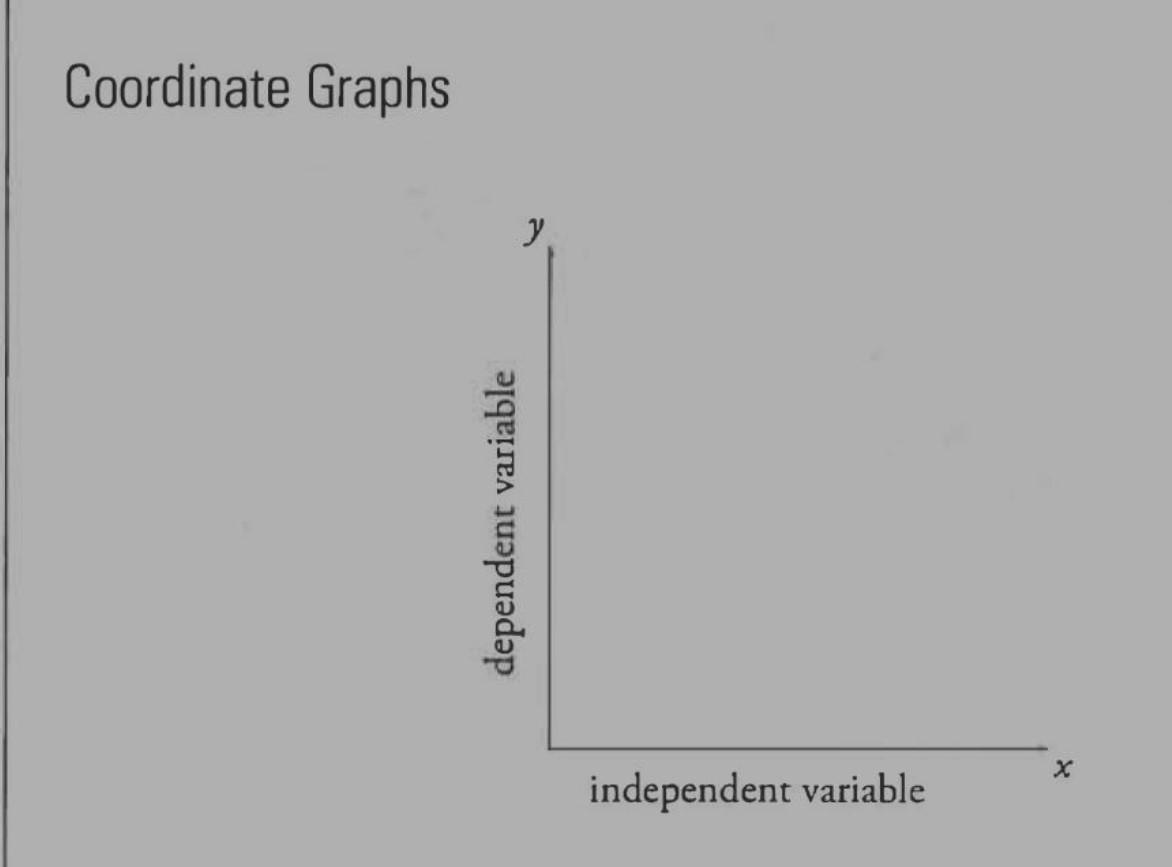
Lookatthecoordinategraphabove.Ithasahorizontalaxis(x-axis)andaverticalaxis(y-axis).Thex-axisshowstheindependent variable,thethingthat'sbeingmanipulated(orchangedpurposely).They-axiscontainsthedependentvariable,thethingthatis affectedwhentheindependentvariableischanged.
Nowlet'slookatwhathappenswhenweputsomepointsonthegraph.
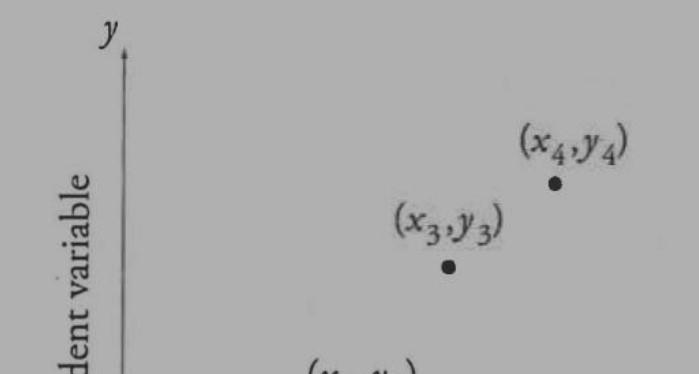
Everypointonthegraphrepresentsavalueforboththeindependentvariable(xvariable)andthedependentvariable(y-variable).In otherwords,eachpointrepresentsan(x,y)pair.Don'tforgetthat.Wheneveryouseeapointonagraph,youshouldrememberthatit hasbothanx-componentanday-component.
Want More Help? Why Not Schedule a Capstone Tutor. Who Better to Take You to the Next Level Than the Tutors Who Are Most Familiar With the Material? Click Here To Schedule
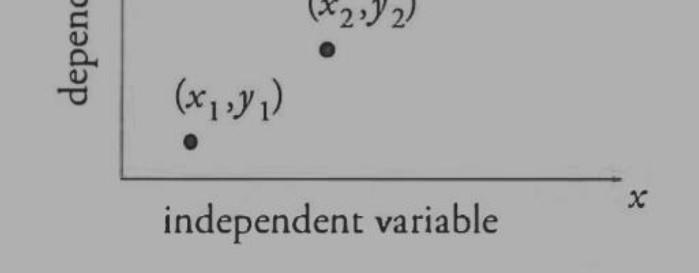
Nowlet'slookatwhathappenswhenwetakethesamegraphandindicatethatthegraphrepresentsanexperimentperformedbyDr. Frankenstein.
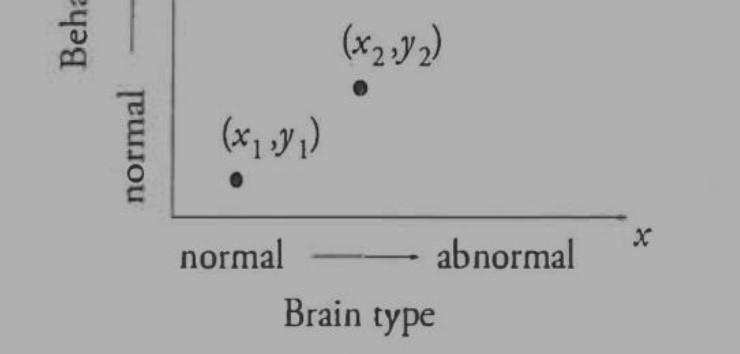
Takealookattheaxes.Thevariablesarebraintypeandbehavior.Thebraintypeisanindependentvariableandisrepresentedalong thex-axis.Thebraintypeaffectsthemonster'sbehavior,whichisrepresentedalongthey-axis.Whenbuildinghismonster,Dr. Frankensteincanusethebrainofeitheranormalpersonorapsychopath.Inthisexperiment(x,J',)representsanormalbrain(the independentvariable)withanormalbehavior(dependentvariable).Thepoint(x4J14)representsapsychopath'sbrainandthe associatedtendencytowardderangedbehaviors.
Let'slook,forexample,atpoint(x2v12)onthegraph.Whenthemonsterisgiventhisbraintype(x2),whattypeofbehaviordoeshe exhibit?Doeshebehavenormally,orishederanged?
Point(x2,y)representsafairlynormalbrainand,consequently,areasonablywellbehavedindividual.
Unfortunately,mostgraphsontheACTwon'tbeasinterestingastheoneaboutDr.Frankenstein'sexperiment.However,we'llshow youhowinterpretingeventhemostboringgraphscanbejustaseasy.
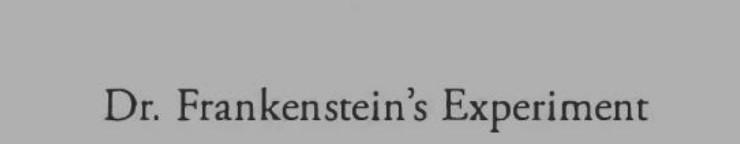
KnowFourKindsofCoordinateGraphs OntheACT,youwillseefourkindsofcoordinategraphs.Justremembertolook atwhatthevariablesare,howthey'remeasured,andhowthey'rerelated.


Thegraphsaboveshowalinearrelationship.Linearisafancywordmeaningthatthepointsfollowastraightline.Apositivelinear relationshipoccurswhenanincreaseinx(asyoumovetotherightalongthex-axis)leadstoanincreaseiny(GraphA).Anegative,or aninverse,relationshipoccurswhenanincreaseinxleadstoadecreaseiny(GraphB).
Let'sseeifyoucanrecognizetherelationshiponthenextpage.
Doesthegraphshowapositiveoranegativelinearrelationshipbetweentemperatureandvolume?
Ifyouansweredpositive,you'reright.If,forsomereason,youforgetwhichgraphshowsapositiverelationship,justrememberthat positivemeanschatthelineispointingupwardcotheright.


Anothercommongraphdisplaysacurve,asshowninGraphC.Thecurveabovemeansthatforeveryincreaseinx,they-valuesbecome larger.Thechangesinyareexponentialandbecomegreaterthemorexincreases.Ifagraphiscurved,chatmeansthattheamounty changeswitheachchangeinxisdifferentatdifferentpointsonthegraph.Lee'slookatanotherexample.
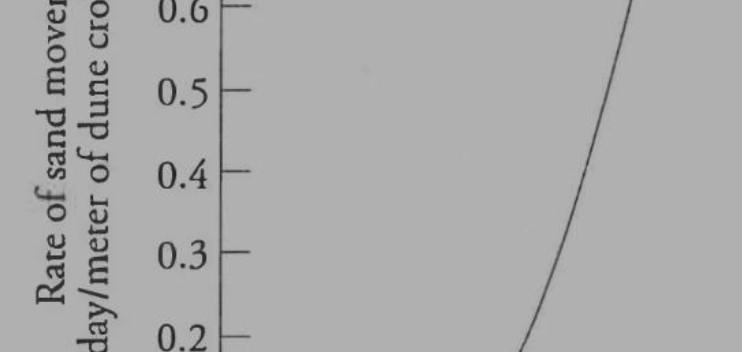
Whenthewindspeedis40km/hr,whatistherateofsandmovement?Theansweris0.3.Nowlet'sseewhathappenswhenthewind speedis50km/hr.Therateofsandmovementincreasesto0.6.Didyounoticethattherateofsandmovementdoubled?Nowwhat happenswhenthewindspeedis60km/hr?Therateofsandmovementincreasesevenmore.Asyoupicklargervaluesforwindspeed, therateofsandmovementwillshootupinvalue.
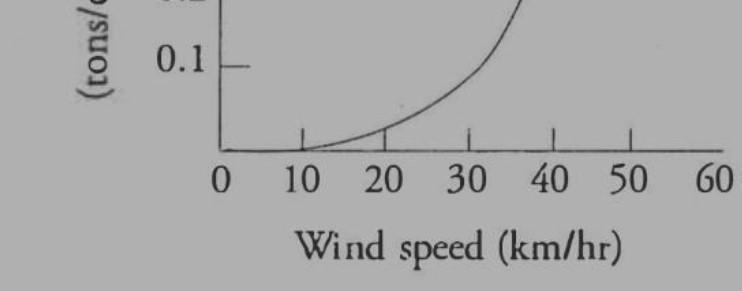
TheACTtestwritersexpectyoutounderstandascatterdiagram.Seethelinethatrunsthroughthecenterofthegraph?It'scalleda "best-fit"line.Ittellsyouthatifyoutooktheaverageofallthepointsonthegraphandlinedthemup,theywouldformthestraightline above.Therefore,thegraphtellsyoutwothings:(1)whatthepointswouldlooklikeiftheywereaveragedandlinedup(astraightline), and(2)howtheyreallylookonthegraph(scattered).
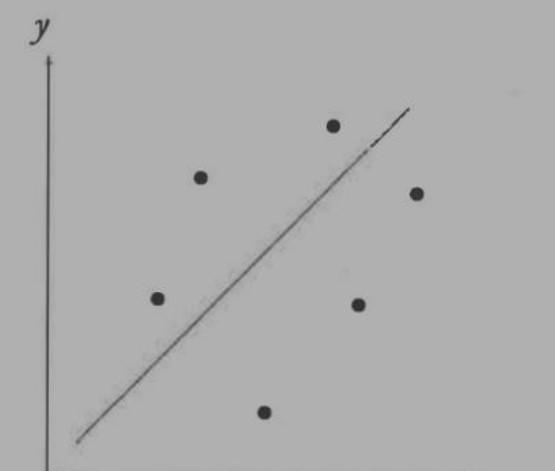
Everysooften,theACTwillplotdataonagraphinwhichthereisnorelationshipbetweenthevariables.Thatistosay,thetwo elementsplottedonthegraphhavenoeffectoneachother.Whenthisoccurs,theresultisaflatline.Alinewithnoslopeaccurately graphsdatainwhichthereisnochange.Forexample
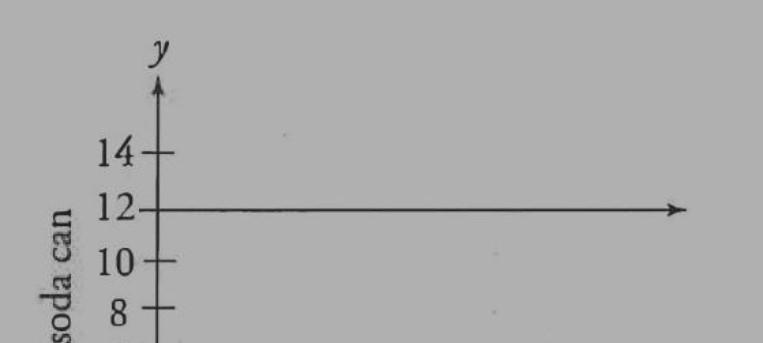
Here,thegraphdisplaystheeffectoftimeonthesizeofasodacan.Doestimeactuallyaffectthesizeofthecan?Ofcoursenot.Asa result,wegetalinewithnoslope.
Notallgraphshavetodepictlinesorpoints.Withalinegraph,there'susuallyaone-to-onecorrespondencebetweentheaxes. Eachpointonthehorizontalaxiscorrespondswithoneandonlyonepointontheverticalaxis(oroccasionally,viceversa).With areagraphs,wecanlookatlargeregionsofpointsatthesametime.
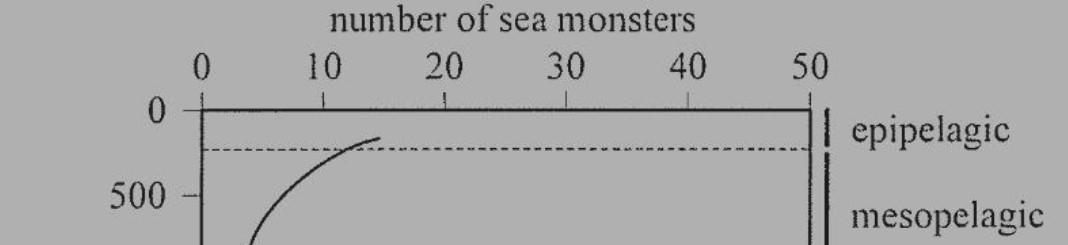
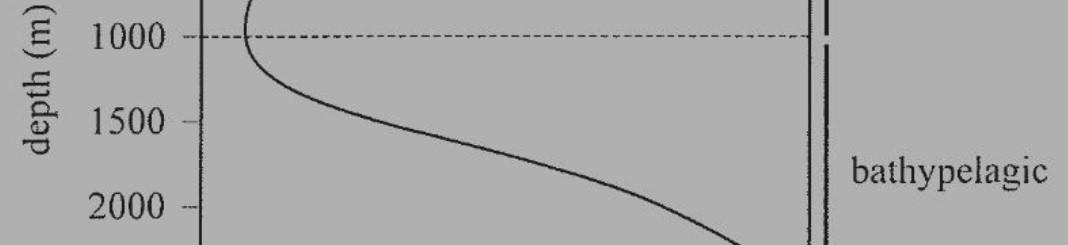
Inthesimplestcases,anormallinegraphhaslayersonit.These layerscanaddmoreinforn1ationaboutthegraphwithout changingthebasicshapeofthegraph.InFigure18,thereare threelayersthatcorrespondtotheoceandepthsdepicted:
Theepipelagiclayer,from0toabout250m
Themesopelagiclayer,from250mto1000m
Thebathypelagiclayer,from1000mto2500m
Justlikeasecondaxis,theselayersaretiedtodepth,sowhenwe knowthedepthofapoint,wealsoknowwhichlayerit'sin.All pointsbelow1000mareinthebathypelagiclayer.

We can read bar graphs exactly the same way we do any other graph: matching, matching, matching.
When scanning a Graph, look at the Variables and Units
When you see a graph, table, or chart, you should ask yourself the following two questions:
1.What are the variables? (sunlight? temperature? number of plants?)
2.How are they measured? (in grams? quarts? meters?) Keep in mind that values can also be represented as percentages.
Scan the Bar Graphs
1.What are the variables?
•There are four diseases: chicken pox, tuberculosis, measles, and rabies.
•Did you notice the small boxes under the bar graphs? They make up a key that gives you more information about the variables. The graph is about diseases, and the key describes levels of severity.
•Now how many levels are there?
•There are five levels: unapparent, mild, moderate, severe (nonfatal), and fatal.
2.How are they measured?
•The values are in percentages, just as before.
Not Every Graph Is a Bar Graph
The ACT is filled with graphs. There are different types of graphs, so you must learn how to read not only bar graphs, but also graphs in general. We started with bar graphs because they're usually easy to understand. But all graphs illustrate how one variable relates to another. Now let's look at another of the ACT test writers' favorite graphs: the coordinate graph.
2. Setup Diagrams
Finally, sometimes a figure won't provide data; it will just explain the setup of the experiment. Experiments will often involve special or elaborate equipment-tube A is connected to tank B, which releases gas C, launching the car down ramp D, etc. When there's a lot going on, pictures and diagrams can make things clearer. You usually don't have to spend a lot of time analyzing these diagrams; they're only useful if you're asked about them, and you're rarely asked about them.
When scanning an Illustration, look at the Variables Instead of a chart or graph, sometimes the ACT test writers will give you an illustration. Sometimes these illustrations will have text within the picture, but usually they will not have a specific explanation accompanying them. The ACT test writers want to see if you can follow a flow chart or interpret a diagram. Look at the example on the next page.
The figure above illustrates the oxygen cycle. Based on this figure, which of the processes releases oxygen into the atmosphere? Look at the arrows associated with each box. The information inside every box is the variable. Which of the boxes has an arrow that shows that oxygen is released into the atmosphere? The box labeled "photosynthesis on land and in surface seawater produces oxygen."
Now what if the ACT test writers ask you what kinds of living organisms produce oxygen? According to this diagram, the answer is algae and plants on land. The direction of the arrow indicates that oxygen is moving from algae and the ground to the atmosphere. All the other arrows are pointing away from the atmosphere.
ACT Science questions tend to fall into categories based both on the form of the question and on where to find the answer. You need to learn how to identify the question type. Now that you know how to scan the various charts, graphs, and illustrations, let's go right to the questions. Remember that there are only three basic question types, each addressing a different skill.
These question types all have to do with the data presented in the figures and tables. Let's take a brief look at the categories, and then look at some examples on a sample passage. All these question types can be done using the same basic four-step method we discussed earlier.
Data Lookup questions
Data Lookup questions are the most common type of question on the Science Test. They're also the most straightforward: they simply require you to retrieve a value given in one of the tables or graphs provided. In fact, most of the time you don't even have to understand what it is you're looking up. All you have to do is match the name of the quantity the question asks for with the headings and labels in the figure. Ask yourself two questions: what do we know? and what do we want? Simply take what you know and match it to what you want in the data given.
Combination questions
Combination questions require you to pull information from more than one part of the passage. These questions are similar to Data Lookup questions, but the data you need is spread across multiple tables or figures. These questions usually don't require any additional understanding of the meaning of the data; they just require an additional lookup step. You have to find a bridge between the two figures. For example, say a question asks you to connect volume on Table 1, with temperature on Table 2. Ask yourself: what do the tables have in common? What columns or rows are the same on both tables? Find what they have in common and use that variable to compare the values you need.
Instead of asking you to retrieve specific data values, these questions ask you about the relationship between fields. Usually this is just a matter of figuring out up vs. down: when one value increases, does the other value increase, decrease, do both, or stay the same? Sometimes these questions might be slightly more mathematically sophisticated (for example, one value is always triple another value), but any math you may need will be very simple.
Don't confuse the direction of the values with the direction on the page. If the numbers in a column go physically down the page, that's not the same thing as the values of the numbers going down. We care about whether the numbers increase or decrease; they may be written in either direction on a table. On graphs it's a bit easier to tell visually whether numbers are going up, but some graphs don't act the way you think they will. Be sure to look at the actual numbers on the axes.
Sometimes questions may ask you to produce your own graph based on the data provided. This could involve converting a table to a graph, or converting one type of graph to another (say, a line graph to a bar graph). But these are essentially just like other Relationship questions: you just have to know whether one factor increases or decreases with respect to another factor.
These questions are similar to Data Lookup questions with one important twist: the data point that the question is asking for does not literally appear in the figure. You must infer the value based on the data that does appear. This may sound difficult, but it's not so bad: the point will either be right in between points that are given, or it will be higher or lower than any values given. Inferred Data questions usually don't ask for a single value but for a range of possible values based on the information you know. This is basically a game of higher, lower, or in-between.
On the Data Representation passage in the practice below: it presents one set of information about a topic. Data Representation passages tend to have questions involving literal interpretation of charts and graphs. First, we'll present the passage and questions, and then we'll discuss the answers.

Of course, not all questions will just ask about the figures and tables. Here are some question types that require you to go beyond the numbers in the pictures.
Passage questions
These are questions for which you need more information than what's in the figures and tables themselves. In addition to looking at the figure, you'll have to read the introductory material in the passage or the definitions of terms used.
Usually, it's pretty easy to tell whether you need to go back to the passage: if the key words in the question do not appear in the figure, look for them in the passage. Remember that key words in the passage are often italicized. If you're looking for the definition of a word, just quickly scan the paragraphs and look for italicized words.
These questions vary in their difficulty. If all you need is the definition of a term, they're really no more difficult than Data Lookup questions. You just go back to the passage instead of the figure. Other times they can be trickier-you can't just know what the fields in the figures say, you have to understand what they mean. In that case you'll have to read the paragraphs more closely. But don't spend time doing that unless you really have to.
It's also important to use information you learn in one question on later questions. Multiple questions may ask about the same parts of the passage. You don't always have to get a deep understanding of the experiment, but if you do learn something, remember it. It might show up again later.
Experiment Design questions
These questions ask you about the design of the experiment. These questions will only appear in Research Summaries passages, which feature several different experiments around the same topic or line of investigation. Questions may ask how an experiment was literally set up, why things were set up a certain way, what factors were varied, or what might happen if we change the experiment.
A word about variables
It's worth spending a bit of time here discussing how experiments (and science in general) work. The purpose of any experiment is to test a hypothesis. In order to check whether one thing affects something else, you run a bunch of tests and write down what happened. Usually this means doing the same thing several times, keeping some things the same and other things different. We say that the things that are the same across the tests are controlled, and things that are different are varied.
The thing that you vary is the thing that you want to test. If you change something and the results are the same, then the thing you changed had no effect on the results. On the other hand, if the results are different and you only changed one thing, the thing you changed was probably the cause of the difference.
Let's take a specific example. Say you want to figure out whether a certain fertilizer makes plants grow bigger. You could test it by getting two plants. Give one the fertilizer and the other one no fertilizer and measure how big they grow. If the one that got the fertilizer grew bigger, you might conclude that the fertilizer worked.
However, if everything else was not the same, then you can't make that conclusion. What if the one that grew bigger also got more sunlight? Or got more water? Or it was a different kind of plant that naturally grows bigger. If there are too many differences between the two plants, you can't tell which factor caused the extra growth. But if you keep everything the same except the factor you want to test, then you know that factor caused the growth. These factors that you don't change are controlled.
The factors that we vary are called independent variables, and the results we get are called dependent variables. They're "independent" because we can choose any values at all we want for them. We can give the plant 10 grams, 100 grams or 500 grams of fertilizer if we want. The others are "dependent" because the values depend on all the other factors in the experiment. We can't choose how big the plant gets-it depends on how much fertilizer it gets. In fact, when there is a relationship between variables, we say that one variable depends or is dependent on the other.
In interpreting any data representation, you must first be sure you understand what the variables are. If they are not numerical, they will simply be named. There will always be numerical variables as well, and you must be able to find their values. These are the things to look for when you come to a Data Representation question:
What are the units of measure?
These will usually be given along with the name of the variable. In a data chart, they will be at the top of the column. In a graph, they will be stated at the bottom and sides of the graph, along with the name of the variable. What are the values of the variables? In a data chart, the values are entries in the table. In a graph, the values are read off the scales at the bottom and sides of the graph.
Are there any trends?
Check to see whether there is an obvious consistent increase or decrease of any values as you move through the chart or graph.
Are there any correlations?
If there are trends in any of the variables, how do they relate to trends in other variables? As one variable increases, does another increase or decrease?
These questions are not always applicable, but if they are, it will help you try to find answers to them.
Every experiment and many kinds of theoretical studies present results in some kind of numerical matrix. This can be a data table, the familiar line graph, a bar graph, or any other kind that the author can think up. Three of the passages in the Science Reasoning Test will be some kind of data presentation, and about 15 of the questions willask you to interpret thosepassages. You may find that the passage presents you with data in a form that you have never seen before.
Hereis a sample Data Representation question. It is a graph showing how thepopulation density of two organisms changes with time, under two different conditions of cultivation. Data always consists of variables. In the graphs below, for example, the variables are species, condition of growth, relative population density, and age. The only numerical variable is age; its unit of measure (days) is marked on the horizontal axis.
Two species of the microorganism Paramecium are grown in cultures, and the population density is measured daily. The upper graph shows the results if the two species are raised in separate cultures. The lower graph shows the results if the two species are grown together in a single culture.
In interpreting any data representation, you must first be sure you understand what the variables are If they are not numerical, they will simply be named. There will always be numerical variables as well, and you must be able to find their values. These are the things to look for when you come to a Data Representation question:
What are the units of measure? These will usually be given along with the name of the variable. In a data chart, they will be at the top of the column. In a graph, they will be stated at the bottom and sides of the graph, along with the name of the variable.
What are the values of the variables? In a data chart, the values are entries in the table. In a graph, the values are read off the scales at the bottom and sides of the graph.
Are there any trends? Check to see whether there is an obvious consistent increase or decrease of any values as you move through the chart or graph.
Are there any correlations? If there are trends in any of the variables, how do they relate to trends in other variables? As one variable increases, does another increase or decrease?
These questions are not always applicable, but if they are, it will help you try to find answers to them.
Try these passages for practice. Since they are data representation questions, you must be able to answer certain questions, if they apply. What are the variables? What are the units of measure? How are values read from the data? Are there trends? Are there correlations?
Data and Non Data Questions are basically “Look It Up” questions. The majority of these questions test your ability to understand the figures. They want you to explain, describe, and identify some of the basic scientific concepts or assumptions that underlie the information provided in the figures. Some questions involve only one figure in the passage, while others require two or more. So for "Look It Up" questions, identify the piece of information needed.
Here's an example.
The term solubility refers to the amount of a substance (solute) that will dissolve in a given amount of a liquid substance (solvent). The solubility of solids in water varies with temperature. The graph below displays the water solubility curves for six crystalline solids.
1.Which of the following factors affects the degree to which KC! is soluble in water?
A.Only the quantity of KCI added to 100 ml of water
B.The temperature of the solution
C.Only the amount of solvent present in the solution
D.The weight of KC!
This question requires that you understand the variables-what's being compared with what. The variables are
•the solution's temperature; and •solubility, or the mass of solute that will dissolve in 100 ml of water
The graph shows you that for KC!, the solubility varies with the solution's temperature. That's why the answer is (B).
Translating Tables to Graphs
Sometimes you will be given a question that asks, "Which of the following graphs would best represent the results in the passage?" If you're given a table, you might have to translate the information into a graph. Luckily, we've just learned a few things about graphs and tables. Now we have to learn how to read a table and translate this information into a graph. To make a graph, draw both axes and label the axes x and y. Remember, the x-axis is the independent variable, and the y-axis is the dependent variable. After you have drawn your axes, you can begin to plot some points on the graph. Let's see if we can translate the information in the table about radioactive thorium into a graph.
Now let's see if you can translate a table into a graph. An investigator conducted a study to determine the relationship between temperature and pH of the enzyme chymotrypsin. Her findings are listed in the table below.
Thefirstthingtodoisdrawyouraxes.


Whatistheindependentvariable?It'sthenumberofexpiredhalf-lives.LabelyourxaxiswiththenumbersOthrough4.Now,what isthedependentvariable?It'stheamountofthoriumleftaftereachexpiredhalf-life.Labelthey-axiswiththenumbers1-to1. Nowyoucanplotthevaluesonthegraphandconnectthedots!


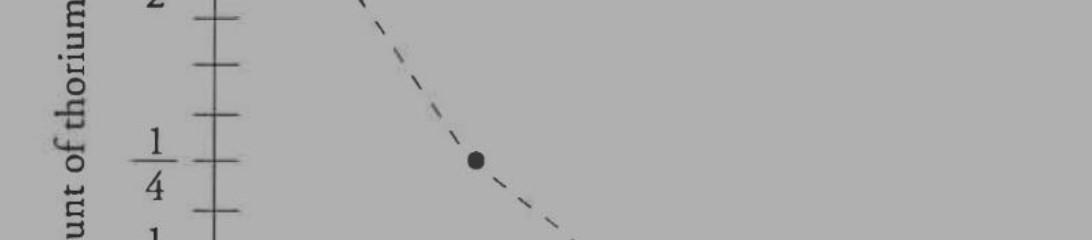
Nowlet'sseeifyoucantranslateatableintoagraph.Aninvestigatorconductedastudytodeterminetherelationshipbetween temperatureandpHoftheenzymechymotrypsin.Herfindingsarelistedinthetablebelow.
UsethespaceinthemargintodrawagraphthatrepresentstherelationshipbetweentemperatureandpHinthisexperiment.
ThisIsWhatYourGraphShouldLookLike

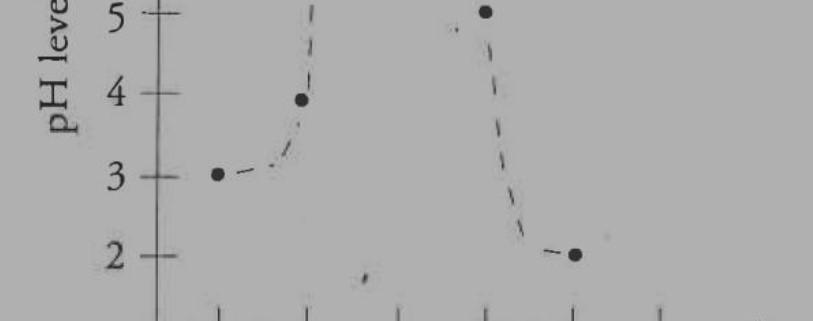
Thesequestionsaskyoutomakeconclusionsabouthypothesesbasedontheresultsoftheexperiments.Theymayaskwhether acertainconclusionisjustified,whetheracertainfactweakensorstrengthensahypothesis,orwhatassumptions arenecessarytomakeanargument.Sometimesthesequestionsmayrequireextendedreasoning,butoftentheyrequire littlemorethanlookingupdataandcanbedonebyelimination.
MostReasoningquestionstakethesameform.Thequestionpresentsyouwithastatementorhypothesisaboutthetopicof thepassage,andthequestionaskswhetherthedatasupportsthisstatement.Thechoiceswillhavetwocomponentsto theanswerchoices:theanswer(yesorno)andtheevidenceforthatanswer(usuallyadescriptionofthedata).So,thereare twoquestions:whetherthegivenstatementiscorrect,andwhatpartofthedatashowswhetherit'scorrect.
Youcandothesequestionsintwosteps.First,ignorethestatementinthequestion.Justlookatthechoicesandeliminatechoices thatarefalse.Lookatthesecondpartofthechoices,afterthe"Yes"or"No"andseeifitmatcheswhatweknow.Thesecondpart couldbeactualnumbersfromthefiguresandtables,orjustadescriptionoftheresults.Eliminateanythingthatisn'ttrue.Ifa choicesays"Yes,becausetheplantsallgotbigger,"gobackandmakesuretheplantsactuallygotbigger.You'llbesurprisedto seehowoftenthiseliminationisenoughtogetthewholequestion.
Ifyouhavemorethanonechoiceremaining,thenyoucanworryaboutwhetherthatinformationprovesordisprovesthe statementinthequestion.Oftenthismeansyou'llbeleftwithtwochoicesthatdescribethesamedatainthepassage,theonly differencebeingwhetherit'sa"Yes"ora"No".Sometimesseeingtherelationshipbetweenthehypothesisandthedatacanbe tricky,butoftenitjustcomesclowntoasking:arethesethingssayingthesamethingordifferentthings.Ifthehypothesis said"thefertilizerwillmaketheplantsgrow"andthedatashowedthattheplantsgotbigger,thenyes,thedataproved thehypothesis.Sometimesit'sreallythatsimple.
Thesequestionsrequireadditionalscientificknowledgethatisnotgiveninthepassage.Sometimesthismaybesomething assimpleasknowingwhatawordmeans(like"mammal").Othertimesyoumayneedanunderstandingofcertainproperties orconcepts(like"density")thataren'texplicitlydefinedinthepassage.Thesequestionscanbethemostannoying,since theyrelyoninformationthatisn'tpresent,buttheyarealsotheleastcommonquestiontype.
If you don't know the facts or definitions you need for a question, you'll probably be stuck and might freak out a little. It's okay. First, look at the choices and see if you can eliminate any that are clearly false based on what you do know from the passage. Once you've eliminated what you can, just guess something and move on to the next question. Remember: never ever leave any question blank for any reason ever, ever, ever.
Let's take a closer look at these question types by looking a sample passage on the next practice exercise below. This passage is a Research Summaries passage, presenting several different experiments about the same topic.
On this passage we will only present non-data questions for the sake of illustrating the question types. In reality, however, questions on Research Summaries passages aren't significantly different from those on Data Representation passages. Both passage types can have data and non-data questions. The biggest difference is that Experiment Design questions will only appear on Research Summary passages, not on Data Representation passages
The passage for Reasoning questions consists of a description of two or more experiments, followed by a statement of the results of the experiments. Your task is to answer five or six questions based on the results. You will succeed if you know what to look for. For purposes of discussing tactics, one experiment will be exemplified.
Here are some hints for attacking questions regarding research summaries, along with a sample passage to show you how these hints apply.
Each description of an experiment starts with a statement of what the experiment is designed to find out. Read this statement carefully; do not go any further until you are quite sure that you understand exactly what the experimental problem is.
Here is a sample of such a problem statement:
A horticulturist investigated the effects of using a high-nitrogen fertilizer on the growth of privet plants.
Understand the design
Next, study the description of the experimental method. It. may be accompanied by a diagram. Try to relate the design of the experiment to the problem that the experiment is designed to solve.
For the sample problem we are considering, the experimental design is as follows:
Fifty I-year-old privet plants were divided into 10 lots of 5 plants each. All were watered every third day with equal amounts of water. In 9 of the lots, different amounts of high-nitrogen fertilizer were added to the water once every 2 weeks for a year. The heights of the plants were measured at the end of the year.
Identify the variables
Research problems can fall into two general categories. In some problems, the investigator stud- ies some aspect of the natural world, often making measurements of some kind. By comparing measurements, the scientist hopes to come to some understanding of the nature of the process under study. Generally, there will be two or more variables, and what is being sought is a relationship between the variables. If the research problem you are given is of this kind, your first job is to identify the variables.
The second category of research is the experiment. Here, the investigator plays a more active part, varying some condition to see what will happen. The independent variable is the quantity that the experimenter adjusts or controls in some way. Presumably, this will make something else change. The something else is the dependent variable. Just as in the other kind of problem, you must first be sure that you understand what the variables are.
In the sample we are using, the independent variable is the amount of fertilizer, and the dependent variable is the heights of the plants at the end of the year.
Identify the controls
In an experiment, and sometimes in a strictly observational problem, there is always the danger that some unsuspected variable is affecting the outcome. The experimenter must make sure that whatever outcome is observed is due to changes in the independent variable, not in something else. The way to be sure is to include controls in the experiment. Controls are precautions taken to eliminate all variables except the independent variable.
In our sample experiment, all plants must have identical soil, air, light, and so on. All the plants must be genetically identical. Further, to make sure that the minimum amount of fertilizer has an effect, a special control sample must be included. This is a group of plants that are given no fertilizer. Unless this control group turns out to be different from the experimental groups, there is no way to be sure that the minimum amount of fertilizer is affecting the growth of the plants.
Study the results
The outcome of the experiment may be presented in words, in a diagram, or (most often) in the form of a data table. In such a table, the independent variable appears on the left, and the dependent variable on the right.
For our experiment, a table of experimental results might look like this:
An important control in this experiment is the first data point, when no fertilizer was used. Without this, there would be no way to tell whether 5 g/L of fertilizer had any effect at all.
What trend do you notice in these data? You should see that the fertilizer helps, but that over a wide range the amount is not important. There is no significant difference in plant height between 10 g/L and 30 g/L. However, it is also clear that, if too much fertilizer is used, growth is retarded.
Look for flaws in the experiment
Are the controls adequate? Is the conclusion justified by the data? Are the experimental errors so great as to invalidate the results?
In the sample experiment, for example, the experimenter did not specify that all the plants be genetically identical. Another flaw is the failure to describe exactly how the height of the plants was measured.
Once you thoroughly understand the nature of the experiment and the meaning of the results, you should be able to deal with the multiple-choice questions based on the experiment.

Data Representation and Research Summary passages tend to have similar question types following them. However, the Conflicting Viewpoints passages are noticeably different. The passage will present a topic or situation followed by several different theories that seek to explain the situation. Unlike the other types, there will be only one Conflicting Viewpoints passage per test. You will be given short statements representing the ideas of two scientists. They will disagree with each other. Your job is to analyze the arguments and information in the two statements. You will be asked to identify the nature of the disagreement, to tell why each of the scientists has arrived at the opinion expressed, and to identify forms of evidence that might resolve the conflict.
In this type of question, you will not be asked to decide which of the two scientists is correct. You will be required to identify points of agreement and disagreement. You may be asked to identify kinds of evidence that would tend to support or to deny either of the two viewpoints.
The biggest difference is that this passage usually involves less data and more reading. As a result, it can take longer to do, which is why many students may want to skip it entirely or save it for the end.
The dense reading also means that you can't gloss over the passage the same way you can with the other passage types. For other types, you can dive straight into the questions and start looking up data without reading a word from the paragraphs. Here, you have no choice: you have to read the paragraphs.
However, you don't have to memorize everything in the passage. All you need are the Main Ideas. This should be familiar to you from your Reading Strategies.
First, skim the opening paragraph to get a general sense of what it's about. No details, just the topic: it's about bird migration, or the structure of atoms, or double black holes. Sometimes the passage will begin by listing a series of specific known facts about the situation. Ignore these. Only read them if and when a question refers to them.
Then move on to the viewpoints. The viewpoints will usually be labeled in terms of the people presenting the views: Scientist 1 and Scientist 2, or Student 1 and Student 2. Usually there are 2-3 viewpoints per passage, but there could be as many as 5. (The more viewpoints there are, the shorter each will be.)
Get the main ideas of the different viewpoints presented. More often than not, you can just underline the first sentence of each viewpoint to get the main idea. These passages may contain some dense science content, but they're written in an unadorned, direct language. Each viewpoint will usually start by stating its hypothesis, followed by an explanation of why they think that, and how it fits in with the known facts. So, the first sentences should tell you what the hypotheses are.
If you've done this right, your Main Ideas will look something like this: TOPIC: Dogs smell weird when they get wet.
Scientist I: The smell is caused by oil in dog fur that chemically reacts with water.
Scientist 2: The smell is caused by microbes on the dogs' skin that release chemicals into the air.
Scientist 3: The smell is caused by a pheromone the dogs release because they are afraid of the bath
Now move on to the questions. Don't worry about the rest of the paragraphs. Yes, there is a lot of information in there, and yes you may be asked about it later. But you can worry about it if and when you're asked about it, not before.
Scientific information is never complete. While ideas and theories are developing, scientists will continue to disagree with each other. It is these disagreements that provide the spur for research. Experiments and other forms of investigation are specifically designed to resolve points at issue. It is through this dialogue of scientists with each other and with nature that consensus is eventually reached.
In the Conflicting Viewpoints questions, you will be given short statements representing the ideas of two scientists. They will disagree with each other. Your job is to analyze the arguments and information in the two statements. You will be asked to identify the nature of the disagreement, to tell why each of the scientists has arrived at the opinion expressed, and to identify forms of evidence that might resolve the conflict.
In this type of question, you will not be asked to decide which of the two scientists is correct. You will be required to identify points of agreement and disagreement. You may be asked to identify kinds of evidence that would tend to support or to deny either of the two viewpoints.
Here is a sample Conflicting Viewpoints passage, with a sample of possible questions at each of the three cognitive levels.
The Questions
You can use the same basic four-step method on Conflicting Viewpoints questions that you do for all other question types. Things will be a little different when there aren't tables or figures, but the general structure is the same.
1. In the question, underline any specific viewpoints mentioned (e.g. "Scientist 1", "Student 3", etc). Also underline any figure or table mentioned. If no viewpoints or figures are mentioned, move on to step 2.
2. In the question, underline any key words,just like on any other question.
3. Go back to the passage to find the key words:
a. If one or more viewpoints were mentioned, look for those key words in the viewpoints.
b. Ifno viewpoints were mentioned, look for the key words in the passage. Use your Main Ideas (the first sentences you underlined) to help you figure out which viewpoints to check.
4. Read what the passage or viewpoints say about the key words to answer the question.
The question types we've already discussed show up on Conflicting Viewpoints passages to varying degrees, sometimes in slightly different form. Most common are:
• Passage questions: These are questions that literally ask what the introduction or one ofthe hypotheses says. They occur quite frequently.
• Reasoning questions: These may occur in the "Yes" or "No" format we saw before. Other times, a question will ask which viewpoints would be supported or weakened by a given statement.
• Combination questions: Instead ofasking you to compare data or figures, these questions will ask you to directly compare and contrast different viewpoints.
On the link below you'll find a sample Conflicting Viewpoints passage and some questions. Try it on your own:
CLICK HERE TO ACCESS THE SCIENCE PASSAGE IV DRILL
CLICK HERE TO ACCESS THE SCIENCE PASSAGE V DRILL
You Can Receive a 70% Discount on our Full Length ACT Test Prep Class. Using This Link, You Pay Only $175. Our Normal Rate is $599 - This is a $424 Savings! Click Here Sign Up Today!