27four Beta Solutions conducts style-based analysis on the top 100 shares (by market capitalization) listed on the JSE. The research conducted involves style back-testing on 27four’s proprietary JSE dataset where shares are sorted on several style proxies. Long-only style benchmark returns are calculated on a buy-and-hold basis applying market capitalization and factor weighting. Market capitalization weighting implies assigning each share an initial in-portfolio weight based on their sorting date market cap-
italization while factor weighting implies applying the standardised style score (proxy) as the initial weighting. The results of both market capitalization and factor weighting are presented. Importantly, both market capitalization and factor weighted portfolios are identical in terms of their share constituents, the only difference being the initial weight assigned at each portfolio sort date.
The proxy for each style is described on the table below:
Size
Volatility
Liquidity
Dividend Yield
Linear combination of earnings yield (EY) and cashflow per share (CFPS)
Linear combination of idiosyncratic risk and market beta measured over the previous 252 trading days
Linear combination of return on assets (ROA), return on equity (ROE)and debt to equity ratio (D/E)
Natural logarithm of market capitalization on portfolio sort date
Average value traded measured over the previous 252 trading days relative to market capitalization
One year trailing total dividend (inclusive of special dividends) scaled by the current share price
Currency Risk Currency beta measured over the previous 252 trading days
Value = top 30 shares based on z-score combination of EY and CFPS
Low Vol = bottom 30 shares based on z-score combination of standard deviation and market beta
Quality = top 30 shares based on z-score combination of ROA, ROE less DE
Small = bottom 30 shares based on natural log of market capitalization
Illiquid = bottom 30 shares based on value traded scaled by market capitalization
High Yield = top 30 dividend paying shares based on natural log of dividend yield
Rand hedge = top 30 shares based on currency beta
Growth = bottom 30 shares based on z-score combination of EY and CFPS
High Vol = top 30 shares based on z-score combination of standard deviation and market beta
Junk = bottom 30 shares based on z-score combination of ROA, ROE less DE
Big = top 30 shares based on natural log of market capitalization
Liquid = top 30 shares based on value traded scaled by market capitalization
Low Yield = bottom 30 dividing paying shares based on natural log of dividend yield
Rand tracker = bottom 30 shares based on currency beta
minus Junk
Small minus Big
Illiquid minus liquid
High Yield minus Low Yield
Rand hedge minus rand tracker
Momentum’s performance over Q1 shows the divergence of outcomes associated with weighting methodologies. Market cap weighting dominated factor weighting over the quarter, with the former achieving the highest returns across styles of 18%, compared to the 3.2% for the latter. The discrepancy was even more stark when comparing the momentum premium (winner minus losers), with market cap weighting producing an excess return of 10.5% compared to -3.1% for factor weighting.
Value and growth produced consistent results across weighting methodologies with growth outperforming value over Q1 2025, with market cap weighting producing a growth premium of 2.9% while factor weighting returned 3.1%. The result is consistent with the market cap weighted momentum results for the quarter, given growth’s naturally high correlation with momentum.
Unlike global style performance for the quarter, low volatility shares dramatically underperformed their high volatility counterparts in Q1 2025. Factor weighting produced the starkest results, with high vol shares outperforming low vol by 13.8%. More importantly, on a long-only basis, factor weighted high vol produced the highest return across styles. In contrast to the positive performance of global low vol, the results seem to be largely driven by the composition of the JSE relative to the MSCI world. Almost every MSCI world style portfolio holds some degree of the tech heavy NASDAQ which was hardest hit due to the increased volatility associated with Trump’s return to office and swath of executive orders. Conversely, the JSE was largely helped by precious mineral counters, especially the gold miners which are notoriously volatile while simultaneously being viewed as a safe-haven in market turmoil scenarios.
Where low vol underperformed, quality outperformed. As noted above, quality as an investment style considers shares that have both high quality earnings and strong balance sheets. The increased global volatility drove SA investors into safer companies, as quality outperformed junk over Q1 2025. The quality premium was significantly stronger when applying market cap weighting, with quality outperforming junk by 11.2% (factor weighting produced a premium of 3.5%).
The good fortune of SA inc. small and mid-caps experienced over 2024 was reversed in Q1, with large caps clearly outperforming. Under both weighting methodologies, small and mid-caps posted the worst performance across styles, dropping by -4.5% and -4.3% respectively (market cap and factor weighting). Conversely, large caps performed positively, posting returns of 7.7% and 11.24% assuming market cap and factor weighting, resulting in large cap premiums of 12.1% and 15.5%.
Typically, the illiquidity premium is expected to be highly correlated with the size effect. Interestingly, this did not manifest over Q1 2025, with illiquid counters outperforming their liquid peers by 10.2% and 4.7% on a market cap and factor weighted basis respectively.
Given that dividend yield (DY) is used as proxy for value, academic literature typically indicates a positive relationship between the two styles. This did manifest on the JSE with high DY shares following value in Q1, underperforming low DY shares by 11.6% and 7.2% assuming market cap and factor weighting.
Rand hedge produced inconsistent performance across weighting methodologies. Over the past quarter, market cap weighted rand hedge shares outperformed rand trackers marginally by 1.7%. Conversely, factor weighting resulted in rand tracker shares dominating rand hedge by 9.9%. The result is logical, especially considering the precious metal surge over the quarter. Gold counters typically maintain above average Rand betas (high Rand beta implies rand hedge) as revenues are largely driven by commodity prices priced in USD yet maintain ZAR based expenses. Shares with the highest ZAR beta’s typically have ‘purer’ offshore exposure, with both income and expenses being denominated in hard currency. As mentioned, market cap weighting naturally upweights larger shares while factor weighting is determined based on the respective style proxy, therefore, in this case, precious metals were effectively upweighted in the market cap weighted Rand hedge portfolio and downweighted when applying factor weighting.
Instead of showing cumulative performance, we now present full year and last quarter performance of factors in excess of the JSE Capped SWIX (J433). The figures that follow describe excess style performance on a market cap and factor weighted basis.

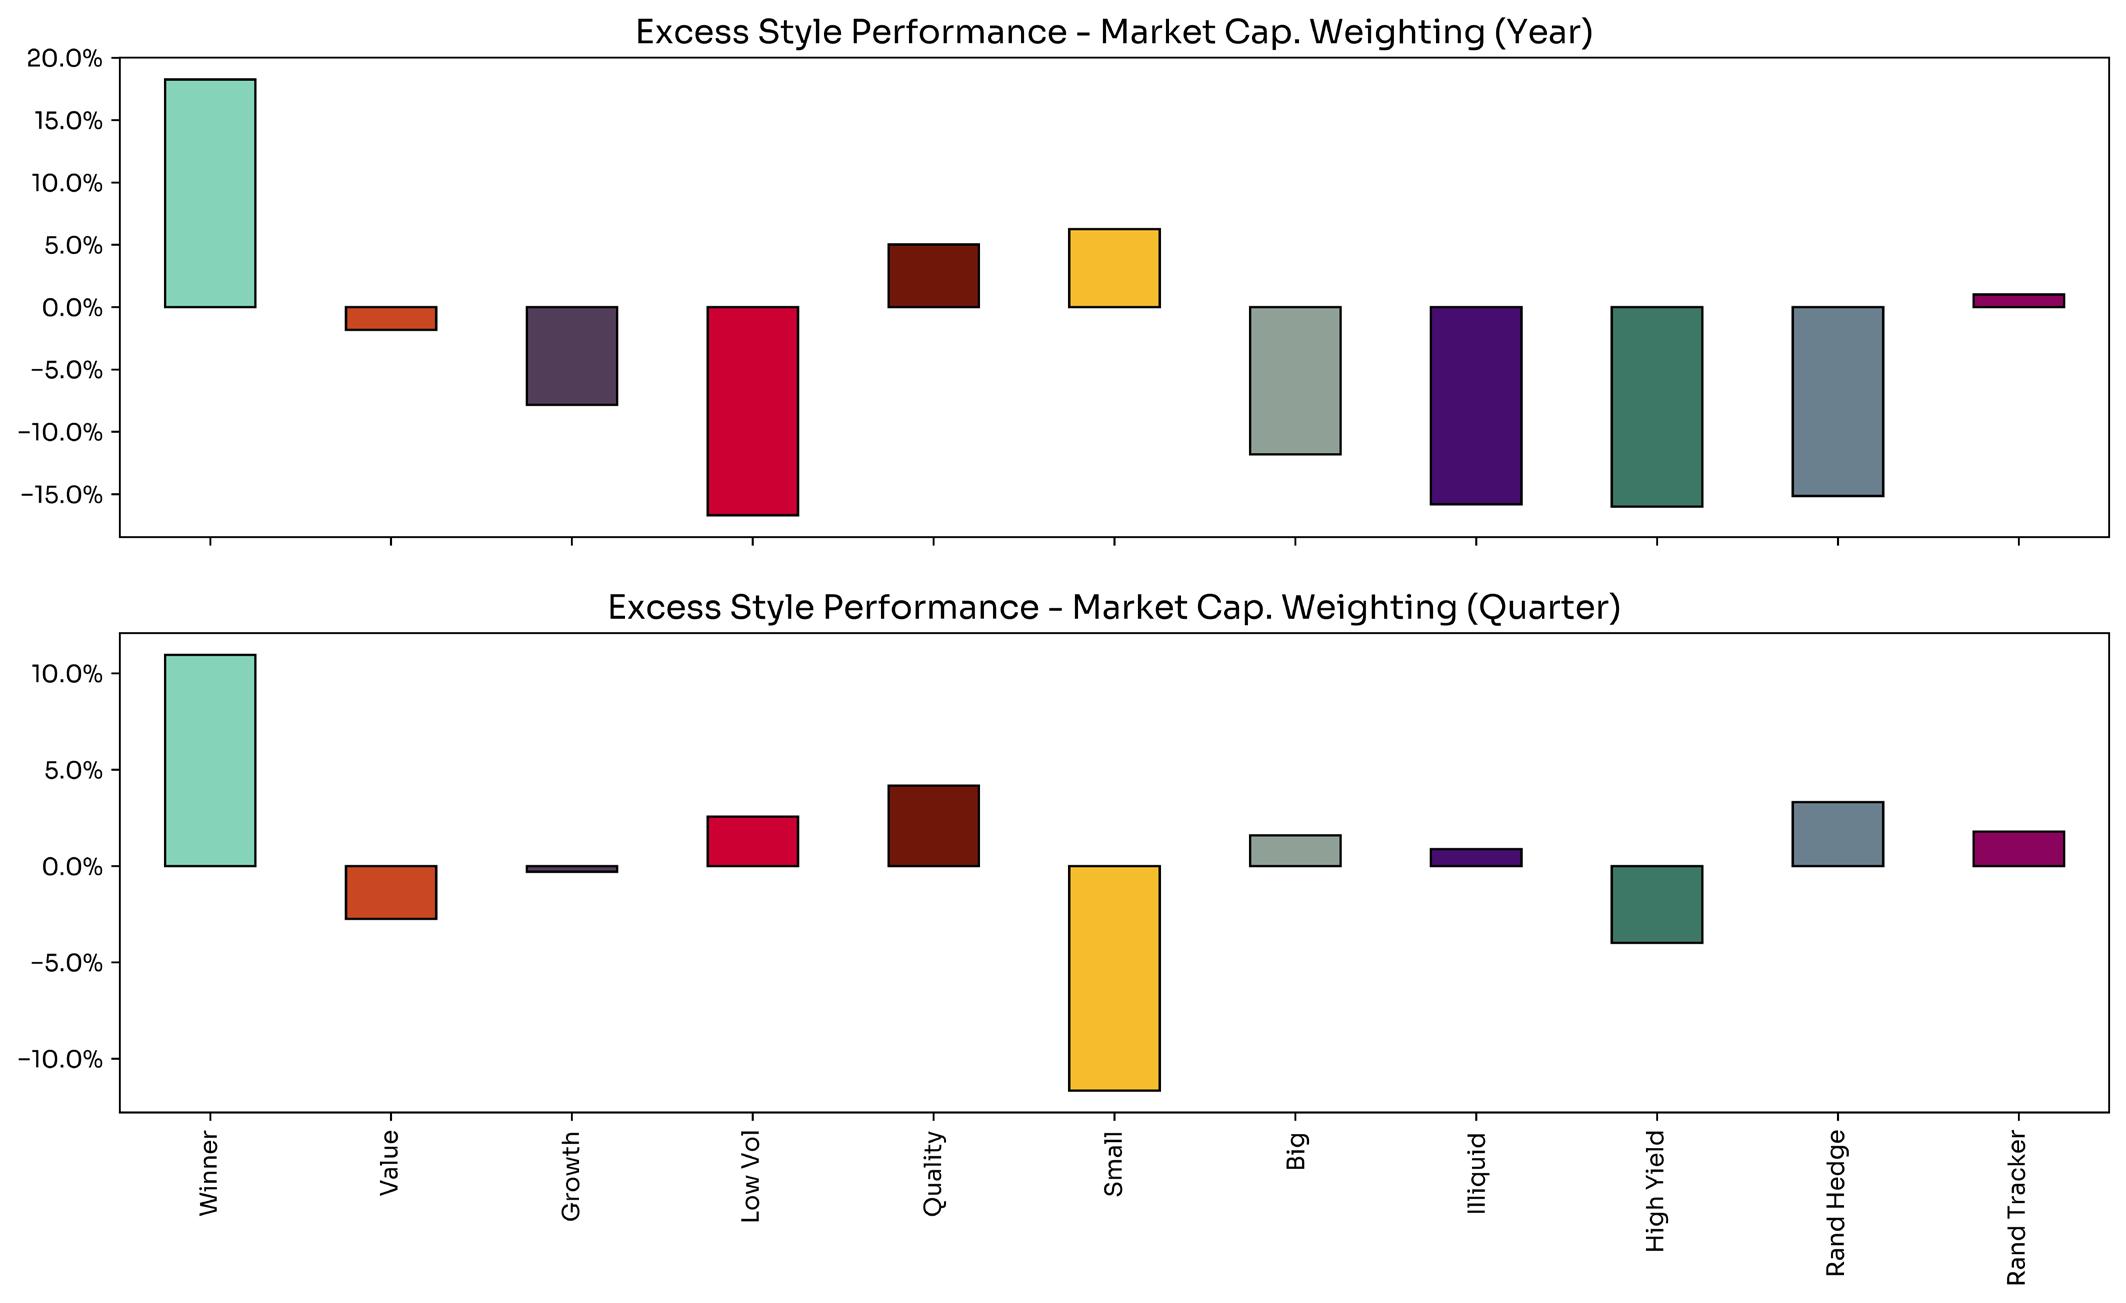
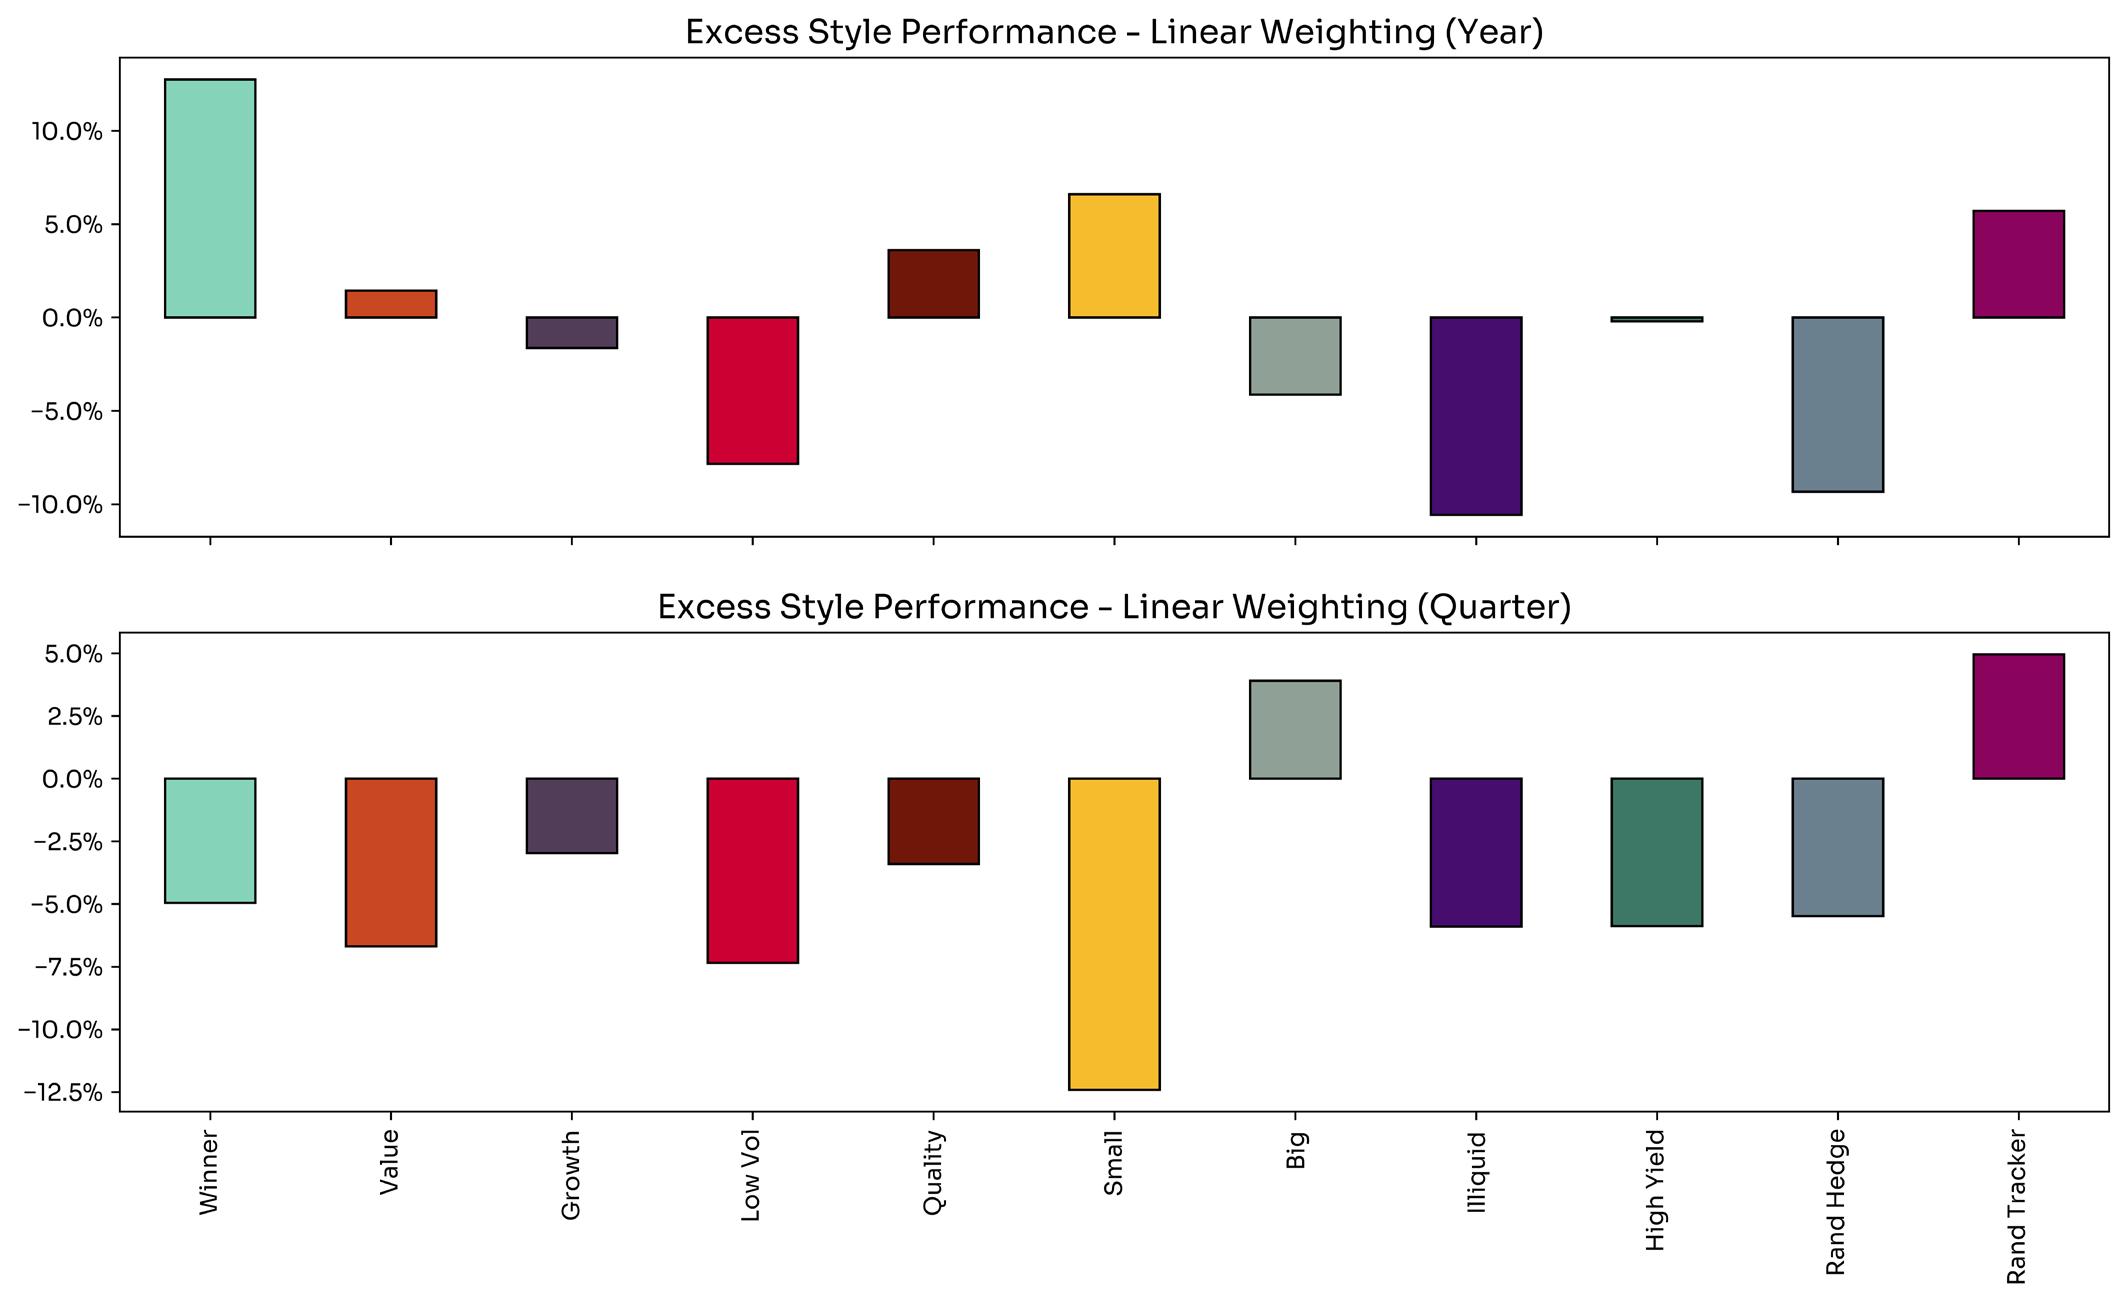
The results show:
• Market cap weighted momentum and quality convincingly outperformed the Capped SWIX over the quarter
• Factor weighting negatively impacted momentum and quality, with both underperforming the Capped SWIX over the quarter
• Under factor weighting, large cap and rand trackers posted the best returns while small and mid-caps were the biggest laggard for the quarter under both weighting methodologies.
The top 10 tickers per style category are described above with each tickers rank being determined by its respective styles z-score. The top 10 momentum maintained We Buy Cars at the top with the rest of the top 10 being a fair mix of small and large cap counters across industries. 3 of the big 4 banks made it into the top 10 value counters as well as both coal miners (Thungela and Exxaro). The top 10 growth counters were once again made up of largely consumer discretionary and consumer staples while BHP entered at number 4. Mr Price once again tops the quality counters in Q1 2025 as well as the other retailers (Clicks, Pick n’ Pay and Woolies). Thungela replaced by Exxaro as the top DY share, followed by Kumba and Exxaro, while the large RIETS also featured. The top 10 rand hedge counters are highly consistent given the relationship with the USDZAR exchange rate with all having either offshore hard currency earnings and asset bases (usual suspects, namely BAT, AB InBev & Richemont) while BidCorp came in at number 9.
Back-tests provide an educated glimpse of historical style related investment opportunities. Consistent with theoretical framework of asset pricing, we view styles as risk-factors that explain returns. Therefore, by implication, style returns are risky and move stochastically across the performance spectrum. This means that historical analysis provides minimal insight about the future performance of styles, especially over the short-term. To this end, 27four Beta Solutions applies data science and econometric modelling to provide short to mid-term views on future style performance. The models applied are vector auto-regression (“VAR”) and long and short-term memory (“LSTM”) deep learning neural networks. Both are well established in literature, with the former a staple in economics and finance studies while the latter is a more recent and highly popular machine learning algorithm. The benefit of both techniques is that they allow for the estimation of a ‘system’ where all variables in question are modelled to be inter-related. Once the system is modelled, recent data is fed into the models to estimate future performance using the style in question as well as the other styles present on the JSE.
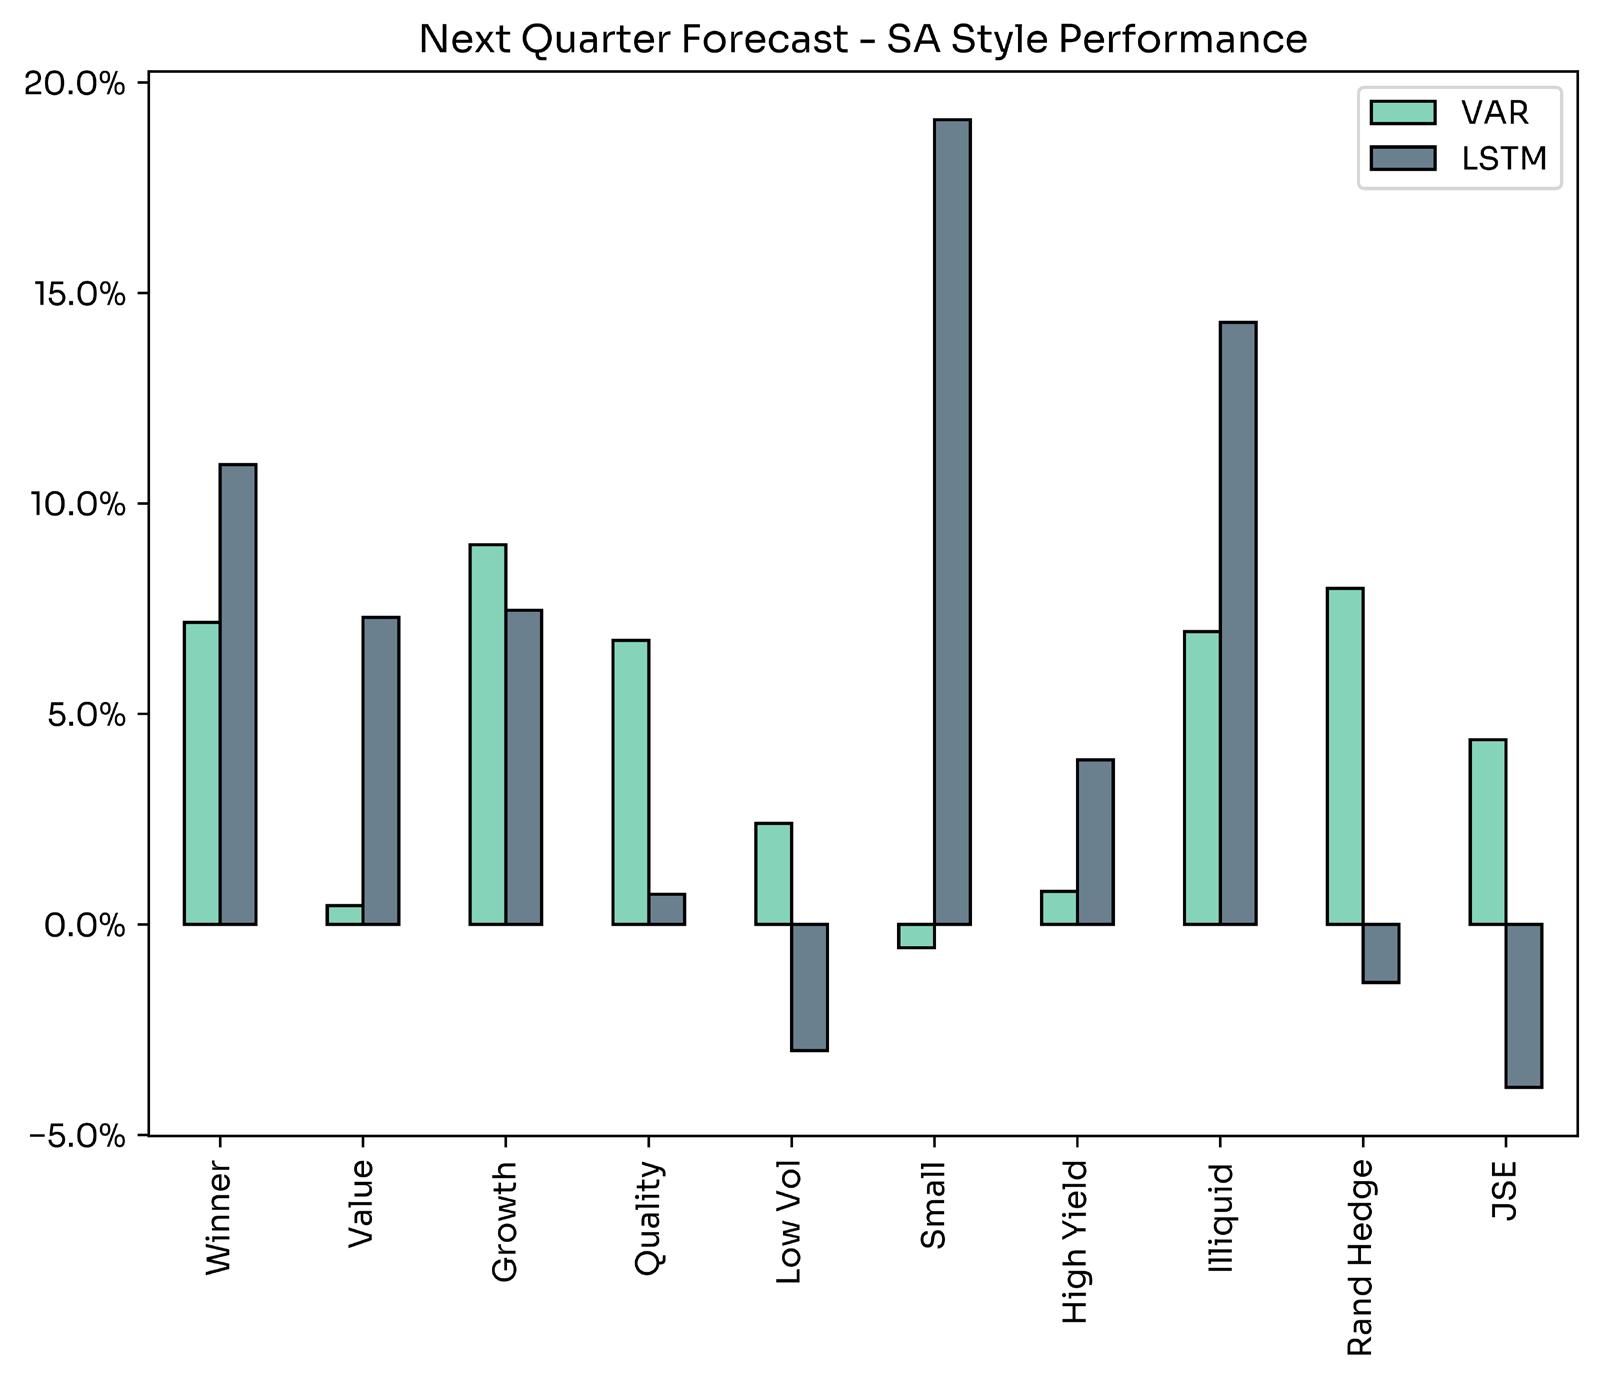
A summary of the results is presented graphically above. The figure shows the next quarters forecast for style performance on the JSE where the LSTM predicts relative outperformance for momentum, small and mid-caps as well as illiquid shares while having a negative outlook for the benchmark. Conversely, VAR is predicting superior performance for momentum, rand hedge and growth as well as positive performance for the benchmark. The results of the forecast analysis are synthesised in the table below where the prior quarters forecast is evaluated in terms of accuracy (green means materialised, yellow means partially materialised and red means did not materialise) as well as presenting in the last two columns the VAR and LSTM’s next quarter forecast.