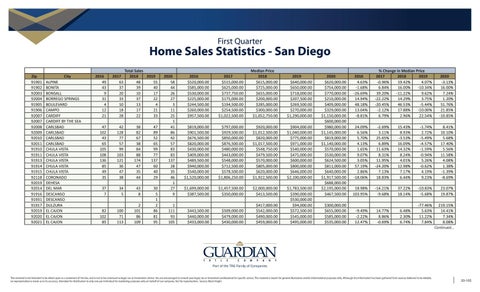
First Quarter
Home Sales Statistics - San Diego Zip 91901 91902 92003 92004 91905 91906 92007 92007 92008 92009 92010 92011 91910 91911 91913 91914 91915 92118 92019 92014 91916 91931 91917 92019 92020 92021
City ALPINE BONITA BONSALL BORREGO SPRINGS BOULEVARD CAMPO CARDIFF CARDIFF BY THE SEA CARLSBAD CARLSBAD CARLSBAD CARLSBAD CHULA VISTA CHULA VISTA CHULA VISTA CHULA VISTA CHULA VISTA CORONADO DEHESA DEL MAR DESCANSO DESCANSO DULZURA EL CAJON EL CAJON EL CAJON
Total Sales 2018 2019 48 55 39 40 10 17 37 22 13 4 17 21 22 33
2016 49 43 9 31 4 12 21
2017 63 37 20 33 10 18 28
47 102 43 65 105 108 136 85 49 35
42 128 77 57 99 103 121 36 47 38
38 82 67 38 84 88 174 47 35 44
47 89 52 65 99 77 137 60 40 29
37 7
34 5
43 8
82 102 85
100 71 113
2 101 86 109
30 5 1 2 86 81 95
2020 58 44 26 27 3 11 25 1 41 86 42 57 83 83 137 28 35 46 1 27 9 1 111 93 105
2016 $520,000.00 $585,000.00 $530,000.00 $225,000.00 $244,500.00 $260,000.00 $957,500.00
2017 $515,000.00 $625,000.00 $737,750.00 $175,000.00 $194,500.00 $254,500.00 $1,022,500.00
Median Price 2018 $615,000.00 $725,000.00 $655,000.00 $200,000.00 $285,000.00 $300,000.00 $1,052,750.00
2019 $640,000.00 $650,000.00 $718,000.00 $207,500.00 $269,500.00 $270,000.00 $1,290,000.00
$819,000.00 $901,500.00 $676,500.00 $820,000.00 $430,000.00 $409,000.00 $489,500.00 $940,000.00 $540,000.00 $1,520,000.00
$797,000.00 $929,500.00 $850,000.00 $876,500.00 $480,000.00 $443,000.00 $548,000.00 $712,500.00 $578,500.00 $1,806,250.00
$920,000.00 $1,012,500.00 $820,000.00 $1,017,500.00 $548,750.00 $479,500.00 $570,000.00 $805,000.00 $620,000.00 $1,922,500.00
$904,000.00 $1,040,000.00 $775,000.00 $971,000.00 $540,000.00 $475,000.00 $600,000.00 $800,000.00 $646,000.00 $2,100,000.00
$1,699,000.00 $387,500.00
$1,457,500.00 $350,000.00
$2,000,000.00 $413,500.00
$443,500.00 $440,000.00 $433,000.00
$509,000.00 $479,000.00 $430,000.00
$417,000.00 $542,000.00 $490,000.00 $459,000.00
$1,783,500.00 $390,000.00 $530,000.00 $94,000.00 $572,500.00 $545,000.00 $495,000.00
2020 $620,000.00 $754,000.00 $770,000.00 $210,000.00 $409,000.00 $329,000.00 $1,150,000.00 $600,000.00 $980,000.00 $1,145,000.00 $819,000.00 $1,140,000.00 $570,000.00 $530,000.00 $624,500.00 $811,000.00 $640,000.00 $1,917,500.00 $688,000.00 $2,195,000.00 $467,500.00 $300,000.00 $655,000.00 $585,000.00 $535,000.00
2016 4.63% -1.68% -26.69% 14.94% 48.18% 13.04% -8.81%
% Change in Median Price 2017 2018 2019 -0.96% 19.42% 4.07% 6.84% 16.00% -10.34% 39.20% -11.22% 9.62% -22.22% 14.29% 3.75% -20.45% 46.53% -5.44% -2.12% 17.88% -10.00% 6.79% 2.96% 22.54%
24.09% 6.56% 5.70% 4.13% 1.65% 9.07% 3.05% 57.19% 2.86% -18.06%
-2.69% 3.11% 25.65% 6.89% 11.63% 8.31% 11.95% -24.20% 7.13% 18.83%
15.43% 8.93% -3.53% 16.09% 14.32% 8.24% 4.01% 12.98% 7.17% 6.44%
-1.74% 2.72% -5.49% -4.57% -1.59% -0.94% 5.26% -0.62% 4.19% 9.23%
8.41% 10.10% 5.68% 17.40% 5.56% 11.58% 4.08% 1.38% -1.39% -8.69%
18.98% 103.95%
-14.21% -9.68%
37.22% 18.14%
-10.83% -5.68%
23.07% 19.87%
-9.49% -2.22% 12.47%
14.77% 8.86% -0.69%
6.48% 2.30% 6.74%
-77.46% 5.63% 11.22% 7.84%
219.15% 14.41% 7.34% 8.08%
2020 -3.13% 16.00% 7.24% 1.20% 51.76% 21.85% -10.85%
Continued...
This material is not intended to be relied upon as a statement of the law, and is not to be construed as legal, tax or investment advice. You are encouraged to consult your legal, tax or investment professional for specific advice. The material is meant for general illustration and/or informational purposes only. Although the information has been gathered from sources believed to be reliable, no representation is made as to its accuracy. Intended for distribution to only one per individual for marketing purposes only on behalf of our company. Not for reproduction. Source: Black Knight
20-165