TECHNICAL UNIVERSITY IN ZVOLEN Faculty of Wood Sciences and Technology
MAJLINGOVÁ, Andrea KAČÍKOVÁ, Danica
ZACHAR, Martin ŠPILÁK, Dominik
ADVANCED METHODS IN FIRE INVESTIGATION

This work was supported by the Slovak Research and Development Agency under the contract No. APVV-17-0005-0005 (35 %) and contract No. SK-CN-21-0002 (35 %); and project “Progressive research of performance properties of wood-based materials and products”! (LignoPro); ITMS 313011T720, supported by the Operational Programme Integrated Infrastructure (OPII) funded by the ERDF (30 %).
Authors:
Assoc. prof. Andrea Majlingová, PhD., MSc.
Department of Fire Protection
Faculty of Wood Sciences and Technology, Technical University in Zvolen, T. G. Masaryka 24, 960 01 Zvolen, Slovak Republic
Prof. Danica Kačíková, MSc., PhD.
Department of Fire Protection
Faculty of Wood Sciences and Technology, Technical University in Zvolen, T. G. Masaryka 24, 960 01 Zvolen, Slovak Republic
Assoc. prof. Martin Zachar, PhD.
Department of Fire Protection
Faculty of Wood Sciences and Technology, Technical University in Zvolen, T. G. Masaryka 24, 960 01 Zvolen, Slovak Republic
Dominik Špilák, PhD.
Reviewers:
Assoc. prof Péter Pántya, PhD.
Assoc. prof. Petr Kučera, Ph.D.
Publication: I. – 2022
Publisher: Technical University in Zvolen
Edition: PDF (electronic), 184 p.
Technical University in Zvolen
doc. Ing. Andrea Majlingová, PhD., MSc. prof. RNDr. Danica Kačíková, MSc., PhD. doc. Ing. Martin Zachar, PhD. Ing. Dominik Špilák, PhD.
Department of Fire Protection
Faculty of Wood Sciences and Technology, Technical University in Zvolen, T. G. Masaryka 24, 960 01 Zvolen, Slovak Republic
University of Public Service, Institute of Disaster Management, Budapest, Hungary
VŠB-TU Ostrava, Faculty of Safety Engineering, Czech Republic
For the scientific and language content of this publication are responsible the authors. The manuscript did not undergo language proof-reading.
ISBN 978-80-228-3347-9
All rights reserved. No part of the text or illustration may be used for further distribution in any form without the prior consent of the authors or the publisher.
TECHNICAL UNIVERSITY IN ZVOLEN
Faculty of Wood Sciences and Technology
MAJLINGOVÁ, Andrea KAČÍKOVÁ, Danica
ZACHAR, Martin ŠPILÁK, Dominik
ADVANCED METHODS IN FIRE INVESTIGATION
Scientific monograph
LIST OF ABBREVIATIONS AND SYMBOLS
Thermal conductivity
Density
∆m Differenceinmasses
AM Ante meridiem – Before noon
ASTM American Society for Testing and Materials
b Universal constant 2.898
C Centre
CO Carbon monoxide
CO2 Carbon dioxide
c Thermal capacity
CFAST Consolidated Fire and Smoke Transport
CFD Computational Fluid Dynamics
CLT Cross-laminated panel
DIN Deutsche Industrie-Normen
E East
EN European Standard
ETA Event Tree Analysis
FDS Fire Dynamics Simulator
FTA Fault Tree Analysis
FTIR Fourier-Transform Infrared Spectroscopy
GCV Gross calorific value
GIS Geographical Information System
HRR Heat Release Rate
HRRPUA Heat Release Rate Per Unit Area
HRRPUV Heat Release Rate Per Unit Volume
IAAI International Association of Arson Investigators
ILR Ignitable Liquid Residues
JPRL Forest Spatial Distribution Unit
Lf Flame height
Lfk Height of continuous flame
Lfp Height of pulsating flame
m(τ) Massofthesampleovertime
m(τ0) Originalmass ofthesample
m0 Woodmassinthedrystate
MS MicroSoft
MUF Melamine urea-formaldehyde
mw Woodmassata specified moisturecontent
MWIR Mid-wave infrared radiation
N North
NFA National Fire Academy
NFPA National Fire Protection Association
NIST National Institute of Standards and Technology
NWCG National Wildfire Coordinating Group
O2 Oxygen
P Probability
PM Post meridiem – After noon
PUR Polyurethane
PVC Polyvinyl chloride
R&D Research & Development
S South STN Slovak Technical Standard
T Thermodynamic temperature
t Time
TV Television
ʋ Rate of burning
Vw Volumeat aspecifiedmoisturecontent
w Moisturecontent
W West
wm Mass of wet fuel
ws Mass of dry fuel
α Absorption coefficient
β0
Nominal charring rate
δ(τ) Masslossovertime
Δ Time interval in which weight is recorded
ϵ Emissivity
λmax
Wavelength at which, at temperature (T), the radiation intensity is maximum
w Densityat aspecified moisturecontent
���� Relative rate of burning ����(��) Relative mass loss over time
The investigation of fires is one of the more complicated forensic sciences due to the continuously altered or destroyed evidence by the fire itself.
The job of current fire investigator is to provide scientific evidence, notably the analysis of scientific or engineering data, to the justice system to reduce uncertainty (TARONI ET AL.2010).
Fire investigation as a subpart of forensic science (HOUCK AND SIEGEL 2006) is defined as the application of a broad spectrum of sciences to answer questions of interest to the legal system, including both natural and human actions.
Fire is a highly three-dimensional, time-variant process with time-variant boundary conditions. For forensic scientists investigating fires is typical that the observations of damage after the fire may often be independent of the path taken by the fire making it difficult to identify where the fire started. Thus, a fire investigator must have a solid grasp of the physics and variables that influence a fire’s development, as well as how these variables may or may not have influenced the damage outcome (TARONI ET AL 2006).
The information about physics and variables that influence a fire’s development comes from research,i.e., the firetests providedforthis reason in variousscales and usingvarious standardized and non-standardized test methods as well as advanced technologies.
The aim of this monograph was to provide theoretical knowledge about the fire investigation as ascientificdiscipline,theprocesses and methods appliedin fireinvestigationpracticein general and specifically in the Slovak Republic. We focused both, as enclosure fires as wildfires and introduced the theoretical background of fire investigation of both.
In the monograph, there are introduced the results of research provided at the Department of Fire Protection, Faculty of Wood Sciences and Technology, Technical University in Zvolen, Slovakia, in the framework of research projects implemented. This research focuses development of new non standardized testing methods and apparatus to acquire new fire properties of material which lead to more specific and precise evaluation of those material in view of fire hazard. This information is a key input parameter into the fire modelling.
When firehypotheses (potentialfirescenarios)are identified,theprocess ofits validationstarts. To do it, computer-aided modelling is an advanced tools to test the validityof the hypotheses when changing the input parameters of material but also the environment.
To specify the hypotheses, i.e., the potential fire scenarios and to specify the reasons of fire ignition and furtherspread,theimplementation ofdecisionsupporttools is an advanced procedure,
which allows to prioritize all the considered hypotheses and scientifically prove the appropriateness of the choice as well as the validity of each of the hypotheses.
This work was supported by the Slovak Research and Development Agency under the contract No. APVV-17-0005-0005 (35 %) and contract No. SK-CN-21-0002 (35 %); and project “Progressive research of performance properties of wood-based materials and products” (LignoPro); ITMS 313011T720, supported by the Operational Programme Integrated Infrastructure (OPII) funded by the ERDF (30 %).
It is published on the 25th anniversary of the Department of Fire Protection, Faculty of Sciences and Technology, Technical University in Zvolen.
1. FIRE INVESTIGATION
1.1. INTRODUCTION TO THE FIRE INVESTIGATION
According to NFPA 1033, fire investigation is defined as “the formal process of determining the origin, cause, and development of a fire or explosion”. It is an integral part of fire safety science. It provides information necessarynot only for different branches of the fire safety science but also for revisions of fire regulations (STEEN-HANSEN,STORESUND,SESSENG 2020). It involves a wide variety of disciplines and therefore it also attracts wide variety of practitioners. These range from fire protection engineers who may only occasionally engage in forensic work to law enforcement officers, laboratory chemists, metallurgists, and materials engineers. (LENTINI 2019)
As STEEN-HANSEN, STORESUND, SESSENG (2020) further stated: „Investigation of fires and analyses of information from fires are useful tools for gathering experience and knowledge of characteristics of fires, how fires occur and why they develop as they do. Through investigation of fires important data and information can be collected and analysed. Such information may be used for assessment of regulations, it can form the basis of future regulations, it can be applied by insurance companies in risk assessments, be used by manufacturers of building materials for product evaluation and -development or may be useful for any other parties in fire safety work. “
Fire investigation includes two basic types of analysis - fire scene investigation and fire debris analysis. The former occurs primarily at the scene, while the latter occurs primarily in the laboratory for the purpose of detecting and identifying ignitable liquid residues. Fire debris analysis is based on established scientific principles and has been one of the most fully standardized forensic fields for the past 20 years (LENTINI 2008). Nevertheless, there are instances where additional research would help to improve its analytical capabilities.
Fire scene investigation is much more challenging than fire debris analysis for several reasons, including the extensive destruction of evidence caused by the fire and firefighting activities, the complex behaviour of fire, and the generally inadequate understanding of fire chemistry and physics by many investigators. Many of the evaluations and determinations are based on subjective determinations and judgments and, hence, depend on human cognitive factors. Depending on the extent of damage, one of the most difficult tasks is determining the fire’s point oforigin.“The origin of a fire is one of the most important hypotheses that an investigator develops and tests during the investigation. Generally, if the origin cannot be determined, the cause cannot
be determined, and generally, if the correct origin is not identified, the subsequent cause determination will also be incorrect” (NFPA1 921).
Fire origin and cause determination involves the evaluation of several variables, including witness statements, fire patterns, arc mapping and fire dynamics. Analysing these variables and documenting the relevant evidence is essential to understanding what the fire did and why. It is also important for fire investigators to document any actions taken by firefighters that may have altered the scene and/or evidence, so that it can be considered when conducting the investigation. (A
LMIRALL ET AL. 2017)Investigators must understand the relationship between the elements that constitute the fire tetrahedron: heat, fuel, oxygen, and the chemical reaction among the three. Although fire investigations is complexbecauseofthedifferent variablesthat must beconsidered,fires generally follow predictable behaviours. Initially, flames and smoke tend to flow up and outwards in a threedimensional buoyant plume rising from the fire. In confined spaces, these hot gases rise to the ceiling and then expand downward to form a smoke layer, charring or discolouring anything in this hot upper layer of the room. Patterns on surfaces in the fire enclosure will demonstrate how far the hot gases extended down from the ceiling. These behaviours leave behind patterns of damage that, if interpreted correctly, allow fire investigators to determine how the fire progressed through the structure, the fuels involved, and the point of origin.
Fire patterns can manifest themselves as V-patterns, caused by the intersection of a plume by a vertical surface. Some of the most common fire patterns include char patterns, damage patterns, and smoke and soot patterns. Charred material patterns typically result from direct flame involvement and may indicate the relative duration of burning, as well as the directionality of the flame movement. Damage patterns on objects, when unmoved, such as melted light bulbs, will also indicate the directionality of the heat source. Smoke and soot patterns may help the investigator determine how the fire developed. (A
LMIRALL ET AL. 2017)Burn patterns can be confusing and misleading because the point of origin will not necessarily be located where charring is deepest, or heat damage is most severe. This is particularly true for enclosure fires that grow to the point of flashover and become fully involved. Flashover is a transitional phase during which all exposed combustible surfaces in a room ignite almost simultaneously due to intense radiant heating from the hot gas layer in the room; flashover occurs when the temperature of the hot gas layer reaches 500-600 °C. Once flashover occurs, enclosure fires typicallybecome “fullyinvolved,” which means the room is filled with fire, and “ventilationlimited,” which means the rate of burning within the room becomes limited by the rate of air flow
into the enclosure through ventilation pathways rather than by the rate of fuel released by burning surfaces.
In afullyinvolved enclosurefire, themost intense burningoccurs wherefuel vapoursencounter oxygen entering the fire enclosure, and that may not be where the fire started. Such ventilationgenerated burn patterns have been interpreted incorrectlyin the past and are the subject of ongoing interest and research in the fire investigation community. Such misinterpretations have included inaccurate findings regarding the use of ignitable liquids and multiple fire origins, leading to incorrect determinations of incendiary fires.
Fire investigators routinely assess and interpret fire scene patterns and damages to develop hypotheses, and eventually draw conclusions about where a fire may have started and how that fire spread throughout a structure. In the case of pre-flashover fires, there is rarelydisparityamong fire investigators about the general area in which a fire originated. However, despite significant advances in the science of fire investigation, it is still a relatively common occurrence that two qualified fire investigators look at the same post-flashover fire scene evidence and reach different conclusionsregardingareaoforigin,andthenultimatelycause.Thefactthatdifferentinvestigators can review the same fire scene damages yet reach different interpretations about how those damages were generated, has been, and continues to be the premier problem in the evolution of fire investigation as a more reproducible scientific process. It is recognized that no system will ever eliminateall disputes among investigators, as anessential featureoforigin andcauseopinions is that they rely upon individual interpretation of data. Nevertheless, investigations that employ approaches based upon a solid scientific foundation are more likely to yield substantially similar conclusions, rather than vastly differing opinions. A major roadblock in quality, scientific-based fire investigations may be a generalized lack of understanding of the fundamental principles governing fire damage development among many practicing fire investigators. Investigators must have a clear understanding not just of the fire-related physics and material properties that are responsible for creating fire damages, but they must also be able to justifiably interpret those damages in a meaningful and technically accurate way. Several resources, including texts like NFPA 921 Guide for Fire and Explosion Investigations, organizations like the International Association of Arson Investigators2 (IAAI), and educational institutions like the National Fire Academy3 (NFA), attempt to address the issue of fire scene damage assessment and interpretation with some effectiveness, but the issue is by no means resolved. The purpose of this paper is to outline a practical and logical thought process to assist fire investigators in more accurately
and consistentlyidentifyingcorrect areas oforigin. Beforeoutliningthis framework,abriefreview of some fundamental fire science and damage dynamics principles is required. (COX 2013)
In addition to the process of fire investigation, which falls fully within the competence of officers of the Fire and Rescue Service (professional firefighters), we also recognize fire investigation, which on the other hand is fully within the competence of officers of the Police Corps. They investigate the fire or accident when a criminal offense is suspected.
1.1.1. Fire Investigation in Competency of Fire and Rescue Service
The basic legislation in the field of fire investigation in Slovakia is:
1. ACT NO. 314/2001 COLL. ON FIRE PROTECTION, as amended: this Act regulates the conditions forthe protectionofthe life and healthofnatural persons,propertyandtheenvironment
(Section 2 of ACT NO.17/1992COLL. ON THE ENVIRONMENT as amended bythe ACT NO.287/1994 COLL.) against fires and establishes the competence of state administration bodies and municipalities in the field of fire protection and fire brigades when providing rescue works during fires, natural disasters and other emergencies.
This Act further regulates:
obligations of central state administration bodies (ACT NO. 575/2001 COLL. ON THE ORGANISATION OF GOVERNMENT ACTIVITIES AND THE ORGANISATION OF CENTRAL STATE ADMINISTRATION, as amended). and other central authorities, municipalities, legal entities, natural persons-entrepreneurs,andnatural personsin thefield offireprotection,
training and competence requirements for fire protection activities,
performance of state administration in the field of fire protection,
types of firefighting units, their establishment, and duties in fighting the fires and providing the rescue work during natural disasters and other emergencies,
assisting when fighting the fires,
the tasks of Voluntary Fire Protection of the Slovak Republic and other civic associations in the field of fire protection,
penalties for breaches of obligations under fire protection regulations.
The Act deals with the issue of fire investigation in the fourth part – state fire supervision, namelyin § 25 performing state fire supervision and in § 26, 27, 28 introducing bodies performing state fire supervision.
State fire supervision means the activity of state administration bodies, aimed at checking compliance with the obligations of defined legal entities and entrepreneurial natural persons, in which the actual situation in the audited entities is compared with the situation required
by legislation. A new element in the performance of state fire supervision is also the fire investigation.
According to the Act, the following state fire supervision activities are carried out:
fire control of compliance with the obligations of the legal person and the natural person – entrepreneur, except for single-family houses and apartment buildings which have a maximum of eight floors above ground,
assessing the project documentation of buildings in terms of their fire safety and assessing the buildings with a view to meeting fire safety requirements according to the approved project documentation within the scope of the procedures regulated by the BUILDING ACT,
carrying out inspections of buildings during their implementation regarding fire safety according to approved project documentation,
fire investigation,
control of the municipality in matters entrusted to the performance of state administration in the field of fire protection,
checking the readiness and action of firefighting units and their material and technical equipment in the legal person and natural person – entrepreneur and in municipalities,
the imposition of measures to remedy the deficiencies identified and the monitoring of compliance with those measures,
supervision of specified products placed on the market under specific rules.
The body performing state fire inspection is entitled to enter the premises and facilities of a legal person or natural person – entrepreneur for the purpose of carrying out fire inspection or fire investigation accompanied by the authorized person and to request the necessary cooperation from the managers andother employees ofthe legal personornatural person –entrepreneur. When carrying out state fire inspection, a picture of the facts related to the deficiencies identified by the fire control or the facts related to the fire investigation, including the production of copies of the documentation in the field of fire protection, may be produced. The authoritycarryingout the state fire surveillance shall demonstrate the authority to carry it out before the fire inspection begins.
Minutes of the fire inspection carried out shall be drawn up by the authority carrying out the state fire inspection, indicating the inspected entity, the location and time of the inspection carried out, the proven control findings, including the deficiencies detected. The minutes shall specify the measures imposed and the time limits for remedying the deficiencies found, the date on which the minutes were discussed, the statement and signature of the statutory representative of the legal
person or the responsible representative of the natural person – the entrepreneur. An annex to the minutes shall be an image record.
State fire inspection is not carried out on simple structures and small structures.
The Ministry of Interior of the Slovak Republic performs state fire inspection:
in central authorities with a view to the performance of their duties,
evaluating the project documentation of buildings in terms of their fire safety and evaluating the buildings with a view to meeting fire safety requirements according to the approved project documentation within the scope of the procedures governed by the BUILDING ACT, for construction works to be carried out in the territorial districts of two or more regions, and by assessing the project documentation of buildings for which the principles of fire safety are not regulated, or by assessing the project documentation of buildings for which the principles of fire safety are not regulated, or by evaluating the project documentation of buildings for which the principles of fire safety are not regulated, or by evaluating the documentation of buildings design to be carried out in the territorial districts of two or more regions, and by assessing the documentation of buildings design for which the principles of fire safety are not regulated documentation of buildings which it reserves in terms of special economic or social importance,
evaluation of buildings in the approval procedure with a view to meeting fire safety requirements according to the approved project documentation of buildings for which the principles of fire safety are not regulated, or of buildings which it reserves in terms of special economic or social importance,
an evaluation of products placed on the market regarding their fire safety which are not intended products placed on the market under specific rules, if the evaluation of such a product is reserved,
fire investigation in particularly serious fire cases,
the inspection of specified products placed on the market regarding their fire safety according to specific regulations.
If, the Ministry of Interior, when carrying out state fire inspection, finds that a product placed on the market has serious deficiencies in certain characteristics from the point of view of fire safety, it may require the importer or manufacturer to submit the product at his own expense in the necessary quantity and with the required documentation to an accredited person to verify these characteristics.
If the product concerned does not comply with the required characteristics, the Ministry of Interior, bydecision, shall prohibit its production,placing on the market or import, or impose other measures.
The Regional Directorate of the Fire and Rescue Service performs state fire inspection:
evaluation the documentation of buildings to be carried out in the territorial districts of two or more district directorates or which it reserves in terms of special economic, social, or cultural significance,
evaluation of documentation of domestic technological equipment which, taken as a whole, is not subject to conformity evaluation under specific regulations,
fire investigation in severe cases.
fire inspection of compliance with the obligations of the selected legal person or natural person – entrepreneur.
The District Directorate of Fire and Rescue Service performs state fire inspection if this inspection does not fall within the competence of the Ministry of Interior of the Slovak Republic or the Regional Directorate of the Fire and Rescue Service
2. DECREE OF THE MINISTRY OF INTERIOR OF THE SLOVAK REPUBLIC NO. 121/2002 COLL. ON FIRE PREVENTION: this Decree implements certain provisions of the ACT OF THE NATIONAL COUNCIL OF THE SLOVAK REPUBLIC NO. 314/2001 COLL. ON FIRE PROTECTION, as amended. It deals with the issue fire investigation in § 41 Fire investigation:
“For each fire, the fire investigation is provided. Based on the data and knowledge gained in fire investigation, an intervention report or expert opinion on the cause of the fire, or fire engineering expertise, shall be prepared.”
The expert opinion on the cause of the fire or fire engineering expertise shall include in particular:
the circumstances, conditions and time data on the occurrence and spread of the fire,
place and cause of fire,
an evaluation of the infringement of the measures and obligations, including the proposal to impose a sanction.
Expert opinions on the causes of fires and fire engineering expertise are used mainly for determining fire protection measures and in the preparation of fire statistics
The fire statistics shall include:
the number of fires by their species,
the causes of fires,
number of persons rescued, injured, and killed in fires,
the amount of damage caused by fires and the saved values,
evaluation of the provision of fire protection by legal persons or natural persons entrepreneurs,
evaluation of violations of fire protection regulations in connection with the performance of state fire supervision,
evaluation of the fire safety situation in the sectors of the economy,
other relevant data necessary for the determination of preventive and organisational and organisational-technical measures.
For each fire, the fire investigation is provided. It is a specific professional activity aimed at identifying the circumstances related to the occurrence of a fire. Knowledge of this activity is applied in the field of fire prevention. In fire investigation, the Presidium of Fire and Rescue Service, the Regional Directorate and the District Directorate of the Fire and Rescue Service cooperate with other authorities, in particular the Police Force of the Slovak Republic, the courts and the prosecutor's office.
3. FIRE AND RESCUE SERVICE PRESIDENT'S INSTRUCTION NO. 32/2016 ON FIRE INVESTIGATION AND STATISTICAL MONITORING OF FIRES: this instruction regulates the organizational provision for the fire investigation, material and technical equipment of the fire investigator, details of sampling from the fire site, details of the documentation management, statistical monitoring of fires, fire analyses.
The following terms are also defined in the instruction:
Fire investigation: a summary of the activities and measures carried out on and outside the fire site aimed at objectively identifying the site (outbreak) and the cause of the fire,
Fire investigator: officer of the Fire and Rescue Service who passed basic training, specialized training, and special training in fire investigation,
Static inspection of the fire site - inspection associated with documentation of the current situation after the fire without handling objects on the fire site, in particular the detection of the site or outbreak of fire according to visible focal signs and signs of the direction of spread of the fire; part of the static inspection of the fire site is the collection of materials and information leading to the identification of the causes of fires,
Dynamic inspection of the fire site: inspection associated with the intervention of structures, equipment and installations on the fire site, their movement and movement of debris to find the initiator of the fire and, where appropriate, to the sampling for examination to identify the causes of the fires,
Direct fire damage: quantified or expertly estimated financial damage resulting from the immediate action of the fire and damage, deterioration, or destruction of the structure and its equipment, machinery and technological equipment, stored materials, means of transport and transport, transported materials, plantations of forest and agricultural areas, etc.; the amount of direct damage shall be quantified by the owner and, in other cases, by the intervention commander or investigator.
For fire investigation purposes, fire shall be classified by the following facts:
whether the fire brigade intervened,
damage to property, damage to health or other damage.
To determine the state fire supervision authority competent to investigate the fire, fire shall be classified to:
a fire in which a direct damage of up to € 200,000 has been caused and no more than one person has been killed,
serious case of fire,
particularly serious case of fire.
A serious case of fire:
at least two people have been killed,
at least three people were injured, at least one of whom suffered serious personal injury or was fatally injured.
A particularly serious case of fire:
at least three people have been killed,
at least seven people have been injured, at least one of whom has suffered grievous bodily harm or has been fatally injured,
direct damage incurred in the amount of more than € 200,000.
To investigate the fire, measures will be taken in cooperation with police officers to prevent access by unauthorized persons. To investigate the fire after arrival at the fire site, the fire investigator shall in particular:
carry out a static and dynamic inspection of the fire site with a focus on detecting the place of the fire,
document the fire site with a focus on its scope and shape,
familiar with the design of the building, the technology of equipment and production, the types and properties of combustible materials present, the operation of equipment and persons before the fire and at the time of fire,
carry out a dynamic inspection with a focus on identifying possible initiators of a fire, documenting the established evidence,
carry out an inspection of the fire site aimed at determining the conditions for the possible spread of fire to the flammable materials and structures present,
provide further necessary data from the intervening fire brigades, police authorities and investigators of the Police Force and the owner or user of the building for further joint action in carrying out a dynamic inspection of the fire site,
determine the outbreak of the fire according to the degree of burnout, destructive signs, lessons learned and witness statements,
determine the versions of possible causes of the fire.
If a police officer is present at the scene of the fire, the fire investigator shall, in agreement with him/ her,ifnecessary, takesamples oftheevidence,objects, appliances, equipment orpartsthereof to assess the fire safety, safety and other required characteristics and characteristics or to assess the possible initiator of the fire. The task of the fire investigator in the sampling is to provide the physical evidence found which expresses the conditions and peculiarities of burning or the causal link with the occurrence of the fire. In the case of collection of materials or substances, a comparative sample which has not been damaged by fire shall also be taken from the fire site The purpose of sampling and subsequent examination of samples of evidence is to confirm or exclude versions of the cause of fire. Samples of evidentiary material shall be taken from the fire site if:
evidence should be taken from a larger quantity of material or substance,
evidence for its dimensions cannot be taken and sent for expert assessment and may be sampled,
a sample of the material or substance is sufficient to identify and assess the properties and characteristics,
it is possible to take for examination the apparatus, appliance, equipment, or part thereof which may have acted as the initiator when the fire started.
Accompanying documentation consisting of:
a protocol on the sampling of the fire site and other evidence,
photo documentation with an indicative fire site plan and photographic images of the sampling point; the sampling point shall be indicated by an arrow,
technical documentation (project documentation, instructions for use, operation, and maintenance, etc.),
a description of the situation at the time of the fire,
a description of the individual samples and basic information on these samples. The report on the sampling and evidence from the fire site shall include:
an indication of the relevant district directorate or institute,
fire registration number,
the address of the place of fire,
a description of the object where the sample was taken (indicating the sampling point),
a description of the sample, focusing on its original functional designation and the status or description of the material from which the sample was taken, indicating the quantity of the sample,
the date and time of sampling,
conditions for collection (weather, method of collection, etc.),
the method of packing the sample,
requirements for laboratory examination.
1.1.2. Fire investigation in competency of the Police Corps
Fire investigation under the responsibility of the Police Force comes into consideration when a crime has occurred.
Analytical examination of stops and samples is provided by the Institute of Criminology and Expertise of the Police Force of the Slovak Republic. It examines traces and samples from the crime scene, or samples otherwise related to the crime, which are submitted mainly to law enforcement andcourts forexamination.Uponrequest, theexpertshall,ifnecessary,as an adviser, take part in a crime scene inspection. The results of the examination of criminal traces, the facts established at the crime scene or in the psychophysiological examination of persons are processed in writing by the institute's experts mainly in the form of an expert opinion or expert opinion answering questions put by the investigator, the court, or other qualified entities.
For the purposes of this publication, it is necessary to define the crime and to indicate the selected provisions of ACT NO. 300/2005 COLL. (CRIMINAL CODE). Section 8 defines an offence as an unlawful act, the characteristics of which are set out in this Act, unless this Act provides otherwise.
Under Section 9 of the Act, the offence is misdeed and transgression.
According to Section 10(1) of the Act, the transgression is:
an offence committed negligently, or
an intentional offence for which this Act provides in a specific section for a custodial sentence with a maximum limit not exceeding five years.
According to Section 11(1) of the Act, a crime is a deliberate offence for which that law provides, in a specific section, for a custodial sentence with a maximum penalty of more than five years. According to Paragraph 11(3) of the Act, the crime for which that law provides for a custodial sentence with a lower term of imprisonment of at least 10 years is particularly serious. The offence may be committed intentionally or negligently. Under Section 15 of the CRIMINAL CODE, an offence is committed intentionally if the offender:
intended, in the manner set out in this Act, to infringe or jeopardize the interest protected by
by this Act, or
he/she knew that by his actions he could cause such an infringement or threat and was aware of it if he/she caused it.
Under Section 16 of the Criminal Code, an offence is committed negligently if the offender:
he/she knew that he may, in the manner provided for in this Act, violate or threaten the interest protected by this Act, but relied on, without reasonable grounds, not to cause such an infringement or threat, or
he/shewas unawarethat,byhis actions, he/shewas liableto causesuch an infringement or threat, even though he should have known and could have known about it in the light of the circumstances and his personal circumstances.
In ACT NO. 300/2005 COLL., the fire is directly mentioned in Sections 284, 286 and 315.
Pursuant to Section 284(1) of the CRIMINAL CODE, an offence is activity of a person who intentionally:
puts people at risk of death or serious injury to health or foreign property at risk of large-scale damage by causing fire or flooding, or failure, or accident, or accident of a means of mass transport of persons, or the harmful effect of explosives, gas, electricity, radioactivity or other similarly hazardous substances or forces, or commits any other similar dangerous act (general hazard), or
general danger will increase or make it more difficult to avert or mitigate it. Thus, the intentional establishment (causing) of a fire within the meaning of Section 284 of the CRIMINAL CODE is one of the intentional offences referred to as a general danger.
According to Section 285(1) of the CRIMINAL CODE, the activity of a person who, negligently, causes or increases a general danger, or makes it more difficult to avert or mitigate it.
Pursuant to Section 286(1)(d) of the CRIMINAL CODE, a deliberate threat to the operation of apublicprotectivedevice usedforfirefighting, floodorotheremergenciesis considered a criminal offence.
According to Section 315(1) of the CRIMINAL CODE, a criminal offence is the activity of a person intending to damage the constitutional equipment or defences of the Slovak Republic:
he/she puts a group of persons at risk of death, serious personal injury, or foreign property at risk of large-scale damage by causing a fire or flood, or a breakdown, or an accident, or an accident of a means of mass transport of persons, or the harmful effect of explosives, gas, electricity, radioactivity, or other similarly hazardous substances or forces, or increases or makes it more difficult to avert or mitigate; or
he/she commits other similar dangerous activity.
Such conduct is referred to as a criminal act within the meaningof Section 315 of the CRIMINAL CODE
The intentional setting of a fire aimed at killing or causing serious personal injury to persons or causing damage to a large extent to foreign property or damage to the constitutional equipment or defences of the Slovak Republic is a deliberate crime within the meaning of Sections 284 and 315 of the CRIMINAL CODE.
Failure in meeting the compliance with fire prevention obligations resulting in general danger is a negligent offence within the meaning of Section 285(1) of the CRIMINAL CODE.
However, fire-related offences do not necessarily have to be linked solely to its cause (intentional or unintentional). For example, under Section 158 of the CRIMINAL CODE, the offence is committed by someone who negligently harms his/her health by violating an important obligation arising from his employment, status or function imposed on him by law. Neglect of an important legal obligation (e.g., negligence of the obligation laid down in § 5(b) – maintenance of permanently free escape routes of ACT NO 314/2001 COLL ), which in the event of a fire (regardless of the cause of its occurrence) results in harm to another health, is a criminal offence within the meaning of Section 158 of the CRIMINAL CODE
In addition, the cause of a fire may relate to the intention to commit another crime, e.g., insurance fraud within the meaning of Section 223 of the CRIMINAL CODE or with the intention of covering up or making it difficult to investigate another (often more serious) crime, e.g., premeditated murder or murder pursuant to Section 144 and 145 or embezzlement under Section 213 of the CRIMINAL CODE
Crimes in the Slovak Republic are investigated by law enforcement authorities for which, pursuant to Section 10(1) of ACT NO. 301/2005 COLL. (CODE OF CRIMINAL PROCEDURE), the prosecutor and the policeman are responsible. According to Section 10(8) of the CODE OF CRIMINAL PROCEDURE, police officers are understood to mean:
investigator of the Police Force,
investigator of the financial administration (in the case of offences in connection with an infringement of customs or vat legislation in the field of value added tax on imports and excise duties),
officer in charge of the Police Force,
officer in charge of the military police (in proceedings for offences of officers of the armed forces),
officer in charge of the Prison and Judicial Guard Corps (in proceedings concerning offences of officers of the Prison and Judicial Guard Corps and in the premises of the Prison and Judicial Guard Corps and its employees, and on the crimes of persons in custody or in custody),
authorised officers of the financial administration (in the case of offences committed in connection with an infringement of customs or vat legislation in the field of value added tax on importation and excise duties),
the master of the seagoing ship in proceedings for offences committed on that ship. In addition to criminal offences, persons may commit an offence in connection with the occurrence of fire or the failure in meeting the fire protection obligations. The offence defines Section 2(1) of ACT NO 372/1990 COLL as a faulty act which violates or threatens the interest of the company and is expressly designated as an offence in this or another act unless it is another administrative offence punishable by special legislation or a criminal offence.
Offences resulting from a breach of obligations laid down byACT NO 314/2001COLL are dealt with by Fire and Rescue Service officers based on § 59 and § 61 of the Act.
1.1.3. Fire Investigation Experts
Experts from the branch 32 02 00 Fire investigation, or experts from the branch 32 00 00 Fire protection, performing their activities based on ACT NO. 382/2004 COLL. and DECREE OF THE MINISTRY OF JUSTICE NO 490/2004 COLL may also comment on certain issues related to the degree of responsibilityin connection with a fire in an expert opinion. Therefore, their activitycan be considered as Fire Analysis in terms of NFPA 921: 2014. Also, persons conducting investigation under ACT NO 473/2005 COLL and DECREE OF THE MINISTRY OF JUSTICE NO 634/2005 COLL. may obtain information which may serve as evidence in proceedings before a court or administrative authority concerning the degree of liability in relation to a fire.
1.2.SCIENTIFIC APPROACH TO THE FIRE INVESTIGATION
Police and fire investigators were often slow to accept advances in fire science that called into question what had long been considered unmistakable evidence of arson and in manyjurisdictions,
those new rules were slow to take hold, as veteran investigators clung to what are now considered disproven theories. In fact, some investigators have been openly hostile to the updated science (MILLS, 2015). As advances in fire science are being made, investigators and attorneys are revisiting old cases. What they are finding is chilling.
We will never know for sure how many people have been wrongfully convicted based on the methods and practices. Likewise, we will never know how many criminal arsonists have not been indicted because of inadequate forensic tools. (A
LMIRALL ET AL 2017)Some of the most significant changes in fire investigation in the last 20 years have been the result of legal interpretations of the Daubert, Kumho Tire, Joiner, and Benfield. Today’s fire investigator must demonstrate to the court that he or she has the training and qualifications to offer an opinion about the fire, has data (information) to support that conclusion, has followed an appropriate protocol in the investigation and decision-making process, and has followed, in general, the scientific method of inquiry. (D
EHAAN, ICOVE 2009)The complexities encountered in fire investigation are sometimes overwhelming to the investigator, but patience and adherence to fundamental scientific principles of combustion, fire behaviour, and heat transfer will usually result in a reasonable and defensible diagnosis of the fire if there are sufficient reliable data.
Asindicatedabove, at present, thescientificapproach to fireinvestigation also defines thestateof-the art of fire investigation.
In recent years, the term scientific method of fire investigation has been more widely introduced, sometimes to the confusion of fire investigators (SALLEY ET AL. 2007). The concept does not mean that a fire investigator must be a scientist, or to analyse things in a laboratory, or to replicate a fire scene in a field test or computer model. It means to apply the scientific method of logical inquiry to the investigation. It is an approach most good fire investigators already apply; it simply means the investigation follows a series of logical steps.
The universally accepted methodology cited by NFPA 921 in conducting investigations into the origin and causes of fires centres on the use of the scientific method, which embraces sound scientific and fire protection engineering principles. NFPA 921 defines the scientific method as the systematic pursuit of knowledge involving the recognition and formulation of a problem, the collection of data through observation and experiment, and the formulation and testing of a hypothesis.
The basic concepts of the scientific method are simply to observe, hypothesize, test, and conclude. The scientific method is considered the best approach for conducting fire scene origin and cause determinations, analysis, and reconstruction. The process of the scientific method
is that it continuously refines and explores various working hypotheses until arriving at a final expert conclusion or opinion. (IQBAL,SALLEY 2004)
As applied to fire investigation and reconstruction, the scientific method is a logical and iterative seven-step systematic process. Properly applied, this systematic process addresses how to correctly formulate, test, and validate a hypothesis. Fire investigation as a seven-step process (DEHAAN, ICOVE 2009):
1. Needs recognising: The responsibility of first responders is to protect a scene until a full investigation can be started. After initial notification, the investigator should proceed to the scene as soon as possible and determine the resources needed to thoroughly conduct the investigation. It is necessary not only to determine the origin and cause of the fire or accident but to determine whether future fires, explosions (i.e., domino effects), or loss of life can be prevented through new designs, codes, or enforcement strategies. In public-safety sectors, determination of the origin and cause of every fire is often a statutory requirement.
2. Problem definition: This step is usually focused on the finding of the cause and nature of the loss but may also include specification who has the primary responsibility and authority to interview witnesses, protect evidence, and review preliminary findings and documents describing the loss. The tasks of the fire investigator in this phase are as follows: devise a tentative investigative plan to preserve and protect the scene; determine the cause and nature of the loss; conduct a needs assessment; formulate and implement a strategic plan; and prepare a report.
3. Data collection: Facts and information about the incident are collected through direct observations, measurements, photography, evidence collection, testing, experimentation, case histories, and witness interviews. All collected data should be subject to verification of how they were legally obtained, their chain of custody, and notation as to their reliability and authoritative nature. Data collection should include the documentation of the property; construction and occupancy; fuel loading; the processing and layering of the debris and evidence as found; examination of the fire (heat and smoke) patterns; char depths and calcination; and the application of electrical arc mapping surveys where relevant.
4. Data analysis: Using inductive reasoning (which involves formulating a conclusion based on several observations), all the data collected should be analysed. The fire investigator relies on his or her knowledge, training, and experience in evaluating the totalityof the data. This subjective approach to the analysis may include knowledge of similar loss histories (observed or obtained from references), training in and understanding of fire dynamics, fire testing experience, and experimentaldata.Data evaluated canincludethe patternoffiredamage, heat and flamevectoring, arc mapping, and fire engineering and modelling analysis.
5. Working hypothesis development: A hypothesis is defined as “a supposition or conjecture put forward to account for certain facts and used as a basis for further investigation by which it may be proved or disproved” (KRASNY,PARKER, BABRAUSKAS 2001). Based on the data analysis, the investigator develops a tentative or working hypothesis to explain the fire’s origin, cause, and development that is consistent with on-scene observations, physical evidence, and testimony from witnesses. The hypothesis may address a causal mechanism or a mathematical relation (e.g., plume flame height, impact of differing fuel loads, locations of competent ignition sources, room dimensions, impact of open or closed doors and windows).
6. Working hypothesis testing: Deductive reasoning involves a conclusion based on previously known facts. Using deductive reasoning, the working hypothesis is compared with all other known facts, the incidence of prior loss histories, relevant fire test data, authoritative published treatises, and experiments. The hypothesis testing is used to eliminate all other reasonable origins and causes for the fire or explosion. If necessary, the collection and analysis of additional data is recommended, as well as seeking new information from witnesses, and development or modification of the working hypothesis. Interactively repeat steps 4, 5, and 6 until there are no discrepancies with the working hypothesis. A critical feature of hypothesis testingistocreatealternativehypothesesthatalso canbetested.Ifthealternativesareinopposition to the working hypothesis, their evaluation may reveal issues that need to be addressed. By testing all hypotheses rigorously against the data, those that cannot be conclusively eliminated should still be considered viable. The scientific process as used in fire investigation is fundamentally different from that used in other fields, because in most fire cases, the solution or final hypothesis will not be tested byburninganother house, vehicle, or wildland to see if the outcome is similar. (DE
HAAN, ICOVE 2009)The investigator must gather adequate reliable data and apply robust, reliable analyses (usually of basic indicators of fire movement, intensity, or duration) to develop a working (primary) hypothesis. Because these findings will often be “tested” in an adversarial legal proceeding, the fire investigator is expected to have devised and tested alternate explanations (hypotheses). The evaluation of all these hypotheses is sometimes called abductive reasoning. The outcome of this process is the selection of the hypothesis that fits all available data and the rejection of all other reasonable hypotheses. When applied in medical evaluations, this process is called differential diagnosis. This process best describes most modern fire investigations. Even though it does not follow every sequential step of the pure “scientific method,” it is a well-recognized analytical process. It should be noted that this application of the scientific method is not the same as that used in experimental science. There, observation of an event causes the scientist to
formulate a hypothesis about a possible explanation and then design experiments to gather data (information) with the specific intent of testing or rejecting that primary hypothesis. Only if the primary hypothesis has been rejected (or shown to be incorrect) will the experimenter return to the process and create another testable scientific hypothesis. The crucial test for scientific inquiries is to use the “proven” hypothesis to predict the outcome of further tests conducted by others (demonstrating its reproducibility and reliability). In fire/explosion investigations, it is very rarely possible to re-create an event to fully test the final hypothesis. (DEHAAN, ICOVE 2009)
7. Final hypothesis selection: When the working hypothesis is thoroughly consistent with evidence and research, it becomes a final hypothesis and can be authoritatively presented as a conclusion or opinion of the investigation.
Upon selection of a final hypothesis, the confidence of an expert opinion is often determined. Levels of confidence may also vary with the profession of the person preparing the report.
In forensic origin and cause determination, the investigator applies scientific knowledge to recreate the path of spread of the fire, trace it back to its origin, and there, establish the cause of the fire. Such opinions are often expressed “to a reasonable degree of scientific certainty.” When various hypotheses about the cause of the fire or explosion are tested, if only one hypothesis fits the available data and others are conclusively eliminated, the opinion can be expressed to a reasonable degree of scientific certainty (within the limitations of the available data). All scientific conclusions are subject to continual retesting or re-evaluation if new reliable data are presented.
If two (or more) hypotheses about the origin or cause of a fire or explosion exist and neither can be demonstrated to be false, the degree of certainty or confidence is reduced to “possible” or “suspected,” and the conclusion should be “undetermined.
1.3. STRUCTURAL FIRES INVESTIGATION
Fires in buildings are known as enclosure fires. The major effect on fire development in case of enclosure fire have room boundaries and vents. Enclosure fires can generally progress through four stages (MOWRER 2008), identified as:
The fire plume/ceiling jet stage
The enclosure smoke-filling stage.
The pre-flashover vented stage.
The post-flashover vented stage
1.3.1. Fire Patterns
In fire investigation, the place where a fire start is referred to as the "point of origin." This may be an exact point or a general area. In almost all cases, the point of origin must be correctlylocated to properly determine the fire cause. In the past, individuals often referred to cause and origin; the correct phrase and procedure is origin and cause. In general, fire will burn longer at or near the point of origin, thus the damage generally will be greater. Normally the fire cause will be found at, or very near, the point of origin, and physical evidence of the fire cause, whether accidental or incendiary, is often recovered. Once the point of origin is determined, it may confirm or contradict the statements of owners / occupants / witnesses / suspects. One of the most important aspects of any fire investigation is the proper recognition, identification, and analysis of fire patterns.
Fire patterns are the actual physical effects that can be seen or measured after a fire, including charring, oxidation, distortion, melting, colour changes, and structural collapse. Lines or areas of demarcation found on vertical and horizontal surfaces after a fire are the borders defining the different levels of heat and smoke as they affect various items at the fire scene. The production of these lines and areas is dependent upon a combination of variables: the material itself, the heat release rate, fire suppression activities, temperature of the heat source, ventilation, and the length of time of exposure. Surface effect is the result of the nature and material of the surface which contains the fire pattern, affecting the actual shape of the lines of demarcation displayed, or increasing or decreasing the amount of pyrolysis and combustion in different areas. (G
ET
AL 2015)
ORBETTThe penetration of horizontal surfaces (burn throughs) from above or below, can be the result of radiant heat, direct flame impingement, or smouldering in a localized area. Downward penetrations often are considered unusual, since the more natural direction of heat and fire spread is upward. However, once flashover has occurred, the hot fire gases may be forced downward through small pre-existing openings, such as for ductwork, resulting in a penetration. Downward penetrations also can result from the intense burning of polyurethane mattresses, couches, or chairs. Dropping of flaming or smouldering materials also can lead to floor penetrations. Any downward penetration should be examined carefully, and its cause determined. The burn direction of a penetration can be determined by an examination of the sides of the hole. Sides that are wider at the top of the hole, and slope inward, indicate that the fire came from above. On the other hand, sides that are wider at the bottom and slope upward toward the centre of the hole indicate that the fire came from below. Another method that can be used to determine whether a fire spread up or down through a hole is to compare the overall extent of damage to the two levels separated by the penetrated surface. If the fire moved upward, most often the damage to the underside of the
surface will be more severe. If the fire moved downward, then the opposite most likely will be true.
Loss of material and mass may occur when wood or other combustible materials burn. The remains ofthesematerials themselvescandisplaylinesofdemarcation,andultimatelyfirepatterns that can be analysed. Examples of this are the top of wall studs burned away at progressivelylower levels, which can be used to determine the direction of fire travel. Likewise, the extent of damage on opposite sides of a door opening can be used to determine the direction of fire travel.
Fire patterns fall into two general types, both of which are regulated by the chemistry and physics of fire, as well as by method of construction. Movement patterns are those which are the result of growth and extension of fire and products of combustion away from the original heat source. Proper inspection of the fire scene will result in tracing these patterns back to the original heat source. Intensity patterns are produced by the effects of the various intensities of heat exposureto thestructure andits contents. Thevaryingheat levels canproducelines ofdemarcation which can be used to determine the characteristics and quantities of fuel loading, as well as to indicate the direction of fire spread.
1.3.2. Introduction to the Enclosure Fire Dynamics
During the fire plume/ceiling jet stage, buoyant gases rise from a localized fire in a coherent plume. As the plume rises to the ceiling, fresh air is entrained into the plume. This air entrainment dilutes the smoke and decreases the plume temperature as it rises. Once the plume impinges on the ceiling, the buoyant gases movelaterallyacrossthe ceiling and aredeflected downfrom the ceiling and form a layer of smoke known as a ceiling jet. The ceiling jet spreads beneath the ceiling until it is confined by the walls of the enclosure. As the ceiling jet spreads beneath the ceiling, it loses heat to the ceiling, causing the temperature of the gases in the ceiling jet to decrease with radial distance from the fire plume. (ALMIRALL ET AL. 2017)
The duration of the fire plume/ceiling jet stage of fire depends primarily on the size of the enclosure. In residential scale rooms, this stage of a fire will typically last for only seconds; in large enclosures, such as “big box” stores or warehouses, this stage can last for tens of minutes.
The fire patterns generated during this stage of a fire can provide a clear indication of the location of a fire. Fires located near the walls of a room will leave distinguishable fire patterns associated with the fire plume on the walls and fires located anywhere else in a room will leave distinguishable fire patterns on the ceiling (NFPA 921).
Once the ceiling jet reaches the walls of the enclosure, the second stage begins. During this enclosure smoke-filling stage, the smoke layer that has formed beneath the ceiling continues to descend from the ceiling because of the smoke being injected into the hot gas layer via the fire
plume. The duration of the enclosure smoke-filling period depends on the size of the room and the presence of ventilation openings in the enclosure boundaries. In residential-scale rooms with open doors to adjacent spaces, the enclosure smoke-filling stage is insignificant because smoke begins to flow through such openings during the fire plume/ceiling jet phase. In verylarge spaces with no vents, the enclosure smoke-filling stage can last tens of minutes. (ALMIRALL ET AL 2017)
Fire patterns generated during the enclosure smoke-filling stage include evidence of smoke stainsonenclosurewalls.Thesestains canbeusedtodeterminehowfarthesmokelayerdescended within the fire enclosure. A fire in a small fully enclosed room may consume the available oxygen within the room and the fire maysuppress itself due to oxygen depletion within the room. Without the introduction of additional oxygen, such a fire may continue to burn at a reduced rate, or it may extinguish. The fire patterns generated during this stage will generally complement those generated during the fire plume/ceiling jet stage rather than obscure these previously generated patterns. (ALMIRALL ET AL
. 2017)The third stage of enclosure fire development, the pre-flashover vented stage, starts when smoke leaves the fire enclosure through ventilation pathways, which are typically open doors or windows. During this stage, a quasi-steady balance develops between the rate of air flow into the room, the rate of smoke flow into the smoke layer via the plume and the rate of smoke flow from theenclosure viathewall orceilingvents. Thesmokelayer equilibrateswhenthis balancebetween inflow and outflow occurs. Stains on enclosure walls are a distinguishing fire pattern for this stage of fire development (KARLSSON AND QUINTIERE 2000).
The fourth stage of enclosure fire development is the post-flashover vented stage. NFPA 921 defines flashoveras a“transition phase in the development of a compartment fire in which surfaces exposed to thermal radiation reach ignition temperature more or less simultaneously and fire spreads rapidly throughout the space, resulting in full room involvement or total involvement of the compartment or enclosed space.” NFPA 921 also suggests that flashover represents the transition from “a fire in a room” to “a room on fire.”
Flashover conditions have been characterized experimentally in room fire tests involving relatively small enclosures with floor areas in the order of 9.29 m2 and heights of approximately 2.44 to 3.05 m (POULSEN ET AL 2013). Flashover has been observed to occur when the smoke layer temperature reaches approximately 500 to 600 °C, which is associated with a heat flux at floor level of approximately 20 kW∙m-2. In comparison, intense direct sunlight produces a heat fluxofapproximately1kW∙m-2.Underthisimposedheatflux,exposedcombustiblesurfacesbegin to ignite almost simultaneously, which is why this transition is called flashover (NFPA 921).
Once flashover occurs, fully developed fire conditions ensue with smoke layer temperatures that can exceed 1,000 °C and heat fluxes at floor level that have been measured to be as high as 170 kW∙m-2. Flames can fill virtually the entire volume of the room (hence, the “room on fire” description) and extend through vents to other enclosures or up the building façade. The rate of heat release within the fire enclosure typically becomes “ventilation limited” once all the exposed combustible surfaces ignite, with the burning rate within the enclosure regulated by the airflow rate through vents into the enclosure. The airflow rate may not be sufficient to combust within the enclosure all the fuel being released from the surfaces (hence, the term ventilation limited), with the excess fuel vapours burning outside the enclosure where they encounter additional air (DRYSDALE 2016).
Although pyrolysis can continue throughout the compartment, flaming combustion will only occur where there is sufficient oxygen present. Depending on the momentum of the entraining air, flaming combustion may occur within the ventilation stream at various depths into the compartment.
The intense fire conditions that occur during fully developed fires can obscure fire patterns generated during the three previous stages of fire development. The level of this obscuration depends on the duration of the post-flashover burning. Of equal or even greater significance, postflashover fires can generate different types of ventilation-generated fire patterns that have been misinterpreted as being related to accelerated fires in the past. Figure 5 represents the postflashover stage.
Once a fullyinvolved fire becomes ventilation limited, the actual combustion zone can separate from the fuel surface(s) and move toward the ventilation openings, where the unburned fuel vapours mix with the incoming air and burn. This can result in more substantial damage patterns remote from the area of origin of a fire, which can lead to inaccurate origin and cause determinations (CARMAN 2009). To accurately determine the origin of a fully involved fire, a fire investigator needs to understand these processes. Therefore, enclosure fires that develop into fully involved fires require a higher level of expertise.
Fire patterns can provide important evidence, but fire investigators also need to consider other factors. As noted above, knowledge of fire dynamics is important if the fire investigator is to account for the spread of the fire. The observations of eyewitnesses can provide crucial data in finding the fire’s origin. Arc mapping, an examination of the damage to a structure’s electrical system, is another source of data (NFPA 921).
If the use of a liquid accelerant is suspected, samples are collected for laboratory analysis
Further,thereissummarizedthemostimportantknowledgetohelptodistinguishbetweenarson and accidental fires
The evidence left behind by fully involved accidental fires is often indistinguishable from evidence left by fully involved incendiary fires (PUTORTI 1997).
Modern furnishings, particularly upholstered furniture made with polyurethane or polyester fibrefill cushions, can burn so quickly as to cause a room to become fully engulfed in flames in less than five minutes.
The behaviour of fires under differing ventilation conditions, unless well understood, can lead to erroneous determinations of whether a fire is accidental or incendiary (CARMAN 2012). Theventilation (oxygen) availableto afireis largelyresponsibleforthe behaviour ofa ventilationlimited fire, including its temperature. In ventilation-limited fires, the amount and flow path of available oxygen determines how severely a fire will burn at a particular location. In ventilationlimited fires, fuel vapours move away from the fuel source and burn near ventilation openings where they mix with the incoming oxygen. This will cause ventilation-generated burn patterns, remote from the area of origin, that need to be considered during an investigation (CARMAN 2009).
Forpost-flashoverfires,itisgenerallymoredifficultforfireinvestigatorstocorrectlydetermine the area(s) of origin based only on interpreting fire patterns, and the level of difficulty increases the longer a fire burns in a fully involved condition.
1.3.3. Fire Debris Analysis
Forensic science laboratories that conduct fire debris analysis often focus on the analysis of ignitable liquid residues (ILRs). This process aims to identify any potential accelerant in a sample collected from a fire scene that is suspected of being deliberately set. While solids (paper) and gases may be used to accelerate a fire, ILR analysis is always restricted to liquids (typically mixtures of ignitable compounds) and their residues.
Laboratory scientists depend on the proper recognition of samples that may contain ILRs at the scene of a suspect fire, adequate packaging, secure transmittal, and an assured chain of custody. After the collection of the evidence, the laboratory process involves sample preparation (usually an extraction of the liquid-residue mixture), a separation technique (usually gas chromatography), and compound identification (typically mass spectrometry but other methods of compound identification maybe used, such as FTIR) followed by the interpretation of the data collected from the analysis (ALMIRALL ET AL. 2017).
The scientists must be fully aware of the advantages, limitations, and performance of the analyticalmethodsusedinfiredebrisanalysis,includingextraction(recovery)methods,separation science (chromatography), and compound detection/identification (usually, mass spectrometry).
Finally, the scientific discipline of fire debris analysis needs wholesale validation studies to determine the performance of the scientists within the field, in addition to the external proficiency tests that are already being performed. Proficiency tests are high-stakes evaluations of individuals and their laboratories in the determination of ILRs similar in nature to very routine casework and are, therefore, only a snapshot of performance of the field at a relatively low level of difficulty. A low-stakes evaluation of the field should be attempted. This should include the performance of the ASTM E1618:2014 method itself, which would provide a wider view of error rates for the field varying the level of difficulty of analysis and complexity of samples analysed. Anonymous interlaboratory trials would provide the scientists and their laboratory leadership with a better estimate of performance for a wider set of casework situations.
In Slovakia, the FIRE AND RESCUE SERVICE PRESIDENT'S INSTRUCTION NO. 32/2016 ON FIRE INVESTIGATION AND STATISTICAL MONITORING OF FIRES is a key document providing the description of methodology sampling the fire debris at the fire scene.
1.4. WILDFIRES INVESTIGATION
Wildfires occur in open land covered with grass, brush, or timber are often termed wildfires Although they are often terrifying in their destructive power and intimidating in their coverage, they begin, like almost everyother fire, with suitable fuel and a small, localized source of ignition. Uncontrolled wildfires of forest vegetation, grassland and agricultural cultures are a global phenomenon (WEISE, WRIGHT 2014; SCOTT ET AL. 2014), which can be related to the expected climatic and meteorological conditions. They represent a complex phenomenon involving many processes (e.g., the process of burning, releasing, and transferring energy) that occur in a wide range of spatial and temporal scales (ATTIWILL AND ADAMS 2013; TEDIM ET AL. 2018). The characteristics of the fuel particles and the fuel structure itself partly determine the amount of energy that will be released in the combustion process and describe the way in which the burning and heat transfer process itself takes place (WEISE, WRIGHT 2014; COUNTRYMAN, 1972) Knowledge of the relevant characteristics of fuel occurringin the wildland affecting fire behaviour is essential for informing and supporting the decision-making of relevant persons, also as an input for a wide range of applications designed to control fires as well as the development of preventive measures aimed at mitigating the occurrence of large fires (STEPHENS ET AL. 2014; GILL, STEPHENS, CARY 2013). These applications may be aimed at determining fire hazards and issuing fire warnings (DEEMING, BURGAN, COHEN 1977; HARRIS, MILLS, BROWN 2017; BROWN, DAVIS 1973), assessment of the risks of ignition in the wildland (AGER, VALLIANT, FINNEY 2010; MAJLINGOVÁ 2015), modelling the behaviour of fires occurring in different types of vegetation
(e.g. grasslands, forests, shrubs), planning of fire tactics procedures, calculation of emissions of fire-induced combustion products (WEISE AND WRIGHT 2014) and anticipation of the impacts of fire in several aspects (JOHNSON AND MIYANISHI 1995; REINHARDT,KEANE,BROWN 2001).
Wildfires can generally be classified in the category of fires occurring in the wildland and fires of forested areas (forest fires), grassland and other grassland fires (eels, gardens, etc.) and fires of agricultural areas and crops.
Abroad, these are supplemented by the category of peat fires, fires arising within the wildlandurban interface area, bushfires, etc.
These categories of fires differ, among other characteristics, in particular the type of fuel consumed during a fire. Fuel in this case is perceived as a general term used to describe the characteristics of vegetation, which relate mainly to fire behaviour and are essential for gaining control of the fire (ANDERSON 1974)
A fuel complex is a set of individual layers of fuel in space, e.g., tree canopies, undergrowth including shrubs and fuel contained in the ground layer (PYNE 1984). These layers are characterized by certain homogeneous properties. They are defined mainly by the specific characteristics of their particles. The different layers differ in vertical distance from the ground and the orientation of the fuel. Understanding the impact of this multi-layered fuel arrangement on fire behaviour requires the studyof the physical properties defining each fuel layer, its vertical and horizontal continuity. (C
RUZ ET AL 2018)The fuel that occurs in the wildland is stored in three stacked layers: underground fuel, surface fuel and crown fuel. Depending on which of the layers or components of the forest burns in the fire, we talk as follows about an underground, surface, or crown fire. These are generally three types of fire that we can encounter in the wildland.
Underground fuel consists mainly of decomposing vegetation - humus and soil wood, which form decomposing dead roots and stumps. This combustible material is located between the litter and the soil itself, which no longer contains sufficient organic material. This topmost layer of soil is also called raw overlying humus (duff). If a fire also spreads with this layer of fuel, it contributes to its more difficult manageability. Roots may be damaged, and trees die, even if the area has not been hit by a crown fire (PYNE, ANDREWS, LAVEN 1996).
Surface fuel represents all living and dead vegetation above the raw overlying humus, starting with the tree litter and ending with the canopies of small trees that do not interfere with the crown closure. Surface fuel is much more diverse than underground and crown fuel. It includes fallen leaves and needles, lichens, and mosses, fallen woody material as fallen trunks, branches and twigs, live and dead parts of herbs and grasses, shrubs, and small trees. Also, a surface/ground
fire spreads primarily through fine surface fuel (grass, needles, and small wood material smaller than 2.5 cm in diameter). A greater amount of fuel contributes to greater intensity and length of fire burning. The intensity of a surface fire is the most important indicator of the probability of whether a crown fire will also occur.
Crown fuel is made up of large trees and shrubs that reach the height of the treetop (PYNE, ANDREWS, LAVEN 1996). In a crown fire, the main source of energy are leaves, twigs, and small branches. In a very intense crown fire, a large part of the woody biomass of large branches burns. For the emergence of a crown fire, the intensity of surface fire, the height of the deposit of tree crowns and the humidity of leaves and branches are decisive. Crown biomass density (HARRINGTON 2005) is important for the spread of crown fire. Usually, a fire arises in a layer of surface fuel (PYNE, ANDREWS, LAVEN 1996) only subsequently can spread, and only if it is supported by enough fuel and favourable weather (ROTHERMEL 1972). The duration and intensity of the ground fire then decides whether a crown fire will also occur. The fire can also spread to undergroundfuel,whichislocateddirectlyinthesoil,thuspassingintoanundergroundfire(PYNE, ANDREWS, LAVEN 1996).
Due to its complexity and the key role of surface fuel which plays in a fire, it is of the utmost importance in research (PYNE, ANDREWS, LAVEN 1996) and great emphasis is also placed on the study of its fuel characteristics (SANDBERG, OTTMAR, CUSHON 2001). This type of fuel is present in all identified categories of fires occurring in the natural environment.
To estimate fire behaviour, it is essential to know several characteristics of the available fuel, which are characterized by significant variability of values in space. It includes moisture content, shape of fuel parts and their size, spatial distribution (both horizontally and vertically- mainly in relation to tree canopy) and its continuity.
To accurately determine the role of fuel in fire behaviour and to know the rate of fire spread and the heat total released, the specific parameters of fuel must be specified.
These parameters have been completed and formulated into fuel models (FM), which represent a set of fuel complex characteristics.
A description of the approaches to the creation of these files as well as the classification of the territoryof Slovakia into fuel models has alreadybeen published in previous publications (TUČEK, MAJLINGOVÁ 2007; MONOŠI,MAJLINGOVÁ,KAPUSNIAK 2015).
The behaviour of a fire generally depends on the way in which the fire is initiated, its development and subsequent spread. In the case of wildfires, this behaviour is influenced by how fuels (such as needles, leaves, twigs, grass, herbs), weather and topography interact.
As soon as a fire occurs, it will only develop if it has enough heat, air (oxygen) and fuel available. Together, these three elements are referred to as the “burning triangle”. By removing one or more elements of this triangle, the burning ceases.
Accurate wildfire origin and cause determination is an essential first step in a successful fire investigation. Proper investigative procedures which occur during initial attack can more accurately pinpoint fire causes and preserve valuable evidence that might be destroyed by suppression activities. If a fire is human caused, the protective measures described in the guide can preserve evidence that may lead to effective and fair administrative, civil, or criminal actions. The investigation should start at the time a fire is reported or discovered. First responders play an important role in protecting evidence (NWCG 2016)
In some respects, the investigation of a wildfire is simpler than that of a structure fire, because thefuels involvedaregenerallylimitedto naturallyoccurringvegetation. Theyareignitedbysome finite source of heat: natural, such as lightning; accidental, such as a discarded match; or incendiary, with an intentional ignition device. Someevidenceofthesource ofignition will remain unless, as in a fire started with a lighter, the source has been removed from the scene. The causes of wildfires are more varied than for structure fires. (D
EHAAN, ICOVE 2009)Unlike with structure fires, however, there are complications in retracing the progression of the fire by variable environmental conditions: fuels, wind, weather, and terrain. The large scale of many wildfires results in major firefighting efforts that can disturb or destroy delicate evidence. Because of the fire, an area of interest may remain inaccessible to the investigator for days, during which time the evidence is exposed to the elements, further diminishing its value. All fire investigations require thorough and systematic examination of the suspected area of origin and logical and analytical assessment of the evidence found. (D
EHAAN, ICOVE2009)
For the wildfire investigator is critical to understand the basic principles of fire behaviour. The ability to re-create the fire course, based on knowledge of these principles greatly assists the fire investigator in identifying and correctly interpreting fire pattern indicators and overall burn patterns. It is strongly recommended that a fire investigator take additional training in wildland fire behaviour to enhance his/her understanding of these principles. (NWCG 2016)
Severalbasicfuelparametershaveafundamentalinfluenceontheintensity,durationandspread of fire. These parameters include fuel composition, fuel quantity, spatial distribution of fuel and its moisture content.
Fuel (flammable materials located in the fire site) in wildfires is classified as wood, woody, or grassy/herbaceous vegetation. These materials are ignited at a variety of temperatures, depending on their moisture content, oil, and mineral content. The ease of ignition of these
materials depends on their size and nature, on the content of oils and minerals, on weather conditions, topographical conditions, and location. If vegetation is exposed to sunny weather for some time, flammable materials dry up and thus become easier to ignite and more easily spread fire. Conversely, in wet or rainy weather or in shady areas, these materials absorb moisture and thereforealongerexposuretimeortemperatureis neededto ignitethem.Topographical conditions affect not only the spread of fire due to physical laws, but also affect the lightness of ignition, the influence of wind, shadow and other factors that regulate the moisture content and temperature of these combustible materials. (NFPA 921)
As an example, a known cause of wildfires is the burning of carbon particles from the engine exhaust, but even in this case ignition depends on the level of relative humidityof air, the moisture content of the fuel/flammable material, as well as the size, density, arrangement, and temperature of the fuel.
In a forest or other wildfire, the spread of fire is affected by convection (flowing) and radiant heat. Convection heat allows the fire to spread from the lower grassy level upwards to the level of branches and crowns of trees. Then radiant heat gains the dominant influence as the primary way of heat transfer as the fire spreads sideways. Radiant heat is the dominant way of transferring heat in combustible materials at lower levels, which are formed by shrubs and grass on flat surfaces.
To reliably analyse the behaviour of a fire, it is needed to closely monitor changes in the inflamed material.
In the wildland, there is a great diversity in combustible materials. There is deep forest humus, newly fallen dead leaves, grass canes, fallen dry twigs and branches, tree trunks, low shrubs, tree branches, hanging mosses, tree stumps and other types of materials. Each of these materials has a different fire property. The flammability of a particular combustible fuels is influenced by the fire properties of these materials and the combined influences of the different types of materials presented.
Before the fire properties can be analysed, a classification of the physical characteristics of combustible materials present in the wild land must be classified. Such classification makes it possible to identify factors of combustible material that affect the flammability itself. Once combustible material has been properlyclassified, topographical and weather conditions must first be considered before the fire spread rate and general fire behaviour of that fuel type can be determined.
As flammable material in forests is so diverse and complex, it is necessary to develop a systematic approach to the analysis of its flammability. Firstly, the flammable materials are
divided into two groups, namely terrestrial flammable materials (at ground level) and aerial combustible materials. Then each of these classes is evaluated according to the arrangement, compactness, continuity, volume, and moisture content of the fuel. Also, the location affects the flammability of fuels: slopes sloping to the southwest are heated more than slopes with northeast inclinations. This procedure can be handled quickly and easily by practitioners
Terrestrial flammable materials include fuel that lies on or immediately above the ground or is in the ground. The main materials include humus, peat-containing soil, tree roots, dead leaves, fallen needles, grass, laborious wood, rolled tree trunks, stumps, large branches/twigs, low shrubs, and young tree shoots.
Humus rarely has a more significant effect on the rate of fire spread, since it is usually moist and heavily compressed, so little of its surface is freely exposed to the air, and its burning rate is low. In wildfires, most hummus burns up to the rock bedrock. Occasionally, humus contributes to the rate of fire spread by paving the way for a fire so that it can spread between places with more flammable material.
Roots are not an important factor in the rate of spread of fire, since the significantly limited access of air prevents them from burning faster. However, fires can spread slowly through the roots – in fact, some fires got out of hand because the roots have provided a way for the fire to get beyond the control line. The hottest roots are large lateral shoots from dead trunks lying on the ground.
As the leaves and needles litter, gradually it also becomes part of the layer of humus. However, before this change occurs, leaves and needles are highly flammable materials and should be assessed separately when assessing terrestrial combustible material. In many forests, surface fuel consists mainly of needles felled from trees. For example, pine needles are extremely flammable, since its length and shape create a free arrangement, allowing free circulation of air. Shorter needles (e.g., fir needles) usually burn less intensely because they are connected more compactly on the ground.
Needles, which are still clinging to the dead branch, are extremely flammable because they are freely exposed to air and is usually not in direct contact with a much moister material on the ground. Needles remaining on fallen branches create highly flammable material to burn stronger pieces of wood. For this reason, residues after felling conifers, containing dry needles, are a dangerous fuel.
Grass, herbs, and weeds are an important ground fuel that affects the rate of spread of fire. A key factor for these fuels is their degree of drying. Juicy green grass acts as a fire barrier. However, during the normal fire season, it gradually dries and becomes more flammable as it
ripens (blooms and brings seeds), or as straws and leaves die because of loss of moisture. Currently, the grassy surface is easily incendiary. If the dried grass is located on a large and homogeneous space, it becomes the hottest ground fuel, with the fastest spread of fire. Firefighters need to determine the volume and link between grassland. In dense forests, where little sunlight falls on the ground, there is very little grass. In more open forests, such as a forest with adult pine trees, there can be a lot of it. If there is a continuous cover of dry grass on forest land, the rate of spread of the fire will be managed by this grass cover much more than the heavier fuels normally found in forests. Dry grass fires often have a high rate of spread.
Dead wood consists of twigs, smaller branches, bark and rotting wood material. Normally, the classification of fine dead wood is limited to material with a diameter of less than 50,8 mm. This fine dead wood fuel is one of the most important materials among those that affect the rate of fire spread and the general behaviour of fire in the forested area. The dusty wood is easy to ignite and often provides the main route for transferring fire from one area to another. It is a material for burning larger, heavier pieces of wood.
In areas where there is a large volume of fine dusty wood, extremely high heat can quickly develop in a fire. Most of the dead wood is usually found in areas where logging waste occurs. Under drought conditions, fires in these areas behave very turbulently, strong convection currents generated by intense heat create burning carbons that fire forward and create additional fire outbreaks in front of the main front of the fire.
The parts of dusty wood, although they do not represent a particularly serious factor in the rate of spread of fire, are a highlyflammable fuel. Flyingcarbons from the main fire often cause further fire outbreaks in the dusty wood that lies on the surface or in the cavities of old trunks or stumps. Heavy combustible materials such as lying tree trunks, stumps and large branches need long periods of hot and dry weather to become easily incendiary. However, when such material dries, very high intensity fires can occur. The most dangerous heavy flammable materials in forests include those that contain dry wood, coarse bark, or many cracks. Material with a smooth surface is less incendiary because it dries more slowly, little of its surface is exposed to air access and less material capable of burning the thicker pieces.
Fires producing extremely radiant heat can arise in piles of overgrown trunks and large branches, or across layered fallen trees uprooted by the wind, where different fuel components can radiate heat to each other. Separately lying branches and trunks will not burn so intensely unless an increased accumulation of dusty wood contributes to the development of the fire.
Low shrubs, tree seedlings and young trees are included in the group of ground (surface) combustible materials because they are very closely related to the combustible material in the
forest bedrock. This vegetation of the lower rod can either accelerate or slow down the rate of the spread ofthe fire. Atthebeginningofthe fireseason,thesituation is such thattheshadowprovided by this vegetation prevents the rapid drying of combustible materials underneath. However, as the season progresses with fire-friendly conditions, a continuous higher air temperature and lower relative air humidity cause both the lower bedrock and this low vegetation to dry out. When this situation occurs, most of the low vegetation, especially small conifers, becomes a fire-carrying factor.
Low scrub vegetation in forests often provides a link between ground combustible materials and"airy"combustiblematerials(intreecanopies).Thecrownsofsmalltreescanigniteandspread the fire to "airy" combustible materials in the upper floor, which consists of the crowns of adult trees. The first means for a fire on the lower surface to burn out and spread to the crowns of trees can be a thicket of young woody vegetation or dead bushes.
A specific group are aerial combustible materials. This includes all green and dead materials, which are in the upper floor, represented by the crowns of trees. The main components of aerial combustible materials are tree branches, crowns, trunks, moss, and high bushes (shrubs)
Even live tree needles are very easily an incendiary fuel. The arrangement of needles on the twig allows for free airflow. In addition, the upper branches of trees are more freely exposed to wind and sun, compared to flammable materials at the level of the soil cover. These factors, plus volatile oils, and resins in the needles of trees, cause branches and tree canopies to be important components of aerial combustible materials.
Tree branches and crowns are combustible materials that can quickly flare up if relative humidity changes. Fires in the canopy of trees are rare if relative humidity is high. However, needles dry out quickly when exposed to hot, dry air. The dryness of the needle is influenced by the process of breathing (evaporation) of the tree. When the soil is moist, the tree draws a large amount of moisture into the air through the leaves. When the earth dries, the evaporation process slows down, and as a result, the leaves and branches are drier and more flammable.
Dead branches on trees are an important air fuel. The concentration of dead branches, as we find in places attacked by insects or fungi, can cause the spread of fire from tree to tree. The concentration of dead branches at the bottom of tree trunks can provide an additional possibilityfor the spread of fires from the level of the floor to the canopy of trees. The hottest dead branches are those on which needles are still held.
Dead tree trunks are one of the most important aerial combustible materials that influence fire behaviour. Although in most forests the number of living green trees is much higher than dying, fires start in dead trunks because they are drier and much easier to ignite. Dead trunks can have
very different properties and thus have an impact on fire behaviour. Smooth solid trunks, which have a verythin bark and onlya few notches or cracks, are not very flammable. On the other hand, strains with a ruptured upper part, a rough pulped bark or partially decayed trunks burn easily and have a very large effect on the spread of fire. Burning carbons that fly away from trunks with a rough and cracked crust can spread fire extremely well through the emergence of new outbreaks. In areas where there are many large dead trunks, a fire can spread from one trunk to another due to intense heat radiation.
Mosshangingfromtrees ismostsusceptibletoignitionfromallaircombustiblematerials.Moss is important mainly because it provides a way for the spread of fire from terrestrial combustible materials to aerial flammable materials or from one component of aerial combustible materials to another airborne component. Like other light fuels, moss reacts quickly to changes in relative humidity. In dry weather, tree crown fires can quickly develop in places with a dense presence of tree moss/lichens.
Crowns of high shrubs are classified as aerial combustible materials because they are separated by a certain distance from ground combustible materials. In manyforested areas, dense shrublands (bushes) can arise in places that have previously been burned down, often forming the main vegetationcoverin theseareas.Crownfiresin shrublandsusuallyoccuronlyiftherearesignificant ground flammable materials at soil level to generate the required heat. However, in some shrub locations, a high ratio of dead shoots may produce a sufficient volume of fine dead air fuel to produce a very hot and rapidly spreading fire in the crown. The key factors in assessing the behaviour of fires in high shrublands are the volume of fuel, its arrangement, the general condition of ground combustible materials and the presence of dead or dried and dusty aerial flammable materials.
Themainfactors to be assessedin determiningthelikelyareaoffireand whichaffect thespread of fires include wind speed and direction. These factors are directly related to the resulting rate of fire spread. This is easiest to spot as we proceed backwards from the position of the front of the fire, from the sides and from the back.
When wildfires are bounded by landscape formations such as ravines, troughs or narrow valleys, convectional heating of bounded gases and re-radiation from flames and burning vegetation increases the rate of heat release from burning fuels. These factors can result in faster burning and spreading than would be the case with a vegetation fire that would not be limited by anything.
Winds greatly affect the speed at which a fire can spread. The wind fan effect pushes the flame forward and thus preheats yet unburned flammable materials. Winds also help dry vegetation and
thus increase the ease of ignition. The wind also promotes the formation of airborne butts that rise in convection currents of heated air. Accompanying winds in a fire can unleash carbons and hot sparks in front of the main fire area and ignite secondary fires in areas with unburned combustible materials. Three different types of winds that affect fire behaviour are classified as meteorological, daytime and fire winds
Daytime winds arise due to sunny warming and night cooling. As the air heats up during the day, rising air creates ascending winds up the slope. When the air cools down after sunset, this denser, heavier air drops downwards, causing winds heading down the slope.
The fire wind is caused by the fire itself. This wind arises because of rising streams of combustion gases pulling in the surrounding air. Winds of this type affect the spread of fire.
The moisture content present in the fuel plays an important role in determining the ignition and rate of spread of fire. As vegetation (fuel) dries, it becomes increasingly incendiary and will burn with greater intensity. Green (live) vegetation or vegetation with a high moisture content is much more difficult to ignite and will burn much slower precisely because of its moisture content, which absorbs heat during evaporation. When the humidity is gone, the temperature will rise to the ignition temperature of the fuel. The moisture content of the fuel varies and depends on the type and condition of vegetation, its exposure to the sun, the weather and geographical location.
The oil content of vegetation also plays a role in how easily the fuel becomes inflamed, the intensity with which it burns.
The fuel can be divided into three different categories: underground, surface (overground) and crown. Underground fuels are found between the earth's surface and mineral soil. These include decomposing substances, peat, humus, and roots. Underground fuels, such as roots or wood under a layer of soil, can burn along their entire length underground and break out in a place other than a surface fire. Surface fuels include grass, leaves, twigs, needles, field crops, shrubs and fallen branches. Any vegetation up to a height of 2 m can be considered a surface fuel. Crown fuel on treetops is separated from surface fuel. This includes combustible materials at a height higher than 2 m. It is, e.g., hanging moss and lichens, branches of different sizes and thicknesses, leaves, needles, and treetops.
The basic factors for the spread of fires include the distribution or density of fuel coverage. Distributed fuels may be too distant from each other to preheat adjacent fuels to their ignition temperature during a fire. Conversely, if the fuels are in proximity, this can increase the intensity of the fire, prolong the length of the flames, and accelerate the spread of fire.
Topography refers to the form of the earth's surface, whether natural or reshaped by man. Topographical conditions affect the intensity and spread of fire. The topographical conditions of the territory are also heavily influenced by the winds.
One of the factors of topography, which has a significant impact on the spread of fire, is the slope of the slope. The terrain slope of a certain area is characterized by elevation change over a certain distance and is often expressed as the upper third, the middle third and the lower third. The slope allows the fuel on the side of the sloping upwards to be preheated more quickly than it would be on the plane. This can cause the fire to burn more intensely and faster. Wind currents, which mostly head upwards during the day, can alarmingly accelerate the spread of fire upwards. On the slope, it can also occur that burning fallen tree trunks and carbons swing down the hill and ignite new outbreaks of fire and near of the primary outbreak and around the control lines (the perimeter of the fire area).
Another factor of topographyto consider is the orientation of the slope towards the Sun (terrain aspect). In the case of a slope, this is the direction in which the slope is considered. This is an important aspect due to the heating by the sun's rays (or the absence of heating) to which fuel and the terrain are exposed, and which affects the incendiary potential and the rate of fire spread. Slopes facing the sun's side are usually drier and may have more flammable fuel or vegetation of a more flammable type than slopes that do not fall sunlight, resulting in easier ignition and faster fire spread. Areas with rare rainfall and poor soil may have poorer vegetation that does not encourage the spread of fires until there are extremely strong winds.
The behaviour of wildfires in nature is most affected by the weather. Weather conditions can be described as the state of the atmosphere regarding atmospheric stability, temperature, relative humidity, wind speed, cloud cover and precipitation.
When investigating the fires, it is important to consider the development of weather changes. It's a description of the weather conditions of the previous days to weeks. Weather conditions should be analysed and determined what effects they may have had on the ignition of the fire and the characteristics of the fire.
The ambient air temperature directlyaffects the fuel temperature. One of the factors that affects temperature is the sun. When glowing solar energy warms the earth's surface and vegetation, flammable materials become more susceptible to ignition. Temperature differences of up to 10 ºC could be possible between shaded spaces and spaces directly illuminated by the sun. Lower air pressure at higher altitudes allows the air to expand and cool down here.
The relative humidity of the air is the ratio of the amount of humidity in the air to the amount that a known volume of air can contain, expressed as a percentage. Air humidity directly affects
the moisture content in the fuel and in reverse. Dry air pulls moisture out of vegetation, making it more susceptible to ignition. Fine fuels are more sensitive to relative humidity than large fuels. If the air has high relative humidity, the vegetation sucks some of this moisture and becomes a little more resistant to ignition, or moisture can slow down the rate of fire spread. Warm air can hold more water than cooler air. This is what we see in the morning fog. As the night air cools down, it loses its ability to retain moisture. Humidity condenses at the dew point of the air and creates fog.
The burning period indicates the duration of the fire since its occurrence. In the context of wildland fires, a24-hburningtimeis usuallyconsidered.This is because, undernormal conditions, the territory is subject to at least a 24-h cycle of wind conditions, exposure to sunlight, relative humidity, and changes in fuel moisture content. When a fire burns and spreads across the territory, there are changes in fuel parameters, as well as changes in topography and weather conditions.
Thetotaltimeelapsedbetweentheoccurrenceofafireanditsdisposalis generallyanindication of the interaction of fuel, weather, and topography factors. If the development of the fire indicates that it will be a long-lasting fire (several days, or up to weeks), it can be assumed that the requirements for the forces and means necessary to carry out the localisation and disposal work on the fire site will also increase, especially when fuel parameters and field conditions indicate that the fire will continue to spread on several fronts.
Fires occurring in the wildland area are complex phenomena caused by a combination of land management, human activity, cultural traditions, and climatic and weather conditions.
Although it may seem that due to the relatively low number of fires and the total area of fireaffected territory in Slovakia, the issue of fire prevention occurring and in the wildland is not one of the key themes of our society, this is not the case. Unfortunately, the future will convince it. In circles of both professional and lay public, it is often discussed that the main cause of the increased frequency of wildland fires for the future, is the ongoing climate change and its impacts. However, the latest findings of experts (BOWMAN ET AL. 2017) confirm that the risk of wildland fireswillincreasedespitetheeffectsofclimatechange.Severalfactorscontributetotheirincreased occurrence, such as moisture content of fine fuel, which occurs on the ground, but also material of larger sizes, such as pieces of wood. A sufficiently moist surface of the material may reduce the potential for the spread of fire and affect its ignition in a positive direction. Meteorological factors, such as wind speeds, are also important because they can affect the speed at which a fire could spread after it is ignited. (ATTIWILL, ADAMS 2013) However, a critical factor mainly related to extreme weather (prolonged drought) is the moisture content of coarse woody fuels and other
organic substances on the ground. And this will be the biggest problem, especially during periods of prolonged drought.
The publication of MAJLINGOVÁ, DRITOMSKÝ, KAPUSNIAK (2018) deals with the analysis of tactical fire-fighting procedures in the wildland areas of the Slovak Republic, the knowledge of which is also an important information for fire investigation purposes.
2. ADVANCED TESTING METHODS IN FIRE INVESTIGATION
Because of the difficulty and complexity of a complete and accurate fire investigation, and preconceptions, there is a special need for every investigator to develop a comprehensive analytical approach to the task. This analytical approach recognizes that to be a successful fire investigator, a person must understand and master numerous facets of fires, fuels, people, and investigative procedures. The fire investigator must really understand how a fire burns, what factors control its behaviour, and that all fires do not necessarily behave in a precisely predictable fashion.
Fire modelling can be in the form of bench-scale (miniature) physical models into which are introduced dyed liquids, smoke, or hot gases to re-create the flow of smoke and heat or in the form of mathematical analyses. However, the use of physical scale models is rare.
To improve the analysis of a fire’s origin and cause, tests should be run in both reduced and full scale, using multiple compartments and multiple openings, fully documenting the aftermath; with the burning of different materials under a range of realistic fire conditions; and by lighting fires in identically constructed compartments. These tests should be scientifically instrumented so that information, such as temperature at various layers of the room and radiant heat fluxes are measured. A major consideration in deciding to conduct this research is the high cost of burning compartment test rooms. However, by using reduced scale testing, the cost can be lowered and may provide the same critical values related to heat as a full-scale test. (A
LMIRALL ET AL 2017)When a physical fire test is conducted, the fire scenario being tested should also be simulated with a deterministic fire model to evaluate the accuracy of the model and to better understand uncertainties associated with the model. Based on the data obtained through such comparisons, the computer-based deterministic fire models can be continually refined to produce more accurate results, and over time may find an expanded role as a useful tool in actual investigations.
(ALMIRALL ET AL. 2017)2.1. ADVANCED LABORATORY FIRE TESTS
The basic group of fire properties for the purpose of fire investigation represent the fire initiation characteristics, as these allow the assessment of whether a certain material could have been ignited by an initiation source. The basic fire initiation characteristics include the ignition temperature, the flash point, the flash point temperature, the flash point of the flammable gases and vapours of flammable liquids and the minimum flash point of the dusts.
From the point of view of fire investigation, a significant trace of a fire, on the basis of which it is possible to determine the direction of fire spread, is mainly the depth of charring, especially wood, but also other materials with a tendencyto form a solid char. Traces indicating the direction of the fire allow, on the one hand, the reconstruction of the course of the fire, on the other hand, it is possible to verify the place of origin of the fire on the basis of them. (BALOG, KAČÍKOVÁ,
MARTINKA 2015)
According to NFPA 921: 2014, in the practical application of the charring rate and the charring depth of wood, it is necessary to enter the relative charred depth (compare the charred depth in several places) and not from the charring depth itself (charring rate). The reason is the fact that the correlation of the charring rate of 2.54 cm in 45 min can be only applied to a fire controlled by ventilation. Under real fire conditions, the charring rate of wood can vary from 1 cm to 25.4 cm per hour (depending on the intensity of the fire). Therefore, the depth of charring cannot be used as the sole indicator of the duration of the fire (NFPA 921: 2014). The rate of charring of wood is variable and depends on several factors.
Among the most important are (NFPA 921: 2014):
rate and duration of heating,
effect of ventilation,
surface area to weight ratio,
direction, orientation, and size of the core in the wood,
wood species,
wood density,
wood moisture content,
surface coating properties,
oxygen concentration in hot gases,
gas flow rate,
influence of gaps, cracks, joints, and edges.
The charringdepth analysis is more reliable for assessing the spread of fire than for determining the specific time or intensity of burning of materials. The relative depth of charring between the various points is crucial for determining the areas with the greatest damage due to exposure, ventilation, or fuel location. The fire investigator can then deduce the direction of the spread of the fire with decreasing charring depth from the heat source (NFPA 921: 2014).
In the following sub-chapters, we introduce new advanced non-standard methods to determine the depth of charring of wood, based on mathematical (Case study 1) and computer-aided modelling (Case study 2). Case study 3 is focused on determination of fire ignition potential
of forest litter and setting the moisture of extinction(%) to be used as an input value for calculation and classification of forest fire danger index.
2.1.1. Wood Thermal Degradation Study – Case study 1
Currently, many standardized and non-standardized test methods are used in the fire testing of materials and building structures. Standardized test methods are used primarily for the purpose of demonstrating compliance with the requirements imposed on the material or product by applicable legal regulations. Non-standardized test methods are used primarily in the field of science and research, but also in the field of fire investigation (e.g., reconstruction of fires at a laboratoryscale).However,it shouldberememberedthatarelativelylargenumberofstandardized test methods were originally created in research laboratories as non-standardized. Only over time, when the results of scientific research proved that, based on the results of these tests, it is possible to make areliableestimation ofthe behaviour ofthematerial at acertain stage of fire development, these methods were specified in technical standards (MARTINKA, BALOG 2014).
According to the individual stages of fire development, the methods of testing materials can be divided into tests of initiation characteristics (flash point temperature, critical density of heat flow, tendency of the material to self-ignition), tests of the rate of flame propagation, tests of the heat release rate, tests aimed at assessing the tendency of the material to spread fire in the flashover phase, fire resistance tests of structures and tests focused on the toxicity of combustion products and the optical density of smoke.
Thestudydeals with theissueofthermaldegradationofsprucewood,namelythedetermination of mass loss, burning rate and the thickness of the charred layer with changing heat flow (thermal loading), through laboratory (small-scale) tests.
Experiment
The size of samples used in the work was of 40 x 50 x 50 mm. Samples were air conditioned to a moisture content of 10 ± 0.15%. We subjected the samples to a thermal loading with two heat flux values, i.e., 15 and 30 kW∙m-2. In the study, we repeated the test for each heat flux ten times. We carried out the measurement using a measuring apparatus, which is maintained at the Industrial Property Office of the Slovak Republic under UTILITY MODEL NO 9373. It is designed to measure the rate of burning and the rate of charringof polymers. It is composed of from ceramic infrared lamp, precision digital scale, initiating flame source, regulating device, device for measuring temperature using thermocouples and fume hood
The ceramic infrared heater was heated for at least 30 min, to stabilize the heat flow to a specified value of 15, 20, 25 and 30 kW m-2. To know the standard temperature values and the
course of temperatures under the infrared lamp, at the respective heat flows of 15, 20, 25 and 30 kW∙m-2, it was necessary to determine them by measurement. The lowest temperature values (100 ±2 °C) were measured at a heat flux of 15 kW∙m-2, at a heat flux of 20 kW∙m-2 temperatures of 120 ±2 °C were measured. At a heat flux of 25 kW∙m-2, temperature values of 135 ±2 °C were measured. Temperature of 160 ±2 °C were measured at a heat flux of 30 kW∙m-2C.
The Data logger ALMEMO® 710 was used to measure the course of temperatures in the test bodies and on their surface. Using thermocouples, we measured the temperature in samples. The temperature measuring device and the scales were connected to a computer, and values were recorded every 10 s. The temperature in the sample was measured by the thermocouples, inserted into the pre-drilled holes. The holes were 10 mm apart (depth).
RADWAG PS 3500.R2 precision scales, metrologically verified, were used to measure the weight of the samples. The weight (mass) of the sample during the experiments was recorded at an interval of 5 s.
The test apparatus was placed in a laboratory fume hood, where the flue gas extraction was set to a rate of 24 l·s-1 (as with measurements on a conical calorimeter).
We measured the thickness of the charring manually. Before testing, we measured the thickness of the samples at 9 different locations using a sliding gauge. Then, after thermal loading and subsequent cooling, wecleanedthesample, scraped offthecharredlayer,and measuredthesample again in the same 9 places.
Before loading the samples with a ceramic infrared lamp, their density and moisture content was determined. We calculate the density of the tested wood samples according to the equation (1), which gives the ratio between the mass/weight and volume of the wood at a specified moisture content.
Where:
w – wooddensityat aspecifiedmoisturecontent(kg·m-3),
mw
woodmassata specifiedmoisturecontent (kg),
Vw – woodvolumeataspecifiedmoisturecontent (m-3).
The moisture content of the test wood samples was calculated according to the equation (2), which gives the ratio between the mass/weight of wet and the mass of dry wood (the wood mass after dryingat atemperatureof 103± 2 °C). In the firetests, there wereused thedrywood samples.
Where:
w – woodmoisturecontent (%)
mw
woodmassat aspecifiedmoisturecontent (kg), m0 – woodmassinthedrystate(kg).
With the thermal loading method used, there was tracked and recorded the mass loss every 5 s. The mass loss in specified time intervals was then calculated from it according to equation (3).
Where:
δ(τ) – masslossovertime(τ)(%), m(τ0) – originalmassofthesample(g), m(τ) – massofthesampleovertime(τ)(g), ∆m – differenceinmasses (g).
To determine the rate of combustion in the time interval (5 s) we are monitoring, the rate of combustion was calculated according to the equation (4):
Where:
ʋ – rate of burning (%·s-1),
δ(τ) – masslossovertime(τ)(%),
δ(τ + Δ) – mass lossovertime(τ+ Δ)(%), Δ
time interval in which masses (s) are recorded.
Results and Discussion
In the following section, there are shown the courses of mass loss, calculated according to the equation (3) depending on the heat flux loading of 15, 20, 25 and 30 kW∙m-2
In Figure 1, there are shown the courses of mass loss under a sample thermal loading with various heat fluxes.
When loading the samples with a heat flux of 15 kW∙m-2, the lowest mass loss of 44.88 % was recorded at the end of the loading (after 1,920 s). When increasing the heat loading to a heat flux of 20 kW∙m-2, higher mass loss of 51.66 % was recorded. At a heat flux of 25 kW∙m-2, the mass loss of 65.06 % was recorded. And, at the highest loading, i.e., at heat flux of 30 kW∙m-2 , the highest mass loss of 76.64 % was recorded at the end of the thermal loading (after1,920 s).
Rate of burning
In the following section, the rate of burning courses, calculated according to equations (4) are presented, considering the heat flux loadings of 15, 20, 25 and 30 kW∙m-2 .
The rate of burningof the spruce wood samples is calculated from the mass loss and is therefore only comparable in the time interval from 600 s to 1,920 s
Figure 2 shows the average rate of burning in of samples under thermal loading with various heat fluxes.
Figure 2 Rate of burning of samples under various thermal loadings
The course of the average mass loss when the samples were loaded with a ceramic infrared heater producing a heat flux of 15 kW∙m-2 showed that the initiation phase, averaged over each series of measurements under thermal loading, ranged in time from 225 to 296 s. The highest value of burning rate of 0.29 %∙s-1 was achieved at 265 s.
When samples thermally loaded with heat flux of 20 kW∙m-2 , the initiation phase, averaged over each series of measurements under thermal loading, ranged in time from 43 to 54 s. The highest value of burning rate was of 0.25 % s-1, achieved at 55 s.
At heat flux of 25 kW∙m-2, the initiation phase, for the average of each series of measurements under thermal loading, ranged in time from 17 to 27 s. The highest value of burning rate of 0.38 %∙s-1 was achieved at 50 s.
At heat flux of 30 kW∙m-2, the initiation phase, for the average of each series of measurements under thermal loading, ranged in time from 9 to 14 s. The highest value of burning rate of 0.54 %∙s-1 was achieved at 50 s.
It is important to note that with increasing heat flux, shorter times to reach the maximum rate of burning were recorded, indicating a faster and more intense development of combustion in the first minutes of testing.
As reported by ZACHAR (2009), who found the variabilityof burning rate values in burning rate course, when thermally loaded the spruce wood samples varying the distance of the test sample from the source (30, 35, 40, 45 and 50 mm), which is comparable to results of this study using the heat fluxes of 15, 20, 25 and 30 kW m-2 for samples thermal loading. At 30 mm from the source, he found the maximum burning rate of 0.098 %∙s-1 recorded in 480 s, and at 35 mm, the maximum burning rate was of 0.065 % s-1 recorded in 75 s. At 40 mm from the source, the burning rate was of 0.079 % s-1 recorded in 45 s. At 45 mm, the burning rate was of 0.069 % s -recorded in 270 s and at 50 mm from the source, the maximum burning rate of 0.058 %∙s-1 was recorded in 240 s.
The burning rate of spruce wood samples was also addressed in the work of CHREBET et al. (2011), who found significantly lower values of burning rates that ranged from 0.005 to 0.007 % s-1. The reason for the lower values was due to the initial phase of the samples burning compared to this study, where the initiation of the samples occurred as early as in 26 s at sample position of 30 mm far from the source.
When comparing burning rates according to the work of Zachar et al. (2012), the highest burning rate value of 0.099 %·s-1 was reached almost at the last phase of the fire test (480 s) at a spruce sample distance 30 mm from the source. On the contrary, the lowest maximum rate of burning (0.058 %·s-1)was observed for the samples at 50 mm from the source. At 35 mm from the source, the burning rate reached value of 0.065 % s-1 at 75 s. A higher burning rate was achieved at 45 mm from the source, where it reached 0.069 % s-1 at 270 s. The shortest time (45 s) to reach the maximum burning rate of 0.079 %·s-1 was achieved at 40 mm from the source. From the above, a significant effect of the thermal loading source distance on the thermal degradation process can be concluded.
KAČÍKOVÁ AND MAKOVICKÁ (2009) found that, compared to other coniferous species, the lowest averagerateof burningwas foundforspruce wood,whereavalueof0.090 %·s-1 was found. The maximum rate of burning value was of 0.187 %·s-1 at 180 s from the beginning of thermal loading.
Similar claims are also supported by results of this study. Depending on the heat flux values of 15, 20, 25 and 30 kW∙m-2, the time to reach the maximum burning rate varied significantly. The
higher the heat flux value, the shorter the interval to reach the maximum rate of burning of spruce wood samples.
Temperature course recorded inside the test samples
Based on the recorded temperatures in the samples, the theoretical assumption of spruce wood thermal degradation, without the need for manual measurement of charred layer thickness can be established. As stated in NFPA 921:2017, the rate of wood charring depends on the volume of wood and a large number of variables (wood properties) and fire conditions, and to determine the burning time and intensityof the fire, EN 1995-1-2 (EUROCODE 5) can be applied, which states that the char line of wood charred layer is considered to be the point where the temperature has reached 300 °C. Reaching a temperature of 300 °C in the test samples (at the depth of 10, 20, 30 and 40 mm) was also crucial for this study to determine the depth of charring.
The following figures (Figure 3 to Figure 6) show the course of average temperatures recorded bythe thermocouples (T1, T2, T3 and T4) when the samples were thermallyloaded with a ceramic infrared radiator with a heat flux of 15, 20, 25 and 30 kW∙m-2 .
Figure 3 shows the average temperature profile on the T1 thermocouples (situated at a depth of 10 mm) when the samples were thermally loaded with a ceramic infrared heater with a heat flux of 15, 20, 25 and 30 kW∙m-2
Ascan be seen fromFigure3, at the thermocouple T1at aheat flux of15 kW∙m-2 ,themaximum temperatures ranged from 355 °C at 600 s to 516.9 °C at 1,920 s. At a heat flux of 20 kW∙m-2 , the maximum temperatures ranged from 434 8 °C at 600 s up to 517 7 °C at 1,920 s. At a heat flux of 25 kW∙m-2 , the maximum temperatures ranged from 516.7 °C at 600 s up to 566.7 ° C at 600 s to
1,920 s. At a heat flux of 30 kW∙m-2 , the maximum temperatures ranged from 553.7 °C at 600 s up to 578.3 °C at 1,920 s.
In Figure 4, there is shown the average temperature course recorded by the thermocouples T2 (at a depth of 20 mm), when the samples were thermally loaded with a ceramic infrared heater with a heat flux of 15, 20, 25 and 30 kW.∙m-2 . Figure 4 Average temperature courses recorded by thermocouple T2 (in depth of 20 mm) during thermal loading of the samples with a heat flux of 15, 20, 25 and 30 kW∙m-2
As seen in Figure 40, at the thermocouple T2 at a heat flux of 15 kW m-2 , the maximum temperatures ranged from 136.5 ° C at 600 s up to 360.9 ° C at 1,920 s. At a heat flux of 20 kW∙m-2 , the maximum temperatures ranged from 210 8 ° C at 600 s up to 440 6 °C at 1,920 s. At a heat flux of 25 kW∙m-2 , the maximum temperatures ranged from 246 9 ° C at 600 s up to 510 8 ° C at 1,920 s. At a heat flux of 30 kW∙m-2 , the maximum temperatures ranged from 302 5 ° C at 600 s up to 529 8 °C at 1,920 s.
In Figure 5, there is shown the average temperature course on the T3 thermocouples (at a depth of 30 mm), when the samples were thermally loaded with a ceramic infrared heater with a heat flux of 15, 20, 25 and 30 kW∙m-2
As seen in Figure 5, at the thermocouple T3 at a heat flux of 15 kW∙m-2 , the maximum temperatures ranged from 75.1 °C at 600 s up to 169.9 °C at 1,920 s. At a heat flux of 20 kW∙m-2 , the maximum temperatures ranged from 102.3 °C at 600 s up to 241.3 °C at 1,920 s. At a heat flux of 25 kW∙m-2 , the maximum temperatures ranged from 127.8 °C at 600 s up to 382.4 °C at 1,920 s. At a heat flux of 30 kW∙m-2 , the maximum temperatures ranged from 157.5 °C at 600 s up to 450.9 °C at 1,920 s.
In Figure 6, there is shown the average temperature course recorded by the thermocouple T4 (at a depth of 40 mm), when the samples were thermally loaded with a ceramic infrared heater with a heat flux of 15, 20, 25 and 30 kW m-2 .
As seen in Figure 6, at the thermocouple T4 at a heat flux of 15 kW∙m-2 , the maximum temperatures ranged from 8 °C at 600 s up to 99.2 °C at 1,920 s. At heat flux of 20 kW
m-2 , the
maximum temperatures ranged from 69 °C at 600 s up to 123.3 °C at 1,920 s. At heat flux of 25 kW∙m-2 , the maximum temperatures ranged from 83,7 °C at 600 s up to 198,9 °C 1,920 s. At heat flux of 30 kW∙m-2 , the maximum temperatures ranged from 100.6 °C at 600 s up to 250.5 °C at 1,920 s.
Determination of the samples charring rate
Based on the temperature courses recorded at individual depths (10, 20, 30 and 40 mm) inside the wood test samples thermally loaded with the ceramic infrared heater, the depth and rate of charring was determined in this study.
The rate of charring is one of the most important fire properties of wood and wood products. It is one of the input data for the calculation of the fire resistance of timber structures according to EN 1995-1-2 (EUROCODE 5). In addition, the charring rate of wood is also an important parameter for fire investigation, as specified in NFPA 921: 2017.
The technical standard (EUROCODE 5) is the most reliable for analysing the depth of charring layer when assessing the fire spread. For the determination of burning time and fire intensity (STN EN 1995-1-2: 2004), it defines the charring layer depth as the distance between the outer face of the surface of the material and the position of the line between the charred layer and the rest of the cross-section. That standard considers the charring line of timber structures as the point where the temperature has reached 300 °C.
FONSECA AND BARREIRA (2009) measured the charred layer at five different points using "K" type thermocouples and the MGCPlus data acquisition system. They measured the temperature at different positions, i.e., 1, 2, 3, 5 and 25 cm far from the surface exposed to thermal loading. They concluded that the interface between thermally degraded and non-degraded wood is the boundary plane between the black and brown layers of the wood which is characterized by a temperature of 300 °C.
WHITE AND NORDHEIM (1992) reported that the charred layer corresponds to a temperature of 288 °C. The studies of FINDORÁKET AL.(2016) and CHEN ETAL.(2016) reported that rapid thermal decomposition of wood (in case of short-term exposure) starts already at temperatures just below 300 °C.
For this reason, the study was oriented on the determination of the charring rate of spruce wood samples bydetermining the course of temperatures in each layer under the wood surface thermally loaded with a ceramic infrared heater.
Determination of the rate of charring was determined by measuring the time to reach the limiting temperature of 300 °C (Table 1).
Table 1 The depth and charring rate of the test samples
Average temperature of 300 °C, recorded by thermocouple T1 at heat flux of 15 kW∙m-2 , was reached in 505 s, corresponding to a charring thickness of 10 mm below the thermally loaded surface. On the thermocouple T2 a temperature of 300 °C was reached in 1,195 s, corresponding to a charred layer thickness of 20 mm below the thermally loaded surface. On the other thermocouples (T3 and T4) at a heat flux of 15 kW∙m-2, the temperature of 300 °C was not reached within 1,920 s (end of thermal loading of the samples) since the depth of charred layer could not be determined.
On thermocouple T1 at a heat flux of 20 kW∙m-2 , a temperature of 300 °C was reached in 391 s, corresponding to a charred layer thickness of 10 mm below the thermally loaded wood surface. On the thermocouple T2 a temperature of 300 °C was reached in 811 s, corresponding to a charred layer thickness of 20 mm below the thermally loaded wood surface. On the other thermocouples (T3 and T4) at a load of 20 kW∙m-2 , the temperature of 300 °C was not reached within 1,920 s (end of thermal loading of the samples) since the depth of charred layer could not be determined.
On thermocouple T1 at a load of 25 kW∙m-2 , a temperature of 300 °C was reached in 298 s, corresponding to a charred layer thickness of 10 mm below the thermally loaded surface. On the thermocouple T2 a temperature of 300 °C was reached in 726 s, corresponding to a charred layer thickness of 20 mm below the thermally loaded surface. On the thermocouple T3 a temperature of 300 °C was reached in 1,364 s, corresponding to a charred layer thickness of 30 mm below the thermally loaded surface. On the thermocouple T4 at a heat flux of 25 kW∙m-2 , the temperature of 300 °C was not reached within 1,920 s (end of thermal loading of the samples) since the depth of charred layer could not be determined.
On thermocouple T1 at a heat flux of 30 kW∙m-2 , a temperature of 300 °C was reached in 314 s, corresponding to a charred layer thickness of 10 mm below the thermally loaded surface. On the second thermocouple (T2) a temperature of 300 °C was reached in 596 s, corresponding to
a charring thickness of 20 mm below the thermally loaded surface. On the thermocouple T3 a temperature of 300 °C was reached in 977 s, corresponding to a charring thickness of 30 mm below the thermally loaded surface. On the fourth thermocouple (T4) at a load of 30 kW∙m-2 , the temperature of 300 °C was not reached within 1,920 s (end of thermal loading of the samples), due to which the depth of charring could not be determined.
FONSECA AND BARREIRA (2011) determined the depth of charred layer by an experimental method. They subjected the test samples to thermal loading using an "electro-ceramic resistance" system with a thermal capacity of 70 kVA, with an adjustable temperature range from 20 °C to 1,200 °C. During the experiment, the temperature was monitored at five positions on the test specimen (10, 20, 30, 50 and 250 mm far from the exposed side). The authors divided each sample into charred, pyrolysis and intact wood zones and came to the following conclusions:
At 10 mm from the exposed side, a charred layer was formed after 33 min and is characterized by a temperature of 700-800 °C (until the end of the test).
At 20 mm from the exposed side, a charred layer was formed after 42 min, and the temperature at this point was of 400-600 °C after 60 min.
At 30 mm from the exposed side, there was no charred layer, the temperature was below 300 °C.
At 250 mm from the exposed side, there was thermally undegraded wood, the temperature at this point was of 16 ° C after 60 min.
These results correspond to the values recorded on thermocouples T1, T2 and T3 in this study, with the difference that the charring temperatures were reached sooner
The depth of the charred layer was also investigated by MARTINKA ET AL. (2018), using the samples of Norway spruce and Scots pine with dimensions of 100 x 100 x 50 mm. Those were subjected to the experiment. The thermal loading of the test specimens was carried out using a cone calorimeter for 10, 20 and 30 min. After a predetermined time, interval of thermal loading, the test specimen was extinguished and placed in a container of water. The test specimens were dried and then cut in the middle of the charring line. The authors obtained the depth of charring as the difference between the original cross-sectional width and the residual cross-sectional width. The authors arrived at the following results for the spruce wood test specimen (results after 30 min):
At a heat flux of 20 kW∙m-2 , the depth of charring was of 22 mm.
At a heat flux of 30 kW∙m-2 , the depth of charring was of 28 mm.
At a heat flux of 40 kW∙m-2 , the depth of charring was of 33 mm.
At a heat flux of 50 kW∙m-2 , the depth of charring was of 36 mm.
Comparing the results of study published by MARTINKA ET AL.(2018) and results of this study, the wood species, the time of test samples thermal loading and partly the heat flux (20 and 30 kW∙m-2) were identical. In this study, at a heat flux of 20 kW∙m-2, charring depth of 20 ± 5 mm after 30 min was detected, and at a heat flux of 30 kW∙m-2 the depth of the charred layer was of 30 ± 5 mm. The differences in the results obtained may have been due to the different values of heat flux, the dimensions of the test samples and methodologies applied.
The thickness of the charred layer was also addressed in the work of ŠPILÁK ET AL (2018), where theytested spruce wood with different geometric cross-sections (square, circular and square profile with truncated edges). They thermally stressed the test specimens for 30 min, using a 50.5 kW m-2 radiation panel, corresponding to a temperature of 935 °C. The total emissivity was set to 0.9.
Based on the results of the medium-scale fire tests,ŠPILÁK ET AL.(2018) reported that the depth of charring varied depending on the cross-sectional shape of the sample, i.e., wooden beam For the square cross-section it varied on average from 7 - 9 mm, for the cross-section with truncated edges it varied on average from 8.5 - 10 mm, and for the round cross-section the average depth of charring was from 15 - 19.5 mm. They also reported that the depth of charring of the square and rounded cross-sections found experimentally agrees with the calculated depth of charring dchar,0 = 12 mm according to EN 1995-1-2.
Conclusions
Charred wood is found after every structural fire on a wooden vessel and will provide the investigator with valuable information concerning the origin and spread of the fire.
The heat produced during a fire result in the decomposition of various surfaces. The extent and degree of the discoloration and charring that result from this decomposition are compared to other areas to find the areas of heaviest damage.
In fire investigation the depth of charred layer can be used as a reliable means of establishing fire spread. By measuring the relative charred layer depth and extent of charring, it is possible to determine what portions of a material or construction have been exposed longest to a heat source. The relative depth of charred layer from point to point is the key to appropriate use of chancing, i.e., locating the places where damage was more severe due to exposure, ventilation, or fuel placement.
When comparing the extent of charring, it also is important to consider the type of materials involved. For example, a room in which wood panelling is the interior finish, maybe more heavily charred than an adjoining room in which the interior is gypsum board, even though the fire may have originated in the gypsum board room.
When comparing the depth of charred layer, it also is critical to consider the effects of ventilation. Wood can exhibit a deeper charring when adjacent to a ventilation source or an opening where hot gases can escape. For example, the portion of a room adjacent to an open door can be more heavily charred than a point of origin across the room, if the fire ventilated through the door opening.
Charred layer depth measurements should be made in the centre of char blisters.
When fuel gases or oxygen is the initial fuel source for a fire, the fire will generally produce relatively even char patterns over the often-wide area that they cover. Deeper charring may exist in proximity to the point of gas leakage. This type of charring may be highly localized because of the pressurized gas jets that can exist at the leakage point.
Fire investigators should not claim that indicators such as large, shiny blisters or dull or coloured char are indications of accelerant, based on the appearance of the char alone.
The depth of charred layer can also be used to estimate the duration of a fire. The charring of wood varies depending on such things as rate and duration of heating; ventilation effects; surface area to mass ratio; direction, orientation, and size of wood grain; species of wood; moisture content; and nature of surface coating.
2.1.2. Forest Litter Flammability Study – Case study 2
In Slovak forests, there is predominantly surface fire well-known disturbance factor. Ignitability/flammability and behaviour of surface fire varies mostly in dependence on fine fuel (i.e., litter, duff, grasses, and herbs) species, density, and moisture content. This fact was also stated in VIEGAS ET AL. 2001; SCHWILK AND CAPRIO (2011); and VARNER ET AL. (2015). Just fine fuel is strongly dependent on precipitations and respond to any precipitations by very rapid moisture content increase. On the other hand, this leads to decrease in fire potential. The ignitability / flammability of forest fuel, considering different moisture content, finding of forest fuel critical moisture content value (moisture of extinction), was an objective of several studies. DIMITRAKOPOULOS AND PAPAIOANNOU (2001) measured the time to ignition of dominant Mediterranean forest fuels. Based on this data, relative flammability classification was developed, and fuels moisture of extinction was determined. The study on effect of fuel drying temperature on fuel moisture content provided MATTHEWS (2010). To aim of the study was to determine the differences between oven-dry mass dead grass, pine and eucalyptus fuels dried at temperature of 60 and 105 °C. The differences were set at 3.5 %. The recommendation was to dry the fuel at temperature of 105 °C.
A specific group of fine living fuel is represented by forest litter. Forest litter should be described as a fresh, undecomposed, and by species and type easily recognizable plant debris. It is
composed of leaves, cones, needles, twigs, bark, seeds/nuts, logs, or reproductive organs. Components with a size of more than 2 cm on diameter are referred to as coarse litter. Smaller ones are referred to as fine litter or just litter. (F
LANNIGAN ET AL. 2016)The moisture content of litter is dependent on climate conditions and actual weather situation (VIEGAS ET AL 2001). Climate changes results in fuel moisture content changes having further impact onfireseason length andseverity(ROSSA 2017).Thesensitivityoffuel moistureto weather changes, mostly temperature and precipitation and exploring the implications under a future climate is demonstrated in increase of sensitivity to temperature that leads to the drier fuels and a higher frequency of extreme fire weather days (FLANNIGAN ET AL. 2016).
Experiment
The aim of the case study, experiments provided, was to determine the critical moisture values of oak litter affecting the initiation and subsequent propagation of forest fire. It was necessary to find moisture content values at which ignition still occurs when the most common sources of initiation are used. In the experiments, there were used the ignition sources which are most often occurring in the fire statistics kept by the Fire Research Institute of the Ministry of the Interior of the Slovak Republic. The experiments were performed under laboratory conditions, in the laboratories of the Technical University in Zvolen.
The ignitability testing of the litter consisted of the following parts: sampling (fuel) in the field, adjusting the samples to the required moisture content, performing a fuel ignition experiments, recording and processing data.
On 23.07.2019, sampling of the oak (Quercus sessilis) litter took place as part of a field survey from research plots established in oak stand (365a) (Figure 7) located in the territory of the University Forestry Enterprise which is situated in the Central part of Slovakia (Figure 8). Basic characteristics of the stands were as follows: tree species composition – Quercus sessilis (100 %), stand age was 110 years, stand area was 5.59 ha, stem density was 0.8, aspect was north, slope was 30 %, altitude was 320-380 m above sea level.
Figure 8 Position of the University Forest Enterprise Laboratory pre-treatment phase was aimed at adjusting the samples to the required moisture content. The litter sample was dried to a dry state in the Memmert dryoven at a temperature in the rangeof103-105°C.Thedriedmaterialwasplacedinapolyethylenebagandweighed.Theweight of the sample in the drystate was determined. Subsequently, accordingto equation (5), the amount of water to be added to achieve the desired moisture content of the sample was calculated. The desired moisture content of the sample was achieved by sprinkling it in the form of a fine mist to achieve uniform wetting of the sample (e.g., the sample dried in an oven to 100 g was moistened to 120 g to reach the desired moisture content value of 20 %). Prior to the experiment, the moistened sample was homogenized in a polyethylene bag by mixing it and
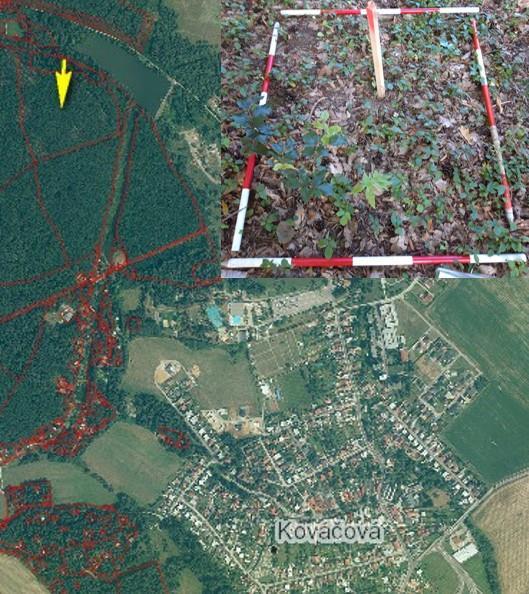
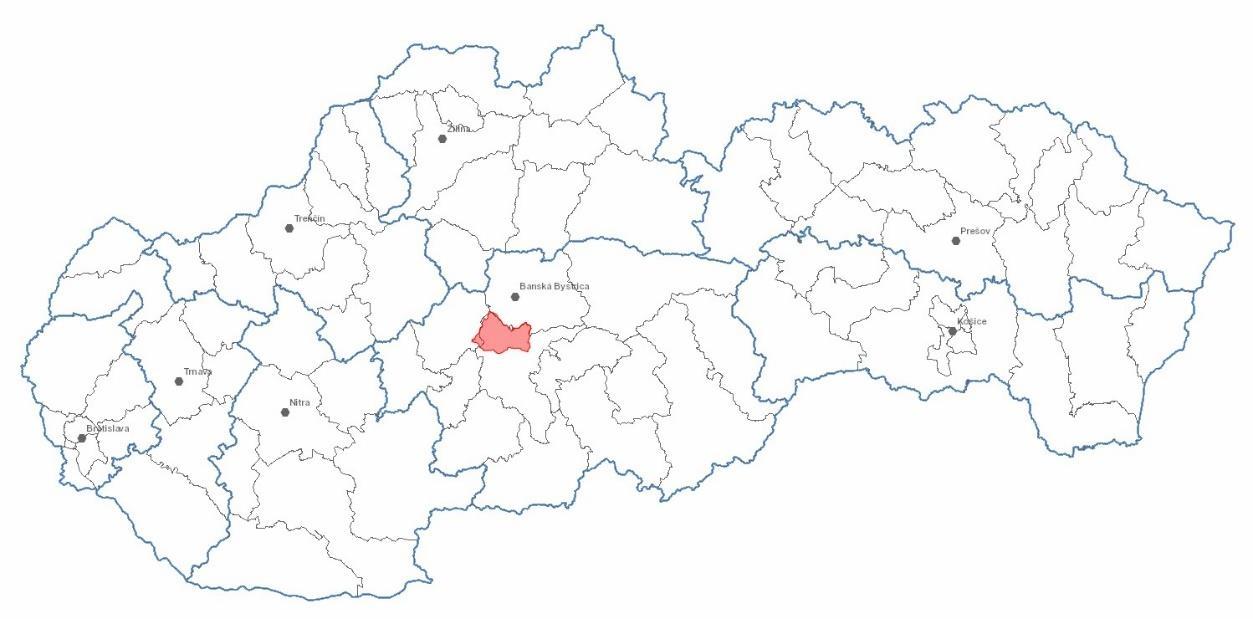
allowed to stand in a closed bag for 24-48 h to allow complete absorption of water. The fuel in the bag was also mixed continuously to achieve a uniform moisture content.
To calculate the sample moisture content, the following equation was used (5): Where:
w – absolute fuel moisture content (%),
wm – mass of wet fuel (g),
ws – mass of dry fuel (g).
The experiments were performed in a laboratory digestor using reconstructed bedding of tested litter with uniform moisture content and mass. All samples were arranged in such a structure as to reflect their natural occurrence with approximately the same proportion of each fuel type.
The aluminium dish used for the experiments was circular in shape with a diameter of 20 cm and a depth of 3 cm. This size was chosen because of its suitability for observing not only the ignition of a fire, but also the propagation. The dish was filled with the litter evenly to the brim, the weight of the dish with the sample being in the range of 40 g ± 0.2 g. The dish was then placed in a laboratory digestor with a slight suction set. To check the real moisture content of the sample, 30 gof sample was taken from each bag and the moisture content was verified back by gravimetric method.
The fire was initiated by 3 initiators. Figure 9 shows the types of fire initiators used.
As the first initiator, a kitchen pull-out lighter was used, which initiated the burning of litter for a period of max. 30 s. Then, an oak wooden cube with dimensions of 2.4 x 1.8 x 1 cm was used. An electric spiral cooker was used for heating-up the wooden cube. After gentle heating, it was ignited by the lighter flame to initiate the flame burning. Finally, Winston Classic cigarette butts 5.4 cm long (with filter) and 3 cm (without filter) with a diameter of 0.8 cm were used. The cigarette was lit and when it had a length of 3 cm (without filter), its tip was placed at a depth of 1 cm inside the fuel at an angle of 45°.
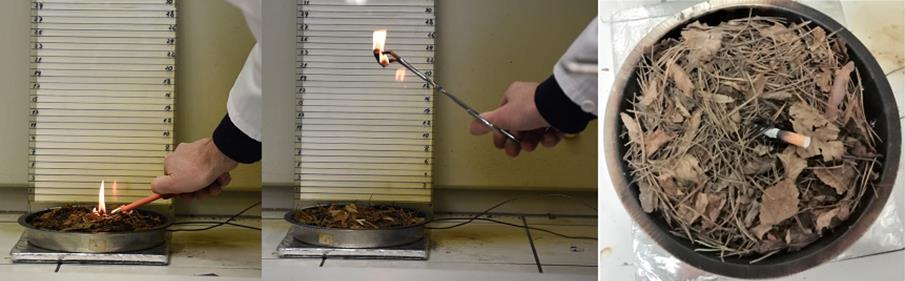
To perform airflow experiments, a SilverCrest Ship 2000 A1 home Profi hair dryer with a constant temperature and constant airflow rate was used as the wind flow source. The temperature was set to 37 – 39 °C to simulate warm summer air. Required wind speed was set by changing the distance, or by increasing the air flow speed. The Laserliner AirflowTest-Master anemometer was used to measure wind speed. This also served to record ambient temperature and relative air humidity.
To evaluate the capability of the initiators to ignite the test sample and allow the propagation of fire, a classification scale was created, namely: level 0 - the initiator goes out by the wind; stage 1 - burning of the initiator only; stage 2 - burning only around the initiator; level 3 - burnt area at least 15 %; level 4 - burnt area at least 30 %; level 5 - burnt area at least 45 %; level 6 - burnt area at least 60 %; level 7 - burnt area at least 75 %; level 8 - burnt area at least 90 %; level 9 - the burnt area represents 100 % of the area of the test dish. The classification scale used was created for the purposes of this study, resulted from the course of individual experiments, and was used to express and describe the course of combustion when different individual sources of ignition are used.
Based on the findings of experiments carried out in the initial research phase, the following values of fuel moisture content and wind speed were determined for the determination of the limit value of forest fuel moisture content for initiation and subsequent propagation of fire, for which laboratory tests were performed (Table 2).
Table 2
Values of fuel moisture, wind speed and fire initiator for each type of litter used in the implementation of laboratory tests
All experiments for each type of fuel, fuel moisture content, initiator and wind speed were repeated 3 times for period of 10 min. The average value of these repeated measurements was used to calculate the analysed parameters. If the result of the experiment was significantly different from this average, the experiment was repeated.
Ambient temperature, relative air humidity and fuel temperature were also recorded during laboratorytests.The airtemperaturewas in therange of 18°C – 23°C andtherelativeairhumidity in the range of 28.5 %
43 %.
Results and Discussion
Forpredictingthefirepotentialandfirefrequencyisnecessarytounderstandtheclimatechange effects, especially at regional and local scales. Fire occurrence is strongly dependent on weather conditions which have direct effect on fuel moisture. This parameter is critical in predicting the ignitability of fuel. Regarding this, the most important information is the information on fuel moisture content critical value.
Here are presented the results of determining the critical values of oak litter (fuel) moisture content,atwhichignitionandthesubsequentpropagationoffireoccurs.Atotalof235experiments were performed at different wind speeds and fuel moisture contents.
Figure 10 shows the course of the fire initiation and propagation process (expressed in degrees) as a function of fuel moisture content and wind speed using a lighter flame as an initiation source. It is clear from Figure 4 that a fuel with a moisture content of 20 % - 21 % could not be ignited by the lighter flame for 30 s at any of the simulated wind flow rates. By fuel with a moisture content of 14 % - 15 %, no fire was initiated at any of the simulated wind flow rates (1, 3, 4, 5, 6). In the absence of wind, the fuel was ignited and further propagated, resulting in an average burned area of up to 30 %. At a wind flow rate of 2.5 m∙s-1 (stage 2), only 15 % of the area burned down. Furthermore, at a wind flow rate of 9.5 m∙s-1 (stage 5) and higher, it was not possible to ignite due to the going out of the lighter flame or the early flaming out of the flame immediately after the lighter was removed and the air flow was allowed to access the fuel bed. Based on the results of experiments, it can be stated that the moisture content of the fuel at which a fire is propagated into the surroundings is in the range of 10 % – 11 % at an average wind speed of 6.5 m∙s-1 (stage 4). At lower wind speeds, the fire was unable to spread further.
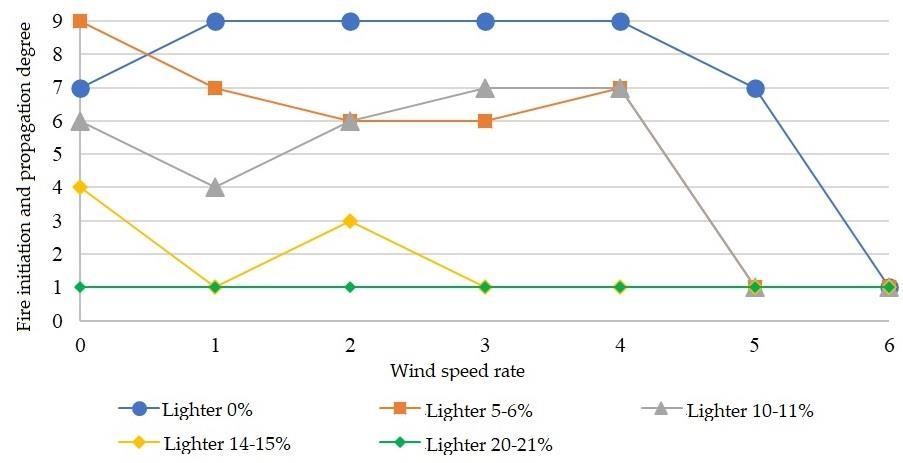
Figure 11 shows the course of the fire initiation and propagation process (expressed in degrees) as a function of fuel moisture content and wind flow rate using a flame burning cube as the initiation source. At fuel moisture content of 20 % - 21 %, only the cube burned. Any propagation and spread of the fire from this source did not occur. As the wind flow rate increased, only the fuel around the source of initiation place burned. At fuel moisture contents of 10 % and 15 %, with increasing wind flow rate, the proportion of burned area increased up to 75 %. At an average wind flow rate of 9.5 m s-1 (stage 5), the cube went out due to laminar airflow, before it could initiate the fuel, unless the fuel has been in a dry state.
Figure 11 The course of the fire initiation and propagation process (expressed in degrees) as a function of fuel moisture content and wind speed – flame burning wooden cube
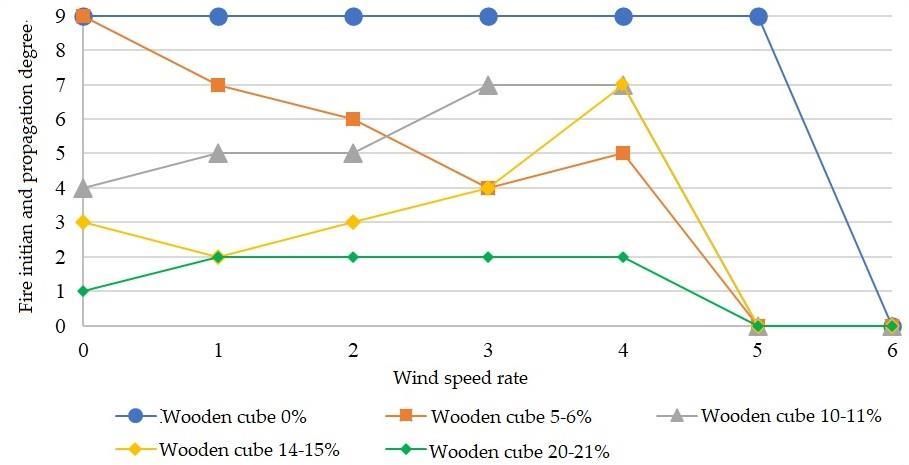
In the case of smouldering cigarette butt-end used as the initiator, the fuel did not ignite even in totally dry state. After about 324 s, the smouldering part of the cigarette reached the filter and then went out.
CURT ET AL (2013) performed similar experiments in which they lit Kermes oak (Quercus coccifera) leaves with a kitchen match in the absence of wind. The results showed that out of a total of 39 experiments, 23 experiments were initiated. At a moisture content of 1 % - 2 %, the leaves were lit 15 times, at a moisture content of 2 - 2.5 %, 4 times. No ignition occurred at fuel moisture content above 2.5 %. They performed a similar experiment with a cigarette butt, which was placed at a depth of 1 cm inside the fuel at an angle of 45°. Just in 20 experiments with completely dry fuel, it did not lead to ignition, even though the initial fuel temperature was 30-35 °C.
The experiment with cigarette butt and leaves of Mongolian oak (Quercus mongolica) was performed by SUN ET AL. In this case, they simulated throwing a cigarette butt from a height of
1.5 m to the specific point on the fuel bed. Experiment results showed that the moisture content of the fuel, the wind speed and their interaction had a significant effect on the probability of ignition. The probabilityof ignition was zero when the wind flow rate was of 0 m/s and 6 m/s. At wind flow rate ranging from 1 to 5 m∙s-1, the probability of ignition decreased with increasing fuel moisture content, and the relationship between fuel moisture content and wind flow rate changed from exponential to linear, and then back to exponential. The maximum moisture content of the leaves at which the leaves can be ignited was set at 15 %.
SATOH ET AL found the maximum moisture value of oak leaves that could be lit by cigarette butts at 14 %. The probability of fuel ignition increased to 50 % when the cigarette butts were inserted inside the fuel.
The differences in results dealing with ignition of fuels by cigarette butts can be explained by the components affecting the burning of cigarettes, which have changed compared to the past. Atpresent,itisnotpossibletoswitchfromcigarettesmoulderingtoflamecombustion,whatmakes it impossible to ignite the surrounding fuel, even the totally dry hays.
Considering the different tree species composition of the Central European forests producing varying fuel loads, there is need to provide more studies focusing on impact of climate change on forest floor fuel moisture content and its ignition potential, which is directly connected with actual fire danger rate. This necessity has already been pointed out in BAIDOC AND CORNWELL (2016)
The floor fuel moisture is strongly dependent on relative air humidity and soil drought. With soil and vegetation (fuel) drought is the hydroclimate directly linked. It is a non-stationary variable, varying as at local and regional as at global scale. Hydroclimate is dependent on five principal components: evaporation, transpiration, condensation, precipitation, and runoff. All of them describes the water cycle in the forest and has very strong impact on vegetation moisture content. According to scenarios of climate change for the future. Some authors (LIU ET AL. (2010); ALDERSLEY ET AL. 2011) doubt on the precipitation effect on increasing moisture content of forest litter when there are long periods characterized with high temperatures and drought. This effect shows high level of uncertainty to the future. It is a dangerous situation for forests and forest management. Considering the scenario, that the precipitation will not be capable of increase the moisture content of forest fuel, especially fine forest fuel, high enough above the critical moisture content value (moisture of extinction), then there is extreme high danger of intensive and severe forest fires even crown fires in the Central European region.
Conclusion
The implementation of fire research related to studying litter or herbal fuel needs more experiments to be provided and database of fuel parameters to be built to allow wildfire modelling in the practice of fire investigation, namely in the Slovak Republic.
2.2.MEDIUM SCALE FIRE TESTS
In this study, the temperature course, depth of the charred layer (mm), charring rate, and fire resistance were investigated through the implementation of medium-scale fire test of wooden beams (prisms and logs) made from Norway spruce wood. Results of medium and large-scale fire tests are important input data for mathematical and computer aided modelling and development of computer fire models to study the fire behaviour of various materials and constructions.
Experiment
The wooden beams, used in fire tests, were made of Norway spruce (Picea abies L.) wood. To study the process of thermal degradation and determine the depth of charred layer and wood charring rate for fire resistance assessment, the medium-scale fire tests were provided.
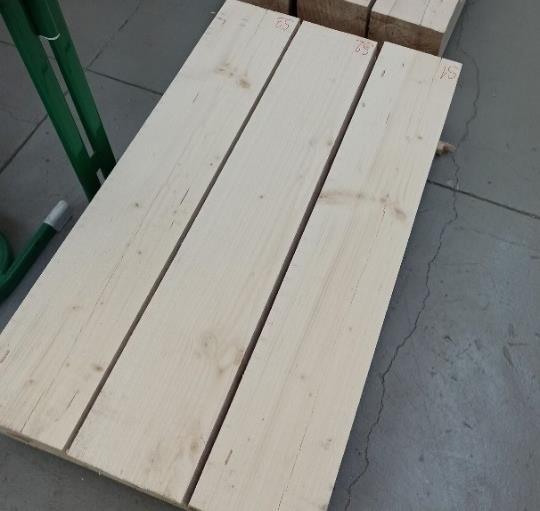
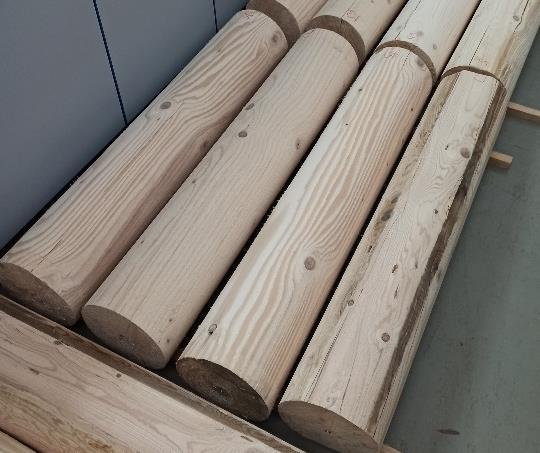
The test samples (3 prisms and 3 logs) were used (Figure 12). Those samples were of square and circle cross-section (prism and logs). The length of all samples was of 1,000 mm. The dimensions of the square cross-section were of 200 x 200 mm ± 1 mm.
Figure 12 Samples for medium-scale fire tests
The test samples were dried in an air-conditioned room to a moisture content of 11 % ± 1 % beforetesting.Nosurfacetreatmentwasappliedtothetestsamples.Allthesamplesweresubjected to medium-scale fire tests carried out in the laboratory chamber. Each test sample was placed on two aerated concrete blocks so that the thermally loaded area of the test sample was at a height level with the central axis of the radiation panel (Figure 13).
Figure 13 Position of the test sample in relation to the radiant panel position
The distance of the test sample from the radiation panel was of 100 mm for the prism and 78 mm for the log. The size of the radiation area was of 480 x 280 mm. The energy source of the ceramic radiation panel was propane-butane gas with a constant flow (15 m3∙h-1), while the temperature measured on the surface of the radiation panel during the fire test was in the range 599 to 624 °C (measured by thermal imaging camera Fluke RSE600).
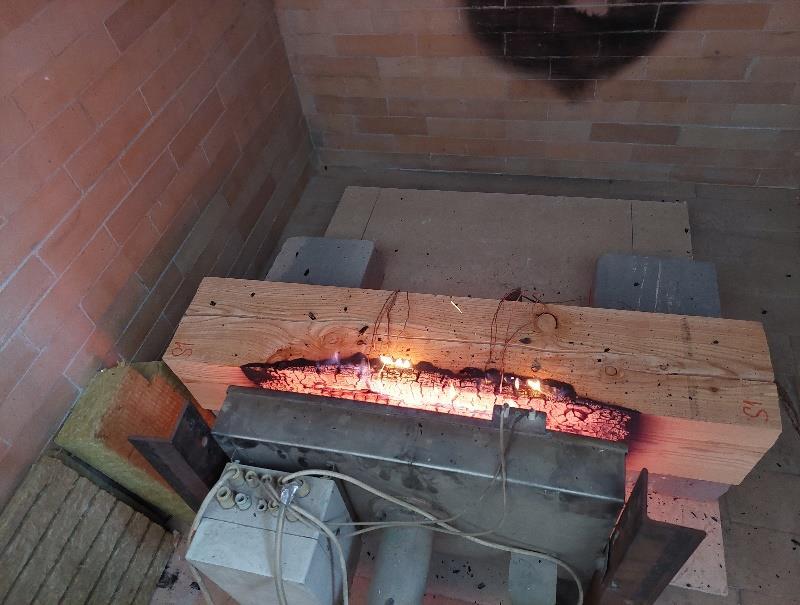
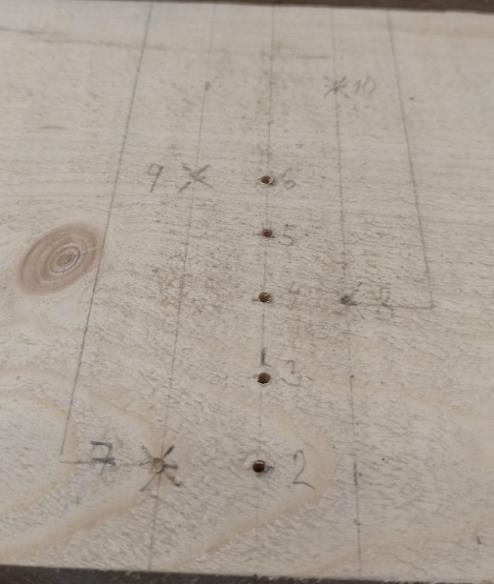
Temperature profile (course) was measured using the NiCr-Ni type thermocouples with a measuring range of -40 °C to +1,200 °C. The location of the thermocouples in the test sample is shown in Figure 14.
Figure 14 Location of thermocouples in the test sample
At every 20 mm from the edge of the thermally loaded side of the sample up to 100 mm, five thermocouples were placed in pre-drilled openings for measuring the temperature inside the sample (thermocouples number 2, 3, 4, 5, 6). Another five thermocouples were placed on the surface of the test sample. These measured the surface temperature. One of these thermocouples
was placed on the exposed side (thermocouple 1) and the remaining four were placed on the upper surface of the sample, 20 mm from the edge of the thermally loaded side, and then every other 40 mm (thermocouples 7, 8, 9, 10).
After the completion of medium-scale fire tests and making slices, i.e., cross-sections, the individual sections were marked according to the sample number and scanned into a computer, where the area and depth of the charred layer was automatically detected, calculated respectively, applying the available analytical tools in TerrSet software (product of the ClarkLabs).
The charred layer depth was assessed using the digital image analyses of photos of wooden beams cross sections taken from the central part of the beam (Figure 15).
Before the fire testing the density of spruce wood was investigated. For its determination, 5 samples of spruce wood with dimensions of 5 x 5 x 2 cm were used. The wood samples were dried in a hot air oven and their final moisture content was of 9,00 % ± 1,00 %. The exact dimensions of the individual samples were measured, their volume was calculated, and they were weighed. Their density was calculated according to the volume and mass of the sample. By averaging the values from all samples, the value of the density of Norway spruce wood was used as an input value to the simulations.
Results
The density of Norway spruce wood used in real fire tests was determined to be 410.70 kg∙m-3, with an average deviation of 3.60 kg∙m-3, a standard deviation of 4.91 kg∙m-3 and a coefficient of variation of 1.20 %.
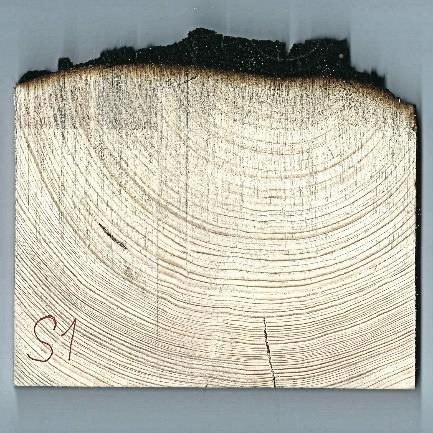
The results of the medium-scale fire tests were processed in the form of graphs of temperature profiles, images of individual sections showing the depth of charred layer and graphs of charring rate. Since the results of the medium-scale fire tests consists of three measurements, the following statistical indicators were processed: absolute deviation, mean deviation, standard deviation, variation range and coefficient of variation.
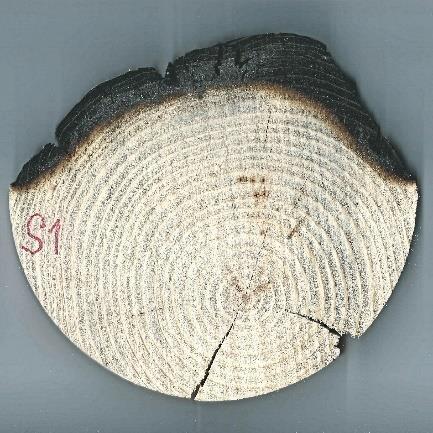
The results for the Norway spruce prism samples are introduced in Figure 16-20. The statistical indicators are summarized in Table 3
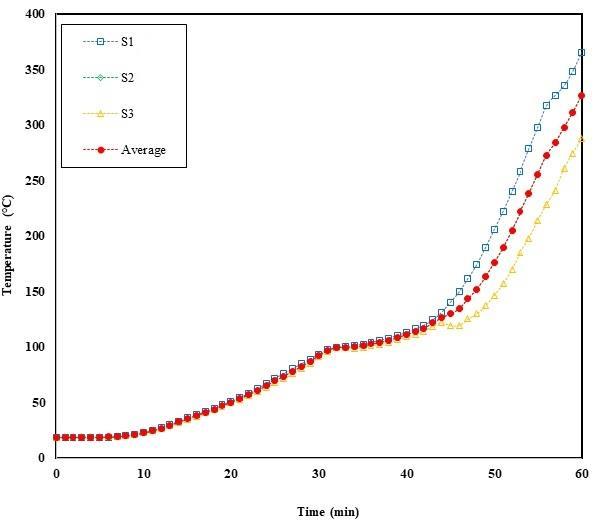
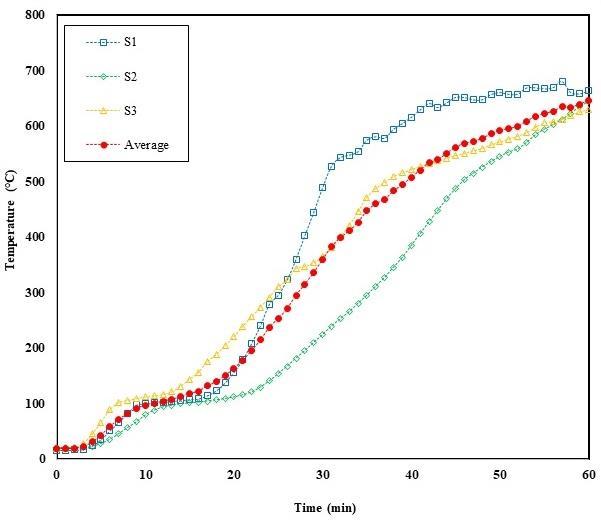
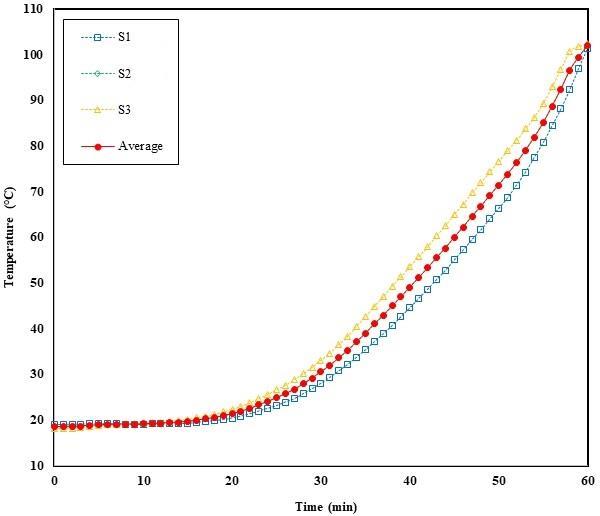
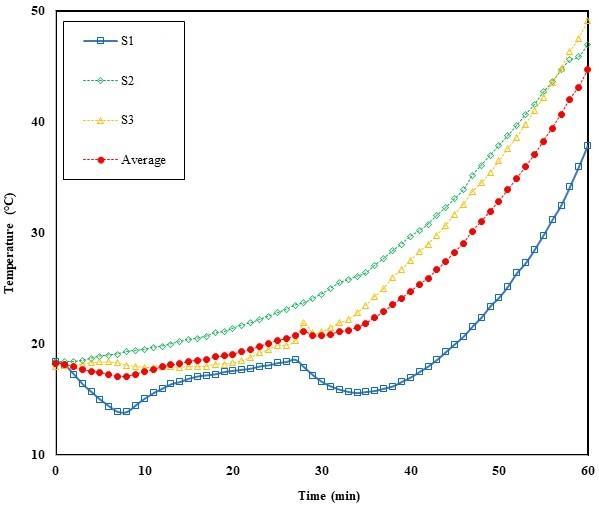
The temperature of charring (limiting value of 300 °C) was achieved in depth up to 4 cm in case of wooden prism. This result is directly connected with evaluation of fire resistance of the wooden beams.
Table 3 presents the statistical data related to the Norway spruce prisms.
Table
The results for the Norway spruce log samples are introduced in Figure 21-25. The statistical indicators are summarized in Table 4.
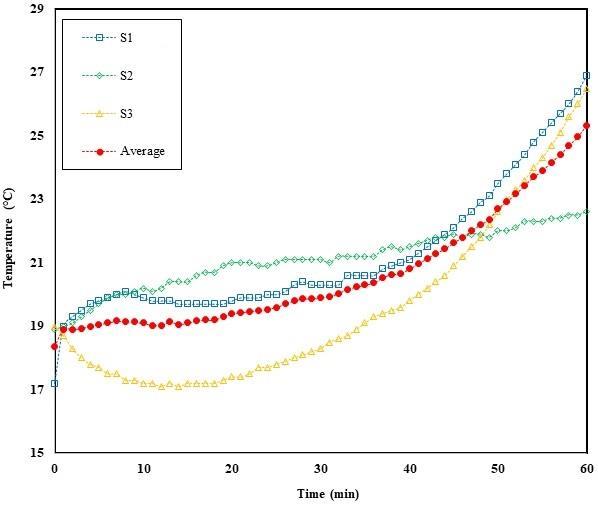
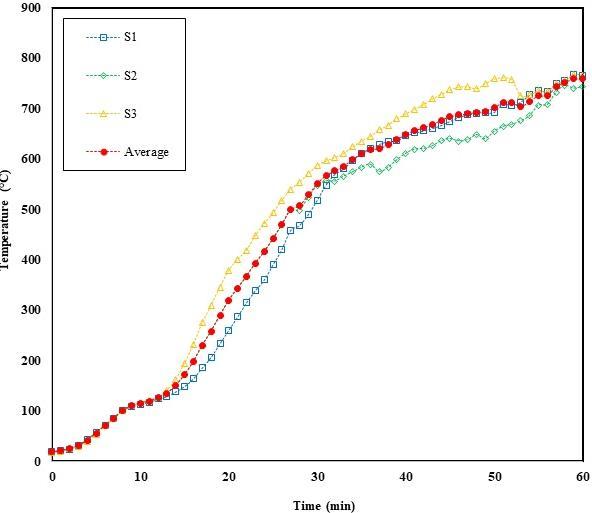
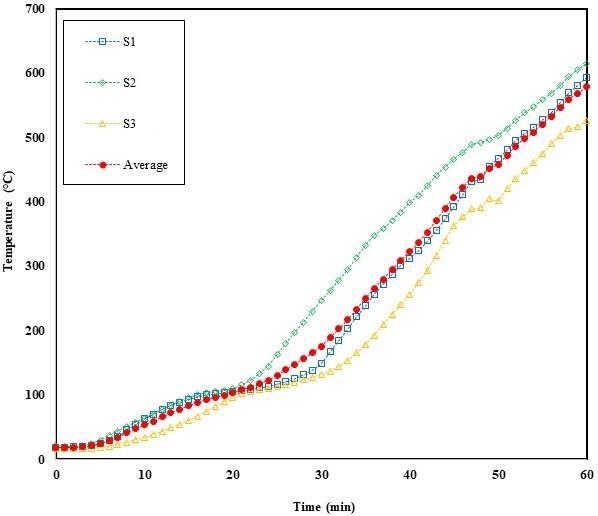
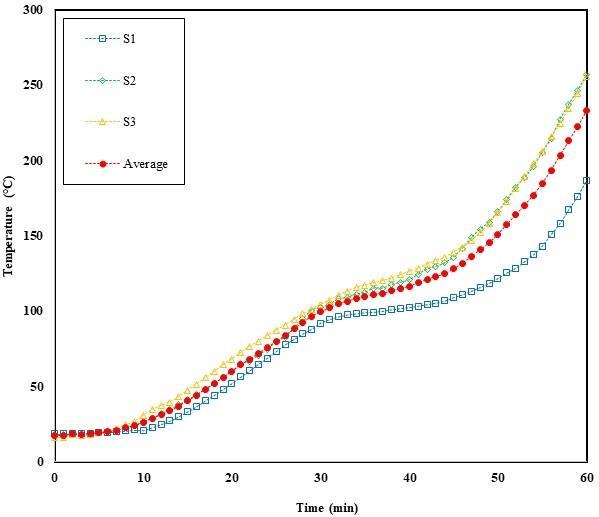
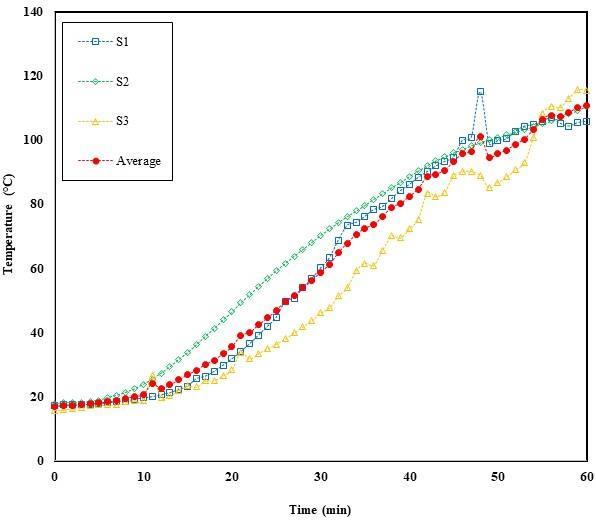
The temperature of charring (limiting value of 300 °C) was achieved in depth up to 4 cm also in case of wooden logs.
Table 4 presents the statistical data related to the Norway spruce logs.
Based on the determined temperature profiles of medium-scale fire tests of spruce logs, the depth and rate of charring were evaluated. Achieving a temperature of 300 °C was considered the charring limit.
Figure 26 shows the course of charring depths values from medium-scale fire tests for Norway spruce prism and Figure 27 for Norway spruce log.
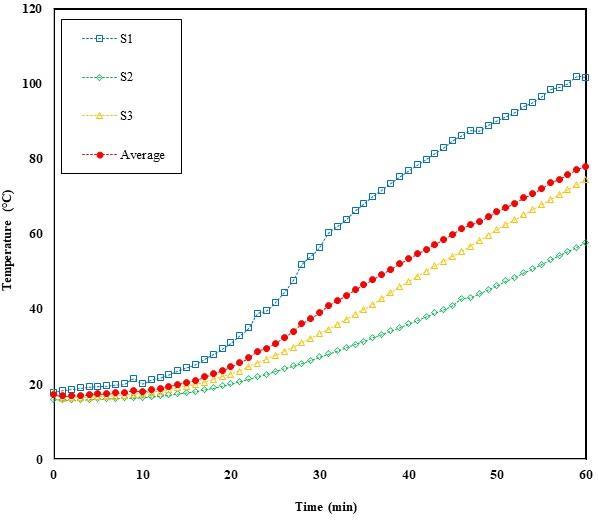
The average area of the charred layer for the Norway spruce prism was of 71.8 cm2, with a standard deviation of 12.2 cm2 In percentage terms, the charred layer represented 22.9 % of the original area. The average area of the charred layer for the Norway spruce log was of 81.0 cm2 , with a standard deviation of 8.4 cm2. In percentage terms, the charred layer represented 25.8 % of the original area.
It is clear from the results that in all cases there was a gradual decrease of the rate of formation of the charred layer, which is also related to the decrease in the rate of charring of wood over time.
According to the fact, that the charring was observed in wood only in the maximum depth of 4 cm, and neither its integrity nor its load-bearing capacity has been affected in 60 min, we can state that in both case, Norway spruce prism and log, that the fire resistance of the wooden beams made from this wood would have the fire resistance of at least 60 min.
The temperature causing charring (300 °C) was reached in case of prisms in the depth of 2 cm after ca. 28 min of thermal loading, so later than in case of logs, which reached this temperature already after ca. 20 min of thermal loading. In the depth of 4 cm, charring temperature was achieved in case of prisms after 50 min and in case of logs after 40 min, on average. Also, and the results related to the achieved depth of the charred layer over time, point out the fact, that the Norway spruce wooden beams with square cross-section (prisms) are more resistant to fire than the wooden beams with circular cross-section (logs).
Conclusions
The provided medium-scale fire tests, showed that the rate of wood charring gradually decreased over time.Basedonthe equationfor calculating thetheoretical rateof charringspecified in the EUROCODE 5, the depth of charring depends on the rate of charring. The technical standard states that the rate of charring is constant over time, which is contrary to this study findings, but also to the findings of other authors.
Results of the studyshowed that increasing the thickness of the charred layer decreases the rate of charring. The reason is the fact that the rate of charring also depends on the already formed charred layer and its depth, due to the change of thermal conductivity of the charring layer.
The significance of information on wood and other materials charred layer depth as well as charring rate for fire investigation was highlighted at Conclusions to the chapter 2.1.1. and is fully incorrespondencewithresearchresults applicationsregardingtheprovidedmedium-scalefiretest
Besides, the results of medium-scale fire tests provide necessary information on material fire properties, which is crucial for development of mathematical or computer fire models to study fire behaviour/ dynamic and to find the cause of fire origin and propagation and spread by the fire investigators.
2.3.DIGITAL IMAGE ANALYSIS IN FIRE TESTING AND FIRE INVESTIGATION
In this chapter we introduce the methodology and results of two types of digital image analyses used as for laboratory-scale as for medium-scale fire tests.
2.3.1. Analysis of Digital Images Acquired from the Forest Litter Laboratory Fire Tests – Case Study 3
This study deals with an investigation of beech forest litter fire behaviour. The main objective of study was the identification and verification of opportunities of digital image analysis application in fire engineeringanddevelopment of amethodologyforautomatedimageprocessing and derivation of selected parameters necessary for describing fire dynamics from images produced bythermal imaging (infrared band) and optical cameras. There were totallyfive fire tests
provided, while three of them were carried out in a laboratory chamber with the simultaneous use of an optical (video) camera used to record the development of flame burning in time. The other two fire tests were carried out in a laboratory fume hood with simultaneous recording of the fire propagation with the Fluke RSE600 thermal imaging camera from above and with an optical camera from the front. For images pre-processing and processing several software were used. Methodologiesweredevelopedto deriveselectedparametersoffiredynamics, whichenable wider and more complex use of knowledge obtained from records from a thermal imaging camera, as well as from classic video camera. The results of the study have their application in science and in practice. From the point of view of application in science, they point to the possibilities and suitability of the application in the work of applied digital technologies for the study of fire behaviour and the automated derivation of its selected parameters. The study provides guidance for conducting similar experiments using digital technologies aimed at studying fire behaviour, too.
Experiment
The material that was investigated was the forest litter collected in the beech forest (stand no. 551, located on the territory of the University Forestry Enterprise of the Technical University in Zvolen) on August 17, 2021. This stand was characterized by the following woody vegetation: European beech 95 %, Silver fir 2 %, European larch 2 % and Sessile oak 1 %. The age of the stand was of 60 years.
The sampled beech litter was dried to a dry state in the MEMMERT air dryer before the fire tests were carried out, and in this state, it was also used in individual experiments, in the amount of 100 g for each test. The duration of each experiment was set to 10 min. While the following data were also recorded during the test: end of flame burning, end of glowing and smouldering.
Laboratory fire tests (5 tests totally) were carried out using the available research infrastructure of the Combustion Laboratory, which is managed by the Department of Fire Protection. The fire tests were carried out in two phases. In the first phase, three fire tests were carried out in the laboratory chamber, together with providing video recordings of the flames.
In the second phase, two fire tests were carried out using not only a video camera, but also a thermal imaging camera. These were carried out in the MERCI G laboratory hood. Here we consider it necessary to emphasize that the implementation of the fire tests served exclusively the purpose of obtaining a basic set of data, i.e., images that were the basis for the processing of image analysesandthedevelopmentofmethodologiesforautomatedimageprocessingandthederivation of selected parameters of fire dynamics.
Theexperiments wereperformedusingacirculartest dish with adiameterof50cm andaheight of 3 cm. During the experiments, the mass loss of the fuel was recorded at intervals of 10 s.
RADWAG WLC R2 precision scales were used for this purpose. Thermocouples (T1 – T5) connected to an autonomous measuring station ALMEMO®710 by AHLBORN and a Fluke RSE600 thermal imaging camera providing a sequence of images with a temporal resolution of 8.6 frames per 1 s and a spatial resolution of 640 x 480 pixels were used to record the course of temperatures during the fire.
The GoPro4 video camera was used to create videos of the fire tests. These records were used in a later phase to derive selected flame parameters applying digital image analysis tools.
From the provided laboratory fire tests, data on the course of temperatures recorded by individual thermocouples (T1-T5) were obtained and further analysed.
Using the RADWAG precision scales, the mass loss of the samples was recorded during the 10 min lasting fire tests. These were processed into graphs. From these data, we also calculated the relative mass loss (6) and the relative mass burning rate (7) in time:
interval in which the weights are recorded (s)
Data on the surface temperature of the fuel at the positions of the thermocouples, which recorded the temperature inside the fuel, were processed from the records obtained by the thermal imaging camera. Subsequently, these temperatures were compared with each other, and the results were analysed and discussed.
The course of temperatures on the surface of the fuel was also recorded and analysed on other profiles, both within the entire surface of the test dish and on specified profiles across the test dish.
From the thermal imaging records, video records and observations, the duration of the flame burning and the time of the glowing (smouldering) of the fuel were obtained. These times were compared to each other. Conclusions were drawn from the results of the comparison.
Data on the mean, average and maximum height of the flame during the fire tests were derived from the data acquired by the video camera. These were derived from images for each 5 s interval.
To calculate the flame height, it was first necessary to define the mean flame height (m). This is best to determine by averaging the visible height of the flame as a function of time. This is the height at which the flame appears in half of the time (equation 8).
Equation (8) considers the height of continuous and pulsating flame in a half of the flame burning time.
Where:
Lfp – flame height (m)
Lfk – height of continuous flame (m)
Lfp – height of pulsating flame (m)
We calculated the average flame height as the average of all flame heights recorded at 5 s intervals during flame burning.
The maximum flame height we determined based on the highest flame height value from the flame height values recorded at 5 s intervals during the flame burning.
Using the data from the fire tests carried out in laboratory fume hood, we calculated the density of the radiated heat flux (mm) according to the equation (9) for each pixel of the image (Wien's displacement law):
Where:
λmax – wavelength at which, at temperature (T), the radiation intensity is maximum
b – universal constant 2.898 (mm∙K-1)
T – thermodynamic temperature on surface of the material (°C)
In the Idrisi TerrSet environment, input images were processed applying image analysis tools (Idrisi Image Processing), i.e., images obtained every 5 s from video recordings and representing thecourseoffiretestsinaspecifictime.Thosefurtherunderwentthresholdingandreclassification. Asaresult,wegot2Dflameshapesoutlines,whichwerefurtherusedforflameheightscalculation.
The rate of burning was calculated based on the mass loss of the sample recorded during the experiments at 10 s intervals.
Results
In this section,wepresent theresults of firetests, theresults of image analysis processingaimed at deriving selected parameters important for understanding the fire dynamics.
Temperature course in a fire
In this subsection, we present the results of the fire tests namely, temperature curves obtained from data from individual thermocouples (T1 – middle of the bowl, T2 – western edge of the bowl,
T3 – northern edge of the bowl, T4 – eastern edge of the bowl, T5 – southern edge of the bowl) located inside the layer of beech litter and also the course of temperatures measured on the surface of the test sample using a Fluke RSE600 thermal imaging camera. The results presented here were obtained during the laboratory fire tests and from processing of the thermal imaging images (in the SmartView R&D software) and of video recordings.
Temperature course – data from the thermocouples
Thermocouples T1-T5 were in the middle of the fuel complex placed on a circular test dish with a height of 3 cm and a diameter of 50 cm. Thermocouple T1 was situated in the centre of the test dish and the other thermocouples was located 2 cm far from the dish edge.
Figures 28-30 show the results for the fire tests carried out in the laboratory chamber.
From the course of the provided fire tests, it is obvious that the different course of temperatures in the individual experiments. Combustion was initiated by igniting the fuel in the centre of the test dish (thermocouple T1). Thermocouple T0 recorded the temperature of the surrounding environment. In Table 5, there are presented the maximum temperature values reached on thermocouples T1-T5 during all three tests carried out in the laboratory chamber.
*Note: W – west direction; N – north direction; E – east direction; S – south direction; C – centre.
From the results shown in Table 3, it is possible to deduce that the heating of the fuel occurred gradually, depending on the direction in which the fire front progressed and where the fire controlled by the available fuel later occurred (maximum temperatures reached during further burning of the fuel). Since the ignition of the fuel always occurred in the centre of the test dish, it is obvious, for example in fire test 1, that the fire front moved from the centre of the test dish first towards the West (T2) and towards the East (T4), i.e., especiallyin the horizontal direction, slower in the vertical direction. In the case of fire test 2, the front of the fire moved faster especially towards the West (T2) and South (T5). In the case of fire test 3, fire spread the fastest both, in the Western (T2) and Northern (T3) directions.
Next, there are presented the results for the fire tests carried out in the laboratory fume hood (Figures 31 and 32). The obtained results were validated based on knowledge obtained from the study of thermal (infrared) imaging records.
Like the case of the fire tests carried out in the laboratory chamber, significant differences during both experiments were also seen in the case of the tests carried out in the laboratory fume hood. In Table 6 we present the maximum temperature values reached on thermocouples T1-T5 during both tests.
Table
Results presented in Table 6 point out the fact that due to the above-mentioned principle of evaluating the results, in the case of fire test 1, the fire front moved first towards the Western and Northern edges of the dish. In the case of fire test 2, the fire front moved first towards the Northern (upper) edge.
Images from a thermal imaging camera were used to validate the findings presented here. The results of the analysis of thermal imaging images pointed to the following facts. In fire test 1, the fire front moved fastest to the North, or Northwest, where it reached the Northern edge of the test dish (T3) already in time of 43 s (Figure 33).
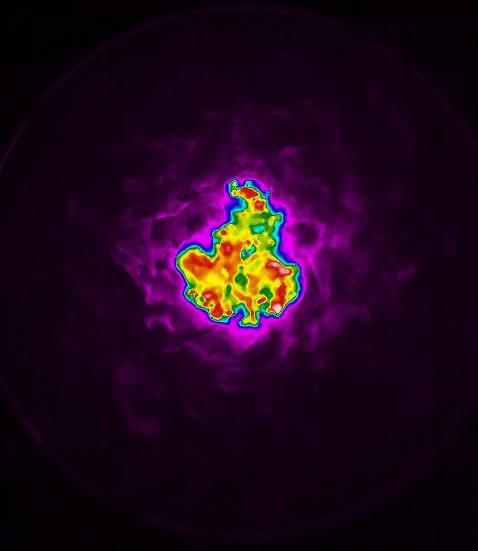
Subsequently, the fire front reached the Western edge of the test dish at 56 s, the Eastern edge at 65 s, and the Southern edge of the dish at 67 s from the start of the fire test. Also, for this reason, considering the amount and structure of available fuel storage, the highest combustion temperatures were later reached at those positions.
In the case of fire test 2, the assumption about the spread of the fire front was not confirmed. Based on the results of the digital image analysis of the infrared images, the fire front moved significantly towards the Northern edge of the test dish at the beginning (Figure 34), but later it spread mainly towards the Southern edge, which reached at time of 61 s. The western edge of the test dish was reached at time of 64 s from the beginning of the fire test.
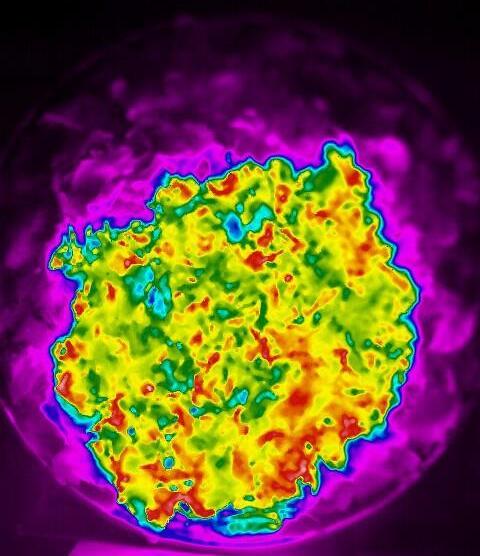
The fire front reached the Eastern edge of the test dish in 73 s and the Northern edge in up to 146 s, while on the surface of the test dish there was also an area of unburned fuel (Figure 35).
Temperature course – data from the thermal imaging camera
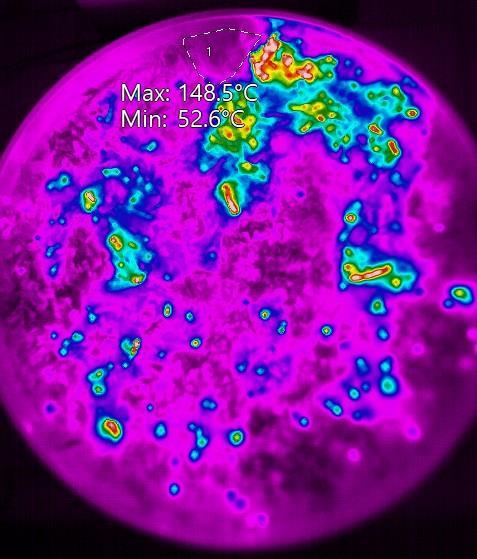
The temperature course on the surface of the test sample was recorded for the position of the individual thermocouples, the entire test dish and subsequently on the individual profile lines. To determine the temperature of the surface of the test sample, recordings from a Fluke RSE600 thermal imaging camera were used, which were processed in the SmartView R&D software. Therefore, the temperatures were determined only within the framework of 2 fire tests carried out in the fume hood.
The thermal imaging camera records individual images at an interval of 0.1 s. In Figure 36 and Figure 37, there are presented the values in this interval, therefore the time units are expressed in the format h:min:s, instead of seconds (s).
First, there are presented the results of the temperature course measured on the surface of the test sample detected at the positions of thermocouples T1-T5.
Figure 37 Temperature course during fire test 2 recorded by thermocouples T1-T5
During the fire test, the maximum and average temperatures reached during the burning of beech litter were recorded on individual thermocouples. In Table 7, there is an overview of these data, which are supplemented with the time in which this value was reached. At the same time, there also presented outputs from the SmartView R&D program, i.e., images from the thermal imaging camera, capturing the surface of the test dish and the course of the temperature of the sample during the fire at the pre-defined times, calculated from the start of the fire test.
Table 7 Maximum and average temperatures recorded by thermocouples during the fire test carried out in the fume hood
Next, there are presented thermal images recorded at time of 13 s (Figure 38), 48 s (Figure 39), 59 s (Figure 40), 64 s (Figure 41) and 69 s (Figure 42) from the start of the fire test. These show the propagation of the fire during the fire test 1.
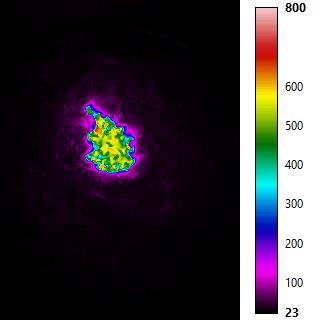
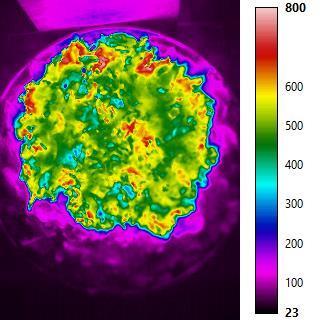
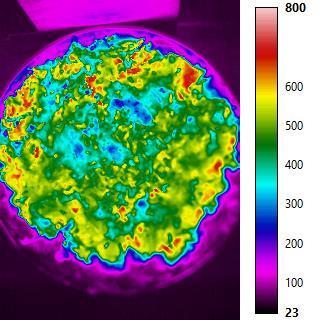
Figure 42 Fire propagation during the fire test 1 – time of 69 s
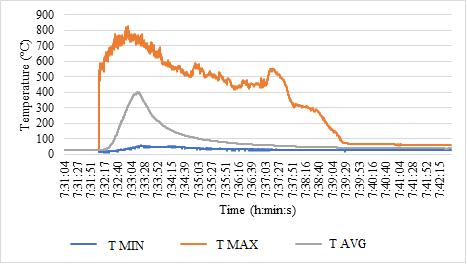
The course of temperatures during fire test 1 calculated for the area of the entire test dish is presented in Figure 43
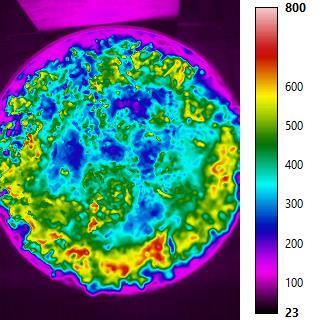
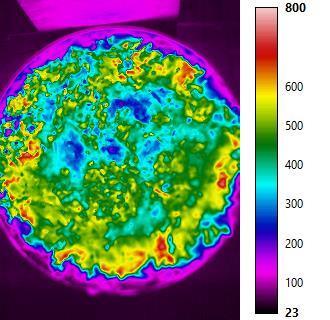
Figure 43 Temperature course within the area of the test dish during fire test 1
During the fire test 1, the maximum temperature value of 770.6 °C was recorded at 21 s from the start of the fire test. At this time, the highest average temperature during the test was also
recorded, namely 179.7 °C. At the time of the end of the test, there were no more spots on the surface of the test dish leading to re-ignition of the fire in case of a sudden supply of air.
The temperature during burning was automatically detected on profiles (4 profiles - eight cardinal points) created in the SmartView R&D software based on temperature information stored in infrared images acquired by the FLUKE thermal imaging camera.
Comparison of temperature course inside and on the surface of the fuel sample
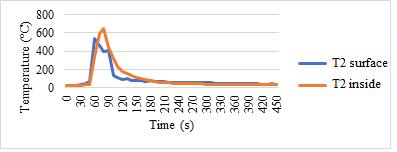
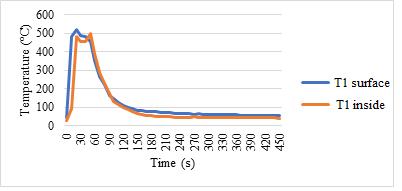
The comparison of the temperature course on the surface and inside the fuel during the fire test was possible when providing the fire tests in the laboratory fume hood, together with using the FLUKE RSE600 thermal imaging camera.
We consider it necessary to draw attention to the fact that the performed study present ways of using progressive recording techniques and digital image analysis of images to derive important fire parameters that serve to understand fire dynamics. The objective of the study was not the analysis of the behaviour of forest litter during a fire itself. This would require the implementation of a sufficient number of fire tests, e.g., for the purpose of deriving dependencies between parameters. The results presented here also correspond to this fact.
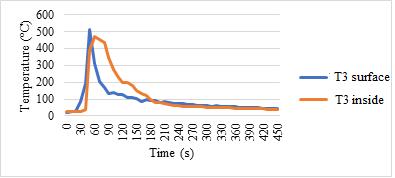
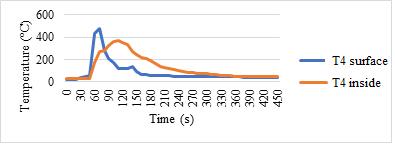
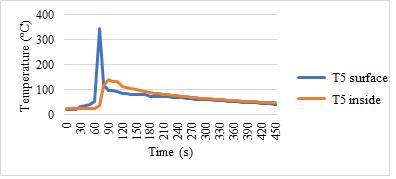
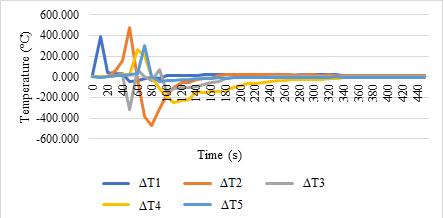
As seen from Figure 33, the significant differences between the temperatures recorded by the thermocouples and the temperatures recorded by the thermal imaging camera were in the flame burning phase. The minimum (T MIN), maximum (T MAX) and average (T AVG) values of temperature differences at the position of individual thermocouples during the fire tests are provided in Table 8
Table 8 Values of temperature differences at the position of individual thermocouples during fire test 1
Duration of flame burning and glowing/smouldering
The study of combustion during fire tests was divided into flame and flameless combustion phases. From the measured values and calculations, we determined 3 phases of combustion. While the flame burning phase itself took place in two sub-phases, i.e., phases of fire development and steady burning. Flameless combustion took place in the last phase called decay. While the highest mass loss, relative burning rate, highest temperatures and flame height were observed right during the flame burning. The rate of the flame burning allowed the fire to spread around the entire perimeter of the test dish. During flameless combustion, the values were stabilized and without significant changes until the end of the experiment. The transition from flameless combustion to flameless combustion was accompanied by smoke, which could be observed visually.
The duration of flame burning was detected from video images analysis. In Table 9 and 10, we present data on the duration of flame and flameless (smouldering/incandescence) burning (also as a percentage of the entire duration of the fire test, i.e., 600 s) for fire tests carried out in the laboratory chamber and for fire tests carried out in the laboratory fume hood. The burning was initiated by the flame of a match.
Table 10 Glowing/smouldering duration
As seen from the results shown in Table 7 and Table 8, there are obvious differences in fire behaviour between the individual tests. The reason for this is mainly the fact that forest litter is not a homogeneous material in its structure, like e. g. wood. The behaviour of the fire in this case is mostly influenced by its distribution on the surface and the overall structure of the fuel. Even with the greatest effort to create test samples that will be similar. This will create a problem because such samples cannot be prepared with this type of material. However, this does not mean that it is not necessaryto investigate them, on the contrary, we need to create an extensive set of data based on several fire tests and then try to derive dependencies between the parameters affecting the behaviour (dynamics) of the fire.
Flame height
In terms of flame height, several parameters were monitored. The maximum, mean and average flame height values were derived from the video data extracted for 5 s intervals of flame burning. Results are presented in Table 11 and Table 12.
Table 11 Average and maximum flame height
Further, there are introduced results for mean flame height (Table 12).
Table 12 Mean height of the flame according to equation (8)
Using the results of fire tests carried out in the fume hood, there was developed an algorithm that enables the automated calculation of the density of the radiated heat flux (equation 9) for the entire area of the test dish.
There are only presented the results for the maximum temperature values recorded in both fire tests.
Inthecaseoffiretest 1,thehighest temperature,770.6°C, was recordedbythethermalimaging cameraattimeof21sfromthestartofthefiretest. Aftersubstitutingthistemperatureintoequation (9), we obtained the value of the wavelength of the maximum radiation intensity at the level of 0.0038 mm = 3.8 μm (mid-wave infrared radiation – MWIR).
A higher maximum temperature value was reached during the fire test 2 (797.6 °C), within 65 s from the start of thetest. Inthis case,the wavelength valueofthemaximum radiation intensity was calculated to be 0.0036 mm = 3.6 μm (MWIR).
Next, the result of the automated determination of the wavelength of the maximum radiation intensity in the form of a time profile of the density of the radiated heat flux calculated for the centre of the test dish (position T1) are presented
Figure 50 Density of radiated heat flux in time in the centre of the dish (position T1)
These values are extracted from the generated image, where each pixel contains a wavelength value calculated according to formula (9). After converting the values from mm to μm and classifying (reclassifying) the wavelength values into the appropriate category, we obtain information about the type of infrared radiation and its spatial distribution on the surface of the sample (material).
Burning rate
From the point of view of calculating the burning rate, we focused on determining the relative mass burning rate and surface burning rate of fuel recorded on surface of the test dish.
Relative mass burning rate
We have expressed the mass burning rate based on the mass loss data, which was recorded during the tests with accurate scales from the RADWAG company. The fire test lasted a total of 600 s = 10 min.
In Figure51 wepresent theresults ofmassloss for firetests carried out in a laboratorychamber.
Figure 52 gives a view of the relative mass rate of burning of the samples during the implementation of fire tests in the laboratory chamber.
In Figure 53, we introduce the results according to the mass loss of samples during fire tests provided in laboratory fume hood.
Figure 54 provides an overview of the relative mass rate of burning of samples during fire tests in a
Surface burning rate
The calculation of the surface burning rate was preceded by analyses aimed at determining the increase in the burning area (burning area with a temperature above 400 °C) within the test dish over time (time interval of 1 s). Here we present the results for fire test 1 (Figure 55). At the same time,wealso present the result regardingtheextentofthefire areaonwhich thetemperatureabove 400°C was reached during the fire (Figure 56).
From Figure 55 and 56, it is obvious that the highest increase in the burning area is precisely in thephaseofflame(steady) burning.Whilethemaximum increasein theburningareawas recorded in 50 s after the start of the fire test and represented a value of 92 cm2. In the time 60 s after the start of the test, the largest burning area was reached, namely 308 cm2
The surface burning rate was calculated based on the algorithm developed in the Python programming language. In this subsection, we present the results of the image analysis for fire test 1, the images of which were also used for the development of an algorithm for the automated calculation of the area burning rate of the sample in 600 s.
Figure 57 Course of the surface burning rate in four directions in 10 s intervals
In Figure57,it is possibleto detect phases in which theburningtook placefaster(flameburning phase) and phases where the burning rate values reached lower values (smouldering phase). In the direction to the south (to T5) from the centre of the bowl, the maximum value of the surface burning rate of 12.8 cm2 ∙s-1 was reached in 50 s from the start of the fire test. In the direction to the west (to T2) from the centre of the bowl, the maximum value of the surface burning rate of 11.3 cm2 s-1 was reached in 70 s from the start of the fire test. In the direction to the east (to T4) from the centre of the bowl, the maximum value of the surface burning rate of 11.5 cm2 ∙s-1 was reached in 340 s from the start of the fire test. In the direction to the north (to T3) from the centre of the bowl, the maximum value of the surface burning rate of 4.1 cm2 ∙s-1 was reached in 100 s from the start of the fire test.
The values of the surface burning rate reached not only positive but also negative values. The reason is mainly fuel heterogeneity. In the case of a homogeneous fuel, the propagation would be constant, but the heterogeneityof the fuel caused differences in the time required for preheating the fuel and its subsequent ignition. At the same time, after burning off the fuel in the parts near the place of initiation, it subsequently cooled down, which caused the reduction of the total area with a temperature above 400 °C.
In Figure 58, we present the course of surface burning rate in 1 s intervals.
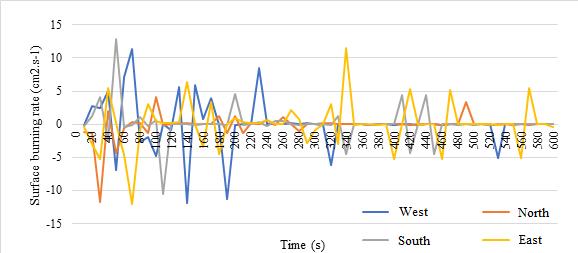
Figure 58 Course of the surface burning rate in 1 s intervals
Automated delineation of flame outlines
For the completeness, we also present the image processing methodology/algorithm applicable in the Idrisi Terrset environment, as well as an example sample of the outputs from the image analyses aimed at identifying the flame outlines (2D visualization of the flame) from the sequence of frames obtained from the video recordings.
File/Import/Desktop Publishing Formats/JPGIDRIS (Output Reference Information/Plane)
File/Display/SEPARATE
Creates separated images (raster) from 24-bit colour or any other binary image in RGB channels.
For further analyses select raster Band 2.
Digitize/Polygon
Serves for creation of polygon vector layer (test dish outline) based on raster file (image). Specify the name of the file and digitize the outline of the test dish by continual clicking on the left mouse button.
RASTERVECTOR
Converts the vector file with test dish outline to raster file.
The spatial parameters of creating raster file should be copied from raster Band 2 (select it from the list).
Idrisi GIS Analysis/Image Calculator (Raster file with outline of the test dish*raster Band2)
Creation of a raster reducing the image extent to area with test dish and flame.
Idrisi GIS Analysis/Database
Query/Reclass
Composer/Add Layer/Vector
Reclassification of raster values into two classes based on thresholding the flame spectral values. (In study, the reclassification of raster values with threshold of 190 was applied for flame detection).
Visualization of the 2D surface of the flame within the test dish.
Using this procedure, we overlay the raster image of the 2D flame with a vector one representingthe outline of the dish (Figure 59).
Outputs (raster files) of image analysis from the Idrisi TerrSet environment can be further processed (calculation of flame height) in this environment these outputs can be used after exporting them to ASCII text format as input data to other program environments such as MATLAB to process further calculations.
Conclusions
In terms of contributions for science, the study presents the possibilities and suitability of applying digital technologies for the study of fire behaviour and automated extraction of selected fire parameters (e.g., the development of fire temperatures over time on the surface of the sample, the calculation of the surface burning rate over time, the detection of the flame shape and height, etc.).
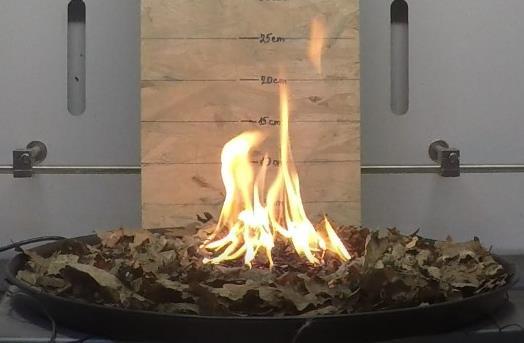
It also provides guidance for carrying out similar experiments using digital technologies to study the behaviour of fire, also in other types of materials, as well as to study the fire dynamics in enclosed spaces, but also in the process of fire investigation
The course of the fire tests carried out, recorded by the thermal imaging camera and by the video (optical) camera, and the digital outputs themselves are a key input to the image analyses and the creation of algorithms enabling the automated derivation of selected fire parameters from them.
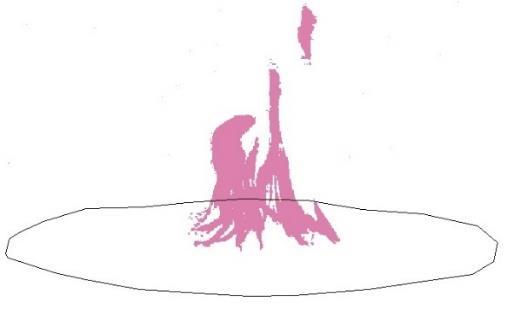
The contribution of the study to research in the field of fire dynamics and fire investigation are mainly the developed algorithms, which are not presented here, but which allow a broader and more comprehensive use of the knowledge obtained from thermal imaging camera recordings as well as from classical video recordings. The algorithms are written in Python and are easily extensible, i.e., additional analytical functions can be added to the algorithms. They are the basis for their further and broader application in research, specifically in the field of machine learning and the application of artificial intelligence tools.
In terms of practical application, the developed algorithms for automated derivation of fire parameters are immediately applicable, especially in the practice of fire investigation.
2.3.2. Analysis of Infrared Images Acquired During the Medium-Scale Fire Tests
– Case Study 4
Wood has excellent structural and mechanical properties and construction options. For wooden building structures, this material ideally meets the increasingly dominant and uncompromising demand of present and probably the foreseeable future, because of its environmental friendliness, to be used in housing, industrial production, and constructions.
Heat transfer, heat conduction and method of thermal loading have the greatest effect on the behaviour of the wooden structure in fire. Wood undergoes thermal decomposition when exposed to fire, see MENSAH ET AL. (2022). Heating, i.e., thermal loading, the surface and conducting heat inside leads to chemical and physical changes in the wood. The fire resistance of the basic building blocks of wood varies, with hemicelluloses being the least resistant to thermal decomposition, while lignin is the most resistant component of wood (HILL,ALTGEN AND RAUTKARI, 2021).
In the EN 1995-1-2 (EUROCODE 5), the rate of charring is assigned to wood and wood-based building materials depending on the type. The rate of charring of wood is also affected by wood moisture content, surface orientation, air movement, thermal loading, cracks, etc., according to
MAČIULAITIS ET AL. (2012).
The heat transfer analysis of fire-exposed structures also includes some level of modelling of the pyrolysis front, which is the transition zone between the fire undamaged wood and the char layer. A variety of simple and advanced calculation methods can be found in the literature. It is important to note that, while pyrolysis is inherently a complex and nonlinear process, simplified models, such as the linear model in Eurocode 5, are based on a single parameter: the nominal char rate.
The nominal charring rate is defined as the char rate at 1 h of standard fire exposure. The nominal char rate depends on the species of wood (i.e., softwood versus hardwood), whether it is solid-sawn wood or is a built-up structural element (e.g., glue-laminated timber), the moisture content of the wood, and the direction of heating (i.e., parallel to the grain versus perpendicular to the grain). Nominal char rates for various wood products can be found in the literature (e.g., EUROCODE 5). Knowing the nominal charring rate, the depth of the charred layer can then be determined as a function of time.
According to the linear model in Eurocode 5, the depth of charring is given by the following equation (10):
Where:
t – time (min)
β0 – nominal charring rate (mm∙min-1).
The equation (10) is a one-dimensional model. Additional factors (e.g., corner rounding) must be considered when a structural element is heated on more than one side.
Experiment
In this study, the depth of the charred layer (mm), charring rate (mm/min) and temperature courses were investigated through the implementation of medium-scale fire test of wooden beams (prisms) made from European larch wood and using the digital image analyses of infrared images recorded by thermal imaging camera
Larch timberis oneofthe most durablesoftwoodspecies. It has averywarm colourandtexture. Larch is in great demand for use in building due to being tough, waterproof, and high durable. Larch wood is used as construction wood, for furniture and equipment. Wood is also found in construction work, bridges, and hydraulic engineering. In the construction of houses, it is used for facades, balconies, windows, and doors. In central Europe it is viewed as one of the best woods even for building houses.
European larch wood is the narrow sapwood, due to the early coring of the tree. Embodied black knots and clearly visible annual rings are quite typical. With an average apparent density of 550 to 590 kg∙m-3 and a wood moisture content of 12 to 15 %, larch wood is one of the heavy, hard woods. Larch heartwood is extremely strong and durable. It can be used without chemical wood protection and is resistant to insects.
To investigate the thermal decomposition of European larch wood beams, the medium-scale fire tests were provided, As the result, the depth and rate of charring was calculated. Besides, temperature courses measured in time at predetermined places on the beam were created and evaluated.
The test samples (3 pcs) were made from larch (Larix decidua L.) wood. Those were of square cross-section (prism). The length of all samples was of 1,000 mm. The dimensions of the square cross-section were of 200 x 200 mm ± 1 mm.
The test samples were dried in an air-conditioned room to a moisture content of 14 % ± 1 %. No surface treatment was applied to the test samples. All the samples were subjected to medium-scale fire tests realized in the laboratory chamber.
Each test sample was placed on two aerated concrete blocks so that the thermally loaded area of the test sample was at a height level with the central axis of the radiation panel. The distance of the test sample from the radiation panel was of 130 mm (Figure 60).
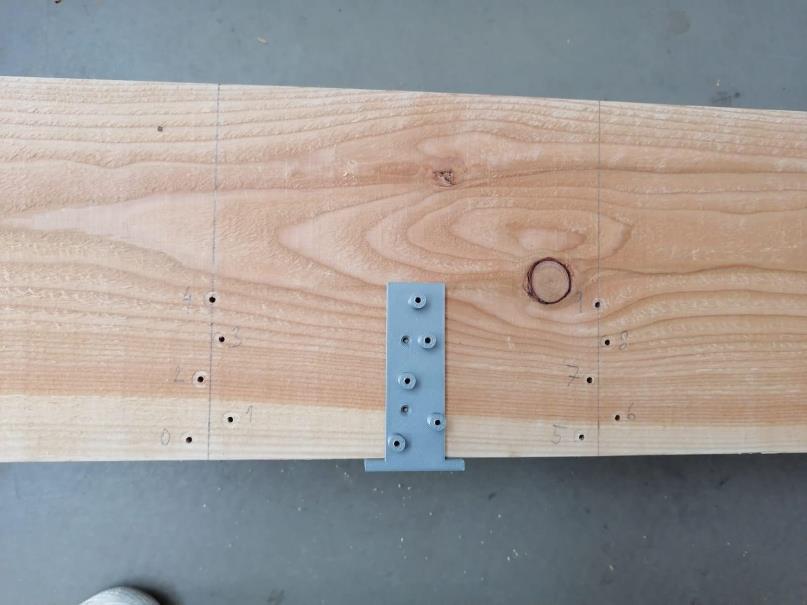
The size of the radiation area was of 480 x 280 mm. The energy source of the ceramic radiation panel was propane-butane gas with a constant flow (15 m3∙h-1), while the temperature measured on the surface of the radiation panel during the fire test was in the range 599 to 624 °C.
The medium-scale fire test lasted 60 min, during which temperature profiles were recorded at predetermined locations of the test sample. Temperature course was recorded using the NiCr-Ni type thermocouples with a measuring range of -40 °C to +1,200 °C.
The position of the thermocouples in the test sample is shown in Figure 61
At every 10 mm (T1 and T6) or 20 mm (T2-T5 and T7-T10) from the edge of the thermally loaded side of the sample up to 80 mm, five thermocouples were placed in pre-drilled openings for measuring the temperature inside the sample in the depth of 80 mm.
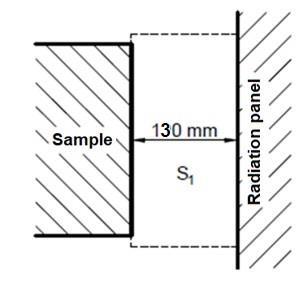
AHLBORN ALMEMO 2290-8710 V7 was used to record temperatures. The thermocouples were positioned to measure the temperature in the middle of the cross section of the test sample.
RADWAG precision laboratory scales were used to measure and record the weight (mass) of the sample over time.
FLUKE RSE600 laboratorythermal imaging camera with spatial resolution of 640 x 480 pixels was used to record the fire tests to obtain the temperature course on the surface of the test samples when thermally loaded. Those temperatures were measured at the same position as the thermocouples were situated.
At the end the temperature measured on the wooden beam surface and inside the wood were compared and discussed.
Charred layer depth was assessed applying the digital image analysis tools. Analyses input data were the photos (visible band) taken by FLUKE RSE600 thermal imaging camera (Figure 62) during the test in 10 min intervals. Digital image analysis was provided in Idrisi TerrSet.
The charred layer and pyrolysis zone depth was assessed both in vertical and horizontal direction. To determine the depth of charring in vertical direction photos taken after the fire test were used (Figure 63).
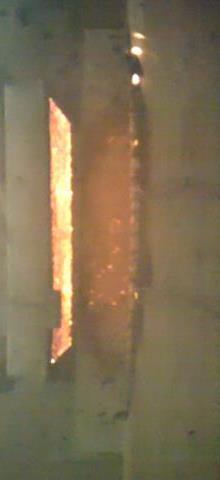
Results and Discussion
The results of the medium-scale fire tests are presented in the form of graphs. In Figure 64, there is shown the course of mass loss (average values of 3 measurements).
The course of mass loss was constructed based on temperature information recorded for 10 s interval for the first 10 min and after only in 1 min intervals. It is the reason of the difference in the mass loss course, i.e., lower rate of mass loss. The total mass loss was of 2.66 kg (12.55 %) after 60 min.
Theseresults werecomparedwith results ofspruce andfirwoodenbeams mass loss which were of the same dimensions and undergone the same fire tests (ŠPILÁK ET AL. 2021).
Mass loss rate course is introduced in Figure 65
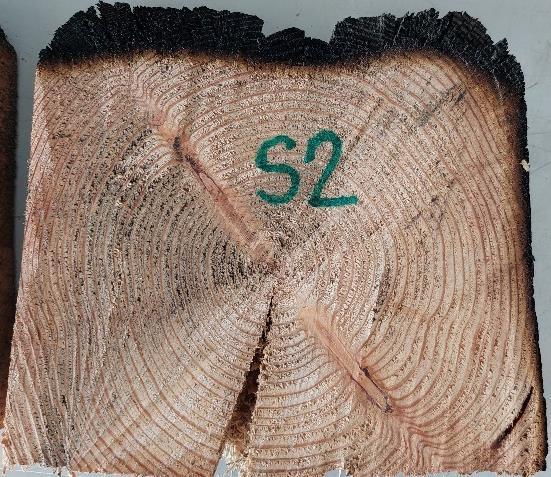
Graphs introduced in Fig. 66-76 contain a temperature course recorded by thermocouples (in the depth of 80 mm) and the temperature course obtained from digital image analysis of thermal (infrared) images.
Based on the temperature courses we studied the pyrolysis process. As DI BLASI (2008) stated, wood typically undergoes three main stages of pyrolysis due to its relatively low thermal conductivity and density and relatively high specific heat: dehydration and very slow pyrolysis below 200 ° C, onset of pyrolysis up to 300 ° C, and rapid pyrolysis above 300 ° C.
In Figure 66 there is shown the temperature course recorded in thermocouples T1-T5 inside the wood,in depth (vertical direction)of80 mm. InFigure 67,thereis thetemperaturecourserecorded by the thermocouples T6-T10.
As seen from the temperature courses (Figure 66 and Figure 67), only the first stage of pyrolysis, i.e., very slow pyrolysis, occurred in case of thermocouples located in the distance from the thermally loaded beam edge of 40-80 mm (T3-T5 and T8-T10). Considering thermocouple T2 and T7 (situated in the depth of 20 mm), the slow pyrolysis stage occurred between 0 and 1,440 s (T2), 0 and 900 s (T7). Thermocouples T1 and T6 recorded temperatures typical for slow pyrolysis stage in time interval of 0-500 s (T6), 0-550 s (T1) respectively. The onset of pyrolysis was recorded only by thermocouples T1 (560 s) and T6 (510 s) located in the distance of 10 mm from the thermally loaded beam edge, and thermocouples T2 (1,450 s) and T7 (1,510 s), located in the distance of 20 mm. Those thermocouples had also undergone the rapid pyrolysis stage: T1 (from 820 s), T6 (from 750 s), T2 (from 1,910 s), T7 (from 1,980 s).
Considering the fact, that the cellulose degradation, creation of charred layer starts with temperature of 300 °C, the charred layer was formed only in wood depth of max. 20 mm, while it was recorded in the depth of 10 mm in time of (T1), (T6) and in the depth of 20 mm in time of (T2) and (T7).
Figure 68
Figure
by thermal imaging camera
the above surface of the
wooden beams.
case, only the slow pyrolysis stage was found at position of thermocouples T4, T5 and T8-T10. The onset of pyrolysis was found at position of thermocouples T1-T3 and T6, T7. Pyrolysis stage characterized by rapid rate was found at position of thermocouples T1, T2 and T6, T7.
The slow pyrolysis stage was recorded in time interval of 0-180 s at position of T1 (10 mm far from thermally loaded wooden beam edge, 0-900 s at position of T2 (20 mm far from the edge), 0-2,860 s at position of T3 (40 mm far from the edge), 0-3,600 s at position of T4 (60 mm) and T5 (80 mm), 0-200 s at position of T6 (10 mm), 0-1,920 s at position of T7 (20 mm), 0-3.600 s at position of T8-T10 (40-80 mm).
The stage characterized by the onset of pyrolysis was detected at position of T1 in time interval of 190-710 s, at position of T2 in 910-1.670 s, at position of T3 in 2,861-3,600 s, at position of T6 in 210-1,330 s and at position of T7 in 1,920-2,820 s.
The rapid pyrolysis stage was detected at position of T1 from 720 s, T2 from 1,680 s, T6 from 1,340 s and T7 from 2,830 s.
In Figure 70, there are presented the temperature courses (average values of three measurements) measured by thermocouples T1 and T6 in the depth of 10 mm and by thermal imaging camera at the position of T1 and T6, measured on the surface of the beam upper side.
As seen from Figure 70, there is a significant difference in the temperature courses recorded by thermocouples and thermal imaging camera.
When comparing the wood thermal degradation process regarding the temperature recorded by the thermocouples inside the wood sample and on the surface of the sample, we can detect the multistage thermal degradation of wood sample on its surface, while the curve of the thermal degradation inside the sample shows almost linear continuously increasing trend.
Comparing the temperature profiles measured on the surface and inside (10 mm) the wood sample in position of thermocouples T1 and T6 (see Figure 61), we can state that there are significant differences in temperaturecourseandthermaldegradation ofwoodon thewoodsurface and in the depth of 10 mm. The temperature profiles constructed according to data recorded by the thermal imaging camera show more stages of thermal degradation which is caused by direct effect of thermal loading on the sample. The temperature peaks are related to the flame combustion occurrence, which was caused by the previous stage of the thermal degradation process, i.e., release of volatiles, which was followed by the pyrolysis (decomposition stage and further by combustion stage which shall result in formation of carbon residue). This behaviour was observed in all the tests implemented; however, they differed by the shape of the temperature curve and the highest temperature values reached.
As mentioned above, charring temperature values (i.e., 300 °C and more were reached only in case of the surface of wood sample and inside the wood, in the depth of maximum of 20 mm.
Results of charred layer depth analyses are provided in Figures 75-77 both, for horizontal and for vertical direction.
Comparing the data related to the vertical and horizontal charred layer depth, there is seen significant difference in thermal degradation of wood in both directions. The reason is the fact that the depth of charred layer in vertical direction was measured on the heat source exposed side of the sample, and the horizontal charred layer depth on the top of the sample, which was not directly exposed to thermal loading. Also, the difference in resulting values caused the expression of both parameters, while the depth of charred layer in vertical direction was expressed in dependency on horizontal distance interval and horizontal depth of charred layer in dependency on time. The maximum average depth of charred layer in vertical direction was of 21.07 mm (exposed side of the sample) and of 42.23 mm in horizontal direction.
Conclusions
This studyprovides guidance on the implementation of medium-scale fire tests of timber beams that are fully compliant with the requirements of the Eurocode 5. An innovative and advanced approach to the determination of selected fire parameters, the knowledge of which significantly assists the process of fire investigation, is the application of thermal imaging camera and digital imageanalysistechniques.Applyingthealgorithms forautomatizedimageanalysesandderivation of selected fire parameters allows to apply this technology also in the present practice of fire investigation, while no special need for training of users of these algorithms is needed. Only the expertise in fire science or fire engineering is needed.