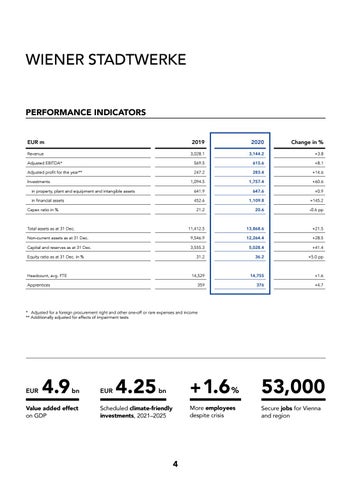
WIENER STADTWERKE PERFORMANCE INDICATORS EUR m
2019
2020
Revenue
Change in %
3,028.1
3,144.2
+3.8
Adjusted EBITDA*
569.5
615.6
+8.1
Adjusted profit for the year**
247.2
283.4
+14.6
1,094.5
1,757.4
+60.6
in property, plant and equipment and intangible assets
641.9
647.6
+0.9
in financial assets
452.6
1,109.8
+145.2
21.2
20.6
-0.6 pp
Investments
Capex ratio in %
11,412.5
13,868.6
+21.5
Non-current assets as at 31 Dec.
9,546.9
12,264.4
+28.5
Capital and reserves as at 31 Dec.
3,555.3
5,028.4
+41.4
31.2
36.2
+5.0 pp
14,529
14,755
+1.6
359
376
+4.7
Total assets as at 31 Dec.
Equity ratio as at 31 Dec. in %
Headcount, avg. FTE Apprentices
* Adjusted for a foreign procurement right and other one-off or rare expenses and income ** Additionally adjusted for effects of impairment tests
EUR
4.9
bn
Value added effect on GDP
EUR
4.25
bn
Scheduled climate-friendly investments, 2021–2025
4
+ 1.6 %
53,000
More employees despite crisis
Secure jobs for Vienna and region


