Green Infrastructure Finance
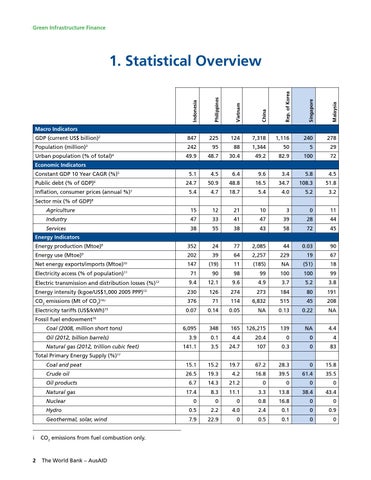
Indonesia
Philippines
Vietnam
China
Rep. of Korea
Singapore
Malaysia
1. Statistical Overview
847
225
124
7,318
1,116
240
278
242
95
88
1,344
50
5
29
49.9
48.7
30.4
49.2
82.9
100
72
5.1
4.5
6.4
9.6
3.4
5.8
4.5
24.7
50.9
48.8
16.5
34.7
108.3
51.8
5.4
4.7
18.7
5.4
4.0
5.2
3.2
Agriculture
15
12
21
10
3
0
11
Industry
47
33
41
47
39
28
44
Services
38
55
38
43
58
72
45
Energy production (Mtoe)9
352
24
77
2,085
44
0.03
90
Energy use (Mtoe)
202
39
64
2,257
229
19
67
Net energy exports/imports (Mtoe)10
147
(19)
11
(185)
NA
(51)
18
71
90
98
99
100
100
99
Electric transmission and distribution losses (%)
9.4
12.1
9.6
4.9
3.7
5.2
3.8
Energy intensity (kgoe/US$1,000 2005 PPP)
230
126
274
273
184
80
191
Macro Indicators GDP (current US$ billion)2 Population (million)
3
Urban population (% of total)
4
Economic Indicators Constant GDP 10 Year CAGR (%)5 Public debt (% of GDP)
6
Inflation, consumer prices (annual %)
7
Sector mix (% of GDP)8
Energy Indicators 9
Electricity access (% of population)
11 12
13
CO2 emissions (Mt of CO2)
376
71
114
6,832
515
45
208
Electricity tariffs (US$/kWh)15
0.07
0.14
0.05
NA
0.13
0.22
NA
6,095
348
165
126,215
139
NA
4.4
14,i
Fossil fuel endowment
16
Coal (2008, million short tons)
3.9
0.1
4.4
20.4
0
0
4
141.1
3.5
24.7
107
0.3
0
83
Coal and peat
15.1
15.2
19.7
67.2
28.3
0
15.8
Crude oil
Oil (2012, billion barrels) Natural gas (2012, trillion cubic feet) Total Primary Energy Supply (%)17
26.5
19.3
4.2
16.8
39.5
61.4
35.5
Oil products
6.7
14.3
21.2
0
0
0
0
Natural gas
17.4
8.3
11.1
3.3
13.8
38.4
43.4
0
0
0
0.8
16.8
0
0
Nuclear Hydro
0.5
2.2
4.0
2.4
0.1
0
0.9
Geothermal, solar, wind
7.9
22.9
0
0.5
0.1
0
0
i CO2 emissions from fuel combustion only.
2
The World Bank – AusAID