REVIVING GROWTH

WORLD BANK EAST ASIA AND THE PACIFIC ECONOMIC UPDATE APRIL 2023

© 2023 International Bank for Reconstruction and Development / The World Bank
1818 H Street NW, Washington, DC 20433
Telephone: 202-473-1000; Internet: www.worldbank.org
Some rights reserved
1 2 3 4 26 25 24 23
This work is a product of the staff of The World Bank with external contributions. The findings, interpretations, and conclusions expressed in this work do not necessarily reflect the views of The World Bank, its Board of Executive Directors, or the governments they represent. The World Bank does not guarantee the accuracy, completeness, or currency of the data included in this work and does not assume responsibility for any errors, omissions, or discrepancies in the information, or liability with respect to the use of or failure to use the information, methods, processes, or conclusions set forth. The boundaries, colors, denominations, and other information shown on any map in this work do not imply any judgment on the part of The World Bank concerning the legal status of any territory or the endorsement or acceptance of such boundaries.
Nothing herein shall constitute or be construed or considered to be a limitation upon or waiver of the privileges and immunities of The World Bank, all of which are specifically reserved.
Rights and Permissions
This work is available under the Creative Commons Attribution 3.0 IGO license (CC BY 3.0 IGO) http://creativecommons.org/licenses/ by/3.0/igo. Under the Creative Commons Attribution license, you are free to copy, distribute, transmit, and adapt this work, including for commercial purposes, under the following conditions:
Attribution—Please cite the work as follows: World Bank. 2023. Reviving Growth. World Bank East Asia and Pacific Economic Update (April). Washington, DC: World Bank. doi:10.1596/978-1-4648-1983-4.
License: Creative Commons Attribution CC BY 3.0 IGO
Translations—If you create a translation of this work, please add the following disclaimer along with the attribution: This translation was not created by The World Bank and should not be considered an official World Bank translation. The World Bank shall not be liable for any content or error in this translation.
Adaptations—If you create an adaptation of this work, please add the following disclaimer along with the attribution: This is an adaptation of an original work by The World Bank. Views and opinions expressed in the adaptation are the sole responsibility of the author or authors of the adaptation and are not endorsed by The World Bank.
Third-party content—The World Bank does not necessarily own each component of the content contained within the work. The World Bank therefore does not warrant that the use of any third-party-owned individual component or part contained in the work will not infringe on the rights of those third parties. The risk of claims resulting from such infringement rests solely with you. If you wish to re-use a component of the work, it is your responsibility to determine whether permission is needed for that re-use and to obtain permission from the copyright owner. Examples of components can include, but are not limited to, tables, figures, or images.
All queries on rights and licenses should be addressed to World Bank Publications, The World Bank Group, 1818 H Street NW, Washington, DC 20433, USA; e-mail: pubrights@worldbank.org.
ISBN (electronic): 978-1-4648-1983-4
DOI: 10.1596/978-1-4648-1983-4
Cover photo: Young asian women farmer working and check quality control in orchid farm greenhouse by Suriyapong Thongsawang © Getty Images. Used with the permission of Getty Images. Further permission required for reuse.
Figure O1. Most major EAP economies have recovered and are growing, but output in most Pacific Island Countries is still not back to pre-pandemic levels
Figure O2. Domestic demand is moderating and goods exports are declining xviii
Figure O3. Most governments have had less expansionary fiscal policy, and began to tighten monetary policy, in 2022
Figure O4. Global growth in 2023 is projected to be slower than in 2022 which, along with monetary tightening, will affect growth in the region
Figure O5. EAP countries have seen two decades of higher and less volatile growth than other economies, and all have transitioned either to lower or upper middle-income status xx
Figure O6. EAP convergence with high income countries, which was faster than in other countries, has recently stalled xx
Figure O7. And productivity growth has been declining xxi
Figure O8. In recent years, the share of manufacturing in GDP declined in major EAP economies (other than Cambodia and Vietnam), and of services in GDP increased xxi
Figure O9. In major countries, workers moved mostly from least productive agriculture to below-average productivity services sectors, and not much to the most productive manufacturing and services sectors
Figure O10. The adoption of digital technologies is likely to increase productivity in services
Figure O11. Reforms contributed positively to GDP-per-capita growth in EAP
Figure O12. Countries need to address the significant “reform gap” between EAP and advanced economies xxiv
Figure O13. Exports of some EAP economies to the US and China increased after they imposition of trade restrictions on each other xxv
Figure O14. Measures taken after 2018 adversely affected innovation of Chinese firms which had prior collaborations with the US, and of US firms which had prior collaborations with China xxv
Figure O15. The US and, increasingly, China are important sources of knowledge for other East Asia and Pacific countries xxvi
Figure O16. The adverse effects of a trade and technological rift between large countries can be reduced by third countries forming (separate) trade agreements that ideally include each large country xx vii
Figure O17. EAP countries are aging faster than rich countries did, and the working age population will peak at lower levels of income per capita xxvii
Figure O18. Aging could reduce the share of the conventional “working age” population, unless older people (especially women) continue to work xxviii
Figure O19. Aging will increase spending on pensions, and requires bridging the gap between actual and actuarially fair contribution rates xxviii
Figure O20. EAP countries are highly exposed to climate change impacts xxix
Figure O21. Investing in adaptation will deliver a triple dividend xxx
Figure O22. For example, all sectors will benefit from adaptation investments in the Philippines xxxi
Figure O23. Aging, deglobalization and climate change can reduce potential growth, but reforms can offset the impact xxxii
Figure 1. Most major EAP economies have recovered and are growing 1
Figure 2. But output remains below pre-pandemic levels in most of the Pacific Island Countries 2
AE Advanced Economy
AFC Asian Financial Crisis
CAR Capital Adequacy Ratio
CBA Cost-Benefit Analysis
COVID Coronavirus Disease
CPI Consumer Price Index
CPTPP Comprehensive and Progressive Agreement for Trans-Pacific Partnership
DB Defined Benefit
DEC Development Economics
EFI Equitable Growth Finance and Institutions
EMBI Emerging market Bond Index
EMDE Emerging Markets and Developing Countries
EU European Union
FDI Foreign Direct Investment
GDP Gross domestic product
GEP Global Economic Prospects
GFC Global Financial Crisis
GTAP Global Trade Analysis Project
GVC Global Value Chain
HIC High Income Country
ICT Information and Communications Technology
IMF International Monetary Fund
IPEF Indo-Pacific Economic Framework
IPO Initial Public Offers
Regions, World Bank Classification and Country Groups
EAP East Asia and Pacific
ECA Eastern Europe and Central Asia
Country/Economy Abbreviations
CHN China
FJI Fiji
FSM Federated States of Micronesia
HKG Hong Kong SAR, China
IDN Indonesia
JPN Japan
KHM Cambodia
KIR Kiribati
KOR Republic of Korea
LAO Lao People’s Democratic Republic
MNG Mongolia
MMR Myanmar
MYS Malaysia
NRU Nauru
LMIC Lower Middle Income Country
NCD Non-Communicable Disease
NDC Nationally Determined Contributions
NPL Nonperforming loans
OECD Organisation for Economic Co-operation and Development
pp Percentage point
PMI Purchasing Manager’s index
PPP Purchasing Power Parity
RCEP Regional Comprehensive Economic Partnership
RHS Right Hand Side
ROW Rest of the World
SME Small and Medium Enterprise
SOE State-Owned Enterprise
TFP Total Factor Productivity
TPP Trans-Pacific Partnership
UHC Universal Health Coverage
UMIC Upper Middle Income Country
VAT Value Added Tax
VAR Vector autoregression
WDI World Development Indicator
WEO World Economic Outlook
WDR World Development Report
WTO World Trade Organization
LAC Latin America and the Caribbean
MNA Middle East and North Africa
SAR South Asia
SSA Sub-Saharan Africa
PHL Philippines
PICs Pacific Island Countries
PLW Palau
PNG Papua New Guinea
RMI Republic of the Marshall Islands
SLB Solomon Islands
THA Thailand
TLS Timor-Leste
TON Tonga
TUV Tuvalu
TWN Taiwan, China
UK United Kingdom
USA United States
VNM Vietnam
VUT Vanuatu
WSM Samoa
Currency Units
B Thai baht
CR Cambodian riel
D Vietnamese dong
F$ Fiji dollar
K Myanmar kyat
K Papua New Guinea kina
Kip Lao kip
P Philippine peso
RM Malaysian ringgit
RMB Chinese renminbi
Rp Indonesian rupiah
SI$ Solomon Islands dollar
Tog Mongolian tugrik
US$ Timor-Leste (U.S. dollar)
US$ United States dollar
this report is a collective endeavor and involved several parts of the world Bank including the eaP, efI, Hd and sPJ.
It was prepared by a team led by ergys Islamaj and aaditya mattoo. other members of the team were, carter Brandon, Yu cao, maggie chen, caroline gerd g de roover, daisuke fukuzawa, shafaat Yar khan, duong trung le, Yusha li, andrew d mason, Veronica sonia montalva talledo, Philip o’keefe, agustin samano Penaloza, Jonathan timmis, Ikuko Uochi, and cecile wodon. Significant contributions to the report were made by Botir Baltabaev, Sebastian Eckardt, Pedro Miguel Gaspar Martins, Rafaela martinho Henriques, elitza mileva, gaurav nayyar, owen nie, robert Palacios, franz Ulrich ruch, kersten kevin stamm, and katherine anne stapleton.
we thank narita futoshi and chris Papageorgiou for sharing data on structural reforms. enkhzaya demid, Jun ge, and adam merican Bin mohd din helped extend data to latest available years. the following staff from the finance, competitiveness and Innovation Global Practice provided country-specific responses to the questionnaire on financial sector reforms in the region: abayomi a. alawode, salman alibhai, ratchada anantavrasilpa, soraya azhar, Botir Baltabaev, roselee shah Bin shaharudin, Yroen guaya Bontigao melgar, michael corlett, tim l. de Vaan, nicolo fraccaroli, Uzma khalil, calvin Zif koenig, dara lengkong, Putri monicha sari, and radu tatucu. the work was coordinated by tatiana didier, cecile thioro niang, and Zafer mustafaoglu.
manuela V. ferro provided valuable guidance and helpful comments. we are grateful for stimulating discussions and comments to ndiame diop, david gould, samuel christopher Hill, Young eun kim, Patrick alexander kirby, lars moller, rinku murgai, Zafer mustafaoglu, gaurav nayyar, cecile thioro niang, tobias Pfutze, carolyn turk, dina Umali-deininger, ekaterine t. Vashakmadze, mara warwick and Hassan Zaman; staff of the eaP region who participated in the review meetings on february 6 and march 1, 2023, and the eaP regional management team meeting on march 9, 2023. we greatly appreciate the support for dissemination provided by geetanjali chopra, mariana lucia de lama odria, mark felsenthal, Jerry kurniawan, and kym louise smithies.
the following staff from the macroeconomics, trade and investment global Practice and the Poverty and equity global Practice prepared country-specific macroeconomic outlook pages: Dwi Endah Abriningrum, Vishesh Agarwal, Tanida Arayavechkit, kiatipong ariyapruchya, mehwish ashraf, mahama samir Bandaogo, Undral Batmunkh, nadia Belhaj Hassine Belghith, andrew Blackman, Yew keat chong, Ibrahim saeed chowdhury, kevin c. chua, souleymane coulibaly, andrea coppola, kevin thomas garcia cruz, somneuk davading, Quang Hong doan, kim alan edwards, karen annette lazaro enriquez, david m gould, Indira Maulani Hapsari, Rashad Hasanov, Faya Hayati, Ahya Ihsan, Assyifa Szami Ilman, Taufik Indrakesuma, Wendy Karamba, demet kaya, Yusha li, sodeth ly, dorsati madani, kemoh mansaray, wael mansour, Pedro miguel gaspar martins, elitza mileva, Jacques morisset, thi da myint, darian naidoo, shohei nakamura, konesawang nghardsaysone, Hoang the nguyen, thu-Ha thi nguyen, ruth nikijuluw, samuel nursamsu, anthony obeyesekere, Yus medina Pakpahan, Utz Johann Pape, keomanivone Phimmahasay, ruslan Piontkivsky, sharon faye alariao Piza, warunthorn Puthong, ririn salwa Purnamasari, rong Qian, Habib rab, ratih dwi rahmadanti, thanapat reungsri, alief aulia rezza, anna robinson, sutirtha sinha roy, Jose luis diaz sanchez, apurva sanghi, shakira Binti teh sharifuddin, reshika singh, Bambang suharnoko sjahrir, lodewijk smets, katherine anne stapleton, ekaterine t. Vashakmadze, dung Viet do, Veronica sonia montalva talledo, sharad alan tandon, kathleen Victoria tedi, sailesh tiwari, kimsun tong, tuimasi radravu Ulu, Phonthanat Uruhamanon, ralph Van doorn, matthew wai-Poi, Ikuko Uochi, samuel wills, and Judy Yang. the work was managed by sebastian eckardt and lars christian moller for the macroeconomics, trade and investment global Practice, and by rinku murgai for the Poverty and equity global Practice. Benoit Philippe marcel campagne, alexander Haider, monika anna matyja, and kristina catherine tan mercado made contributions to the model, table production, and assisting staff with their forecasts. Yulita sari soepardjo and Yu shang provided technical support.
the report was edited and typeset by circle graphics, Inc., reisterstown, md
Throughout the report, geographic groupings are defined as follows:
Developing East Asia and Pacific comprises cambodia, china, Indonesia, lao People’s democratic republic (Pdr), malaysia, Mongolia, Myanmar, Papua New Guinea, the Philippines, Thailand, Timor-Leste, Vietnam, and the Pacific Island Countries.
the Pacific Island Countries comprise fiji, kiribati, the marshall Islands, the federated states of micronesia, nauru, Palau, samoa, the solomon Islands, tonga, tuvalu, and Vanuatu.
the ASEAN member countries comprise Brunei darussalam, cambodia, Indonesia, lao Pdr, malaysia, myanmar, the Philippines, singapore, thailand, and Vietnam.
the ASEAN-5 comprise Indonesia, malaysia, the Philippines, thailand, and Vietnam.
the analysis in this report is based on the latest country-level data available as of march 24, 2023.
Economic activity in most of developing East Asia and Pacific (EAP) has recovered from the recent shocks, with goods exports and private consumption leading the way. However, output remains below pre-pandemic levels in many of the Pacific Island Countries. Inflation remains higher than target ranges in some countries. Near-term growth will depend on: global growth, projected to be slower in 2023 than in 2022, though recent projections are more optimistic; commodity prices, which have moderated; and financial tightening, which is likely to continue in the face of inflationary pressures in the US.
Taking a longer view of the more than two decades since the Asian Financial Crisis (AFC), growth in the developing economies of East Asia and the Pacific has been faster and more stable than in much of the rest of the world. The result has been a striking decline in poverty and, in the last decade, also a decline in inequality. During both the Great Recession and the COVID pandemic, the economies of the region proved more resilient than most.
But it would be a mistake to let these achievements obscure vulnerabilities, past, present, and future. Looking back, sound macroeconomic management after the AFC was accompanied only to a limited extent by productivity-boosting structural reforms. The convergence of the EAP countries with high-income countries, which was previously faster than in other emerging market and developing economies, has recently stalled. Now, the damage done by the pandemic, war, and financial tightening to people, firms, and governments, threatens to reduce growth and increase inequality. The region must cope with these problems even as it faces up to the major challenges of de-globalization, aging and climate change, to which it is particularly susceptible because it has thrived through trade, is growing old fast, and is both a victim of and contributor to climate change.
Four types of policy action are necessary.
• Macro-financial reforms to support recovery today and inclusive growth tomorrow.
• Structural reforms to boost innovation and productivity across the economy.
• Climate-related reforms to enhance resilience through efficient adaptation.
• International cooperation on climate mitigation, and to ensure openness to trade, investment, and technology flows, ideally multilaterally, but also regionally and bilaterally.
Most major economies in developing East Asia and Pacific (EAP) have recovered from recent shocks and are growing. However, output remains below pre-pandemic levels in most of the Pacific Island Countries (figure O1).
Figure O1. Most major EAP economies have recovered and are growing, but output in most Pacific Island Countries is still not back to pre-pandemic levels
Growth in the region has been driven primarily by strong private consumption and goods exports. But now there are signs of weakening domestic and foreign demand (figure O2).
At the same time, macroeconomic policy was becoming less expansionary in most EAP countries. While China provided significant fiscal stimulus in 2022, fiscal support in other countries was diminishing. Even though interest rates were lower in EAP than in other emerging markets and developing economies (EMDEs), they have recently been increasing (figure O3).
Figure O2. Domestic demand is moderating and goods exports are declining
A. Retail sales (year-on-year growth)
B. Goods exports (index)
China Indonesia Malaysia Philippines Thailand Vietnam
China Indonesia Malaysia Philippines Thailand Vietnam
World excluding EAP
Source: Haver Analytics.
Note: A. Philippines refers to auto sales. B. Goods export value indexed to 2019 average, seasonally adjusted, 3 month moving average.
Figure O3. Most governments have had less expansionary fiscal policy, and began to tighten monetary policy, in 2022
Source: Haver Analytics; World Economic Outlook Database, October 2022.
Note: B. Figure shows average policy rates in the region. AE: Advanced Economies, EAP: East Asia and Pacific, EMDE: Emerging Markets and Developing Economies.
Three linked international developments are likely to shape external conditions for EAP economies. First, global growth in 2023 is projected to be slower than in 2022, even though recent projections have become more optimistic (figure O4). The likely slowdown in growth in advanced economies may be partially offset by signs of revival in China’s growth. Second, commodity prices have moderated recently, resulting in declining food and energy prices in several EAP countries. Finally, the continued inflationary pressures in the US are leading to tighter financial conditions not only in the US, but also in the EAP region. To address these inflationary pressures, some countries in the region have raised domestic interest rates, which helped ease capital outflows and depreciation. However, further tightening in advanced economies could renew financial pressures in the region’s economies.
Figure O4. Global growth in 2023 is projected to be slower than in 2022 which, along with monetary tightening, will affect growth in the region
The countries in the East Asia and Pacific region have experienced two decades of faster and less volatile growth than other economies. During this period, all EAP transitioned to lower or upper middle-income status (figure O5). Behind the stable growth after the Asian Financial Crisis (AFC), was sound macroeconomic management and a history of significant structural reforms. After the AFC, the region saw only limited structural reforms and therefore little productivity-enhancing structural change. In particular, a region that thrived through openness to trade and investment in manufacturing, remained reluctant to liberalize its services sectors.
However, the developing EAP catch-up with higher income countries has now stalled. After the Global Financial Crisis and in recent years, convergence has been statistically insignificant (figure O6). At the same time, productivity growth of many EAP economies has been declining (figure O7). The limited growth in labor productivity had been driven more by capital deepening than total factor productivity growth.
Figure O5. EAP countries have seen two decades of higher and less volatile growth than other economies, and all have transitioned either to lower or upper middle-income status
A. GDP growth and growth volatility
B. Income group mobility
Source: Penn World Tables; World Development Indicators.
Note: A. Bar height shows average annual growth rate; whiskers show average standard deviation. EAP: East Asia and Pacific, EMDE: Emerging Markets and Developing Economies. B. East Asia and Pacific countries represented by red dots. GNI: Gross National income. LMIC = Lower Middle-Income class, UMIC = Upper Middle-Income class.
Figure O6. EAP convergence with high income countries, which was faster than in other countries, has recently stalled
A. Convergence coefficient for rest of the world
B. Convergence coefficient for EAP economies
Source: World Development Indicators.
Note: GDP per capita in PPP. The sample of countries used was restrained to those whose population is larger than one million people. Also, oil-rich countries were excluded.
These trends in growth and productivity have coincided with a shift in the pattern of structural change. At different stages between the 1950s and the late 1990s, the economies in the EAP region saw significant growth in manufacturing. However, between the Asian Financial Crisis and the Global Financial Crisis, the share of manufacturing in GDP peaked and began to decline in the early industrializers. Stillindustrializing Cambodia and Vietnam were the exceptions to this trend (figure O8).
The sectoral reallocation of labor underlying this pattern of structural change has not so far favored productivity growth. In Malaysia, Thailand, Indonesia and China, the shift of labor out of agriculture slowed down after the early 2000s, and workers primarily moved not into high productivity manufacturing and business services but into relatively low productivity trade and construction services. The fact that some of the latter services activities were associated with lower productivity in the recent period may reflect the “informalization” and overcrowding of these sectors as they accommodated rural-urban migrants. In Cambodia, Vietnam, and until recently, Myanmar, which are still industrializing, movement out of agriculture was accelerating and oriented towards relatively high productivity manufacturing and services (figure O9).
The shift from manufacturing to services need not, however, be antithetical to productivity growth in future. The digital revolution, which received a boost during the pandemic, is transforming services sectors. More services are becoming internationally tradable and the emergence of digital platforms is transforming even domestic services from retail and finance to transport
Figure O8. In recent years, the share of manufacturing in GDP declined in major EAP economies (other than Cambodia and Vietnam), and of services in GDP increased
Source: GGDC/UNU-WIDER Economic Transformation Database (Kruse et al., 2022); GGDC 10-Sector Database.
Note: Figure shows sectoral share in total value-added. Other EMDE shows 25–75 percentile of 20 major Emerging market and Developing Economies outside EAP.
Figure O7. And productivity growth has been decliningFigure O9. In major countries, workers moved mostly from least productive agriculture to below-average productivity services sectors, and not much to the most productive manufacturing and services sectors
A. Group A: EAP countries where increase in manufacturing employment stalled (China, Thailand, Malaysia, Indonesia)
1976–1990
1990–2004
2004–2018
B. Group B: EAP countries where workers were continuing to move to more productive manufacturing and services sectors (Vietnam, Cambodia, and Myanmar) 1990–2004
2004–2018
and tourism. These changes are contributing to increased productivity in services (figure O10). However, it is not yet clear though whether these changes will lead to an increase in employment not just of the skilled workers but of those with intermediate skills who benefitted enormously from export-led industrialization.
In any case, unleashing new technologies requires market-friendly reforms. EAP economies implemented significant structural reforms, beginning in the early 1980s until the early 2000s. The reforms were broad-based and covered multiple sectors such as manufacturing trade, domestic finance, and product markets, and contributed to per-capita income growth in the region’s economies (figure O11).
However, the pace of reforms slowed down in most countries after the early 2000s. To an extent, the slowing reform was a consequence of significant prior liberalization that left limited room for further reforms, especially the political difficult “last mile” improvements in policy. Nevertheless, the latest available data across all reform areas suggest that there are still sizeable gaps in reforms of developing EAP countries relative to a sample of advanced economies, especially in the services sectors that are vital for future growth (figure O12).
Deeper reforms, more pro-active management and international cooperation are needed especially because the world and the region are changing in ways that pose new challenges to growth. First, a region that reaped enormous benefits from trading in a relatively open, integrated global market governed by predictable trade rules, must now contend with protectionism, trade divisions and policy uncertainty. Second, the regions’ previously youthful population is now aging rapidly, affecting labor endowments, pension burdens, and health care needs. Third, the region’s fossil fuel-driven growth in a world that was slow to respond to the dangers of climate change, is now threatened by the consequences of global warming, and countries must invest in adaption while contributing to mitigate.
The most immediate challenge for the region is the growing division between its two largest markets. On the face of it, the restrictions on bilateral trade imposed by the US and China could divert trade to third country competitors. However, at least four deeper problems are emerging.
• Politics, rather than economic fundamentals and predictable rules, are molding trade patterns and the resulting uncertainty could discourage investment in other countries.
Figure O10. The adoption of digital technologies is likely to increase productivity in servicesFigure O12. Countries need to address the significant “reform gap” between EAP and advanced economies
• Divergent standards, such as in the differing approach to data flows across locations, could segment markets and prevent third countries from exploiting economies of scale in an integrated global market.
• Export restrictions on ultimate destination, as well as import restrictions on ultimate source, can disrupt GVCs and third country trade.
• Perhaps most seriously, bilateral restrictions on technology flows and collaboration between large countries could reduce the global availability of knowledge.
The increase in bilateral protection is affecting other economies either through trade diversion towards producers of substitute products or through production linkages with suppliers of inputs and complementary products. While China experienced more than a 4-percentage-point decrease in its share of US imports during 2018–2022, with the largest decline in the electronics industry, economies such as Vietnam, Thailand, and Indonesia increased their share of US imports, also particularly in the electronics industry. In contrast, Japan, which has GVC production linkages with both the US and China, saw a slight drop in its share of US imports (figure O13).
Figure O13. Exports of some EAP economies to the US and China increased after they imposition of trade restrictions on each other
A. Changes in share of US imports, 2018–2022
B. Changes in share of China imports, 2018–2022
Source: Customs data from the US and China.
Note: Figure shows sectoral decomposition of changes in the economy’s share of respective imports during 2018–2022.
Potentially more important than the impact on trade may be the impact on knowledge. Bilateral restrictions on technology flows and collaboration between large countries could reduce the global availability of knowledge. Initial firm-level evidence suggests adverse effects of recent restrictions on firms in both China and the US (figure O14).
What happens to both Chinese and US innovation matters for other countries in the region. Innovation builds on prior knowledge and backward citations in patents can reflect which sources of prior knowledge are important. While still small
Figure O14. Measures taken after 2018 adversely affected innovation of Chinese firms which had prior collaborations with the US, and of US firms which had prior collaborations with China
Source: Patent applications at EPO, WIPO and USPTO.
Note: Event study plots of the patent applications of US (Chinese) firms with collaborations before 2018 with inventors in China (US).
compared to the advanced economies like the US, China has become an increasingly important source of knowledge for innovation in other EAP countries, using these citation measures. By 2014–2019, China reflected around 10 percent of the prior knowledge used for Singapore or Thailand innovation (figure O15).
How should third countries respond to these developments? A priority should be a reform of their own policies, discussed above, which can enhance their incomes in all states of the world (April 2022 EAP Economic Update (World Bank 2022c)). International agreements can also help. Economic theory suggests that third countries benefit from being “hubs” rather than either “spokes” or members of exclusive trade blocs. That is, a country like Malaysia is better off having trade agreements with both China and the US rather than being left out of any agreement or being part of an exclusive trade bloc. RCEP has helped deepen much of the regions’ integration with China; the CPTPP was meant to but failed to achieve integration with the United States and the proposed Indo-Pacific Economic Framework (IPEF) is not meant to be a traditional trade agreement. Empirical analysis suggests that RCEP and the CPTPP together could more than offset global losses due to the US-China trade war, but not the individual losses of China and the United States, which risk becoming “spokes” because of the growing economic distance between them (figure O16).

The EAP region is also facing the economic challenge of aging faster and at lower levels of income than the currently richer and older OECD and ECA countries. The transition from aging to aged societies (i.e., from reaching 7% of total population 65+ to 14% in that cohort) is taking only 20–25 years for most East and Southeast Asian countries, in contrast to 50–100+ years in those other countries. EAP countries are also becoming aged societies at far lower income levels than their OECD counterparts, with PPP per capita GDP at peak working age shares between 10 and 40% of the level of the United States at the same point in demographic transition (figure O17).
 Figure O15. The US and, increasingly, China are important sources of knowledge for other East Asia and Pacific countries
Source: World Bank staff’s illustration.
Figure O15. The US and, increasingly, China are important sources of knowledge for other East Asia and Pacific countries
Source: World Bank staff’s illustration.
Figure O16. The adverse effects of a trade and technological rift between large countries can be reduced by third countries forming (separate) trade agreements that ideally include each large country
A. Business as before
B. Under sustained trade war
Source: Drawing on Petri and Plummer (2020).
Note: Bars depict changes in global income (billion US$) by 2030. “Business as before” assumes a return to a pre-trade war path. “Sustained trade war” assumes path defined by post-phase one tariffs. Bars show incremental effects of adding each policy to all previous policies. The policy denoted “India” involves adding India to the RCEP15 agreement to form RCEP16. CPTPP: Comprehensive and Progressive Agreement for TransPacific Partnership. RCEP: Regional Comprehensive Economic Partnership.
Figure O17. EAP countries are aging faster than rich countries did, and the working age population will peak at lower levels of income per capita
A. Transition from aging to aged societies (i.e., from population 65+ reaching 7% to 14% of total)
B. GDP per capita at peak working age population relative to US
Source: UN Population projections, 2022, medium fertility variant.
Note: A. Bars denote years realized or projected for the 65+ share of population to go from 7% to 14% of total population. B. Bars denote realized or projected GDP per capita relative to the US when working age population (15–65 cohort) reaches peak.
Aging
Population aging may impact economic growth through the decline in the share of the working age population (typically defined as the population age 15–64; figure O18). However, measures to encourage and help older people work could lessen the adverse impact.
Figure O18. Aging could reduce the share of the conventional “working age” population, unless older people (especially women) continue to work
A. Change in population share of people aged 15–64
B. Significant proportions of older people in EAP are still working
Population aging could also strain fiscal balances on both the revenue and expenditure sides. On the expenditure side, the pressures on public finances will come from rising pension costs, health and long-term care spending, with the first the most pronounced. On the revenue side, the declining size of working age population will shrink the contribution base from which pension, unemployment, and health insurance systems are financed in several major economies in the region. A solution is to increase current contribution rates and bring them closer to actuarially fair rates (figure O19).
Figure O19. Aging will increase spending on pensions, and requires bridging the gap between actual and actuarially fair contribution rates
A. Incremental annual pension spending, 2014 vs 2050
B. Actual vs. actuarially fair contribution rates in contributory DB schemes
Aging is also likely to drive up health and aged-care spending over time, but the public spending impacts are likely to be more modest, as aging is a less significant driver of healthcare costs. But aging populations with higher non-communicable disease (NCD) prevalence and higher co-morbidities will accelerate the epidemiological transition. Structural reforms in the health sector will be needed to better prevent, control and manage NCDs across the lifecycle.
The EAP region is particularly exposed to climate risks, in part because of the high density of population and economic activity along the coasts. More than half of the annual losses from natural disasters worldwide occur in EAP (figure O20). Without major adaptation efforts, coastal, river, and chronic flooding alone could lead to GDP losses of 5–20 percent by 2100 in Indonesia, Vietnam, the Philippines, and China. Climate impacts are most pronounced across the PICs, where natural disasters are estimated to already cost the region over 2 percent of GDP every year and sea level rise is likely to threaten the existence of entire low-lying atoll island nations (Kiribati, Marshall Islands and Tuvalu).
Climate Risk Index Ranking (1999–2019)
The first pillar of climate adaptation is risk reduction, such as ex ante investments in infrastructure and agriculture, and policies to reduce risk such as regulating against construction in flood-prone areas and protecting nature that stabilizes hillsides and protect cities from storm surges. The second pillar are measures to manage risk, ranging from early warning systems to sovereign risk insurance and social safety nets. Inherent in how governments assess these options is incorporating measures to incentivize private sector cost-sharing to the extent possible.
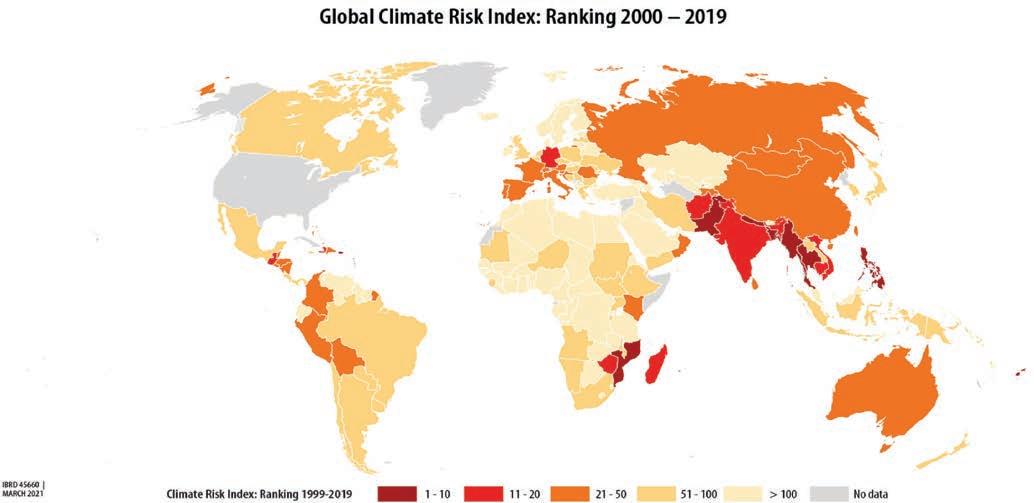 Figure O20. EAP countries are highly exposed to climate change impacts
Globally and in EAP, there is under-investment in climate adaptation. Recent more detailed analysis of a range of adaptation investments shows that the returns on investment in adaptation can be much greater than simply the avoided losses. This analysis, referred to as the triple dividends, uses cost-benefit analysis (CBA) to properly estimate avoided losses (first dividend), induced economic or development benefits (second dividend), and additional social and environmental benefits (third dividend) of adaptation actions (figure O21).
Investing in Adaptation Yields:
Avoided Losses
Induced Economic Benefits
Early warning systems save lives and assets and are worth at least 10 times their cost.
Climate-resilient new infrastructure typically adds 3% to upfront costs but has benefit-cost ratios of 4:1
Reduced flood risks lower financial costs, increase security, and help induce high-value investment in cities.
The Thames barrier induced development of Canary Wharf and East London
Drip irrigation increases yields as well as reduces drought risk.
Social and Environmental Bene
= Triple Dividend
Nature-based flood protection also increases biodiversity, makes air and water cleaner, offers recreation, and improves health.
Mangrove protection and restoration abate coastal surges, support local fisheries and forestry, and store carbon Combined benefits are up to 10 times greater than the costs
Empirical analysis of adaptation investments shows that each dividend is often significant. Recent analysis of seven different projects targeting different categories of climate change impacts — forests and wildfires, urban flooding and drainage, stormwater management, coastal flooding, urban heat islands, and drought — shows that in all cases, valuing the three dividend types makes a significant difference in assessing total project benefits (table O1).
Table O1. Valuing the triple dividend reveals the high returns to investment in different adaptation projects
Forests and wild fires
Tahoe National Forest (United States)
Source: World Resources Institute, 2022.
Urban flooding and drainage
Kunshan Forest Park (China)
Stormwater management
Princes Park (Australia)
Coastal flooding
Felix stowe (United Kingdom)
Urban heat islands (Two U.S. cities in one study) Drought
Washington, DC Philadelphia Ningxia (China)
Figure O21. Investing in adaptation will deliver a triple dividendAt the sector and macro levels, the benefits of adaptation investments are clear. For example, in Samoa , investing an additional 2 percent of GDP in adaptation for the next five years would save about 4.5 percent of 2021 GDP in output losses. In the Philippines, all sectors would benefit from climate adaptation measures: investments of less than 1% of GDP would avoid losses of 1–2% of GDP in many sectors (figure O22).
While decoupling, aging and climate change can reduce potential growth, structural reforms and climate adaptation can offset the adverse imp act. Policies that foster competition and allow for the mobility of labor and capital across different sectors could lead to productivity gains. Similarly, policies that reduce trade costs and improve the efficiency of financial and capital markets could stimulate investment and capital formation. Implementing such policies, under reasonable assumptions, could increase potential GDP growth by 0.15 percentage point annually. Increasing labor force participation could add another 0.28 percentage point annually to potential growth. Moreover, adapting to climate change could mitigate the adverse impacts of climate change on total factor productivity growth and add another 0.1 percentage point per year to potential GDP growth over the next decade (figure O23).
Figure O23. Aging, deglobalization and climate change can reduce potential growth, but reforms can offset the impact
excluding China
Economic activity in developing East Asia and Pacific (EAP) is recovering gradually. China’s economy grew by only 3 percent in 2022, much slower than the 8.4 percent rebound in 2021, because COVID-related public health measures and weakness in the housing sector dampened economic activity. The rest of the region grew at an estimated 5.8 percent, up from 2.6 percent in 2021, supported by buoyant domestic and external demand (figure 1A). However, recent high-frequency indicators suggest that growth momentum may be slowing, with weakening foreign demand for goods and moderating retail sales (figure 1B). Economic activity remained subdued in the Pacific Islands for most of 2022 because of delayed border reopening and the impact of natural disasters in some countries.
While output has surpassed pre-pandemic levels in most of the larger EAP economies, recovery has been uneven across the region. Output in China and Vietnam had already exceeded pre-pandemic levels in 2020 and is now about 15 percent higher. By the end of 2022, Cambodia, Indonesia, Lao PDR Malaysia, Mongolia, the Philippines, and three Pacific Island countries (Nauru, Kiribati, and Papua New Guinea) had also exceeded pre-pandemic levels of output. But output remains below pre-pandemic levels in several Pacific Island countries as well as in Myanmar, Thailand and Timor-Leste (figure 2).
The recovery has also been uneven across sectors. Information and communication technology, finance and agriculture have experienced relatively strong growth. However, output in transportation, accommodation and catering sectors in the Philippines and Thailand, and construction and real estate in Malaysia and Philippines, is still well below pre-pandemic levels (figure 3). Most recently, services sector has started to recover, benefitting from the release of pent-up demand amid economic reopening.
Consumer price inflation (CPI) rose markedly during 2022 in most EAP economies, driven by rising energy and food prices, as well as idiosyncratic factors. Core and nominal CPI inflation have surpassed central banks’ target ranges
in most major EAP economies (figure 4). While inflation has recently peaked in several economies, it continues to rise in the Philippines and Vietnam, and remains high in Lao PDR, Mongolia, and Myanmar.
China’s pace of poverty reduction slowed down in 2022 because growth was slower (figure 5). In the rest of the region, the rate of poverty reduction has been moderate. Even though economic growth in 2022 was higher than expected but so was inflation, raising concerns about the prospects of poverty reduction in the region. Overall, 12 million people in the region are expected to escape poverty between 2022 and 2023 at the lower-middle income class poverty line (US$3.65/day, 2017 PPP), whereas 36 million people are projected to escape poverty at the upper-middle income class poverty line (US6.85/ day, 2017 PPP).
Figure 2. But output remains below pre-pandemic levels in most of the Pacific Island CountriesFigure 4. Inflation remains high and higher than target ranges in several countries
A. CPI inflation (year on year)
B. Inflation
Source: Haver Analytics, World Bank.
Note: B. Latest available (Feb 2023: China, Fiji, Indonesia, Lao PDR, Mongolia, Philippines, Thailand, Vietnam; Jan 2023: Cambodia, Malaysia; July 2022: Myanmar). Target refers to Central Bank target for each country. Malaysia’s target shows Central Bank forecast of 2023 inflation.
Figure 5. The number of poor in developing EAP countries is expected to decline in 2023
A. Lower middle-income poverty line ($3.65 per day in 2017PPP)
B. Upper middle-income poverty line ($6.85 per day in 2017PPP)
Source: World Bank staff’s estimations. Poverty estimates are based on growth forecasts, population projections, and historical growth elasticities of poverty.
Note: Forecasts are based on GDP growth projections as of March 21, 2023. US$3.65 per-person-per-day and US$6.85 per-person-per-day poverty lines (2017PPP) represent the typical value of poverty lines found in lower-middle-income and upper-middle-income countries, respectively.
In 2022, three broad factors influenced economic growth in EAP countries: COVID-19 containment measures, external conditions, and the capacity of the government to provide support. China’s economic activity was hampered by strict public health measures, while infections and border restrictions constrained activity in several Pacific Island economies. In most major EAP economies, the unexpectedly strong recovery of private consumption and sustained demand for EAP exports of manufactured goods and commodities fueled growth. Although tourism supported growth in countries like Thailand, the Philippines and many Pacific Islands, it still remained below pre-pandemic levels across EAP countries by the end of 2022. Governments’ ability to provide continued policy support varied, with some becoming increasingly constrained by rising debt. Monetary policy remained supportive for most of the year, but rates have risen in recent months (figure 6).
Private consumption rebounded fast in the first three quarters of 2022 as most countries in the region lifted Covidrelated restrictions. Driven by the rebound in private consumption, retail sales experienced strong recovery. However, recent data shows that retail sales have moderated in many EAP economies, indicating less buoyant domestic demand (figure 7). The moderation in retail sales may be attributed to a number of factors, notably a negative income effect from the recent surge in inflation which reduced consumers’ purchasing power and from weakening foreign demand for EAP exports.
Foreign demand for manufactured goods and commodities in EAP countries has been a major driver of growth in the region. However, there are now signs that this demand is weakening, as reflected in the decline in goods trade. Exports have fallen by more than 20 percent from their peak in the second quarter of 2022 in Indonesia, Malaysia, China, and Vietnam (figure 8A). The decline is due to a slowdown in global economic growth and weakened demand from major trading partners. High-frequency measures, such as the new export orders PMI, suggest that the slowing down of goods trade is likely to continue (figure 8B).
An ongoing revival of tourism has helped services exports in the Philippines, Thailand and many Pacific Island countries
Figure 7. But consumer demand is now moderating
Retail sales (year-on-year growth)
(figure 9A). But tourist arrivals are still only about 50 percent of what they were before the pandemic in most EAP economies. The recent reopening of China’s borders is expected to accelerate the recovery of tourism (figure 9B).
As the Covid-19 situation stabilized and economic activity resumed, governments in the region cut expenditure on support programs implemented during the pandemic. This decrease in support is leading to a decline in disposable income of
Figure 9. . . . even as services exports and tourism revive
households and firms, which could dampen consumption and investment. Except for China, most major economies in the region are estimated to have a lower structural balance in 2022 compared to the previous year (figure 10).
As inflation continues to be a concern for policymakers, policy interest rates have been raised globally and in the EAP region. However, policy rates in the EAP region remain lower than in other EMDEs, and the rise in policy rates was milder (figure 11).
Economic performance in the regions was affected by growth in the US and China, commodity prices, and financial conditions in advanced economies. Strong growth in the US, helped by generous fiscal support in the aftermath of Covid-19, helped boost economic growth in the EAP region since 2021, although the effect waned as US growth moderated in late 2022. While China’s economic recovery in early 2021 benefitted the region’s economies, its continued public health restrictions resulted in lower growth in 2022 in China and in the region. Tightened US monetary policy also appears to have negatively affected the region. While higher oil prices negative affected growth in oil importing economies such as the Philippines and Thailand, they helped support growth in economies such as Indonesia and Malaysia (figure 12).
Source: Haver Analytics.
Note: Figure shows average policy rates in the region. EAP: East Asia and Pacific, EMDE: Emerging Markets and Developing Economies, AE: Advanced Economies.
Source: Haver Analytics; World Bank staff’s estimates.
Note: The bars represent average of historical decomposition of each shock, estimated using a Bayesian structural vector autoregression (SVAR) model with stochastic volatility, as a deviation from a longer-run average. The model for each EAP country includes the following variables: US monetary policy reaction shock, US real GDP growth, China real GDP growth, commodity weighted prices for recipient country, recipient country real GDP growth, and recipient country exchange rate to the US dollar. EAP countries included in the estimation are Indonesia, Malaysia, the Philippines, and Thailand. The models are estimated from 2000Q1 to 2022Q4, except in Malaysia which starts in 2005Q1. The US monetary policy shock is based on Arteta, Kamin, and Ruch (2022) and captures changes in investors assessments that the Federal Reserve’s reaction function has become more hawkish.
Slowing global growth, high commodity prices and financial tightening in advanced economies will continue to affect the region’s economies both through real and financial channels in 2023 (figure 13).
Global growth prospects have improved in recent months, aided by the reopening of the Chinese economy and strong services recovery in many economies. Manufacturing surveys for several major economies continue to indicate declining activity, but at a slower pace than previously. Forecasts for global growth in 2023 have been revised upwards, reflecting betterthan-expected growth in the United States and Euro area in 2022Q4 and an overall improvement in global sentiment (figure 14).
China and the US are a significant a source of final demand for the countries in the region. Figure 15 shows how much economic activity in an EAP country is exposed to shocks to domestic demand in specific foreign countries. China’s importance as an ultimate destination has been growing and is now comparable to that of the US: about one-tenth of value added in Lao PDR, Malaysia, Myanmar, Thailand, and Vietnam is ultimately absorbed in China.
Figure 14. Global growth in 2023 is projected to be slower than in 2022 but prospects have recently improved relative to previous projections
Source: Haver Analytics, International Monetary Fund, World Bank.
Note: A. WEO: World Economic Outlook; GEP: Global Economic Prospects. B. China’s PMI reports official PMI. Global PMI reports JP Morgan/S&P Global PMI 50+ = expansion.
Domestic value-added content of gross exports
Source: OECD Trade in Value Added database.
Note: The chart plots the domestic value-added content of gross exports by major ultimate destinations. This measure includes direct and indirect value-added exports to a specific country, net of the value of imported inputs and exports to the country that are headed for other countries positioned downstream.
Commodity prices soared following Russia’s invasion of Ukraine, squeezing Asia’s energy importers early last year. At the same time, soaring shipping costs raised the cost of imported goods, with particularly strong impacts on the Pacific Island Countries. But more recently, steady declines in both these factors have taken pressure off current accounts and inflation (figure 16).
In early January, energy prices declined by nearly 9 percent (month to month) for several reasons (World Bank Prospects Group Global Monthly, January 2023). Warmer-than-expected weather in Europe and the United States contributed to a more than 40 percent (month to month) decline in natural gas prices. Reflecting easing concerns about energy shortages, coal prices also declined. Oil prices futures have decreased recently, showing that investors believe that oil prices will not be much higher than the current level for the rest of 2023 (figure 17). In contrast, reflecting improved market sentiment following signs of a stronger than anticipated recovery in China, metal prices increased by 6 percent in January (m/m). Agricultural commodity prices remained broadly stable in January, on average. Nevertheless, uncertainty remains high as the war in Ukraine continues and the impact of the imposition of a price cap on Russian oil products is not yet clear.
Food prices increased considerably across the region’s economies in the past year. While they have moderated somewhat in several countries reflecting the decline in commodity prices, food prices have risen in recent months in the Philippines, Thailand, and Vietnam (figure 18).
In 2022, policymakers started reacting to increased inflation by increasing policy interest rates both globally and in the EAP region. This led to tighter financial conditions across advanced and developing economies. Despite an increasing trend, policy rates in the EAP region remain lower than in other EMDEs, but higher than in advanced economies (figure 19).
Financial conditions eased somewhat in early 2023, amidst signs of a slowdown in inflation in major economies. But recently released data show that the US labor market remains strong. Headline, core and producer price inflation in the US declined only slightly in January (6.4 percent, 5.6 percent and 6 percent (y/y), respectively) and less than expected by markets. This muted deceleration in prices led to increased expectations for the Federal Reserve’s policy rate, which is now expected to peak between 5.25 and 5.5 percent in mid-2023 (figure 20).
Figure 18. Food and energy prices are beginning to ease in most EAP economies, but global price increases could revive inflationary pressures
CPI inflation (year-on-year)
China Indonesia Malaysia Philippines Thailand Vietnam
Food & Beverage Housing & furnishing Transport & communication Others CPI
Figure 19. Continued high inflation in the US is leading to further financial tightening in the US as well as the EAP region
Recent easing of financing conditions combined with interest rate hikes by central banks in the region as they tackle above-target inflation have helped Asian currencies rebound, with most erasing about half of last year’s losses, which has eased pressure on domestic prices (figure 21). But further increases in US interest rates will renew depreciation pressures in economies with a more constrained fiscal and monetary space, which could hurt economic activity.
A growth shock originating in China or the US would impact EAP economies through bilateral trade and financial flows, including foreign direct investment (FDI). Changes in growth in the US or China could also impact regional economies by affecting confidence and hence domestic consumption and investment. An unexpected one-off rise in US (China’s) GDP growth rate of 1 percentage point would increase growth rate in the other developing EAP countries, on average, by an estimated 0.5 (0.3) percentage points in the next year (figure 22). Mongolia, the Solomon Islands, Lao PDR, and Myanmar are especially exposed to China as a destination for exports and as a source of FDI. Unanticipated shocks to US monetary policy would also affect growth; a 25 basis points increase would lower growth by an estimated 0.5 percentage points. Shocks to commodity prices would differ in effect on commodity-exporting and commodity-importing economies and the net effect for the region remains ambiguous (Box 1).
GFC (2008) Taper tantrum (2013)
China deleverage (2015) Covid (2020) Fed tightening (2022)
Figure 20. Expectation of interest rate stays elevated until the end of 2023Growth in the EAP region is projected to accelerate from 3.5 percent in 2022 to 5.1 percent in 2023, about 0.5 percentage points higher than was expected in October 2022. The higher growth is mostly due to China, where activity is projected to rebound sharply to 5.1 percent in 2023, from 3 percent in 2022, following the economy’s swift reopening. Growth in the rest of the region is projected to slow to 4.9 percent in 2023 from 5.8 percent in 2022, and down from 5 percent projected in October 2022 (table 1; figure 23). While domestic demand is expected to remain the primary driver of growth, high inflation is likely to dampen private consumption. Additionally, high household debt in some EAP countries could exacerbate the impact of high interest rates, increase financial burdens, and further weigh on consumption. Private investment growth is also expected to be tempered by the high interest rate environment and uncertainty from external headwinds. Contributions from exports are expected to decrease due to the moderation in global growth resulting in a slowdown in external demand.
Impact of 1 pp shock in China and US growth, 25 bps increase in US 2-year yield, and 10 percent increase in commodity prices
Source:
Note: Bar show impact of the
increase in US 2-year
a
estimated
that includes the following variables: US monetary policy reaction shock, U.S real GDP growth, China real GDP growth, commodity weighted prices for recipient country, recipient country real GDP growth, and recipient country exchange rate to the US dollar. EAP countries included in the estimation are Indonesia, Malaysia, the Philippines, and Thailand. The models are estimated from 2000Q1 to 2022Q4, except in Malaysia which starts in 2005Q1. The US monetary policy shock is based on Arteta, Kamin, and Ruch (2022) and captures changes in investors assessments that the Federal Reserve’s reaction function has become more hawkish.
The Bayesian VAR model used to decompose EAP output growth is based on World Bank (2016). The models for Indonesia, Malaysia, Philippines, and Thailand include the following variables: the US monetary policy reaction shock identified in Arteta, Kamin, and Ruch (2022), U.S real GDP growth, China real GDP growth, export-weighted commodity prices for recipient country, recipient country real GDP growth, and recipient country US dollar exchange rate. For China, the model includes the US monetary policy reaction shock, US real GDP growth, China real GDP growth, China’s export-weighted commodity prices, and China’s exchange rate to the US dollar. The models are estimated from 2000Q1 to 2022Q4, except in Malaysia for which data starts in 2005Q1 (figure B1.1).
Since the period under review includes the COVID-19 crisis, whose unprecedented nature and size present possible modeling challenges, the model includes stochastic volatility. Stochastic volatility in the error structure is modelled as in Jacquier, Polson, and Rossi (1994) and a generic version of what is suggested in Lenza and Primiceri (2022).1
1 The model is estimated using Bayesian techniques and the Minnesota prior with hyperparameters on the first lag coefficients at 0.8, on overall tightness at 0.1, on lag decay at 1.2, on the exogenous variable tightness at 100, and cross-variable weighting at 0.9. A total of 30,000 iterations are run, with the first 5000 discarded and only every 5th iteration kept. The model includes 4 lags. The prior mean on the residual variance (i.e. stochastic volatility) is 0 and the prior’s variance is 10000.
Figure 22. Growth in the region in 2023 will be influenced by global growth and monetary tighteningWorld Bank staff’s.
following shocks: one percentage point increase in China and US growth, 25 bps
interest rate yield, and 10 percent increase in commodity prices. Effects
using
structural Bayesian VAR model
(Box 1. continued)
A. Impact of a 25 basis point reaction shock on EAP real GDP (peak response)
B. Impact of a 1 percentage point US GDP shock on EAP real GDP (peak response)
C. Impact of a 1 percentage point China GDP shock on EAP real GDP (peak response)
D. Impact of a 10% Commodity price shock on EAP real GDP (peak response)
Source: World Bank; World Bank estimates and projections.
Note: Percent growth of GDP at market prices. Values for 2022 for the small island economies refer to GDP growth estimates. ASEAN-5 comprises Indonesia, Thailand, the Philippines, Malaysia, and Vietnam. Values for Timor-Leste represent non-oil GDP. For the following countries, values correspond to the fiscal year: Federal states of Micronesia, Palau, and Republic of the Marshall Islands (October 1–September 30); Nauru, Samoa, and Tonga (July 1–June 30). Myanmar growth rates refer to the fiscal year from October to September.
The forecast assum es a pro-grow th alignment of public health, regulatory, and macroeconomic policy in China, but recognizes that policy makers face difficult tradeoffs between reviving near term growth and ensuring that longer-term growth is inclusive, stable and sustainable (Box 2). Monetary policy in China is expected to be supportive, but less so that in 2022. Fiscal policy is also expected to be expansionary but to a lesser extent in 2023 than 2022. In the rest of the region, the outlook assumes continued but more modest fiscal consolidation and further monetary policy tightening.
Thailand and Mongolia are expected to benefit more from China’s reopening because of their dependence on China for tourism and exports, respectively. Thailand’s growth will increase to 3.6 percent in 2023 from 2.6 percent in 2022, driven by the strong pent-up demand in China. In Mongolia, a rapid recovery in mining production resulting from the removal of border frictions, some decline in coal inventories, and the commencement of the Oyu Tolgoi underground mining stage is expected to accelerate the economic growth to 5.2 percent in 2023 from 4.7 percent in 2022. Recovery in tourism is expected to boost growth in other tourism-dependent countries such as the Philippines and several Pacific Island countries (Box 3).
China’s policy documents, including the Government Work Plan for 2023, have highlighted increasingly wider policy objectives, emphasizing economic growth alongside a range of economic, environmental, and social targets. To achieve these multiple objectives, policymakers confront difficult policy trade-offs, some of which were exposed during the pandemic. Looking ahead, policy trade-offs could be eased through structural reforms.
• A large fiscal stimulus supported short-term growth during the pandemic but exacerbated pre-existing macroeconomic imbalances. Infrastructure spending was a key part of the stimulus but has been facing diminishing returns and increased state sector indebtedness, especially at the subnational level, raising fiscal and financial risks (DRC and World Bank 2019). At the same time, relatively limited direct aid to households raised precautionary savings, from an already high pre-pandemic level, resulting in subdued consumption growth since 2020 which partly reversed macroeconomic rebalancing away from investment. Expanding the coverage and benefit adequacy of China’s social safety nets and ensuring portability of benefits across provinces, would build automatic fiscal stabilizers that could deployed during downturns while also contributing to reducing precautionary savings and rebalancing towards private consumption-driven growth.
Figure 23. GDP growth in 2022 and 2023 forecast Source: IMF, World Bank.• To curb excessive leverage, the authorities imposed tighter regulatory constraints on credit to property developers in 2020 but the ensuing real estate downturn slowed China’s economic recovery. While the persistence and severity of the downturn prompted regulatory easing, corporate balance sheet weaknesses and excess capacity in some property markets continue to weigh on the recovery of the sector. Accompanying short-term regulatory easing and liquidity support with more decisive efforts to develop a framework for dealing at scale with the debt overhang could help return the sector to more robust and sustainable growth while containing financial risks.
• To rein in market power in China’s tech sector, the authorities tightened regulatory measures, but higher regulatory uncertainty has dampened private investment and may undermine China’s long-term strategy of building a high-tech and knowledge-based economy. In 2021, regulators aggressively tightened anti-monopoly provisions aimed at digital platforms. This sparked a significant deterioration in investor confidence and capital outflows from the sector. Since the end of 2022, the authorities have signaled less regulatory intervention. Ensuring greater regulatory predictability and transparency could help address market distortions without inhibiting investment.
• State-owned enterprises (SOEs) have been assigned increased responsibility in supporting national development in recent years, but that may have come at a cost to productivity growth. SOEs have been tasked in recent years with multiple (and possibly conflicting) objectives, such as stabilizing employment and leading sectoral restructuring, domestic innovation and industrial policy (Naughton, 2018). Meanwhile, their financial performance has deteriorated since GFC (Brandt et al. 2022), despite evidence of SOEs benefiting from lower financing costs. Ensuring competitive neutrality, removing implicit guarantees, and fostering the orderly exit of unprofitable SOEs would enhance efficiency of capital allocation. To the extent that SOEs fulfill social responsibilities/public mandates, those activities should be compensated transparently to avoid distortions to competition, while remaining commercial operations should operate on a basis without crowding out the private sector.
China has made an ambitious commitment to achieve carbon neutrality by 2060, but short-term priorities have delayed decarbonization. Following regional energy supply shortages – which were in part triggered by aggressive decarbonization targets in 2021 and the sharp rise in global energy prices in 2022 - concerns over energy security led to an increase in domestic coal production. Shifting from the use of administrative targets and quotas to more market-based instruments, including through continued electricity market reforms and a strengthened emission trading scheme (ETS) could help achieve a more efficient decarbonization path while ensuring reliable energy supply and security.
The 2023 economic outlook for the Pacific region is influenced by ongoing COVID-19 recovery efforts, border reopening, and decreasing global commodity and shipping prices. Palau and Fiji, which rely on tourism, are expected to continue their recovery in 2023, especially Palau’s service sectors such as accommodation and transportation. However, the slower growth performance in 2022 will delay the closing of output gaps for most countries, except for Samoa and Palau, which are expected to reach their 2019 output levels after 2025 (figure B3.1). Samoa’s rebound is expected to be slower due to a sluggish tourism recovery and delayed reopening compared to Fiji, while Palau’s three-year recession has reduced its capacity for a quick recovery. Inflation rates are expected to ease in 2023, thanks to decreasing global commodity prices and shipping costs.
Consumer prices in the Pacific have surged due to rising commodity prices and global inflation. As of 2022Q3, inflation has been accelerating in most Pacific Island Countries (PICs) (figure B3.2), reaching nearly 15% in Samoa and Tonga, and over 10% in Palau and Solomon Islands. In Fiji, consumer prices are approaching 5%. The main drivers of inflation have been food and transportation prices, fueled by the increasing costs of energy, food, and imports.
Figure B3.1. GDP forecasts relative to 2019 levelCurrent account balances in Pacific Island Countries (PICs) are significantly influenced by external donor flows and reflect the net impact of terms of trade shocks. Tourism-exporting PICs such as Fiji, Palau, Vanuatu, and Samoa continue to experience current account deficits due to slow recovery in tourism exports and rising import bills from higher commodity and shipping prices in 2022. Conversely, PICs that rely on oil and fish exports such as PNG, Nauru, Kiribati, RMI, FSM, and Tuvalu are benefitting from positive terms of trade and registered smaller deficits or surpluses in their current account. Remittances held up well during the pandemic and contributed to current account balances in several countries including Fiji, Samoa, and Tonga. External grants play a crucial role in financing current account deficits and critical investment in human and physical capital in PICs.
Fiscal policy was used to alleviate the impact of the pandemic and rising costs of living, as the PICs lacked independent monetary policy. From January 2020 to September 2021, PICs spent an average of 13% of GDP on COVID-19 response measures. Fiscal assistance on healthcare averaged around 5% of GDP, while non-health support to households and businesses averaged around 8% of GDP (figure B3.3).
(Box 3. continued)
EAP annual median headline inflation is now expected to slow from 6 percent in 2022 but remain high at 4.5 percent in 2023. As the Chinese economy reopens, a rebound in domestic consumption is expected to put moderate upward pressure on its inflation, rising to 2.6 percent in 2023, up from 2.0 percent in 2022. Inflation is expected to gradually trend down from its earlier levels in rest of the region, as global supply constraints ease and commodity prices stabilize. However, core inflation could continue hovering at high levels for longer, due to delayed pass-through. Expected inflation rate for 2023 has been stable in most EAP economies in recent months, although higher than what was expected in 2022 (figure 24).
 Figure B3.3. Contribution to post-Covid fiscal balance dynamics
The main risks to the economic outlook related to global growth, commodity prices and financial conditions. While sentiments for global growth have recently improved, a sharper-than-expected slowdown could occur due to synchronic monetary tightening and geopolitical uncertainty. In principle, stronger recovery in China could provide substantial positive spillovers to global activity, benefiting regional economies through trade and tourism channels. However, although China’s reopening may provide a boost, it is unlikely to offset the slowdown in advanced economies in most EAP countries. China’s reopening began with services, especially COVID-sensitive sectors, which would limit spillovers through the trade channel to the region initially, though several countries are expected to benefit from China’s outbound tourism. Beyond the reopening effect, China’s outlook remains somewhat uncertain due to challenges in its property sector, which will also weigh on EAP countries’ GDP growth.
Risks also stem from high commodity prices. Elevated input costs may continue to exert second-round pressures on core prices. A renewed food and oil price shock, potentially linked to an intensifying war in Ukraine, could further stoke inflation.
Rising financial market stress, more generally, is considered one of the main risks to the region’s projected economic recovery. Further unanticipated monetary policy tightening by major central banks could put pressure on regional currencies, and pass through to higher inflation, especially in countries that rely on short-term capital inflows (for example, Cambodia, Malaysia and Mongolia). Tighter global financial conditions could also induce debt distress in highly indebted EAP countries.
Recent events, including the failures of certain industrial country banks, Silicon Valley Bank, Signature Bank, and Credit Suisse, have raised concerns about potential spillovers to Emerging Market and Developing Economies (EMDEs), including those in the (EAP) region. Risk aversion has increased, causing credit default swap premia to rise in some EMDEs. The EAP banking sector has not so far been impacted, but there are potential risks through direct or indirect exposure to losses, e.g. from Swiss Bank AT1 bonds and mark-to-market adjustments of other fixed income assets.
Finally, country-specific downside risks include political factors such as general elections in Thailand, civil conflict in Myanmar, and the natural disasters in the PICs.
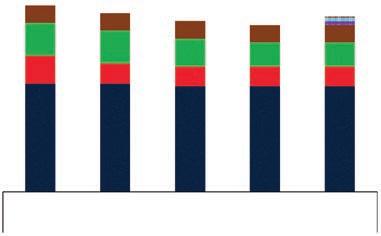
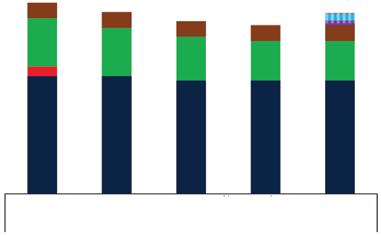
Increased government spending in the last decade was not matched by higher revenues. Government spending as a share of GDP in EAP countries has, on average, been increasing since the Asian Financial Crisis (AFC) and has continued after the Global Financial Crisis (GFC) (figure 25A). Revenue as a share of GDP saw an increase after the AFC but has been on the decline since the GFC. The increased in government spending above and beyond revenues has coincided with increased debt since the GFC (figure 25B).
The debt burden has been exacerbated by recent fiscal deficits, which increased during the COVID pandemic in all major economies and are still exceptionally large in Fiji, Palau, and Timor-Leste. The interest payment burden in significant in Indonesia, Lao PDR, Papua New Guinea, and Mongolia. General government gross debt is significant in Mongolia and Fiji, while short term debt to GDP ratio is high in Malaysia and Thailand.
Figure 25. Government spending has increased in the last decade, coinciding with an increase in government debt
Higher debt combined with increased costs of borrowing have shrunk fiscal space, curtailing the ability of EAP countries to spend money on important programs or respond to unexpected economic events. There is also a need to rebuild fiscal buffers. Growing pressure for fiscal consolidation in these countries combined with the rising costs of untargeted subsidies put in place to mitigate the impacts of the recent shocks highlight the need to spend scarce government resources more efficiently. Protecting people in the region from economic shocks and poverty, promoting inclusiveness, and supporting sustainable public investment in infrastructure, requires government to proactively rethink and adjust fiscal policies.
Three measures can help. First, governments should reconcile spending needs with tightening budget constraints, by, first, committing to restoring fiscal discipline through the (re)introduction of fiscal rules. Evidence suggests that countries with fiscal rules faced lower borrowing spreads compared to countries without fiscal rules both prior to and after the onset of the pandemic (figure 26). Second, governments can commit to fiscal reform through enactment of legislation, especially to boost tax revenues, to be implemented conditional on objective measures of recovery. Meeting new challenges would requires more pro-active fiscal policy as they did in the past and governments need to create space by increasing revenues. For example, new tax reform legislation in Indonesia is expected to raise revenue by 1.2 percent of GDP in the medium term.
Third, more efficient and adaptive social protection would protect the vulnerable and free fiscal space for other ends. Direct transfers to poor households and firms, once the relevant digital infrastructure is in place, would alleviate the pain from the cumulative shocks without distorting price signals or subsidizing the wealthy. Countries’ experiences during the pandemic demonstrated that
countries have some capacity to scale up programs that can protect people from poverty in the face of shocks. But most countries’ scale-up efforts were carried out on the fly, lacking the information or delivery systems needed to quickly reach those worst affected by the pandemic, especially those in the informal sector. Moreover, few countries have social assistance programs that are well-coordinated with the disaster risk management systems that are called upon in the event of natural disasters or climate shocks. In this context, EAP countries need to focus on building more “shock-responsive” social protection systems, building on the lessons from the pandemic (World Bank 2022c).
As higher commodity prices pass-through to increased costs for consumers and firms, governments face a trade-off between tackling inflationary pressures and supporting incomplete economic recovery. While monetary policy remains generally more supportive of the economic recovery in emerging EAP countries than EMDEs elsewhere in the world, policy rates have increased gradually since the second quarter of 2022.
An important policy question is whether inflationary pressures reflect a permanent or a temporary shock. For the most part, these pressures have been triggered by the war in Ukraine and have begun to ease for some commodities. The renewed dynamism of the Chinese economy may put upward pressure on global commodity and service prices, particularly in countries expecting resurgent tourism. Central to devising the appropriate response are the dynamics in labor markets and the extent to which nominal wages will adjust to increasing prices. An increase in labor costs that cannot be absorbed by firms (for example, through reductions in profit margins) could cause even higher inflation and risk triggering a wage-price spiral.
Thus far, long-term inflation expectations seem to remain well-anchored for the major economies in the region. Nevertheless, central banks need to stay alert. Core inflation is still running above target. The big supply shocks and permanent structural realignments associated with the pandemic have made calibrating monetary policy particularly challenging. Central banks should reaffirm their commitment to price stability and be prepared to hike rates if core inflation does not show clear signs of returning to target.
As exchange rates have come onto pressure, some countries have used a combination of foreign exchange policies: (i) allowing some depreciation of the national currency against the strengthening US dollar; (ii) intervening in the foreign exchange market to support local currency; (iii) increasing national reference interest rates to mitigate capital outflows; and (iv) mopping up excess liquidity in the domestic market through the issuance of Central Bank papers.
While interventions and administrative controls in the foreign exchange market may initially reduce external liquidity pressures, these measures entail the risks of ultimately being counterproductive, undermining adjustments to relative price changes and impairing efficient resource allocation. Given import dependence, large foreign debt obligations, concerns about the pass through to inflation and expectations that are anchored to the exchange rate, the reluctance to allow greater exchange rate flexibility is understandable. However, like price controls exchange rate interventions can lead to misalignments and distort price signals that are important to ensure efficient allocation of resources. An overvalued exchange rate can dampen necessary external adjustments and expenditure switching (substitution of imported with domestically produced goods). Surrender requirements at below market rates effectively tax exporters, undermining export competitiveness and creating disincentives to repatriate export earnings. At the same time, scarcity of foreign
exchange may lead to supply shortfalls of critical commodities. As evidenced by the emergence of parallel exchange rates, economic agents will also seek to evade requirements, leading to a wider parallel premium and ultimately passing through to inflation.
A stability-oriented monetary policy and exchange rate regime can be bolstered by central bank independence and transparency. A more independent central bank is in a more credible position to achieve monetary policy targets, even at the expense of other economic policy targets. More transparent central bank operations, strategy, and communications can safeguard the legitimacy of the central bank, enhance public understanding of and confidence in sound monetary policy, promote informed discussion among market participants and the broader public, and more effectively guide and stabilize inflation expectations.

Higher funding costs for corporate borrowers, originating from tighter monetary stances in global markets can lead to increased corporate vulnerabilities. In addition, higher interest rates can exacerbate existing vulnerabilities due to high household indebtedness in certain countries (e.g. Thailand). At this stage, banks seem equipped to deal with corporate and household financial difficulties but must remain alert to threats to their safety and soundness (table 2). Moreover, risks for individual country and banks show heterogeneity, underscoring the need to be vigilant about idiosyncratic risks (Box 4).
The phasing out of pandemic-related forbearance measures is progressing at an uneven pace—remaining in place in Lao PDR and China for instance. Even in countries that have phased out such measures, a clear plan for dealing with deferred payments and restructured loans is often missing. While non-performing loans (NPLs) in most EAP countries have been relatively stable, there is a risk of overestimated asset quality and understatement of the vulnerabilities accumulating in some of East Asia’s bank-dominated financial systems. A correction on this front will constrain the banking sector’s balance sheet headroom and impact credit growth.
Table 2. Financial sector is well-capitalized except for Vietnam, but risks remain to profitability, solvency, and liquidity
Source: IMF, Fitch Solutions, World Bank, national sources.Financial sector health is so far sound in EAP. Publicly available indicators show adequate overall capital levels and low non-performing loans (NPLs) for most countries in the region. The systemwide averages, however, mask idiosyncratic vulnerabilities. In Lao PDR, for instance, the largest 8 banks have lower capital buffers than smaller banks. The largest commercial bank—with 38 percent of system assets—has seen its capital adequacy ratio steadily decline to levels below the prudential minimums. Data on asset quality (NPLs) may not reflect the negative impact of ongoing regulatory forbearance measures. Unsustainable debt accumulation and large operating losses of SOEs also pose significant fiscal risks. While commercial bank lending to SOEs declined to 13 percent in 2022 from over 20 percent in 2012, the banks remain exposed.
Vietnam’s financial sector has stabilized after a short period of liquidity shock in 2022q3, but liquidity and interest rate pressures remain high. In 2022q4, many banks exhausted their credit room and stretched their loan-todeposit (LDR) ratios beyond the threshold given by the State Bank of Vietnam, which pressured them to significantly increase savings interest rates to attract deposits. Investors remain cautious after the Saigon Commercial Bank (SCB Bank) and Van Thinh Phat (VTP) fraudulent cases that depressed the prospects of the corporate bond market. The capital adequacy ratio (CAR) for the banking sector remains at 11 percent as of October 2022 with limited buffer for any shock absorption, especially for the four state-owned commercial banks—accounting for about 45 percent of total banking assets—whose CARs are only slightly above the regulatory minimum threshold of 8 percent. NPLs for consumer finance loans are high, increasing from 4.9 in 2019 percent to 9.1 percent in 2022, which is considerably above the system wide average of 2 percent.
In Mongolia, GDP growth surpassed expectations in 2022 and along with improved economic prospects, financial markets conditions have shown recovery. Nonetheless, high public debt, fiscal deficit and pressure on international reserves continue to pose macro-financial challenges. The recent decline in bank NPLs is mostly due to the specific case of one bank (TDBM), reflecting the symbiotic relationship between the banks and the government, rather than underlying improvements in the quality of overall loan performance in financial markets. The process of issuing Initial Public Offers (IPOs) in domestically systemically important banks started in 2022 and is a move in the right direction to reduce ownership concentration. However, its impact on the diversity of ownership or governance of the banks is not clear yet, as the IPO process was not accompanied by efforts to strengthen bank transparency and governance.
The Chinese banking system has healthy capital adequacy ratios above regulatory levels, low NPLs, ample provisioning for bad debt and sufficient liquidity. Rural commercial banks, however, have relatively high NPLs and smaller capital buffers. There are signs of a turnaround in the real estate sector, but weak demand and soft sales continue to create liquidity pressures for property developers, given their reliance on proceeds from pre-sales.
To strengthen financial stability while enhancing the financial sector’s ability to allocate resources efficiently, authorities can consider a range of measures. Close monitoring of asset quality will be vital, and it is essential to conduct timely asset quality reviews of loans under relief. Providing targeted debt mediation or debt restructuring to support viable firms and households facing debt distress is critical as well. However, the exit from macroprudential easing, particularly loan forbearance measures, involves trade-offs and will need to be carefully designed and managed. Protracted forbearance measures may continue to mask the true extent of financial sector vulnerabilities. Much work needs to be done in strengthening the implementation of the insolvency regime in many EAP countries.
Effective insolvency frameworks can play a crucial role in mitigating the risks of credit misallocation. The effectiveness of efforts to manage NPLs is limited if insolvency frameworks are not conducive to efficient corporate restructuring. This means that the faster the process of corporate restructuring and exit is, the faster the resolution of nonperforming loans, and the resources tied to the failing firms can be reallocated to more productive uses.
Over the last 20 years, the EAP region has enjoyed higher and more stable growth than other economies. During the 1999–2019 period, the region’s economies grew at an average rate of 6 percent per year, which is higher than the average growth rate of 4 percent of other emerging market and developing economies (EMDEs) and 2 percent for advanced economies. The average growth rate of the region’s economies was also higher than in the two decades preceding the Asian Financial Crisis. Furthermore, the volatility of growth for the region’s economies during the 1999–2019 period has been lower than in the preceding two decades, as well as lower than in other EMDEs and even advanced economies (figure 27).
The sustained and higher economic growth of the EAP region has enabled most countries to move up the economic income ladder and attain middle-income country status. At the start of the 2000s, the EAP region counted six low-income countries – Cambodia, Lao PDR, Mongolia, Myanmar, Papua New Guinea (PNG), and Vietnam–but all of them transitioned to lower-middle-income (LMIC) status by 2019 (figure 28). Thailand and China transitioned from the lower-middle-income group to upper-middleincome countries (UMIC) by 2010. Although Indonesia and the Philippines remain in the same lower-middle-income category, they are now on the verge of transitioning to upper-middle income.
Sustained high growth in EAP economies can be attributed at least in part to sound macro economic policies that helped weather external shocks such as Global Financial Crisis and COVID-19. Since the Asian Financial Crisis (AFC) of the late 1990s, East Asia has made significant strides in improving its macroeconomic management. Fiscal sustainability has been achieved through a combination of better expenditure management and fiscal consolidation measures. Many countries in the region have strengthened debt management practices. The region’s economies are now less exposed to short term external debt and hold more buffers in the form of foreign currency reserves.
Inflation management is another area of improvement. Many countries in the region have adopted inflation-targeting frameworks, which have helped to keep inflation under control. Central banks have been given greater independence and have become more transparent in their policy decisions. Growth of broad money supply has been lower than in the pre-AFC period, and exchange rate regimes have become more flexible, allowing currencies to adjust to market conditions (figure 29).
Bank capitalization has also been a focus of macroeconomic management in East Asia since the AFC. Banks have been required to increase their capital levels and improve their risk management practices. This has helped to strengthen the financial system and reduce the likelihood of banking crises.
Figure 28. Consequently, EAP countries have all transitioned either to lower or upper middle-income status
Poverty rates in EAP economies have decreased significantly in the last two decades, both in rural and urban areas. The poverty reduction has been especially notable in rural areas, with lagging regions catching up and significantly narrowing the rural-urban gap. China, Indonesia, and Malaysia have experienced an average annual urban population growth of 2.7 percent over the two decades, while rural areas have seen negative population growth of 1.4 percent per year. Consequently, the proportion of poor people living in urban areas in these countries has increased markedly by 7–14 percentage points since the early 2000s (figure 30).
Economic growth in the EAP region, rather than policies aimed specifically at benefiting the poor, has played the primary role in reducing poverty over the past two decades, but the impact of growth on poverty reduction has been declining. Nearly 90 percent of the total poverty reduction in the region over the last two decades can be attributed to consumption (income) growth (figure 31). The role of pro-poor fiscal policies in reducing poverty has been modest but has increased over time. In the 2000s, the effects of equitable welfare redistribution were limited due to relatively neutral and regressive growth trends, with only Thailand and Vietnam experiencing a 0–1 percentage point reduction in poverty from redistribution effects. In the 2010s, pro-poor growth, along with welfare growth, led to an additional 2–4 percentage point decline in poverty in most countries, reflecting higher consumption (income) growth rates for poorer households in this period.
Estimates of inequality suggest that growth was less inclusive in developing EAP countries in the first decade of the 2000s, but more so during the 2010s, leading to reduced inequality in the latter period. In the first decade of the 2000s, consumption (income) growth either favored better-off households or was equal across the welfare distribution.
Figure 29. Sound macroeconomic management in major EAP economies helped reduce volatility after the Asian Financial Crisis
D.
Figure 30. Poverty rates have declined markedly during the last two decades in both urban and rural areas
Source: World Bank staff’s estimates.
Note: Figure shows poverty rate at $6.85 (2017PPP). The discontinuity in the country-level line graphs indicates breaks in survey and welfare comparability over time.
Consequently, consumption/income inequality, as measured by the Gini index, tended to increase during this period (figure 32). However, during the 2010s, consumption (income) among poorer households grew at a faster rate than among wealthier households in China, Malaysia, the Philippines, and Thailand, resulting in a decrease in inequality by the end of the decade.


Even though growth was relatively high and sustained, productivity growth in EAP was slowing even before the COVID-19 pandemic. During the post-GFC 2012–2019 period, the growth of both labor productivity (output per worker) and total factor productivity (TFP), was lower than during the post-AFC 2000–2007 period in China and the rest of the region (figure 33). Growth in the region has been primarily driven by capital accumulation.
Source: World Bank staff’s estimates, based on a growth-redistribution decomposition method from Datt and Ravallion (1992).

Note: Bars show percentage-point change in poverty and the contribution of growth and distribution effects to total poverty reduction at the upper middle-income poverty line ($6.85/day). The spells for each country were selected based on availability of two comparable surveys over the last decade; China: 2013–2019, Indonesia: 2011–2019, Malaysia: 2011–2019, Philippines: 2012–2018, Thailand: 2011–2019, and Vietnam: 2012–2018. A decomposition of poverty changes into growth and inequality components examines whether changes in poverty were driven by growth in mean consumption (income) per capita or a more inclusive distribution of consumption (income).
Prior to the financial crisis, developing EAP economies experienced growth rates that exceeded those of advanced economies, resulting in faster convergence of their incomes per capita than in other parts of the world (Patel et al. 2021). However, post-GFC, convergence slowed down and in recent years is statistically insignificant (figure 34) – even though the productivity levels of many EAP economies remain below the global productivity frontier, represented by the productivity level of the United States (figure 35).
The last two decades have also seen a shift in the pattern of structural change. At different stages between the 1950s and the late 1990s, the economies in the EAP region saw significant growth in manufacturing. However, between the Asian Financial Crisis and the Global Financial Crisis, the share of manufacturing in GDP peaked and began to decline in the
early industrialize rs (figure 36). Still- industrializing Cambodia and Vietnam were the exceptions to this trend.


The pattern of structural change differs in developing EAP economies from that in the early industrializers such as Japan, Republic of Korea, and Taiwan, China. First, the share of manufacturing in GDP and employment peaked at lower levels of GDP per capita in developing EAP countries, a phenomenon referred to as premature deindustrialization (Rodrik 2014). Second, the peak is not necessarily lower in terms of the share of manufacturing in value added but is lower than share of manufacturing in employment. A further difference, not previously recognized, is that the economies of the Republic of Korea and Taiwan, China seem to be experiencing a resurgence in manufacturing value added in recent years, driven by the growth in high-tech industries such as semiconductors and electronics (figure 37).
The pattern of structural change over time has affected productivity growth.

• Consider first Malaysia, Thailand, Indonesia and China. In the two fourteen-year periods before 2004, workers moved out of relatively low productivity agric ulture to relatively high productivity manufacturing and services. In the third and most recent period (2004–2018), the shift out of agriculture slowed down, and workers primarily moved not into high productivity manufacturing and business services but into relatively low productivity trade and construction services (figure 38). The fact that some of the latter services activities were associated with lower productivity in the most recent period may reflect the “informalization” and overcrowding of these sectors as they accommodated rural-urban migrants.

Figure 34. But EAP convergence with high income countries, which was faster than in other countries, has recently stalled
A. Convergence coefficient for rest of the world
B. Convergence coefficient for EAP economies
Source: World Development Indicators.
Note: GDP per capita in PPP. The sample of countries used was restrained to those whose population is larger than one million people. Also, oil-rich countries were excluded.
Source: Penn World Table.
Note: Figure shows GDP weighted average. SSA: Sub-Saharan Africa, SAR: South Asia, EAP: East Asia and Pacific, LAC: Latin America, EXA: Europe and Central Asia, MENA: Middle East and North Africa, AE: Advanced Economies.
Figure 36. In recent years, the share of manufacturing in GDP declined in EAP economies (other than Cambodia and Vietnam), and the share of services in GDP increased
Source: GGDC/UNU-WIDER Economic Transformation Database (Kruse et al., 2022), GGDC 10-Sector Database.
Note: Figure shows sectoral share in total value-added. EMDE: Emerging Markets and Developing Economies. Other EMDE shows 25–75 percentile of 20 major EMDEs outside EAP.
Figure 37. The share of manufacturing in GDP and employment has peaked at lower levels of GDP per capita in developing EAP economies than in the early East Asian industrializers
A. Share of agriculture in total value-added B. Share of manufacturing in total value-added C. Share of services in total value-added
D. Share of agriculture in total employment E. Share of manufacturing in total employment F. Share of services in total employment
China Percent 0 5 10 15 20 25 30 35 40 5 6 7 8 9 10 11 Per capita GDP, log
China
Japan
China
Indonesia Philippines Thailand Malaysia Vietnam Japan Korea, rep Taiwan, Percent 0 10 20 30 40 50 60 70 80 5 7 9 11 Per capita GDP, log
Figure 38. In major countries in recent years, workers moved mostly from least productive agriculture to below-average productivity services sectors, and not much to the most productive manufacturing and services sectors. While in Vietnam, Cambodia and Myanmar, workers were continuing to move to more productive manufacturing and services
A. EAP countries where increase in manufacturing employment stalled (China, Thailand, Malaysia, Indonesia)
B. EAP countries where manufacturing still attracts employment (Vietnam, Cambodia, and Myanmar)
C. Advanced EAP economies where manufacturing employment has been declining but recently experienced increase in productivity (Japan, Republic of Korea, and Taiwan, China)
Source: GGDC/UNU-WIDER Economic Transformation Database (Kruse et al., 2022), GGDC 10-Sector Database.
Note: The size of the circle represents employment share in the initial year.
• Cambodia, Myanmar and Vietnam are still in the industrialization phase of structural change. Movement out of agriculture is accelerating and oriented towards relatively high productivity manufacturing and services –mostly construction in Cambodia’s case in recent years (2004–2018).
• In developed EAP economies such as Japan, the Republic of Korea, and Taiwan, China, the decline in manufacturing employment has slowed in the most recent period (2004–2018) while the shift to relatively high productivity business services continued. Interestingly, manufacturing saw a boost in relative productivity, possibly due to investments in innovation and the adoption of new technologies.
It is important to recognize that even though productivity in the labor-absorbing services sectors was eventually lower than in the overall economy, productivity in services was still higher than in agriculture and was increasing within services overall. Therefore, services did contribute to overall productivity growth (figure 39).
Underlying the change in productivity within sectors, is the change in productivity within firms and the change due to the reallocation of resources between firms. The quality of publicly available firm level data in the EAP region does not support a rigorous analysis of these trends. However, the analysis that is feasible suggests that reallocation across firms appears to be productivity enhancing in East Asia and Pacific, but it is small and potentially slowing over time (Box 5).
Figure 39. Nevertheless, the growth of productivity within services and the movement of workers from agriculture to services have contributed to overall productivity growth in EAP countries
Looking ahead, the digital revolution, which received a boost during the pandemic, is transforming services sectors. More services are becoming internationally tradable and the emergence of digital platforms is transforming even domestic services from retail and finance to transport and tourism. These changes are contributing to increased productivity in services (figure 40). However, it is not yet clear whether these changes will lead to an increase in employment not just of the skilled workers but of those with intermediate skills who benefitted enormously from export-led industrialization.
Major economies in EAP region have implemented significant structural reforms, beginning in the early 1980s until the early 2000s, but the pace of reforms has slowed down. The earlier reforms were broad-based and covered multiple sectors such as trade, domestic finances, and product markets. The available evidence suggests that, in most countries, the pace of reforms has slowed down after the early 2000s (figure 41). China and Vietnam continued to implement reforms until later, in part driven by their accession commitments to the World Trade Organization (WTO), but even their pace of reforms slowed starting in mid-2010s. Recent reforms in Indonesia and the Philippines have not yet been included in the index (see discussion in EAP Economic Update of October 2021, Box I.13).
Source: GGDC/UNU-WIDER Economic Transformation Database (Kruse et al., 2022). Note: Simple averages (EAP 8, other EMDE16, Advanced Asia 3 economies).Productivity growth depends on the reallocation of resources towards more productive uses. Industry growth comes from several sources. Within-firm productivity growth raises industry productivity, by each firm becoming more productive. But industry growth can also result from a reallocation of activity - more productive firms growing or less productive firms shrinking. Productivity-enhancing reallocation is reflected in higher wages – if high-wage firms hire more workers, average wage in the sector increase. Additionally, the dynamic reallocation of resources through the exit of less efficient firms and entry of highly productive startups – “creative destruction” – can also boost growth in an industry.
Reallocation appears to be productivity enhancing in EAP, but it is small and potentially slowing over time. Using data for larger Chinese manufacturing firms, Brandt et al (2020), find that two-thirds of total factor productivity (TFP) growth over 1998-2013 was due to firm entry, with the remainder from within-firm productivity improvements. After 2007, the contribution of firm entry fell by two-thirds, accounting for the bulk of the slowdown in China’s manufacturing growth. In contrast, reallocation within incumbent firms had a negligible contribution to productivity throughout the period. Another way of measuring reallocation is how strongly firm employment growth is related to firm productivity – i.e. do the more productive firms grow in size (following Decker et al., 2020). For EAP countries, we find more productive firms do increase employment more than those less productive. Whilst, these reallocation rates are positive, they appear to be slowing over time and are low compared to benchmarks in more flexible markets (see figure B5.1). For instance, the annual employment growth of US manufacturing firms is more than twice as responsive to productivity as equivalent measures for Chinese manufacturing firms and more than four times as responsive as Indonesia (Decker et al., 2020), suggesting there are large potential productivity gains from improving resource reallocation in the region.
Figure B5.1. Reallocation among firms is productivity enhancing, but is small and not improving over timeFigure shows the percentage point increase in 5-year employment growth correlated with a one standard deviation higher (5-year lagged) TFP. Manufacturing firms with more than 20 employees in each country. 5-year employment growth calculated following Davis et al (2007) and is bounded between +2 and 2. For each country, employment growth is regressed on lagged TFP and its interaction with a quadratic time trend, and includes year, industry and a young firm fixed effects. The estimate coefficients are multiplied by the standard deviation of industry TFP. TFP calculated using Wooldridge (2009) control function method. Unreported annual employment growth for China and Indonesia is around one-third of the magnitude reported in the figure.
Figure 40. And the adoption of digital technologies is likely to increase productivity in services
A. Adoption of E-commerce technologies after COVID-19
B. Correlation between website use and labor productivity of retail firms
Source: ILOSTAT, UN National Accounts, World Bank Enterprise Surveys, Nayar et al. (2021).
Note: B. Website data for 2016 or most recent available year.
Figure 41. Significant reforms were implemented in most major EAP economies until the early 2000s, but fewer have been introduced subsequently
Source: World Bank staff’s estimates, based on earlier work by Alesina et al. (2020).
Note: Overall and sectoral reform indices are continuous indicators taking a value in the [0-1] interval. A higher value indicates greater degree of liberalization (lower intensity of restrictions). Lines represent 3-yearmoving-average fits. Trade reforms is a composite index capturing the degree of liberalization in tariffs and the current account. Domestic finances reform captures the degree of liberalization in credit and interest rate controls, banking entry and supervisions, privatization, and security markets. Product market reform captures the degree of liberalization in two representative sectors of electricity and telecommunication.
There is some evidence to suggest that per-capita income growth in the region’s economies is positively associated with the structural reforms (Box 6). However, this illustrative analysis does not examine other factors, such as public investments in education, health and infrastructure, which can also boost productivity including through structural change (Box 7).
There is a considerable body of literature studying the effects of structural reforms on economic growth. For example, Fernandez et al. (2016), Quinn and Toyoda (2008) and Chinn and Ito (2006) focus on liberalization of capital inflows and outflows and Abiad et al. (2010) study growth effects of domestic financial market reforms. Alesina et al. (2020) takes a more integrated approach and studies the effects of structural reforms in trade, external finance, domestic financial sector, and product and labor markets on growth. These studies report that structural reforms help increase economic growth.
This box utilizes panel-data estimation techniques to evaluate the marginal effects of structural reforms on per-capita growth across six major developing EAP countries with available longitudinal series of reforms data (China, Indonesia, Malaysia, Philippines, Thailand, and Vietnam). Specifically, this box investigates the relevance of four areas of reform that could have influenced per-capita income growth: trade (represented by tariff liberalization and import/export payments and receipts); external finances (represented by liberalization in capital inflows and outflows); domestic finances (represented by liberalization in the securities markets); and product markets (represented by liberalization in the electricity sector). The regression results, which control for country and year fixed effects and the level of output per capita, suggest that greater liberalization in each of the four reform dimensions is positively associated with percapita GDP growth (figure B7.1). Specifically, a one-standard-deviation increase in country’s reforms to liberalize trade, external and domestic financial sectors, and the electricity sector, is associated with an increase in annual percapita income growth by 0.25, 0.23, 0.15, and 0.13 percentage points, respectively.
Source: World Bank staff’s estimates.
Note: The sectoral reform indices are continuous indicators taking [0-1] value, following Alesina et al. (2020). A higher value indicates greater degree of liberalization (lower intensity of regulatory restrictions). Two-way fixed effect OLS panel-data estimation with annual country-level data from 1970 (or earliest available) to 2014 in major developing EAP countries where reforms data are available (China, Indonesia, Malaysia, Philippines, Thailand, and Vietnam). The dependent is annual growth in GDP per capita. All reform indicators are measures of the preceding year. Given the collinearity between reforms, each area of reform is examined separately. Regressions control for country and year fixed effects and log of GDP per capita in the previous year. Bar height represents annual per-capita income growth effect associated with one-standard-deviation increase in structural reforms. Whiskers represent 90-percent confidence intervals.
Figure B6.1. Correlation of GDP-per-capita growth in EAP and structural reformsStructural change is a key feature and driver of economic and social development (Kuznets, 1966). There is no universally agreed definition of structural change, but three major perspectives exist. The first group often considers a narrow (production) focus, typically entailing a relative decline in agriculture and a concomitant increase in the share of industry and/or services (Dabla-Norris et al. 2013). The second, broader perspective, focuses on labor productivity rather than production alone. This perspective evaluates structural change in terms of labor shifts from lower-productivity to higher-productivity sectors (see, for example, McMillan, Rodrik, and Verduzco-Gallo 2014). The third perspective goes beyond changes in the economic structure by also considering changes in other socio-economic aspects of society, such as demographic transition (through lower fertility rates), changes in labor participation (through changing social preferences), and a spatial reorganization of the population (through rural-urban migration) (Martins 2019).
Subsequently, growth in output per capita can be decomposed into three components: (i) changes in output per worker (i.e., labor productivity, within- and between-sectors); (ii) changes in the employment rate; and (iii) changes in the relative size of the working-age population (i.e., demographic change). Within-sector growth has been the major driver of per-capita income growth in EAP, accounting for approximately 60 percent of total growth during the 2004–2018 period (figure B7.A). However, across-sector growth is also sizable in several economies and higher than the level predicted by their income level (figure B7.B). Changes in demographic structures (share of working age population) has had a positive effect on per capita growth in most economies and significantly so in Malaysia and Vietnam. It is notable that they had a negative effect on growth in China, indicating rapid aging
A. Decomposition of GDP per-capita growth (average, 2004–2018)
B. Correlation of across-sector growth and income level (average, 2004–2018)
Economic Transformation Database (Kruse et al., 2022); World Development Indicator. Note: Lao PDR shows average decomposition between 2000 and 2018.
of the society. The impact of employment rates varies considerably across countries, partly because declines may suggest an investment in future generations, as young people stay longer in education.
The pace and pattern of structural change can be influenced by several factors. First, countries’ initial conditions matter. Given the large productivity gaps usually observed between agriculture and other economic sectors, countries with a high share of employment in agriculture have greater scope to benefit from employment reallocations. Conversely, resource-rich countries may have limited incentives to diversify their economic structures, especially when high demand and prices for natural resources reinforce their comparative advantage and specialization. Second, macroeconomic instability may undermine structural change, through greater economic uncertainty. Third, openness to international trade and a competitive real exchange rate may facilitate structural change if they lead to output and employment growth in higher-productivity sectors. Fourth, human capital is likely to be of vital importance to induce structural change. Workers need improved skills to gain access to higher-productivity jobs, while skills and knowledge are also key to promote entrepreneurship, creativity, and dynamism—thus affecting both labor supply and demand. Fifth, physical capital can also be critical since improving basic infrastructure—such as transport, energy, water and sanitation, and telecommunications—can significantly enhance a country’s competitiveness. Sixth, good governance and strong institutions can provide a more conducive environment for accelerating structural change. Finally, sectorspecific policies are also likely to play an important role, particularly if they unleash the productivity potential of sectors that can absorb a significant number of new workers.
Understanding which drivers matter the most largely depends on country characteristics and binding constraints. For instance, some countries in the EAP region have large education and infrastructure gaps that undermine the relocation of labor – through both supply and demand bottlenecks. Other countries predominantly suffer from a challenging business environment, such as high barriers to competition. The historical experience of developed and emerging economies confirms that sustained economic development requires structural change. The EAP region has undergone a rapid process of economic and social transformation over the past decades, but labor productivity gaps remain high in several countries. This suggests that there is still much scope for accelerating structural change.
To an extent, the slowing reform is a consequence of significant prior liberalization which leaves limited room for further reforms, especially the politically difficult “last mile” improvements in policy. Nevertheless, the latest available data across all reform areas suggest that there are still sizeable gaps in reforms of developing EAP countries relative to a sample of advanced economies (figures 42a and 42b).
Furthermore, reforms have been reversed in some areas. In trade, the total number of new restrictions in goods trade in China and ASEAN-5 have increased by over three times since 2009 (figure 43A–D), with those imposed in China and Indonesia accounting for the largest shares in the region. Most recently, the number of restrictions has also surged in Thailand and the Philippines. Similarly, some countries have taken measures to limit international capital flows (figure 43E).
Figure 42a. But countries will need to address the significant “reform gap” between EAP countries and advanced economies . . .
Source: World Bank staff’s estimates, based on earlier work by Alesina et al. (2020).
Note: Overall and sectoral reform indices are continuous indicators taking a value in the [0-1] interval. A higher value indicates greater degree of liberalization (lower intensity of restrictions). Lines represent 3-yearmoving-average fits. Trade reforms is a composite index capturing the degree of liberalization in tariffs and the current account. Domestic finances reform captures the degree of liberalization in credit and interest rate controls, banking entry and supervisions, privatization, and security markets. Product market reform captures the degree of liberalization in two representative sectors of electricity and telecommunication. All indicators reported in 2020, except for Domestic finances reform index for Japan, Singapore, and United States (2014).
A. Overall reform indexFigure 43. Trade restrictions have increased in several countries since the beginning of 2010s and capital account openness has been reverse in some
A. Number of newly imposed restrictive measures in goods trade
B. Number of newly imposed liberalizing measures in goods trade
C. Number of newly imposed restrictive measures in services trade
D. Number of newly imposed liberalizing measures in services trade
Source: Global Trade Alert; Chinn-Ito Capital Account Openness Index (Chinn & Ito, 2006).
Note: E. Red line (ASEAN-4) shows the arithmetic index average for Indonesia, Malaysia, Thailand, and Philippines. Orange line (Small ASEAN + Vietnam) shows an arithmetic average for Cambodia, Lao PDR, Mongolia, Myanmar, Vietnam. Index (0-1; 0 = most restricted; 1 = most liberalized).
Us-China economic tensions have resulted in complex and multifaceted measures spanning trade, investment, and technology. The increase in mutual protection can be viewed conceptually as the reversal of trade integration between two large countries. While the latter involves the removal of barriers to bilateral trade, the former involves the erection of barriers to bilateral trade, including both tariffs and non-tariff barriers (nTBs). In addition, as the two countries engage in a race of industrial policies to catalyze domestic innovation and investment, the hybrid of trade and industrial policies is set to reshape the landscape of global value chains (gVCs).
This section first discusses the trade effects of the US-China tensions, manifested in tariffs, non-tariff barriers, and industrial policy, on third countries’ trade and investment. It then examines the innovation-dimension, and how it might affect the Us, China and third countries. Finally, it explores possible policy responses by third-country policymakers, especially in the eAP region, to mitigate the impact on individual and global economies.
The increase in bilateral protection, by raising trade costs between the world’s largest trading countries, is affecting other countries through either trade diversion or production linkages. however, at least four problems are emerging.
• Uncertain politics, rather than economic fundamentals and predictable rules, are molding trade patterns and that could discourage investment.
• Divergent standards, such as in the divergent approach to data flows in China, EU and the US, could segment markets and prevent developing countries from exploiting economies of scale in an integrated global market.
• export restrictions on ultimate destination, can disrupt gVCs and third country trade.
• Perhaps most seriously, bilateral restrictions on technology flows and collaboration between large countries could reduce the global availability of knowledge.
Us-China tariffs are affecting other countries through either trade diversion or production linkages. Countries that may substitute suppliers from either the Us (such as the eU) or China (such as Vietnam) may experience an increase in exports because of trade diversion and relocations of multinational activities. In contrast, countries that share gVC production linkages with the Us or China (or both) (such as Japan and the Republic of Korea) may suffer a negative spillover due to decreasing import demand for and export supply of intermediate inputs.
The trade diversion effect and the gVC production linkage spillover may be driving the changes in economies’ shares of Us imports (see also the discussion on shifting gVCs in the April 2022 eAP economic Update). While China experienced
more than a 4-percentage-point decrease in its share of Us imports during 2018–2022, with the largest decline in the electronics industry, economies such as Vietnam, Thailand, and Indonesia exhibited an increase in their share of Us imports, also particularly in the electronics industry, suggesting US trade diversion from China (figure 44A). In contrast, Japan, which shares gVC production linkages with both the Us and China, saw a slight drop in its share of Us imports.
At the same time, China substituted its imports from the US, which declined by about 2 percentage points in electronics and other manufacturing industries, with imports from Taiwan, China, and Vietnam (figure 44B). The US was not the only partner economies experiencing a drop in its share of Chinese imports. China’s import shares from Japan and the Republic of Korea also saw a decrease of similar or even greater magnitudes, because of their production linkages with both the Us and China. Figure 45 highlights two Asian economies whose exports exhibit some of the strongest trade effects. In the last couple of years, Indonesia significantly increased its exports to China, driven by metal exports, while its exports to the US, EU, and Japan remained relatively flat. Vietnam, on the other hand, saw an increase in its exports to the US without significantly increasing exports to China, Japan, and the EU.
Fajgelbaum et al. (2021) provide additional evidence in support of both mechanisms: several countries decreased exports to China and increased exports to the Us and the rest of the world as most countries export products that complement the Us and substitute China. mao and holger (2020) make a similar point: tariff hikes between the Us and China, increased cumulative tariffs for other countries that are positioned downstream in global supply chains including the eU, Canada, and Mexico. EAP countries differ in how they participate in GVCs, but most are significantly integrated with the world and with China, especially in electronic products (figure 46).
These findings confirm that how the US-China trade tensions affect third countries, depends on their sector-specific substitutability (export similarity) and complementarity with respect to Us-China trade. Those competing with Us-China trade can benefit from the trade diversion effect and experience increased trade with either the US or China, whereas those
Figure 45. Indonesia increased its exports primarily to China, Vietnam primarily to the Us
A. Destination of Indonesia exports
B. Destination of Vietnam exports
Figure 46. EAP countries differ in how they participate in GVCs, but most are significantly integrated with the world and with China
A. GVC participation as a share of gross exports
B. Share of GVC links with China
complementing Us-China trade through gVC linkages will likely suffer from a negative spillover as tariffs ripple through the value chains. Apart from these economic fundamentals, a country’s ability to take advantage of opportunities is also affected by its own trade policies, its access to trading partners’ markets, as well as its political affiliations (figure 47).
Apart from tariffs, non-tariff barriers such as stricter technical regulations and export controls on sensitive technology goods have also provided the US and China alternate instruments for intervening trade and investment flows.
Figure 47. But trade patterns are now being molded not just by economics but by uncertain politics
Significant exporter characteristics associated with increased imports to the US and EU
Source: BACI-CePII database / Un Comtrad
Note: The chart above plots significant coefficients from a regression to determine what exporter characteristics were associated with increased imports to the US and EU. The bars are the interaction coefficient of exporting country characteristics and change in imports from China for each product. They tell us how much more the Us and the eU are importing from 3rd Quartile country relative to their imports from 1st quartile country at the respective characteristic in the products where imports from China are falling. The blue bars are all products pooled together and orange bars are only the manufactured consumption goods. Tariffs on imports are exporting country’s import tariffs weighted across all products; tariffs faced by exporters are exporting country’s average market access; and bilateral tariff is the only variable tariff variable which is importer-exporter country level and is a weighted average across all products.
For example, both governments also launched initiatives to promote domestic innovation and reduce reliance on foreign technology, which led to the development of new technical standards and regulations that favored domestic firms over foreign competitors. Technical standards and regulations are the dominant form of nTBs for both the Us and China and have been on the rise since 2017 in both nations (figure 48).
Source: World Trade organization (I-TIP goods).
Technical Barriers to Trade Sanitary and Phytosanitary
Note: The figure shows the number of non-tariff measures (NTMs) applied in merchandise trade. The information includes WTO members’ notifications of NTMs as well as information on “specific trade concerns” raised by members at WTo committee meetings.
Unlike bilateral tariffs, most technical standards and regulations do not in principle discriminate across trading partners. The rise and divergence of standards between countries can, nevertheless, reshape the global patterns of trade and investment in all sectors
including services. As shown in Chen and mattoo (2008), regional agreements on standards through, for example, harmonization and mutual recognition can address differences in standards across countries and increase trade between participating countries as well as trade with third countries (unless the agreements lead to stricter standards or restrictive rules of origin).
Conversely, the fragmentation of standards, especially between the world’s two largest markets, can not only constitute additional barriers to trade and investment between the two countries but also create additional burdens and diseconomies on exporters and multinational corporations from third countries as companies need to adjust their products and processes to comply with different regulations. moreover, if a product must meet different technical standards at each stage of production, it can create additional costs and complexity in sourcing decisions, which may lead companies to keep more of the production process and input sourcing within one country, rather than across borders. This would lead to further fragmentation of markets and supply chains that go beyond the effects of tariffs.
Chen, Hsieh, and Song (2022) show that unofficial non-tariff barriers were responsible for 50% of the overall reduction in Chinese imports from the US during the height of the US China trade war in 2018 and 2019. The authors find nontariff barriers accounted for more than 90% of the Chinese consumer welfare loss from the Us-China trade war, with the loss from reduced imports from the Us due to non-tariff barriers being six times larger than an equivalent import decline due to higher tariffs. nTBs were more costly because they applied to some importers and not others, resulting in misallocation, and did not generate revenue.
nTBs are not exclusive to manufacturing trade. given the rapid rise of digital trade, cybersecurity standards regulating data flow and storage have also been rolled out. Currently, the US and China each pursue a different approach to data governance and present challenges to smaller economies that seek to trade digitally with both. The Us has generally pursued an approach of free flow of data, promoting the transfer of data across borders with minimal restrictions. China, on the other hand, has taken a more restrictive approach, with data localization requirements and other measures designed to keep data within China’s borders. Casalini et al. (2021) shows that among the surveyed sample of developed and developing economies, China’s privacy and personal data protection regulation exhibits the lowest overlap with other economies (figure 49).
In addition to the different data protection and transfer policies, trade tensions have also led to increased scrutiny of data flows between major economies, which adds further costs for businesses that engage in digital trade with more than one major economy. As a result, businesses in third economies that need to transfer data across multiple major economies or between operations in these economies, may be forced to choose between compliance requirements in different economies
Another recent development is the securitization of gVCs and technology competition using export restrictions and industrial policy. These policies are set to further shuffle the landscape of GVCs for high-tech sectors such technology decoupling can affect third economies by not only reducing global trade and investment flows but also decreasing the degree of international technology diffusion.
Cerdeiro et al. (2021) have recently argued that technology decoupling would adversely affect main technology hubs and most economies across the world, including China, the United states and eU countries such as germany. The magnitude of the losses would increase with the degree of fragmentation. The authors find scenarios where non-hub countries end up trading with a single technology hub such as the United states or China to be particularly harmful, though these scenarios are extreme as discussed below. goes and Bekker (2021) estimate the global and regional welfare losses from the Us-China decoupling, another drastic separation scenario, to be as large as 12 percent in some regions because of reduced technology diffusion,
Figure 49. The Us and China have pursued different approaches to data governance
Average overlap in privacy and personal data protection regulation
and largest in lower-income regions that are more dependent on technology spillover. The following section focuses, not on extreme potential outcomes, but on what has so far happened.
China has made dramatic progress in innovation during the past two decades, with rapid growth in patenting and R&D expenditure. In the 1990s Chinese patent applications to the three major patent offices (EPO, WIPO and USPTO) were close to zero and less than one per cent those of the U s . By 2019, the last year of complete data, the number of Chinese patent applications had reached more than half the US annual total (figure 50). China has shown similarly rapid growth of both high-tech and less-high-tech patent technologies, as well as applied and basic research patents.
The quality of China’s patents is uneven. In some technology fields, especially non-high technology, China’s patent quality is close to the global frontier. one measure of the patent quality is the number of citations each patent receives – higher quality patents are more likely to be cited by other patents. The quality of Chinese innovation has been improving rapidly at the same time as the growth in the quantity of Chinese patenting. For non-high technology patents, the average quality of Chinese patents reached parity with the average Us patent quality in 2018. China’s high-tech patents tend to have a larger gap to the global quality frontier, except in some high-tech fields like Electric Motors, Batteries and Accumulators.
Declining dependence of China on Us technology was already underway in the 2000s, preceding recent Us-China tensions. one way of capturing dependence is through measuring the sources of prior knowledge that Chinese innovations build upon – reflected in the backward citations of Chinese technology patents. In the 1990s, Chinese innovations tended to build heavily on US prior knowledge – accounting for more than 60% of citations. Whereas since 2008, the Us has been declining in its relative importance for Chinese innovation. In contrast, Chinese technology innovations have become much more likely to build on other Chinese patents and now account for a similar share of citations as the Us (figure 51A). A second way of measuring decoupling is through international collaborations of Chinese inventors. Until the mid-2000s, Chinese inventors were increasingly likely to collaborate with US inventors, with almost 20% of Chinese patents involving collaboration with the US (figure 51B). However, from 2008 to 2018, the share of Chinese patents involving collaboration with Us inventors almost halved.
Declining dependence may be a natural part of economic development. Countries typically expand their domestic innovation capacity as the develop, with higher R&D expenditures as a share of gDP and increased quality and quantity of patenting (World Bank 2021). As the pool of potential collaborators and prior knowledge increases at home, inventors may be more likely to collaborate domestically and cite domestic patents, becoming less reliant on foreign sources of knowledge.
Any impact of China’s industrial policies on decoupling, if present, is tiny compared to pre-existing trends. There is little evidence that decoupling was accelerated by either China’s 2012 strategic emerging Industries (seI) policy in 2012 or the Made in China 2025 (MIC) policy in 2015, consistent with the recent findings of Han et al. (2021). Technologies targeted by China’s seI or mIC policies did exhibit faster decoupling over the past two decades in terms of fewer collaborations with Us inventors and more domestic Chinese collaborations. Crucially however, these trends were already underway years before the policies was enacted thus it does not appear to be related to the policies themselves. But rather, both seI and mIC policies targeted high tech and high tech innovation that had faster pre-existing decoupling trends.
This may be because Chinese Industrial Policy has not been efficient at stimulating innovation. There is little evidence that Chinese firms that received subsidies as part of the Strategic Emerging Industries policy or Made in China 2025 policy changed the amount or quality of their innovation (Han et al., 2021; Branstetter and Li, 2022). This might be due to
Figure 51. even before recent tensions, China’s patents decreasingly cited Us patents or involved Us collaborators and increasingly cited Chinese patents and involved Chinese collaborators (Index, 1995 = 0)
Source: Chinese patent applications at ePo, WIPo and UsPTo
Note: Dotted lines correspond to China’s WTo accession in December 2001, China’s 2012 strategic emerging Industries Industry Policy and the major revisions to the Us entity list in 2018. The backward citation share is calculated for each patent as number of backward citations from each economy as a proportion of total backward citations. The collaboration share is calculated for patents with more than one inventor as number of collaborators from each economy as a proportion of total collaborators. We aggregate using patent families, such that each patent counts once even if it is applied for at multiple offices. Citations are normalized by subtracting 1995 values. “Other AEs” includes Austria, Belgium, Denmark, Finland, France, Germany, Greece, Ireland, Italy, Liechtenstein, Luxembourg, Netherlands, Norway, Portugal, Spain, Sweden, Switzerland, the United Kingdom, and Australia, Canada, and Israel.
inefficient allocation of innovation subsidies. State-owned firms are more likely to receive subsidies and receive larger subsidies than private sector firms (figure 52) and so subsidies shift innovation towards these state-owned firms. However, because state-owned firms are less efficient innovators than privately-ow ned firms, the return on innovation subsidies would likely be higher if they were allocated more efficiently.
Initial firm-level evidence suggests sanctions hurt have Chinese innovation, but also the innovation of US firms. Collaborating with inventors from the Us or other advanced economies increased the innovation output of Chinese firms. The Us entity list expansion in 2018 appears to lead to a fall in patenting of Chinese firms that already had patents in these sanctioned technologies (figure 53). Moreover, after 2018 (the year the Us entity list was expanded), patenting also fell for Chinese firms that previou sly collaborated with the US (figure 54A). Sanctions also reduced the innovation of US firms that previo usly collaborated with China (figure 54B). Sanctions, while specific to some firms in tech fields, may have discouraged collaboration between US and China in other areas, with particularly negative impacts for those firms that had previously benefitted from these collaborations.
What happens to both Chinese and Us innovation matters for other countries in the region. First of all, developing eAP economies remain dependent on knowledge flows from the rest of the world because they still have relatively small
Figure 53. Measures taken after 2018 adversely affected the innovation of both Chinese and US firms with prior patents in sanctioned technologies
A. Chinese firms
B. US firms
Source: Patent applications at ePo, WIPo and UsPTo
Note: Event study plots of the patent applications of firms with more than 50% of prior patents in sanctioned IPC fields versus those with fewer than 50% of existing patents in sanction fields.
domestic innovation capacity (figure 55). s econd, innovation in these economies builds on prior knowledge, with patent backward citations reflecting the relative importance of the sources of prior knowledge. While still small compared to advanced economies, China has become an increasingly important source of knowledge for innovation in other eAP economies, using these citation measures. By 2014–2019, China reflected around 10% of the prior knowledge used for Singapore or Thailand innovation (figure 56). Inventors in developing EAP are also becoming more likely to collaborate with
Figure 54. Measures taken after 2018 adversely affected innovation of Chinese firms which had prior collaborations with the US, and of US firms which had prior collaborations with China
A. Chinese firms
B. US firms
Source: Patent applications at ePo, WIPo and UsPTo

Note: Event study plots of the patent applications of US (Chinese) firms with collaborations before 2018 with inventors in China (US).

Figure 55. Innovation capacity in developing eAP outside China remains relatively small
A. Advanced and developing EAP
B. ASEAN-6
Figure 56. The US and, increasingly, China are important sources of knowledge for other East Asia and Pacific countries
Panel A: 1996–2001 Panel B: 2014–2019
Chinese inventors, which was almost as likely as collaboration with the Us by 2019. While the importance of the Us in terms of citations or collaborations has declined over the same period, the Us remains the largest single country source of prior knowledge or collaborations for the region.
some recent literature highlights the risks of venturing further down the path of decoupling. The results suggest that extreme forms of decoupling may lead to dramatic welfare losses as developing eAP would miss out on knowledge spillovers from at least some more advanced economies (Cerdeiro et al., 2021; goes and Bekkers, 2022). Although these severe impacts rely on
Loom
strong assumptions, such as a full polarization of trade and technology into blocs of east and West, they serve as salutary warnings to policymakers. Fortunately, the likelihood of a global partition into separate trading blocs seems unlikely. Today, innovation in developing eAP relies on knowledge and collaborations from around the world. With the risk of disruptions to innovation, countries and firms have an incentive to further diversify their innovation networks, rather than to choose sides, as discussed in the next section.
how should third countries respond to the broad Us-China distancing in trade, investment, and technology and the increasing fragmentation of gVCs? A priority should be a reform of their own policies, discussed above, which can enhance their incomes in all states of the world (eAP economic Update, April 2022). International agreements can also help. Two mega-regional trade agreements, namely, the Comprehensive and Progressive Agreement on Trans-Pacific Partnership (CPTPP) and the Regional Comprehensive economic Partnership (RCeP), have offered avenues, especially for eAP countries, to mitigate the negative impacts of the tensions. The proposed Indo-Pacific Economic Framework may also have the potential to do so.
A growing strand of literature including, for example, Chen and Joshi (2010), shows that the decision to enter into an FTA is crucially dependent on the participating countries’ existing FTA relationships with third countries. A country’s incentive to form new FTAs rises when the country already has existing FTAs, as the potential loss in its home markets from forming a new FTA will be smaller (a home-market loss-sharing effect). however, the incentive for a country to form an FTA will be strictly lower when the partner already has existing FTAs because the potential gain in the export market from forming the new FTA will be smaller (an export-market profit-erosion effect). The incentive to form an FTA in a given context hence depends on the relative strength of the two forces. An unambiguous prediction is that countries have strong incentives to become a “hub” in the FTA network to enjoy unique market access to “spoke” countries while sharing the home-market loss with the spokes.
Applying the theoretical results to the context of the Us-China trade war, the distancing of the world’s largest two economies can conversely alter other countries’ incentives to form new FTAs with one or both nations through similar forces. Depending on their substitutability with Us-China trade, some third countries may expect greater incremental gains from a new FTA with either the Us or China amid the trade war compared to the case without a trade war. Further, countries that manage to form FTAs with both the US and China will be positioned to reap the most benefits of being the hub that connects the world’s largest economies.
The importance of FTAs during US-China trade conflicts is especially pronounced for RCEP. By reducing trade costs within Asia and, in particular, trade costs with China, RCEP will increase trade and investment flows across participating countries and foster Asian regional value chain. At the same time, however, in the absence of an FTA with the Us, RCeP members may experience potential economic distancing from the Us.
Petri and Plummer (2020a) find that the RCEP can help mitigate Asian countries’ losses from the US-China trade war. Trade among all RCEP15 countries (the three regions called “China”, “Japan and the Republic of Korea”, and “RCEP other”) would increase by $428 billion, while trade among other economies would fall by $39 billion. The strengthened trade links can also foster regional innovation systems, especially given the technology decoupling between the Us and China.
Comparing RCEP with CPTPP, Petri and Plummer (2020b) find RCEP to be more economically significant than the CPTPP. As depicted in the figure below, they estimate RCEP to make larger contributions to global and regional welfare in the context of a trade war than under pre-trade-war conditions. RCeP and the CPTPP together will more than offset global losses due to the US-China trade war, but not the individual losses of China and the United States (figure 57).
in addition to being a leading member of RCeP, China also applied to join the CPTPP in september 2021. as shown in Table 3 below, there exist significant gaps between CPTPP and RCeP in areas such as subsidies, soes, and labor market regulation.
The impact of China’s potential membership in CPTPP on third countries will depend on whether their exports are (a) destined for ultimate consumption in China; (b) compete horizontally with China’s in third markets, as is the case to a certain extent with other regional countries’ exports of electronic products; or (c) are vertically linked to China’s exports, i.e. are used as inputs by China, e.g. Australia’s coal or the Republic of Korea’s semiconductor exports, or use Chinese exports as inputs, e.g. Cambodia’s cloth imports.
EAP countries could explore the prospect of expanding and deepening the existing RCEP agreement and the opportunity of removing intra-regional tariff and nontariff barriers for trade, investment, and technology flows. ideally, these efforts would be accompanied by initiatives to deepen engagement with the United states (and the rest of the world), or at least to prevent higher barriers in those markets. The proposed Indo-Pacific Economic Framework (IPEF) could potentially be an avenue to deepen links with the US but the IPEF has so far not been crafted as a traditional trade agreement and does not offer better market access to the Us market (Lovely, 2023).
The recent announcement that China’s population began to shrink from 2022 has attracted global attention to the rapid demographic transition that is happening in the major economies of eAP and its potential economic and social implications. While societal aging can be considered a triumph of development, this demographic success heralds a new set of challenges and risks for the region, including countries’ growth and productivity, fiscal balances, and health. This section looks first at the demographic transition in eAP, examines its economic and social implications, and discusses policy directions to help countries navigate the demographic transition.
For most of the large economies of emerging east and southeast Asia, the share of older people has been increasing rapidly. Overall, the population share of people 65+ in emerging EAP will more than double from its current level to around 16 percent by 2060, or in absolute numbers from just over 250 million currently to 585 million in the same period (figure 58). In addition to the increases in 65+ populations, the share of those 80+ will increase by an even more rapid rate, quadrupling from around 1 to 4 percent of the total population. At the same time, there is considerable heterogeneity in the region in the stage of demographic transition, and other – mostly smaller – economies (e.g., the Pacific Island Countries, Papua New Guinea, Timor-Leste and the Philippines) are more concerned with productively managing youth bulges. In broad terms, the countries of the region can be grouped into those that have been experiencing rapid aging for some time and already see a decline in the share of the working age population (China, Thailand, the Republic of Korea, Japan, singapore), those where rapid aging has started and the turning point from growing to a declining working age population share is imminent (Vietnam, Indonesia, Malaysia), and those where the working age population share will be fairly flat or increase in coming decades (Mongolia, myanmar, Philippines, PICs and Png, Lao PDR and Cambodia).
The speed of societal aging in eAP is far more accelerated than currently richer and older oeCD and eCA countries, with the transition from aging to aged societies (i.e., from reaching 7% of total population 65+ to 14% in that cohort) taking 20–25 years for most East and Southeast Asian countries, in contrast to 50–100+ years in those other countries (figure 59).
eAP countries are also becoming aged societies at far lower income levels than their oe CD counterparts, with PPP per capita gDP at peak working age shares between 10 and 40% of the level of the United States at the same point in demographic transition (figure 60).
The main driver of these population dynamics is the rapid change in fertility behavior, although the steady increase in longevity across the region is also contributing to societal aging. not only has the decline in fertility been rapid (across countries at all stages of demographic transition), but it appears to be inexorable, and eAP is now home to both the world’s second lowest fertility country (Korea Rep., which in 2022 had a total fertility rate of only 0.78) and some of the lowest fertility rates of major emerging countries (China and Thailand). The regional average total fertility rate (TFR) had fallen to 1.6 by 2020, well below replacement (figure 61). To date, policy efforts to reverse the decline have largely failed to achieve the intended results (e.g., China’s childbirth incentives since the complete removal of the one-child policy in 2016 and Korea, Rep. and Japan’s efforts to revive birthrates).2
from reaching 7% of total population 651 to 14% in that cohort
Related to the low level of economic development at which aging is occurring, eAP countries are in several ways underprepared for their demographic transitions. First, systems for old age financial protection are under-developed, with relatively low coverage of formal pension systems (figure 62), and very modest social pension and social assistance adequacy for older people. second, healthcare systems offer shallow financial protection against out-of-pocket costs, despite significant progress toward universal health coverage, and formal aged care is at best nascent in emerging Asia. Third, labor markets are often stubbornly informal, complicating expansion of old-age financial protection beyond the minority of people employed in the formal sector in most countries (figure 63).
Figure 61. Rapid declines in fertility have been the main driver of rapid aging in eAP Source:
Coverage of contributory pension schemes in many eAP economies
While there are many current and potential impacts from population aging in eAP, the discussion below focuses mainly on the implications in three key areas: productivity and growth; fiscal balances; and health and wellbeing. Each of these areas is discussed in turn below.
Population aging may impact growth and productivity through different channels. The first and most direct channel is through the decline in the share of the working age population (typically defined as the population age 15–64). Changes in working age share in coming decades can be seen in figure 64, though the experience of recent decades in e AP suggests that the medium fertility assumption behind the projections in the figure may understate the actual future working age population decline. other things equal, this decline in working age population will negatively impact growth, transforming eAP’s demographic tailwind to growth to a demographic headwind.3 even for younger eAP countries, the strength of the demographic tailwind for growth is expected to weaken over coming decades as growth in countries’ working age populations slow. The accompanying impact is on oldage dependency ratios, which rise as the relative shares of working age and older populations shifts. While there are
a number of policies and behavioral responses on quantity and quality of labor and with respect to substitution of capital for dwindling labor forces that can dampen the pure demographic impacts on growth, the urgency of such policies is more acute given the underlying demographics.
Across countries, changing demographics also affect comparative advantage, with likely impacts on trade and investment flows (Cai and Stoyanov, 2016). At the aggregate level, as labor forces shrink, the wages of the smaller workforce are expected to rise (as for example seen over the past decade in China as the working age population has fallen). This will be particularly the case in sectors which are more reliant on age-depreciating skills. shrinking working age populations would in turn shift comparative advantage away from reliance on cheap and abundant labor and incentivize movement of investment to countries with more labor-intensive endowment mixes. To compensate, countries with older populations would be expected to invest in labor-saving technologies or to shift the sectoral composition of investments towards industries that rely more intensively on skills that appreciate, or depreciate more slowly, with age.4
It should also be noted that there is considerable labor force participation among older people in the region, so that the standard definition of working age population may not strictly apply in much of EAP. Between a third and over a half of all men and a quarter to a third of women 65 and older still work in several major economies (Vietnam, Thailand, Indonesia, Korea, Rep., Philippines, malaysia for example), so that standard dependency ratios need to be treated with caution (figure 65). Steady increases in health life expectancy (HLE) also mean that people have higher potential for work at older ages than has historically been the case, although the increasing gap between hLe and total life expectancy also suggests rising care needs in people’s later years (figure 66). While current participation patterns and higher potential for work at older ages are positives, work at older ages in the region currently tends to be more concentrated among those with lower education levels and in less productive sectors of the economy, so that productivity of work at older ages remains a major challenge.
4 In analysis of population aging and growth, Acemoglu and Restrepo (2017) find no negative correlation between older worker shares and GDP PC growth from 1990-2015 for a sample of 169 countries, after controlling for initial GDP per capita, initial demographic composition and trends by region. While not causal, they suggest that shrinking cohorts of younger workers may induce accelerated adoption of automation technologies which offset or even reverse the negative labor force quantity effect.
In addition to labor force participation, aging itself may influence workforce productivity, although evidence on the relative productivity of older workers is mixed. While the productivity-age profile in general is found to follow an inverted U-shape, macro estimates of the effect of age on aggregate productivity find that older workers are no less productive than younger workforces, on average (World Bank 2016, 2021). Direct evidence for emerging Asia is limited; however, a study of 12 Asian countries, including the major economies of East and Southeast Asia, did find a decline in TFP growth related to aging (Park and shin, 2011). To the extent that declines in productivity with age are observed, they appear more pronounced in jobs requiring more fluid abilities (problem solving, learning and speed), while those relying on crystalized abilities (dependent on experience and verbal ability) show little or no age-related decline (Skirbekk, 2008). At the same time, findings of declines in physical productivity after around age 40 are not observed in mental productivity (Van ours, 2009).
several factors may, over time, serve to mitigate or offset age-related declines in productivity. To the extent that technological advances make many jobs physically less demanding, this should help compensate for any age-related productivity declines. Indeed, to the extent that smaller labor forces are complemented by more intensive capital/labor substitution, the negative quantity impact on output may be mitigated by higher per worker productivity. moreover, education levels of workers in the region have been rising, and evidence indicates that the cognitive and physical performance of workers is also improving over time, so workers’ age-productivity profiles are likely to be rising over time (i.e., 60 is the new 50).
Aging may also affect growth and productivity through other channels, for example, through its effects on savings and interest rates. To the extent that declining quantity of labor requires capital deepening, the effect of aging on savings behavior becomes more salient. Unlike declines in the working age population, the impact of population aging on aggregate savings is not straightforward to predict, as the net impact depends on whether compositional effects (i.e., lower savings rates due to greater dissaving among older people) or behavioral effects (i.e., higher savings as people anticipate longer lives and periods of labor market inactivity) on savings rates dominate. estimates for Asia suggest on balance that concerns over declining savings rates may be overstated; some researchers find a positive but only short-lived positive impact of aging on savings, while others find more sustained positive impacts in response to longevity increases (Kinugasa and Mason, 2007; Li et al., 2007; IMF, 2019). At the same time, international literature suggests that population aging is likely to result in a long-run decline in real interest rates due to the combined effect of households accumulating assets faster in response to rising life expectancy and greater capital abundance due to a smaller population (World Bank, 2019; Eggertsson et al., 2019).
A second channel of impact from population aging is on fiscal balances which are likely to be strained on both the revenue and expenditure sides. On the expenditure side, the pressures on public finances will come from rising pension costs, health and long-term care spending.5 Figure 67 presents estimates of significant increases in contributory pension spending in the absence of deeper policy reforms. A key driver of both current and projected spending is civil service pension schemes, which are much more generous than private sector schemes in a number of countries (figure 68). This results in significant and rising unfunded liabilities (figure 69). While countries such as China and Vietnam have started to reform civil service pensions, the transition periods are long, and the fiscal burden will continue for some time. This is of particular concern in a low-revenue region like eAP. Increases in spending on formal sector pension schemes are likely to be added to by ongoing efforts to expand non-contributory social pensions and other programs, such as matching defined contribution schemes, for those with careers in the informal sector. on the revenue side, the declining size of working age population will shrink the contribution base from which pension, unemployment, and health insurance systems are financed in several major economies in the region, necessitating either ever-increasing and distortionary labor taxes or significant reforms in how entitlement programs are financed.
Aging is also likely to drive up health and aged-care spending over time, but the public spending impacts are likely to be more modest, as aging is a less significant driver of healthca re costs than factors such as medical technology and other policy choices on efficiency and cost control (World Bank, 2016; Normand, Williams and Cylus, 2022). Analysis for Asia suggests that aging per se is likely to account for a third or less of increase in health spending even in older countries (World Bank, 2016). Nonetheless, there will be a demographic impact. I m F and the oe CD estimate increases in annual health spending purely due to aging of between 0.5 and 0.9% of GDP for China, and of between 0.3 and 0.5% for Indonesia and Philippines between 2010 and 2030. Who analysis suggests population aging will similarly drive increases in public healthcare spending in Vietnam and mongolia. For long-term care (LTC), not only will a growing cohort of “oldest old” people increase care needs, but the expected increase in the gap between healthy and total life expectancy (and fewer adult children to provide informal care) suggests longer periods of LTC needs in later life. LTC spending increases will be from very low bases and highly dependent on policy choices, but the oeCD estimates for China and Indonesia suggest increases of 0.2–0.3% of gDP in annual LTC spending from 2010–30 (De La maisonneuve and martins, 2013).
The epidemiological transition towards a non-communicable-disease-dominated burden of disease will have implications for people’s health as well as for how health systems are organized over time (figure 70). This is not entirely an aging-driven transition, but aging populations with higher non-communicable disease (nCD) prevalence and higher co-morbidities will accelerate the transition and exacerbate the need for structural reforms in the health sector.
Figure 70. The epidemiological transition in emerging eAP requires reforms to prevent, control and manage non-communicable diseases across the lifecycle
navigating population aging will require not only wide-ranging policy reforms, but also broader societal changes in behavior and attitudes. The discussion below focuses on several key areas that are central to navigating the growth and productivity, fiscal, and health challenges arising from population aging in the region. The experiences of older, high-income countries in the region, such as Japan, singapore and Korea, Rep. provide important insights into ways forward, although a paucity of rigorous evaluations highlights a need for more evidence on the impact and cost-effectiveness of different policies.
In the face of shrinking working age populations, countries need to focus both on raising participation of adults across the lifecycle and on increasing the quality and productivity of the smaller future labor force. Policies in older countries in the region aimed at increasing the quantity of labor offer several lessons, some of which are beginning to be adopted in emerging eAP countries.6
• Reforms of labor market regulations should facilitate flexible forms of work (e.g., part-time, job sharing, remote work), making it easier for people to continue work in formal settings at more advanced ages. such reforms are important to promoting a shift from retirement “cliffs” towards retirement “glides”.
has been shown to improve
• Reforms of social security, wage setting, and tax systems should remove disincentives to work at older ages (e.g., unfavorable tax treatment of non-pension retirement income). These reforms should include retirement ages that adjust periodically (and automatically) to reflect changes in healthy longevity at older ages. Such efforts can be enhanced by anti-discrimination and labor laws that address age-related discrimination. singapore and the Republic of Korea have also introduced wage subsidies for older workers to promote retention and hiring.
• Policies that facilitate regulated labor migration between countries at different stages of demographic transition can also help increase receiving countries’ labor forces. The positive experience of Australia and new Zealand in promoting labor mobility from the Pacific Islands and other parts of the region offers lessons in managed increases in migration flows, including through the alignment of training systems in sending countries with the skills demand profile of receiving countries.
With respect to quality and productivity of the workforce, promising policy directions include:
• Building systems of adult learning to ensure sustained skill upgrading across longer working lives, including more short-term training offerings and training methods that account for the distinct ways that older workers learn. Through its skillsFuture program, singapore provides all citizens over 25 with publicly funded training accounts to enable continued skills development. Additional training credits are provided for workers, age 40–60, to support them in upgrading their skills (www.skillsfuture.gov.sg/credit).
• Phasing out of wage-setting practices that do not reflect relative worker productivity across the life cycle. Asia has historically had strong seniority-based wage setting which undermines the cost-effectiveness of retaining older workers. Singapore (with financial incentives to firms to remove seniority wage mechanisms) and Korea, Rep. (with its peak wage system which gradually reduces salaries from age 55 and offers financial incentives to firms adopting the approach) provide incentive-based approaches.
The most pressing fiscal challenge associated with aging in emerging EAP countries relates to providing adequate and sustainable old-age income security. most eAP countries face the dual challenge of expanding coverage of adequate old-age financial protection among informal workers at the same time as existing contributory pension schemes – most notably those for civil servants – often face challenges of sustainability or adequacy.7 Reforms of contributory pension schemes go hand-in-hand with creating fiscal space for expanding coverage in a way that is fair to different cohorts of retirees and avoids aging-related escalation of public debt. As EAP countries undertake fiscal consolidation post-pandemic, they will also need to address the longer-term fiscal sustainability question related to resources to deal with population aging and financing climate actions.
A key reform priority relates to financing of pension systems. For pay-as-you-go defined benefit schemes found in much of east and south-east Asia, funding entirely from social contributions of existing workers is problematic as system old-age dependency ratios rise. given that steadily raising social contribution rates is neither politically feasible nor economically desirable due to its distortionary effects, it will be necessary to partially finance contributory schemes from general revenues.8 This will lead to a blurring of the financing lines between social insurance and social assistance, as is already being seen in
countries like Japan, where the basic pension is funded in significant part from sales taxes, and in Mongolia, where structural deficits in contributory systems are already funded from the general budget. This is not an issue for defined contribution provident funds seen in former British colonies in the Pacific, Malaysia, and Singapore. In those systems, the major challenge relates more to adequacy of workers’ accumulations at retirement.
Beyond the need to rebalance the funding of contributory pension schemes, several types of reforms will be needed, including:
• Reforms are needed to improve intra- and intergenerational equity in contributory pension systems while balancing sustainability and adequacy goals. The specific reforms needed vary across eAP countries but may include adjustments in accrual rates and retirement ages (including equalizing for men and women), contribution rates, earnings averaging and valorization rules, minimum pension rules, and indexation. some challenges are common. With the exception of Vietnam, for example, pension contribution rates are much lower than would be required to equate contributions with benefits over the lifetime of an average worker (figure 71).
• To mitigate labor market, equity, and fiscal impacts, there is a need to deepen reforms and integrate civil service pensions with private sector pension schemes across much of EAP (outside of the Pacific Island countries). Integration is more challenging where the disparities between public and private pensions are large and may require gradual transitions (as in Vietnam), or use of supplementary occupational schemes for civil servants as their basic pension is integrated, to avoid dramatic falls in generosity across age cohorts of public sector workers (as in China).
• For defined contribution schemes, the main challenge is to improve the adequacy of pensions at retirement Pension accumulations in the region’s provident funds are typically inadequate for providing old-age income security. A key driver of this problem is generous early-withdrawal rules (as seen acutely during the CoVID crisis, where individual accounts balances were sharply reduced as workers were allowed to withdraw their funds to cope with the pandemic). The reform challenge in these countries is improving adequacy at retirement at the same time as responding to member desire for protection during their working lives against short-term shocks and
events such as house purchases.
• Expand informal sector pension coverage and improve adequacy with innovative instruments and financing. given low coverage among informal workers, expanding coverage is a high priority, although one which will increase fiscal costs. Available estimates for EAP suggest that significant and adequate social pension coverage can be achieved at a fiscally affordable costs in most countries.9 Achieving this would require some mix of three options:
Source: World Bank staff’s estimates.
Note: The actuarially fair contribution rates is the rate which ensures that present value of contributions equals to present value of benefits, given the rules of the scheme and average life expectancy in the country. A scheme with actuarially fair contribution rate from the onset is designed to be self-sustainable but over time as demographics change the contribution rate needs to be adjusted to ensure scheme sustainability.9 See for example, Lu et al (2011) for China; Nguyen (2019) for Vietnam; Knox-Vydmanov et. al. (2017) for Philippines; and Kudrna et al. (2021) for Indonesia.
- expanding coverage of social pensions (and in a number of countries increasing their adequacy). Whether social pensions are universal or targeted to specific older populations will affect both the financial protection they provide and their fiscal costs. Practice in the region to date is mixed.
- Encouraging voluntary contributions from informal sector workers, perhaps with financial incentives as seen in several eAP countries (e.g., Thailand, malaysia, and Vietnam). With few exceptions, however, voluntary contributory programs have tended not to result in major expansions in coverage to date.
- Fully subsidizing the contributions of those least able to afford them. This approach has been used for health insurance in several eAP countries and has been successful in raising coverage of social health insurance. The only options that can achieve universal coverage and provide a minimum level of financial protection in the long run are quasi-universal social pensions, heavily subsidized contributory pensions, or a combination of the two.
Promoting healthy and more productive longevity will require reform of countries’ healthcare systems, both in terms of service delivery and financing. Well-designed reforms can simultaneously promote better health outcomes and improve the efficiency and sustainability of countries’ healthcare systems. Among the key priorities for healthcare reform:
• A first priority involves reforms to better prevent, control and manage NCDs across the lifecycle . This is of particular importance for aging populations who experience higher nCD co-morbidities and admission rates. Tackling nCDs requires strengthening strategies to reduce exposure to key risk factors through health promotion, improved medication adherence, public health interventions, and public finance measures, including raising taxes on tobacco, alcohol and sweetened beverages.10 more fundamentally, it will require transforming healthcare delivery systems to focus on integrated primary-care centered care, moving away from over-reliance on costly and inefficient hospital care towards greater use of preventive, ambulatory, community-based and home-based care.11
• A second focus of reforms should be on getting better value-for-money in health systems and, specifically, controlling the non-demographic drivers of costs. This includes improved healthcare purchasing arrangements to reduce incentives for unnecessary treatment. Thailand provides a good example of reforms in this area, combining a strong health purchasing agency, which has used its bargaining power to reduce drug and service costs, with provider payments reforms, including performance-based supplementary payments (hanvoravongchai, 2013). It also involves more evidence-based prioritization of healthcare packages to better align the nCD-dominated burden of disease with core services and pharmaceutical lists, and health technology adoption informed by health technology assessments. The Republic of Korea’s national Insurance service is illustrative in this regard, with assessment of proposed drugs and medical technology based on clinical and cost-effectiveness grounds, budgetary impact, and international price benchmarking.
• A third area of focus for aging countries involves preparing for functional and cognitive decline among older populations While better prevention and management of nCDs can delay onset and reduce the aggregate economic burden, degenerative conditions such as worsening eyesight and hearing, joint and bone weakening, and dementia will increase as populations age. some interventions are simple and cost-effective, for example, regular eye and hearing testing, increased calcium intake, regular exercise, improved social contact, and treatment of osteoarthritis with nonsteroidal therapies. For dementia, which is expected to nearly triple to over 70 million people in Asia and the Pacific between 2015 and 2050, the costs of care can be high and sometimes prolonged. The key is early diagnosis, delay of onset, and symptom management.12
For LTC, the first priority will be defining the role of the state and the “rules of the game”. As a relatively new service sector in most countries, defining effective and sustainable approaches to financing and system governance remain important challenges. Different countries have taken different approaches to LTC finance. Whereas countries like Japan and the Republic of Korea have taken the approach of dedicated social LTC insurance (and China has a growing set of subnational LTCI pilots), others such as Thailand and Indonesia have relied on general revenue financing through the health system. modes of sectoral governance – and associated institutional arrangements – are also evolving. nevertheless, the need for good coordination between the social welfare and health sectors, building on a clear high-level policy framework, is becoming increasingly apparent.
The experiences of Japan and the Republic of Korea with development of LTC systems over the past two decades are instructive, and the emerging approaches of China, Thailand, Indonesia and Vietnam offer lessons for further development of the sector (Piggott and Yiengprugsawan, 2023; o’Keefe and Yiengprugsawan, forthcoming). Key lessons from those experiences include:
• First, an approach that maximizes “aging in place,” wherever feasible, is more sustainable and better aligned with the preferences of older people. This requires, however, a shift from an historical policy emphasis on residential care for older people to development of formal home- and community-based care modalities.
• second, global and regional experience suggests an important role for private sector service providers (forprofit, not-for-profit and community-based), supported with state financing and appropriate regulation. Public stewardship, in turn, requires development of government regulatory capacity and support systems.
• Third, it is vital to include interventions that target social isolation as well as activities of daily living13 to delay cognitive decline and minimize the risk of depression. such interventions can be cost-effective and are wellsuited to community-based approaches.
12 See Alzheimer’s Disease International (2014) on prevalence, economic costs and management strategies in Asia and Pacific.
13 Activities of daily living are essential and routine tasks that most young, healthy individuals can perform without assistance The activities of daily living are classified into basic ADLs and Instrumental Activities of Daily Living (IADLs). Basic ADLs are those skills required to manage one’s basic physical needs, including personal hygiene or grooming, dressing, toileting, transferring or ambulating, and eating. Instrumental Activities of Daily Living (IADLs) include more complex activities related to the ability to live independently in the community, including activities such as managing finances and medications, food preparation, housekeeping, laundry (NIH website: https://www.ncbi.nlm.nih.gov/books/NBK470404/).
The EAP region is contributing to climate change but is also suffering its consequences. China emits about 24.8% of global totals and Indonesia 3.6%, while the other 26 developing countries in the region combined emit a total of 4.2% of global emissions. Of this amount, Thailand, Malaysia and Vietnam emit less than 1% each, and the Philippines and Myanmar emit 0.5% each.14
While emissions reduction is important, climate vulnerability is an equal and understandable priority. Reducing climate risk has high immediate and direct benefits from the community level (e.g., from reduced flooding, reduced asset destruction, reduced lost income, and improved health and education) to the national level (reduced threat of fiscal or trade imbalances, financial sector shocks, or increased debt stress). Furthermore, investing in adaptation only serves to shine a spotlight on the need to mitigate. since no country can adapt its way out from under climate impacts, the cost and complexity of adaptation only reinforces the need to mitigate. Further, if and when global tipping points are approached,15 the damages associated with climate change will become even more impossible to address with adaptation measures.
Recent studies in the eAP region, including from the World Bank Country Climate and Development Reports (CCDRs), give an idea of the economic and social dimensions of climate risks in eAP. The region is particularly exposed to climate risks, in part because of the high density of population and economic activity along the coasts:
• eAP stands out as the region with the highest urban growth rate and the largest proportion of settlements in the highest flood risk category (inundation depth over 1.5 meters) (Rentschler et al., 2022).
• More than half of the annual losses from natural disasters worldwide occur in EAP (Baker and Gadgil, 2017). These amounted to about $50 billion in 2021 (munich, Re, 2022). In a +2°C world, eAP would see an additional 50 million people regularly exposed to coastal flooding by 2100. Without major adaptation efforts, coastal, river, and chronic flooding alone could lead to GDP losses of 5–20 percent by 2100 in Indonesia, Vietnam, the Philippines, and China (World Bank and Vivid economics, 2019).
• Because of its high level of urbanization, eAP is highly exposed to the Urban heat Island effect, with urban areas experiencing temperature increases of up to 8°C. Recent studies estimate that 1°C increase in annual mean surface temperature increases mortality in EAP cities by 6 percent, electricity consumption by 3–9 percent (Zhao et al., 2021). Heat also impacts crime rates, learning outcome and productivity. Figure 72 shows increased heatrelated mortality in eAP that is comparable to the menA region.
• Climate impacts are most pronounced across the sIDs, where natural disasters are estimated to already cost the region over 2 percent of GDP every year and sea level rise is likely to threaten the existence of entire low-lying atoll island nations (Kiribati, marshall Islands and Tuvalu) (Thomas et al., 2020).
• Up to 7.5 million more people in EAP could fall below the extreme poverty line without climate action by 2030 (Jafino et al., 2020).
Global Climate risk index: Ranking 1999–2019
Some country-specific indicators also reveal the economic risk that EAP countries face due to climate change. In the Philippines, climate change without adaptation will increase the poverty rate by nearly a percentage point, economic insecurity by 3.3 points, and inequality by 0.3 points (World Bank, 2022a). In Vietnam, two World Bank forecasting models indicate that climate change impacts could cost Vietnam a total of 12–14.5 percent of GDP or cumulative costs of $400–$523 billion, by 2050. About 45% of the Mekong Delta would be affected by salinity, and up to 1 million people could fall into extreme poverty without adaptation measures (World Bank, 2022b). In China, the country’s densely populated, economically critical, and climate vulnerable low-elevation coastal cities account for a fifth of China’s population and a third of its GDP (World Bank, 2022d). Modeling shows that climate change could result in GDP losses up to 2.3 percent per year as early as 2030, losses which disproportionately reduce the incomes of bottom 40 percent of the income distribution by 4.7 percent (figure 73; Hallegatte et al., 2016). Other research suggests GDP losses up to 3.5 percent by midcentury, and up 6 percent by 2100, depending on the climate scenarios (CMCC 2021; Swiss Re Institute 2021). In its most recent Article IV staff surveillance report, the IMF rates climate risk as a “medium” but worsening structural risk.16 A “medium” probability is between 10 and 30 percent of materializing, and structural risks are those that are likely to remain salient over a longer horizon.
These damage estimates are likely to steadily increase in coming years, since the economic valuation of damages associated with climate change is increasing every year. In fact, they are increasing far faster than physical upwards trends of Co2 concentrations in the atmosphere or the intensity of extreme events. This is shown clearly in the recent evolution of the estimated global social cost of carbon (see Box 8).
A. Change in GDP
B. Change in income of the bottom 40%
The social cost of carbon is the estimated cost to humanity of emitting one ton of carbon dioxide into the atmosphere, including everything from the cost of lost crops and flooded homes to the cost of lost wages and climate-related deaths. The Obama Administration estimated that the cost would be $36 per ton in 2015, rising to $42 in 2020 and $46 in 2025.17 In 2022, the ImF cited and adopted the use of a 2019 estimated average cost of carbon of $80 per ton (Adrian et al., 2022), to be contrasted with the late 2022 Biden Administration proposed raising the marginal value of $190 per ton effective 2020. even the $190 value omits many categories of climate change damages, such as climate-related sickness, changes in labor productivity, climate impacts on non-coastal assets, the costs and feasibility of providing safe drinking water, and changes in ecosystem services, to name just a few (UsePA, 2022).
Why are climate change damage estimates going up so much faster than physical trends? The main reason is that economists better understand – and value – the multiple impacts of physical trends on people and livelihoods, beyond simply estimating the impacts of extreme events on assets as is common to the insurance industry. Better understanding of these economic factors is fundamental to using the social cost of carbon in policy and project analysis (Brandon, 2018):
• The size of the affected population is growing, especially in coastal areas;
• Affected populations are getting older, and hence more vulnerable to high heat;
• Per capita incomes of the affected population is rising, which means greater losses when disrupted;
• Unit and total asset values of buildings and infrastructure systems are rising;
17 Wikipedia entry on the social Cost of Carbon.
• Vulnerable areas, especially around cities, are expanding (e.g., hillside slums);
• Increasing environmental degradation decreases resilience to climate impacts, such as for flooding, heat, and drought;
• The extent of farming on marginal lands (with relatively higher climate impacts) is increasing;
• Increased disruptions in supply chains and trade with ripple effects.
As described above, many of these factors are important aspects of the high exposure of eAP country populations to climate change.
given physical, economic, and social trends, eAP countries clearly need to invest in their climate resilience. To address where and how, this section takes two steps. First, it gives high-order estimates of the costs of adaptation, combined with reasons why these cost estimates are still very preliminary; and second it compares these costs to the benefits of reducing climate risk. Box 9 illustrates the range of actions that comprise climate adaptation – including one category that is largely investment-oriented (ex-ante risk reduction) and another that is largely financially-oriented (ex post risk management).
Analysis of the nDCs submitted by eAP countries give an idea of the sectors that the countries themselves see as a priority for adaptation interventions (figure 74). Not surprisingly, the agriculture sector tops the list, followed by developing the institutional capacity and data needed to better plan and implement adaptation strategies.
There is no single cost of building climate resilience – too much depends on very area-specific conditions and vulnerabilities (hallegatte et al., 2018). These include the time horizon of local risk tolerance; the sequencing of adaptation programs and investments; construction and maintenance quality of both existing and new assets; the level of family and community savings needed to withstand climate change; spillover effects from neighboring jurisdictions; the uncertainty of future global mitigation actions; and the uncertainty of local climate impacts for any given emissions scenario.
That is why very few countries or even municipalities have fully developed adaptation strategies, including cost estimates and financing requirements. A recent review of all NDCs prepared for COP26 in Glasgow showed that of 21 countries in East Asia and the Pacific (including high income countries), only 5 countries (24%) offered an even a rough estimate of adaptation costs. Those estimated costs are in the range of a few hundred to a few thousand dollars per capita over the time span of the nDC (Table 4). The complexity of adaptation is also why recent CCDRs only tentatively estimate total adaptation costs, and often revert to rules of thumb for new infrastructure and buildings, old infrastructure and buildings, and other systems such as food, health, education, and the environment.
The first grouping of climate adaptation is risk reduction, such as ex ante investments in infrastructure and agriculture, and policies to reduce risk such as regulating against construction in flood-prone areas and protecting nature that stabilizes hillsides and protect cities from storm surges. The second main grouping is risk management, including measures ranging from early warning systems to sovereign risk insurance and social safety nets.
Agriculture research and development
Climate-proofing buildings and infrastructure
Land-use planning
Nature-based solutions to protect people and assets
Permanent relocation (migration)
Risk reduction
Early warning systems
Forest-based action (contingency planning)
Strengthen first responders
Temporary evacuation
Insurance and risk finance instruments
Social safety nets
Recovery services, including health and education
Build back better
Risk management
Adaptation planning includes assessing how to allocate resources across all the of options shown here, and at what levels. There are also differing time horizons, such as prioritizing investments in short-term flood management vs. long-term agricultural research. Finally, inherent in how governments assess these options is incorporating measures to incentivize private sector cost-sharing to the extent possible.
Cost benefit analysis shows that the returns on risk reduction are higher than for risk management, except for the essential but relatively low-cost measures associated with early warning systems (Brahmbhatt et al., 2019).
The ImF estimates global adaptation needs at around ¼ percent of world gDP per year, but emphasizes the large disparities of adaptation costs across countries and the high uncertainty (Aligishiev et al., 2022). Annual adaptation costs will exceed 1 percent of GDP for some developing countries and be above 10 percent of GDP for some island states, whose very existence is threatened. other estimates of cumulative resilience needs for Dominica, Fiji, Grenada, and Tonga range from 100 to 500 percent of GDP, although some of these needs might be defined very broadly (grenada, 2021; ImF, 2020e, 2021b; government of the Republic of Fiji, 2017).
Other country-specific adaptation cost examples are:
• In the Philippines, projected investment levels indicated by Cge modelling gives a conservative estimate of 0.7% of GDP for adaptation investments, not including the cost of retro-fitting existing infrastructure (World Bank, 2022a).
• In Vietnam, the IMF estimated the cost of adaptation to be 3–4 percent of GDP over the period 2021– 2025, and the World Bank estimates a range of 4.5–5.4 percent of GDP per year over the period 2022–2050 in net present value (Table 5). Current financing available is barely 25% of estimated requirements (World Bank, 2022b).
Source: World Bank staff’s analysis, based on WDI ClimateWatch 2023.
Source: World Bank Vietnam CCDR, 2022.
Note: NPV is net present value; all those amounts reflect a 6 percent discount rate.
• In China, one study estimates that 1.5–2% of GDP ($250 billion per year) is required for adaptation programs (Chai et al., 2019).
• In Samoa, the annualized cost of prioritized adaptation projects for 2022–26 is around 11 percent of 2021 GDP, based on currently identified projects and sectoral plans (Kinoshita, 2022). The cost of adaptation is double the combined cost of achieving the other SDGs and reaching national emission reduction targets (Table 6).
At the sector and macro levels, the benefits of adaptation investments are clear. For example, in Samoa, investing an additional 2 percent of GDP in adaptation for the next five years would save about 4.5 percent of 2021 GDP in output losses (Kinoshita et al., 2022). Furthermore, financing additional ex-ante adaptation investment is likely to result in net savings for international donors, especially when natural disasters become more intense – since ex ante risk reduction is much cheaper than post-disaster reconstruction. Finally, the samoa analysis shows that long-term debt sustainability would improve with additional ex-ante adaptation investment. Even if financed entirely through (concessional) borrowing, lower post-disaster reconstruction costs would contain the overall increase in the debt-to-gDP ratio.
The Philippines CCDR shows that all sectors would benefit from climate adaptation measures: investments of less than 1% of GDP would avoid losses of 1–2% of GDP in many sectors (figure 75). modeling the employment impact of adaptation investments also helps build popular support (figure 76).
Figure 75. All sectors will benefit from adaptation investments in the Philippines
still, however, globally and in eAP, there is under-investment in climate adaptation. The high benefits of adaptation investment are under-realized. Drivers of this under-investment include lack of complete information on risks, costs of addressing those risks, and benefits. They also include such market failures as poor information, distorting regulations, imperfect capital markets, and lack of public-private coordination over public goods aspects of adaptation actions.
It is commonly thought that the economic benefits associated with investments in climate adaptation is equal to the climate damages averted, i.e., the “avoided losses.” Avoided losses are the primary benefit stream in any cost benefit analysis of adaptation program and projects. however, recent more detailed analysis of a range of adaptation investments shows that the returns on investment can be much greater than simply the avoided losses (heubaum et al., 2022). This analysis, referred to as the triple dividends, uses cost-benefit analysis (CBA) to properly estimate avoided losses (first dividend), induced economic or development benefits (second dividend), and additional social and environmental benefits (third dividend) of adaptation actions.
The analysis shows that for a wide range of adaptation investments (Box 10), the second and third dividends are especially important since they accrue regardless of whether the actual climate risk actually occurs. They can often exceed the value of avoided losses and generate project benefit-cost ratios (BCRs) greater than 1 even when the value of avoided losses is not considered.
The triple dividends analysis shows the extent to which many adaptation investments have been under-valued and hence under-invested. It also shows that many adaptation investments:
• Have high economic returns and are viable even without concessional climate finance.
• Are viable independent of the probability of the climate risk. The second and third dividends are not sensitive to the time frame of the identified risk. i.e., whether it is perceived as being a 5, 10, or 25-year risk.
• Have both public and private costs and public and private benefits. Careful mapping of these is useful for shaping blended finance deals, typically where the public sector reduces private risks or costs (see below).
The triple dividends approach can also be scaled up from the project level to help identify sectoral priorities and help generate economic, financial, and political support for adaptation measures. At both the project and sectoral levels, analysis can close knowledge gaps, provide more consistent and comparable assessments, and help look across at national systemic priorities vs locally prioritized concerns. most importantly, through its use of CBA, it can help countries improve project appraisal and access to finance.
As total investment in adaptation increases, some argue that there may be declining marginal returns (just as in other areas of investment) (Aligishiev et al., 2022). But given the complex matrix of local geographies and sector vulnerabilities across the countries of eAP, this point is far in the future. still, tackling the sources of under-investment in adaptation is important, including through better: (a) understanding of climate risks, (b) understanding of options for addressing those risks, (c) estimates of the costs and benefits of priority options, and (d) development of financing models that would capture, to the extent possible, private financing of private benefits. On the question of private finance, financing models should include fiscal instruments such as betterment or property taxes, as well as more direct investment approaches to blended financing, PPPs, or tax incentives.
Adaptation finance is not currently the only and perhaps not the main constraint to expanded investment in climate adaptation. Few governments have costed out adaptation strategies in their nDCs or national Adaptation Plans (or nAPs,
The triple dividend concept dates to 2015, and was highlighted by the global Commission on Adaptation in 2019 (figure B10.1). In 2022, Heubaum et al. (2022) advanced the concept empirically showed its applicability across a range of sectors and countries (Table B10.1).
Figure B10.1 Investing in adaptation will deliver a triple dividend
Climate-resilient new infrastructure typically adds 3% to upfront costs but has benefit-cost ratios of 4:1.
Reduced flood risks lower financial costs, increase security, and help induce high-value investment in cities.
The Thames barrier induced development of Canary Wharf and East London
Drip irrigation increases yields as well as reduces drought risk.
Nature-based flood protection also increases biodiversity, makes air and water cleaner, offers recreation, and improves health.
Mangrove protection and restoration abate coastal surges, support local fisheries and forestry, and store carbon. Combined benefits are up to 10 times greater than the costs.
Source: Adapted from global Commission on Adaptation, oDI, gFDRR and the World Bank.
Empirical analysis of adaptation investments shows that each dividend is often significant. A analysis recent of seven different projects targeting different categories of climate change impacts – forests and wildfires, urban flooding and drainage, stormwater management, coastal flooding, urban heat islands, and drought – shows that in all cases, valuing the three dividend types makes a significant difference in assessing total project benefits (Table B10.1).
Table B10.1. Valuing the triple dividend reveals the high returns to investment in different adaptation projects
Source: World Resources Institute (WDI), 2022.
Princes Park (Australia) Felixstowe (United Kingdom) Washington, DC Philadelphia
(China)
Kunshan Forest Park (China) Project cost (Us$ million) 4 1.2 6.7 20.3 838 2,380 1,970 Project benefits (US$ million) 22.9 59.7 12.7 644.9 5,750 10,780 11,050 Benefit-cost ratio: all dividends 5.7 49.6 1.9 31.8 6.9 4.5 5.6
For four of the projects shown above, the second and third dividends are larger than the avoided losses, and in some cases much larger. In the other three cases, the avoided losses are the largest dividends, and account for BCRs of 2.3 to 4.5. But for even those projects, the second and third dividends alone have BCRs of 1.2–3.1.
supported by the UNFCCC). Few governments are ready with good econmic and financial analysis of adaptation finance policies and projects. There is growing realization of the need to do so, not only because of rising physical climate change risks, but because the World Bank, ImF, and other donors are demanding better understanding of those risks. Donors are also helping to highlight the links between reducing climate risk and the development benefits of doing so – from community level benefits (income and welfare) to the national level (reduced fiscal, trade, financial sector, and debt sustainability risks).
governments can best start to improve their country’s climate resilience by answering two basic climate risk questions. First, what are the levels of macro- and local-level risks being faced, and second, what is the national and local ambition in reducing those risks – measured, ideally, in terms of risk reduction. Combined, the answers to these two questions will help countries shape adaptation priorities in an economically efficient and equitable manner, understand private and public goods issues, and access adaptation finance.
governments also need to think about how to allocate adaptation funding across sectors, and between ex ante risk reduction (spanning such options as short-term flood management and long-term agricultural research) and ex post risk management (such as contingency finance, insurance schemes, and safety nets). Donor lending and international concessional finance instruments exist to help address climate risk across sectors and levels, i.e., from macro-level contingency finance down to climate-informed community driven development. however, it is well established that the total amount of international climate finance is vastly inadequate to meet all climate transition needs, including mitigation, adaptation and loss & damage, and is a central topic of debate in virtually all climate and development fora.
Pursuing these questions will help countries identify knowledge and capacity gaps, and mainstream adaptation planning across all sectors and at all levels. most importantly, it will maximize how climate and development objectives are integrated, thereby reducing the overall cost of climate adaptation by maximizing the economic return across all development policies and investments.
The rate of potential growth in EAP has decreased in the past decade (2011–2021) to 6.2 percent, compared to rate in the previous decade (2000–2010) of 7.7 percent (figure 77). Looking ahead, over the next decade (2022–2030), potential growth in EAP is expected to decelerate further, and could be as low as 4.7 percent. The primary driver of this slowdown is the slower potential growth in China, but potential growth in the rest of the eAP region is also projected to decline slightly by 0.1 percentage point to 4.4 percent. The slowdown in capital accumulation accounts for nearly half of the decline, while deceleration in productivity and the decline in demographic dividends due to aging, would also contribute significantly.
Figure 77. Potential growth in the eAP is expected to decline
A. Potential growth in EAP and its components
B. Potential growth in EAP (ex. China) and its components
Potential gDP growth in the region could be further dampened by deglobalization and climate change. In a hypothetical scenario, where trade tensions increase and lead to a 10-percentage-point reduction in trade as a share of gDP, investment growth could slow down by 1.5 percentage points per year. This investment slowdown would ultimately reduce the capital stock and total factor productivity growth, resulting in an average annual decrease of 0.25 percentage point in potential GDP growth over the next 10 years. In a climate change scenario, which assumes that the frequency off destructive climate events for each country rises at the same pace as during 1980–2020, 0.1 percentage points could be shaved of total factor productivity growth (Dieppe, 2021).
Policies that help increase labor force participation, total factor productivity, and enable countries to adapt their economies to climate change can help boost potential gDP growth. Boosting female labor force participation can have a positive impact on potential gDP growth. simulation results show that if female labor force participation in eAP countries were to increase at the rate observed in Malaysia between 1990 and 2020 (from 41.6 percent to 48 percent), potential gDP growth could rise by 0.12 percentage points per year over the next 10 years. similarly, increased digitization could enable more elderly individuals to participate in the labor force by leveraging remote work and digital tools. The digitalization scenario assumes that each 5-year cohort starting from 50-year-old workers would achieve the labor force participation rate of the previous cohort, and that the effect of digitization would take 20 years to fully materialize (Kose and ohnsorge, 2023). In combination, policies that aim to boost labor force participation could lead to an average annual increase of up to 0.28 percentage points in potential GDP growth over the next 10 years (figure 78).
Figure
A. Impact on EAP’s potential growth
B.
Estimated potential GDP growth, 2022–30
Boost from adaptation to climate change Boost from structural policies
Boost from increased female labor force participaiton
Boosting productivity through structural reforms and climate adaptation would result in higher potential gDP growth. Policies that foster competition and allow for the mobility of labor and capital across different sectors could lead to productivity gains. Similarly, policies that promote trade and improve the efficiency of financial and capital markets could stimulate investment and capital formation. Implementing such policies, under reasonable assumptions, could increase potential GDP growth by 0.15 percentage point annually. Moreover, adapting to climate change could mitigate the adverse impacts of climate-related disasters on total factor productivity growth and add another 0.1 percentage point per year to potential gDP growth over the next decade.
Abiad, Abdul, enrica Detragiache, and Thierry Tressel. 2010. “A New Database of Financial Reforms.” IMF Staff Papers, 57.2: 281–302. Washington: International Monetary Fund.
Acemoglu, Daron and Pascual Restrepo. 2017. “Secular Stagnation? The Effect of Aging on Economic Growth in the Age of Automation. American Economic Review. Vol. 107, No. 5: 174–79.
Adrian, Tobias, Patrick Bolton, and Alissa m Kleinnijenhuis. 2022. “The Great Carbon Aribitrage.” IMF Working Paper series. WP/22/107. Washington: International Monetary Fund.
Alesina, A. F., Furceri, D., Ostry, J. D., Papageorgiou, C., and Quinn, D. P. 2020. “Structural Reforms and Elections: Evidence from a World-Wide New Dataset.” National Bureau of Economic Research, No. w26720.
Alzheimer’s Disease International. 2014. “Dementia in the Asia-Pacific Region.” Alzheimer’s Disease International. London. Aligishiev, Z., Massetti, E., & Bellon, M. 2022. “Macro-Fiscal Implications of Adaptation to Climate Change,” Staff Climate notes, Washington: International monetary Fund.
Arteta, C., Kamin, S.B., Ruch, F.U. 2022. “How Do Rising US Interest Rates Affect Emerging and Developing Economies? It Depends.” Policy Research working paper; no. WPS 10258 Washington, D.C.: World Bank Group.
Baker, Judy and Gauri Gadgil. 2017. “East Asia and Pacific Cities: Expanding Opportunities for the Urban Poor.” Urban Development. Washington, DC: World Bank.
Bloom, David, David Canning, and Jaypee Sevilla. 2003. “The Demographic Dividend: A New Perspective on the Economic Consequences of Population Change.” Santa Monica, CA: RAND.
Brahmbhatt, M. et al. 2019. “Estimating the Economic Benefits of Climate Adaptation Investments: Background paper for the Global Commission on Adaptation.” Global Commission on Adaptation.
Brandon, Carter. 2018. “Climate Action Peer Exchange (CAPE) Capacity-Building Forum.” World Bank, Washington, DC.
Brandt, L., J. Litwack, E. Mileva, L. Wang, Y. Zhang, and L. Zhao. 2020. “China’s Productivity Slowdown and Future Growth Potential; China’s Productivity Slowdown and Future Growth Potential.” World Bank Policy Research Working Paper; no. 9298.
Brandt, L., J. Litwack, E. Mileva, L. Wang, Y. Zhang, and L. Zhao, 2022, “Recent Productivity Trends in China: Evidence from Macro- and Firm-level Data,” China: An International Journal, 20(1), pp. 93–113.
Branstetter, Lee G. and Guangwei Li. 2022. “Does “Made in China 2025” Work for China? Evidence from Chinese Listed Firms”. NBER Working Paper 30676.
Betts, M. Caroline, Yu Cao. 2022. “How Does State-ownership Affect Firm Innovation?”. Mimeo.
Brenton, Paul; Ferrantino, Michael J.; Maliszewska, Maryla. 2022. “Reshaping Global Value Chains in Light of COVID-19: Implications for Trade and Poverty Reduction in Developing Countries.” Washington, DC: World Bank.
Chai, Q. et al. 2019. “Financial Needs in Implementing China’s Nationally Determined Contribution to Address Climate Change By 2030.” China Population, Resources and Environment 29 (4):1–9.
Cai, J., and Stoyanov, A. 2016. “Population Aging and Comparative Advantage.” Journal of International Economics. Vol 102, 1–21.
Casalini, Francesca, Javier Lopez-Gonzalez, and Taku Nemoto. 2021. “Mapping Commonalities in Regulatory Approaches to Cross-border Data Transfers.” Working Party of the Trade Committee. OECD.
Cerdeiro, Diego A., Rui Mano, Johannes Eugster, Dirk VMuir, and Shanaka J Peiris. 2022. “Sizing Up the Effects of Technological Decoupling.” IMF Working Paper series. WP/2021/069. Washington: International Monetary Fund.
Chen, M.X. and Mattoo, A. 2008. “Regionalism in Standards: Good or Bad for Trade?” Canadian Journal of Economics, 41: 838–863.
Chen, Maggie and Sumit Joshi. 2010. “Third-country Effects on the Formation of Free Trade Agreements”. Journal of International economics, vol. 82, issue 2, 238–248
Chen, Tuo, Chang-Tai Hsieh and Zheng Michael Song. 2022. “Non-Tariff Barriers in the US-China Trade War”. NBER Working Paper 30318.
Chinn, Menzie D. and Hiro Ito. 2006. “What Matters for Financial Development? Capital Controls, Institutions, and Interactions.” Journal of Development Economics, 81:1, 163–192.
CMCC (Fondazione Centro Euro-Mediterraneo sui Cambiamenti Climatici). 2021. “G20 Climate Risk Atlas: China.” Lecce, Italy.
Dabla-Norris E, Thomas A, Garcia-Verdu R, Chen Y. 2013. “Benchmarking Structural Transformation Across the World”. IMF Working Paper series. WP/13/176. Washington: International monetary Fund.
Datt, Gaurav and Martin Ravallion, 1992. “Growth and Redistribution Components of Changes in Poverty Measures: A Decomposition with Applications to Brazil and India in the 1980s,” Journal of Development Economics, Volume 38, Issue 2.
Davis, s., J. haltiwanger and S. Schuh. 1996. “Job Creation and Destruction.” Cambridge, MA: MIT Press.
De la Maisonneuve, Christine, and Joaquim Oliveira Martins. 2013. “Public Spending on Health and Long-Term Care: A New Set of Projections.” Organisation for economic Co-operation and Development, Paris.
Decker, R., J. Haltiwanger, R. Jarmin and J. Miranda. 2020. “Changing Business Dynamisms and Productivity: Shocks versus Responsiveness.” American Economic Review, 110(2), pp. 3952–3990.
Development Research Center of the State Council (DRC) and World Bank. 2019. “Innovative China: New Drivers of Growth”
Dieppe, Alistair, ed. 2021. “Global Productivity: Trends, Drivers, and Policies.” Washington, DC: World Bank.
Fajgelbaum, Pablo, Pinelopi K. Goldberg, Patrick J. Kennedy, Amit Khandelwal & Daria Taglioni. 2023. “The US-China Trade War and Global Reallocations”. NBER Working Paper 29562.
Fernandez, Andres, Michael Klein, Alessandro Rebucci, Martin Schindler, and Martin Uribe. 2016. “Capital Control Measures: A new Dataset.” IMF Economic Review, 64, 548–574.
Eggertsson, Gauti B., Ragnar E. Juelsrud, Lawrence H. Summers, and Ella Getz Wold. 2019. “Negative Nominal Interest Rates and the Bank Lending Channel.” NBER Working Paper 25416.
Global Commission on Adaptation. “Adapt Now: A Global Call for Leadership on Climate Resilience,” 2019.
Goes, Carlos and Eddy Bekkers. 2022. “The Impact of Geopolitical Conflicts on Trade, Growth, and Innovation.” World Trade organization: Research and Analysis: Working Papers.
Government of Grenada. 2021. “Grenada: Disaster Resilience Strategy.” Ministry of Finance and Ministry of Climate Resilience Paper. st. george’s.
Government of the Republic of Fiji. 2017. “Climate Vulnerability Assessment: Making Fiji Climate Resilient.”
Han, Pengfei, Wei Jiang, and Danqing Mei. 2022. “Mapping US-China Technology Decoupling, Innovation, and Firm Performance.” Columbia Business School Research Paper.
Hallegatte, S. et al. 2016. “Shock Waves: Managing the Impacts of Climate Change on Poverty.” World Bank, Washington, DC.
Hallegatte, S., Brandon, C., et al. 2018. “The Economics of (and Obstacles to) Aligning Development and Climate Change Adaptation : A World Bank Group Contribution to the Global Commission on Adaptation.”. World Bank, Washington, D.C.
Hanvoravongchai, Piya. 2013. “Health Financing Reform in Thailand: Toward Universal Coverage under Fiscal Constraints.” UnICo study 20, Universal health Coverage, World Bank, Washington D.C.
Herd, R. 2020, “Estimating capital formation and capital stock by economic sector in China: The implications for productivity growth,” World Bank Policy Research Working Paper No. 9317.
Heubaum, H. 2022. “The Triple Dividend of Building Climate Resilience: Taking Stock, Moving Forward.” World Resources Institute Working Paper.
Hou, X., Jigyasa Sharma, and Feng Zhao. 2023. “Silver Opportunity: Building Integrated Services for Older Adults around Primary Health Care.” World Bank, Washington, D.C.
International Monetary Fund. 2019. “Macroeconomics of Aging and Policy Implications”. Prepared for G20. International monetary Fund, Washington, D.C.
International Monetary Fund. 2020. “Kingdom of Tonga: Climate Change Policy Assessment.” Washington, D.C.
International Monetary Fund. 2021. “Dominica: Disaster Resilience Strategy.” IMF Country Report, Washington, DC.
Jacquier, e., n. Polson, and P. Rossi. 1994. “Bayesian Analysis of stochastic Volatility Models.” Journal of Business and economic statistics 12 (4): 371–389.
Jordà, Ò. 2005. “estimation and Inference of Impulse Responses by Local Projections.” American economic Review, 95(1), pp. 161–182.
Jafino, Bramka Arga, Brian James Walsh, Julie Rozenberg et al. 2020. “Revised Estimates of the Impact of Climate Change on Extreme Poverty by 2030.” World Bank Policy Research Working Paper No. 9417. World Bank, Washington, DC.
Kelley, Allen C., and Robert M. Schmidt. 1995. “Aggregate Population and Economic Growth Correlations: The Role of the Components of Demographic Change.” Demography 32 (4): 543–55.
Kinoshita, Y, Z. Aligishiev, C. Alonso, C. Chen, K. Funke, A. Hosny, K. Kirabaeva, D. Prihardini, S. Suphachalasai, A. Swiston, E. Tandberg, and G. Zinabou. 2022. “Samoa: Technical Assistance Report—Climate Macroeconomic Assessment Program,” IMF Staff Country Reports. International Monetary Fund, Washington D.C.
Kinugasa, Tomoko, and Andrew Mason. 2007. “Why Nations Become Wealthy: The Effects of Adult Longevity on Saving.” World Development 35 (1): 1–23.
Knox-Vydmanov, Charles, Daniel Horn, and Aura Sevilla. 2017. “The Feasibility of a Universal Social Pension in Philippines”. HelpAge International. London.
Konte, Maty, Wilfried A Kouamé, Emmanuel B Mensah. 2022. “Structural Reforms and Labor Productivity Growth in Developing Countries: Intra or Inter-Reallocation Channel?” The World Bank Economic Review, 36:3, 646–669.
Kose, M. Ayhan, and Franziska Ohnsorge, eds. 2023. “Falling Long-Term Growth Prospects: Trends, Expectations, and Policies.” Washington, DC: World Bank.
Kruse, H., E. Mensah, K. Sen, and G. J. de Vries. 2022. “A Manufacturing Renaissance? Industrialization Trends in the Developing World.” IMF Economic Review.
Kudrna, G., O’Keefe P., Piggott J. 2022. “Pension Policy in Emerging Asian Economies with Population Ageing: What Do We Know, Where Should We Go?” In Bloom, D., Sousa-Poza, A. and Sunde, U. (Eds.). The Routledge Handbook on the Economics of Ageing. Routledge.
Kuznets, S. 1966. “Modern Economic Growth: Rate, Structure, and Spread.” Yale University Press, New Haven.
Lenza, M. and Primiceri, G.E. 2022. “How to Estimate a Vector Autoregression After March 2020.” Journal of Applied econometrics.
Li, Hongbin, Jie Zhang, and Junsen Zhang. 2007. “Effects of Longevity and Dependency Rates on Saving and Growth: Evidence from a Panel of Cross Countries.” Journal of Development Economics 84 (1): 138–54.
Lovely, Mary E. 2023. “The Trouble with Trans-Pacific Trade,” Foreign Affairs. January 23, 2023.
Lu, Bei, Wenjiong He, and John Piggott. 2014. “Should China Introduce a Social Pension?” Journal of the Economics of Aging 4. 76–87.
Mason, Carl and Qiulin Chen. 2012. “Projecting China’s Expenditures on Health Care, Education and Pensions with Data from The National Transfer Accounts: Results and Documentation.” Mimeo. World Bank, Washington, D.C.
Mao, H, Görg, H. Friends. 2020. “The Impact of the US–China Trade War on Global Value Chains.” World Economy. 43: 1776– 1791.
Martins, PMG. 2018. “Structural Change: Pace, Patterns and Determinants.” Review of Development Economics. 00: 1– 32. McMillan M, Rodrik D, Verduzco-Gallo Í. 2014. “Globalization, Structural Change, and Productivity Growth, with an Update on Africa”. World Development. Vol 63., 11–32.
Munich Re. 2022. “Hurricanes, Cold Waves, Tornadoes: Weather Disasters in USA Dominate Natural Disaster Losses in 2021.”
Naughton, B. 2018, “State Enterprise Reform Today,” in Garnaut, R., L. Song, and C. Fang (Eds.), “China’s 40 Years of Reform and Development 1978–2018.” Acton, Australia: ANU Press.
Nguyen, C. 2019. “Simulation of the Costs and Benefits of Delayed Retirement: Evidence from Vietnam.” MPRA Paper 106180, University Library of Munich, Germany.
Normand, Charles, Williams, Gemma A and Cylus, Jonathan. 2022. “The Implications of Population Ageing for Health Financing in the Western Pacific Region: Exploring Future Scenarios and Policy Options for Selected Countries using the PASH Simulator.” European Observatory on Health Systems and Policies. World Health Organization.
O’Keefe, P. and Yiengprugsawan, VS. Forthcoming. “Aged Care in Emerging Asia: New Demands, Evolving Responses and Future Directions.” Handbook of Aging, Health and Public Policy. Springer. New York.
Palacios, R. forthcoming. “Rethinking Public Pension Provision in Asia.” World Bank, Washington, D.C.
Patel, Dev, Justin Sandefur, and Arvind Subramanian. 2021. “The New Era of Unconditional Convergence,” Journal of Development Economics, Volume 152, 102687.
Park, D., and Shin, K. 2011. “Impact of Population Aging on Asia’s Future Growth.” ADB Economics Working Paper Series no. 281. Asian Development Bank.
Pradelli and Van Doorn. 2015. “Fiscal Impact of Aging: Background Paper”. Mimeo, Washington, D.C.
Petri, P.A. and Plummer, M. 2020. “RCEP: A New Trade Agreement that Will Shape Global Economics and Politics.” Order from Chaos [BLog].
Petri, P.A. and Plummer, M.G., 2020. “East Asia Decouples from the United States: Trade War, COVID-19, and East Asia’s New Trade Blocs.” Policy File.
Quinn, Dennis P., and A. Maria Toyoda. 2008. “Does Capital Account Liberalization Lead to Growth?” The Review of Financial studies, 21:3, 1403–1449.
Rentschler, Jun, Paolo Avner, Mattia Marconcini et al. 2022. “Rapid Urban Growth in Flood Zones: Global Trends in Exposure Since 1985.” World Bank, Washington, DC.
Sewdas, R., de Wind, A., Stenholm, S., Coenen, P., Louwerse, C, Boot, C. and van der Beek, A. 2020. “Association Between Retirement and Mortality: Working Longer, Living Longer? A Systematic Review and Meta-analysis.” Journal Epidemiol Community Health. 74(5): 473–480.
Skirbekk, V. 2008. “Age and Productivity Capacity: Descriptions, Causes and Policy Options.” Ageing Horizons, 8: 4–12.
Swiss Re Institute. 2021. “The Economics of Climate Change: No Action Not an Option.” Zurich, Switzerland.
Thomas, Adelle, April Baptiste, Rosanne Martyr-Koller, Patrick Pringle, Kevon Rhiney. 2020. “Climate Change and Small Island Developing States.” Annual Review of Environment and Resources 45:1, 1-27 2020.
US Environmental Protection Agency. 2022. “Report on the Social Cost of Greenhouse Gases: Estimates Incorporating Recent Scientific Advances.” Washington, DC 20460.
Van Ours, J. 2009. “Will You Still Need Me: When I’m 64?” De Economist 157 (4): 441–60.
Wooldridge, J. 2009. “On Estimating Firm-level Production Functions Using Proxy Variables to Control for Unobservables,” economics Letters, 104(3), pp. 112–114 World Bank. 2016a. “Live Long and Prosper: Ageing in East Asia and Pacific.” World Bank, Washington, D.C. World Bank. 2016b. “Global Economic Prospects: Spillovers amid Weak Growth.” Washington, DC: World Bank. World Bank. 2021. “The Macroeconomic and Fiscal Impact of Aging in Thailand”. World Bank, Washington, D.C. World Bank. 2022a. “Philippines Country Climate and Development Report.” CCDR series. Washington, DC: World Bank World Bank. 2022b. “Vietnam Country Climate and Development Report.” CCDR Series. Washington, DC: World Bank. World Bank. 2022c. “World Bank East Asia and Pacific Economic Update, April 2022: Braving the Storms.” Washington, DC: World Bank.
World Bank. 2022d. “China Country Climate and Development Report.” CCDR Series. Washington, DC: World Bank. World Bank. 2023. “Global Economic Prospects, January 2023.” Washington, DC: World Bank.
World Bank and Vivid Economics, 2019. “Climate Change in APEC: Assessing Risks, Preparing Financial Markets, and Mobilizing Institutional Investors.”
Yiengprugsawan VS, Piggott J. 2023. “Shaping Long-Term Care in Emerging Asia: Policy and Country Experiences.” Routledge, London.
Zhao, et al. 2021. “Global, Regional, and National Burden of Mortality Associated with Non-optimal Ambient Temperatures from 2000 to 2019: a Three-stage Modelling Study.” The Lancet. Graphics source, the Washington Post, Feb. 16, 2023.