
56 minute read
2 Water Security in South Sudan


Water Security For People
Key points
Advertisement
• Water supply and sanitation improvements since South Sudan’s independence in 2011 have failed to reach most South Sudanese, and although recent data suggest that modest improvements were made on access to basic drinking water, fewer households have access to sanitation than before the conflict period.
• Seasonal water access varies sharply at subnational levels, with most states and administrative areas having lower access to basic water supply during the rainy season.
• Close to 15 percent of households without improved drinking water in the dry season travel more than two hours roundtrip to access water.
• Nationally, just 10 percent of households have access to sanitation and 75 percent practice open defecation.
Overview
Water security entails the capacity of a population to safeguard sustainable access to adequate quantities of acceptable quality water for human well-being. Under the notion of water security for people, this section captures this important aspect of water security and assesses South Sudan’s status with regard to access to safely managed water supply, sanitation, and hygiene (WASH) services. These are an essential part of improving human health and dignity, and also reducing the risk of infectious disease outbreaks, notably, cholera. However, the benefits of water security for people do not just include improved health outcomes; they also result in important quality-of-life benefits, such as reduced vulnerability to violence and assault, especially for women; time savings; and environmental quality.
This section uses data from the UNICEF/WHO Joint Monitoring Programme (JMP) and the 2020 South Sudan Household Health Survey to assess water security for people. JMP publishes global indicators on access to WASH by service level, indicating quality and availability (see box 2.1). JMP reports safely
Measuring access: Sustainable development goal indicators
In 2015, the 2030 Agenda for Sustainable Development replaced the Millennium Development Goals with a more ambitious blueprint for achieving universal prosperity by 2030, underpinned by the Sustainable Development Goals (SDGs). The objective of SDG 6 Clean Water and Sanitation is to ensure the availability and sustainable management of water and sanitation for all. With the SDGs came the expansion of the “service ladder” used to measure the quality of access to water, sanitation, and hygiene, including an aspiration for “safely managed” levels of service that include provisions for quality and availability
(table B2.1.1). The new UNICEF/WHO JMP service ladders go beyond measuring access to water supply and sanitation to include safely managed services for all, as well as incorporating key indicators on access to hygiene. Target 6.1 of the SDGs reads, “by 2030, achieve universal and equitable access to safe and affordable drinking water for all,” and Target 6.2 reads, “by 2030, achieve access to adequate and equitable sanitation and hygiene for all and end open defecation, paying special attention to the needs of women and girls and those in vulnerable situations.”
TABLE B2.1.1 Joint Monitoring Programme service ladders for measuring achievement of the Sustainable Development Goal targets for drinking water supply, sanitation, and hygiene
SERVICE LEVEL DEFINITION
Drinking water
Safely managed
Drinking water from an improved water source that is located on premises, available when needed, and free from fecal and priority chemical contamination
Basic Drinking water from an improved source, provided collection time is not more than 30 minutes for a roundtrip including queuing
Limited Drinking water from an improved source for which collection time exceeds 30 minutes for a roundtrip including queuing
Unimproved Drinking water from an unprotected dug well or unprotected spring
Surface water Drinking water directly from a river, dam, lake, pond, stream, canal, or irrigation canal
Sanitation
Safely managed Use of improved facilities that are not shared with other households and where excreta are safely disposed of in situ or transported and treated off-site
Basic Use of improved facilities that are not shared with other households
Limited Use of improved facilities shared between two or more households
Unimproved Use of pit latrines without a slab or platform, hanging latrines, or bucket latrines
Open defecation Disposal of human feces in fields, forests, bushes, open bodies of water, beaches, and other open spaces or with solid waste
Hygiene
Basic Availability of a handwashing facility on premises with soap and water
Limited Availability of a handwashing facility on premises without soap and water No facility No handwashing facility on premises managed drinking water only when information on drinking water quality and either accessibility or availability is available for at least 50 percent of the population. Likewise, estimates for safely managed sanitation require comprehensive data on excreta disposal and management. South Sudan lacks sufficient data for estimates on safely managed access to be made. Therefore, the highest level of access to drinking water and sanitation for which JMP estimates are available are for “at least basic.” Hygiene data are not available in sufficient detail or for a large enough share of the population for JMP to make estimates for South Sudan.
Source: WHO/UNICEF 2017.
Water supply and sanitation improvements since 2011 have not reached most South Sudanese
Although substantial efforts were made following independence in 2011 to operationalize a governance structure for water supply and sanitation, along with significant donor investment to expand rural access to improved drinking water supply, develop small-scale water distribution systems, and improve access to safe drinking water and sanitation in urban areas, the bulk of these efforts were eroded in the subsequent conflicts. Civil war not only destroyed water infrastructure but also made it obsolete because of population displacement or lack of management. Moreover, the emphasis during the period following independence was almost exclusively on building infrastructure, with less attention to sustainable operation and maintenance of the completed schemes or financial viability of utilities (World Bank 2013). As a result, access to at least basic drinking water has stagnated in South Sudan since estimates from JMP began in 2011 (figure 2.1). A larger share of the population has gained access to limited service
(improved with collection time exceeding 30 minutes roundtrip), with an increase from 24.4 percent in 2011 to 37.4 percent in 2020. The share of the population that relies on surface water declined from 20.9 percent in 2011 to 8.1 percent in 2020, with the population mostly shifting to limited sources in rural areas (for example, an improved source such as a borehole or a protected spring for which collection time exceeds 30 minutes roundtrip) and at least basic sources in urban areas.
There is a large urban-rural divide in access to drinking water supply services. In urban areas, access to at least basic drinking water sources has improved in the past decade, increasing from 52.1 percent in 2011 to 70 percent in 2020. In rural areas, access declined by 5.2 percentage points, from 38.8 in 2011 to 33.6 percent in 2020. Furthermore, whereas urban areas were successful in eliminating surface water dependency, 10 percent of the population in rural areas still relies on surface water. Since four out of five people live in rural areas of South Sudan, these figures indicate that water supply improvements between 2011 and 2020 have failed to reach most South Sudanese. The divergence of trends for urban and rural populations suggests that a large share of the rural population is being left behind.
Sanitation figures also clearly illustrate large disparities between urban and rural populations. Nationally, just 9 percent of people living in rural areas have access to sanitation and 73 percent practice open defecation. Open defecation only declined 10 percentage points over the nine-year period of the JMP estimates, with most of the declines occurring among urban populations (figure 2.2). According to JMP data, an estimated 60 percent of the population still defecates in the open.
Population with access to drinking water and sanitation in South Sudan and Sub-Saharan Africa, 2020
South Sudan lags behind the rest of Sub-Saharan Africa in access to drinking water supply and sanitation services. Figure 2.3 (panel a) compares national access statistics in South Sudan with averages for Sub-Saharan Africa. Although South Sudan performs better than the average of countries in Sub-Saharan Africa on access to at least basic water supply, it is important to note that lack of data on safely managed access for South Sudan prevents a full comparison on service standards. South Sudan is substantially behind the average of countries in Sub-Saharan Africa on levels of open defecation (no service) and access to at least basic sanitation (see figure 2.3, panel b).
Access to WASH services in schools is also very low, affecting children’s right to quality education. In 2021, an estimated 33 percent of schools in South Sudan had no drinking water service and 21 percent had no sanitation. An estimated 80 percent of schools have no hygiene services. For health facilities, 36 percent lack drinking water service and 8 percent lack sanitation. In one out of five schools, students and staff spend more than 30 minutes per roundtrip to collect water from sources located off premises, representing an enormous opportunity cost (WHO/UNICEF 2021b).
Seasonal water access varies sharply at subnational levels, with most states and administrative areas having lower access to basic water supply during the rainy season
To further explore trends and variability in water security for people, this section uses the most recent data available on access to WASH in South Sudan. These data were collected as part of the 2020 South Sudan Household Health Survey, with representative estimates for the 10 states and three administrative areas.
There are important differences in the methodology used for estimates across these two sources, with the main difference being that JMP sources data from multiple nationally representative surveys to estimate coverage using a simple linear regression model, whereas the household survey draws estimates directly from the survey responses.1 The health survey provides information on seasonal access and use of drinking water as well as estimates of access to handwashing facilities with soap and water. This section first presents estimates from this survey in comparison with JMP estimates, followed by figures on trends in access to WASH at state and administrative area levels.
In 2020, year-round access to at least basic drinking water is estimated to be 41.0 percent, with a slightly higher share of households having access to basic drinking water during the dry season (44.4 percent).2 Access to improved sanitation is 10 percent (compared with 24.6 percent in JMP), while 75 percent of households report defecating in the open (compared with 60.1 percent in JMP) nationally. Findings from the 2020 health survey are consistent with JMP for access to drinking water but indicate that households are worse off for access to sanitation.
National estimates of WASH access and estimates for urban and rural populations separately can hide important subnational variation. Figure 2.4 presents WASH statistics by state and administrative area. The estimates show that open defecation is highest in Upper Nile (95.0 percent), Western Equatoria (93.6 percent), and Greater Pibor Administrative Area (AA) (93.1 percent), and lowest in Warrap (27.2 percent), followed by Ruweng AA (48.4 percent) and Northern Bahr el Ghazal (54.4 percent). Access to improved sanitation is highest in Abyei AA (33.3 percent), Warrap (22.3 percent), and Northern Bahr el Ghazal (19.8 percent), compared with the national average of 10.3 percent. States with higher levels of improved sanitation are also more likely to have higher coverage of handwashing facilities and lower levels of open defecation, suggesting better hygiene practices overall.
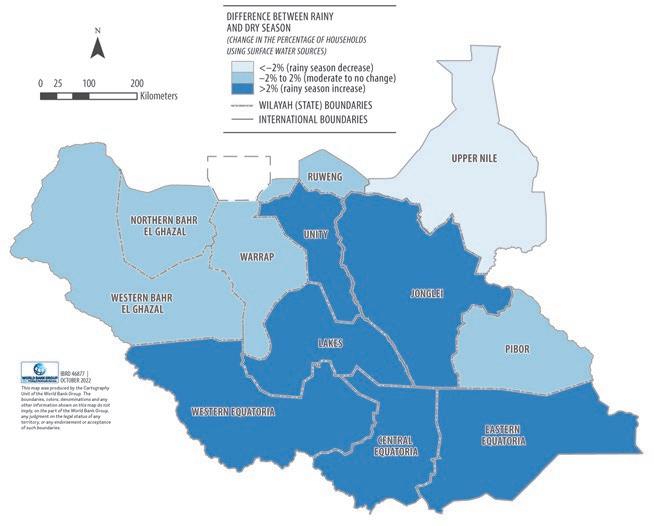
Year-round access to at least basic drinking water is highest in Abyei AA (67.8 percent) and Eastern Equatoria (51.0 percent), and lowest in Greater Pibor AA (5.8 percent), compared with the national average of 41.0 percent. Drinking water access differs between the dry and rainy seasons in all geographic areas of South Sudan, although the differences are minor. The dominant trend is greater access to at least basic drinking water in the dry season, with only Northern Bahr el Ghazal, Upper Nile, Western Equatoria, and Greater Pibor AA having greater access during the rainy season.
Map 2.1 illustrates the extent of the change in access to basic drinking water from the dry to the rainy season. Households living in states shown in lightest blue are less likely to have access to basic drinking water during the rainy season compared with the dry season. There are numerous accounts of water sources being submerged by floodwaters during the rainy season, forcing households to seek out other sources of water that may require them to walk longer distances or the water will be of lower quality. United Nations reports highlight the severe impacts of floods in 2019, 2020, and 2021 on access to
Percentage-point change in access to basic drinking water between rainy and dry season, by state and administrative area
MAP 2.2
Change in surface water use between rainy and dry seasons, by state and administrative area
drinking water supply (OCHA 2021); however, no countrywide estimate of the impacts of these events on access levels exists.
Surface water dependence increases especially for Jonglei and Unity states during the rainy season, with the southern states also reporting increases in the use of surface water during the rainy season (map 2.2). These trends largely explain the decline in access to basic drinking water during the rainy season. In addition to the possibility that water sources are affected by flooding, these trends may also be due to convenience factors (surface water sources are more readily available during rainy season), low awareness of the risks of using unimproved sources of water, and taste preferences.
Access to basic drinking water increased in 5 out of 10 states, while open defecation increased in most states between 2010 and 2020
The following analysis uses Multiple Indicator Cluster Survey (MICS) data from 2010 to analyze changes in access up to the most recent household survey data in 2020. Although the surveys use different methodologies, they are both designed to be representative at the state and administrative area level, making comparison possible. Because the MICS 2010 questionnaire does not differentiate seasonal access to water supply, the analysis generates the following categories for 2020 data to allow comparison with 2010 MICS data:
• Improved = Household has access to improved (or basic) drinking water yearround in 2020
• Unimproved = Household has access to only unimproved water year-round in 2020
• Surface = Household uses only surface water year-round in 2020
• At least unimproved year-round = Household has access to improved (or basic) in one season but unimproved in another in 2020
• Surface reliant = Household has access to improved (or basic) or unimproved in one season but uses surface water in another in 2020
Using these categories, figure 2.5 presents two estimates for 2020. The first bar for 2020 shows estimates for the 2020 dry season and the second shows the year-round access categories. Access to improved water supply decreased in 5 out of 10 states (Jonglei, Western Bahr el Ghazal, Lakes, Central Equatoria, and Eastern Equatoria), while the greatest increases were in Warrap and Northern Bahr el Ghazal states (22 percent and 23 percent, respectively). The highest share of “surface reliant” households, that is, households that use surface water for part of the year, is observed in Unity (13 percent) and Western Equatoria (11 percent).
Trends for access to sanitation are more readily comparable across the two data sources (figure 2.6). The comparisons suggest that all but two states (Western Bahr el Ghazal and Central Equatoria) have had large increases in rates of open defecation, with the largest increases in Lakes and Unity states. Access to improved sanitation increased slightly in Jonglei, Warrap, and Northern and Western Bahr el Ghazal.
WASH quality standards in emergencies are not being met or barely met
According to data published by the United Nations High Commissioner for Refugees (UNHCR), WASH service provision is not always meeting targets, and the quality of WASH services in refugee settings in South Sudan is generally low (UNHCR 2022). The World Health Organization’s recommended amount of at least 20 liters of water per capita per day to meet basic hygiene needs and ensure basic food hygiene is not being met in many refugee camps. Data show that postemergency water supply and sanitation quality standards in many refugee camps are not being met or are barely met. For example, only 42 percent of households in the camps have access to a latrine, and the ratio of persons to a functioning water point exceeds 2,500 (table 2.1).
Accessibility, quality, and affordability challenges further constrain access to drinking water
The highest level of service for drinking water and sanitation is defined by JMP as “safely managed.” To meet these criteria, drinking water must be from an improved water source that is located on premises, available when needed, and free from fecal and priority chemical contamination. For sanitation, the definition includes use of improved facilities that are not shared with other households and where excreta are safely disposed of in situ or transported and treated off-site. Most of the data required to estimate access to safely managed services are not available in South Sudan; however, this section presents evidence on indicators of accessibility, water quality, and affordability.
Water accessibility
Nearly 15 percent of households without dry season access to an improved drinking water source report walking more than 4 kilometers (approximately
FIGURE 2.6
Trends in access to sanitation, 2010 and 2020, by state
Source: World Bank using MICS (2010) and National Household Health Survey (2020).
TABLE 2.1 WASH indicators for selected refugee camps in South Sudan
UNHCR 2022.
Note: Based on data for Ajoung Thok, Doro, Gendrassa, Kaya, Pamir, and Yusuf Batil camps. CFU = colony forming units; FRC = free residual chlorine; NTU = nephelometric turbidity unit; WASH = water supply, sanitation, and hygiene.
2 hours roundtrip) for water. Survey data suggest that households without access to improved drinking water travel longer distances to access the water source compared with those that do have access (figure 2.7). Assuming a walking speed of 4 kilometers per hour, water at a distance less than 1 kilometer (approximately 15 minutes one way) would meet the criteria of less than 30 minutes roundtrip.3 An estimated 66.9 percent of households with access to an improved source in the dry season can access it in less than 30 minutes, compared with 58.3 percent of households without dry season access to an improved source.
Map 2.3 shows the share of population by county living more than 30 minutes roundtrip from a water point, using the Water Information Management
Distance to water source in dry season for households with and without access to improved drinking water supply
Source: World Bank using National Household Health Survey (2020).
Percentage of population living more than 30 minutes roundtrip from water point
Source: World Bank using Water Information Management System, Ministry of Water Resources and Irrigation (2012).
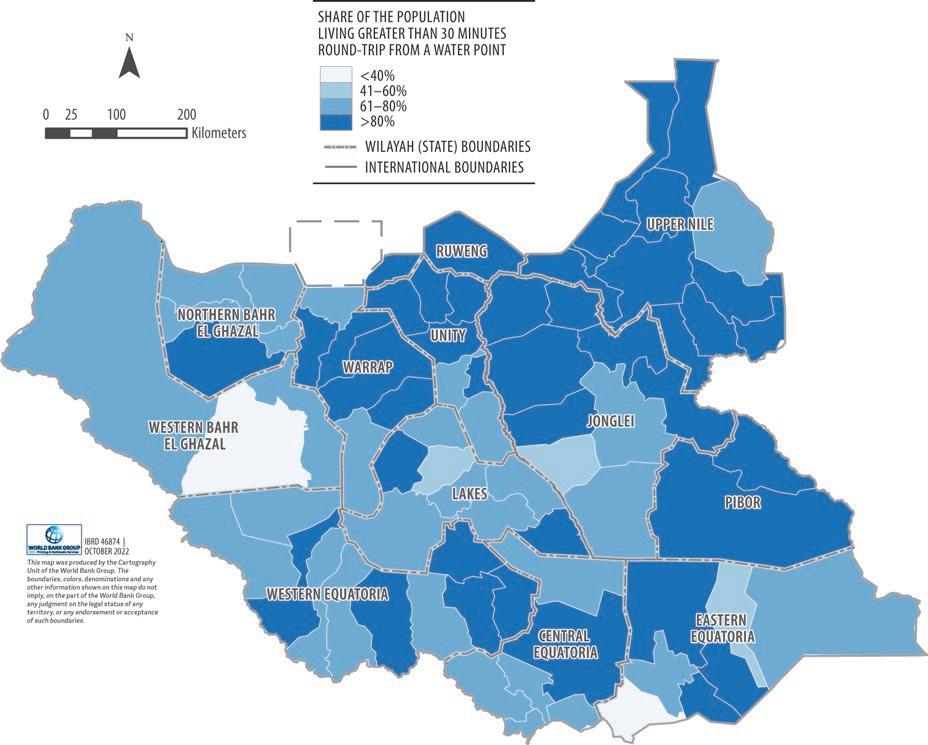
System of the MWRI. Although these data were last updated in 2012, the findings are indicative of population proximity to water points identified by the government of South Sudan, regardless of whether they are functional.4 The analysis shows 32 counties where more than 90 percent of the population is located more than 30 minutes roundtrip from the closest water point, the majority of these located in the northern states.
Water quality
Despite 2020 estimates showing 41 percent of households with year-round access to at least basic drinking water, there is a high likelihood that these water sources—most of which are nonnetworked—are contaminated. Furthermore, evidence indicates that water treatment practices are very low in South Sudan. Water Information Management System data from 2012 indicate that 89 percent of households reported that they did nothing to treat their drinking water.
Although guidelines on drinking water quality were developed in 2008 (UNICEF 2008), there appears to be no routine water quality monitoring or enforcement of the standards in South Sudan. A department of Water Quality Monitoring is housed in the Water Resources Management Directorate of MWRI; its role is to supervise, oversee, and manage water quality issues; quality monitoring; water quality assessment; and pollution control (and a small water quality laboratory housed in MWRI) (AfDB 2013). However, there is no evidence that these activities are funded or implemented. Currently, the Ministry of Health is mandated to manage water treatment and enforce drinking water quality standards. The draft Water Bill foresees the mandate for setting and monitoring compliance with potable water quality standards to be assigned to the proposed Safe Water Supply and Sanitation Services Regulator.
Systematic data on water quality are not available for South Sudan. However, a few ad hoc surveys have been conducted, which are reported here. For example, a study conducted in Juba collected samples from three water distribution points: Juba Bridge, Konyokonyo, and Gumbo Water Treatment Plant. The study reports that both Juba Bridge and Konyokonyo water collection points are used by water tankers licensed by Juba City Council to collect and to distribute water to the city. Water quality tests showed bacterial growth in Konyokonyo samples, while for Juba Bridge the tests showed 55 colony forming units (CFUs) per 100 milliliter sample. Only Gumbo Water Treatment Plant met the WHO standard of zero CFU, making it safe for human consumption (Health of Mother Earth Foundation 2019).
Water expenditure and affordability
Affordability is enshrined in the definition of Sustainable Development Goal (SDG) targets 6.1 and 6.2 on drinking water and sanitation; however, this indicator has not been part of SDG monitoring to date because of lack of agreement on how to measure affordability. Recommendations point to the use of nationally representative income and expenditure surveys and imputation of time costs based on distance to drinking water source and place of defecation (WHO/ UNICEF 2021c).
Data from the High Frequency South Sudan Survey (2012–16) indicate that, on average, 39 percent of household respondents reported water among
FIGURE 2.8
Priorities for household expenditure, based on 14 focus group discussions in Juba, Kapoeta, and Rumbek counties, 2022
31% the household’s top three expenditures (Pape and Parisotto 2019). Qualitative data from focus group discussions conducted as part of this work in Juba, Kapoeta, and Rumbek counties indicate a high priority given to water payments over other household expenditure (RVI 2022). A participatory exercise was used to indicate the relative importance of water payments in overall household expenditure (see appendix A for details). Whereas most focus groups gave highest priority to education spending, water was second in priority, followed by other categories of livestock, health, and food (figure 2.8).
Reliance on water trucks in urban areas further compounds affordability challenges. Although there are no official estimates for the price of tanker water, existing reports suggest that the price of water depends on the distance and the tank used. A large drum of water costs between 500 and 1,000 South Sudanese pounds (US$1.13–US$2.27), and a jerry can costs 100 pounds ($0.77) (Magot 2021).
Water Security For Production
Key points
• Variability of water resources in time and space influences all livelihood systems in South Sudan and the combination of activities pursued by populations for sustenance and income generation.
• Seasonal flooding sustains livelihoods for about 6 million people living along the Nile and Sobat Rivers and the wider eastern and western floodplains.
• South Sudan has some of Sub-Saharan Africa’s highest solar adoption potential, with a suitable area for solar-based irrigation using groundwater and surface water of about 6–10 million and 1–3 million hectares, respectively.
• Although new emerging livelihoods, such as artisanal mining, charcoal production, and brickmaking, support income generation, they also contribute to deforestation and land degradation, exacerbating vulnerability to droughts and pluvial flooding.
Overview
Water’s productive potential sustains livelihoods and ecosystem services across South Sudan. Through the term water security for production, this section recognizes two fundamental dimensions linking water security to production. First, water security inherently speaks to the provision of water as an input to production, that is, an input to the creation and sustenance of humanmade capital assets and livelihoods. Because of the country context and because of the broad range of activities and assets that South Sudanese leverage to support themselves, generate income, and meet their food security needs, the section focuses specifically on water as an input to livelihoods. Second, water security also speaks to water resources as an input to sustaining natural assets of social, economic, and environmental value, such as freshwater ecosystems (including wetlands). Building upon this understanding of water security for production, this section describes the potential for water to sustain productive livelihoods and ecosystems. The section then examines the potential for water sector investments to moderate the effects of hydrological variability on livelihoods.
Livelihoods are highly dependent on water resources and water-related ecosystems
Most South Sudanese derive their livelihoods from activities that are highly dependent on water availability and variability. About 78 percent of households rely on subsistence agriculture and pastoralism as the primary source of income (AfDB 2013). Although the relative contribution of agriculture and pastoralism to the economy is low—accounting for about 10 percent of GDP—these activities play a crucial role for food security and well-being (World Bank 2021b). In addition, approximately 12–15 percent of the population relies on freshwater fisheries as their primary source of livelihood (AfDB 2013). Agriculture, pastoralism, and freshwater fisheries are highly dependent on water resources, and therefore vulnerable to changes in its quantity and quality. To assess the link between these sources of livelihoods and water resources, the report combines data on livelihood zones with information on population distribution and water availability.
The most recent Livelihood Zone Classification for South Sudan (map 2.4) identifies 12 different livelihood zones, which can be aggregated into 6 major livelihood systems following classifications developed by SSCCSE (2011) and UNEP (2018). The correspondence between the 12 livelihood zones and the broader livelihood systems is shown in table 2.2. Overall, this classification suggests that livelihood systems are a combination of five activities: cattle grazing, crop production, wild food collection, fishing and hunting, and trade.
Variability of water resources in time and space influences each of these livelihood systems and the combination of activities pursued by populations. More specifically, this variability engenders water-related risks and opportunities, which tend to vary in each of the livelihood systems (table 2.2). Although table 2.2 describes livelihood systems based on different activities and water-related risks and opportunities, it is important to emphasize a few features that are common across livelihood zones. First, cattle are central to most livelihoods in South Sudan, except in the southwest, and their importance extends well beyond food production (milk and meat). Cattle signify—and to some extent determine—wealth and status, form the foundations for social networks, and are an important part of the dowry (bride price). Second, mobility is a key feature of most livelihood systems. Mobility allows people to take advantage of seasonal food opportunities in different areas, such as fish and wild foods; it is also crucial for the survival of livestock, which depend on

TABLE 2.2 Main livelihood systems, related water risks and opportunities, and livelihood zone names
Ironstone Plateau
• Multiyear drought
• Seasonal water shortage in the dry season due to the low water retention capacity of soils
Improved access to water for agriculture through targeted expansion of water storage and irrigation infrastructure
• Ironstone Plateau: agro-pastoral
• Western plains: groundnuts, sesame, and sorghum
1.40
Semiarid
• High vulnerability to drought
• Overgrazing and gully erosion
• Artisanal mining activity threatening water quality
Floodplains Catastrophic flood events result in heavy crop and livestock losses
Integrated catchment management and water storage to reduce drought vulnerability and soil erosion risk
• Harness benefits of seasonal flooding
• Support local governance systems and agreements between groups over access to seasonal water and grazing areas for livestock
Eastern: semiarid pastoral 0.62
Nile and Sobat corridors
Catastrophic flood events
• Maximize opportunities provided by the Nile basin, including domestic fish production and preservation, water lily farming and production, rice production, flood-recession agriculture, and navigation
• Protection of water resources from pollution
• Eastern plains: sorghum and cattle
• Greater Bahr el Ghazal: sorghum and cattle
• Northwestern Nile basin: cattle and maize
• Northern: sorghum and livestock
• Northeastern: maize, cattle, and fishing
• Nile basin: fishing and agro-pastoral
5.03
Hills and mountains
• Drought and timing of seasonal rains
• Land use change and erosion
Greenbelt Pluvial flooding and crop losses due to poor drainage and infrastructure
Integrated catchment management to reduce drought vulnerability and soil erosion risk
• Maize, sorghum, fishing, and natural resources
• Highland forest and sorghum
0.98
High water availability and bimodal rainfall pattern offer opportunities to strengthen rainfed agriculture and generate food surplus regular migrations between dry and wet season grazing areas (Martell 2019). As described more in chapter 3, when floods or conflict restrict mobility, livelihoods are more likely to be disrupted.
Water is highly valued in pastoralist communities—among pastoralists “water is food.” This means that water is not just about drinking but can also be a source of food, prestige, and influence in the community. As one elder explained in the focus groups, “If you have 20 cows, 30 goats, and 50 sheep you pay 30,000 South Sudanese pounds [about US$60] a month for water, which is a large amount for a poor pastoralist” (RVI 2022).
Seasonal flooding sustains floodplain livelihoods for millions of people living along the Nile and Sobat Rivers and in the eastern and western floodplain zones. An estimated 6 million people live in these areas where livelihoods depend on changing water levels, with the highest share of the population relying on flood-based livelihoods found in the Upper Nile and
Equatorial: maize and cassava 1.47 parts of Unity, Jonglei, Warrap, Northern Bahr el Ghazal, and Lakes. This includes about 1 million people living in the Nile and Sobat River corridors, whose livelihoods and food security rely heavily on freshwater fisheries. The water resources of the two rivers have enabled communities to withstand the impact of the protracted conflict better than other zones (SSCCSE 2011). Seasonal flooding between July and September increases yields of fish and wild foods. In some areas where receding floods leave sufficient soil moisture, more than one maize or sorghum crop can be grown in a year. For poor groups, a combination of fish and wild foods commonly contributes about 40 percent of annual household food requirements in the floodplain zones (SSCCSE 2011). When catastrophic flooding occurs, such as the 2020 and 2021 events, access to wild foods (fish and water lilies) tends to decline, and the incidence of crop pests and livestock disease increase, severely disrupting livelihoods along the river corridors (UNEP 2018).
Receding and rising floodwaters are also key drivers of agro-pastoralism. Pastoralists follow the receding flow, with grazing land becoming available as the flood waters retreat to the main river channel (Catley 2018). When crop or livestock production fails, agro-pastoralists rely on riverine environments for fish, wild foods, and alternative pasture. Hence, riverine environments become important safety nets for agro-pastoralists during food shortfall years. The productivity of these flood-based livelihood systems can be further enhanced by improved maintenance of small-scale water control structures, such as community dikes, that can allow for better control of water, protection of livestock routes and fishing zones, and reduced erosion and waterlogging, and also by enhancements to field water management and agronomic practices.
The unique Sudd wetland is the principal basis of livelihoods for millions
A large part of South Sudan is covered by wetlands, which are a cornerstone for livelihoods, especially in the floodplains. Wetlands cover 7 percent of the total area of South Sudan, with the Sudd covering at least 5 percent (AfDB 2013). As described in chapter 1, the Sudd is Africa’s largest wetland and one of the largest tropical wetlands in the world. The Sudd is a Ramsar site, which confers it globally recognized importance for containing representative, rare, or unique types of wetland and for conserving biodiversity. The Sudd-Sahelian Flooded Grasslands and Savannas eco-region, of which the Sudd is a part, is a key unrepresented ecological system globally (UNESCO 2017).
The economic value of the Sudd wetland for livelihoods alone has been estimated to be more than US$250 million (NBI 2020). However, it is important to note that the ecosystem services that the Sudd wetland provides go well beyond supporting livelihoods and include water regulation, biodiversity, and cultural services. Among the services provided by the wetland are the regulation of microclimate, flood control, and water regulation. Microclimate regulation takes place as a result of the high proportion of water that evaporates from wetlands. The evaporated water is not lost from the system given that it is partly recycled in the form of rain and it contributes to an increase of the air moisture index, which results in a reduction of evaporation in the dry season (Mohamed et al. 2005). The Nile Basin Initiative estimates the total economic value of the multiple services, all underpinned by water, from the wetland to be at least US$3.2 billion (NBI 2020).
Global analysis confirms the importance of natural assets, and of the water resources that sustain them, for societal well-being. A vast majority of South Sudanese (about 75 percent of the country’s population) directly depend on nature for their food, clean water, and energy through subsistence uses (Fedele et al. 2021). This positions South Sudan among the top 10 countries in the tropics for the total number of people who directly depend on natural capital for their well-being and basic needs. This strong, direct dependence on nature contributes to increased climate vulnerability and is also typically associated with lower levels of human development.
The potential of water resources to sustain and enhance livelihoods and food security remains unexploited
Different types of gray water infrastructure are key enablers of sustainable livelihoods, particularly in the drier areas of the country. There are no large dams or reservoirs in South Sudan with storage capacity greater than 0.1 cubic kilometer, and most water storage structures are community based. Water is commonly stored in community ponds, roadside dugout pits, rock catchments, water barriers, and haffir (Arabic word for pond). These water storage structures have been constructed by communities, the government, and international partners, and no inventory of them exists. They typically serve multiple purposes, including human consumption and livestock water needs.
Many of the more recently constructed haffir are reported to be nonfunctional because of inadequate site selection, design, and maintenance (FAO 2015b). In some cases, these water storage structures have been promoted as a means of reducing tensions over access to water, particularly for livestock. Guidelines for improved technical designs have been developed (FAO 2015a) and can form the basis for a countrywide needs assessment of haffir.
South Sudan’s irrigation potential remains largely untapped. According to the MWRI, irrigated agriculture currently accounts for less than 5 percent of the total area under cultivation (South Sudan MWRI 2021). The irrigated land is distributed across the country, with about 12,700 hectares in Upper Nile state, and other irrigated areas in Jonglei and Western Equatoria (AfDB 2013). The overall suitability of South Sudan for irrigated agriculture is very high, with the Nile Basin Initiative setting it at 24 million hectares based on physical characteristics and accessibility (NBI 2012) out of total agricultural land of about 28.5 million hectares. In the short to medium term, the African Development Bank estimates that 1.5 million hectares could be developed in the floodplain, greenbelt, and Nile and Sobat zones (AfDB 2013). The 2015 Irrigation Development Master Plan recognizes the potential for expansion and identifies specific priority projects, including Wau, Jebel Lado, and Rejaf East (South Sudan MWRI 2021).
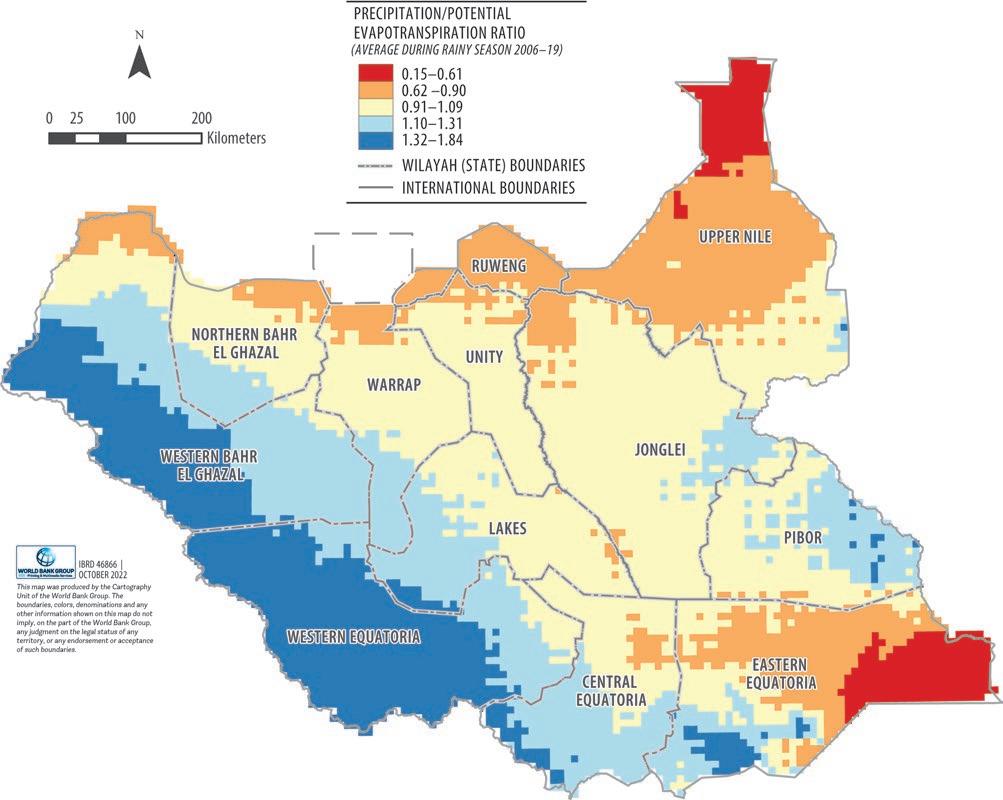
Analysis of hydro-climatic data further confirms the potential benefits of improved agricultural water management. Map 2.5 shows areas of South Sudan that face, on average, some water deficit conditions during the May–September rainy season. This is the main crop-growing season in the Greater Upper Nile and Greater Bahr el Ghazal areas, and thus any water deficit is likely to affect harvests that take place from September onward. The risk of water deficits is quantified using the aridity index, which compares the long-term average of precipitation to the long-term average of climatic water demand (known as potential evapotranspiration). When this ratio is less than one, especially during the growing season, water deficits might occur and hinder plant growth, reducing harvests. Eastern Equatoria and Upper Nile emerge as the two key states facing severe aridity conditions during the main growing season (red areas in map 2.5). When population distribution is overlaid on this information on aridity, it emerges that about 7.5 million people live in areas facing some level of water deficit during the growing season, especially in the Greater Upper Nile and Greater Bahr el Ghazal areas and Eastern Equatoria (World Bank 2022a).
Improved water availability during the main crop-growing seasons can enhance yields and bolster food production. South Sudan’s yields are well below average yields in neighboring countries. In 2018, for example, South Sudan’s cereal yield (in kilograms per hectare) was about 18 percent of the average in
South Africa, and about a third (31–41 percent) of that of Kenya, Uganda, or Ethiopia (World Bank 2022b). This low agricultural performance is confirmed by data for South Sudan’s major crops, whose average yields are well below yield potential for both rainfed and irrigated systems estimated for the country (table 2.3). Although potential for yield improvement is location-specific and depends on a range of biophysical and human-related factors, table 2.3 clearly shows significant opportunities for agricultural water management to enhance food production. In rainfed systems, yield improvements could materialize through measures to retain more water in soils (for example, use of cover crops, no-till systems, and soil water management practices such as terraces). Irrigation expansion is another solution; however, its adoption will depend on whether use of irrigation is sustainable (withdrawal rates in line with recharge rates and environmental requirements) or economically feasible (for example, depth of groundwater and associated pumping costs).
Innovations in irrigation service provision offer opportunities to enhance water’s contribution to livelihoods and food security. First, processes such as farmer-led irrigation development could help accelerate the uptake of irrigation in the country and enhance the chances of social and economic sustainability (Izzi, Denison, and Veldwisch 2021). Small-scale farmer-led irrigation practices are a cost-effective and scalable agricultural water management solution that have been proven to enhance the food security and livelihoods of smallholders in Sub-Saharan Africa (Lefore, Closas, and Schmitter 2021). Another opportunity for expansion of irrigated agriculture in South Sudan is small-scale solar-powered irrigation systems. In the context of underdeveloped electricity infrastructure, off-grid solar photovoltaic irrigation presents an important alternative for pumping and for improving rural communities’ livelihoods. The solar suitability framework developed by the International Water Management Institute (Schmitter et al. 2018) is used here to quantify the suitability for solar-based irrigation in South Sudan. South Sudan has some of Sub-Saharan Africa’s highest solar adoption potential (Xie et al. 2014), with a suitable area for solar-based irrigation of 6–10 million and 1–3 million hectares, using groundwater and surface water, respectively, as shown in figure 2.9. Within South Sudan, areas with the highest potential for groundwater-based solar pumping are in the east and northeast of the country, and for surface water–based pumping in the northwest and east. Although irrigation has significant potential, including through solar pumping, more careful assessments are required to prioritize investments for rehabilitation and expansion. Particular attention is needed for issues of equity in access to technologies for poor farmers and women, and sustainability of water use to avoid water resources depletion. In addition, problems facing South Sudan’s agricultural sector are not going to be solved by irrigation expansion alone, requiring a comprehensive food systems approach to ensure that all important links are pursued (World Bank 2022d).
Even though improvements in agricultural water management can also benefit livestock systems, investments in this area need to be particularly cognizant of related social and conflict dynamics. FAO (2019) estimates that there are at least 11.7 million to 13 million head of cattle in South Sudan, plus about 24 million sheep and goats. Although the accuracy of these estimates is low and difficult to assess, the sheer scale of the numbers suggests that water-livestock interactions need to be considered in the country’s water resources development. In most countries, water-livestock interactions are dominated by the large quantity of water used in the production of feed. Across the world, only about 2 percent of water consumption related to livestock production goes into animal drinking (Heinke et al. 2020). In South Sudan, however, there are many more ways in which livestock and water interact (box 2.2).
The converging effects of climate change, environmental degradation, and conflict on livelihoods and ecosystems
Even though natural capital–based livelihoods have evolved to adapt to hydrological variability, many adaptation strategies have broken down in the past few decades because of increasing external and internal pressures. Conflict and climate change emerge as two key pressures that are having profound effects on livelihoods. Livelihoods are also one of the main channels through which the impacts of climate change interact with social and political factors, such as elite
Livestock and water resources interactions
The One Health approach provides a framework with which to analyze livestock and water resources interactions in South Sudan. Animal and human health are interrelated, and in turn they depend on a healthy environment. As shown in figure B2.2.1, water is a core determinant and connector shaping interactions between human, livestock, and environmental health in South Sudan.
Water resources engender risks and opportunities at the interface between environmental and livestock health. Most livestock feed on rangelands whose water consumption is met through rainfall. Hence, improvements in pasture management and soil moisture retention can enhance the productivity of these rainfed systems, halting land degradation and contributing to sustaining forage availability. With regard to risks, flooding leads to livestock losses and disease. For example, at least 800,000 head of cattle, goats, and sheep and an unknown quantity of poultry died because of drowning, lack of livestock feed, and diseases following the 2021 flooding event (FAO 2021).
Livestock can also significantly degrade the country’s water resources, thus requiring careful coordination between water and livestock management interventions and community management of water points. Livestock grazing and watering along the edges of water bodies such as rivers and dams leads to removal of riparian vegetation and greater channel siltation, increasing the chances of localized flooding and hindering navigation.
Water resources also play a key role at the interface of human and livestock interactions. Uncontrolled livestock grazing close to community drinking water points can lead to contamination of drinking water supplies and disease transmission. Conversely, more controlled and strategic placement and use of livestock water points can contribute to livestock health and community well-being. As discussed in chapter 3, absence of livestock water points induces herders to move into new areas in search of water, putting them in contact with other population groups and heightening the risk of conflict. Strategic placement of
Livestock grazing contributes to contamination of drinking water and disease transmission
Strategic location of water points contributes to livestock well-being and can prevent conflicts and tensions
Livestock
Flooding leads to livestock losses and disease
Livestock grazing can degrade water resources and environment
Soil moisture retention in grazing fields and pastureland sustains forage availability
Human health and livelihood
Environment and water resources
Cropland expansion and water resources development might come at the expense of livestock production systems, requiring diversification groundwater points, especially in the arid southeast, can prevent excessive mobility and can enable pastoralists to take advantage of rangeland areas currently unusable because of the lack of watering facilities (Peden et al. 2005). Strategic placement of water points along routes to markets can further improve livestock production because it reduces the risk of animal weight loss and mortality, thus overcoming market access constraints caused by animals’ poor health. exploitation of local grievances, to compound existing vulnerabilities and tensions.
Source: World Bank.
Human and environmental interactions, especially in relation to water resources development, can further strain livestock systems. For example, any anticipated expansion of rainfed or irrigated cropland might come at the expense of pastoralists’ access to land and water resources. To avoid future tensions and marginalization, investments need to carefully navigate customary land access practices to diversify community livelihoods to rely less on livestock and pasture.
Decades of conflict and insecurity have disrupted many livelihood systems and altered related production and trade patterns. Since at least the Second Sudanese Civil War, which started in 1983, livelihood systems have changed in response to conflict, displacement, resettlements, reduced kinship ties, and humanitarian aid. These factors and, to a lesser extent, demographic pressures and associated changes in population density, have seriously disrupted mobility patterns and access to water and land resources over the years. These disruptions have had ripple effects on food security, heightening the risk of food shortages, particularly for pastoralists. Conflict and insecurity are expected to remain the major pressure on livelihoods moving forward, as resettlements continue, risks of cattle raids or predation remain high, and security of land tenure, whether legally or customarily defined, remains low (Diing et al. 2021).
Climate change is also straining livelihoods through its impacts on water resources availability and extremes. Although livelihoods have adapted to South Sudan’s high levels of hydrological variability, the frequency and intensity of floods and droughts under climate change well exceed this envelope of variability and cause unprecedented stress on livelihoods. Droughts lead to fodder and water shortages, which lead to higher mortality among animals and decreased crop production. Droughts might also lead pastoralists to sell more of their livestock, causing an oversupply of typically undernourished animals that fetch low prices in markets and thus make people more prone to finding alternative means of recouping their losses, including cattle raiding or joining violent groups (Maystadt, Calderone, and You 2014). This risk is particularly pronounced in the semiarid southwest of the country.
Degradation of the country’s natural capital is also straining livelihoods. More than 99 percent of the population of South Sudan depends on forests as their source of energy (fuel wood and charcoal) and for construction and furniture (UNEP 2018). Deforestation, overgrazing, and plowing are the main causes of human-induced environmental degradation, especially soil erosion. In turn, these causes can have negative consequences on livelihoods, especially in the highlands and pastoralists’ areas, where it triggers a series of cascading effects, such as fertility and nutrient loss, reduced carbon storage, and declining biodiversity. Soil erosion rates in South Sudan have been increasing since the start of the century, with global assessments pointing to a 5 percent increase in annual average soil erosion (Borrelli et al. 2017). By 2070 and without any adaptation measures, water erosion over land could increase by 2.5 percent across the country, with some areas in the highlands zone experiencing as much as a 7 percent increase in soil erosion and associated land degradation (Borrelli et al. 2020). The sustainability of water resources is also intertwined with the country’s natural capital, with soil and catchment degradation causing river siltation, and increasing flood risk and oil spills causing public health incidents. The lack of environmental standards and guidelines to safeguard the exploration and exploitation in the extractive industry has led to pollution in the oil fields and in the surrounding areas (UNEP 2018).
As a result of the convergence of these pressures, livelihoods are being disrupted and new livelihood systems are emerging, some of which heighten vulnerability to water-related risks. Decades of conflict and forced displacement mean that humanitarian aid now plays a fundamental role for livelihoods, for both food provisioning and inputs, such as seeds. The forced displacement crisis has also influenced livelihoods, with refugees returning to South Sudan bringing new experiences of rural and urban living and livelihoods, which have contributed to the emergence of new markets, such as mining, charcoal, and brickmaking. Fuel wood and charcoal production supports income generation, but it also contributes to deforestation and land degradation, exacerbating vulnerability to droughts and pluvial flooding. Finally, remittances help populations face daily contingencies and disruptions to livelihood-generating activities. In 2021, the total inflow of remittances to South Sudan was equivalent to 30 percent of the national gross domestic product (World Bank 2021c).
Water Security For Protection
Key points
• South Sudan ranks seventh in the world for share of the total country population exposed to river floods.
• Interactions between local and global climate patterns influence the occurrence of floods. Warming in the Western Equatorial Indian Ocean can bring excess precipitation to the African Great Lakes region and South Sudan, causing riverine flooding in the center and eastern parts of the country, where the largest rivers are located.
• One in two South Sudanese, or about 5.4 million people, live in areas exposed to moderate flood hazard (areas where water depths of a 1-in-100-year flood event reach or exceed 0.15 meters).
• One in four South Sudanese, or about 2.7 million people, live in areas exposed to high and potentially deadly flood hazard (areas where water depths of a 1-in-100-year flood event reach or exceed 0.5 meter).
• The southeastern and northeastern parts of the country have experienced more droughts compared with the rest of the country. In these areas, droughts can affect the mobility options of pastoralists and others who rely on natural resources for their livelihoods, bringing them into competition with neighboring communities and increasing the risk of cattle raids.
• Droughts are projected to become 60–100 percent more frequent by the end of the century compared with the 2020s.
Overview
This section focuses on the destructive force of water. Protection from waterrelated disasters, notably floods and droughts, is a key component of water security. Countries where lives, livelihoods, and economic performance are resilient to floods and droughts are relatively water secure. In contrast, countries are water insecure when floods and droughts impose social and economic costs, with ripple effects on economic performance and social stability. The impacts of floods and droughts in South Sudan are growing, not just because climate change is increasing their frequency and intensity, but also because protracted armed conflict and forced displacement are pushing more people and assets into harm’s way.
South Sudan is a global hotspot for flood risk
South Sudan is one of the world’s countries most exposed to river floods. It ranks seventh for share of total country population exposed to river floods, just behind countries such as Bangladesh and Myanmar, which are well-known flood risk hotspots (World Resources Institute 2019). Flood exposure is defined as the people, assets, or other elements located in harm’s way (in hazard zones) and thereby subject to potential losses when the harm materializes (UNISDR 2009), while flood hazard is defined as a phenomenon that can cause loss of lives, livelihoods, disruption, and environmental damage. Exposure is mostly a function of the location of people and assets, while hazard is a function of hydrological and biophysical factors.
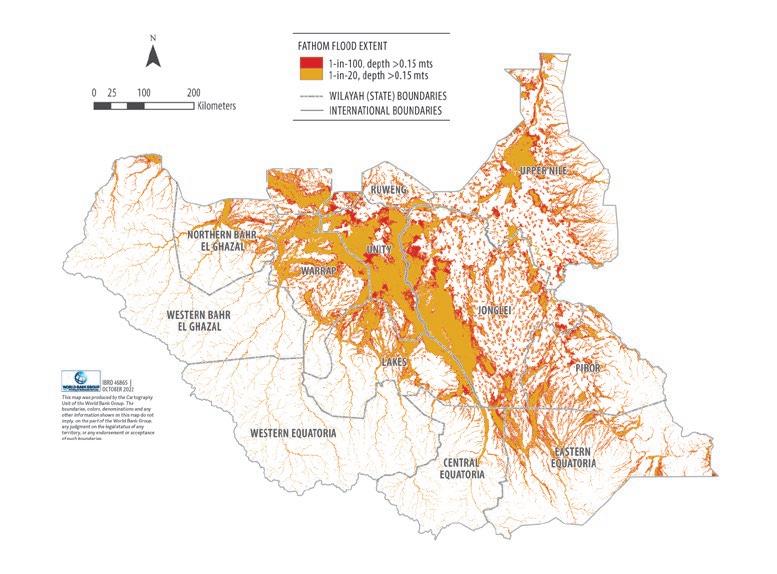
To analyze flood risk in South Sudan, this report uses the Fathom data set, which provides high-resolution information from a global hydrological model on the depth and extent of inundation from undefended floods during flood events of different frequencies (see appendix A for details). As shown in map 2.6, 1-in-20- and 1-in-100-year floods inundate large swaths of the country well beyond the areas close to the Sudd wetland. The map clearly shows that even under a 1-in-20-year flood event, that is, an event with an annual probability of occurrence of 0.05, all states apart from Western Bahr el Ghazal and Western Equatoria would face some flooding with depths of at least 0.15 meter. These flood depths are already sufficient to damage road infrastructure and considerably disrupt livelihoods. Under a more severe 1-in-100-year flood event, even more areas are expected to be inundated, including areas in central Unity and Ruweng Administrative Area (AA). Analysis of flood extents following the 2021 floods, shown in map 2.7, confirms the findings from the global hydrological model and the sobering assessment that even relatively frequent floods (for example, 1-in-20-year events) are expected to inundate all but 2 of the country’s 13 states and administrative areas.
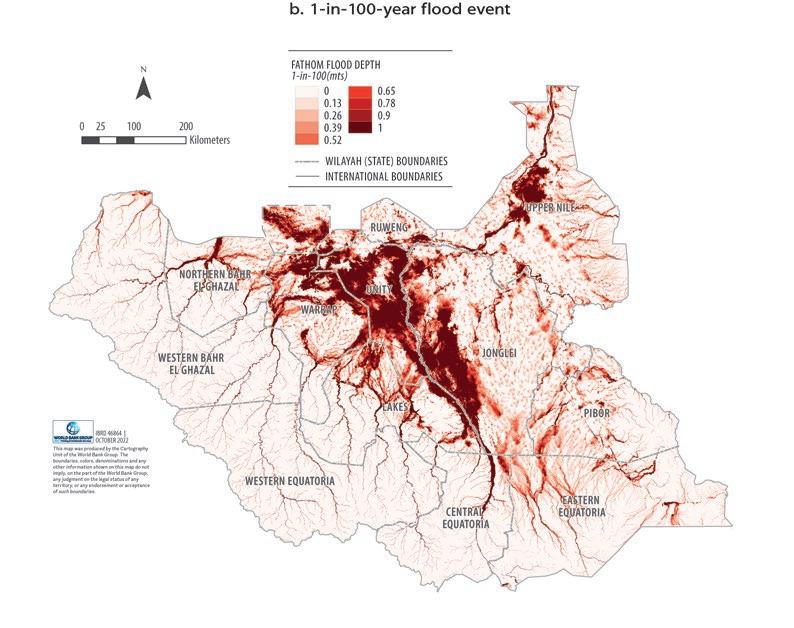
Mapping of flood depth further confirms that several states are confronted with very high and potentially deadly flood inundation depths, even for relatively frequent flood events. Under a 1-in-100-year flood event, large parts of the Greater Upper Nile and eastern Bahr el Ghazal regions would be submerged under a meter of floodwater. These areas are mostly, but not exclusively, located along the White Nile River and the Sudd wetland, as shown in map 2.8. Even under a 1-in-20-year event, that is, a relatively more frequent flood event, most areas around the Sudd and Machar wetlands and large parts of Unity, Warrap, and Jonglei states would be submerged under a meter of floodwater. Under
MAP 2.6
National flood extent map for 1-in-20- and 1-in-100-year flood events
Source: World Bank using Fathom.
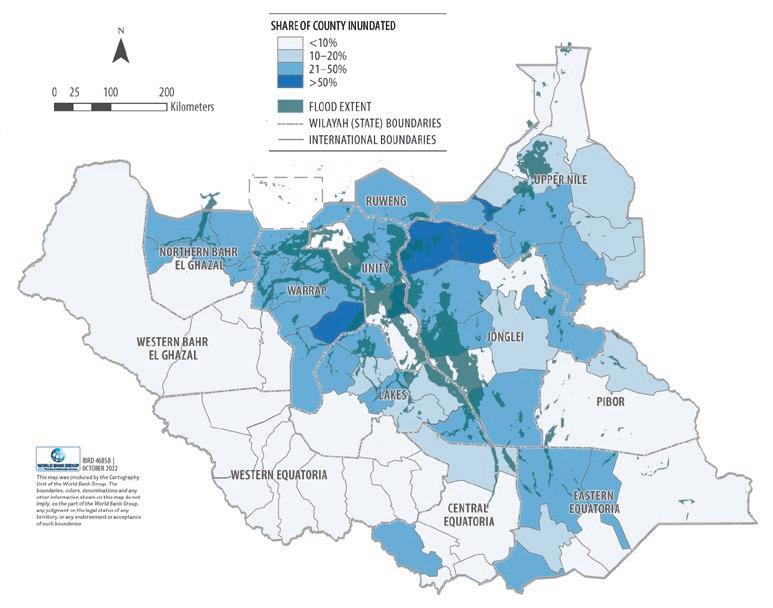
MAP 2.7
Flooded area as a proportion of total county area and flood extent of the May–October 2021 South Sudan floods these conditions, flood impacts on lives and livelihoods are catastrophic; even fit adults would have difficulty wading to safety, and all roads and evacuation routes would be completely submerged, requiring boats or helicopters to deliver relief and evacuate people.
Source: World Bank.
Note: Darker blue counties are those that have experienced inundation over a greater proportion of their area. Note that overlain in green are the flood extents (that is, areas submerged) from September 19 through October 24.

This information on flood hazard (depth and extent) can be overlain with information on population and assets to map exposure to flooding. This combination helps provide a visual image of the locations where people are at risk and identifies counties with high numbers of people exposed to floods (that is, people living in harm’s way). Map 2.9 shows population exposure to moderate or higher (that is, an inundation depth greater than or equal to 0.15 meter)5 flood hazard relative to total county population. The central and eastern parts of the country have some of the highest exposure levels relative to their overall population. Table 2.4 shows the top 10 counties by relative exposure to flood hazard. Leer, Mayendit, and Twic East top the exposure ranking. These counties are near the Sudd wetland and are therefore highly exposed to the wetland’s swelling following flooding. These findings are aligned with observations from the 2021 flood event, where, for example, water submerged nearly 90 percent of Mayendit’s area (14 out of 16 payams) (World Bank 2021a).
In absolute terms, the top three counties with the most people exposed to moderate or higher flood hazard are Lafon, Kapoeta East, and Gogrial West (table 2.5). In a country such as South Sudan, where most counties face at least
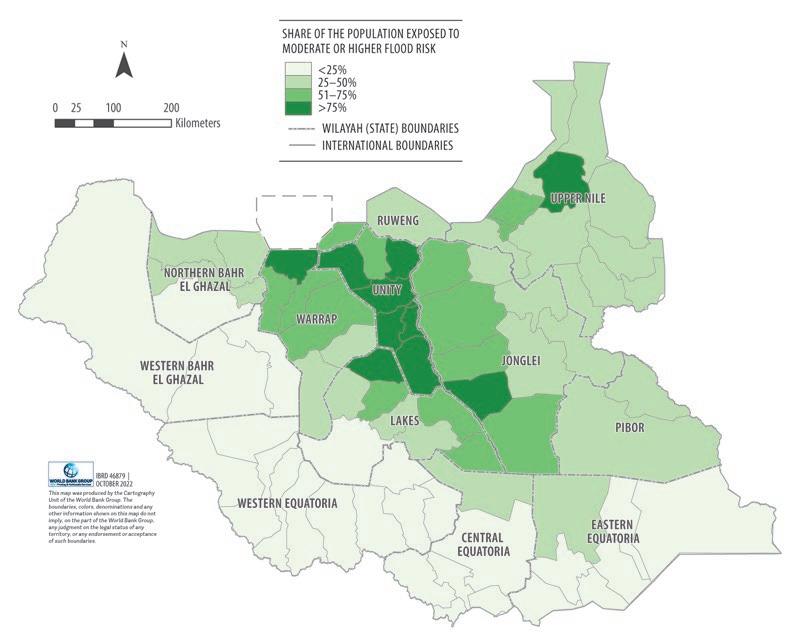
TABLE 2.4 Top 10 counties by share of county population exposed to moderate or higher flood risk
Flood Risk
some flood hazard, the absolute exposure map (map 2.10) more closely follows the country population map (map 2.9), with highly populous counties (for example, Gogrial West) also facing greater overall absolute risk because of their higher population.
The dramatic flood events of 2019, 2020, and 2021 are stark reminders of this extremely high exposure to flood hazards. South Sudan suffered three consecutive years of exceptionally severe flooding, and climate outlooks indicate that the 2022 rainy seasons will likely also bring above-average rainfall and flooding. The 2021 flood event damaged more than 100,000 buildings beyond repair, severely affecting about 1.24 million people (about 11 percent of South Sudan’s population), with an additional 1.33 million people moderately affected.
The World Bank’s damage assessment estimated the total direct economic damage from the 2021 flood event to be more than US$670 million (World Bank 2021a).
Catastrophic floods have devastating impacts on lives and livelihoods; however, more moderate floods can also have beneficial impacts. Rainfall occurring between April and October leads to seasonal floods, which are beneficial for soil fertility, grass and pasture growth, and fisheries (UNEP 2018). These events differ from the catastrophic floods just discussed because they occur with much higher frequency (annually) and lead to far less inundation than the less frequent events linked to variable continental and regional climate patterns. During this seasonal flooding, many parts of the country are left under water, including swaths of Jonglei, Unity, Upper Nile, Warrap, Northern Bahr el Ghazal, and parts of Western Equatoria and Eastern Equatoria (World Bank 2022c). Extensive seasonal flooding occurs particularly around the Sudd wetlands and along the rivers that flow into it from the south, east, and west, covering areas between 10 and 30,000 square kilometers and contributing to a significant difference in the size of the wetland between the dry and the rainy seasons. Despite different estimates for the size of the wetland (see chapter 1), all sources agree that seasonal hydrological variability is responsible for the considerable expansion and swelling of the wetland.

Determinants of flooding
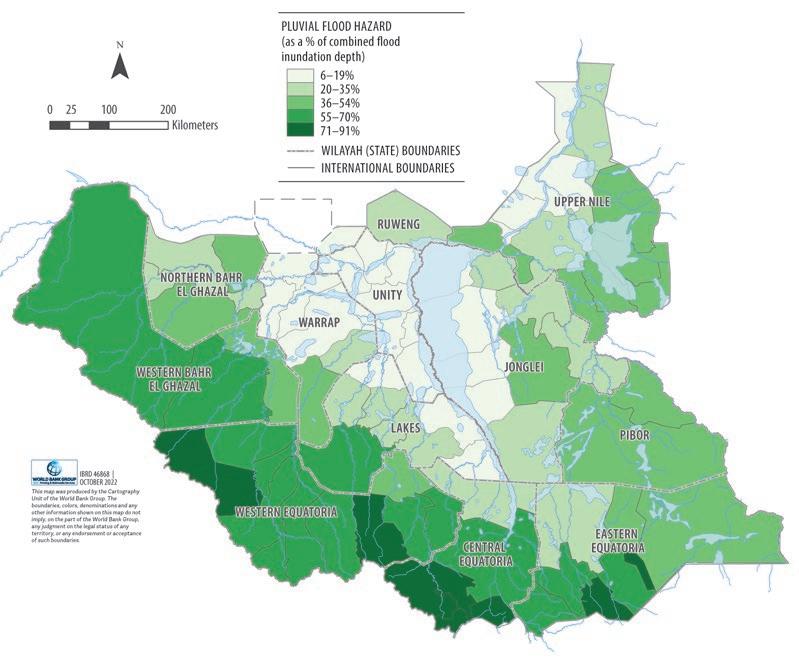
South Sudan faces flood hazards from both fluvial and pluvial sources. Fluvial flooding occurs when water bodies (rivers, streams, lakes) overflow onto the surrounding banks and land. Pluvial flooding occurs when heavy rainfall saturates natural drainage (for example, soils unable to absorb the water) or artificial drainage (for example, urban drainage systems overwhelmed by the quantity of water), creating a flood independent of an overflowing water body. As shown in map 2.11, fluvial sources dominate in the central and eastern parts of the country, where the largest rivers are located. These floods are directly linked to rainfall patterns in the African Great Lakes region, where the Bahr el Jebel (White Nile) originates, and in the Ethiopian Highlands. Pluvial sources dominate in the southwest, where the steeper topography and the lack of large water bodies mean that most surface water floods occur following heavy rainfall events and not from the overflow of water bodies (map 2.12).
Complex interactions between climate patterns acting at local and global scales influence precipitation variability, and therefore the occurrence of floods and droughts, in South Sudan. At the continental scale, the El Niño–Southern Oscillation is a primary driver of variability. During an El Niño, the expected rainfall increase over most of the Lake Victoria catchment area is about 15–25 percent (Birkett, Murtugudde, and Allan 1999), which leads, in turn, to greater

Pluvial flood hazard (percentage of total depth of inundation for a 1-in-100-year undefended flooding event originating from pluvial sources) discharges downstream into South Sudan. Besides the El Niño–Southern Oscillation, changes in the sea-surface temperature in the Indian Ocean (known as the Indian Ocean Dipole) can further increase rainfall in South Sudan and upstream areas in Ethiopia and in the African Great Lakes region. More specifically, warming in the Western Equatorial Indian Ocean can bring excess precipitation to eastern Africa, as was observed during the 1997 floods, when the combination of El Niño with the Indian Ocean Dipole resulted in 20–160 percent excess precipitation in the African Great Lakes region (particularly Lake Victoria), which subsequently resulted in a major expansion of the Sudd wetland in South Sudan and related flooding (Birkett, Murtugudde, and Allan 1999). Similar patterns were also related to floods in 1961 and 2006 (Nicholson 2017) and, more recently, to floods in 2020, when warming of the western Indian Ocean6 led to greater-than-average rainfall over the African Great Lakes area, contributing to increasing water levels and higher discharges out of Lake Victoria’s main outlet in Jinja, Uganda.
The extent to which South Sudan floods then depends on the lagged effects of excessive rainfall in the Lakes region, particularly Lake Victoria, but also the Ethiopian Highlands, coupled with local rainfall events. Excessive rainfall in the Ethiopian Highlands is associated with flooding in Jonglei and Upper Nile, where streams belonging to the Baro-Akobo-Sobat basin drain. On the other hand, excessive rainfall in the African Great Lakes region is associated with flooding along the Bahr el Jebel, affecting Central and Eastern Equatoria, Jonglei, Lakes, Unity, and Warrap.
Lack of long-term and reliable gauged hydrological data severely hinders any comprehensive analysis of flooding patterns across South Sudan. Nonetheless, earth observation data can be applied to obtain a first-order understanding of the spatial dependence of flooding in the country. Satellite altimetry data can be used to measure water levels of lakes, reservoirs, and rivers, providing an indication of hydrological conditions in different parts of the country. For South Sudan, satellite-based water level data were retrieved from Schwatke et al. (2015). A simple correlation matrix of water levels confirms the strong relationship between flows entering South Sudan and hydrological conditions in the African Great Lakes (Lake Albert and Lake Kyoga). The locations shown in figure 2.10 are sorted from the most upstream (on the top) to the most downstream (at the bottom). There is a strong relationship between water levels in the African Great Lakes and the White Nile in Juba, which weakens downstream of the Sudd wetland in Malakal and Dawmayah. In this area, flows, and therefore flooding, are strongly influenced by rainfall in the catchment areas of the Sobat River in Ethiopia (that is, high correlation between Sobat and White Nile in Malakal and Dawmayah).
Horizon chart of historical monthly water height anomalies as a percentage of the water height average in select locations of South Sudan, 2008–22
Note:
A comparison of water levels across select locations in South Sudan further highlights the scale of the 2019, 2020, and 2021 flood events. Figure 2.11 shows anomalies in water levels as a percentage of the average water level measured at four different locations in South Sudan. More intense shades of color represent greater percentage changes from the average, and a diverging color scheme is used to separate positive (blue) and negative (red) deviations for that location. The 2020 and 2021 high water levels are clearly visible, with water levels being 15–45 percent greater than the recorded average for the four locations, including in the upstream Lake Kyoga (located in Uganda). The figure also highlights the 2019 floods, with most flooding taking place in the Upper Nile region and caused by high flows from the Sobat River, and the seasonal element of the Sobat River hydrology and the influence of this seasonality on the White Nile flows at Malakal, which is located just downstream of the confluence of the White Nile and the Sobat Rivers.
Drought: A frequent, persistent risk
Hydrological variability also means that South Sudan is at risk from droughts. Figure 2.12 shows the Standardized Precipitation Index (SPI), a common metric used to track meteorological drought (that is, precipitation-related drought). The SPI values can be interpreted as the number of standard deviations by which the observed precipitation anomaly deviates from the long-term mean. Given the lack of long-term and reliable rain gauge station data in South Sudan, the report examines 40 years of rainfall estimates from CHIRPS: Rainfall Estimates from Rain Gauge and Satellite Observations (Funk et al. 2015). Figure 2.12 highlights the high temporal variability of drought in South Sudan, which is characterized by the alternation of drought-rich periods in the 1980s and in the 2000s (negative SPI) with relatively wetter periods in the 1990s and 2010s (positive SPI).
Droughts also display considerable spatial variability. Figure 2.13 shows the share of the country under different levels of drought between 1982 and 2021. The 1984–86 and 2008–09 droughts had very large spatial footprints, directly reducing rainfall levels across most of the country. Other episodes, such as the 2017 drought, were more concentrated in the northern and eastern states. For some states, droughts are a recurrent hazard. In the period considered in this analysis (1981–2021), Eastern Equatoria and Jonglei faced more than 10 drought events (figure 2.14), confirming the numerous reports of the frequent droughts affecting the southeast of the country (AVSI and Plan International 2017; Langton 1982). Droughts are less frequent but more persistent in the northern and western states. Over the past 40 years, Northern Bahr el Ghazal, Warrap, and Upper Nile states recorded fewer drought episodes; however, these events have tended to last longer and have been more intense (that is, the rainfall deficit has been greater). This difference can be partly explained by considering the different rainfall regimes in these areas, which are wetter than other states in the northeast and southeast. When a drought strikes in these areas, it typically leads to much greater departure from these areas’ wetter conditions, as can be observed in figure 2.14, showing that drought characteristics vary among states.
Source: World Bank, using CHIRPS data (https://data.chc.ucsb.edu/products/CHIRPS-2.0/).
The spatial pattern of drought characteristics is also confirmed by the analysis of the drought frequency relationship for different livelihood systems. The southeastern pastoralists, alongside livelihood systems in the northwest, have experienced more droughts compared with the rest of the other livelihood systems. In these areas, droughts can affect the mobility options of pastoralists and others who rely on natural resources for their livelihoods, bringing them into competition with neighboring communities and increasing the risk of cattle raids (NUPI and SIPRI 2021). Despite having experienced the highest number of
Drought duration and frequency relationship, by South Sudanese state, 1981–2021
drought episodes, these livelihood zones also have experienced shorter droughts compared with the rest of the country. When the duration of each drought episode is taken into account, it appears that the southern highland forest and sorghum and Nile basin agro-pastoralists face fewer, but longer, drought events.
While climatological studies suggest that the El Niño–Southern Oscillation influences drought occurrence in South Sudan and might partly explain the observed trend, there is still a lack of understanding about the broader climatic controls of drought occurrence (Awange et al. 2016; Elagib and Elhag 2011). As shown in figure 2.12, the prevalence of drought did not increase from 2009 to 2018. The 2017 drought was not more severe than preceding droughts in 2008–09. The 2017 famine was so catastrophic because drought conditions coincided with the harvesting period and an acute phase of the conflict, confirming that violent conflict and fragility exacerbate vulnerability to hydro-climatic hazards (Anderson et al. 2021).
The overall drought risk and impact are determined by the interplay of the drought characteristics described above with underlying vulnerabilities and exposure. In South Sudan, drought risks are particularly pronounced in the southeast and northeast of the country, particularly in Eastern Equatoria, Jonglei, Unity, and Upper Nile (map 2.13). In these areas, droughts led to poor crop growth or crop failure and reduced yields, as most recently observed in 2017, when failed rains led to an almost 10 percent reduction in aggregate food production (World Bank 2017). Although this drought event was relatively short, lasting for less than one year, it severely affected agriculture because it occurred during the harvest period. The drought mostly affected the northern part of the country and, when combined with the impacts of conflict and violence, left about 50 percent of the population facing severe food insecurity (WFP 2017).
Source: ICA South Sudan, 2016 - Drought Risk, 1998–2014 (https://geonode.wfp.org/layers/geonode:ssd_ica_droughtrisk _geonode_feb2016/metadata_detail).
Note: Counties classified into three categories (high, medium, low) based on the number of poor growing seasons and percentage of area affected by droughts over the period 1998–2014.

Climate change is altering the frequency, magnitude, and duration of water-related disasters
Climate change is underway and already affecting both long- and short-term patterns of hydrological variability that control the availability of water resources and the occurrence of extreme events. South Sudan has already been warming at one of the fastest rates around the world. Over the past 30 years, temperatures have risen by 1.2oC, and are projected to increase a further 1oC to 1.5oC by midcentury (South Sudan MEF 2021). These increasing temperatures will amplify the impact of drought because warming typically leads to increased evaporation and further reductions in the availability of water. For rainfall, climate model projections over this part of Africa are less reliable, with climate model outputs suggesting that rainfall could either increase or decrease in the long term (Rowell et al. 2015).
Although the climate patterns responsible for floods and droughts in South Sudan are not a consequence of climate change, their frequency, intensity, and duration are expected to change as temperatures increase. Climate model analysis for South Sudan suggests that drought changes follow the “dry gets drier and wet gets wetter” paradigm. Under all emissions scenarios, South Sudan is projected to experience more frequent, longer, and more intense drought events by the end of the century. Under a high emissions scenario, droughts are expected to become 60–100 percent more frequent compared with the 2020s by the end of the century, with droughts lasting for more than 30 months (Haile et al. 2020). With regard to flooding, the Indian Ocean Dipole and related extreme floods might occur with greater frequency, from one every 17.3 years, on average, to one event every 6.3 years, on average, under high emissions scenarios (Cai et al. 2014). This means that extremes such as the 2019 floods are likely to occur more frequently under global warming (Cai et al. 2021).
Conclusions
Although flood risks are capturing headlines, they are just one of the many threats from water insecurity. This chapter identifies several other threats from water insecurity, focusing on challenges for people, production, and protection. The chapter also shows that South Sudan can harness the ubiquity of water as a tool to advance national development and stability. For example, seasonal flooding sustains livelihoods for about 6 million people living along the Nile and Sobat Rivers and the wide eastern and western floodplains. Water security is achieved not by trying solely to control water and diverting its flow, but also by focusing on maintaining preparedness and delineating areas for water to reduce its destructive potential and making productive use of the water for household consumption, livelihoods, and development.
To address the destructive force of water described in this chapter, two broad sets of actions should be pursued. The first set of actions would address the water supply and sanitation crisis. The crisis can be addressed by strengthening service delivery models for rural households, bolstering the sustainable use and management of groundwater resources, and promoting climate-resilient solutions. The second set of actions should advance disaster risk preparedness and early warning, which can be achieved through a portfolio of infrastructure, institutions, and information, initially focusing on nonstructural measures to prevent populations from moving into harm’s way and devising information systems and institutional arrangements to increase preparedness and early warning.
For managing water’s productive force, the chapter highlights opportunities to harness floods for productive livelihoods, including enhancing flood-based livelihoods with investments supporting domestic fish production, wetland restoration, and flood-recession agriculture. The chapter also describes the potential for irrigation expansion to bolster food security, including through solar irrigation.
Notes
1. In addition, the household survey uses Lot Quality Assurance Sampling (LQAS), which was developed by the WHO in 1991 as a practical management tool for conducting baseline surveys and monitoring health indicators. The main drawback to LQAS is the large error size of up to 10 percent due to the smaller sample size required for the methodology. In addition, the household survey provides estimates at the household level versus the population-level estimates that JMP provides, and it does not provide disaggregated estimates by urban and rural areas.
2. JMP estimates 41 percent of the population has at least basic drinking water service. Estimates are not available for year-round or seasonal access.
3. This calculation does not factor in waiting time at the water source, which can be substantial, especially during times of water scarcity.
4. Moreover, because the analysis uses the shortest distance between two points regardless of terrain or obstacles, the figures are likely a conservative estimate.
5. Any flood event causing a depth of inundation equal to or greater than 0.15 meter, following previous applications of the flood hazard data set (Rentschler and Salhab 2020).
6. National Oceanic and Atmospheric Administration data show a very positive Indian Ocean Dipole in 2019 and 2020 (http://psl.noaa.gov/gcos_wgsp/Timeseries/DMI/index.html).
References
AfDB (African Development Bank). 2013. South Sudan: An Infrastructure Action Plan—A Program for Sustained Strong Economic Growth. Tunis, Tunisia: AfDB.
Anderson, W., C. Taylor, S. McDermid, E. Ilboudo-Nébié, R. Seager, W. Schlenker, F. Cottier, et al. 2021. “Violent Conflict Exacerbated Drought-Related Food Insecurity between 2009 and 2019 in Sub-Saharan Africa.” Nature Food 2 (8): 603–15.
AVSI and Plan International. 2017. “Kapoeta Region Multi-Sector Survey.” https://www .humanitarianresponse.info/sites/www.humanitarianresponse.info/files/assessments /avsi_kapoeta_region_multi-sector_report_.pdf.
Awange, J. L., M. Schumacher, E. Forootan, and B. Heck. 2016. “Exploring Hydro-Meteorological Drought Patterns over the Greater Horn of Africa (1979–2014) Using Remote Sensing and Reanalysis Products.” Advances in Water Resources 94: 45–59.
Birkett, C., R. Murtugudde, and T. Allan. 1999. “Indian Ocean Climate Event Brings Floods to East Africa’s Lakes and the Sudd Marsh.” Geophysical Research Letters 26 (8): 1031–34.
Borrelli, P., D. A. Robinson, L. R. Fleischer, E. Lugato, C. Ballabio, C. Alewell, K. Meusburger, et al. 2017. “An Assessment of the Global Impact of 21st Century Land Use Change on Soil Erosion.” Nature Communications 8 (1) : 1–13.
Borrelli, P., D. A. Robinson, P. Panagos, E. Lugato, J. E. Yang, C. Alewell, D. Wuepper, L. Montanarella, and C. Ballabio. 2020. “Land Use and Climate Change Impacts on Global Soil Erosion by Water (2015–2070).” Proceedings of the National Academy of Sciences 117 (36): 21994–22001.
Cai, W., A. Santoso, G. Wang, E. Weller, L. Wu, K. Ashok, Y. Masumoto, and T. Yamagata. 2014. “Increased Frequency of Extreme Indian Ocean Dipole Events Due to Greenhouse Warming.” Nature 510 (7504): 254–58.
Cai, W., K. Yang, L. Wu, G. Huang, A. Santoso, B. Ng, G. Wang, and T. Yamagata. 2021. “Opposite Response of Strong and Moderate Positive Indian Ocean Dipole to Global Warming.” Nature Climate Change 11 (1): 27–32.
Catley, A. 2018. “Livestock and Livelihoods in South Sudan.” UK Department for International Development, London.
Diing, A., B. K. Majuch, C. Night, C. M. Anei, E. Abuk, E. N. Malou, J. G. Mut, et al. 2021. South Sudan: Youth, Violence and Livelihoods. Juba: Rift Valley Institute.
Elagib, N. A., and M. M. Elhag. 2011. “Major Climate Indicators of Ongoing Drought in Sudan.” Journal of Hydrology 409 (3–4): 612–25.
FAO (Food and Agriculture Organization of the United Nations). 2015a. “Planning, Construction and Operation of Water Harvesting Structures in South Sudan.” FAO, Rome. https://www .unep.org/resources/report/planning-construction-and-operation-water-harvesting -structures-south-sudan
FAO (Food and Agriculture Organization of the United Nations). 2015b. “Water Harvesting for Peacebuilding in South Sudan. An Assessment of Livestock Water Harvesting Structures in Eastern Equatoria, Western Equatoria, and Lakes State.” FAO, Rome. https://wedocs.unep .org/bitstream/handle/20.500.11822/19533/water_harvesting_peacebuilding_southSudan .pdf?sequence=1.
FAO (Food and Agriculture Organization of the United Nations). 2019. Special Report. FAO/ WFP Crop and Food Security Assessment Mission to South Sudan. Rome: FAO and World Food Programme.
FAO (Food and Agriculture Organization of the United Nations). 2021. “Flood Impact Report.” FAO, Rome. https://www.fao.org/fileadmin/user_upload/faoweb/South-Sudan/FAOSS -Flood-Impact-Report-Dec-2021.pdf
Fedele, G., C. I. Donatti, I. Bornacelly, and D. G. Hole. 2021. “Nature-Dependent People: Mapping Human Direct Use of Nature for Basic Needs across the Tropics.” Global Environmental Change 71: 102368.
Funk, C., P. Peterson, M. Landsfeld, D. Pedreros, J. Verdin, S. Shukla, G. Husak, et al. 2015. “The Climate Hazards Infrared Precipitation with Stations—A New Environmental Record for Monitoring Extremes.” Scientific Data 2 (1): 1–21.
Haile, G. G., Q. Tang, S. M. Hosseini-Moghari, X. Liu, T. G. Gebremicael, G. Leng, A. Kebede, X. Xu, and X. Yun. 2020. “Projected Impacts of Climate Change on Drought Patterns over East Africa.” Earth’s Future 8 (7): e2020EF001502.
Health of Mother Earth Foundation. 2019. “Assessing Clean Drinking Water Availability in Juba, South Sudan.” Nile Initiative for Health and Environment. Health of Mother Earth Foundation, Juba.
Heinke, J., M. Lannerstad, D. Gerten, P. Havlík, M. Herrero, A. M. O. Notenbaert, H. Hoff, and C. Müller. 2020. “Water Use in Global Livestock Production—Opportunities and Constraints for Increasing Water Productivity.” Water Resources Research 56 (12): e2019WR026995. International Water Management Institute. 2022. “Solar Suitability Framework Application to South Sudan.” Unpublished. International Water Management Institute, Colombo, Sri Lanka.
Izzi, G., J. Denison, and G. J. Veldwisch, eds. 2021. The Farmer-Led Irrigation Development Guide: A What, Why and How-to for Intervention Design. Washington, DC: World Bank. Langton, P. 1982. “Drought in SE Sudan, January—July 1980.” Disasters 6 (1): 16–20.
Lefore, N., A. Closas, and P. Schmitter. 2021. “Solar for All: A Framework to Deliver Inclusive and Environmentally Sustainable Solar Irrigation for Smallholder Agriculture.” Energy Policy 154: 112313.
Magot, D. 2021. “The Drinking Trucks: In a City That Borders River Nile, Covid-19 Curbs Access to Clean Water for South Sudanese.” InfoNile, December 1, 2021. https://www.infonile.org /en/2021/12/the-drinking-trucks-in-a-city-that-borders-river-nile-covid-19-curbs -access-to-clean-water-for-south-sudanese-photo-story/
Martell, P. 2019. First Raise a Flag: How South Sudan Won the Longest War but Lost the Peace New York: Oxford University Press.
Maystadt, J. F., M. Calderone, and L. You. 2014. “Local Warming and Violent Conflict in North and South Sudan.” Journal of Economic Geography 15 (3): 649–71.
Mohamed, Y. A., B. J. J. M. Van den Hurk, H. H. G. Savenije, and W. G. M. Bastiaanssen. 2005. “Impact of the Sudd Wetland on the Nile Hydroclimatology.” Water Resources Research 41 (8).
NBI (Nile Basin Initiative). 2012. “Assessment of the Irrigation Potential in Burundi, Eastern DRC, Kenya, Rwanda, South Sudan, Tanzania and Uganda Final Report,” Appendix South Sudan. Nile Basin Initiative, Entebbe.
NBI (Nile Basin Initiative). 2020. Sudd Wetland Economic Valuation of Biodiversity and Ecosystem Services for Green Infrastructure Planning and Development. Entebbe: Nile Basin Initiative.
Nicholson, S. E. 2017. “Climate and Climatic Variability of Rainfall over Eastern Africa.” Reviews of Geophysics 55 (3): 590–635.
NUPI and SIPRI (Norwegian Institute of International Affairs and Stockholm International Peace Research Institute). 2021. “Climate, Peace and Security Fact Sheet: South Sudan.” NUPI and SIPRI. https://sipri.org/sites/default/files/Fact%20Sheet%20South%20 Sudan_HR.pdf
OCHA (United Nations Office for the Coordination of Humanitarian Affairs). 2021. “South Sudan Flooding Situation Report No. 3: Inter-Cluster Coordination Group—As of 14 December 2021.” Juba, UNOCHA.
Pape, U., and L. Parisotto. 2019. “Estimating Poverty in a Fragile Context: The High Frequency Survey in South Sudan.” Policy Research Working Paper 8722, World Bank, Washington, DC.
Peden, D., A. Freeman, A. Astatke, A. Notenbaert, and D. Sheikh. 2005. “Investment Options for Integrating Water-Livestock-Crop Production in Sub-Saharan Africa.” ILRI, Nairobi, Kenya, and IWMI, Addis Ababa, Ethiopia.
Rentschler, J., and M. Salhab. 2020. “People in Harm’s Way: Flood Exposure and Poverty in 189 Countries.” Policy Research Working Paper 9447, World Bank, Washington, DC.
RVI (Rift Valley Institute). 2022. “Fragility and Water Security in South Sudan.” Study conducted for the World Bank by the Rift Valley Institute in collaboration with the Centre for Humanitarian Change. Background paper prepared for this report. Rift Valley Institute, Juba.
Rowell, D. P., B. B. Booth, S. E. Nicholson, and P. Good. 2015. “Reconciling Past and Future Rainfall Trends over East Africa.” Journal of Climate 28 (24): 9768188.
Schmitter, P., K. S. Kibret, N. Lefore, and J. Barron. 2018. “Suitability Mapping Framework for Solar Photovoltaic Pumps for Smallholder Farmers in Sub-Saharan Africa.” Applied Geography 94: 41–57.
Schwatke, C., D. Dettmering, W. Bosch, and F. Seitz. 2015. “DAHITI—An Innovative Approach for Estimating Water Level Time Series over Inland Waters Using Multi-Mission Satellite Altimetry.” Hydrology and Earth System Sciences 19 (10): 4345–64.
South Sudan MEF (Ministry of Environment and Forestry). 2021. South Sudan’s Second Nationally Determined Contribution. Juba: MEF.
South Sudan MWRI (Ministry of Water Resources and Irrigation). 2021. “Presentation on Irrigation Development Budget in the Republic of South Sudan.” Ministry of Water Resources and Irrigation, Juba.
SORUDEV (South Sudan Rural Development). 2021. Crop Production Farmer Extension Guide for Smallholders in South Sudan, 2nd edition. https://knowledge4policy.ec.europa.eu /publication/crop-production-farmer-extension-guide-smallholders-south-sudan-2nd -edition_en
SSCCSE (South Sudan Centre for Census, Statistics and Evaluation). 2011. “Southern Sudan Livelihood Profiles. A Guide for Humanitarian and Development Planning.” SSCCSE, Juba.
UNEP (United Nations Environment Programme). 2018. South Sudan: First State of Environment and Outlook Report 2018. Nairobi: United Nations Environment Programme.
UNESCO (United Nations Educational, Scientific and Cultural Organization). 2017. “Sudd Wetland.” UNESCO, Paris.
UNHCR (United Nations High Commissioner for Refugees). 2022. UNHCR WASH dashboard. https://wash.unhcr.org/wash-dashboard-for-refugee-settings/
UNICEF (United Nations Children’s Fund). 2008. “Southern Sudan Water Quality Guidelines, 2008.” UNICEF, Juba.
UNISDR (United Nations Office for Disaster Risk Reduction). 2009. “UNISDR Terminology on Disaster Risk Reduction.” UNISDR, Geneva.
WFP (World Food Program). 2017. “Integrated Food Security Phase Classification: The Republic of South Sudan.” WFP, Rome. https://www.ipcinfo.org/fileadmin/user_upload/ipcinfo /docs/IPC_South_Sudan_AcuteFI_May2017_June-July2017.pdf.
WHO/UNICEF (World Health Organization/United Nations Children’s Fund). 2017. Progress on Drinking Water, Sanitation and Hygiene: 2017 Update and SDG Baselines. Geneva: WHO and UNICEF.
WHO/UNICEF (World Health Organization/United Nations Children’s Fund). 2021a. “Joint Monitoring Programme for Water Supply, Sanitation and Hygiene (JMP) for Households.” WHO and UNICEF, Geneva. https://washdata.org/data/household#!/ssd
WHO/UNICEF (World Health Organization/United Nations Children’s Fund). 2021b. “Joint Monitoring Programme for Water Supply, Sanitation and Hygiene (JMP) in Schools.” WHO and UNICEF, Geneva. https://washdata.org/data/school#!/ssd
WHO/UNICEF (World Health Organization/United Nations Children’s Fund). 2021c. “The Measurement and Monitoring of Water Supply, Sanitation and Hygiene (WASH) Affordability: A Missing Element of Monitoring of Sustainable Development Goal (SDG) Targets 6.1 and 6.2.” WHO and UNICEF, New York. https://www.who.int/publications/i /item/9789240023284
World Bank. 2013. “Republic of South Sudan: The Rapid Water Sector Needs Assessment and a Way Forward.” World Bank, Washington, DC.
World Bank. 2017. “South Sudan Emergency Food and Nutrition Security Project (P163559).” Project Appraisal Document, World Bank, Washington, DC.
World Bank. 2021a. GRADE Note on May–October 2021 South Sudan Floods. World Bank, Washington, DC.
World Bank. 2021b. “South Sudan Economic Update, June 2021: Pathways to Sustainable Food Security.” World Bank, Washington, DC.
World Bank. 2021c. “Annual Remittances Data.” May 2021. https://www.worldbank.org/en /topic/migrationremittancesdiasporaissues/brief/migration-remittances-data
World Bank. 2022a. “Agricultural and Food Insecurity Dynamics (2006–2020). South Sudan Conflict Economy.” World Bank, Washington, DC.
World Bank. 2022b. Directions for Reform: A Country Economic Memorandum for Recovery and Resilience in South Sudan. Washington, DC: World Bank Group.
World Bank. 2022c. “South Sudan Climate Change Profile.” Climate Change Knowledge Portal. World Bank, Washington, DC.
World Bank. 2022d. Transforming Agriculture from Humanitarian Aid to a Development Oriented Growth Path in South Sudan. World Bank: Washington, DC.
World Resources Institute. 2019. “Aqueduct 3.0: Updated Decision-Relevant Global Water Risk Indicators.” World Resources Institute, Washington, DC.
Xie, H., L. You, B. Wielgosz, and C. Ringler. 2014. “Estimating the Potential for Expanding Smallholder Irrigation in Sub-Saharan Africa.” Agricultural Water Management 131: 183–93.


