REFORMS FOR RECOVERY

WORLD BANK EAST ASIA AND THE PACIFIC ECONOMIC UPDATE OCTOBER 2022

1818 H Street NW, Washington, DC 20433
Telephone: 202-473-1000; Internet: www.worldbank.org
Some rights reserved
1 2 3 4 25 24 23 22
This work is a product of the staff of The World Bank with external contributions. The findings, interpretations, and conclusions ex pressed in this work do not necessarily reflect the views of The World Bank, its Board of Executive Directors, or the governments they represent. The World Bank does not guarantee the accuracy of the data included in this work. The boundaries, colors, denominations, and other information shown on any map in this work do not imply any judgment on the part of The World Bank concerning the legal status of any territory or the endorsement or acceptance of such boundaries. Nothing herein shall constitute or be considered to be a limitation upon or waiver of the privileges and immunities of The World Bank, all of which are specifically reserved.
Nothing herein shall constitute or be considered to be a limitation upon or waiver of the privileges and immunities of The World Bank, all of which are specifically reserved.
This work is available under the Creative Commons Attribution 3.0 IGO license (CC BY 3.0 IGO) http://creativecommons.org/licenses/ by/3.0/igo. Under the Creative Commons Attribution license, you are free to copy, distribute, transmit, and adapt this work, including for commercial purposes, under the following conditions:
Attribution—Please cite the work as follows: World Bank. 2022. “Reforms for Recovery”
World Bank East Asia and Pacific Economic Up date (October), World Bank, Washington, DC. Doi: 10.1596/978-1-4648-1921-6. License: Creative Commons Attribution CC BY 3.0 IGO
Translations—If you create a translation of this work, please add the following disclaimer along with the attribution: This transla tion was not created by The World Bank and should not be considered an official World Bank translation. The World Bank shall not be liable for any content or error in this translation.
Adaptations—If you create an adaptation of this work, please add the following disclaimer along with the attribution: This is an adaptation of an original work by The World Bank. Views and opinions expressed in the adaptation are the sole responsibility of the author or authors of the adaptation and are not endorsed by The World Bank.
Third-party content—The World Bank does not necessarily own each component of the content contained within the work. The World Bank therefore does not warrant that the use of any third-party-owned individual component or part contained in the work will not infringe on the rights of those third parties. The risk of claims resulting from such infringement rests solely with you. If you wish to re-use a component of the work, it is your responsibility to determine whether permission is needed for that re-use and to obtain permission from the copyright owner. Examples of components can include, but are not limited to, tables, figures, or images.
All queries on rights and licenses should be addressed to World Bank Publications, The World Bank Group, 1818 H Street NW, Wash ington, DC 20433, USA; e-mail: pubrights@worldbank.org.
ISBN (electronic): 978-1-4648-1921-6
DOI: 10.1596/978-1-4648-1921-6
Cover photo: Aerial view of international port with Crane loading containers in import export business logistics with cityscape of modern city at sunset by Mongkol Chuewong © Getty Images. Used with the permission of Getty Images. Further permission required for reuse.
Overview xv
1. Recent Developments 1
1.1. Economic growth 1
1.2. Inflation 1
1.3. Debt 2
1.4. Poverty 4
2. What Explains Economic Performance? 6
2.1. Drivers of growth 6
2.2. Drivers of inflation 15
2.3. Drivers of debt 18
3. What are the Risks of Inflation and Price Distortions? 24
3.1. Macro instability 24
3.2. Micro inefficiency 29
3.3. Poverty and inequality 56
4. Outlook 59
5.1. Macro financial policy to control inflation without hurting growth 62
5.2. Financial sector policies 65
5.3. Efficiently choosing policies that achieve the food and fuel goals 68
Appendix: Tables and Additional Details 76
References 80
Figure o1. Even as China’s economy slowed in the first half of 2022, the rest of the region continued to grow; in major EAP countries, growth is projected to be higher and inflation lower than in the rest of the world xv
Figure O2. Rebounding from the Covid-19 shock, private consumption is contributing to growth in EAP outside China xvi
Figure O3. Goods exports have grown strongly though now there are signs of weakening external demand xvi
Figure O4. Recent fiscal and monetary tightening in EAP countries has been less than in other regions xvii
Figure O5. Continued COVID-19 infections amidst China’s zero-COVID policies are leading to disruptions in economic activity xvii
Figure O6. Slowing global growth will negatively affect growth in the region xvii
Figure O7. Rising international interest rates are leading to capital outflows from EAP countries and creating depreciation pressures . . . xviii
Figure O8. . . . which are increasing the burden of debt, and hence inhibiting the revival of investment xviii
Figure O9. Price controls are one reason for reason for lower inflation in the EAP countries xix
Figure O10. EAP countries provide high and growing support to agriculture, primarily through market price support as well as budget support for production subsidies and irrigation xx
Figure O11. Regional fossil fuel subsidies have recently increased xx
Figure O12. Declining house prices in China are further straining the finances of property developers xxi
Figure O13. Transfers are more cost effective at reducing poverty, but governments may still choose fuel subsidies for social welfare, political economy or macro-policy reasons xxii
Figure O14. At current fuel prices, existing coal is the cheapest source of energy, but favorable access to finance could make renewables less costly than new coal xxiii
Figure O15. Inefficient interventions could magnify the growth costs of recent price and interest rate shocks; more efficient interventions and deeper reforms could offset the negative growth impact xxiv
figure 1. Even as China’s economy slowed in the first half of 2022, the rest of the region continued to grow 1 figure 2. But GDP in 2022 is projected to remain below pre-pandemic levels in many countries 2 figure 3. Manufacturing and digital services have recovered, face-to-face-services have not 2 figure 4. inflation is rising but remains relatively low in the larger EAP countries 3 figure 5. Public and private debt have increased during the pandemic 3 figure 6. Growth in major EAP countries is projected to be higher and inflation lower than in the rest of the world 4
figure 7. Most EAP countries have a relatively low debt burden and relatively manageable external financing needs 4 figure 8. The number of poor in developing EAP countries is expected to decline in 2022 5
figure 9. EAP country performance is being shaped by CoViD-19 containment, external conditions, and government support 6
figure 10. Continued COVID-19 infections amidst China’s zero-COVID policies are leading to a disruption in output 7
figure 11. COVID-19 infections waves and economic activity in China 7
figure 12. China’s output is expected to grow more slowly than the output of the rest of the region in 2022, for the first time since 1990 12 figure 13. For the moment, external demand for goods remains strong and goods exports are growing for most EAP countries . . . 13 figure 14. Manufacturing has led growth of EAP countries’ good exports, whereas travel and transport are a drag on services exports 13 figure 15. The revival of tourism has been slow 14 figure 16. Slowing global growth is likely to dampen export demand 14 figure 17. A slowdown in major advanced economies and in China will negatively affect growth in the region 15 figure 18. Economies around the world are increasing policy rates 15 figure 19. EAP countries continued fiscal expansion in 2021 but began consolidating in 2022, except for China 16 figure 20. Potential drivers of inflationary pressures 17 figure 21. Persistent output gaps limit scope for domestic demand-pull inflation 17 figure 22. Commodity prices increased substantially, though some are beginning to drop 18 figure 23. These price increases have generated inflationary pressures 18 figure 24. But pass-through to producer and consumer prices is lower in major EAP countries 19 figure 25. Price controls are one reason for lower pass-through to consumer prices 20 figure 26. Inflation in the US has led to monetary policy tightening and an increase in interest rates . . . 20 figure 27. . . . leading to capital outflows from EAP countries and currency depreciation, creating inflationary pressure 21 figure 28. Economic growth has alleviated the burden of debt in East Asia 21 figure 29. Debt accumulation driven by primary deficit 22 figure 30. Debt accumulation driven by currency depreciation and inflation 22 figure 31. Correlation between inflation rates and inflated debt 23 figure 32. Debt accumulation driven by debt service 23
Figure B1.1. COVID-19 lockdown stringency and growths of exports across Chinese provinces 8 Figure B1.2. Marginal effects of subnational public health restrictions stringency on provincial exports 9 Figure B2.1. China housing market and international comparison 10 Figure B2.2. Housing market activity in China has slowed sharply 11 Figure B3.1. Marginal effects of inflation expectation, exchange rates, and prices on inflation 19
3. What are the Risks of Inflation and Price Distortions?
figure 33. Higher and more volatile inflation is correlated with lower growth; more volatile inflation with more volatile growth 24 figure 34. Public debt composition is diverse, and so is risk tolerance 25 figure 35. Corporate sector debt in East Asia is mostly in local currency, but a significant portion of it matures in the near term 26 figure 36. Inflation volatility can dampen savings and investment 26 figure 37. Lao PDR, Mongolia and Myanmar have faced more significant exchange rate and inflation pressures than the rest of the region 27 figure 38. Exchange rate misalignments and administrative interventions have led to emergence of parallel FX markets and exchange rates 28 figure 39. Price distortions can negatively affect growth 30 figure 40. Inflation heat map 37 figure 41. Vulnerability to food crisis by food exposure score 37
figure 42. Shocks of the war in Ukraine to global food system 38 figure 43. Prices for rice, the staple cereal for EAP countries, have been stable in the current episode 38 figure 44. Rice situation is more stable compared to that of wheat and maize 39 figure 45. severe food insecurity has been rising in parts of EAP region 39 figure 46. EAP food inflation is driven by non-rice products 40 figure 47. Food inflation hurts consumption and nutrition (Philippines) 41 figure 48. Food demand and consumption diversifying out of rice 42 figure 49. import dependency: EAP region still relies on imports of meats, wheat, maize, and soybean 43 figure 50. Asia region is particularly vulnerable to natural disasters 44 figure 51. Energy crunch has ratcheted up fertilizer prices, raising concerns for the future 44 figure 52. Protective trade and policy measures have increased in the recent crisis 45 figure 53. Between 40–70 percent of budget support to agriculture went to direct subsidies and irrigation 45 figure 54. Public policy support through price fixation and trade barriers is at least twice as much as through budget support 45 figure 55. Policy support for agriculture, as a share of GDP, is among the highest in the world in Indonesia, Philippines and China 46 figure 56. Market Price Support (MPS) and subsidies heavily biased towards production of livestock and grains, especially rice 46 figure 57. Implications of high energy prices depend on the measures to shield consumers 47 figure 58. Energy cost increases could make green technologies more economically viable 48 figure 59. Borrowing costs of non-financial corporates have been on the rise 49 figure 60. A sizable fraction of non-financial corporate debt needs to be rolled over, under tighter funding conditions 51
figure 61. Declining house prices in China are further straining the finances of property developers 53 figure 62. China’s state-owned enterprises are less productive than privately owned enterprises, but get credit at much better terms and a much larger share of net funding 53 figure 63. sovereign borrowing cost have seen increases in the EAP region as well 54 figure 64. The linkage between banks and sovereign warrants close monitoring 54 figure 65. State-owned banks play a large role in the deepening of the bank-sovereign nexus during the pandemic 55 figure 66. Household consumption shares by Q1 (Bottom 20) and Q5 (Top 20) 57 figure 67. Food and transport appear to have driven inflation in the region 58 figure 68. Simulation impacts of inflation on welfare, poverty and inequality 58
Figure B4.1. Price distortion and GDP growth across countries 31
Figure B4.2. Higher tariffs are correlated with higher price distortions; higher price distortions are correlated with lower growth 31
Figure B5.1. TFP gains from equating TFP ratio (TFPR) across industries 33
Figure B5.2. Corrected TFP gains from equating TFPR across industries 34
Figure B6.1. Non-performing Loans to Total Loans before and after the outbreak of Covid-19 52
figure 69. In response, monetary policy rates have been or are expected to increase 62 figure 70. inflation expectation is increasing in major EAP economies this year and the next 63 figure 71. Better targeting could provide more “bang for buck” in terms of poverty reduction 65 figure 72. Regional fossil fuel subsidies have recently increased 73
figure 73. At current fuel prices, existing coal is the cheapest source of energy, but favorable access to finance could make renewables less costly than new coal 73 figure 74. Current wind and solar shares in power generation 74 figure 75. Potential growth and its components in EAP 74 figure 76. Inefficient interventions could magnify the growth costs of recent price and interest rate shocks; more efficient interventions and deeper reforms could offset the negative growth impact 75 Figure B8.1. In Thailand, both fuel subsidies and cash transfers play a role in mitigating the poverty impacts of rising inflation, but to different degrees, for different groups, and at different costs 67
figure B9.1. Population distribution by economic class and country in developing East Asia and Pacific 2019 70
Figure A1.1. Comparison in number of poor in 2019 between 2011 and 2017PPPs 78
Table O1. GDP growth forecast xxv
2. What Explains Economic Performance?
Table 1. Government finance worsened in most economies 16
3. What are the Risks of Inflation and Price Distortions?
Table 2. financial sector is well-capitalized, but risks remain to profitability, solvency, and liquidity 50
4. Outlook
Table 3. GDP growth forecast 60
Table 4. fiscal cost of price subsidies exceed fiscal windfall in large economies 64
Table 5. Food security in EAP: issues and risk 72
Table 6. What policies should EAP Government adopt to strengthen food security? 73
Table A1. Growth, the disease, trade and financial exposure, and fiscal and monetary policy space 76
Table A2. Fiscal policy space has narrowed across developing East Asian economies; monetary policy space less so 77
Table A3. External vulnerabilities are severe in Lao PDR, Mongolia, Cambodia and Palau 77
Box 1. The Omicron variant and economic activity in China 8
Box 2. The real estate market in China 9
Box 3. The response of consumer prices to external factors 19
3. What are the Risks of Inflation and Price Distortions?
Box 4. Price distortions and economic growth 30
Box 5. Misallocation in EAP 32
Box 6. Financial Sector Vulnerabilities in the Pacific Islands 52
Box 7. Potential income effects of food prices 57
Box 8. Government of Thailand responses to the food and fuel price crisis: The effects of fuel subsidies and cash transfers on poverty and their relative cost-effectiveness 66
Box 9. Why do governments choose to control prices? 69
Box A1. The new 2017PPP-based international poverty lines and their implications for poverty monitoring in EAP 78
AE Advanced economies
CCGT Combined cycle gas turbine
CPI Consumer Price Index
EMBi Emerging Market Bond index
EMDE Emerging Markets and Developing Countries
EU European Union
FDI Foreign Direct Investment
GDP Gross domestic product
IMF International Monetary Fund
MPS Market Price Support
NPL Nonperforming loans
EAP East Asia and Pacific
ECA Eastern Europe and Central Asia
AUS Australia
BRA Brazil
BRN Brunei Darussalam
CAN Canada CHN China
FJI Fiji
FSM Federated States of Micronesia
IDN Indonesia
IND India
JPN Japan
KHM Cambodia
KIR Kiribati
KOR Republic of Korea
LAO Lao People’s Democratic Republic
MEX Mexico
MNG Mongolia
MMR Myanmar
A$ Australian dollar
$NZ New Zealand dollar
B Thai baht
CR Cambodian riel
D Vietnamese dong
F$ Fiji dollar
K Myanmar kyat
K Papua New Guinea kina
oECD organisation for Economic Co-operation and Development
PMI Purchasing Manager’s Index
PPI Producer Price Index
PPP Purchasing power parity
RHS Right hand side
sME Small and medium enterprise
soE state owned Enterprise
TFP Total factor productivity
WTO World Trade Organization
LAC Latin America and the Caribbean
MNA Middle East and north Africa
SAR South Asia SSA Sub-Saharan Africa
MYS Malaysia
NRU Nauru
PHL Philippines
PLW Palau PNG Papua New Guinea
RMI Republic of the Marshall Islands
RUS Russia
SGP Singapore SLB Solomon Islands
THA Thailand TLS Timor-Leste TON Tonga TUR Turkey
TUV Tuvalu
UK United Kingdom USA United States VNM Vietnam VUT Vanuatu WSM Samoa
Kip Lao kip
P Philippine peso RM Malaysian ringgit
RMB Chinese renminbi
Rp Indonesian rupiah
SI$ Solomon Islands dollar
Tog Mongolian tugrik
US$ Timor-Leste (U.S. dollar)
This report is a collective endeavor and involved several parts of the World Bank including the EAP, Efi, AGf, inf and HnP.
it was prepared by a team led by Ergys islamaj and Aaditya Mattoo. other members of the team were francesca de nicola, Caroline Gerd G De Roover, Tatiana Didier, sebastian Eckardt, Daisuke fukuzawa, shafaat Yar khan, sinem kilic Celik, Duong Trung Le, Andrew D. Mason, Tobias Pfutze, Hector Pollitt, Agustin Samano Penaloza, Animesh Shrivastava, Jonathan Timmis, ikuko Uochi, Ekaterine T. Vashakmadze, Matthew Wai-Poi, and Cecile Wodon.
significant contributions to the report were made by Mateo Ambrosio, Undral Batmunkh, David Charles Dawe, katia D’Husler, kim Alan Edwards, Pedro Miguel Gaspar Martins, Madhur Gautam, Jun Ge, fang Guo, Yusha Li, Rahul kitchlu, Maria Ana Lugo, Alban Mas Aparisi, Aka Kyaw Min Maw, Owen Nie Robert Palacios, Francesco Strobbe, Peter Timmer, Franz Ulrich Ruch, and Smita Wagh.
Manuela V. Ferro provided valuable guidance and comments. We are grateful for helpful discussions and comments to ndiame Diop, Erik feyen, Elitza Mileva, Lars Moller, Rinku Murgai, Zafer Mustafaoglu, Cecile Thioro niang, Dina Umali-Deininger, and Hassan Zaman; staff of the EAP region who participated in the review meetings on August 8 and August 31, 2022, and the regional management team meeting on September 8, 2022. We greatly appreciate the sup port for dissemination provided by Geetanjali Chopra, Mariana Lucia De Lama Odria, Mark Felsenthal, Andy Shuai Liu, and Kym Louise Smithies.
The following staff from the Macroeconomics, Trade and investment Global Practice and the Poverty and Equity Global Practice prepared country-specific macroeconomic outlook pages: Dwi Endah Abriningrum, Vishesh Agarwal, Tanida Arayavechkit, Kiatipong Ariyapruchya, Mehwish Ashraf, Mahama Samir Bandaogo, Undral Batmunkh, Nadia Belhaj Hassine Belghith, Andrew Blackman, Yew Keat Chong, Ibrahim Saeed Chowdhury, Kevin C. Chua, Souleymane Coulibaly, Andrea Coppola, kevin Thomas Garcia Cruz, somneuk Davading, Quang Hong Doan, kim Alan Edwards, karen Annette Lazaro Enriquez, David M. Gould, indira Maulani Hapsari, Rashad Hasanov, faya Hayati, Assyifa szami ilman, Taufik indrakesuma, Wendy karamba, Demet kaya, Yusha Li, Maria Ana Lugo, sodeth Ly, Dorsati Madani, Wael Mansur, Pedro Miguel Gaspar Martins, Elitza Mileva, Jacques Morisset, Thi Da Myint, Darian naidoo, shohei nakamura, Konesawang Nghardsaysone, Hoang The Nguyen, Samuel Nursamsu, Anthony Obeyesekere, Yus Medina Pakpahan, Utz Johann Pape, Keomanivone Phimmahasay, Ruslan Piontkivsky, Sharon Faye Alariao Piza, Warunthorn Puthong, Ririn Salwa Purnamasari, Rong Qian, Habib Rab, Ratih Dwi Rahmadanti, Thanapat Reungsri, Alief Aulia Rezza, Anna Robinson, Sutirtha Sinha Roy, Jose Luis Diaz Sanchez, Apurva Sanghi, Shakira Binti Teh Sharifuddin, Reshika Singh, Bambang Suharnoko Sjahrir, Lodewijk Smets, Wael Mansour, Veronica Sonia Montalva Talledo, Sharad Alan Tandon, Kathleen Victoria Tedi, Kimsun Tong, Tuimasi Radravu Ulu, Phonthanat Uruhamanon, Ralph Van Doorn, Matthew Wai-Poi, Samuel Wills, and Judy Yang. The work was managed by sebastian Eckardt and Lars Christian Moller for the Macroeconomics, Trade and investment Global Practice, and by Rinku Murgai for the Poverty and Equity Global Practice. Benoit Philippe Marcel Campagne, Alexander Haider, Monika Anna Matyja, and Kristina Catherine Tan Mercado made contributions to the model, table production, and assisting staff with their forecasts. Buntarika Sangarun and Yu Shang provided technical support. The report was edited and typeset by Circle Graphics, Inc., Reisterstown, MD.
Throughout the report, geographic groupings are defined as follows:
Developing East Asia and Pacific comprises Cambodia, China, Indonesia, Lao People’s Democratic Republic (PDR), Malaysia, Mongolia, Myanmar, Papua new Guinea, the Philippines, Thailand, Timor-Leste, Vietnam, and the Pacific Island Countries.
The Pacific Island Countries comprise Fiji, Kiribati, the Marshall Islands, the Federated States of Micronesia, Nauru, Palau, Samoa, the Solomon Islands, Tonga, Tuvalu, and Vanuatu.
The ASEAN member countries comprise Brunei Darussalam, Cambodia, Indonesia, Lao PDR, Malaysia, Myanmar, the Philippines, Singapore, Thailand, and Vietnam.
The ASEAN-5 comprise Indonesia, Malaysia, the Philippines, Thailand, and Vietnam.
The analysis in this report is based on the latest country-level data available as of September 22, 2022.
Growth in most countries in the East Asia and the Pacific (EAP) region rebounded in the first half of 2022, but China lost momentum (Figure O1A; table O1). In much of the region, domestic demand revived after the distress of the COVID-19 Delta wave. In China, the public health measures to contain outbreaks of the highly infectious Omicron variant inhibited consumption. Most of the region is projected to grow faster and have lower inflation in 2022 than other regions (figure o1B).
Beyond the end of 2022, three factors could be a drag on growth: global deceleration, rising debt, and policy distortions. Current measures to contain inflation and debt are adding to existing distortions in the markets for food, fuel and finance in ways that could hurt growth. in each case, more efficient measures could address current difficulties without undermining longer-term objectives.
A. GDP relative to pre-pandemic levels
Index: 2019Q4 =100
B. Inflation and GDP growth forecasts for 2022
110
100
120 Q4 Q4 Q4 Q1 Q2 2019 2020 2021 2022
World excl. EAP EAP excl. China China
8
6
4
Figure O1. Even as China’s economy slowed in the first half of 2022, the rest of the region continued to grow; in major EAP countries, growth is projected to be higher and inflation lower than in the rest of the world 90
2
0
2022 GDP (growth forecast, percent) 2022 CPI (inflation forecast, percent)
–2
Tonga
Myanmar Kiribati Timor-Leste Mongolia Thailand TuvaluPNG CambodiaIndonesia Malaysia Philippines Vietnam China Lao PDR –4
10 0 10 20 30
Source: World Bank; Fitch. Note: A. seasonally adjusted real GDP indexed to fourth quarter of 2019 (100). B. Dotted lines show median of emerging market and developing economies (EMDE).
The relatively strong growth in most EAP countries during much of 2022 is for three reasons: the robust recovery of private consumption in the first half of 2022 from the Delta deprivation in the latter half of 2021 (figure o2); the sustained global demand for EAP exports of manufactured goods and commodities, though signs of weakening have appeared (figure o3); and the limited tightening so far of fiscal and monetary policy, though pressures to tighten may increase (Figure O4).
The economic impact of CoViD-19 may now be small in much of the world but it is still significant in China and in the Marshall Islands, Micronesia, and Palau. China has continued its zero-COVID approach, using mass testing and targeted mobility restrictions to contain outbreaks of the disease (Figure O5A). These restrictions disrupt supply chains, industrial and services production, domestic sales, and exports (Figure O5B).
Figure O2. Rebounding from the Covid-19 shock, private consumption is contributing to growth in EAP outside China
Contribution to growth, selected components
Percentage point
–20 –15 –10
Q1 Q2 Q1 Q2 Q1 Q2
Q1 Q2 Q1 Q2
2020 2021 2022 2020 2021 2022 2020 2021 2022 2020 2021 2022 2020 2021 2022
Source: Haver Analytics
China Indonesia Malaysia Philippines Thailand
Private consumption Government consumption Public and private investment Goods exports Services exports Net export (for China)
–5 0 5 10 15 20 25 Figure O3. Goods exports have grown strongly though now there are signs of weakening external demand
EAP countries are facing to a varying degree a combination of external and self-created problems: a slowing world economy that will dampen external demand; an increasing debt burden, already large in a few countries, exacerbated by increasing interest rates and depreciating exchange rates; and distortionary domestic measures taken by several countries to deal with current difficulties.
Deceleration. The global economic slowdown is likely to depress hitherto buoyant demand for the region’s exports of manufacturing and commodities. At the same, the weakening of the pandemic is reviving hitherto dormant tourism. The slowdown in major economies could cut more than 1 percentage point off growth this year in the major EAP countries (figure o6).
Debt. inflation abroad is prompting an increase in interest rates, inducing capital outflows and exchange rate depreciation in EAP countries, all of which are raising the burden of servicing debt. The weakening exchange rate is also contributing to domestic inflation. Lao PDR and Mongolia are most vulnerable in these respects, because they were already struggling with high debt, and have large shares of debt at variable ra tes and denominated
Index
175
150
125
100
Note: China’s private consumption includes government consumption. 50
200 Feb-20 May-20 Aug-20 Nov-20 Feb-21 May-21 Aug-21 Nov-21 Feb-22 May-22 Aug-22
75
China Indonesia Malaysia Phillipines Thailand Vietnam World excl. EAP
Source: Haver Analytics. Note: goods export value indexed to 2019 average (100). seasonally adjusted. 3 month moving average.
Figure
Index:
Alpha
Dec-19 Apr-20 Aug-20 Dec-20 Apr-21 Aug-21 Dec-21 Apr-22 Aug-22


Merchandise
Retail
PMI:
Industrial
PMI:
in foreign currency, (figure o7). Growing debt service is straining the finances of governments and firms and hence limiting public and private investment (Figure O8).
Distortions. EAP governments are striving to protect households from the increased cost of living and firms from the increased cost of production. inflation has eroded purchasing power, by between 2 percent in Vietnam and 11 percent in Mongolia. Governments also need to alleviate the increased burden of servicing public and private debt. Current
Figure O7. Rising international interest rates are leading to capital outflows from EAP countries and creating depreciation pressures . . .
A. Emerging markets equity and debt flows (cumulative)
USD, billions
Weeks since the beginning
GFC (2008) Taper tantrum (2013) China deleverage (2015) COVID (2020) War in Ukraine/Fed tightening (2022)
Source: Haver Analytics. Institute of International Finance.
Note: A. sample of selected emerging market countries.
A. General government debt
GDP
120
100
80
60
B. Exchange rates (local currency to US dollar) 20
Index, Sep 2020=100 Sep-20 Nov-20 Jan-21 Mar-21 Jul-21 Sep-21 Nov-21 Jan-22 Mar-22 Jul-22 Sep-22May-2 May-2 –70 –60 –50 –40 –30 –20 –10 0 10 0 10 20 30 40
40
China Indonesia Malaysia Philippines Thailand Vietnam Lao PDR Myanmar Mongolia
Figure O8. . . . which are increasing the burden of debt, and hence inhibiting the revival of investment
B. Public and private investment contribution to investment growth
Philippines Vietnam
2020–21
Source: International Monetary Fund, Haver Analytics, World Bank.
Thailand
Private
Notes: B. Shows decomposition of real investment growth. 2015–19 and 2020–22 refers to average during each respective period. Decomposition of investment growth for 2020–22 represents team’s forecast and assessment
policy measures, intended as a response to short-lived shocks, provide much-needed relief but add to existing policy distortions.
• Controls on prices of food and fuel supported by subsidies dampen inflation (figure o9), but distort consumer and producer choices, assist not just the poor and the sMEs but also the affluent and large firms, and swell public deficits and debt.
• Measures to deal with the growing burden of debt – in the absence of faster growth or greater revenue mobilization –may lead to repression in financial markets and hence distort economy-wide savings and investment decisions.
Current policy choices are being made in the face of difficult trade-offs shaped by limited implementation capacity, weak economic institutions, and strong political imperatives. The trade-offs also depend on the duration of shocks. With weak implementation capacity and temporary shocks, price subsidies may help consumers and firms avoid serious disruption with limited fiscal costs.
The muddying of price signals in food, fuel, and finance, as well as other long-standing policy-induced distortions in these markets described below, will inhibit efficient reallocation in a post-CoViD world.
in both food and fuel, EAP governments must meet the triple goals of affordability, security, and sustainability In both cases, the political imperative today is to prioritize affordability for consumer and firms. This goal is being pursued by keeping prices low through food and fuel subsidies as well as export restrictions. These measures provide relief to consumers and producers, and may be the only immediately feasible measures, but they have economic costs even when they are temporary. They shrink fiscal space, inhibit switching of consumption to cheaper commodities, may help the rich and large firms more than the poor and sMEs, and draw tax payers’ money away from expenditure on infrastructure, education and health.
Figure O9. Price controls are one reason for reason for lower inflation in the EAP countries
Figure O10. EAP countries provide high and growing support to agriculture, primarily through market price support as well as transfers for production subsidies and irrigation
A Transfers and market price support to agriculture (% of GDP)
Australia Vietnam South Africa Brazil USA EU OECD Russia Japan Korea, Rep China Turkiye Philippines Indonesia
B. Transfers and market price support to agriculture (% of total support)
100
80
Percent
C Components of transfers to agriculture (% of total transfers)
100
80
Percent
60
40
20
0 1 2
Percent of GDP
Source: World Bank estimates from oECD (2022).
Note: Figures show 2010–2020 average.
0
3 4 In fuel, the temporary crisis measures to keep prices low run counter to the efforts in major EAP countries in the last few years to reduce fuel subsidies. Fuel subsidies are growing in most countries, including in Indonesia and Malaysia which had significantly reduced them (figure o11). At the same time, production of coal is being revived even in countries that were beginning to shut down coal mines. These actions
Other Agricultural knowledge and innovationsystem
Hydrological infrastructure
Production support subsidies
Figure O11. Regional fossil fuel subsidies have recently increased
Fuel subsidies in EAP countries
3.5
3.0
2.5
Percent of GDP
2.0
In food, the temporary crisis measures taken to keep prices low run against a general trend in EAP countries to support production, especially of food grains. Among the existing producer-supporting policies, market price support (MPS) (through import restrictions and government procurement) and transfers to producers (through subsidies, irrigation and other supporting services) are both high and growing for some EAP countries. MPs is 1.5 to 4 times higher than transfers across countries and heavily biased toward production of grains, especially rice even as domestic consumption is diversifying to include more vegetables, fruit, and meat. The mismatch means greater import dependence, higher food prices, and longer-term nutritional insecurity. Between 40 and 70 percent of transfers to agriculture is spent on production and irrigation subsidies (Figure O10). These measures entrench input-intensive food production patterns that are economically inefficient and insufficiently attuned to the challenges of land degradation, environment pollution and greenhouse gas emissions.
1.5
1.0
0.5
–60 –40 –20 0 20 40 60 0.0
2015
China Indonesia Malaysia
Thailand Vietnam
B Bond prices of major Chinese property developers
Percent
8
4
0
–4
–8
12 Jul-18 Nov-18 Mar-19 Jul-19 Nov-19 Mar-20 Jul-20 Nov-20 Mar-21 Jul-21 Nov-21 Mar-22 Jul-22
Real estate climate index New residential housing price
Sources: Bank for international settlements; Bloomberg; Consensus Economics; Haver Analytics; World Bank.
Index/US$
100
80
60
40
20
0
120 Sep-21 Oct-21 Nov-21 Dec-21 Jan-22 Mar-22 Apr-22 May-22 Jul-22 Aug-22
China property bond index Evergrande 2024 Country Garden 2024
Note: A. Figure shows annual percentage changes. The climate index measures the aggregate business activity in land sales and real estate
today could compromise emission reduction commitments as well as perpetuate dependence on imported fossil fuels and hence vulnerability to future energy price shocks.
in finance, governments also have three goals: controlling inflation while maintaining financial stability and supporting growth. Today higher interest rates are being thrust on the region by the twin fears of inflation and capital flight which could weaken currencies. These developments increase the burden of servicing pandemic-bloated private and public - especially variable interest rate debt and debt denominated in foreign currencies. Debt distress in the corporate sector hurts the banks and may threaten financial instability. China’s real estate sector turmoil is an example of pre-existing difficulties that are accentuated by financial tightening though the direct exposure of systemically important banks to property sector loans is limited (figure o12).
When financial institutions, as a consequence of pandemic-induced regulatory forbearance or debt moratoria, continue to support zombie borrowers, the availability of finance is reduced for more productive firms, resulting in lower investment and employment growth. At the same time, debt strains on the government can induce it to seek privileged access to domestic savings through measures that also crowd out productive private investment and hurt growth.
The welfare or profit losses associated with inflation can be significant. Price controls supported by subsidies are motivated by the desire to protect consumers or to avoid disruptions in production. However, support through income transfers is preferable to price regulation. because transfers do not distort choices and can be targeted to those most in need. In Thailand, both fuel subsidies and cash transfers are mitigating the poverty impacts of price increases, but targeted transfers are more cost effective (O13A). Reducing poverty by one percentage point would require THB11.2 billion worth of fuel subsidies, five times more than the THB2.2 billion worth of cash transfers. Therefore, more targeted measures that offer support to vulnerable households (or even firms) would be cheaper for governments; in indonesia, replacing explicit and implicit energy subsidies with targeted support for vulnerable groups would save the government 0.6 percent of GDP. fiscal costs are likely to be smaller if shocks are short-lived.
Figure O13. Transfers are more cost effective at reducing poverty, but governments may still choose fuel subsidies for social welfare, political economy or macro-policy reasons
A. Poverty reduction and cost effectiveness of Thailand’s responses to food and fuel price shocks
Poverty Alleviation (percentage point)
B. Average monthly benefit, if received
4 5 6 400
3
2
1
0
Fuel subsidies and excise reduction
SWC top-up payments (THB 200)
Fuel subsidies and SWC payments
Hypothetical SWC top-up (THB 1000)
Mitigation impact Cost-effectiveness
Source: World Bank estimates based on the 2019 Socioeconomic Survey for Thailand.
0 2
(THB billion)
Cost per Point Alleivated
THB
500
300
200
100
1 2 3 4 5 6 7 8 9 10
Income decile
Diesel subsidy (per capita) Cash transfers (per capita) SWC coverage; RHS
30
20
10
4 6 8 10 12 14 40 0
0
Percent
Note: A. fuel subsidy scenario uses a net THB 10 per liter fiscal cost, which represents a combined impact of fuel subsidies and price controls as well as reduced excise duties. Cost-effectiveness is THB billions of spending per percentage point of poverty averted. B. sWC: social welfare card. Average monthly per capita benefit of diesel subsidy and sWC top-up, if received (THB, LHs); value of diesel subsidy and sWC top-up relative to market income (percent, RHS) and coverage of SWC by decile (percent, RHS).
But governments may still choose price subsidies over targeted transfers for four reasons. First, from a social welfare perspective, in practice a significant proportion of the poor do not receive transfers because many countries do not have adequate delivery infrastructure, such as comprehensive social registries. For example, in Thailand, less than half the poor possess the necessary social welfare card. Second, from a political perspective, targeted transfers do not in principle benefit the majority who are above the poverty line and who feel the pinch of inflation. Third, from an industrial policy perspective, price controls can shield firms from increases in costs of production that could disrupt recovery from the COVID-19 shock. Finally, from a monetary policy perspective, price controls can help keep inflation in check in countries where the monetary authority lacks credibility or inflation expectations are not well-anchored (figure o13B).
How soon governments can transition from less to more efficient policy measures will depend on how soon they can relax constraints posed by implementation capacity, economic institutions, and political considerations. for example, efficient social protection requires:
• developing the infrastructure of social registries, bank accounts and mobile connectivity, to make timely income transfers to those in need;
• devising strategies to win broad political support for desirable reforms, for example by making equal but still progressive transfers to all those who are adversely affected;
• creating mechanisms to help firms and farms to cope with temporary shocks, including through longer term improvements in productivity;
• anchoring inflationary expectations by creating central banks that have both the capacity and the autonomy to make sound and credible policy choices, as in most large AsEAn countries.
To achieve the food goals – affordability, security, and sustainability – governments must begin by shifting focus from ricecentric food security to nutrition security. The implication would be to encourage diversified production of nutritious foods, like livestock products, fruits and vegetables, by reducing policy distortions that currently favor production of rice. Where support to producers is deemed necessary, it would ideally take the form of direct transfers decoupled from production, which would enhance the efficiency of resource use. Additionally, food costs could be significantly reduced by lowering trade barriers. In the longer term, the goal must be to increase agricultural productivity and resilience without undermining sustainability. This goal requires a move away from input-intensive to knowledgeintensive technologies and production practices, involving, for example, improved and resilient breeds/varieties and precision agriculture. Long-term resilience to shocks is best ensured through ex-ante preparedness (better risk assessments and early warning systems) and improved ex-post management systems (well-resourced, reliable, and flexible reserves and contingency funds) which also involve the private sector. These shifts will enhance affordability of and secure access to a more nutritious consumption basket, contribute to higher incomes for farmers, and protect the natural resource base (land, water, and air quality).
In achieving the similar energy goals, policy responses must help meet the immediate need for affordable energy without compromising energy security and sustainability. Some governments are expanding existing fossil fuel sources as they are seen as the most economical way to alleviate the current crisis, but encouraging investment in renewables can reduce exposure to fossil fuel price volatility and help meet emission reduction commitments. In addition to the necessary policy reforms to encourage private sector participation, providing affordable access to finance at-scale and green public procurement would help support low-carbon technologies and accelerate the clean energy transition. At current energy prices, cheaper finance could make investing in wind and solar more attractive than in new coal power plants (Figure O14). such support would be justified if it helped avert the risk of locking development into a high-carbon future or creating potentially stranded assets, thus contributing to both national energy security and global sustainability. When energy prices eventually fall, the introduction of carbon prices would improve the viability of renewables and finance support for vulnerable households.
Figure O14. At current fuel prices, existing coal is the cheapest source of energy, but favorable access to finance could make renewables less costly than new coal
Simulated impact of fuel price and interest rate increases on the levelized cost of energy
USD/MWh (in 2019 prices)
160
120
80
40
0
Existing coal
New coal New wind (onshore)
Interest costs (4pp increase)
New solar PV New CCGT
Back-up cost at current gas prices (25%)
Variable cost of new wind, new solar and new CCGT
Change in coal price in 2022
Coal price in 2021
Source: iREnA and World Bank estimates Note: The Figure shows ‘levelized’ cost calculations of the average unit price of generation using each technology.
To achieve the financial goals, authorities will need to strengthen prudential measures and enhance the financial sector’s ability to allocate resources efficiently. supervisory authorities must ensure that banks maintain sound capital positions and provision adequately for loan losses on a forward-looking basis. Jurisdictions where NPLs were high and remained unresolved typically experienced deeper and more protracted recessions and slower recoveries than those where NPL problems were speedily addressed. Ensuring transparent and timely reporting of bank asset quality is necessary to assess and manage NPL problems and address the risks of credit misallocation arising from pandemic crisis support measures, like regulatory forbearance and repayment moratoria. Effective insolvency frameworks also help mitigate the risks of credit misallocation. Government efforts to mobilize revenue, as Indonesia has recently done through reform of its tax system, and increase efficiency of spending, will also limit the need for government borrowing which could deprive the private sector
of investment funds. In the longer term, developing deeper and more diversified financial systems would help achieve development goals.
Policymakers must consider not only current costs of inefficient instruments, in terms of diverted revenues, diluted assistance, and distorted choices, but also the risk of undermining longer-term goals of growth, security and sustainability. Recent price and interest rate shocks could reduce EAP growth by 0.4 percentage points; inefficient instruments would soften the impact on current welfare but magnify the growth cost; more efficient intervention and deeper reforms – not just in the three areas discussed above but also in services and factor markets – could even offset the growth impact of recent shocks (Figure O15). Addressing the infrastructural, institutional, and political constraints would allow a transition to more efficient policy instruments.
Figure O15. inefficient interventions could magnify the growth costs of recent price and interest rate shocks; more efficient interventions and deeper reforms could offset the negative growth impact
5 6 Impact on potential growth (2022–2031)
4
Percent
3
2
1
0
Baseline Commodity price and interest rate shocks
Government intervention through price subsidies
TFP improvements due to deeper reforms
Government intervention through lumpsum transfers
Boost in investment due to deeper reforms
Growth under initial shock and policy response
Source: World Bank estimates.
2020 2021
April 2022 October 2022 forecast forecast for 2022 2022 2023
East Asia & Pacific 1.2 7.2 5.0 3.2 4.6
East Asia & Pacific (excluding China) −3.6 2.6 4.8 5.3 5.0
ASEAN-5 −3.8 3.4 4.9 5.4 5.1
Pacific Island Countries −9.5 −3.3 2.9 5.3 5.7
China 2.2 8.1 5.0 2.8 4.5
Indonesia −2.1 3.7 5.1 5.1 5.1
Malaysia −5.5 3.1 5.5 6.4 4.2
Philippines −9.5 5.7 5.7 6.5 5.8 Thailand −6.2 1.5 2.9 3.1 4.1
Vietnam 2.9 2.6 5.3 7.2 6.7 Cambodia −3.1 3.0 4.5 4.8 5.2 Lao PDR 0.5 2.5 3.8 2.5 3.8
Mongolia −4.4 1.6 2.5 2.4 5.5
Myanmar 3.2 −18.0 1.0 3.0
Papua New Guinea −3.5 1.0 4.0 4.0 4.2 Timor-Leste −8.6 1.5 2.4 3.0 3.0
Palau −9.7 −17.1 7.2 6.0 18.2
Fiji −17.2 −4.1 6.3 12.6 7.8
Solomon Isl. −3.4 −0.2 −2.9 −4.5 2.6
Tuvalu −4.9 0.3 3.5 3.0 3.5
Marshall Isl. −2.2 −2.5 3.0 1.5 2.2 Vanuatu −5.4 0.5 2.0 2.2 3.4 Kiribati −0.5 1.5 1.8 1.5 2.3
Tonga 0.5 −2.7 −1.6 −1.6 3.2 Samoa −3.1 −7.1 −0.3 −5.0 2.0
Micronesia −1.8 −3.2 0.4 −0.5 3.0
Nauru 0.7 1.5 0.9 0.9 1.9
Source: World Bank; World Bank estimates and projections.
Notes: Percent growth of GDP at market prices. AsEAn-5 comprises indonesia, Thailand, the Philippines, Malaysia, and Vietnam. Values for Timor-Leste represent non-oil GDP. for the following countries, values correspond to the fiscal year: federal states of Micronesia, Palau, and Republic of the Marshall islands (october 1–september 30); nauru, samoa, and Tonga (July 1–June 30). Myanmar growth rates refer to the fiscal year from October to September.
China’s economic activity slowed in the second quarter of 2022 after growing by 4.8 percent in the first quarter. The rest of the region grew by 5.9 percent in the second quarter of 2022 (figure 1). Both external and domestic demand have supported growth in the region excluding China. strong goods exports supported growth in the region’s economies reflecting robust external demand. services exports, which were sluggish, contributed to a lesser extent to growth in the first half of 2022. Private consumption has also been buoyant in the region excluding China as many countries lifted COVID-related restrictions.
Figure 1. Even as China’s economy slowed in the first half of 2022, the rest of the region continued to grow
A GDP relative to pre-pandemic level
120
= 100
2019Q4
INDEX:
110
100
90
Q4 Q4 Q4 Q1 Q2
2019 2020 2021 2022
World excl. EAP EAP excl. China China
Source: Haver Analytics, World Bank.
Note: Seasonally adjusted real GDP indexed to fourth quarter of 2019 (100).
B. GDP relative to pre-pandemic level
120
INDEX: 2019Q4 = 100
110
100
90
Q4 Q4 Q4 Q1 Q2
2019 2020 2021 2022
Indonesia Malaysia Philippines Thailand Vietnam
The recovery has been uneven across East Asia Pacific (EAP) countries, and output remains below pre-pandemic levels in many of the region’s economies. The worst affected and the slowest to recover are Myanmar and several Pacific island countries (figure 2). While output in China and Vietnam had already exceeded pre-pandemic levels in 2020, output in indonesia and Malaysia did so at the end of 2021. Output in Cambodia, the Philippines and Thailand is expected to surpass pre-pandemic levels of output in 2022, and output in many Pacific islands is not likely to return to pre-pandemic levels even by 2023.
The recovery has been uneven across sectors. While sectors like information and communication technology, finance and agriculture have been resilient, output in the transportation, accommodation and catering sectors remains wellbelow pre-pandemic levels in Malaysia, the Philippines, and Thailand (figure 3).
Consumer price index (CPI) has been increasing in recent months but has remained around the target ranges of central banks in several major economies. Price pressures are building rapidly in other countries, reflecting rising energy and food prices, as well as idiosyncratic factors (figure 4). inflation is now above the target range in the Philippines, Thailand and, significantly so, Mongolia. in Mongolia, the prolonged border frictions associated with China’s
Figure 2. But GDP in 2022 is projected to remain below pre-pandemic levels in many countries
Percent
–25 –20 –15 –10 –5 0 5 10 15
zero-COVID policy and increased costs of importing through Russia because of the war in Ukraine, contributed to supply shortages and generated significant price pressures. in Myanmar, consumer price inflation was nearly 18 percent in April 2022, reflecting increasing transport prices and a sharp depreciation in the kyat. Among small economies with available data, inflation has accelerated in Cambodia, fiji, and especially, Lao PDR, exceeding 25 percent (y-o-y) by July 2022 in the latter as the exchange rate sharply depreciated partly because of debt vulnerabilities.
During the crisis, as governments increased spending, public debt increased in most developing EAP countries by more than 10 percent of GDP compared to pre-pandemic levels, and by more than 20 percent and 30 percent in the Philippines and Fiji, respectively (Figure 5). In most EAP countries, the rise in public debt during the CoViD-19 crisis was driven primarily by an increase in domestic debt. At the same time, private sector debt remains high, especially household debt in China, Malaysia and Thailand, and nonfinancial corporate debt in China and Vietnam. An increase in non-financial corporate debt was the major contributor to the rise in private debt during the COVID-19 crisis in Thailand, Vietnam and Cambodia.
In sum, growth in major East Asian economies is projected to be higher and inflation lower than in the rest of the world during 2022 (Figure 6). Most EAP countries have a relatively low debt burden and relatively manageable external financing needs (figure 7). Lao PDR, Mongolia and some of the Pacific island countries are the exceptions to this relatively benign picture.
Figure 3. Manufacturing and digital services have recovered, face-to-face-services have not
120
110
100
90
130 Index (2019Q4 = 100)
80
70
Source: World Bank. Note: figure shows 2022 GDP forecast relative to 2019. 60
CHN IDNMLS PHL THAVNM
Manufacturing ICT & finance Wholesale & retail trade Agriculture Construction & real estate Transportation, accommodation & catering
Source: Haver Analytics. Note: figure shows the seasonally adjusted output level of second-quarter 2022 indexed to fourth-quarter 2019. China shows estimates using year-on-year growth. The bubble size shows the relative size of the sector. ICT = information and communication technology.
China Vietnam Indonesia Lao PDR Cambodia Malaysia Nauru Kiribati Philippines PNG Mongolia Tuvalu Thailand Vanuatu Marshall Isl. Tonga Timor-Leste Micronesia Solomon Isl. Fiji Myanmar Samoa PalauA. CPI inflation (year on year)
Percent
–10 –5 0 5 10 15 20 25 30 35 Aug-19 Nov-19 Feb-20 May-20 Aug-20 Nov-20 Feb-21 May-21 Aug-21 Nov-21 Feb-22 May-22 Aug-22
China Indonesia Malaysia Mongolia Philippines Thailand Vietnam Cambodia Fiji Lao PDR Myanmar
Source: Haver Analytics, World Bank.
B. CPI, core CPI, and target CPI inflation
30
25
20
Percent
15
10
5
0
China Vietnam Malaysia Indonesia Fiji Philippines Thailand Cambodia Mongolia Myanmar Lao PDR
Moderate Substantial High CPI Core CPI Target
Note: B. Latest available (August 2022: China, Indonesia, Fiji, Lao PDR, Mongolia, Philippines, Thailand, Vietnam; July 2022: Malaysia; June 2022: Cambodia; March 2022: Myanmar. “Target” refers to central bank target for each country. Malaysia’s target shows central bank forecast of 2022 inflation.
A. Public debt B. Private debt
100
80
60
40
20
0
Mongolia Lao PDR Malaysia China Philippines PNG Thailand Vietnam Myanmar Indonesia Cambodia Fiji Samoa Vanuatu Tonga Kiribati Solomon Isl. EMDE exc. EAP
East Asia Island economies –
Domestic External 2019
Source: IMF, Fitch, World Bank, IIF, Haver Analytics
Percent of GDP
Percent of GDP 0 40 80 120 160 200 240
China Thailand Malaysia Cambodia Mongolia Vietnam Lao PDR PNG Philippines Indonesia Myanmar Fiji Vanuatu Samoa Solomon Isl. Tonga EMDE exc. EAP
East Asia Island economies –
Domestic External 2019
Note: figure shows public (general government) and private debt decomposition by domestic and external creditors in 2021. EMDE exc. EAP show GDP weighted average of major emerging market and developing economies. Myanmar shows 2020 data
Figure 6. Growth in major EAP countries is projected to be higher and inflation lower than in the rest of the world
10
2022 GDP (growth forecast)
Figure 7. Most EAP countries have a relatively low debt burden and relatively manageable external financing needs
6
4
2
0
–2
–4
Myanmar Kiribati Timor-Leste Mongolia Thailand Tuvalu PNG Cambodia MalaysiaIndonesia Philippines Vietnam China
Tonga
Lao PDR
0 10 20 30
2022 CPI (inflation forecast)
External financing needs (percent of reserves)
Source: World Bank; Fitch Note: Dotted lines show EMDE median
1.4. Poverty
300
250
200
150
100
50
Lao PDR
1 See Box A1 for a discussion of the updated World Bank International Poverty Lines.
350 0 50 100 150 200 250
Cambodia China
FijiIndonesia
8 Mongolia Myanmar Philippines ThailandVietnam 0
Total debt (percent of GDP)
Source: International Monetary Fund, World Bank, Fitch
Note: Total debt includes general government debt and private external debt in 2021. External financing needs show current account deficit, short-term debt and debt service in 2022 forecast as a share of foreign reserves at the end of 2021. Dotted lines show EMDE median.
Poverty in the region is expected to decline in 2022 supported by continued recovery from the pandemic. While many EAP countries, aside from China, experienced setbacks in poverty reduction in 2020 and 2021, the pace of poverty reduction returned to pre-COVID levels in 2022, and the incidence of poverty and number of poor are now projected to reach historic lows (figure 8). An additional 12 million people are expected to escape poverty between 2021 and 2022, based on the World Bank’s updated lower-middle income class poverty line (US$3.65/day, 2017 PPP), whereas 25 million people are projected to escape poverty, based on the updated upper-middle income class poverty line (US$6.85/day, 2017 PPP).1 Further reductions in poverty are expected over the next few years, with the total number of poor in the region projected to decline from 124 million in 2022 to 102 million in 2024 at the lower-middle income poverty line. It is important to note, however, that the region’s progress in reducing poverty remains fragile, as poor and vulnerable households continue to face important challenges related to rising food and fuel prices.
A Lower middle-income class poverty line
B Upper middle-income class poverty line ($3.65 per day in 2017PPP) ($6.85 per day in 2017PPP)
Number of people, millions
100
80
60
40
20
106 110
42 38 26 23 0
120 2019 2020 2021 2022 2023
94 88 18 14 2024
Pre-Covid projections, EAP excl China
Pre-Covid projections, China Covid estimates, EAP excl China Covid estimates, China
Number of people, millions
110 101 Pre-Covid projections, EAP excl China Pre-Covid projections, China Covid estimates, EAP excl. China Covid estimates, China
306 312 317 308 300 292
300
348 333 289 273 248 224 200
350 2019 2020 2021 2022 2023 2024
250
Source: World Bank estimates. Poverty estimates are based on growth forecasts, population projections, and historical growth elasticities of poverty. Note: Forecasts are based on GDP growth projections as of September 14, 2022. US$3.65 per-person-per-day and US$6.85 per-person-per-day poverty lines (2017PPP) represent the typical value of poverty lines found in lower-middle-income and upper-middle-income countries, respectively
Figure 8. The number of poor in developing EAP countries is expected to decline in 2022
Four broad factors are shaping the recovery across EAP countries. The heterogeneity of economic performance across EAP countries is explained primarily by the scale of the CoViD-19 shock, the measures by which the disease is being contained, the extent to which external conditions are favorable to recovery, and the capacity of the government to provide support (figure 9). Most EAP countries have been able to ramp up vaccinations, and relaxed restrictions that hurt domestic economic activity. However, the economic impact of CoViD-19 is still significant in China because of the stringent local public health measures prompted by its efforts to suppress the disease. Even though tourism is reviving, supporting growth in countries like Thailand, the Philippines and many Pacific islands, the global economic slowdown is dampening demand for the region’s exports. EAP governments’ ability to provide continued policy support differed, with some increasingly constrained by rising debt. While inflation at home deflates domestic debt, inflation abroad is prompting an increase in interest rates, capital outflows and exchange rate depreciation, all of which increase the burden of debt
Source: World Bank elaboration.
Apart from the original outbreak between January and March 2020, China was largely able to suppress the spread of infections by deploying the government’s zero-COVID policy—a combination of mass testing, targeted mobility restrictions, travel bans, and mandatory quarantine for travelers entering the country. These measures (figure 10) have helped contain infection outbreaks to largely just within the provinces of Jilin and Shanghai during the Omicron wave.
China’s success in containing COVID-19 infections comes at significant economic expense. The targeted mobility restrictions not only depress demand, but also limit production by shutting down factories and disrupting the domestic supply chain. China’s industrial production shrank by 2.9 percent in April 2022 from a year earlier, the first negative growth in production since March 2020. Merchandise exports also only grew 3.9 percent, the slowest pace since June 2020 ( f igure 11; box 1). Meanwhile, real estate markets continue to be under stress (box 2). China’s output
COVID-19 pandemic Economic conditions in the rest of the world Ability to implement an efficientcontainment strategy Government capacity to provide economic stimulus Country economic conditions Figure 9. EAP country performance is being shaped by CoViD-19 containment, external conditions, and government support100
80
60
Alpha Delta Omicron
40
20
Number of people, thousands
0
Jan-20 Mar-20 May-20 Jul-20 Sep-20 Nov-20 Jan-21 Mar-21 May-21 Jul-21 Sep-21 Nov-21 Jan-22 Mar-22 May-22 Jul-22 Sep-22
China EAP average (excl. China) World average
6
5
4
3
2
Index 0
7 Apr-20Jan-20 Jul-20 Oct-20 Jan-21 Apr-21 Jul-21 Oct-21 Jan-22 Apr-22 Jul-22
1
Hubei Jilin Shanghai Other provinces
Source: Haver Analytics, Johns Hopkins University Center for systems science and Engineering’s CoViD-19 Data (JHU CssE).
is expected to grow more slowly than the output of the rest of the region in 2022, for the first time since 1990. (figure 12).
Goods trade continued to grow in the first two quarters of 2022 because demand in the rest of the world was buoyant (Figure 13). However, quarterly reports from Walmart and Target in the US suggest saturating global demand for consumer electronics, which are important exports for China, Malaysia, Vietnam, and other countries in the region. Further, slower growth in China is decreasing demand for other EAP countries’ exports. incoming data point to a slowdown of global trade growth in 2022 (figure 14).
Figure 11. COVID-19 infections waves and economic activity in China
175
150
125
100
Alpha Delta Omicron
Note: B. figure shows provincial daily confirmed cases, seven-day moving average (JHU CssE). 0
75
50
75
50
100 25
Index: 2019 Dec =100 Index Dec-19 Apr-20 Aug-20 Dec-20 Apr-21 Aug-21 Dec-21 Apr-22 Aug-22
Merchandise export Industrial production
Retail sales PMI: suppliers delivery times (RHS)PMI: services (RHS)
25
Source: Haver Analytics Note: Merchandise export, and real industrial production and retail sales indexed to December 2019; for PMI suppliers’ delivery times and services PMI, 50+ shows no delivery delay and expansion, respectively.
A revival of tourism is likely to help services exports in countries such as the Philippines, Thailand and many Pacific Island countries. But tourist arrivals are still less than 40 percent of what they were before the pandemic in the majority of EAP economies, likely driven by the relatively stricter CoViD-19 related restrictions in EAP economies (figure 15).
The increase in interest rates is leading to tighter financial conditions and is squeezing aggregate demand in advanced economies. Meanwhile, many countries are struggling with increased energy costs and continuing supply chain disruptions. COVID-19-related restrictions and a sharp decline in residential investment is likely to also hurt economic growth in China. Growth projections for large economies have been downgraded in the face of recent developments (figure 16).
The negative effect on trade of government public health measures in China during Omicron was less dramatic but more durable than during the Alpha wave in 2020.
China continues to resort to mass testing and local mobility restrictions to suppress the spread of COVID-19. This zero COVID policy is motivated by the concerns that a spike in infections could overwhelm health system capacity especially in rural areas where the number of unvaccinated people among vulnerable groups remains significant and few have attained immunity conferred by prior infections (World Bank 2022a).
While suppressing the spread of the virus, empirical analysis shows that these public health measures affect economic activity. Province-level data on exports show that during the Alpha and Omicron COVID-19 waves of infections, restrictions were more likely to affect economic activity negatively. The correlation between de jure government restrictions, measured by a government lockdown stringency index, and provincial exports performance, measured by year-on-year export growth relative to the 2019 level, is weak during normal times (in other words, the non-wave periods; green), but turned strongly negative during the Alpha and Omicron waves of infections (red) (figure B1.1).
Figure B1.1. COVID-19 mobility restrictions and growths of exports across Chinese provinces
Export growth (percent)
100
80
60
40
20
0
–20
y = 0.6196x - 0.6436 R² = 0.0549 –40
120 45 50 55 60 65 70
y = -3.0724x + 191.85 R² = 0.1954
Stringency (Index)
Alpha and Omicron waves Non-wave period
Source: Haver Analytics; General Administration of Customs, China Note: The Figure shows average stringency and year on year export growth during the Alpha and Omicron waves (Jan–Mar 2020, Jan–Apr 2022), and the non-wave period (Apr 2020–Dec 2021) for each province.
A panel regression estimation with month and province fixed effects that controls for the severity of infections and de facto public mobility confirms these results. The negative effect of restrictions on exports during the Omicron wave was less dramatic but more durable compared to the Alpha wave in 2020. On average, an index-point increase in provincial restrictions stringency—associated with a 0.8-percentage-point decrease in monthly year-on-year exports growth during the omicron wave (statistically significant at 90 percent confidence interval for the months of December 2021 and January and March 2022), and a 2-percentage-point decrease during the Alpha wave (significant in March 2020) (figure B1.2).
1
Percentage point
Percentage point
Alpha Delta Omicron
No wave period Wave period
Source: Haver Analytics; General Administration of Customs, China; Wind. Note: Alpha-wave is January-March 2020. Delta-wave is July-November 2021. Omicron-wave is January-April 2022. Bar height represents estimated coefficient. Lines represent 90% confidence intervals.
0
–2
2 Dec-19 Feb-20 Apr-20 Jun-20 Aug-20 Oct-20 Dec-20 Feb-21 Apr-21 Jun-21 Aug-21 Oct-21 Dec-21 Feb-22 Apr-22
Source: Haver Analytics; General Administration of Customs, China; Wind. Note: Monthly conditional correlations of lockdown stringency and exports growth. Lines represent 90% confidence intervals.
(Box 1. continued) *** ** –4 –3 –2 –1 0 Housing became the principal component of households’ investment portfolios in the absence of alternative savings options, and sales of land use rights represent an important source of financing for local governments. Meanwhile, according to China Real Estate information Corporation, as of June 2022, inventories of homes in tier-3 and tier-4 cities stood at around 265.2 million square miles in total with a destocking cycle of 24 months. This supply overhang might not be easily absorbed, given China’s unfavorable demographics and slower urbanization over the coming decade. At the same time, the pace of disposable income growth is projected to cool alongside slowing long-term growth, further limiting the housing market’s ability to sustain high valuations in metropolitan areas.
–8 –6 –4 Alongside bond issuance, developers used the presale of housing units as a source of low-cost financing to fund expansive development projects. A similarly rapid accumulation in leverage was witnessed prior to other housing boom-bust episodes, such as Japan in the 1990s and the United States in the 2000s. Housing prices have roughly quintupled over the past 20 years, and the pace of appreciation has accelerated notably since 2015 (figure B2.1).
The rapid expansion of housing in China since the mid-2000s, along with the share of housing-related activities’ increasing sharply to an estimated 30 percent of GDP in gross value-added terms (including housing-related construction, equipment, and real estate services), led to unsustainable accumulation of debt by developers (Rogoff and Yang 2020).
(Box 2. continued)
Figure B2.1. China housing market and international comparison
A. Share of housing in GDP
40
30
20
10
0
1997 2003 2009 2015
China U.S. in 2005 Spain in 2006
Source: nBs; United nations; World Bank; China Real Estate information Corporation (CRiC).
B. Average price for residential property sold
600
500
(Index, 2000=100)
400
300
200
100
0
Note: A: Author’s calculations using national input-output matrix. for China, see data sources in Rogoff and Yang (2020). for other countries, see kLEMs. B: Average price for residential property sold is calculated as the total value of all residential property sold divided by the total floor space sold.
Concerned about growing financial risks, the authorities tightened real estate regulations to rein in property sector leverage, starting in the third quarter of 2020. The main regulation, known as the “three red lines,” was introduced in August of 2020 and sought to curb lending to developers that are in breach of three targets: debt-to-equity ratio of 100 percent, cash-to-short-term-debt ratio of one, and liability-to-asset ratio of 70 percent.
Developers exceeding one or more of these targets face a cap on further increases in total interest-bearing debt of 15 percent or lower.
The implementation of the three red lines policies caused several real estate developers to experience liquidity shortages by the second half of 2021. Liquidity pressures raised concerns among investors and homebuyers, causing equity and bond prices of major developers to plummet and housing sales and prices to fall.
China’s real estate market is experiencing a severe downturn. Housing activity has dropped following a temporary rebound between mid-2020 and mid-2021. A short-lived boom in housing demand during this period was fueled by a surge in household savings and accommodative credit policies. But fixed asset investment in real estate plunged in the second half of 2021 and land sales plummeted owing to regulatory tightening on property developer financing and on land purchases (figure B2.2). Construction starts also dropped sharply as major developers experienced significant financial stress. The surge in new home sales in the first half of 2021, fueled by a liquidation of holdings by developers to improve liquidity positions, was followed by a sharp contraction in new home sales. Housing prices have fallen, especially for second-hand housing for which average prices dropped by almost 7 percent between september 2021 and July 2022.
Apr-00 Jun-03 Aug-06 Oct-09 Dec-12 Feb-16 Apr-19 Jun-22 (continued)
(Box 2. continued)
Figure B2.2. Housing market activity in China has slowed sharply
A. Land sales and housing starts (y/y, 3mma)
B. New home sales (y/y, 3mma)
60
40
20
0
–20
–40
Percent –60 –40 –20 0 20 40 60 80 100 120
–60
Apr-15 Sep-17 Feb-20 Jul-22
Land sales Housing starts
Source: Haver Analytics; NBS; Wind Information Database; World Bank.
Note: B: sales volume refers to floor space sold. 3mma=3-month moving average; y/y=year-on-year.
What has been the response by policymakers?
Apr-15 Sep-17 Feb-20 Jul-22
Sales value Sales volume
The authorities have announced several initiatives and proposals to address the real estate downturn. While the central government has provided guidance, most of these measures have been implemented to varying degrees at the local level.
• The five-year loan prime rate (LPR)— the benchmark rate for mortgages—was cut by 15 basis points (bps) to 4.30 percent in late August. The down-payment requirements and purchase restrictions have been further relaxed from city to city.
•
The authorities have encouraged large banks and asset management companies to facilitate the supply of reasonable financing.
• Regulators initiated a credit enhancement program for a few selected private developers in which China Bond Insurance Co. Ltd. will provide direct guarantees for bonds or asset securitization products issued by the companies.
•
The local government has taken the lead to ensure housing completion through administrative measures. Meanwhile, the policy banks are planning to provide special loans to support the construction of some presold housing projects facing difficulties with delivery.
The measures have slowed the fall in housing prices but have done little to spur residential investment growth. financial institutions have been hesitant to refinance developer debt, and housing demand remains weak.
Percent (continued)
• In the short term, the authorities may need to provide temporary liquidity support to distressed developers and financial guarantees for project competition to reduce the risk of contagion and help restore confidence in the property market. Some state support for stalled projects has been provided, though only at the local level.
• Over the medium and longer term, reducing property sector risks will require continued deleveraging of developers, harmonized rules on the use of funding from housing pre-sales and their enforcement, and the introduction of property tax to reduce speculative investment.
•
Fiscal reforms to give local governments access to new sources of revenue beyond land sales, including a property tax, would need to be introduced in parallel.
•
The distress of large developers has also underscored the need for a robust and predictable framework for debt resolution and corporate insolvencies, which would facilitate the reallocation of capital to support a more innovation-driven, private-sector-led growth.
• Changes to urban master plans and floor area regulations could unlock private investment in urban regeneration. Such a shift would also require investment into upgrading public spaces, improving public transport, and enhancing the delivery of public services.
• further liberalization of the financial system is essential to expanding the range of financial assets available to households as investment options and reduce the propensity to buy and hold empty properties as investment vehicles.
Figure 12. China’s output is expected to grow more slowly than the output of the rest of the region in 2022, for the first time since 1990
60
50
40
175
150
Index
30
20
10
Feb-20 May-20 Aug-20 Nov-20 Feb-21 May-21 Aug-21 Nov-21 Feb-22 May-22 Aug-22
China Indonesia Malaysia Philippines Thailand Vietnam
125
100
Index 50
200 Feb-20 Apr-20 Jun-20 Aug-20 Oct-20 Dec-20 Feb-21 Apr-21 Jun-21 Aug-21 Oct-21 Dec-21 Feb-22 Apr-22 Jun-22 Aug-22
75
China Indonesia Malaysia Phillipines Thailand Vietnam World excl. EAP
Source: Haver Analytics. Note: A. PMI new export orders. Seasonally adjusted. 50+ = expansion. Three-month moving average. B. Goods export value indexed to 2019 average (100). Seasonally adjusted. Three-month moving average.
Figure 14. Manufacturing has led growth of EAP countries’ good exports, whereas travel and transport are a drag on services exports
point
Source: Customs data from China, the
2022q1 2020q1 2020q3 2021q1 2021q3 2022q1 2020q1 2020q3 2021q1 2021q3 2022q1
China Indonesia Malaysia Philippines Thailand
Extraction Machinery/Electronics Other Manu. Goods
Travel
Balance of Payment statistics. note: The chart shows decomposed export growth relative to the fourth quarter of 2019.
120
100
80
60
40
20
0
140 Jan-20 Mar-20 May-20 Jul-20 Sep-20 Nov-20 Jan-21 Mar-21 May-21 Jul-21 Sep-21 Nov-21 Jan-22 Mar-22 May-22 Jul-22
Cambodia Malaysia Philippines Thailand Vietnam Fiji
Tourist arrival (2022 YTD indexed to 2019, controling China's share in 2019)
Index Cambodia Fiji
A growth shock originating in G7 economies (China) would impact EAP economies through bilateral trade, including trade in intermediate goods, trade in services (especially in the Pacific islands), and financial flows, including foreign direct investment (FDI). In addition to trade and financial channels, slower G7 countries’ (Chinese) growth could transmit a significant shock to regional economies by depressing confidence and investment. Lower trade and fDi inflows would hurt domestic investment and productivity growth over the medium term. An unexpected one-off drop in G7 countries’ (China’s) GDP growth rate of 1 percentage point would lower the aggregate growth rate in the rest of developing EAP countries by 0.6 (0.5) percentage points for the next two years (figure 17). This estimate is based on a Bayesian structural vector autoregression (SVAR) model, which can capture both the upside and downside risks associated with China’s economic growth. Mongolia, the Solomon Islands, Lao PDR, and Myanmar are especially exposed to China as a destination for exports and as a source of FDI.

Hong Kong SAR, China Malaysia
MyanmarPhilippines SingaporeThailand Vietnam
y = -0.846x + 32.227 R² = 0.2988 –50 –40 –30 –20 –10 0 10 20 30 40 50 20 40 60 80


Stringency index (average, 2022)
Source: Haver Analytics Note: A. Figure shows tourist arrivals indexed to the corresponding month in 2019. B. Figure shows total tourist arrivals in 2022 (until July or latest) indexed to the corresponding total in 2019 after controlling for China’s share in origin of tourists in 2019 (y-axis), and the average stringency index (x-axis).
Figure 16. Slowing global growth is likely to dampen export demand
GDP growth forecast
Source:
Fund,
forecast
Policymakers are reacting to increased inflation by raising policy interest rates both globally and in the EAP region. Despite an increasing trend, policy rates in the EAP region remain lower than in other EMDEs, but higher than in advanced economies (figure 18).
Despite the monetary tightening in the US and the increasing price pressures, financial conditions have so far remained relatively benign for the EAP region. During the crisis, governments increased spending, relaxed monetary policy, and exercised regulatory forbearance toward the financial sector. As a result, policy space narrowed in certain dimensions (table 1).
At the same time, governments in the region are cutting expenditure as support to individuals and firms that were ramped up in the aftermath of COVID-19 has been waning. With the exception of China, the structural balance during 2022 in all other major economies in the region is forecast to be less than during 2021 (figure 19).
Inflation in most EAP countries has been driven less by domestic demand pull than by foreign cost-push factors. Demand-pull factors remain relatively weak because of restrained monetary and fiscal policies and the gradual revival in private consumption and investment. Three key cost-push factors include higher imported commodity prices, including food and fuel, input shortages due to
Figure 18. Economies around the world are increasing policy rates
rates and inflation forecasts
Source: Haver Analytics.
A. fitch’s
Figure 17. A slowdown in major advanced economies and in China will negatively affect growth in the region
Impact of a 1 percentage-point decline in the G7 (excluding Japan) and Chinese GDP growth rate on the growth rates of other regional economies
point
inflation
as of end-August 2022.
unweighted
Malaysia Thailand Philippines Indonesia
G7 excluding Japan China
Source: World Bank, Haver Analytics, J.P. Morgan, IMF Balance of Payments Statistics (BOP), IMF Direction of Trade Statistics (DOTS), UNCTAD.
Notes: Cumulative impact on growth after one year. Median of posterior distribution. Estimates based on a Bayesian sVAR, estimated using quarterly data for first-quarter 1998 to first-quarter 2018. Estimates for each country include the following variables: growth in G7 excluding Japan; the JPMorgan Emerging Market Bond Index; growth in Japan, China, and Korea, Rep.; commodity price growth; recipient-country growth; and the real exchange rate of the recipient country. Commodity exports are weighed by each commodity’s average export share in a commodity export basket of the spillover destination country. A lag of four quarters is adopted. identification is based on a recursive structure, with variables ordered as just listed, and earlier variables are assumed to be contemporaneously unaffected by later variables Inferences are based on 2,000 Monte Carlo draws. Estimated spillovers include effects through indirect channels, including confidence as well as global and regional value chains.
Interest rates by
of 10 EAP,
and
Dec-20 Aug-22
other EMDE
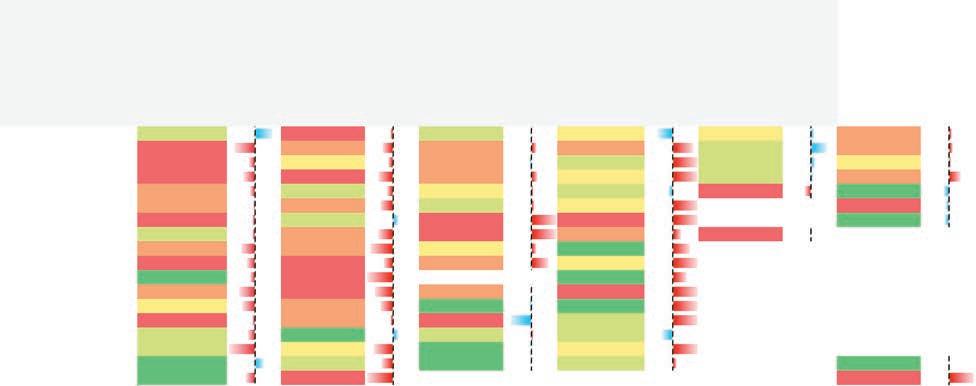
China Malaysia Indonesia Philippines Vietnam Thailand Lao PDR Mongolia Cambodia Myanmar Timor-Leste Fiji Solomon Islands Papua New Guinea Samoa Vanuatu Tonga
Figure 19. EAP countries continued fiscal expansion in 2021 but began consolidating in 2022, except for China
change of structural balance
A. East Asia
B. East Asia compared to other regions
Source:
Imported (commodity) price increases
(Imported) input shortages due to supply chain disruptions
Depreciating currencies due to foreign financial tightening
Expansionary monetary and fiscal policy
Increase in private consumption and investment
Source: World Bank elaboration.
SRAS 2
SRAS 1
(Imported) cost-push inflation
(Domestic) demandpull inflation
Real GDP (Y)
AD 2
1
Real GDP (Y)
supply chain disruptions, and a depreciation in currency driven by external developments (figure 20).
Output remains below potential in the region’s largest economies, suggesting subdued domestic demand, which is unlikely to have been a major driver of inflation (Figure 21). In many countries, private consumption and investment remain below pre-pandemic levels. Economic slack is mostly concentrated in sectors such as transportation and accommodation and catering.
Energy prices remain elevated, reflecting tight supplies driven by the war in Ukraine, but some other commodity prices are beginning to drop (Figure 22). Metal prices have seen a sharp fall amid worries of a decline in Chinese demand and weak global growth. Agricultural prices declined from their peak in June and July, led by grains, oils and meals. Wheat prices have fallen due to higher-than-expected production in Canada, Russia and the United States.
Figure 21. Persistent output gaps limit scope for domestic demand-pull inflation
Output gaps after policy support in EAP
Percent of potential GDP
Source: Haver Analytics.
Bank
Rising energy and food prices fed into price increases in most countries, (Figure 23). Food prices have increased considerably in Indonesia, Malaysia, the Philippines and Thailand during the last few months and appear to be the major contributor of higher inflation. Energy prices have risen in the Philippines, Thailand and Vietnam.
Compared to other EMDEs, consumer prices appear to have responded less to external pressures in the EAP region. While import prices and producer prices have increased sharply, measures of consumer price inflation (both headline
and core) remain subdued in the major EAP economies (figure 24; box 3). in contrast, consumer prices in other EMDEs have been increasing much quickly, closing the gap with import prices. further, producer price inflation in the EAP region lags import and export price inflation, whereas in other EMDEs they appear to move closely with producer price.
One reason for low pass through is that EAP countries maintain price controls supported by subsidies (Figure 25). Commodity exporters like Indonesia and Malaysia can more easily afford these subsidies. In general, co-movement of export and import prices is stronger in EAP countries, and some EAP countries have access to energy from Russia at discounted prices
Figure 23. These price increases have generated inflationary pressures
200
160
120
80
40
0
Note:
China Indonesia Malaysia Philippines Thailand Vietnam Food & Beverage Housing & furnishing Transport & communication Others CPI Percentage point Index: 2010 =100
Source: Haver
figure shows contribution to CPi inflation (year on year). China’s CPi weight is estimated. Source: Haver Analytics, World Bank.
–4 –2 0 2 4 6 8 10 Jan-20 Jun-20 Nov-20 Apr-21 Sep-21 Feb-22 Jul-22 Jan-20 Jun-20 Nov-20 Apr-21 Sep-21 Feb-22 Jul-22 Jan-20 Jun-20 Nov-20 Apr-21 Sep-21 Feb-22 Jul-22 Jan-18 Jul-18 Jan-19 Jul-19 Jan-20 Jul-20 Jan-21 Jul-21 Jan-22 Jul-22
2 Kose, Ohnsorge, Reinhart,
At this stage, for many EAP countries, inflation at home is a lesser problem than inflation abroad because it is provoking an increase in interest rates (Figure 26). Such tightening could also be triggered by broader concerns about financial vulnerabilities and the sustainability of the recovery in EMDEs. The resulting capital flows out of emerging markets are leading to a depreciation in emerging market currencies that could pass-through to inflation (figure 27).
The pandemic-induced recession in 2020 led to the largest single-year surge in global public debt in the last 30 years, raising concerns about debt sustainability.2 Several factors have contributed to public debt accumulation in developing EAP countries during the last decades.
Jan-20
and Commodity prices
Jun-20 Energy Agriculture Metals and minerals
Nov-20 Apr-21 Sep-21 Feb-22 Jul-22 Jan-20 Jun-20 Nov-20 Apr-21 Sep-21 Feb-22 Jul-22 Jan-20 Jun-20 Nov-20 Apr-21 Sep-21 Feb-22 Jul-22
Analytics Figure 22. Commodity prices increased substantially, though some are beginning to drop
Rogoff (2022)
options that have, in the past, helped lower debt burdens. They examine orthodox options (enhancing
heterodox options (inflation, financial repression, debt default, and debt restructuring).
Percent
–5
–10
Jan-20 Apr-20 Jul-20 Oct-20 Jan-21 Apr-21 Jul-21 Oct-21 Jan-22 Apr-22 Jul-22
CPI Core CPI PPI
Export Price Import Price
40
30
20
10
0
–10
CPI Core CPI PPI
Export Price Import Price
Box 3. The response of consumer prices to external factors
To disentangle the impact of drivers of consumer price inflation in the region, an augmented Phillips curve is estimated. it includes a forward-looking measure of inflation expectation (consensus forecasts over a one-year horizon), a backward-looking measure (four quarters of lagged inflation representing adaptive expectations of agents), the output gap representing slack in the economy, and supply-shock variables such as exchange rates and commodity prices (food and energy prices). inflation expectations turns out to be a significant predictor of headline inflation. The results suggest a low level of pass-through from external price shocks to consumer price inflation in EAP countries (figure B3.1). This finding may reflect that agents in the region are forward looking and their behavior, such as in negotiating wages, is largely based on inflation expectations, which are relative well-anchored. The stability of expectations in turn can be attributed to sound monetary policy and the credibility achieved by many central banks since the adoption of the inflation-targeting regime (Taylor 2000).
Figure B3.1. Marginal effects of inflation expectation, exchange rates, and prices on inflation
Marginal effects on headline inflation
Inflation expectations
Output gap
prices Figure 24. But pass-through to producer and consumer prices is lower in major EAP countries
* A. East Asian economies
US dollar exchange rate
Import prices
Producer prices
prices Percent
Source: World Bank’s Global Economic Monitoring, Haver Analytics. Note: EAPCE staff research. Estimates from oLs panel regressions of quarterly headline inflation on the respective quarterly B. Other EMDEs
Energy
Food
0.0 *** ** ** ** 0.2 0.4 0.6 0.8 Jan-20 Apr-20 Jul-20 Oct-20 Jan-21 Apr-21 Jul-21 Oct-21 Jan-22 Apr-22 Jul-22
output gaps, four consecutive lags of quarterly inflation, and country and quarter fixed effects. four-quarter moving-average smoothing Source: Haver Analytics.
–0.2
prices and exchange rates, controlling for quarterly inflation expectation,
applied. sample includes China, indonesia, Malaysia, Philippines,
and Thailand. ***p < 0.01, **p < 0.05, *p < 0.1. Note: A. Average of China, Indonesia, Malaysia, Philippines, Thailand and Vietnam.
A. Price controls on imports
Historically, economic growth rates in developing EAP countries have been sufficiently high to exceed nominal interest rates, which contributes to a reduced debtto-GDP ratio. Economic growth helped EAP countries reduce the public debt-to-GDP ratio, on average, by 2.1 percentage points per year during the 2000–2022 period (figure 28). Even during the Global financial Crisis (GFC) of 2008–09 economic growth helped reduce the debt burden. But growth contraction during the COVID-19 recession in EAP countries excluding China led to an increase in the public debt-to-GDP ratio of 2.6 percentage points in 2020, on average, in these countries.
B. Median inflation
adjusted)
Figure 26. inflation in the Us has led to monetary policy tightening and an increase in interest rates . . .
Percent
Jun-19 Sep-19 Dec-19 Mar-20 Jun-20 Sep-20 Dec-20 Mar-21 Jun-21 Sep-21 Dec-21 Mar-22 Jun-22
CPI 10 year treasury note yield (RHS)
Source: Haver Analytics
On average, primary deficits have contributed to increasing public debt-to-GDP ratio by 1.1 percentage points. The historical patterns observed in most EAP countries suggest that relying on fiscal consolidation as a policy option to deal with high debt to GDP would be challenging. in the past, fiscal consolidation has only contributed to lower debt-to-GDP ratios in indonesia, fiji, the Philippines, and Thailand. Pre-CoViD, negative primary deficits observed in Indonesia, Fiji, the Philippines, and Thailand helped to reduce the public debt-to-GDP ratio by 0.7, 0.7, 1.9, and 0.5 percentage points, respectively. on the other hand, positive primary deficits observed in the rest of the developing EAP countries contributed to increases in the public debt-to-GDP ratios of 1.8 percentage points, even before the CoViD-19 shock (figure 29). furthermore, post-CoViD, the high primary deficits that resulted from the policy response to CoViD-19 have contributed to an increase in the public debt-to-GDP ratio of 4.1 percentage points.
The effect of inflation on the real value of the public debt-to-GDP ratio depends on the composition of the debt. on one hand, inflation helps to lower debt burdens by diluting the real value of public debt. on the other hand, higher inflation rates could depreciate the exchange rate and increase the nominal value of debt denominated in foreign currency. Therefore, the net effect of inflation on debt accumulation depends on the composition of public
A. Emerging markets equity and debt flows (cumulative)
–70 –60 –50 –40 –30 –20 –10 0 10 0 10 20 30 40
B. Exchange rates (local currency to US dollar)
120
100
Weeks since the beginning
GFC (2008) Taper tantrum (2013) China deleverage (2015) COVID (2020) War in Ukraine/Fed tightening (2022)
Source: Haver Analytics. Institute of International Finance Note: A. sample of selected EM countries.
80
60
Index, Sep 2020=100 20
USD, billions Sep-20 Nov-20 Jan-21 Mar-21 May-2 Jul-21 Sep-21 Nov-21 Jan-22 Mar-22 May-2 Jul-22 Sep-22
40
China Indonesia Malaysia Philippines Thailand Vietnam Lao PDR Myanmar Mongolia
debt. foreign currency debt as a share of total debt is high in Cambodia (100 percent), Lao PDR (83 percent), and Mongolia (88 percent), while in China, Malaysia, Thailand, and the Philippines, debt denominated in foreign currency represents less than 10 percent of total debt (figure 30). Among countries that are highly indebted in foreign currency, currency depreciation contributes to an increase of 1.6 percentage points in the debt-to-GDP ratio. The effect of currency depreciation on debt accumulation is negligible among most EAP countries except for Mongolia and Lao PDR. finally, countries with most of their debt denominated in domestic currency, such as Thailand, Malaysia, and China have not relied on seignorage as much as countries that hold most of their debt in foreign currency, which could be explained by the commitment of their central bank to inflation targets and central bank credibility.
Figure 28. Economic growth has alleviated the burden of debt in East Asia
A. EaP excluding China
Percent of GDP
Debt accumulation Growth rate (RHS)
Source: International Monetary Fund; World Bank estimates
B. China
Percent of GDP
2000 2002 2004 2006 2008 2010 2012 2014 2016
Debt accumulation Growth rate (RHS)
A. Pre-COVID (2000–2019)
B. Post-COVID (2020–2022)
Percent of GDP Philippines
Indonesia Fiji Thailand China Vietnam Mongolia Cambodia Malaysia Lao PDR
Source: World Economic outlook, international Monetary fund; World Bank estimates
Percent of GDP Philippines
Indonesia Fiji Thailand China Vietnam Mongolia Cambodia Malaysia Lao PDR
A. Share of public debt denominated in foreign currency
Percent China Thailand Philippines Indonesia Fiji Lao PDR Mongolia CambodiaMalaysia
Percent of GDP
Indonesia Lao PDR Cambodia Fiji Philippines Malaysia Thailand ChinaMongolia
Pre-COVID Post-COVID
–2 0 2 4 6 8 Source: World Economic outlook, international Monetary fund; World Bank estimates. Note: A. Data as of 2021. B.C. Pre-Covid shows the average of 2000–2019. Post-Covid shows the average of 2020–2022.
Percent of GDP Lao PDR
Indonesia Vietnam Philippines Fiji Cambodia Malaysia Thailand ChinaMongolia
Pre-COVID Post-COVID
Overall, inflation has contributed to reducing debt burdens by 1.6 percent of GDP. After controlling for the exchange rate depreciation effect, the positive effect of seignorage on resource mobilization dominates the currency depreciation effect, and therefore there is a negative correlation between inflation rate and public debt-to-GDP ratios across EMDEs (figure 31).
Debt service has added as much as 1.5 percentage points to public debt to GDP ratios in developing EAP countries (Figure 32).
Figure 31. Correlation between inflation rates and inflated debt
Debt accumulation, % GDP
5 10 15 20 Inflation rate, %
Source: World Economic outlook, international Monetary fund; World Bank estimates
–7 –6 –5 –4 –3 –2 –1 0 0 Figure 32. Debt accumulation driven by debt service
Percent of GDP
2000–2007 2008–2009 2010–2019 2020–2022
Cambodia Fiji Indonesia Malaysia Mongolia Philippines Thailand Vietnam
Source: International Monetary Fund; World Bank estimates
Low and stable inflation has often been associated with more rapid output growth and lower output growth volatility. Low and stable inflation increases the transparency of relative price changes, provides confidence for longterm savers and investors, protects the purchasing power of household income and wealth, and enhances financial stability (figure 33). Policies needed to reduce inflation in high-inflationary environments, including tighter monetary policies, are also likely to suppress economic growth.
Figure 33. Higher and more volatile inflation is correlated with lower growth; more volatile inflation with more volatile growth
A. GDP growth
B. GDP growth volatility
Source: Ha, Kose and Ohnsorge 2019
sample includes 84 EMDEs, including
An inflation-provoked increase in interest rates abroad inflates debt service. Further, the depreciation in currencies increases the burden of debt, especially in those countries that have large debt in foreign currency (figure 34). Cambodia, Lao PDR and Mongolia have a large share of external debt in foreign currency. These countries also have a significant share of variable rate external debt and external debt borrowed in non-concessional terms. China is the largest creditor for Cambodia and Lao PDR.
The need to refinance debt in the short term can distress in the private corporate’s balance sheets. EAP countries have accumulated significant private sector debt, especially through non-financial corporates. Most of the debt is denominated in local currency, but in countries like China, Malaysia and Thailand large part of corporate debt matures in the short-term (figure 35).
Inflation weakens consumption and worsens income redistribution. Higher prices will nudge households to lower consumption. Since low-income households have a higher propensity to consume, their consumption will weaken the most. Low-income households tend to rely on wages, pensions, and social benefits as their main sources of income, which respond less and with longer lags to inflation than nonwage income. At the same time, when inflation is high, low-income households hold a larger share of their savings in cash, and the real value of cash savings will be eroded by
inflation volatility inflation volatility low-income countries. inflation volatility is defined as standard deviation. inflation refers to year-on-year inflation. Average savings and investment from 1980 to 2016 for countries with a standard deviation of inflation in the top quartile and standard deviation of inflation in the bottom quartile.


100
80
B. Short-term and variable rate external debt
200
150
60
40
20
0
Percent of GDP Indonesia Myanmar Vietnam Thailand PNG Philippines China Malaysia Lao PDR Mongolia FijiCambodia
Domestic creditor
Domestic creditor, local currency
Domestic creditor, foreign currency
External creditor
External creditor, local currency
External creditor, foreign currency
C. Concessional vs non-concessional debt
60
100
50
0
Percent of GDP China Philippines Solomon Isl. Indonesia Vietnam Fiji Cambodia Thailand Lao PDR PNG MongoliaTimor-Leste
Short term debt Variable rate debt
D. Creditors of external public debt
40
20
Percent of GDP Non-Consessional Concessional
80 China Thailand Philippines Fiji Vietnam Indonesia Cambodia Lao PDR Mongolia
Percent of GDP
0
0 10 20 30 40 50 60 70 80 China Thailand Vietnam Philippines Fiji Indonesia Cambodia Lao PDR Mongolia


Others Bonds Japan China World Bank Asian Development Bank


Source: World Bank, IMF, IIF, Haver Analytics
Note: A. Figure shows general government debt in 2021 decomposed by creditor type and currency denomination. For China, Malaysia, the Philippines and Thailand, the currency composition of general government debt is assumed to be the same as that of the central government. For Lao PDR, external debt is assumed to be foreign currency denominated; foreign currency bond and commercial bank loans are assumed to be domestically held. B. Figure shows external short-term debt and long-term variable rate debt in 2020. C. Figure shows concessional and non-concessional external public and publicly guaranteed debt in 2020. Concessional debt is defined as loans with an original grant element of 35 percent or more. D. figure shows large creditors of external public and publicly guaranteed debt in 2020.
inflation. As a result, poor households’ real incomes tend to decline more than those of higher-income households in high-inflation environments.
High inflation can reduce savings through two channels. First, as costs of living increase, households are likely to utilize more of their saved assets to pay for goods and services they were already planning to purchase. second, inflation lifts nominal income growth and, thus, accelerates tax progression which is measured against fixed nominal income tax brackets (Ha, Kose and Ohnsorge 2019). This squeezes post-tax incomes, which will tend to depress household saving.

Percent of 2021 GDP
15
Percent of GDP 0
0
Source: IIF, World Bank
China
Household, foreign currency
Nonfinancial corporate, foreign currency
Household, local currency Nonfinancial corporate, local currency
Indonesia
The erosion of current savings and the reduction of after-tax incomes lowers aggregate savings and, hence, the funding envelope for productive investment (figure 36).
While most of developing East Asia maintained broad macroeconomic stability, Lao PDR and Mongolia stand out as notable exceptions. Both countries have been struggling with high debt and have experienced widening macroeconomic imbalances, rapid weakening of exchange rates and soaring domestic inflation (figure 37). in Myanmar, the combination of CoViD-19, persistent domestic conflict, and limited access to foreign financing in the wake of the military coup has exacerbated external liquidity pressures. While specific country circumstances vary, in all three cases global shocks compounded pre-existing vulnerabilities, amplifying the negative effects and limiting the scope for effective policy responses.
10
5
20 2022 2023
2023
2023
2023
2023
VNM IDN PHL THA MYS CHN
2023
Financial corporate Nonfinancial corporate Sovereign
Percent of GDP
A. figure shows private debt by currency denomination in the first quarter of 2022. B. figure shows loans and bonds that will be matured in 2022 and 2023 as a percent of 2021 GDP. 0
10
5
Source: Ha, Kose and Ohnsorge 2019 Notes: sample includes 84 EMDEs, including 20 low-income countries. inflation volatility is defined as standard deviation. inflation refers to year-on-year inflation. figure shows average savings and investment from 1980 to 2016 for countries with a standard deviation of inflation in the top quartile and standard deviation of inflation in the bottom quartile.
Due to the impact of rising import prices for food and energy as well as currency depreciation, consumer price inflation in all three countries hit recent historical highs, reaching 17.3 percent in March for Myanmar, 25.6 percent for Lao PDR in July and 15.7 percent in July in Mongolia. Increases in global oil prices have driven pronounced increases in domestic fuel prices and transport costs. Depreciation, supply chain disruptions and the spillover effects of higher transport prices have resulted in price increases for a broader range of producer and consumer goods, squeezing already thin profit margins of businesses and reducing the purchasing power of households. Reflecting growing external imbalances and liquidity constraints, exchange rates weakened in all three countries despite efforts by the authorities to lean against depreciation pressures, with the
Figure 37. Lao PDR, Mongolia and Myanmar have faced more significant exchange rate and inflation pressures than the rest of the region
A. Exchange rate (local currency per USD)
180
160
140
Index
120
100
80
Jan-19 Apr-19 Jul-19 Oct-19 Jan-20 Apr-20 Jul-20 Oct-20 Jan-21 Apr-21 Jul-21 Oct-21 Jan-22 Apr-22 Jul-22
Lao PDR Mongolia Myanmar Median: EAP others
Source: Haver Analytics, World Bank Note: A. Exchange rate is indexed to January, 2019
B. Inflation (year on year change)
30
25
20
Percent
15
10
5
0
–5
Jan-19 Apr-19 Jul-19 Oct-19 Jan-20 Apr-20 Jul-20 Oct-20 Jan-21 Apr-21 Jul-21 Oct-21 Jan-22 Apr-22 Jul-22
Lao PDR Mongolia Myanmar Median: EAP others
Tugrug (MnT), kip and kyat depreciating by 12 percent, 58 percent and 13 percent, respectively, over the past year. All three countries face large external balance of payments (BOP) imbalances and perilously low foreign exchange (FX) reserves.
The underlying causes of instability vary across the three countries. In Lao PDR, COVID-19 and rising energy prices have intensified external and fiscal imbalances, which are exacerbated by existing high debt levels and large external debt service obligations. The consequent liquidity pressures contributed to a sharp depreciation of the kip, which has considerably increased inflation. in Mongolia, the combined impact of CoViD-19, the war in Ukraine, and lingering border frictions with China which have constrained commodity exports and raised the cost of transportation service imports, resulting in slow growth and a growing current account deficit that is projected to widen to 15.4 percent of GDP in 2022. in Myanmar, continued conflict has depressed economic recovery after COVID-19 and the military coup, and exacerbated external liquidity pressures as investors have lost confidence in the domestic currency.
Policy responses have also varied but all three countries have attempted to intervene to stabilize currencies. In Mongolia, the Bank of Mongolia (BoM) accommodated pressures by allowing the MnT to weaken by 12 percent against the US dollar since the beginning of the year. However, expecting easing of border frictions and viewing current exchange rate pressures as transitory, the BoM has been reluctant to let the exchange rate depreciate further (reflecting concerns about the pass through to inflation). Resulting fX interventions have led to a loss of Us$1.5 billion in reserves in the first half of this year, depleting gross international reserves to US$2.9 billion, less than three months of imports. The BOM also hiked the policy rate cumulatively by 400 basis points (in January, March and June) to 10 percent, but large quasi-fiscal activities in the banking system partly co-financed by commercial banks (subsidized lending programs amounting to about US$1.5 billion) have continued to fuel credit expansion and undermined effective monetary policy transmission. During a period of intense liquidity constraints in February 2022, banks started rationing FX to customers while the government imposed controls on capital outflows. This has resulted in a significant gap between the non-bank and interbank nominal exchange rates (figure 38).
After returning to a fixed exchange rate regime, the authorities in Myanmar relied on tighter capital controls in a bid to stem downward pressure on the currency. Following the military coup in February 2021, the kyat faced
3100
2800
2500
22
20
16 18
2200
1900
Thousand Kip/USD
1600
1300
Dec-20 Feb-21 Apr-21 Jun-21 Aug-21 Oct-21 Dec-21 Feb-22 Apr-22 Jun-22 Aug-22
Reference rate
Counter rate midpoint Parallel market rate
C. Mongolia
14
12
10
Kyat/USD 8
Jan-20 Apr-20 Jul-20 Oct-20 Jan-21 Apr-21 Jul-21 Oct-21 Jan-22 Apr-22 Jul-22
Parallel rate Commercial rate
Sources: Haver Analytics, World Bank
3100
A. Myanmar B. Lao PDR 2800
MNT/USD 2/24/22
3000
2900
3200 3/26/22 4/25/22 5/25/22 6/24/22 7/24/22 8/23/22
Interbank rate Non-bank rate (parallel)
significant depreciation pressure. To slow down the kyat depreciation, the Central Bank of Myanmar increased the sales of US dollars: between September and December 2021, US$294 million was sold, almost triple the amount sold in the previous four months. Faced with dwindling reserves, the Central Bank of Myanmar has stopped auctioning US dollars into the market since early March 2022 and abandoned the managed float exchange rate regime, instead fixing the exchange rate at an overvalued level not reflective of market supply and demand. This has led to shortages of foreign currency at that official rate (and the emergence of large spreads in parallel markets), restricting the ability of businesses to import critical goods, including fuel. In a bid to stem foreign exchange pressures, the authorities concurrently imposed a number of foreign exchange restrictions and capital controls, including FX surrender requirements for exporters3 and mandatory
3 The Central Bank of Myanmar issued a notification in August that required =within one working day the conversion of 65 percent of foreign currency earnings into Myanmar kyat at the predetermined unfavorable official reference rate. Exporters must use the remaining 35 percent of the foreign currency earnings within 30 days for imports or other cross-border payments, if not used in 30 days, the foreign exchange earnings will be converted into kyat.
conversion requirements for foreign currency deposits. These requirements have acted as a tax on Myanmar exporters (who were previously able to convert foreign exchange earnings at the market rate), reducing their price competitiveness on international markets and hindering necessary external adjustments. In addition, the authorities in Myanmar have imposed onerous trade restrictions, including the reinstitution of import and export trade license requirements, import bans and quotas.
While Lao PDR has experienced the sharpest exchange rate depreciation in the region, foreign liquidity pressures persist. The external current account has improved on stronger exports and higher prices for some key commodity exports, but foreign liquidity pressures have prevailed, largely due to exporters retaining earnings off-shore, in part to make payments abroad (related to external debt, imports, dividends, and so forth.) but likely also because of devaluation expectations and perceived confiscation risks. The authorities have accommodated external pressures by allowing the official kip/Us$ exchange rate to depreciate by almost 60 percent over the past 12 months, but a persistent premium in the parallel market points to further depreciation pressures. External liquidity constraints are exacerbated by Lao PDR’s large external debt service obligations (amounting to over US$1 billion per year) while FX reserves remain precariously low, standing at US$1.3 billion, less than two months of import coverage4. To ease pressures on the kip, the Bank of Lao has tightened domestic liquidity, including through a recent issuance of a six-month savings bond, priced very aggressively at an annualized 20 percent interest rate, significantly above prevailing deposit rates. in addition, the authorities have resorted to various administrative measures, limiting the functions of currency exchange units and granting commercial banks a greater role in the purchase and sale of foreign currencies by importers, exporters, investors and other legal entities. Currency exchange units are now only allowed to change money for individuals and tourists, up to a maximum of 15 million kip per person per day. Further capital controls are being considered, including FX surrender requirements for exporters in an attempt to corral more FX into the domestic market. Meanwhile, foreign currency liquidity shortages caused a demand-supply mismatch and widened the spread between the official and parallel market rates, with the spread reaching 38 percent in mid-June, before declining to 16 percent by the end of July. The combination of foreign exchange shortages (at the official rate) and a fuel price cap have also led to widespread fuel shortages in the country, which have been temporarily eased by a credit line to fuel importers and the lowering of fuel excises for three months.
High inflation requires frequent price adjustments for goods and services by firms to maintain their profitability. These price adjustments are usually asynchronous (“staggered price setting”), leading to relative price distortions that undermine the efficient allocation of resources and productivity growth (nakamura et al. 2018). High inflation obscures relative price changes, creating a need for costly information searches, increasing uncertainty about the future value of assets, and hence discouraging investment and economic growth (figure 39; box 4). similarly, price control measures to curb inflation can hinder the allocation of resources to their most productive use and thus hurt productivity (box 5).
A. Regression coefficient from regressing distortions on GDP per capita growth
0
–1
–2
–3
–4
–5
–6
–7
–8
–9
B. Price controls and labor productivity
Labor productivity (GDP/employment)
120
100
80
60
40
20
Indonesia China Myanmar
Fiji Vietnam
Malaysia y = -0.9775x + 46.316 R² = 0.0948 0
140 0 10 20 30 40
Number of Price Controls
Source: Trade Policy Review (TPR), Haver Analytics, Penn World Table (PWT), World Bank and World Bank estimates Note: A. The chart extends Easterly’s (1993) analysis. Dependent variable: GDP per capita growth, 2015–19. Price level distortions are defined as expenditure-weighted average input prices across 49 categories of inputs and investment goods for 2017 orthogonalized log of dollar price relative to the U.S. Price dispersion refers to expenditure-weighted variance across input and investment good categories for 2017 orthogonalized log of dollar price relative to the US Whiskers represent 90-percent confidence intervals of the estimates. B. Latest available number of products with import price controls pre-COVID, collected from TPRs. Labor productivity collected from PWT and averaged for the period 2015–19.
One way to measure indirect distortions of prices, like those analyzed in the previous section, would be to look directly at observed retail prices across countries. We utilize the International Comparison Program (ICP)’s prices database with data on 2017 benchmark prices relative to the U.S. for 171 countries and 120 commodities. Following Easterly (1993) and Aitken (1991), we construct a measure of the mean of relative prices across commodities for each country and interpret this as complementary measures of overall distortion of the price system. As noted in Easterly (1993), the variation of each commodity’s price across countries due to differences in natural resource endowments needs to be removed. This is done by isolating the orthogonal component of each of the logs of the 120 prices with respect to per capita income. Following, the expenditure-weighted mean of the orthogonalized logs of relative prices is computed, separately for all commodities and for those belonging to each of the three aggregate sectors including agriculture, manufacturing, and services. The expenditure-weighted averages of each commodity’s orthogonalized log price from the log mean is then computed for each country.
A scatterplot showing the distribution of countries on the price-distortion-and-growth plane further indicate that most EAP countries fall in quadrant I, which is characterized by a higher-than-median annual GDP growth and negative average residual prices (figure B4. 1). This suggests that most EAP countries tend to keep their relative prices lower than international levels, even after controlling for the national income level. (continued)
Ordinary least square (OLS) estimates suggest that countries’ distortion levels in agriculture, manufacturing, and services are highly correlated with the size of tariffs and restrictiveness imposed in these respective sectors (figure B4.2). The econometric estimates also suggest that countries with a relatively lower level of price distortions experienced a higher GDP growth rate within the same period.
Figure B4.1. Price distortion and GDP growth across countries
GDP growth (average; 2015–2019)
Price distortion (2017 average price residuals)
Source: iCP, WEo
Note: Vertical and horizontal dash lines show median growth and distortion levels.
Figure B4.2. Higher tariffs are correlated with higher price distortions; higher price distortions are correlated with lower growth
B. Correlations between aggregate price distortions A. Correlations between tariffs and aggregate price distortions and sectoral GDP growths
(index)
Source: iCP, WEo
Note: Each bar represent coefficient estimates from a cross-country oLs regression. Dependent variables are aggregate sectoral price distortions, measured as the mean of absolute orthogonalized log 2017 prices computed for each country. Agricultural and manufacturing tariffs are the average of effectively applied rates for primary and manufacturing products, respectively. Tariffs and services trade restrictiveness index are standardized from global means. Bar height represents estimated coefficient. Whiskers represent 90 percent confidence intervals.
Source: iCP, WEo
Note: Each bar represents coefficient estimates from a cross-country oLs regression. independent variables are aggregate sectoral price distortions, measured as the mean of absolute orthogonalized log 2017 prices computed for each country. Respective dependent variables are aggregate and sectoral GDP growths (2015–19). Bar height represents estimated coefficient. Whiskers represent 90 percent confidence intervals.
Developing East Asia has undergone a dramatic transformation over the past few decades thanks to a combination of policies that fostered outward-oriented and labor-intensive growth, investments in basic human capital, and sound economic governance. However, slowing growth and shifting patterns in global trade, rapid technological change, and evolving country circumstances present challenges to sustaining past productivity growth and ensuring future growth. Thus, understanding the extent of misallocation and its driver is an important step toward identifying the types of policies that can improve domestic productivity and the competitiveness of firms.
What is misallocation? A growing literature is investigating the existence and magnitude of distortions that cause producers to deviate from their socially efficient size. Two approaches have been followed. first, the indirect approach is based on the seminal paper by Hsieh and Klenow (2009). This methodology does not identify the amount of misallocation deriving from specific sources but provides an all-encompassing measure. second, direct evidence of misallocation is sought by focusing on one specific channel through which misallocation may arise. This box reviews the evidence from both approaches for East Asian countries and discusses their limitations.
Indirect evidence—an all-encompassing measure
Hsieh and Klenow (2009; henceforth HK) provide a framework to assess the extent of misallocation under the indirect approach. Their basic idea is that allocative efficiency is achieved when two firms within a narrowly defined industry can employ resources until their marginal revenue products are equalized. This optimization occurs as more-productive firms grow until the decrease in their prices matches their higher total factor productivity. Under the Hk framework, large dispersions in marginal revenue products among firms operating within a narrowly defined industry imply the misallocation of resources in that industry.
HK rely on data from China, India, and the United States and find sizeable misallocation of resources, which decreases aggregate total factor productivity (TFP). de nicola et al. (2020) apply the Hk framework to data from indonesia, Malaysia, and Vietnam and again find high levels of misallocations (figure B5.1).
While it is a valuable first step toward measuring resource misallocation, the HK approach depends on rather strong assumptions. one important assumption is that firms’ inputs and revenue are free of measurement error. Since the HK approach uses revenue and inputs to estimate marginal productivity, this assumption could bias the estimated resource misallocation. Mismeasurement is likely to present in most firm-level datasets, especially in developing countries, because of the weak capacity of firms’ accounting systems and national statistical agencies.
Bils, Klenow, and Ruane (2017; henceforth BKR) propose a methodology that exploits the panel structure of the data to correct potential measurement errors. The authors build on the HK approach and allow for additive measurement error in revenues and intermediate inputs.5 Correcting for measurement error suggests that
5 When measurement error is additive but i.i.d. over time, the levels and first differences of revenue relative to inputs provide independent signals of the true dispersion in marginal revenue products. Hence, by taking the covariance between first differences and levels of average revenue products, one could estimate the variance of the true marginal products, which captures resource misallocation within a narrowly defined industry.
180
120
90
60
30
0
2001–2005 1991–1994 1987–1997 2008–2015 2008–2015 2008–2015 China India U.S. Indonesia Malaysia Vietnam
Source: Hk for China, india and U.s.; de nicola et al. (2020) for indonesia, Malaysia, and Vietnam.
the level of misallocation is lower. BkR consider data from india and United states, while de nicola et al. (2020) apply BKR methodology to data for Indonesia, Malaysia and Vietnam (Figure B5.2).
Another limitation of HK is discussed in Haltiwanger et al. (2018, Hks henceforth): model misspecification.6 Using exceptionally detailed microdata, where businesses’ quantities and prices are observed separately, HKS show a key assumption in the HK framework does not hold in any of the 11 markets observed. Hence, the HK framework would yield spurious measures of distortions.7
Recognizing the possible limitations of the HK approach is important in order to precisely estimate the extent of misallocation. However, and reassuringly, the ranking of the misallocation magnitudes does not change based on the approach used. According to both the HK and the BKR approaches, misallocation is more prevalent in Indonesia, while distortions harming productivity are less severe in Vietnam and even less so in Malaysia.
(Box 5. continued) Direct evidence—specific channels
Measurement error and/or departures from the assumed market structure may overestimate the extent of misallocation. In general, the indirect method may yield estimates of misallocation that far exceed those arising from specific individual channels. indeed, a given economy may suffer from multiple sources of misallocation at once.
6 In HK, TFPR dispersion is evidence of misallocation and the existence of distortions since a producer’s price has an elasticity of -1 to its TFPQ level. This negative unit elasticity ensures that TFPR is invariant to TFPQ differences across producers unless distortions are present. HKS demonstrate that this assumption holds only if every producer faces isoelastic demand, and their marginal costs are constant in quantity and negative unit elastic with respect to TFPQ.
7 In HKS data and related literature, TFPR and TFPQ are positively correlated, indicating the HK assumption is likely not to hold. Indeed, HK-implied measures of TFPQ are only weakly correlated with TFPQ measures directly observed in HKS data, and they have a much larger variance. Accounting for demand shocks helps reconcile these measures.
(continued)
Regulation. A wide range of policy instruments has been considered in the literature to assess the extent to which regulatory interventions contribute to misallocation and thereby lower aggregate productivity. The focus has moved from adjustment costs, such as firing costs, to the broader category of “size-dependent policies”—for example, higher taxes that become effective beyond a certain employment threshold—yet any of these measures tends to explain only a small fraction of misallocation.
Preferential access to resources for state-owned enterprises is associated with sizeable (see Song, Storesletten, and Zilibotti, 2011) and increasing productivity losses. Brandt, Tombe, and Zhu (2013) study the period 1985–2007 and find that within-province misallocation of capital between state and nonstate sectors reduced the nonagricultural TfP growth rate by 0.5 percent per year. The costs of misallocation appear to have sharply increased during the latest period analyzed, 1997–2007.
Regulatory restrictions on movements across space are also associated with considerable misallocation. Bryan and Morten (2019) leverage detailed data from Indonesia to estimate the aggregate productivity gains from reducing barriers to internal labor migration, accounting for worker selection and spatial differences in human capital. They find a 22 percent increase in labor productivity resulting from removing all barriers. The estimate hides substantial heterogeneity, with some more constrained localities seeing gains of over 100 percent. Using the United states as a benchmark indicates that removing migration costs there would yield only a 7 percent productivity boost. Misallocation due to migration costs is sizeable also in China. Tombe and Zhu (2019) study the impact of goods- and labor-market frictions using a general equilibrium model calibrated with Chinese data. overall, the reduction in the cost of internal trade and migration account for 28 percent of aggregate labor productivity growth in 2000–2005, while reduction of international trade costs accounted for only 8% of labor productivity growth. Despite reductions in internal trade and migration costs during the period studied, these costs remain high. The quantitative model indicates that gains from further liberalization are large, especially with respect to land reform.
1985–2013 1978–2013 2008–2015 2008–2015 2008–2015 India U.S. Indonesia Malaysia Vietnam Figure B5.2. Corrected TFP gains from equating TFPR across industries Source: BkR for india and United states; de nicola et al. (2020) for indonesia, Malaysia, and Vietnam.Property rights. Property rights affect resource allocation and therefore productivity, by limiting expropriation and facilitating market transactions (Besley and Ghatak 2010). Adamopoulos and Restuccia (2014) assess the impact of the Comprehensive Agrarian Reform Program (CARP) on agricultural productivity by calibrating a model with data from the Philippines.8 In 1988, the reform introduced ceilings on existing land holdings promoted the transfer of above-ceiling land to landless and smallholders and restricted the transferability of the redistributed land. Between 1989 and1993 agricultural productivity fell by more than 10 percent. According to the model, this decline is the result of distortions in farm size and occupational choices, as land is transferred from more to less productive holders.
Using a quantitative framework and farm-level panel data from China, Adamopoulos et al. (2022) study how frictions in land and capital market curb productivity through two margins: (1) the allocation of resources across farmers (misallocation) and (2) the allocation of workers across agricultural and non-agricultural sectors (selection). Reallocation of factors across existing farmers to their efficient use increases agricultural TfP by 24 percent. By allowing factor inputs to be allocated efficiently also across villages, the gains double to 53 percent, with more than two-thirds of the gains accounted for by labor reallocation across villages.
Labor misallocation in agriculture is a concern also in Vietnam. Using household level panel data and a quatitative framework, Ayerst et al (2020) find that despite annual growth of agricultural output of more than 4 percent over the period from 2006 to 2016, labor misallocation in agriculture remained high and possibly worsened. The widening dispersion in productivity between farmers is driven by switching to higher value crops, increasing farm plot size, and shifting to larger farms.
Trade and competition. Trade policy influences the allocation of resources across heterogeneous producers and consequently impacts aggregate productivity. Two approaches are used to quantitatively assess the impact of tariffs and/or other distortionary forms of protection. On the one hand, evidence comes from model-based estimates. for example, building on Arkolakis, Costinot, and Rodríguez-Clare (2012), Edmond, Midrigan, and Xu (2015) study the impact of moving from autarky to free trade by calibrating a model to manufacturing data. Opening to trade leads to greater competitive pressure and substantially reduces markup distortions. Consequently, it reduces misallocation and improves total factor productivity by more than 12%.
On the other hand, specific trade policy changes are examined for causal inference. Khandelwal, Schott, and Wei (2013) study the elimination of externally imposed quotas on Chinese textile and clothing exports. Interestingly, the distortionary effects of the quotas imposed by the Us, Canada, and the European Union were compounded by the effects of government-imposed quotas allocated in favor of (less productive) state-owned enterprises. The authors find that 71 percent of the productivity gains derived from the empirical analysis are the result of the elimination of misallocated quota licenses, while the remaining 29 percent is explained by the removal of misallocation resulting from the quota itself.
8 Incidentally, it is interesting noting that models tend to explain a larger share of the changes in agricultural rather than manufacturing productivity
Credit constraints and informational frictions. There is established literature on the positive correlation between financial market development and growth (see Buera, kaboski, and shin (2015) for an overview). Credit constraints may lead to misallocation, potentially magnifying the persistency of low productivity, as more-productive firms take a longer time to overcome financial constraints. This empirical question has been tested in multiple frameworks and the resulting estimates tend to vary substantially across studies. On the conservative side are the results by Midrigan and Xu (2014). They calibrate a model with korean plant-level data and find that losses from misallocation in an environment with borrowing constraints amount to 4.7 percent of the TfP decline (accounting for over 27 percent of the change). Borrowing constraints harm growth more through the selection (into a sector) channel rather than through the misallocation (within the sector) channel.
A complimentary analysis is proposed by David, Hopenhayn, and Venkateswaran (2016) who focus on informational frictions. Under their framework, firms have limited knowledge about the demand conditions in their markets when choosing inputs. The authors estimate a structural model with 2012 data on firm-level production variables and stock returns for three countries: China, India, and the United States. Informational frictions for investment but not labor decisions lead to losses in productivity (of 4 percent, 7 percent, and 10 percent) and output (5 percent, 10 percent, 14 percent) (for the United states, China, and india respectively). The authors show that financial markets have limited ability to overcome these frictions given the high level of noise in market prices. Conversely, valuable information can be inferred from private (internal to the firm) sources.
The EAP region has been relatively less impacted by the food security crisis
Against the backdrop of rising global food insecurity, the EAP region is in a relatively less vulnerable position. An international comparison of real food inflation (figure 40), based on latest values available for each country in the last four months, shows EAP countries placed in the low-inflation band of 0 percent to 2 percent, comparable to the Us, Canada, Uk, france and south Africa. similarly, the EAP region appears to be relatively well placed in a more granular assessment of food vulnerability. The food exposure score9 shows that the EAP region, along with south Asia, is among the least vulnerable regions. (figure 41)
The EAP region is also structurally less susceptible to shocks generated by the war in Ukraine. The war has caused significant tremors in the international food system because Russia, Ukraine and Belarus combined represent 16 percent of the cereal (mainly wheat) exports, 10 percent of the animal/ vegetable fats or oils exports and 21 percent of the fertilizer exports. However, there is relatively limited direct impact on EAP countries (except Mongolia). Wheat accounts for a small percentage of cereal consumption in EAP countries. similarly, sunflower/safflower oil imports account for a small share of total edible oils and fats imports in EAP countries. However, about a quarter of the EAP countries’ fertilizer imports are from Russia, Ukraine, and Belarus. As such, this impact will be felt most strongly, both directly through trade restrictions and indirectly through increased prices (figure 42).
Source:
Note:
Rice prices have been generally stable throughout the recent crisis. Maize and wheat prices have been volatile upward, in contrast to rice. Since early 2021, the price of wheat has nearly doubled, while the price of rice has kept declining. This is hugely significant given the key role as the main food staple rice plays in the food security concerns of the region (figure 43).
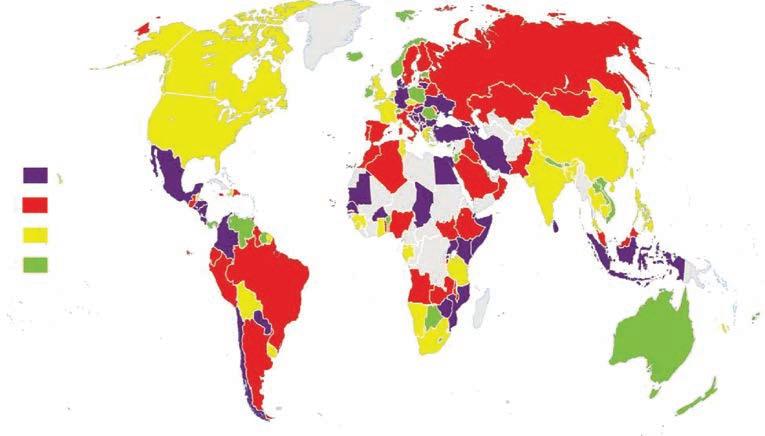
Source: WB calculations using data from WB (2022).
Note: Food exposure score is calculated using the share of kilocalories from cereals per share of cereals imported, the share of stock to consumption weighted by May prices, the
Dietary Sourcing
Index and the FAO Food System Resilience Index, and the food imports share of total imports.
Over the years, the rice situation has been more stable than that of wheat or maize, thus buttressing EAP food security. In the 2010s, the volatility of rice production was remarkably lower than the volatility of wheat and maize. This was reflected in more stable prices. Between 1970 and 1979, variation (measured through standard deviation of monthly price changes, within indicated years) of international rice prices was higher than that of wheat and maize. However, in the period between 2010 and 2022, rice price variation sharply fell to below that of wheat and maize. Structurally, these trends were related to the spread of irrigation in rice production. In the 2000s, the share of irrigated area in global production of rice (62.2 percent) doubled the share of wheat (31.1 percent) and tripled the share of maize (19.7 percent). finally, rice stocks have also been relatively more stable across different episodes of food crisis (figure 44).
Although EAP countries have been relatively unscathed by the on-going food crisis, there is need to address growing threats to food security. These threats relate to pre-crisis weaknesses, structural characteristics of the food
A. Share of Russia, Ukraine, and Belarus in world exports
16%
Cereals Animal or vegetable fats or oils Fertilizers
Belarus Russia Ukraine
100
80
60
40
0 B. EAP’s reliance on imports from RUB for cereal and wheat (in value, average 2018–2020) (average 2018–2022)
800
600
400
200
20
10% 21% RUB share (% of total wheat imports)
Pacific
RUB share (% of total cereal imports)
Cereal ex-im ratio (RHS)
EAP
0 Benchmark for export-import ratio (RHS)
Source: WB estimates using data from WITS Note: Cereals include wheat and meslin, barley, maize. Animal or vegetable fats or oils include soya-bean oil, sunflower or safflower oil; rape, colza or mustard oil. fertilizers include n-fertilizer, k-fertilizer and fertilizer with two or three elements (n,P,k). The countries grouped into “Pacific island countries” include fiji, kiribati, the Marshall islands, Micronesia, nauru, Palau, samoa, the solomon islands, Tonga, Tuvalu, and Vanuatu (as defined in the WB EAP Economic Update). Due to data constraints, not all the countries are not included in all analyses. Trade data for Pacific countries, except fiji, are mirrored. Also, mirror data is used for Papua new Guinea and Timor-Leste due to data constraints, and Myanmar’s import data is also mirrored due to reportedly under-recording issues. For the export-import ratio, a value above 1 is interpreted as a net exporter and below 1 is a net importer. RUB = Russia, Ukraine, Belarus.
economy and vulnerability to external shocks. The salient challenges are the rising number of food-insecure people; food price inflation and volatility, despite stable rice prices; increasing incidence of natural hazards; and susceptibility to fuel and fertilizer shocks.
Figure 43. Prices for rice, the staple cereal for EAP countries, have been stable in the current episode
Index
200
150
100
50
250 Jan-2 Apr-2 Jul-20 Oct-2 Jan-2 Apr-2 Jul-21 Oct-2 Jan-2 Apr-2 Jul-22
0
Rice Wheat Maize
Source: World Bank calculations using data from World Bank Commodity Price Data (The Pink Sheet) Note: Figure shows monthly cereal price indexes (January 2020=100).
Worryingly, the incidence of severe food insecurity has been increasing in EAP countries. Severe insecurity refers to the condition where someone has run out of food and gone a day or more without eating. In south-eastern Asia, the number of severely food insecure people has almost doubled since 2014, with 15.2 million people that year and 28.0 million in 2021. In those years, the prevalence of severe food insecurity has gone up from 2.4 to 4.1 percent. in eastern Asia, the number of severely food insecure people has increased less drastically since 2014, from 13.2 million people to 17.4 million in 2021. in those years, the prevalence of severe food insecurity has slightly increased, from 0.8 to 1.0 percent. in oceania, the number of severely food insecure people has doubled since 2014, from 1.0 million people to 2.0 million in 2021. The change in the prevalence of severe food insecurity is significant, increasing from 2.5 to 4.5 percent (figure 45).
Stable rice prices have not insulated EAP consumers from food inflation or food price volatility. Despite stable rice prices, food inflation has been a significant component of recent CPi increases in EAP countries (section 2.2). Moreover, in the evolution of the current food c risis since January 2020, country level data shows that despite stable (even falling rice prices) consumers have had to endure both price increases and price swings driven, for example, by changing prices of animal protein. This is because the contribution (“weight”) of rice to overall CPi is dwarfed by that of non-rice food items (figure 46)
volatility compared to wheat and
Source:
A. Thailand
Index 60 80 100 120 140 160 180 200
CPI
Jan-20 Mar-20 May-2 Jul-20 Sep-2 Nov-2 Jan-21 Mar-21 May-2 Jul-21 Sep-2 Nov-2 Jan-22 Mar-22 May-2 Jul-22
Food CPI Rice Meats
B. Philippines
Index
60 80 100 120 140 160 180 200
CPI
Jan-20 Mar-20 May-2 Jul-20 Sep-2 Nov-2 Jan-21 Mar-21 May-2 Jul-21 Sep-2 Nov-2 Jan-22 Mar-22 May-2 Jul-22
Food CPI Rice Meats
C. Malaysia
Index 60 80 100 120 140 160 180 200
CPI
D. China food CPI
Index 60 80 100 120 140 160 180 200
Jan-20 Mar-20 May-2 Jul-20 Sep-2 Nov-2 Jan-21 Mar-21 May-2 Jul-21 Sep-2 Nov-2 Jan-22 Mar-22 May-2 Jul-22
Food CPI Rice Meats
Weights
Jan-20 Mar-20 May-2 Jul-20 Sep-2 Nov-2 Jan-21 Mar-21 May-2 Jul-21 Sep-2 Nov-2 Jan-22 Mar-22 May-2 Jul-22
Food CPI Grain Meats and poeltry
This has important consequences for consumer welfare and food security strategy and policies. Evidence on the ground clearly indicates that food prices increase impose a heavy and regressive burden on households. figure 47 shows how households coped with recent food price increases by both reducing overall food consumption and, critically, cutting down on consumption of more nutritious and healthy diets. The latter clearly jeopardizes nutritional welfare, especially that of women, children and other vulnerable groups. In terms of strategy, the current focus of public policies and public expenditures on rice stability needs to be urgently augmented with promoting the availability, affordability and stability of more diversified and healthy diets.
It is imperative to address three long-term challenges to strengthen food security in EAP economies. First, there is a growing mismatch between food demand and supply. Food demand is moving away from rice as consumers grow richer, more nutritionally conscious and also more urbanized (figure 48). However, insufficient diversification in domestic production has led to growing imports in important categories of food products, especially meats and edible offal, maize and soybeans (figure 49).
Second, climate change presents major risks to the food security of EAP countries. figure 50 shows the rising frequency of natural disasters in the EAP region. on climate change, agriculture is both a “culprit” (a major contributor to climate change) and a “victim” (one of the sectors expected to be hardest hit). Food security policies need to address the fact that current agricultural practices and land use changes are compromising the natural resource base and future production potential. Evidence shows a direct negative impact of climate change on agricultural productivity growth. There is need to also promote investment in adaptation through new technologies, adapted seeds and management practices.
Third, the current crisis has highlighted the need to increase resilience to fuel and fertilizer shocks. As figure 51 shows, the recent fuel price increases have ratcheted up fertilizer prices. Historically, fertilizer prices have had a close influence on grain prices. in the short term, there is need to diversify fertilizer imports to secure supplies for the coming planting seasons. In the longer term, to promote sustainability and resilience, it is important that food security policies
Figure 47. food inflation hurts consumption and nutrition (Philippines)
A. Share of poor households not buying food due to price increase
B. Share of better-off households not buying food due to price increase
B. Change in calories (per capita per day) from various food groups
400
150
100
Calories per capita
300
200
100
0
Kgs per capita –100
50
0
200 1980 1985 1990 1995 2000 2005 2010 2015 2020
Rice - East Asia Wheat - East Asia
Rice - Southeast Asia Wheat - Southeast Asia
Rice Non-rice cereals & starchy roots Fruits & Vegetables Meat, dairy, eggs & fish Oils and fats Sugar Others
C. Projected change in consumption from various food groups in Asia, 2022–2031
Percent
10
A. Consumption per capita of rice and wheat in EAP region, 1990–2019 0
Source: A. fAosTAT, UsDA PsD. B. fAosTAT. C. oECD/fAo (2022)
5
Staples Meat Dairy Fish Sugar Vegetable oil
Developed and East Asia South and Southeast Asia
Note: The Developed and East Asia group includes: Australia, China, Japan, new Zealand, korea Rep. The south and southeast Asia group includes: Afghanistan, Bangladesh, Bhutan, Myanmar, Cambodia, Lao PDR, nepal, TimorLeste, Brunei Darussalam, Democratic People’s Republic of Korea, Hong Kong SAR, China, Macao SAR, China, Maldives, Federated States of Mongolia, Singapore, Sri Lanka, Taiwan, China, American Samoa, Cook Islands, Fiji, French Polynesia, Guam, Kiribati, Marshall Islands, Micronesia, Nauru, New Caledonia, Niue, Palau, Papua New Guinea, Samoa, Solomon Islands, Tokelau, Tonga, Tuvalu, Vanuatu, Wallis and Futuna Islands.
both promote optimum use of fertilizers (which reduces per unit consumption) as well as reduce the fuel-intensity of agriculture by transitioning to lower-carbon approaches and green-energy sources in both agriculture production and distribution.
15 20 25 30 The short-term responses to recent food crises run against a longer term trend in normal times to support production, and have involved a mix of protective trade measures and provision of subsides as well as social protection support. figure 52 shows that the number of export restrictions and market interventions increased in the region during the current crisis. The protective trade measures can, however, amplify price fluctuations. Globally, measures to protect domestic markets and consumers introduced during the 2010–11 food price spike are estimated to have accounted for 40 percent and 25 percent of the increase in the world price of wheat, and maize, respectively.
A. Wheat B. Maize
10
10
8
8
6
4
2
0
US$, billions –2
2000 2002 2004 2006 2008 2010 2012 2014 2016 2018 2020
China EAP excluding China
C. Meats and edible offal
50
40
US$, billions
30
20
10
0
–10
2000 2002 2004 2006 2008 2010 2012 2014 2016 2018 2020
China EAP excluding China
Source: World Bank estimates using data from World Integrated Trade Solution (WITS) Note: Figure shows net imports of selected commodities
6
US$, billions
4
2
0
US$, billions –2
2000 2002 2004 2006 2008 2010 2012 2014 2016 2018 2020
China EAP excluding China
D. Soybean
50
40
30
20
10
0
–10
2000 2001 2002 2003 2004 2005 2006 2007 2008 2009 2010 2011 2012 2013 2014 2015 2016 2017 2018 2019 2020
China EAP excluding China
More importantly, many aspects of current agricultural policies and public expenditures do not support necessary transformations for greater food security and resilience. To begin with, an average 37 percent of budget support to agriculture is spent on direct subsidies11. Direct subsidies, for which consumers pay, serve to lower the cost of “private inputs” (fertilizer, seeds, power, other), and these often entrench food production patterns that do not support diversification to meet changing demand patterns. These patterns can also have high (hidden) costs in terms of greenhouse gas (GHG) emissions, land degradation and environmental pollution. in a context of constrained fiscal space, they also represent a lost opportunity for public investments in knowledge and innovation, which are critical to develop technologies that increase agricultural productivity, sustainability, and resilience. These investments receive a limited 8 percent of budget support (figure 53).
10 figures in UsD billion. EAP countries in this analysis include Cambodia, China, indonesia, Lao PDR, Malaysia, Mongolia, Myanmar, Philippines, Thailand, and Vietnam. Products are classified in the harmonized system (Hs) 1996. Wheat includes wheat and meslin (Hs 1001) under Hs chapter 10 (cereals). Maize includes maize (Hs 1005) under Hs chapter 10 (cereals). Meats include all products at Hs 4-digit level under the Hs chapter 2 (meats and edible offal) – from Hs 0201 to Hs 0210. soybean includes soybean (Hs 1201) under chapter 12 (oil seeds and oleaginous fruits; etc.).
11 for China, indonesia, Philippines and Vietnam, the four largest economies in the EAP region, excluding Thailand.
Figure 49. import dependency: EAP region still relies on imports of meats, wheat, maize, and soybean10Market price support (MPS) in agriculture, for which tax payers pay and which significantly distorts production, consumption and resource allocation decisions, currently dwarfs budget transfers. MPS, or support through price fixation and trade barriers, is 1.5 to 4 times higher than transfers ( f igure 54) 12. MPS and producer subsidies represent a policy transfer from consumers to producers, as they increase the retail price of domestically produced foods. i n the EAP, the Total s upport Estimates (T s E) are some of the highest in the world (Figure 55), and with 75% of the population employed outside agriculture (Source: World Development Indicators, 2022), this is a significant issue for food security. Further, MPS and subsidies are heavily biased towards production of livestock and grains, especially rice ( f igure 56). Currently, these measures support production systems in rice and livestock
Figure 50. Asia region is particularly vulnerable to natural disasters
Number of events
200
150
100
50
0
1970 1973 1976 1979 1982 1985 1988 1991 1994 1997 2000 2003 2006 2009 2012 2015 2018 2021
Hydrological Geophysical Climate- & Weather-related
Source: World Bank estimates using EM-DAT data.
Note: Biological disasters excluded. EM-DAT refers to Emergency Events Database launched by the Centre for Research on the Epidemiology of Diasters (CRED), within the Université Catholique de Louvain (UCLouvain).
Figure 51. Energy crunch has ratcheted up fertilizer prices, raising concerns for the future
A. World Bank Fertilizer Price Index
Index
B. Grain and fertilizer nominal prices
300
250
200
150
100
50
0
300 Nov-20 Jan-21 Mar-21 May-21 Jul-21 Sep-21 Nov-21 Jan-22 Mar-22 May-22 Jul-22
Source: World Bank (2022b). WB estimates using data from World Bank Commodity Price Data
250
200
150
100
50
Grains
Fertilizer
2008 food price crisis 2011 food price crisis
Russian invasion China starts fertilizer export restrictionsIndex 2000 2002 2004 2006 2008 2010 2012 2014 2016 2018 2020 2022
0
that have the strongest GHG emissions in agriculture. Repurposing this support for green innovation (for instance, improved breeds and rice farming technologies) could lead to both a productivity increase and a GHG emission decrease. There is also huge scope to repurpose this support towards diversification into horticulture (fruits and vegetables) which can have positive nutrition effects and increase farm incomes.
Energy policy must find a balance between the triple goals of affordability, security, and sustainability. The war in Ukraine has increased energy prices worldwide. The increase is hurting consumers, because energy for cooling, heating and transport is important for human welfare, as well as hurting producers, because energy makes an outsized contribution to
12 Vietnam excluded. Market Price Support is negative in Vietnam. While import-competing commodities, such as beef or sugar, are incentivized through import tariffs, producers of export commodities such as coffee, cashew, rubber, and tea are receiving prices below their export reference price. Rice received a positive MPS until 2014 and became implicitly taxed from 2015 due to export restrictions, that have been gradually lifted from 2018 (oECD, 2022).
0
Jan-20 Feb-20 Mar-20 Apr-20 May-20 Jun-20 Jul-20 Aug-20 Sep-20 Oct-20 Nov-20 Dec-20 Jan-21 Feb-21 Mar-21 Apr-21 May-21 Jun-21 Jul-21 Aug-21 Sep-21 Oct-21 Nov-21 Dec-21 Jan-22 Feb-22 Mar-22 Apr-22 May-22
Source: World Bank estimates using data from Global Trade Alert
Note: Figure shows restrictive policy announcements in EAP related to only food, fertilizer, and feed. Export restrictions include the export ban, export licensing requirement, export quota, export tariff quota, export tax, export-related non-tariff measures, tax or social insurance relief, and local supply requirements for exports. subsidies includes capital injection and equity stakes (including bailouts), financial grants, in-kind grants, interest payment subsidies, loan guarantees, localization incentives, price stabilization, production subsidy, state aid, state loan, and tax or social insurance relief.
Figure 53. Between 40–70 percent of budget support to agriculture went to direct subsidies and irrigation
100
80
Percent
60
40
20
0
China Indonesia Philippines Vietnam
Other Agricultural knowledge and innovation system Hydrological infrastructure Production support subsidies
Source: World Bank estimates from oECD (2022).
Note: Figure shows explicit (budgetary) support to agriculture, 2010–2020 average13
Figure 54. Public policy support through price fixation and trade barriers is at least twice as much as through transfers
100
80
60
40
Percent
20
0
–20
–40
–60
China Indonesia Philippines Vietnam
Market price support Transfers
Source: World Bank estimates from oECD (2022).
Note: figure shows Explicit (budgetary) and implicit (market price support) to agriculture, 2010–2020 average
13 The oECD measures two types of support to agriculture: through policy measures that drive up (or down) farm-gate prices and through budget transfers. farm-gate price distortions are computed by calculating the difference between observed farm-gate prices and a reference farm-gate price free of the effect of policy distortions. This reference farm-gate price is calculated by adjusting the Cif (net imports) or foB (net exports) border price for domestic marketing costs, quality, and quantity differences, thereby reflecting the farm-gate price that would prevail in the absence of trade barriers and price administering policies. The price gap between observed and reference prices is calculated for each commodity, then multiplied by the volume of production and aggregated to calculate the Market Price support. This support is sometimes referred to by the oECD as “implicit support” as it is not provided through budget transfers. Budget transfers include producer subsidies (input and output subsidies), general service support estimates (e.g. research, extension, irrigation) and consumer transfers (e.g., food aid). They are sometimes referred to by the oECD as “explicit support. for more details on the methodology, one may refer to the oECD-PsE manual.
Figure 52. Protective trade and policy measures have increased in the recent crisis
Source: World Bank estimates from oECD (2022).
production in all sectors of the economy. The war and the resulting sanctions have also threatened the security of energy supplies, because of the increased likelihood of disruptions in energy production and trade. Higher fuel prices are affecting greenhouse gas emissions because of the impact on energy demand and supply: higher energy prices reduce energy consumption, although shortterm energy demand responses are typically low, but may also spur further investments to boost fossil fuel supply. The longer-term impacts depend on the policy response to high energy prices ( f igure 57).
Indonesia Philippines Turkey China Korea, Rep. Japan Russia
EU USA Brazil Vietnam South Africa
Figure 56. Market Price Support (MPS) and subsidies heavily biased towards production of livestock and grains, especially rice
Vietnam
Philippines
Indonesia
China
–5 Percent of GDP
5 15 25 35 45
Billion USD
Other Cash crop Oilseeds Livestock Grains Fruits and vegetables
Source: World Bank estimates from oECD (2022). Note: Figure shows producer support to single commodities (budget and MPS), 2010–2020 average
Governments are trying to ease the economic burden of higher energy prices in different ways. Some, notably in Indonesia, Malaysia, and Thailand, are keeping prices low by subsidizing the cost of energy. Others, for example in the Philippines, are letting prices rise but providing targeted support to low-income households. Energy price regulation through subsidies is often easier to implement than making direct transfers to the vulnerable, and offers some temporary relief to consumers and producers, but has three problems: the benefits accrue to all users, rich and poor; the burden on public finances is greater; and the incentive to cut energy consumption is weaker.
The introduction of energy subsidies to protect consumers and producers, while helpful, could have substantial long-term costs. If high energy prices persist, governments will remain under pressure to maintain energy subsidies. These measures can place a substantial burden on public finances; for example in August 2022 Thailand’s state oil fund, which aims to stabilize domestic prices, was reported to be more than $3 billion in deficit14. The subsidies will entail a welfare cost by distorting patterns of consumption by encouraging use of fossil fuels beyond their international market prices.
14 https://www.channelnewsasia.com/business/thailand-readies-4-billion-loan-guarantee-oil-fund-2884141
Figure 55. Policy support for agriculture, as a share of GDP, is among the highest in the world in Indonesia, Philippines and China


The crisis measures to keep prices low run counter to the efforts in major EAP countries in the last few years to reduce fuel subsidies. Previous energy subsidies have left some countries in the region exposed to current high fuel prices; further subsidies could exacerbate the problem. Subsidies undermine the natural price signal to reduce energy consumption and increase the risk of exposure to future energy price shocks and/or supply limitations. Existing subsidies in the region have led not only to higher volumes of energy imports, but also to energy consumers that rely on low prices for their business models and domestic needs. Further subsidies could therefore leave the region exposed to future energy crises.
Energy subsidies will also undermine efforts to reduce emissions and global cooperation to meet agreed upon climate goals. Many countries in the EAP region are currently exploring options for pricing carbon to meet their international commitments on reducing emissions. Energy subsidies effectively act as a negative carbon price and will make it more difficult to achieve climate targets. Even in the short term, energy price subsidies could deter investment in low-carbon equipment, if investors perceive that energy prices will remain artificially low in the future. Status quo supply response: Increasing fossil fuel production
Higher fuel prices could encourage new investment in fossil fuel assets, which would have limited impact on longterm energy security and could either lock countries into a high carbon future or become stranded assets. If higher fuel prices are perceived to persist, they could incentivize investment in new domestic supplies of fossil fuels. The marginal effect of these investments is likely to have only a limited impact on long-term energy security. Furthermore, energy infrastructure investments are typically long lived and may last beyond the target dates set for net-zero emissions in some countries. The sunk costs of these investments could therefore lead to one of two outcomes: if operating costs remain below the costs of renewable energy they could lock energy systems into a higher carbon future that is not compatible with stated emission targets; alternatively, if renewable costs fall sufficiently far, these investments could become stranded assets, leaving behind debts that cannot be repaid and creating additional liabilities (for example, compensation for investors, workers, and communities).
Short term choices Status quo Energy demand falls less Demand Energy security risks unchanged Smaller reduction in emissions Longer term outcomes Increased investment in fossil fuels Emissions rise Risk of lock-in or stranded assets Supply Alternative Demand Energy demand falls Higher consumer energy prices Consumer switch to renewables Emissions fall further Energy security risks reduced further Income support Investment support Investment in fossil fuels as a stop gap; investment in renewables Supply Emissions fall Energy security risks reduced Figure 57. Implications of high energy prices depend on the measures to shield consumers Note: World Bank elaborationIn the absence of energy price subsidies, sustained higher energy prices will continue to negatively impact household welfare, but could improve energy security and sustainability. Higher prices for energy will reduce demand levels, with negative impacts on economic production and welfare. Sustained high fossil fuel prices will also encourage fuel switching to renewables (in the power sector from newly installed renewable wind and solar power15) or electric vehicles (in the transport sector). Over the past decade, the cost of generating electricity from wind and solar power has fallen by up to 90 percent (figure 58). Higher fossil fuel prices have likely further boosted the competitiveness of renewable technologies. Such a shift would reduce emissions and the risk of future disruption in imports of fossil fuels, thus helping to insulate countries in the region against future price shocks. However, other factors will matter for the transition to cleaner energy.
Figure 58. Energy cost increases could make green technologies more economically viable
0.4
USD/kWh
0.3
0.2
0.1
Fossil fuel costs range
0
2010
2012
2019 2020
Solar photovoltaic Onshore wind Offshore wind Concentrating solar power
Source: iREnA Renewable Cost Database. Note: Global weighted average levelized cost of energy, adopting real WACC of 7.5 percent for oECD and China, and 10 percent for the rest of the world. The shaded band represents the fossil fuel-fired power generation cost range.
Expectations of future energy prices are important in determining uptake of renewables. However, with a lifetime of 25 years it is expectations of future fuel costs rather than current costs that are important in determining investment, so the effect of higher fuel prices now may be limited if they are perceived to be only temporary.
Tighter access to finance may inhibit the transition to renewables even with persistently higher-cost fossil fuels. if inflation leads to higher interest rates, capital-intensive renewables will face the largest cost increases. Achieving high penetration rates of renewable energy in the power system is highly capital intensive (due to associated investments that are needed to overcome variability) and requires external support to increase both the volume and the affordability of financing. The combination of a slowing global economy and the lasting effects of the CoViD-19 pandemic on public and private debt levels also means that it may be difficult for companies to secure the necessary financing for renewables, even if they provide the cheapest means to generate electricity.
Higher prices for other minerals used in renewable production will also limit competitiveness gains. The International Energy Agency reports that copper, lithium, nickel, cobalt and rare earth elements are essential components of renewable energy technologies16. Both the war in Ukraine and the COVID-19 pandemic have disrupted supply chains of these minerals and increased costs for renewable energy. Having higher material costs has a much bigger impact on the cost of renewables than it does for fossil-fuel based power generation.
If natural gas prices increase more than coal prices, or if countries are endowed with coal and must rely on less-reliable imports of gas, the result could be the increased consumption of coal. Although coal prices have also increased in
15 New nuclear plants would also provide an alternative source of power, but would take much longer to build.
16 https://www.iea.org/topics/critical-minerals
2022, they have done so less than prices for gas. A significant share of the natural gas consumed in EAP countries is used for electricity generation. In the absence of near-term clean energy response alternatives, such as renewables plus batteries deployed at-scale, the electricity could instead be generated from existing coal-fired power plants with spare capacity. Given the price volatility, the role of natural gas in the power systems must be carefully assessed based on country-specific circumstances. Gas-fired power plants may be necessary for overcoming the intermittency of renewable energy, but higher gas prices may increase the total costs of a system with more renewables. Sustained high gas prices may accelerate the ‘tipping point’ where cleaner alternatives, such as batteries, are more cost-effective.
Financial institutions, households, firms, and the government are connected through numerous mutually reinforcing channels. Each segment is affected by the increase in inflation and interest rates. Elevated risks in one segment can easily spill over and destabilize other segments and the wider economy more broadly if not properly addressed.
Tighter monetary stances in global markets and, increasingly, in local markets in EAP countries, translate into higher funding costs for corporate borrowers. indeed, borrowing costs for EMDE corporates in international bond markets have risen significantly during 2022, in some cases to above pre-pandemic levels (figure 59). Moreover, issuance activity by riskier borrowers has declined significantly during 2022. for example, the share of high-yield EMDE bond issuers in global markets declined from an average of 30 percent of all corporate EMDE issuances in 2021 to less than 10 percent since May 2022. These trends suggest that some corporate borrowers may have been priced out of the market, which might lead to higher rollover risks for some borrowers, especially non-investment grade ones.
Figure 59. Borrowing costs of non-financial corporates have been on the rise
A. Corporate EMBIs investment grade yield to maturity
B. Corporate EMBIs high yield yield to maturity
Morgan
Europe


Higher funding costs could translate into increased corporate vulnerabilities. Higher interest rates affect the capacity of different borrowers to service their debts, even as higher inflation may reduce the real value of outstanding debt. Tighter financial conditions can thus interact with and increase existing pandemic-induced corporate vulnerabilities. for instance, profitability has deteriorated for EAP nonfinancial corporates since the start of the pandemic crisis, and some countries face solvency and liquidity risks (table 2). furthermore, in many countries in the region, policymakers have started or are about to start to wind down the financial support for corporate borrowers enacted during the pandemic crisis. The combination of tighter financial market conditions and the withdrawal of crisis support measures could imply increased vulnerabilities for EAP firms, and might trigger an increase in non-performing loans (nPLs) which are still formally low. The result could be corporate debt distress, which is so far concentrated in the real estate sector in China. Out of the 123 corporate bonds from EAP firms trading at distress levels, almost 92 percent are bonds from Chinese companies and 85 percent of these companies are in the real estate sector.
Rollover risks for corporates seem to vary across countries in the region. The volume of bonds and syndicated loans coming due for non-financial corporations between 2022 and 2023 is sizeable for many EAP countries. for instance, corporates in Malaysia have the equivalent of roughly 8 percent of GDP in debt coming due between 2022 and 2023, in Thailand the ratio is about 6 percent of GDP, and in indonesia almost 5 percent of GDP (figure 60). in addition, the profile of non-financial corporate debt coming due between 2022 and 2023 varies significantly across countries. firms in Indonesia, the Philippines, and Vietnam have a greater share of maturing debt in the form of syndicated loans than in bonds, and at least 60 percent of the debt coming due is denominated in foreign currency, making the firms particularly vulnerable to exchange rate depreciations.17 in contrast, firms in Malaysia and Thailand have a greater share of maturing debt in bond markets, and the bulk of the debt is denominated in local currency.
At this stage, banks seem equipped to deal with corporate financial difficulties but must remain alert to threats to financial stability. The banking sector is well capitalized and has solid buffers in most countries in the region. NPLs have increased but remain at pre-pandemic crisis levels for most countries – although the true level will only become apparent
Figure 60. A sizable fraction of non-financial corporate debt needs to be rolled over, under tighter funding conditions
20 25 A. Nonfinancial corporate debt: maturity profile
US$, billions
15
10
5
0
Indonesia Malaysia Philippines Thailand Vietnam
Bonds 2022 Bonds 2023
Loans 2022 Loans 2023
B. Sovereign bonds: maturity profile
US$, billions
Source: IIF
30
25
20
15
10
5
0
35 2022 2023
Indonesia Malaysia Philippines Thailand Vietnam
when regulatory forbearance has been phased out (box 6). sharply rising nPLs could give rise to a negative feedback loop between deteriorating financial sector performance and weakening real economic activity. The sizeable debt coming due could result in turbulence if global financial conditions were to deteriorate significantly. Distress in debt markets pose risks not only to banks, but also to non-bank financial intermediaries exposed to vulnerable firms, including capital market participants.
Persistence of regulatory forbearance can lead to a misallocation of resources. Delayed resolution of distressed loans may generate unnecessary losses and channel resources to help keep “zombie” firms alive—that is, allocate funding to weak businesses that have little or no prospect of returning to health and fully pay off their debts. This means diverting resources from viable firms, with higher productivity and growth potential, thus ultimately hindering economic activity. In addition, the lack of transparency as to the extent of the build-up of corporate risks in banks’ balance sheets can weaken trust in the financial sector, potentially hindering financial intermediation in the medium term. The Chinese real estate sector is an example of pre-existing difficulties’ being accentuated by the current financial tightening (Figure 61).
When financial institutions, as a consequence of pandemic-induced regulatory forbearance or debt moratoria, continue to support zombie borrowers, the availability of finance is reduced for more productive firms, resulting in lower investment and employment growth. At the same time, debt strains on the government can induce it to seek privileged access to domestic savings through measures that also crowd out productive private investment and hurt growth. in China, for example, some evidence suggests that state owned enterprises (soEs) tend to be less productive and have a lower return on assets than private enterprises (Jurzyk and Ruane, 2021), but benefit from more favorable interest rates and attract a much larger share of net funding (figure 62).
A stronger post-pandemic bank-sovereign nexus translates into more challenging credit conditions for the private sector. The interlinkages between emerging market sovereigns and domestic financial systems, especially banks, have
Available data shows some initial signs of deterioration in asset quality in the Pacific Island countries (PICs). During the first quarter of 2020, shortly after the initial global outbreak of Covid-19, the nPL ratio increased in six out of nine countries (figure B6.1). six PiCs experienced further increases in the nPL ratio following the first quarter of 2020 until the fourth quarter of 2021, with the nPL ratio ranging from a minimum of about 1 percent to a maximum of 17 percent of banking loans.
But buffers remain relatively high. Although the average profitability of the banking sector has dropped since the outset of the pandemic in all but one of the PICs, bank capital adequacy has remained strong, exceeding the minimum regulatory ratios by a large margin, and the share of liquid assets to total assets in banking systems has increased since the outbreak of the pandemic in all PICs for which data are available.
However, it is too early to observe the full impact of the pandemic crisis as relief measures remain in place. That is, measures such as loan forbearance might be masking the true extent of financial sector vulnerabilities. Some of the PICs are amongst the most remote and isolated countries in the world, which explains why they many PICs remained Covid free for a long time. In early 2022, Tonga, the Solomon Islands, and Samoa have all experienced their first big Covid outbreaks. in response, public health restrictions have been imposed and some supervisory authorities have introduced or re-introduced Covid-19 relief measures in 2021 and early 2022. In general, repayment holidays and debt service moratoria have been widely adopted across the PICs. Moreover, contrary to international good practice recommendations, classification and provisioning rules have been suspended or modified in some of the PiCs. Hence, the data on the PiCs’ financial sectors might not yet fully reflect the risks to bank profitability and asset quality, which could materialize over 2022/23.
Figure B6.1. Non-performing Loans to Total Loans before and after the outbreak of Covid-19
Percent
8
4
0
–4
–8
12 Jul-18 Nov-18 Mar-19 Jul-19 Nov-19 Mar-20 Jul-20 Nov-20 Mar-21 Jul-21 Nov-21 Mar-22 Jul-22
Real estate climate index New residential housing price
Sources: Bank for international settlements; Bloomberg; Consensus Economics; Haver Analytics; World Bank.
Index / US$
100
80
60
40
20
0
120 Sep-21 Oct-21 Nov-21 Dec-21 Jan-22 Mar-22 Apr-22 May-22 Jul-22 Aug-22
China Property Bond Index Evergrande 2024 Country Garden 2024
Note: A. Figure shows annual percentage changes. The climate index measures the aggregate business activity in land sales and real estate
arguably intensified over the past two pandemic years in some countries in the EAP region as additional government financing needed to cushion the impact of the pandemic was met to a large extent by central banks and commercial banks. This was the case in Indonesia, where foreign participation in local currency government bond markets declined from almost 40 percent in 2019 to less than 20 percent by the first quarter of 2022, and in Thailand, where foreign holdings declined from an average of 18 percent to about 14.4 percent. This stronger nexus for policymakers in the region indicates that transmission of financial risks to and from the sovereign and the financial sector might intensify, with the potential for strong adverse feedback loops between sovereigns and financial intermediaries.
Figure 62. China’s state-owned enterprises are less productive than privately owned enterprises, but get credit at much better terms and a much larger share of net funding
B. Credit spread (bp)
Source:
deviations from the sector-year average.
C. Net financing (RMB trillion, 6mma)
pooled data from
shows net
Figure 63. Sovereign borrowing cost have seen increases in the EAP region as well
Yields on the GBI-EM Global Diversified Indexes
Jan-20
Europe Latin America Middle East and Africa Asia (RHS)
Source: JP Morgan
On the one hand, distress in sovereign debt markets could lead to increased vulnerabilities for financial intermediaries. A worsening sovereign debt outlook due to higher global rates and exchange rate depreciations could lead to higher sovereign funding costs and threaten sovereign debt sustainability. The unprecedented policy support measures deployed during the pandemic have led to record levels of public debt. Rising global rates and potentially lower fiscal revenues could thus put additional strains on countries’ fiscal accounts. Moreover, some countries in the EAP region have large amounts of sovereign bonds coming due between 2022 and 2023, the bulk of which are denominated in local currency. For example, Malaysia, the Philippines, and Thailand have $43 billion, $41 billion, and $39 billion in debt maturing by the end of 2023, respectively. Sovereign yields in local markets have risen since the onset of the war in Ukraine, but the increases in yields in EAP countries is small in comparison with EMDEs in other regions (figure 63).18 Distress in sovereign debt markets can then adversely affect banks’ balance sheets due to potential mark-to-market losses on sovereign debt holdings. Even though a sizeable share of the sovereign debt for EAP is mark-to-market, banks’ exposure to sovereign debt also remains relatively small for the larger countries in the EAP region (figure 64).
Figure 64. The linkage between banks and sovereign warrants close monitoring
A. Banks’ exposure to sovereign debt
B. Share of mark-to-market sovereign bonds, 2020
Ratio
On the other hand, exposures to sovereign debt by domestic financial intermediaries can actually increase when financial risks and uncertainty are on the rise. one potential channel is through flight to safety effects. financial risks are arguably on the rise for both sovereigns and the corporate sector. Risk averse financial intermediaries, including banks, may thus prefer to increase their exposure to safer, more liquid sovereign debt rather than to corporate debt. In addition, the regulatory treatment of sovereign exposures—which typically allows banks to apply zero risk weights on local currency domestic government bonds—also makes them attractive for banks to hold. Government bond holdings in banks’ balance sheets often serve as collateral for securing funding from the central bank, which may be an important factor for banks during periods of heightened uncertainty and financial market turbulence.
Another channel is through moral suasion or even direct intervention in the financial sector, commonly referred to as “financial repression.” Rising interest rates may induce governments to intervene in financial markets to capture resources at lower costs and/or longer maturities, possibly crowding out financing to the private sector. Financial repression can take several forms, including but not limited to directed lending to the government by captive domestic financial institutions (such as banks and pension funds), explicit or implicit caps on interest rates, regulation of cross-border capital flows, and placement of unmarketable government debt, “excessive” bank reserve and liquidity requirements, among others.
Some of the policy measures adopted in many EAP countries in response to the pandemic crisis share some characteristics of financial repression. For example, many countries in the region increased central bank holdings of government debt, imposed interest rate controls, adopted reserve requirements and other macroprudential regulations, and facilitated bank asset holdings toward government debt, all of which can be interpreted as signs of financial repression. While some of these measures and trends may turn out to be temporary, others may become permanent. In addition, in some countries, state-owned banks have been the major buyers of government debt (figure 65). The challenging environment for public debt sustainability can create incentives for policymakers in the region to tightly regulate domestic financial markets. However, the capacity of sovereign debt management through financial repression is limited because, in some countries, a sizable share of government debt is held by non-residents and, as discussed earlier, a large share of debt is in market instruments.
Figure 65. State-owned banks play a large role in the deepening of the bank-sovereign nexus during the pandemic
Percent
Source: GFSR April 2022
Overall, increased vulnerabilities for sovereign debt would likely be associated with more challenging conditions for credit provision to the private sector. A weaker financial position for banks due to distress in sovereign debt markets can constrain funding for the non-financial corporate sector, potentially hindering investments and economic recovery. Similarly, sovereigns with constrained access to global capital markets may increasingly depend on domestic funding, possibly crowding out the private sector, independent of the source of incentives for financial intermediaries to hold this debt. Riskier firms, such as micro, small and medium enterprises (MsMEs), could be particularly vulnerable to a credit tightening by banks. These effects can become sizeable in countries with a stronger sovereign-banking nexus, in countries where public debt levels are high, and countries where banking sector resilience is lower.
HUN TUR POL BRA CHL ZAF COL State-owned Private domestic Foreign subsidiaryRecent inflation, especially increases in food and fuel prices, is reducing the real purchasing power of all households in the region although the effects vary across the distribution depending on household consumption patterns and the extent to which prices for different goods and services have increased. Since poorer households tend to spend a larger share of their budgets on food, they are more vulnerable to food price increases (box 7). Conversely, richer households consume a larger share of non-food items and are thus more susceptible to non-food inflation. in developing EAP countries, food consumption shares range from 45 to 78 percent among households in the bottom quintile, compared to 27 to 51 percent for those in the top quintile (figure 66). in some countries, poor farmers are more likely to consume their self-produced crops and livestock (as in Lao PDR) and, thus, they may be less affected by increases in food prices; they may even benefit from higher prices if they lead to higher agricultural profits.
Analysis of the CPI by component and by household quintile illustrates how impacts of recent price increases differ within the EAP region and across the welfare distribution. Higher food, fuel and transportation costs are the main drivers for the recent inflation (figure 67A), while the magnitude of price increases significantly differs across the EAP countries, which is in part related to the varying government responses to the price hike. Taking into account quintile-specific consumption baskets, overall inflation experienced across the welfare distribution varies, though substantially only in a few of the countries analyzed (figure 67B). in indonesia, the bottom 20 percent experienced inflation that is 0.8 percentage points higher than the top 20 percent, as inflation is largely driven by food prices and utility and fuel prices have been contained. instead, Lao PDR’s richest quintile experiences inflation that is 2.6 percentage points higher than that of the poorest quintile, both because the poor rely largely on their own production of foodstuff and because the price of transport (which represents a significant share of the rich’s budget) rose the most. in other countries, differences in quintile-CPis are not large.
The welfare losses associated with higher inflation have been substantial in most countries. Based on the latest data on inflation (y-o-y)19, simulation analysis suggests that household purchasing power has declined substantially in all six countries studied – by 5.5 percent, on average – with considerable variation across countries (figure 68A). in Mongolia, welfare losses are around 11 percent, driven by more expensive food imports as well as rising transportation costs due to prolonged border frictions with China. in contrast, in Vietnam with relatively subdued food and energy inflation, household purchasing power losses are more limited (only 1.7 percent). in Lao PDR, household purchasing power losses are significantly greater among wealthier than poorer households, reflecting greater shares of purchased food and transportation among the wealthy. While the estimated impacts on poverty depend on the existing levels of poverty before simulated price increases, the analysis suggests that poverty could increase by 0.2 to 3.4 percentage points using the lower-middle-income poverty line ($3.65 per day, 2017PPP) and 0.9 to 8.3 percentage points using the upper-middle-income poverty line ($6.85 per day, 2017PPP) (figure 68BC). impacts on inequity measured by Gini coefficient appear to be limited, however, except in Lao PDR where larger losses in purchasing power among wealthier households have actually narrowed the income gap between the rich and the poor (figure 68D).
19 Simulations based on the latest available actual consumer price changes (yoy) by components (food, alcohol and tobacco, utility and energy, transportation and others), considering the household -specific consumption basket in the survey year. Therefore, both direct and indirect short-term effects of higher prices on welfare are considered. The simulation assumes that there are no price impacts on own-food consumption. Potential household income effects and changes in consumption behavior due to price increases are not modelled.Rising food prices can have positive income effects on households, particularly on households that are food producers. for these households, Deaton (1989) proposes that the first-order welfare effect of a price change of a food item is proportional to the difference between the production share of the food item and its consumption share in total household expenditures. This partial equilibrium approach has been widely used to simulate the welfare impact of food price shocks in developing countries (see, for example, World Bank, 2009; Anderson, Ivanic and Martin, 2014; and Ivanic, Martin and Zaman, 2012).
Yet over the medium-term, a general equilibrium framework suggests that the income effect of rising food prices could extend to a broader population. in particular, agricultural laborers are expected to benefit. An increase in food prices raises production incentives, generating a higher demand for factors including labor, which then raises agricultural wages. several studies find a positive relationship between rice prices and agricultural wages, with econometric estimates that suggest short-run wage elasticities between 0.25 and 0.69 and long-run elasticities between 0.47 and close to unity (Boyce and Ravallion (1991) and Palmer-Jones (1993) for Bangladesh; Lasco, Myers and Bernsten (2008) for the Philippines; and Headey (2016) for several developing countries). Furthermore, Jacoby (2016) considers broader labor market repercussions and finds a positive effect of rising crop prices on wages for manual labor in rural India, both within and outside agriculture.
However, there are also studies that do not find a relationship between food prices and agricultural wages. for instance, even though Rashid (2002) finds a positive relationship between rice prices and agricultural wages for Bangladesh for the period between 1950 and 1989, he finds no relationship for a later period (between 1977 to 1999). Hassan and kornher (2022) also fail to find a relationship between food prices and agricultural wages for Bangladesh. in both studies the authors argue that urban wages have become a more influential factor in the determination of agricultural wages in the long-run amid increasing urban-rural integration.
Growth in the EAP region is projected to decelerate from 7.2 percent in 2021 to 3.2 percent in 2022, which is about two percentage points slower than was expected in April 2022. The slowing growth is mostly due to China, where activity is projected to decelerate sharply to 2.8 percent in 2022, after the 8.1 percent rebound seen in 2021, owing to recurrent COVID-19 outbreaks, mobility restrictions, and real estate sector stress. Growth in the rest of the region is projected to rebound to 5.3 percent in 2022 from 2.6 percent in 2021, and up from 4.8 percent projected in April 2022 (table 3). This improvement reflects a recovery in domestic demand thanks to the relaxation of CoViD-19 related restrictions as well as support from the strong goods export growth at the start of the year and the services export rebound expected in the latter part of 2022.
The forecast assumes continued fiscal and monetary policy support in China but recognizes that its effectiveness will be limited by lingering COVID-19 outbreaks and mobility restrictions. Nevertheless, the severe Covid-19 related economic shock seen in China in the first half of 2022 is likely to be followed by a gradual bounce back in the second half of the year. At the same time, the ability of the real estate sector to bounce back is subject to downside risks. A sharper, more severe, and more prolonged downturn in the real estate sector could have significant economy-wide reverberations, with negative feedback loops linked to the financial sector. in the rest of the region, the outlook assumes a gradual fiscal and monetary policy tightening.
According to the IMF’s updated forecast, global growth and international trade are projected to be significantly lower than expected in April 2022. Global inflation has been revised up due to food and energy prices as well as lingering supply-demand imbalances. financial conditions are also expected to be significantly tighter and more volatile than expected earlier. Global commodity prices are expected to decline from their current highs but will remain significantly higher than before the war in Ukraine because of disruptions in production and trade, geopolitical tensions, and lingering sanctions.
Export dependent economies like Cambodia, Malaysia, and Vietnam are particularly vulnerable to slowing global demand. In contrast, a relaxation of border closures and the related recovery in tourism activity is expected to boost growth in the Philippines, Malaysia, Thailand, and several tourism-dependent Pacific island countries, especially fiji. Countries with large external financing needs, either in the form of short-term capital (Cambodia, indonesia, and Malaysia), or because of high overall debt (Lao PDR and Mongolia), are more vulnerable to the tightening of global financing conditions than are their peers.
Country-specific circumstances will continue to weigh on growth. Price pressures remain elevated, the external position is worsening, and instability and policy uncertainty persist in Myanmar. This will prevent a strong recovery, following the estimated 18 percent contraction in fY2021. The prolonged border frictions and supply bottlenecks continue to limit growth in Mongolia despite some rebound in domestic activity following a relaxation of Covid-19 restrictions. Growth in the solomon islands is expected to shrink by 4.5 percent in 2022, reflecting the negative impact of recent civil unrest and widespread community transmission of the coronavirus. Investments to replace damaged productive capacity caused by the riots are unlikely to gain pace until later in the year. A volcanic eruption and subsequent tsunami in early 2022 have damaged economic prospects in Tonga.
EAP annual median headline inflation is now expected to surpass 5 percent in 2022 as opposed to the 3 percent expected in April 2022. This implies that inflation will overshoot the upper band of the inflation target in several EAP economies. Higher food and fuel prices represent a significant risk to the upward-revised inflation outlook. in addition, capital outflows triggered by faster-than-expected monetary policy tightening in the United States could put pressure on
Table 3.
2020 2021
April 2022 October 2022 forecast forecast for 2022 2022 2023
East Asia & Pacific 1.2 7.2 5.0 3.2 4.6
East Asia & Pacific (excluding China) −3.6 2.6 4.8 5.3 5.0
ASEAN-5 −3.8 3.4 4.9 5.4 5.1
Pacific Island Countries −9.5 −3.3 2.9 5.3 5.7
China 2.2 8.1 5.0 2.8 4.5
Indonesia −2.1 3.7 5.1 5.1 5.1
Malaysia −5.5 3.1 5.5 6.4 4.2
Philippines −9.5 5.7 5.7 6.5 5.8 Thailand −6.2 1.5 2.9 3.1 4.1
Vietnam 2.9 2.6 5.3 7.2 6.7 Cambodia −3.1 3.0 4.5 4.8 5.2 Lao PDR 0.5 2.5 3.8 2.5 3.8
Mongolia −4.4 1.6 2.5 2.4 5.5
Myanmar 3.2 −18.0 1.0 3.0
Papua New Guinea −3.5 1.0 4.0 4.0 4.2 Timor-Leste −8.6 1.5 2.4 3.0 3.0
Palau −9.7 −17.1 7.2 6.0 18.2
Fiji −17.2 −4.1 6.3 12.6 7.8 Solomon Isl. −3.4 −0.2 −2.9 −4.5 2.6
Tuvalu −4.9 0.3 3.5 3.0 3.5
Marshall Isl. −2.2 −2.5 3.0 1.5 2.2 Vanuatu −5.4 0.5 2.0 2.2 3.4 Kiribati −0.5 1.5 1.8 1.5 2.3
Tonga 0.5 −2.7 −1.6 −1.6 3.3 Samoa −3.1 −7.1 −0.3 −5.0 2.0
Micronesia −1.8 −3.2 0.4 −0.5 3.0
Nauru 0.7 1.5 0.9 0.9 1.9
Source: World Bank; World Bank estimates and projections. Notes: Percent growth of GDP at market prices. Values for 2021 for the small island economies refer to GDP growth estimates. AsEAn-5 comprises indonesia, Thailand, the Philippines, Malaysia, and Vietnam. Values for Timor-Leste represent non-oil GDP. for the following countries, values correspond to the fiscal year: federal states of Micronesia, Palau, and Republic of the Marshall islands (october 1–september 30); nauru, samoa, and Tonga (July 1–June 30). Myanmar growth rates refer to the fiscal year from october to september.
regional currencies, and passthrough into higher inflation, especially in countries that rely on short-term capital inflows (for example, Mongolia, Malaysia and to some extent Indonesia).
The outlook is subject to multiple downside risks, including sharper-than-expected monetary tightening, financial stress, and slowdown in China, and worsening war in Ukraine. If global real interest rates evolve in line with market expectations, they will remain below their pre-pandemic average. However, persistent global inflation may lead major central banks to undertake more policy tightening than currently anticipated to contain price pressures. This would cause even sharper-than-expected slowdown in global growth and trigger significant capital outflows from the EMDEs. Tighter global financial conditions could also induce debt distress in highly indebted EAP countries.
Historically, financial crises are more likely when the U.S. Federal Reserve implements aggressive tightening and when global confidence is weak. These episodes have been followed by increased financial market volatility in EMDEs, including currency depreciation, wider bond spreads, portfolio outflows, equity price adjustments, and liquidity shortages. Renewed COVID-19 outbreaks and public health restrictions as well as a further escalation of the property sector crisis might further suppress Chinese growth and disrupt value chains. Finally, worsening war in Ukraine or trade disruptions could lead to shortages and higher prices for food, fertilizer, and energy. Geopolitical fragmentation could also impede global trade and investment and weigh on global and regional growth.
Previous updates have focused on a number of other policy issues, including: (1) vaccination to contain COVID-19; (2) fiscal policy for relief, recovery, and growth; (3) climate policy to build back better; (4) smart containment of COVID-19, especially through non-pharmaceutical interventions like testing-tracing-isolation; (5) smart schooling to prevent long-term losses of human capital, especially for the poor; (6) social protection to help households smooth consumption and workers reintegrate as countries recover; (7) support for firms to prevent bankruptcies and unemployment, without unduly inhibiting the efficient reallocation of workers and resources; (8) financial sector policies to support relief and recovery without undermining financial stability; (9) trade reform, especially of still-protected services sectors—finance, transport, communications—to enhance firm productivity, avert pressures to protect other sectors, and equip people to take advantage of the digital opportunities whose emergence the pandemic is accelerating; (10) creating opportunities for firms and ensuring inclusion to promote equitable growth; and (11) and policies that encourage technology diffusion and adoption.
The current macro policy choice faces a trade-off between tackling inflationary pressures and continuing support for economic recovery. While monetary policy remains generally supportive of the economic recovery in many EAP economies, policy rates have started to increase since the second quarter of 2022 in some economies and are expected to increase further in the near future (figure 69). The increase in interest rates in EMDEs in the EAP region however has been relatively small when compared to the increases seen in advanced economies, suggesting a gradual approach is being used by policymakers
Figure 69. In response, monetary policy rates have been or are expected to increase
A. Policy rate
B. Expected 3-month interest rate in 12 Months
Indonesia Malaysia Philippines Thailand
in the region. The nature of the price shock is crucial for determining the appropriate policy response. On the one hand, swift and strong monetary policy tightening in response to a temporary supply-side shock could stifle the economic recovery; on the other hand, underestimating the magnitude and duration of the shock by allowing persistently high inflation rates could hurt financial intermediation in the medium term and hence economic growth. Uncertainty about the precise nature of the shock warrants a data-driven approach, whereby policymakers closely monitor domestic and international data on price dynamics and economic performance to re-calibrate the policy response as needed.
An important policy question is whether inflationary pressures reflect a permanent or a temporary shock. For the most part, these pressures have been triggered by the war in Ukraine and have begun to ease for some commodities. Central to devising the appropriate response are the dynamics in labor markets and the extent to which nominal wages will adjust to increasing prices. An increase in labor costs that cannot be absorbed by firms (for example, through reductions in profit margins) could cause even higher inflation and risk triggering a wage-price spiral. Thus far, longterm inflation expectations seem to remain anchored in the region. Although inflation expectations for 2023 have also been revised steadily upward in recent months, the expected inflation rate for 2023 remains below that for 2022 for the major economies in the EAP region (figure 70). Given the current circumstances, measured and gradual policy tightening by the major EAP countries seems appropriate.
Figure 70. inflation expectation is increasing in major EAP economies this year and the next
A. Expectation of CPI inflation for 2022
7
Percent
6
5
4
3
2
1
0
Jan-21 Mar-21 May-21 Jul-21 Sep-21 Nov-21 Jan-22 Mar-22 May-22 Jul-22
China Indonesia Malaysia Philippines Thailand Vietnam
B. Expectation of CPI inflation for 2023
5
Percent
4
3
2
1
Jan-22 Feb-22 Mar-22 Apr-22 May-22 Jun-22 Jul-22 Aug-22
China Indonesia Malaysia Philippines Thailand Vietnam
Source:
Before the war in Ukraine, governments were beginning to cut expenditure even though output remained below potential. support to individuals and firms was waning. The focus was shifting from emphasizing relief (cash handouts to households in the informal and agricultural sectors) to measures that supported the economy, ranging from cashback for spending on goods and services and subsidy programs for domestic travel (Thailand) to improving connectivity infrastructure (China, Indonesia). This consolidation was happening even though output still remained below potential.
Economic slack is mostly concentrated in sectors such as transportation, accommodation and catering. other sectors, like information and communication technology, finance and agriculture are close to their productive capacity.
A sustained increase in producer prices, driven by high import prices could add further pressure to consumer prices. Several countries in the region announced price stabilizing measures on crucial food items such as rice, meat, and cooking oil in early 2022 to cap the increase in food prices. While helpful in containing price pressures in the short term, subsidies to limit price increases impose a significant fiscal cost. Commodity exporters indonesia and Malaysia benefited from fiscal windfalls that made the subsidies more affordable than they were in other countries like Thailand (table 4).
Table 4. fiscal cost of price subsidies exceed fiscal windfall in large economies
Market intervention
Fiscal intervention (percent of GDP)
Price control Trade restriction Food subsidy Agriculture/ fertilizer subsidy Fuel subsidy other transfers*
Total Cost (percent of GDP)
Fiscal windfall (percent of GDP)
Malaysia Chicken etc. Poultry export ban 0.1 0.8 1.4 0.2 2.50 1.23
Thailand Food, construction material etc. 0.39 0.56 0.27 1.22
Indonesia Cooking oil Temporary export ban of palm oil 0.04 1.10 1.14 0.94
Philippines 0.12 0.02 0.21 0.35 0.41
Vietnam 0.30 0.30 0.38
China Coal Coal tariff elimination, Fertilizer export restrictions
* include cash transfers to low-income households, tourism sector and social security contribution cut
Source: World Bank
0.02 0.02
The new shocks will sharpen fiscal policy trade-offs. EAP countries were already struggling to reconcile fiscal support, for relief, recovery, and growth, with shrinking fiscal space. The new shocks will create more needs for support and a further contraction in revenues. one risk is that fiscal support implemented by entities like local governments and stateowned enterprises could undermine their own financial viability. Another risk is lower investment in the infrastructure of trade, energy, and technology diffusion - which are needed to harness new growth opportunities by enhancing domestic capacity and international connectivity.
Three measures can help. First, more efficient social protection would protect the vulnerable and free fiscal space for other ends. EAP countries have shielded households from recent CoViD-related income shocks though a broad-based increase in social protection and from price shocks through a combination of price controls and subsidies (or tax cuts). Both types of measures may be the only form of assistance that is feasible in the short term, but neither is efficient or fiscally sustainable. Direct transfers to poor households and firms, once the relevant digital infrastructure is in place, would alleviate the pain from the cumulative shocks without distorting price signals or subsidizing the wealthy. Second, governments should reconcile spending needs with tightening budget constraints, by committing (a) to restoring fiscal discipline through the (re)introduction of fiscal rules (see below); and (b) to fiscal reform through enactment of legislation to be implemented conditional on objective measures of recovery. For example, new tax reform legislation in Indonesia is expected to raise revenue by 1.2 percent of GDP in the medium term.
Improved targeting of government assistance could ensure continued protection of those who need it most while conserving scarce government resources. To date, social assistance programs and price regulation have not been targeted
strictly to those who experienced pandemic-related income shocks. Growing pressure for fiscal consolidation has increased the need to spend scarce government resource more efficiently, however. several countries have already indicated that they will reduce their assistance budget in 2022, thus requiring better targeting of scarce public resources. Means-based assistance could deliver a twopercentage point larger reduction in the number of poor than could indiscriminate assistance (figure 71). More targeted measures that offer support to vulnerable households would be cheaper to governments; for example in Indonesia, the World Bank estimates that replacing explicit and implicit energy subsidies with targeted support for vulnerable groups would save the government 0.6 percent of GDP (World Bank 2022c). In Thailand, both fuel subsidies and cash transfers are mitigating the poverty impacts of price increases, but transfers are more cost effective (Box 8).
Figure 71. Better targeting could provide more “bang for buck” in terms of poverty reduction
Simulated poverty impacts of cash transfers using different targeting approaches, given a fixed budget
Percent
Targeting Households w/ Children Under 6 Universal Basic Income
Poverty Rate Poverty Gap
Source: Adapted from Grosh et al (2022).
Note: Simulations illustrate the poverty impacts of better targeting social assistance resources in a large middle-income country.
While interventions and administrative controls in the foreign exchange market observed in countries like Lao PDR, Mongolia and Myanmar may initially reduce external liquidity pressures, these measures entail the risks of ultimately being counterproductive, undermining adjustments to relative price changes and impairing efficient resource allocation. Given import dependence, large foreign debt obligations, concerns about the pass through to inflation and expectations that are anchored to the exchange rate, the reluctance to allow greater exchange rate flexibility is understandable. However, like other price controls exchange rate interventions can lead to misalignments and distort price signals that are important to ensure efficient allocation of resources. An overvalued exchange rate will dampen necessary external adjustments and expenditure switching (substitution of imported with domestically produced goods). Surrender requirements at below market rates effectively tax exporters, undermining export competitiveness. At the same time, scarcity of foreign exchange may prevent imports of critical commodities and lead to supply shortfalls. As evidenced by the emergence of parallel exchange rates, economic agents will also seek to evade requirements, leading to a wider parallel premium and ultimately passing through to inflation.
A stability-oriented monetary policy and exchange rate regime can be bolstered by central bank independence and transparency. A more independent central bank is in a more credible position to achieve monetary policy targets, even at the expense of other economic policy targets. More transparent central bank operations, strategy, and communications can safeguard the legitimacy of the central bank, enhance public understanding of and confidence in sound monetary policy, promote informed discussion among market participants and the broader public, and more effectively guide and stabilize inflation expectations.
To strengthen financial stability while enhancing the financial sector’s ability to allocate resources efficiently in support of the recovery, authorities could consider a wide range of measures.
Box 8. Government of Thailand responses to the food and fuel price crisis: The effects of fuel subsidies and cash transfers on poverty and their relative cost-effectiveness
Microsimulations provide insights into the effects of inflation on poverty in Thailand and the potential mitigating effects of two government responses: generalized subsidies on diesel fuel and targeted cash transfers. Both fuel subsidies and cash transfers appear to play a role in mitigating the poverty impacts, but to different degrees and at different costs. in the absence of any government response, it is estimated that inflation would have led to 4.3 percentage point increase in poverty.20 The government’s diesel subsidy is estimated to reduce the poverty impact of inflation by 0.9 percentage points (or 21 percent; figure B8.1A). Although the cost of the subsidy varies month-to-month based on changes in international fuel prices and occasional policy adjustments made by the government, it is estimated that the subsidy costs approximately THB 10 per litre (or roughly THB 11.1 billion per month in total). 21 A monthly cash transfer – top-ups of THB 200 – paid to 13.4 million existing social Welfare Card (sWC) beneficiaries from february to April and again from september to october is estimated to reduce the poverty impact of inflation by 1.2 points (or 28 percent) at a cost of THB 2.6 billion. Together, the two responses are estimated to mitigate half of inflation’s poverty shock impact (around 2.0 points), at a combined cost of THB 13.7 billion.
Given that many nonpoor households benefit from the fuel subsidy, it is an expensive way to mitigate the poverty impacts of the price shock, with an estimated cost of THB 11.2 billion per percentage point of poverty averted. This compares with just THB 2.2 billion per percentage point of poverty averted using the cash transfer. In fact, if the combined fuel subsidy and SWC budget were used entirely to fund larger SWC transfers, these transfers would more than offset the poverty impact of the price shocks, resulting in a 0.6 percent point decrease in poverty overall – and at a cost of only THB 2.7 billion per percent point of poverty reduction. Ongoing analysis for Indonesia suggests similar patterns of cost-effectiveness with respect to poverty reduction. To illustrate: The cash transfer component of the government’s CoViD response had a poverty reduction impact of 3.8 percentage points (World Bank 2020a) at a cost of 0.9 percent of GDP (iDR 139.7 trillion) (World Bank 2020b); this is equivalent to 0.24 percent of GDP per percentage point of poverty reduced. in contrast, energy subsidies have been estimated to cost 0.51 percent of GDP per percentage point of poverty reduced.22 While the Indonesia estimates are not strictly comparable to the Thai estimates, they similarly highlight that targeted transfers are considerably more cost-effective than generalized subsidies in mitigating the poverty impacts of shocks.
It is important to note, however, that there would be both winners and losers associated with moving completely from subsidies to targeted transfers. The current sWC top-up is worth more to beneficiaries in the bottom deciles than are fuel subsidies, both in absolute terms and as a share of their per capita income (figure B8.1A). Due to limitations in program targeting, however, only 38 percent of those in the first decile and
20 The poverty impact simulated here differs from the impact shown in figure 69 for a couple of reasons. first, figure 69 is based on observed inflation, which already includes the effects of the government’s subsidy on diesel. Second, the analysis here is based on “consumable income,” not “disposable income.” Disposable income is defined as household market income minus direct taxes (e.g., personal income tax) plus direct transfers (e.g., Old Age Allowance, Social Welfare Card transfers), and is the welfare aggregate measured in the survey and used for official poverty estimates. Consumable income additionally subtracts indirect taxes (e.g., VAT and fuel excises) and adds in indirect subsidies (e.g., fuel subsidies).
21 The fiscal cost includes both the cost to the state oil fund of maintaining the diesel price cap (THB 35 per litre) and the forgone revenue from reducing the diesel excise (from THB 5.99 per litre to 1.34). A total cost of THB 10 per litre is used in the modelling, a monthly representative subsidy which is similar to that of July 2022.
22 World Bank estimates.
32 percent of those in the second decile receive the top-up. This means that many poor households are better off receiving some fuel subsidy than receiving no relief at all. For households in the middle of the income distribution, the benefits to households of receiving the sWC top-up and the diesel subsidy are almost equal on a per capita basis. nevertheless, the diesel subsidy benefits nearly all Thai households, whereas only between 16-20 percent of households in the 5th and 6th deciles receive the SWC top-up. For those at the upper end of the distribution, the benefits associated with diesel subsidies are much larger than those associated with the sWC top-up (figure B8.1B). In short, there are both social welfare and political economy reasons that make switching wholesale from subsidies to targeted transfers difficult.
Figure B8.1. In Thailand, both fuel subsidies and cash transfers play a role in mitigating the poverty impacts of rising inflation, but to different degrees, for different groups, and at different costs
A. Transfers are more cost effective at reducing poverty … Poverty reduction associated with the Thailand’s responses to food and fuel price shocks (percentage points, LHS); Estimated cost effectiveness of each response (THB per percentage point of poverty averted, RHS)
6
5
4
3
2
1
(Box 8. continued) Poverty Alleviation (percentage point)
0
Fuel subsidies and excise reduction
SWC top-up payments (THB 200)
Fuel subsidies and SWC payments
Hypothetical SWC top-up (THB 1000)
Mitigation impact Cost-effectiveness
Source: World Bank estimates based on the 2019 Socioeconomic Survey for Thailand.
B. … but transfers may not reach many poor in practice and do not cover middle-income households in principle
Average monthly per capita benefit of diesel subsidy and SWC top-up, if received (THB, LHS); value of diesel subsidy and SWC topup relative to market income (percent, RHS) and coverage of SWC by decile (percent, RHS)
12
10
8
6
4
2
0
Cost per Point Alleivated (THB billion)
Note: fuel subsidy scenario uses a net THB 10 per litre fiscal cost, which represents a combined impact of fuel subsidies and price controls as well as reduced excises. Cost-effectiveness is THB billions of spending per percentage point of poverty averted.
400
300
14 100
40
30
PercentTHB
200
0
500 1 2 3 4 5 6 7 8 9 10
Diesel subsidy (per capita) SWC 200 (per capita)
Diesel subsidy (% of market income); RHS SWC 200 (% market income); RHS SWC coverage; RHS
Source: World Bank estimates based on the 2019 Socioeconomic Survey for Thailand.
20
10
0
A rise in NPLs threatens financial stability and the economic recovery. The economic literature warns about the adverse economic effects of such a scenario. if left unaddressed, rising numbers of nPLs threaten financial stability and can set the stage for systemic banking crises as some institutions may be unable to cope with increasing numbers of NPLs. Ari, Chen, and Ratnovski (2021) show that more than 80 percent of the banking crises since the 1990s exhibited nPLs that exceed 7 percent of total loans. Jurisdictions where nPLs were high and remained unresolved typically experienced deeper and more protracted recessions and slower recoveries than those where NPL problems were more speedily addressed. one channel underlying these adverse economic effects of unresolved nPLs is the misallocation of financial resources. financial institutions continue to extend credit to weak and failing firms (supporting often nonviable zombie borrowers), thereby reducing the availability of finance to support vibrant, more productive firms. Caballero, Hoshi, and kashyap (2008) show that this zombie lending affects healthy firms, reducing their investment and employment growth.
This puts a premium on policy action to support timely identification and management of NPLs. Regarding the former, there is currently lack of a transparency about the build-up of credit risks in financial institutions’ balance sheets and the true health of the financial sector (WDR, 2022). Research has shown that recognizing and provisioning for loan losses reduces zombie lending as it removes the incentive to hold on to these loans (Bonfim et al. 2020). Hence, strengthening supervisory policies to ensure transparent and timely reporting of bank asset quality is an essential first step to understanding and managing the pressures on banks and the financial system from rising nPL problems. Although the current risks of credit misallocation are largely the result of the pandemic crisis support measures (for example, regulatory forbearance and repayment moratoria), these risks can be amplified in countries with weak financial institutions. Acharya et al. (2017) show that under-capitalized financial banks are more prone to zombie lending, so as to avoid incurring losses on their portfolios. Therefore, supervisory authorities should ensure that banks maintain sound capital positions and provision adequately for loan losses on a forward-looking basis.
Effective insolvency frameworks are an integral part of the policy arsenal needed to mitigate the risks of credit misallocation. The effectiveness of efforts to manage nPLs is limited if insolvency frameworks are hostile to efficient corporate restructuring. That is, the faster the process of corporate restructuring and exit (and thus the resolution of nonperforming loans) is, the sooner the resources tied to the failing firm can be reallocated to more productive uses. for example, Andrews and Petroulakis (2019) show that improvements in a bank’s financial condition—making it better able to absorb losses resulting from writing off non-performing loans—are more likely to be associated with a reduction in the prevalence of zombie firms where insolvency regimes facilitate restructuring. Consolo, Malfa, and Pierluigi (2018) provide evidence that better insolvency frameworks lead to faster NPL reductions and to lower NPL increases during economically turbulent times. Insolvency systems remain at early stages of legal and regulatory maturity or rely on suboptimal institutional settings in many countries around the world (Menezes and Muro, 2022).
Fostering credit to the private sector to ensure adequate support of economic activity. As discussed earlier, rising corporate, sovereign, and financial sector vulnerabilities could all be associated with a more challenging landscape for private sector financing. As discussed earlier, the depth and structure of financial systems vary widely in the EAP region, indicating that the challenges of access to finance will also vary across countries. While some countries have relatively shallow financial systems, others have under-developed (or non-existent) equity markets, and are thus dependent on debt financing for the private sector. Research has provided evidence that access to diversified sources of financing in particular can improve firm resilience and help firms better cope with shocks. firms with limited access to multiple sources of financing are more prone to the effects of adverse supply-side shocks, such as those associated with tighter financing conditions (Becker and ivashina, 2014). Larger firms are typically those with better access to markets and thus are better able to cope with such shocks, especially publicly-listed firms with access to capital markets (Cortina et. al, 2021). for smaller firms dependent on banks for external financing, small fluctuations in bank credit can have sizeable effects on their investments and productive growth. Unlocking firm financing through deeper and more diversified financial systems can thus support private sector resilience and development.
Regarding both food and fuel, EAP governments must meet the triple goals of affordability, security, and sustainability. in both cases, the political imperative today is to prioritize affordability for consumers and firms. This goal is being pursued by keeping consumer prices low through food and fuel subsidies as well as export restrictions. These measures provide relief to consumers and producers, and may be the only immediately feasible measures, but they have economic costs even when they are temporary. They shrink fiscal space, inhibit switching of consumption to cheaper commodities,
Adalet McGowan et al. (2018) show that market congestion due to an increase in zombie lending is associated with lower investment and employment growth.may help the rich and large firms more than the poor and sMEs, and draw tax payers’ money away from expenditure in infrastructure, education and health.
But governments may still choose price subsidies over targeted transfers for four reasons. First, from a social welfare perspective, in practice a significant proportion of the poor do not receive transfers because many countries do not have adequate delivery infrastructure, such as comprehensive social registries. For example, in Thailand, less than half the poor possess the necessary social welfare card. Second, from a political perspective, targeted transfers do not in principle benefit the majority who are above the poverty line and who feel the pinch of inflation. Third, from an industrial policy perspective, price controls can shield firms from increases in costs of production that could disrupt recovery from the COVID-19 shock. Finally, from a monetary policy perspective, price controls can help keep inflation in check in countries where the monetary authority lacks credibility or inflation expectations are not well-anchored.
Therefore, transitioning to more efficient transfers would require building a stronger delivery infrastructure; devising transfers that are consistent with political imperatives, such as timebound transfers also to those just above the poverty line; and enhancing the credibility of monetary authorities and policy (Box 9). The trade-offs also depend on the duration of shocks: brief shocks may limit the cost of inefficient responses.
In food and fuel, EAP governments face the challenge of ensuring affordability, security, and sustainability. In the face of price shocks, direct transfers to poor or low-income households are often promoted as the best solution. They do not alter the market equilibrium, ensure affordability for the most vulnerable households, and have lower fiscal costs than economy-wide price subsidies. Given this apparent dominance of targeted transfers over other interventions the widespread use of price controls, subsidies and export restrictions seems surprising.
There are several reasons for the continued popularity of price controls. Firstly, they directly address affordability which is the politically most salient issue in the short-term. secondly, a deficient infrastructure in targeting and benefit delivery will preclude eligible households from receiving the direct transfer. A third reason is that targeted transfers, almost by definition, do not benefit the non-poor. But since the non-poor are the majority, and many of them would still suffer from sudden price increases in goods of primary necessity, targeted transfers will not find broad-based political support. Lastly, in the absence of a lack of a credible monetary authority, or the absence of well-anchored inflation expectations, preventing price increases may be necessary to keep inflation in check in the longer term.
Affordability is generally the most pressing issue as it manifests itself in the present moment, whereas other goals such as security and sustainability are longer-term problems. Affordability can be directly and immediately addressed by price controls, subsidies, or export restrictions. Other measures like targeted transfers may take time to implement and leave the price increase in place even though they soften its economic consequences.
The first problem with targeted transfers is that proper targeting and delivery may be difficult and dependent on a country’s administrative capacity. The most common targeting method in low and middle-income countries is the use of proxy means tests that estimate a household’s income based on easily observed characteristics (such as building materials of the dwelling or educational attainment of adult household members). The downside is that these tests are necessarily imperfect. Some households which are non-poor may be categorized as poor (inclusion error) and, more importantly, poor households may end up being classified as non-poor (exclusion error).
A second problem is that these categorizations are necessarily static and often based on information that is several years old. Households that have fallen into poverty more recently, possibly as a result of the same economic upheaval that caused the increase in the price of foods and fuels, would not benefit from such transfers. Keeping prices low can ensure that no household in need is excluded from the policy.
The third problem with such transfers is illustrated in Figure B9.1, showing the population distribution by income group in 2019. The population is divided into the poor, the economically secure and intermediate households. The poor are defined as having a per capita income of less than Us$3.10 in 2011 U.s. Dollars at purchasing power parity (PPP) for lower middle-income countries (Indonesia, Mongolia, Philippines, and Vietnam) and less than Us$5.50 PPP for upper middle-income countries (China and Thailand). The economically secure are defined throughout as having incomes of more than US$15.00 PPP. It is striking that the intermediate households, which are mostly ineligible for targeted transfers, yet whose income is low enough that they would feel the pinch of price increases in fuels and food, constitute the majority in all six countries. Their shares range from 54.2 percent in Thailand to 82.8 percent in Mongolia. Policies that hurt this group will be hard to implement.
80
60
40
20
0
Note: The poor are defined as having a per capita income of less than Us$3.10 in 2011 U.s. Dollars at purchasing power parity (PPP) for lower middle-income countries (indonesia, Mongolia, Philippines, and Vietnam) and less than Us$5.50 PPP for upper middle-income countries (China and Thailand). The economically secure are defined throughout as having incomes of more than Us$15.00 PPP.
There are, however, solutions to this problem. Some countries were successful in improving their targeting. This includes improved registries and their dynamic updating to keep track of newly vulnerable households. The prime example here is the Covid response in Thailand, which was able to scale up transfers quickly and efficiently by using various sources of information at the government’s disposal, such as the national identity registry and tax records. To tackle the problem that a majority of the population would not benefit from the targeted transfers, yet suffer the pain from price increases, better information systems that go beyond a social registry would also be of help. The best approach would be to extend such transfers to include a large share of the intermediate households. These transfers could be time-limited, subject to extension, if they are in response to a sudden price shock such as the war in Ukraine. In the absence of that information, self-targeting subsidies are also an option. For example, staple foods and low-quality grains (e.g., high percentage broken rice) are often “inferior goods,”
(Box 9. continued) (continued) China Indonesia Mongolia Philippines Thailand Vietnam Poor Intermediate Secure Figure B9.1. Population distribution by economic class and country in developing East Asia and Pacific 2019for which consumption shares decline as household incomes increase. As such, subsidies on staples will largely benefit poor and low-income households which consume them. Transfers could also be made universal. These transfers would still be highly progressive because they would constitute a much larger share in poor household’s income than in that of richer ones. While not fully solving the problem of sustainability, they would still eliminate distortions and result in an efficient resource allocation, thus solve the problem of security.
Many subsidies, price controls or export restrictions have been in place for decades and are perceived by the public as established policies or even entitlements. This gives rise to an additional problem if transfers are designed as a replacement: the inability of the government to commit to them long-term. Newly established transfer may be perceived (often rightfully) as short-term policies that may be taken away at any moment. Even if they are not taken away, transfers will lose their purchasing power over time if not adjusted for inflation. The fourth and last reason why many countries’ political economy favors price regulation resides in their long-run effect on inflation. in an ideal world, temporary price spikes should not have any effects on inflation. To see why, one must remember that inflation is the rate of change in the price level. one-off increases in the price of food and fuels will show up as sudden jumps, followed by sudden falls when prices fall back, in the price level. This, however, assumes that the factors that determine inflation are shielded from the effect of price changes. Here, inflationary expectations are of particular importance. if a country’s monetary authority has, or is perceived to have, the technical capacity and autonomy to keep the price level under control, then inflationary expectation should be well-anchored. If that technical capacity or autonomy is lacking, or it does not have the necessary credibility, sudden changes in the price level may quickly alter expectations and trigger an inflationary cycle that will be costly to bring back under control. in such a situation it makes sense for the fiscal authority to use the tools at its disposal to prevent such short-term price increases by regulating prices for certain goods directly. Fuels and food prices are of special important here since many people use them as proxies to the overall price level.
To achieve the food goals – affordability, security, and sustainability – governments must begin by shifting focus from rice-centric food security to nutrition security. The implication would be to encourage diversified production of nutritious foods, like livestock products, fruits and vegetables, by reducing policy distortions that currently favor production of rice. Where support to producers is deemed necessary, it would ideally take the form of direct transfers decoupled from production, which enhance the efficiency of resource use. Additionally, food costs could be significantly reduced by lowering trade barriers. in the longer term, the goal must be to increase agricultural productivity and resilience without undermining sustainability. This goal requires a move away from inputs-intensive to knowledge-intensive technologies and production practices, involving, for example, improved and resilient breeds/ varieties and precision agriculture. Long-term resilience to shocks is best ensured through ex-ante preparedness (better risk assessments and early warning systems) and improved ex-post management systems (well-resourced, reliable, and flexible reserves and contingency funds) which also involve the private sector. These shifts will enhance affordability of and secure access to a more nutritious consumption basket, contribute to higher incomes for farmers, and protect the natural resource base (land, water, and air quality) .
Promoting food security involves, at its core, developing a risk management system for resilience of the agrifood system against a multitude of shocks. Table 5 identifies the relevant set of issues, and the risks relating to them, for three dimensions of food security: increasing availability of food; increasing access to food; utilization and stability.
Increasing availability of food • Increase domestic output
• Increase trade
• Increase product diversity
• Strengthen domestic markets and supply chains (esp in FCV contexts)
Increasing access to food • Increasing “entitlements” (incomes, transfers) for nutritionally adequate food basket
• Natural shocks
• Trade shocks
• Inputs shocks (fuel, fertilizers, seeds)
• supply chain shocks (e.g., internal conflicts, logistics)
• Income shocks
• Transfers shocks (change in remittances, state protection)
• Political shocks (e.g., internal conflicts, fCV situations)
Increasing stability
• Inventory (public, commercial and private stocks) to ease seasonal variations
• Strategic reserves to offset shocks
• Risk spreading to cope with shocks: insurance, trade and forward markets
• Hoarding
• Panic buying
• Inadequate capacity to offset shocks (e.g., AsEAn+3)
• Ineffective (“time-inconsistent”) insurance arrangements
• Logistical bottlenecks
• Regulatory hurdles
Sources:
In the current EAP context, with its legacy of food security policies and the evolving nature of its food security challenges, there are areas where the government can do more (“consider”) and where it can do less or work differently (“reconsider”). These options and recommendations are presented in table 6. key actions to be taken include: (i) improve nutrition by diversifying domestic production and increasing the quality of nutritious foods – through re-focusing the current predominant support for rice; (ii) lower food prices by increasing productivity and lowering trade barriers; (iii) improve affordability by increase farmer incomes through greater value-addition and improved profitability; and (iv) enhance sustainability through “greening of agriculture” (reducing emissions and promoting low-carbon production, processing and distribution).
In fuel, the temporary crisis measures to keep prices low run counter to the efforts in major EAP countries in the last few years to reduce fuel subsidies. Now fuel subsidies are growing in most countries, including in Indonesia which had significantly reduced them (figure 72). At the same time, production of coal is being revived even in countries that were beginning to shut down coal mines. These actions today could compromise emission reduction commitments as well as perpetuate dependence on imported fossil fuels and hence vulnerability to future energy price shocks.
High global commodity prices have created an economic shock that demands an immediate policy response. However, short-term policy responses can also have long-term impacts and there is a risk that measures taken now could lock countries into high emission pathways or lead to stranded assets. As well as distorting energy markets, subsidies use scarce government resources that could instead support long-term sustainable development.
In achieving the similar energy goals, policy responses must help meet the immediate need for affordable energy without compromising energy security and sustainability. Some governments are expanding existing fossil fuel sources as they are seen as the most economical way to alleviate the current crisis, but encouraging investment in renewables could reduce exposure to fossil fuel price volatility and help meet emission reduction commitments. In addition to the necessary
Table 6. What policies should EAP Government adopt to strengthen food security?
Trade restrictions and price band policies: these impede stabilizing role of trade and distort production and consumption decisions
Producer/input subsidies: these do not directly increase productivity or resilience and crowd-out other expenditures
Support to producers decoupled from production: to enhance technical and allocative efficiency at farm level
Targeted, transfers to consumers:
Repurpose budget support: away from input, output subsidies towards measures that increase productivity and production potential
Distortive producer support: these encourage greater use of land, water, fertilizer and other inputs, direct GHG emissions, and promote low-nutrition and low-value crops
Support shift from inputs-to knowledge-intensive production: e.g., improved breeds/varieties, precision agriculture, lowered GHG emissions.
Improve storage and processing infrastructure: to minimize food losses
Over-reliance on short-horizon and expost risk management policies: e.g. ad hoc post-shock farmer and consumer transfers, protective trade policies.
Long-term resiliency to shocks: through exante preparedness (better risk assessments and early warning systems, research on resilient technologies) and improved ex-post management systems (well-resourced, reliable and flexible reserves and contingency funds)
Sources:
policy reforms to encourage private sector participation, providing affordable access to finance at-scale and green public procurement would help support low-carbon technologies and accelerate the clean energy transition. At current energy prices, cheaper finance could make investing in wind and solar more attractive than in new coal power plants (figure 73). such support would be justified if it helped avert the risk of locking development into a high-carbon future or creating potentially stranded assets, thus contributing to both national energy security and global sustainability. When energy prices eventually fall, the introduction of carbon prices would improve the viability of renewables and finance support for vulnerable households.
Expansion of fossil fuels will also be necessary in the short-term because not all countries in EAP have the capacity to rapidly scale up renewable electricity generation. Current academic research has shown that, even if prices are favorable, most of the countries in EAP have yet to cross the threshold from which renewable energy can expand without support (figure 74). it will therefore be difficult to scale up installation quickly. for example, it will take time to build up supply chains and to develop the necessary labor market skills. Electricity grids may need to be improved to handle an increased share of variable generation. Other technologies that reduce fossil fuel consumption, including electric vehicles that require charging networks, face similar issues. Therefore, dealing with high energy prices and shortages will require
Figure 73. At current fuel prices, existing coal is the cheapest source of energy, but favorable access to finance could make renewables less costly than new coal
Simulated impact of fuel price and interest rate increases on the levelized cost of energy
USD/MWh (in 2019 prices)
160
120
80
40
0
Existing coal
Figure 74. Current wind and solar shares in power generation
Percent
0
2 4 6 8 10 Interest costs (4pp increase)
China
Thailand
Philippines Timor-Leste Malaysia Myanmar PNG Indonesia
Solar
New coal New wind (onshore)
Mongolia Vietnam Back-up cost at current gas prices (25%)
Cambodia Variable cost of new wind, new solar and new CCGT
Wind Change in coal price in 2022
Coal price in 2021
Source: iREnA and World Bank estimates
New solar PV New CCGT
Note: The Figures show ‘levelized’ cost calculations of the average unit price of generation using each technology. The levelized cost captures the sum of investment, operational, and fuel costs, divided by the expected revenues from the electricity generated. For existing coal plants, the investment costs are assumed to be zero. Most data are derived from iEA publications. The fuel costs have been adjusted to reflect the latest data. A standard 10 percent discount rate is used in the calculations, with any increases in central bank interest rates added to the discount rate. Additional material costs are estimated based on the material content of the capital used by each technology (source: iREnA). since potential back-up generation costs vary between countries, a range of outcomes has been provided, proportional to levelized costs.
expansion of fossil fuel production in the short-term. Overall, the speed and scale at which clean energy alternatives are deployed will determine how soon the countries are able to reduce reliance on fossil-fuels.
Ì Implications of shocks, policy interventions, and reform on long-term growth
Figure 75. Potential growth and its components in EAP
Percentage point
6
4
2
Sources: iREnA, iEA. –2
8 2000–10 2011–21 2022–30
0
TFP growth Labor Capital Potential growth
Source: World Bank estimates
Potential growth in EAP has declined over the last decade (2011–21) to 6.2 percent compared to the previous decade (2000–10) of 7.6 percent (Figure 75). However, this was entirely due to the structural slowdown in China. Over the remainder of the next decade (2022–30), further deceleration in potential growth in EAP would bring potential growth down to as low as 4.6 percent. While most of this slowdown is still due to the slower growth in potential output in China, potential growth in EAP excluding China is expected to decline modestly by 0.1 percentage point to 4.1 percent. The deceleration of potential growth in EAP would be rooted from broad base decline across each component of potential growth. While almost half of the decline in potential growth would be due to the slowdown in capital accumulation, deceleration in productivity mostly because of the slowdown in new investment projects and decline in demographic dividends due to aging would contribute significantly.
High commodity prices and tightening monetary policy has raised the concerns about growth and inequality in EAP. While countries try to cushion the effects of high commodity prices by different policies especially for vulnerable
groups, it is important to consider the impacts of these policies on long-term growth.
In the first alternative scenario, the commodity price shock is assumed to affect the potential growth through a decline in terms-of-trade which implies a 2 percentage points decline in investment growth of the commodity importers in EAP (Islamaj et al. 2019). 23
In addition, monetary tightening through elevated interest rates would also impact potential growth through investment growth. A 300 basis points increase in interest rate is assumed, which in turn implies a 2.1 percentage points decline in investment over GDP for each year over the period 2022–30 (Hall et al. 1977). Based on this scenario, EAP potential growth is expected to decline by 0.4 percentage point to 4.2 percent (figure 76).
Figure 76. inefficient interventions could magnify the growth costs of recent price and interest rate shocks; more efficient interventions and deeper reforms could offset the negative growth impact
Percent
0
Baseline Commodity price and interest rates
hocks
Government intervention through price subsidies
Government intervention through lumpsum transfers
TFP improvements due to deeper reforms
Boost in investment due to deeper reforms
Growth under initial shock and policy response
Source: World Bank estimates
Note: Reform scenario assumes that over the next decade, each country will raise its investment growth as much as its largest increase over any historical 10-year interval. 5 under these improved policies, investment growth is assumed to reach 4.6 percent annually over the next decade on average in the region compared to 2.8 percent under the CoViD-19 scenario.
In the second alternative scenario, with the commodity price and interest rate shocks, the effect of government intervention through price controls and commodity subsidies is examined. The impact of the interest rate increase is assumed to persist while only half of the impact of the commodity price shock is assumed to remain. In addition, distortions in price signals due to policy interventions are assumed to lead to a deterioration in total factor productivity (TfP) levels by 3 percentage points cumulatively in 10 years. finally, due to the additional burden of price controls and subsidies, public debt is assumed to increase by 10 percentage points, which would lead to a 2 percentage points decline in investment growth. Under this second alternative scenario, potential growth in EAP would decline by another 0.4 percentage point to 3.8 percent.
In the third scenario, again with the commodity price and interest rate shocks, government intervention through lump-sum welfare transfers to vulnerable groups is assumed. Compared to the second scenario, this scenario does not have the deterioration in TFP due to distortions in price signals but the other assumptions stay the same. Although this third scenario leads to some improvement in potential growth in EAP relative to the second scenario with price controls (by 0.2 percentage point), growth is still lower than in the scenario with no government intervention. The reason is that softening the impact of the price and interest shock and the associated gains in the welfare of recipients of transfers to the vulnerable groups come at the expense of public investment.
Governments can, however, push reforms further to address not just the other distortions discussed above but also those in services and factor markets. Reforms that boost investment and improve TFP levels through a better allocation of resources could increase the potential growth by 0.8 percentage points and offset the decline due to commodity price and interest rate shocks.
23 There are six EAP countries in the sample, in which four of them are commodity importers: China, Malaysia, Philippines, and Thailand. The rest of two countries (indonesia and Mongolia) are commodity exporters.COVID-19
million (since June 2022)
COVID-19
COVID-19
million (since June 2022)
People
(average JulAug 2022)
Net energy export (% of GDP, 2016-20)
protocol (%; latest)
Net food export (% of GDP, 2016-20)
Cereal import dependency ratio (%, 201719)
Manufacturin
export (% of GDP, 2016-20)
of GDP, 2016-
GDP, 2016-20)
GDP, 2022 est.)
GDP, 2022)
Source: UN Comtrade; Fitch Solutions; Haver Analytics; International Monetary Fund; Oxford Covid-19 Government Response Tracker (OxCGRT), WHO Coronavirus (COVID-19) Dashboard; FAO; World Development Indicators; World Bank. Note: net energy export includes mineral fuels and ores. net food export includes cereals and grains, meat, fish, dairy, vegetables and fruit. Cereal import dependency ratio shows an extent to which a country’s supply of grains and cereals come from imports. CPi inflation of Timor-Leste, kiribati, Micronesia, samoa, solomon is., Tonga, Tuvalu and Vanuatu show 2022 forecast by fitch. Color scale represents quintiles relative to the group of emerging markets and developing economies, with red denoting the worst exposure and green the least. General government debt of small island economies is not color scaled because the debt tolerance of small island countries is lower than that of larger EMDEs.Fiscal balance
East Asian economies; monetary policy
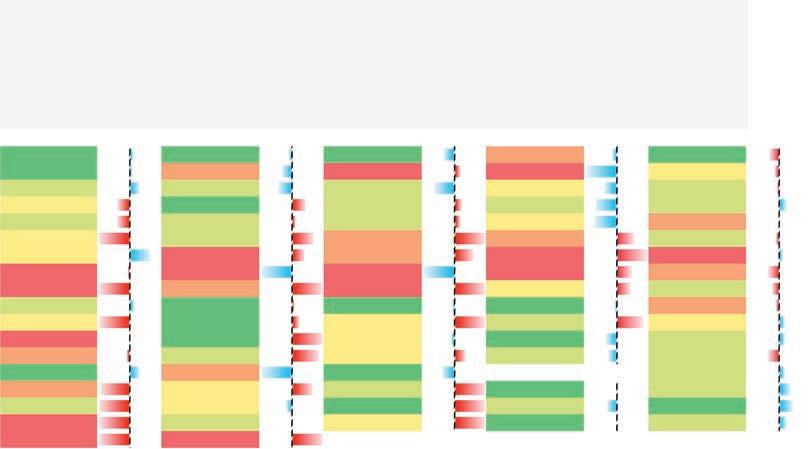
less so


Domestic credit
private sector
policy rate,
percent
Cambodia
China
Malaysia
Philippines
Thailand
Vietnam
Source:
A3. External vulnerabilities are severe in Lao PDR, Mongolia, Cambodia and Palau
China Malaysia Indonesia Philippines Vietnam Thailand Lao PDR Mongolia Cambodia Myanmar Timor-Leste Fiji Solomon Islands Papua New Guinea Samoa Vanuatu Tonga
In Fall 2022, the World Bank is adopting new 2017 purchasing power parities (PPPs) for international poverty monitoring (link). Adoption of the 2017 PPPs is intended to better reflect the prevailing prices than the 2011 PPPs, as well as upgrades in the poverty lines across countries. On the basis of this change, the international extreme poverty line, which was derived as the median national poverty line of low-income countries, was updated to $2.15 per person per day in 2017PPP from US$1.90 in 2011PPP. The income-class poverty lines, which are more relevant to many EAP countries given their per capita income levels, were also updated by taking the median of the national poverty lines for lower- and upper- middle income countries. As a result, the lower-middle-income class line was revised from $3.20 (2011PPP) to $3.65 (2017PPP) while the upper-middle-income class line was revised from $5.50 (2011PPP) to $6.85 (2017PPP).
The impact of adopting the 2017PPP-based new poverty lines is not trivial for the region. Although the impacts on extreme poverty ($2.15 in 2017PPP) are relatively limited, given that extreme poverty in the region is already very low, changes in the lower- and upper-middle-income class lines ($3.65 and $6.85, respectively, in 2017PPP) are noteworthy.24 Using the 2017PPP-based poverty line, the number of measured poor people increased by 33 million at the lower-middle-income class poverty line (panel A, figure 2) and by 174 million at the upper-middle-income class line (panel B, figure 2). These changes are driven by increases in poverty in the region’s two most populous countries: China and Indonesia. These two countries together account for more than 85 percent of the regional increase in the number of poor.
Figure A1.1. Comparison in number of poor in 2019 between 2011 and 2017PPPs
A. Lower middle-income
($3.20
2011PPP, $3.65 in
B. Upper middle-income class poverty
($5.50 in 2011PPP, $6.85 in 2017PPP
(millions)
China
The observed differences in international poverty estimates based on the 2017 PPPs relative to the 2011 PPPs are driven by several factors. The most important factor is the change in price levels in the country relative to the United States. Higher relative prices imply a reduction in purchasing power, thus yielding higher poverty rates. in 2017, the basket of goods and services in several of the EAP countries cost more relative to the United states than it did in 2011. in China, for instance, prices for food and clothing were 15 to 40 percent higher than the global average in 2017, while they were below average in 2011. When using the upper-middle-income poverty line, the difference between the 2011 PPP and the 2017 PPP poverty estimates reflects a second factor. national poverty lines in upper-middle-income countries – which are used to determine the value of the upper-middleincome poverty line – were higher in real terms in 2017 compared to 2011. These increases reflect the fact that “poverty” in upper-middle-income countries is often defined in relative terms, meaning that the definition of poverty changes over time with changing consumption patterns and rising incomes, rather than with prices (which are more relevant for the definition of absolute poverty) (Jolliffe et al. 2022: p28).
Adalet McGowan, Müge, Dan Andrews, Valentine Millot. and Thorsten Beck, 2018. “The walking dead? Zombie firms and productivity performance in oECD countries,” Economic Policy, CEPR;CEs;MsH, vol. 33(96), pages 685-736.
Acharya, Viral V., Lasse H. Pedersen, Thomas Philippon, Matthew Richardson, Measuring Systemic Risk, The Review of Financial Studies, Volume 30, Issue 1, January 2017, Pages 2–47
Adamopoulos, T., L. Brandt, J. Leight, & D. Restuccia. 2022. Misallocation, selection, and productivity: A quantitative analysis with panel data from China. Econometrica 90(3): 1261–82.
Adamopoulos, T., & D. Restuccia. 2014. Land reform and productivity: A quantitative analysis with microdata. Unpublished manuscript, University of Toronto.
Aitken, B. 1991. Measuring trade policy intervention: A cross-country index of relative price distortion. Working paper no. 838, World Bank, Washington, DC.
Anderson, k., M. ivanic, and W. Martin. 2014. “food price spikes, price insulation and poverty.” in The Economics of Food Price Volatility, edited by J. P. Chavas, D. Hummels, and B. D. Wright. Chicago: University of Chicago Press.
Andrews, Dan, Petroulakis, Filippos, 2019. “Breaking the shackles: Zombie firms, weak banks and depressed restructuring in Europe,” Working Paper series 2240, European Central Bank.
Ari, Anil, Sophia Chen, and Lev Ratnovski. 2021. “The dynamics of non-performing loans during banking crises: A new database with post-CoViD-19 implications,” Journal of Banking & finance, Elsevier, vol. 133(C).
Arkolakis, C., A. Costinot, & A. Rodríguez-Clare. 2012. new trade models, same old gains? American Economic Review 102(1): 94–130.
Ayerst, S., L. Brandt, & D. Restuccia. 2020. Market constraints, misallocation, and productivity in Vietnam agriculture. Food Policy 94:101840.
Becker, Bo, and Victoria Ivashina. 2014. “Cyclicality of credit supply: Firm level evidence,” Journal of Monetary Economics, Volume 62, Pages 76–93.
Besley, T., & M. Ghatak. 2010. “Property rights and economic development.” In Handbook of development economics (vol. 5, 4525–95). Amsterdam, netherlands: Elsevier.
Bils, M., P. J. klenow, & C. Ruane. 2017. Misallocation or mismeasurement? in 2017 Meeting Papers (no. 715, March). society for Economic Dynamics.
Block S, L Kiess, P Webb, S Kosen, R Moench-Pfanner, MW Bloem, CP Timmer. 2004. Macro shocks and micro outcomes: child nutrition during indonesia’s crisis. Economics and Human Biology, 2(1): 21–44.
Bonfim, Diana and Cerqueiro, Geraldo and Degryse, Hans and ongena, steven R. G., On-Site Inspecting Zombie Lending (January 1, 2020). Swiss Finance Institute Research Paper No. 20-16,
Boyce, J. K., & M. Ravallion. 1991. A dynamic econometric model of agricultural wage determination in Bangladesh. Oxf. Bull. Econ. Stat. 53(4): 361–76.
Brandt, L., T. Tombe, & X. Zhu. 2013. Factor market distortions across time, space, and sectors in China. Review of Economic Dynamics 16(1): 39–58.
Bryan, G., & M. Morten. 2019. The aggregate productivity effects of internal migration: Evidence from indonesia. Journal of Political Economy 127(5): 2229–68.
Buera, f. J., J. P. kaboski, & Y. shin. 2015. Entrepreneurship and financial frictions: A Macro Development Perspective. Annual Review of Economics 7(1): 409–36.
Caballero, Ricardo J., Takeo Hoshi, and Anil K. Kashyap. 2008. “Zombie Lending and Depressed Restructuring in Japan.” American Economic Review, 98 (5): 1943–77.
Consolo, Agostino, Malfa, Federica, and Pierluigi, Beatrice, 2018. “Insolvency frameworks and private debt: an empirical investigation,” Working Paper series 2189, European Central Bank.
Cortina, Juan J., Tatiana Didier, and Sergio L. Schmukler. 2021. “Global corporate debt during crises: Implications of switching borrowing across markets,” Journal of international Economics, Volume 131, 103487.
Cross L. 2022. key fertilizer price drivers and the impact of conflict in Ukraine on fertilizer markets. Presentation at ifPRi Seminar Fertillizer Availability and Affordability: Implications for agricultural productivity and food security. May 4.
David, J. M., H. A. Hopenhayn, & V. Venkateswaran. 2016. Information, misallocation, and aggregate productivity. The Quarterly Journal of Economics 131(2): 943–1005.
de Nicola, F., H. Nguyen, & N. Loayza. 2020. Productivity loss and misallocation of resources in southeast Asia. Policy Research Working Paper; No. 9483. World Bank, Washington, DC.
Deaton, A. 1989. Rice prices and income distribution in Thailand: A non-parametric analysis. The Economic Journal 99:1–37.
Easterly, W. 1993. How much do distortions affect growth? Journal of Monetary Economics 32(2): 187–212.
Edmond, C., V. Midrigan, & D. Y. Xu. 2015. Competition, markups, and the gains from international trade. American Economic Review 105(10): 3183–221.
Gautam et al. 2022. Repurposing agricultural policies and support, World Bank.
Glauber J, D Laborde. 2022. How Russia’s Invasion of Ukraine Is Affecting Global Agricultural Markets. May. American Enterprise institute for Public Policy Research, Washington, DC.
Grosh, Margaret, Phillippe Leite, Matthew Wai-Poi, & Emil Tesliuc. 2022. Revisiting targeting in social assistance: A new look at old dilemmas. Human Development Perspectives. World Bank, Washington, DC.
Ha, Jongrim, M. Ayhan Kose, & Franziska Ohnsorge. 2019. Inflation in emerging and developing economies: Evolution, drivers and policies. Washington, DC: World Bank.
Haltiwanger, J., R. Kulick, & C. Syverson. 2018. Misallocation measures: The distortion that ate the residual (No. w24199). national Bureau of Economic Research, Cambridge, MA.
Hassan, F., and L. Kornher. 2022. Farm wage and rice price dynamics in Bangladesh. Food Security 14:127–46. Headey, Derek D. 2016. Food prices and poverty. Policy Research Working Paper No. 7898. World Bank, Washington, DC. Hopenhayn, H. A. 2014. Firms, misallocation, and aggregate productivity: A review. Annu. Rev. Econ. 6(1): 735–70. Hsieh, C. T., & P. J. Klenow. 2009. Misallocation and manufacturing TFP in China and India. Quarterly Journal of Economics 124(4): 1403–48.
ilman, Assyifa szami. 2020. Effects of High food Prices on non-Cash food subsidies (BPnT) in indonesia - Case study in East nusa Tenggara, Policy Paper, no. 26, Center for indonesian Policy studies (CiPs), Jakarta. islamaj, Ergys, M. Ayhan kose, franziska L. ohnsorge & Lei sandy Ye. 2019. Explaining Recent investment Weakness: Causes and implications, Emerging Markets finance and Trade, 55:8, 1709–1721
Ivanic, M., W. Martin., and H. Zaman. 2012. Estimating the short-run poverty impacts of the 2010–11 surge in food prices. World Development 40(11): 2302–17.
Jacoby, H. G. 2016. Food prices, wages, and welfare in rural India. Economic Inquiry 54(1).
Jolliffe, D. M., D. Mahler, C. Lakner, A. Atamanov, & S. Tetteh-Baah. 2022. Assessing the impact of the 2017 PPPs on the international poverty line and global poverty. World Bank, Washington, DC.
Jurzyk, M. E. M., & Ruane, M. C. 2021. Resource Misallocation Among Listed firms in China: The Evolving Role of stateowned Enterprises. international Monetary fund.
khandelwal, A. k., P. k. schott, & s. J. Wei. 2013. Trade liberalization and embedded institutional reform: Evidence from Chinese exporters. American Economic Review 103(6): 2169–95.
kose, M. A., ohnsorge, f. L., Reinhart, C. M., & Rogoff, k. s. 2022. The aftermath of debt surges. Annual Review of Economics, 14, 637–663.
Lasco, C., R. J. Myers, & R. H. Bernsten. 2008. Dynamics of rice prices and agricultural wages in the Philippines. Agricultural Economics 38:339–48.
McMillan, M., & Rodrik, D. 2011. Globalization, structural change and productivity growth. In M. Bacchetta, & M. Jense (Eds.), Making globalization socially sustainable (pp. 49–84). Geneva: International Labour Organization and World Trade Organization.
Menezes, A., & Muro, S. 2020. COVID-19 outbreak: Implications on corporate and individual insolvency. http:// pubdocs.worldbank.org/en/912121588018942884/COVID-19-Outbreak-Implications-on-Corporate-andIndividual-Insolvency.pdf
Midrigan, V., & D. Y. Xu. 2014. finance and misallocation: Evidence from plant-level data. American Economic Review 104(2): 422–58.
nakamura, Emi, Jón steinsson, Patrick sun, Daniel Villar, The Elusive Costs of inflation: Price Dispersion during the U.s. Great inflation, The Quarterly Journal of Economics, Volume 133, issue 4, november 2018, Pages 1933–1980
oECD. 2021. Agricultural Policy Monitoring and Evaluation Report 2021 Addressing the Challenges facing food systems, oECD Publishing, Paris.
oECD. 2022. Agricultural Policy Monitoring and Evaluation Report 2022: Reforming Agricultural Policies for Climate Change Mitigation, oECD Publishing, Paris.
oECD/fAo. 2022. oECD-fAo Agricultural outlook 2022–2031, oECD Publishing, Paris.
Palmer-Jones, R.W. 1993. Agricultural wages in Bangladesh: What do the figures really show? J. Dev. Stud. 29(2): 277–95.
Portmann F, S Soenert, P Doell. 2010. MIRCA2000—Global monthly irrigated and rainfed crop areas around the year 2000: A new high-resolution data set for agricultural and hydrological modeling. Global Biogeochemical Cycles, VOL. 24, GB1011.
Rashid, S. 2002. Dynamics of agricultural wage and rice price in Bangladesh: a re-examination. Post-doctoral paper for the International Food Policy Research Institute, Washington, DC.
Rogoff, kenneth s., & Yuanchen Yang. 2020. “Peak China Housing,” nBER Working Papers 27697, national Bureau of Economic Research, inc.
Song, Z., K. Storesletten, & F. Zilibotti. 2011. Growing like China. American Economic Review 101(1): 196–233.
Taylor, J. B. 2000. Low inflation, pass-through, and the pricing power of firms. European economic review, 44(7), 1389–1408.
Tombe, T., & X. Zhu. 2019. Trade, migration, and productivity: A quantitative analysis of China. American Economic Review 109(5): 1843–72.
World Bank. 2009. Welfare impact of rising food prices in south Asian countries. Policy note. south Asia Economic Policy and Poverty Unit, Washington, DC: World Bank.
World Bank. 2020a. Towards a secure and fast Recovery, indonesia Economic Prospects, December 2020. World Bank. 2020b. The Long Road to Recovery, indonesia Economic Prospects, July 2020.
World Bank. 2022a. Braving the storms. World Bank East Asia and Pacific Economic Update (April). Washington, DC: World Bank.
World Bank. 2022b. food security Update, August 11. Washington, DC: World Bank Group. World Bank. 2022c. indonesia Economic Prospects, June 2022: financial Deepening for stronger Growth and sustainable Recovery. Washington, DC: World Bank.