Plastics Policy Simulator: Policy Package Comparison
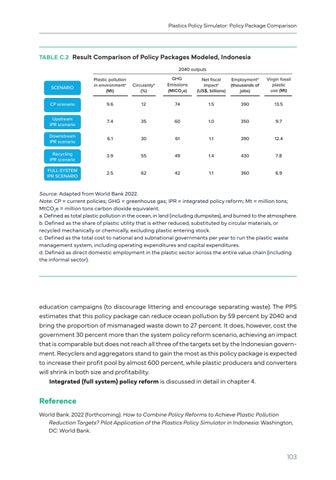
TABLE C.2 Result Comparison of Policy Packages Modeled, Indonesia 2040 outputs Plastic pollution in environmenta (Mt)
Circularityb (%)
GHG Emissions (MtCO2e)
Net fiscal impactc (US$, billions)
Employmentd (thousands of jobs)
Virgin fossil plastic use (Mt)
CP scenario
9.6
12
74
1.5
390
13.5
Upstream IPR scenario
7.4
35
60
1.0
350
9.7
Downstream IPR scenario
6.1
30
61
1.1
390
12.4
Recycling IPR scenario
3.9
55
49
1.4
430
7.8
FULL-SYSTEM IPR SCENARIO
2.5
62
42
1.1
360
6.9
SCENARIO
Source: Adapted from World Bank 2022. Note: CP = current policies; GHG = greenhouse gas; IPR = integrated policy reform; Mt = million tons; MtCO2e = million tons carbon dioxide equivalent. a. Defined as total plastic pollution in the ocean, in land (including dumpsites), and burned to the atmosphere. b. Defined as the share of plastic utility that is either reduced, substituted by circular materials, or recycled mechanically or chemically, excluding plastic entering stock. c. Defined as the total cost to national and subnational governments per year to run the plastic waste management system, including operating expenditures and capital expenditures. d. Defined as direct domestic employment in the plastic sector across the entire value chain ( including the informal sector).
education campaigns (to discourage littering and encourage separating waste). The PPS estimates that this policy package can reduce ocean pollution by 59 percent by 2040 and bring the proportion of mismanaged waste down to 27 percent. It does, however, cost the government 30 percent more than the system policy reform scenario, achieving an impact that is comparable but does not reach all three of the targets set by the Indonesian government. Recyclers and aggregators stand to gain the most as this policy package is expected to increase their profit pool by almost 600 percent, while plastic producers and converters will shrink in both size and profitability. Integrated (full system) policy reform is discussed in detail in chapter 4.
Reference World Bank. 2022 (forthcoming). How to Combine Policy Reforms to Achieve Plastic Pollution Reduction Targets? Pilot Application of the Plastics Policy Simulator in Indonesia. Washington, DC: World Bank.
103


