70
|
Overweight and Obesity in Saudi Arabia
TABLE 5.4
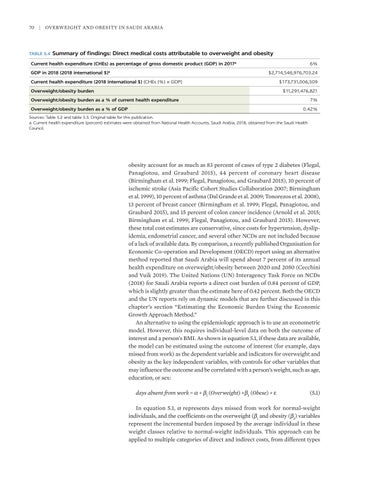
Summary of findings: Direct medical costs attributable to overweight and obesity
Current health expenditure (CHEs) as percentage of gross domestic product (GDP) in 2017a GDP in 2018 (2018 international $)
6% $2,714,546,976,703.24
a
Current health expenditure (2018 international $) (CHEs (%) × GDP) Overweight/obesity burden
$173,731,006,509 $11,291,476,821
Overweight/obesity burden as a % of current health expenditure Overweight/obesity burden as a % of GDP
7% 0.42%
Sources: Table 5.2 and table 5.3. Original table for this publication. a. Current health expenditure (percent) estimates were obtained from National Health Accounts, Saudi Arabia, 2018, obtained from the Saudi Health Council.
obesity account for as much as 83 percent of cases of type 2 diabetes (Flegal, Panagiotou, and Graubard 2015), 44 percent of coronary heart disease (Birmingham et al. 1999; Flegal, Panagiotou, and Graubard 2015), 10 percent of ischemic stroke (Asia Pacific Cohort Studies Collaboration 2007; Birmingham et al. 1999), 10 percent of asthma (Dal Grande et al. 2009; Tonorezos et al. 2008), 13 percent of breast cancer (Birmingham et al. 1999; Flegal, Panagiotou, and Graubard 2015), and 15 percent of colon cancer incidence (Arnold et al. 2015; Birmingham et al. 1999; Flegal, Panagiotou, and Graubard 2015). However, these total cost estimates are conservative, since costs for hypertension, dyslipidemia, endometrial cancer, and several other NCDs are not included because of a lack of available data. By comparison, a recently published Organisation for Economic Co-operation and Development (OECD) report using an alternative method reported that Saudi Arabia will spend about 7 percent of its annual health expenditure on overweight/obesity between 2020 and 2050 (Cecchini and Vuik 2019). The United Nations (UN) Interagency Task Force on NCDs (2018) for Saudi Arabia reports a direct cost burden of 0.84 percent of GDP, which is slightly greater than the estimate here of 0.42 percent. Both the OECD and the UN reports rely on dynamic models that are further discussed in this chapter’s section “Estimating the Economic Burden Using the Economic Growth Approach Method.” An alternative to using the epidemiologic approach is to use an econometric model. However, this requires individual-level data on both the outcome of interest and a person’s BMI. As shown in equation 5.1, if these data are available, the model can be estimated using the outcome of interest (for example, days missed from work) as the dependent variable and indicators for overweight and obesity as the key independent variables, with controls for other variables that may influence the outcome and be correlated with a person’s weight, such as age, education, or sex: days absent from work = α + β1 (Overweight) +β2 (Obese) + ε
(5.1)
In equation 5.1, α represents days missed from work for normal-weight i ndividuals, and the coefficients on the overweight (β1 and obesity (β2) variables represent the incremental burden imposed by the average individual in these weight classes relative to normal-weight individuals. This approach can be applied to multiple categories of direct and indirect costs, from different types


