68 |
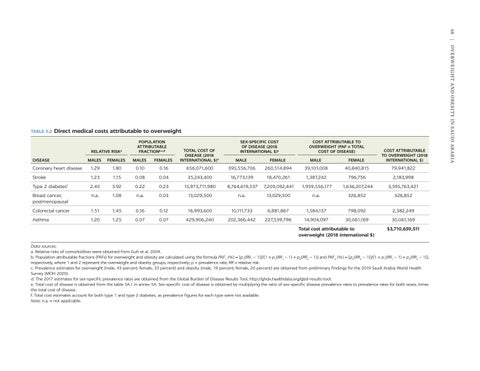
Direct medical costs attributable to overweight
RELATIVE RISK
a
DISEASE
POPULATION ATTRIBUTABLE FRACTIONb,c,d
COST ATTRIBUTABLE TO OVERWEIGHT (PAF × TOTAL COST OF DISEASE)
FEMALES
MALE
FEMALE
MALE
FEMALE
COST ATTRIBUTABLE TO OVERWEIGHT (2018 INTERNATIONAL $)
MALES
FEMALES
Coronary heart disease
1.29
1.80
0.10
0.16
656,071,600
395,556,706
260,514,894
39,101,008
40,840,815
79,941,822
Stroke
1.23
1.15
0.08
0.04
35,243,400
16,773,139
18,470,261
1,387,242
796,756
2,183,998
Type 2 diabetes
2.40
3.92
0.22
0.23
15,973,711,980
8,764,619,537
7,209,092,441
1,959,556,177
1,636,207,244
3,595,763,421
Breast cancer, postmenopausal
n.a.
1.08
n.a.
0.03
13,029,500
n.a.
13,029,500
n.a.
326,852
326,852
Colorectal cancer
1.51
1.45
0.16
0.12
16,993,600
10,111,733
6,881,867
1,584,157
798,092
2,382,249
Asthma
1.20
1.25
0.07
0.07
429,906,240
202,366,442
227,539,796
14,904,097
30,061,169
30,061,169
f
MALES
SEX-SPECIFIC COST OF DISEASE (2018 INTERNATIONAL $)e
TOTAL COST OF DISEASE (2018 INTERNATIONAL $)e
Total cost attributable to overweight (2018 international $)
$3,710,659,511
Data sources: a. Relative risks of comorbidities were obtained from Guh et al. 2009. b. Population attributable fractions (PAFs) for overweight and obesity are calculated using the formula PAF1 (%) = [p1(RR1 − 1)]/[1 + p1(RR1 − 1) + p2(RR2 − 1)] and PAF2 (%) = [p2(RR2 − 1)]/[1 + p1(RR1 − 1) + p2(RR2 − 1)], respectively, where 1 and 2 represent the overweight and obesity groups, respectively; p = prevalence rate; RR = relative risk. c. Prevalence estimates for overweight (male, 43 percent; female, 33 percent) and obesity (male, 19 percent; female, 20 percent) are obtained from preliminary findings for the 2019 Saudi Arabia World Health Survey (MOH 2020). d. The 2017 estimates for sex-specific prevalence rates are obtained from the Global Burden of Disease Results Tool, http://ghdx.healthdata.org/gbd-results-tool. e. Total cost of disease is obtained from the table 5A.1 in annex 5A. Sex-specific cost of disease is obtained by multiplying the ratio of sex-specific disease prevalence rates to prevalence rates for both sexes, times the total cost of disease. f. Total cost estimates account for both type 1 and type 2 diabetes, as prevalence figures for each type were not available. Note: n.a. = not applicable.
Overweight and Obesity in Saudi Arabia
TABLE 5.2


