Forecasting the Health Burden of Overweight and Obesity on Noncommunicable Diseases in Saudi Arabia
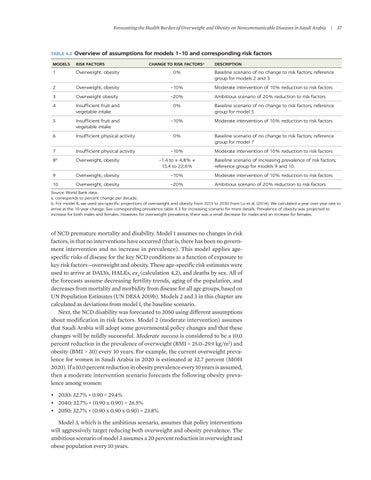
TABLE 4.2
|
37
Overview of assumptions for models 1–10 and corresponding risk factors
MODELS
RISK FACTORS
CHANGE TO RISK FACTORSa
1
Overweight. obesity
0%
Baseline scenario of no change to risk factors; reference group for models 2 and 3
DESCRIPTION
2
Overweight, obesity
–10%
Moderate intervention of 10% reduction to risk factors
3
Overweight obesity
–20%
Ambitious scenario of 20% reduction to risk factors
4
Insufficient fruit and vegetable intake
0%
Baseline scenario of no change to risk factors; reference group for model 5
5
Insufficient fruit and vegetable intake
–10%
Moderate intervention of 10% reduction to risk factors
6
Insufficient physical activity
0%
Baseline scenario of no change to risk factors; reference group for model 7
7
Insufficient physical activity
–10%
Moderate intervention of 10% reduction to risk factors
8b
Overweight, obesity
–1.4 to + 4.8% + 15.4 to 22.6%
9
Overweight, obesity
–10%
Moderate intervention of 10% reduction to risk factors
10
Overweight, obesity
–20%
Ambitious scenario of 20% reduction to risk factors
Baseline scenario of increasing prevalence of risk factors; reference group for models 9 and 10.
Source: World Bank data. a. corresponds to percent change per decade. b. For model 8, we used sex-specific projections of overweight and obesity from 2013 to 2030 from Lo et al. (2014). We calculated a year over year rate to arrive at the 10-year change. See corresponding prevalence table 4.3 for increasing scenario for more details. Prevalence of obesity was projected to increase for both males and females. However, for overweight prevalence, there was a small decrease for males and an increase for females.
of NCD premature mortality and disability. Model 1 assumes no changes in risk factors, in that no interventions have occurred (that is, there has been no government intervention and no increase in prevalence). This model applies age- specific risks of disease for the key NCD conditions as a function of exposure to key risk factors—overweight and obesity. These age-specific risk estimates were used to arrive at DALYs, HALEs, ex0 (calculation 4.2), and deaths by sex. All of the forecasts assume decreasing fertility trends, aging of the population, and decreases from mortality and morbidity from disease for all age groups, based on UN Population Estimates (UN DESA 2019b). Models 2 and 3 in this chapter are calculated as deviations from model 1, the baseline scenario. Next, the NCD disability was forecasted to 2050 using different assumptions about modification in risk factors. Model 2 (moderate intervention) assumes that Saudi Arabia will adopt some governmental policy changes and that these changes will be mildly successful. Moderate success is considered to be a 10.0 percent reduction in the prevalence of overweight (BMI = 25.0–29.9 kg/m2) and obesity (BMI > 30) every 10 years. For example, the current overweight prevalence for women in Saudi Arabia in 2020 is estimated at 32.7 percent (MOH 2020). If a 10.0 percent reduction in obesity prevalence every 10 years is assumed, then a moderate intervention scenario forecasts the following obesity prevalence among women: • 2030: 32.7% × 0.90 = 29.4% • 2040: 32.7% × (0.90 x 0.90) = 26.5% • 2050: 32.7% × (0.90 x 0.90 x 0.90) = 23.8% Model 3, which is the ambitious scenario, assumes that policy interventions will aggressively target reducing both overweight and obesity prevalence. The ambitious scenario of model 3 assumes a 20 percent reduction in overweight and obese population every 10 years.


