Overweight and Obesity in Saudi Arabia

Page 47

Determinants of Overweight and Obesity in Saudi Arabia

spending more than two hours on a screen (Al-Hazzaa 2018). A study of Saudi children ages 6–13 years showed the mean of screen viewing time to be 3.23 (plus or minus 1.7) hours per day, with boys showing significantly higher screen viewing time than girls. This study suggested that excessive screen time increased the chances of children going late to bed, reduced their total night’s sleep, and impacted negatively on breakfast intake (Al-Hazzaa et al. 2019). Close to 75 percent of Saudi adolescents reported screen time of at least two hours a day, and 23.9 percent reported viewing screens 6 hours or more per day (Saquib et al. 2017). The finding that Saudi women are much less active than Saudi men applies to adolescents also. The systematic review by Al-Hazzaa (2018) further found the average prevalence of physical activity to be somewhat moderate (55.5 percent) among adolescent males and very low among adolescent females (21.9 percent). It also showed that physical activity correlated with healthy dietary habits (breakfast, fruit, vegetables, and milk intakes), while sedentary behaviors were associated with greater consumption of sugar-sweetened drinks, fast foods, cake and doughnuts, and energy drinks among Saudi adolescents. The most important reasons for engaging in physical activity among adolescents are health, losing or maintaining weight, recreation, and socializing. The most important barrier to practicing physical activity is the lack of time, followed by the lack of an appropriate place (especially for female adolescents) and the lack of facility and resources. Female adolescents exercise mostly at home, while males exercise mostly in public areas, commonly with their friends.

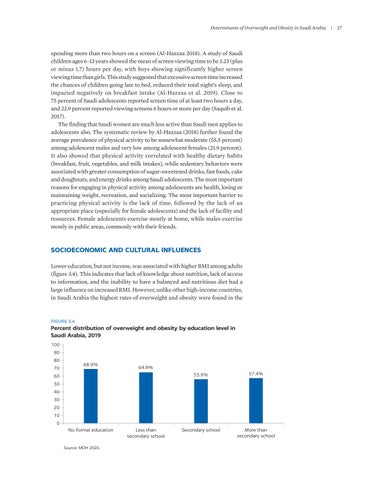
SOCIOECONOMIC AND CULTURAL INFLUENCES Lower education, but not income, was associated with higher BMI among adults (figure 3.4). This indicates that lack of knowledge about nutrition, lack of access to information, and the inability to have a balanced and nutritious diet had a large influence on increased BMI. However, unlike other high-income countries, in Saudi Arabia the highest rates of overweight and obesity were found in the

FIGURE 3.4

Percent distribution of overweight and obesity by education level in Saudi Arabia, 2019 100 90 80 70

68.9%

64.9%

60

55.9%

57.4%

Secondary school

More than secondary school

50 40 30 20 10 0 No formal education

Source: MOH 2020.

Less than secondary school

|

27


Turn static files into dynamic content formats.

Create a flipbook

Articles inside

8A.5 Example of UK multiple traffic light front-of-package labeling

5min
pages 177-178

Annex 8A: Case studies of countries with integrated and systems-based strategies Annex 8B: Examples of applied or recommended nutrient

2min
page 172

8.7 Stage 2: Increase the intake of healthy foods in Saudi Arabia 8A.2 Complete set of black seal labels that might be applied on front-of-package

7min
pages 168-170

8A.3 Example of campaign among public health advocates in support of Mexico’s front-of-package labeling regulation 8A.4 Example of cereal before (left) and after (right) Chile’s food labeling and

1min
page 175

labeling for Mexico based on product characteristics

1min
page 174

marketing law

1min
page 176

8A.1 Example of campaign material by advocates for the sugar-sweetened beverages tax to fund drinking fountains in schools

1min
page 173

Applying a Saudi-specific NPM for transforming the food system

2min
page 166

8.6 Stage 1: Reduce the intake of unhealthy foods in Saudi Arabia

2min
page 167

approaches

4min
pages 161-162

in Saudi Arabia and Chile

5min
pages 159-160

References

22min
pages 142-150

healthy diets

2min
page 152

per capita per day), 2010–19

1min
page 154

products

2min
page 153

Conclusions

2min
page 139

reformulation in Saudi Arabia

7min
pages 134-136

7.5 Saudi Arabia’s voluntary traffic light label, 2018

4min
pages 132-133

7A.2 Examples of different tax designs and evidence on their effectiveness

2min
page 141

Key lessons learned from global experiences

2min
page 138

7.3 Trends in carbonated drink volume per capita sales (liters), 2010–18

4min
pages 127-128

Obesity-prevention policies and their effectiveness evidence

2min
page 124

References

17min
pages 114-120

of COVID-19

9min
pages 109-112

Conclusions

2min
page 113

Summary and conclusions

3min
pages 95-96

The impact of obesity on COVID-19

2min
page 102

References

5min
pages 98-100

Estimating the economic burden using the economic growth approach method

2min
page 94

Estimating the economic burden using the value-of-a-statistical-life method

5min
pages 92-93

obesity

5min
pages 90-91

method

2min
page 87

Annex 4B: Supplementary details for intervention assumptions

2min
page 78

5.2 Direct medical costs attributable to overweight

1min
page 88

Key messages

1min
page 85

Results

2min
page 60

risk factors

5min
pages 57-58

Methods

2min
page 55

References

7min
pages 50-52

and obesity

2min
page 44

References

5min
pages 37-38

Socioeconomic and cultural influences

4min
pages 47-48

Dietary behaviors contributing to overweight and obesity Physical inactivity as a risk factor in the development of overweight

8min
pages 41-43

ages 5–9 years, by sex, 1975–2016

1min
page 30

2 Engagement of men and women in sufficient physical activity in

2min
page 23
Issuu converts static files into: digital portfolios, online yearbooks, online catalogs, digital photo albums and more. Sign up and create your flipbook.