Overweight and Obesity in Saudi Arabia

Page 30

10

|

Overweight and Obesity in Saudi Arabia

FIGURE 2.3

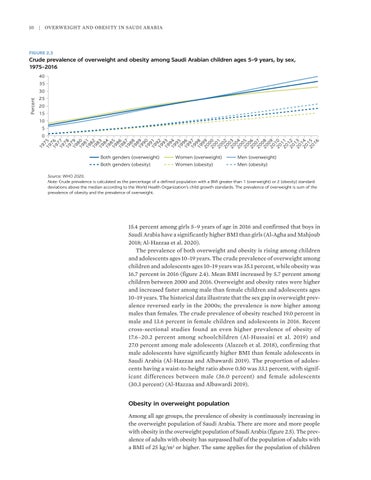
Crude prevalence of overweight and obesity among Saudi Arabian children ages 5–9 years, by sex, 1975–2016 40 35 25 20 15 10 5 0

19 7 19 5 7 19 6 7 19 7 7 19 8 7 19 9 8 19 0 8 19 1 8 19 2 8 19 3 8 19 4 8 19 5 8 19 6 8 19 7 8 19 8 8 19 9 9 19 0 9 19 1 9 19 2 93 19 9 19 4 9 19 5 9 19 6 9 19 7 9 19 8 9 20 9 00 20 0 20 1 0 20 2 0 20 3 04 20 0 20 5 0 20 6 0 20 7 0 20 8 0 20 9 1 20 0 1 20 1 1 20 2 1 20 3 1 20 4 1 20 5 16

Percent

30

Both genders (overweight) Both genders (obesity)

Women (overweight) Women (obesity)

Men (overweight) Men (obesity)

Source: WHO 2020. Note: Crude prevalence is calculated as the ­percentage of a defined population with a BMI greater than 1 (overweight) or 2 (obesity) standard deviations above the median according to the World Health Organization’s child growth standards. The prevalence of overweight is sum of the prevalence of obesity and the prevalence of overweight.

15.4 ­percent among girls 5–9 years of age in 2016 and confirmed that boys in Saudi Arabia have a significantly higher BMI than girls (Al-Agha and Mahjoub 2018; Al-Hazzaa et al. 2020). The prevalence of both overweight and obesity is rising among children and adolescents ages 10–19 years. The crude prevalence of overweight among children and adolescents ages 10–19 years was 35.1 ­percent, while obesity was 16.7 ­percent in 2016 (figure 2.4). Mean BMI increased by 5.7 ­percent among children between 2000 and 2016. Overweight and obesity rates were higher and increased faster among male than female children and adolescents ages 10–19 years. The historical data illustrate that the sex gap in overweight prevalence reversed early in the 2000s; the prevalence is now higher among males than females. The crude prevalence of obesity reached 19.0 ­percent in male and 13.6 ­percent in female children and adolescents in 2016. Recent cross-sectional studies found an even higher prevalence of obesity of 17.6–20.2 ­p ercent among schoolchildren (Al-Hussaini et al. 2019) and 27.0 ­percent among male adolescents (Alazzeh et al. 2018), confirming that male adolescents have significantly higher BMI than female adolescents in Saudi Arabia (Al-Hazzaa and Albawardi 2019). The proportion of adolescents having a waist-to-height ratio above 0.50 was 33.1 ­percent, with significant differences between male (36.0 ­p ercent) and female adolescents (30.3 ­percent) (Al-Hazzaa and Albawardi 2019).

Obesity in overweight population Among all age groups, the prevalence of obesity is continuously increasing in the overweight population of Saudi Arabia. There are more and more people with obesity in the overweight population of Saudi Arabia (figure 2.5). The prevalence of adults with obesity has surpassed half of the population of adults with a BMI of 25 kg/m2 or higher. The same applies for the population of children


Turn static files into dynamic content formats.

Create a flipbook

Articles inside

8A.5 Example of UK multiple traffic light front-of-package labeling

5min
pages 177-178

Annex 8A: Case studies of countries with integrated and systems-based strategies Annex 8B: Examples of applied or recommended nutrient

2min
page 172

8.7 Stage 2: Increase the intake of healthy foods in Saudi Arabia 8A.2 Complete set of black seal labels that might be applied on front-of-package

7min
pages 168-170

8A.3 Example of campaign among public health advocates in support of Mexico’s front-of-package labeling regulation 8A.4 Example of cereal before (left) and after (right) Chile’s food labeling and

1min
page 175

labeling for Mexico based on product characteristics

1min
page 174

marketing law

1min
page 176

8A.1 Example of campaign material by advocates for the sugar-sweetened beverages tax to fund drinking fountains in schools

1min
page 173

Applying a Saudi-specific NPM for transforming the food system

2min
page 166

8.6 Stage 1: Reduce the intake of unhealthy foods in Saudi Arabia

2min
page 167

approaches

4min
pages 161-162

in Saudi Arabia and Chile

5min
pages 159-160

References

22min
pages 142-150

healthy diets

2min
page 152

per capita per day), 2010–19

1min
page 154

products

2min
page 153

Conclusions

2min
page 139

reformulation in Saudi Arabia

7min
pages 134-136

7.5 Saudi Arabia’s voluntary traffic light label, 2018

4min
pages 132-133

7A.2 Examples of different tax designs and evidence on their effectiveness

2min
page 141

Key lessons learned from global experiences

2min
page 138

7.3 Trends in carbonated drink volume per capita sales (liters), 2010–18

4min
pages 127-128

Obesity-prevention policies and their effectiveness evidence

2min
page 124

References

17min
pages 114-120

of COVID-19

9min
pages 109-112

Conclusions

2min
page 113

Summary and conclusions

3min
pages 95-96

The impact of obesity on COVID-19

2min
page 102

References

5min
pages 98-100

Estimating the economic burden using the economic growth approach method

2min
page 94

Estimating the economic burden using the value-of-a-statistical-life method

5min
pages 92-93

obesity

5min
pages 90-91

method

2min
page 87

Annex 4B: Supplementary details for intervention assumptions

2min
page 78

5.2 Direct medical costs attributable to overweight

1min
page 88

Key messages

1min
page 85

Results

2min
page 60

risk factors

5min
pages 57-58

Methods

2min
page 55

References

7min
pages 50-52

and obesity

2min
page 44

References

5min
pages 37-38

Socioeconomic and cultural influences

4min
pages 47-48

Dietary behaviors contributing to overweight and obesity Physical inactivity as a risk factor in the development of overweight

8min
pages 41-43

ages 5–9 years, by sex, 1975–2016

1min
page 30

2 Engagement of men and women in sufficient physical activity in

2min
page 23
Issuu converts static files into: digital portfolios, online yearbooks, online catalogs, digital photo albums and more. Sign up and create your flipbook.