Overweight and Obesity in Saudi Arabia

Page 177

Food Systems Approach to Nutrition Policies in Saudi Arabia

This finding, in contrast to Mexico’s experience, highlights the need for sufficiently large price changes to result in measurable responses. There is ongoing discussion around furthering policy integration efforts by linking the tax designs in Chile with its Food Labeling and Marketing Law. Simulations of expanding the tax to include unhealthy processed foods in Chile show that with such a tax, in line with food labeling and marketing regulations, household purchases of these items would fall dramatically (Caro et al. 2017; Colchero, Paraje, and Popkin 2020). In addition, there would be reductions in nutrients of concern in Chile (sugar, sodium, saturated fats, and calories) linked with the most common NCDs (Caro et al. 2017).

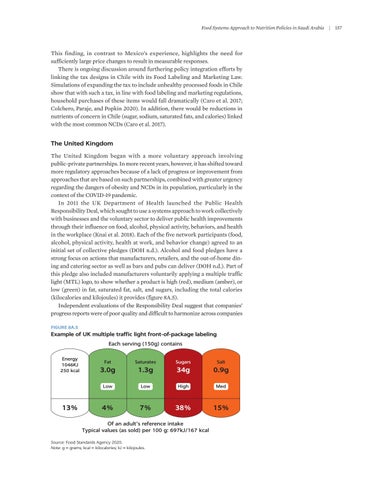
The United Kingdom The United Kingdom began with a more voluntary approach involving ­public-private partnerships. In more recent years, however, it has shifted toward more regulatory approaches because of a lack of progress or improvement from approaches that are based on such partnerships, combined with greater urgency regarding the dangers of obesity and NCDs in its population, particularly in the context of the COVID-19 pandemic. In 2011 the UK Department of Health launched the Public Health Responsibility Deal, which sought to use a systems approach to work collectively with businesses and the voluntary sector to deliver public health improvements through their influence on food, alcohol, physical activity, behaviors, and health in the workplace (Knai et al. 2018). Each of the five network participants (food, alcohol, physical activity, health at work, and behavior change) agreed to an initial set of collective pledges (DOH n.d.). Alcohol and food pledges have a strong focus on actions that manufacturers, retailers, and the out-of-home dining and catering sector as well as bars and pubs can deliver (DOH n.d.). Part of this pledge also included manufacturers voluntarily applying a multiple traffic light (MTL) logo, to show whether a product is high (red), medium (amber), or low (green) in fat, saturated fat, salt, and sugars, including the total calories (kilocalories and kilojoules) it provides (figure 8A.5). Independent evaluations of the Responsibility Deal suggest that companies’ progress reports were of poor quality and difficult to harmonize across companies FIGURE 8A.5

Example of UK multiple traffic light front-of-package labeling Each serving (150g) contains Energy 1046KJ 250 kcal

13%

Fat

Saturates

Sugars

Salt

3.0g

1.3g

34g

0.9g

Low

Low

High

Med

4%

7%

38%

15%

Of an adult’s reference intake Typical values (as sold) per 100 g: 697kJ/167 kcal Source: Food Standards Agency 2020. Note: g = grams; kcal = kilocalories; kJ = kilojoules.

|

157


Turn static files into dynamic content formats.

Create a flipbook

Articles inside

8A.5 Example of UK multiple traffic light front-of-package labeling

5min
pages 177-178

Annex 8A: Case studies of countries with integrated and systems-based strategies Annex 8B: Examples of applied or recommended nutrient

2min
page 172

8.7 Stage 2: Increase the intake of healthy foods in Saudi Arabia 8A.2 Complete set of black seal labels that might be applied on front-of-package

7min
pages 168-170

8A.3 Example of campaign among public health advocates in support of Mexico’s front-of-package labeling regulation 8A.4 Example of cereal before (left) and after (right) Chile’s food labeling and

1min
page 175

labeling for Mexico based on product characteristics

1min
page 174

marketing law

1min
page 176

8A.1 Example of campaign material by advocates for the sugar-sweetened beverages tax to fund drinking fountains in schools

1min
page 173

Applying a Saudi-specific NPM for transforming the food system

2min
page 166

8.6 Stage 1: Reduce the intake of unhealthy foods in Saudi Arabia

2min
page 167

approaches

4min
pages 161-162

in Saudi Arabia and Chile

5min
pages 159-160

References

22min
pages 142-150

healthy diets

2min
page 152

per capita per day), 2010–19

1min
page 154

products

2min
page 153

Conclusions

2min
page 139

reformulation in Saudi Arabia

7min
pages 134-136

7.5 Saudi Arabia’s voluntary traffic light label, 2018

4min
pages 132-133

7A.2 Examples of different tax designs and evidence on their effectiveness

2min
page 141

Key lessons learned from global experiences

2min
page 138

7.3 Trends in carbonated drink volume per capita sales (liters), 2010–18

4min
pages 127-128

Obesity-prevention policies and their effectiveness evidence

2min
page 124

References

17min
pages 114-120

of COVID-19

9min
pages 109-112

Conclusions

2min
page 113

Summary and conclusions

3min
pages 95-96

The impact of obesity on COVID-19

2min
page 102

References

5min
pages 98-100

Estimating the economic burden using the economic growth approach method

2min
page 94

Estimating the economic burden using the value-of-a-statistical-life method

5min
pages 92-93

obesity

5min
pages 90-91

method

2min
page 87

Annex 4B: Supplementary details for intervention assumptions

2min
page 78

5.2 Direct medical costs attributable to overweight

1min
page 88

Key messages

1min
page 85

Results

2min
page 60

risk factors

5min
pages 57-58

Methods

2min
page 55

References

7min
pages 50-52

and obesity

2min
page 44

References

5min
pages 37-38

Socioeconomic and cultural influences

4min
pages 47-48

Dietary behaviors contributing to overweight and obesity Physical inactivity as a risk factor in the development of overweight

8min
pages 41-43

ages 5–9 years, by sex, 1975–2016

1min
page 30

2 Engagement of men and women in sufficient physical activity in

2min
page 23
Issuu converts static files into: digital portfolios, online yearbooks, online catalogs, digital photo albums and more. Sign up and create your flipbook.
Overweight and Obesity in Saudi Arabia by World Bank Publications - Issuu