Overweight and Obesity in Saudi Arabia

Page 173

Food Systems Approach to Nutrition Policies in Saudi Arabia

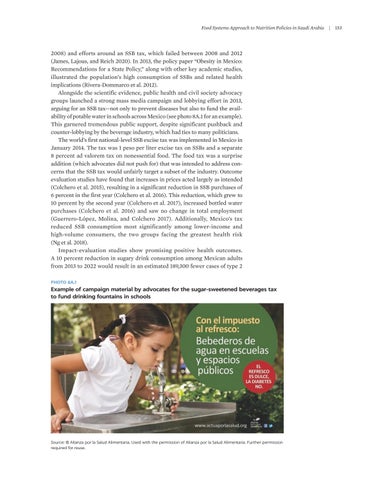
2008) and efforts around an SSB tax, which failed between 2008 and 2012 (James, Lajous, and Reich 2020). In 2013, the policy paper “Obesity in Mexico: Recommendations for a State Policy,” along with other key academic studies, illustrated the population’s high consumption of SSBs and related health implications (Rivera-Dommarco et al. 2012). Alongside the scientific evidence, public health and civil society advocacy groups launched a strong mass media campaign and lobbying effort in 2013, arguing for an SSB tax—not only to prevent diseases but also to fund the availability of potable water in schools across Mexico (see photo 8A.1 for an example). This garnered tremendous public support, despite significant pushback and counter-lobbying by the beverage industry, which had ties to many politicians. The world’s first national-level SSB excise tax was implemented in Mexico in January 2014. The tax was 1 peso per liter excise tax on SSBs and a separate 8 percent ad valorem tax on nonessential food. The food tax was a surprise addition (which advocates did not push for) that was intended to address concerns that the SSB tax would unfairly target a subset of the industry. Outcome evaluation studies have found that increases in prices acted largely as intended (Colchero et al. 2015), resulting in a significant reduction in SSB purchases of 6 percent in the first year (Colchero et al. 2016). This reduction, which grew to 10 percent by the second year (Colchero et al. 2017), increased bottled water purchases (Colchero et al. 2016) and saw no change in total employment (Guerrero-López, Molina, and Colchero 2017). Additionally, Mexico’s tax reduced SSB consumption most significantly among lower-income and high-volume consumers, the two groups facing the greatest health risk (Ng et al. 2018). Impact-evaluation studies show promising positive health outcomes. A 10 percent reduction in sugary drink consumption among Mexican adults from 2013 to 2022 would result in an estimated 189,300 fewer cases of type 2 PHOTO 8A.1

Example of campaign material by advocates for the sugar-sweetened beverages tax to fund drinking fountains in schools

Source: © Alianza por la Salud Alimentaria. Used with the permission of Alianza por la Salud Alimentaria. Further permission required for reuse.

|

153


Turn static files into dynamic content formats.

Create a flipbook

Articles inside

8A.5 Example of UK multiple traffic light front-of-package labeling

5min
pages 177-178

Annex 8A: Case studies of countries with integrated and systems-based strategies Annex 8B: Examples of applied or recommended nutrient

2min
page 172

8.7 Stage 2: Increase the intake of healthy foods in Saudi Arabia 8A.2 Complete set of black seal labels that might be applied on front-of-package

7min
pages 168-170

8A.3 Example of campaign among public health advocates in support of Mexico’s front-of-package labeling regulation 8A.4 Example of cereal before (left) and after (right) Chile’s food labeling and

1min
page 175

labeling for Mexico based on product characteristics

1min
page 174

marketing law

1min
page 176

8A.1 Example of campaign material by advocates for the sugar-sweetened beverages tax to fund drinking fountains in schools

1min
page 173

Applying a Saudi-specific NPM for transforming the food system

2min
page 166

8.6 Stage 1: Reduce the intake of unhealthy foods in Saudi Arabia

2min
page 167

approaches

4min
pages 161-162

in Saudi Arabia and Chile

5min
pages 159-160

References

22min
pages 142-150

healthy diets

2min
page 152

per capita per day), 2010–19

1min
page 154

products

2min
page 153

Conclusions

2min
page 139

reformulation in Saudi Arabia

7min
pages 134-136

7.5 Saudi Arabia’s voluntary traffic light label, 2018

4min
pages 132-133

7A.2 Examples of different tax designs and evidence on their effectiveness

2min
page 141

Key lessons learned from global experiences

2min
page 138

7.3 Trends in carbonated drink volume per capita sales (liters), 2010–18

4min
pages 127-128

Obesity-prevention policies and their effectiveness evidence

2min
page 124

References

17min
pages 114-120

of COVID-19

9min
pages 109-112

Conclusions

2min
page 113

Summary and conclusions

3min
pages 95-96

The impact of obesity on COVID-19

2min
page 102

References

5min
pages 98-100

Estimating the economic burden using the economic growth approach method

2min
page 94

Estimating the economic burden using the value-of-a-statistical-life method

5min
pages 92-93

obesity

5min
pages 90-91

method

2min
page 87

Annex 4B: Supplementary details for intervention assumptions

2min
page 78

5.2 Direct medical costs attributable to overweight

1min
page 88

Key messages

1min
page 85

Results

2min
page 60

risk factors

5min
pages 57-58

Methods

2min
page 55

References

7min
pages 50-52

and obesity

2min
page 44

References

5min
pages 37-38

Socioeconomic and cultural influences

4min
pages 47-48

Dietary behaviors contributing to overweight and obesity Physical inactivity as a risk factor in the development of overweight

8min
pages 41-43

ages 5–9 years, by sex, 1975–2016

1min
page 30

2 Engagement of men and women in sufficient physical activity in

2min
page 23
Issuu converts static files into: digital portfolios, online yearbooks, online catalogs, digital photo albums and more. Sign up and create your flipbook.