Overweight and Obesity in Saudi Arabia

Page 159

Food Systems Approach to Nutrition Policies in Saudi Arabia

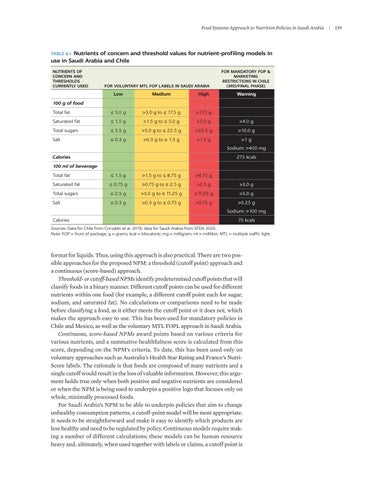
TABLE 8.1 Nutrients of concern and threshold values for nutrient-profiling models in use in Saudi Arabia and Chile NUTRIENTS OF CONCERN AND THRESHOLDS CURRENTLY USED

FOR VOLUNTARY MTL FOP LABELS IN SAUDI ARABIA

FOR MANDATORY FOP & MARKETING RESTRICTIONS IN CHILE (3RD/FINAL PHASE)

Low

Medium

High

Warning

Total fat

≤ 3.0 g

>3.0 g to ≤ 17.5 g

>17.5 g

Saturated fat

≤ 1.5 g

>1.5 g to ≤ 5.0 g

>5.0 g

>4.0 g

Total sugars

≤ 5.5 g

>5.0 g to ≤ 22.5 g

>22.5 g

>10.0 g

Salt

≤ 0.3 g

>0.3 g to ≤ 1.5 g

>1.5 g

100 g of food

>1 g Sodium: >400 mg

Calories

275 kcals

100 ml of beverage Total fat

≤ 1.5 g

>1.5 g to ≤ 8.75 g

>8.75 g

Saturated fat

≤ 0.75 g

>0.75 g to ≤ 2.5 g

>2.5 g

>3.0 g

Total sugars

≤ 2.5 g

>5.0 g to ≤ 11.25 g

>11.25 g

>5.0 g

Salt

≤ 0.3 g

>0.3 g to ≤ 0.75 g

>0.75 g

>0.25 g Sodium: >100 mg

Calories

70 kcals

Sources: Data for Chile from Corvalán et al. 2019; data for Saudi Arabia from SFDA 2020. Note: FOP = front of package; g = grams; kcal = kilocalorie; mg = milligram; ml = milliliter; MTL = multiple traffic light.

format for liquids. Thus, using this approach is also practical. There are two possible approaches for the proposed NPM: a threshold (cutoff point) approach and a continuous (score-based) approach. Threshold- or cutoff-based NPMs identify predetermined cutoff points that will classify foods in a binary manner. Different cutoff points can be used for different nutrients within one food (for example, a different cutoff point each for sugar, sodium, and saturated fat). No calculations or comparisons need to be made before classifying a food, as it either meets the cutoff point or it does not, which makes the approach easy to use. This has been used for mandatory policies in Chile and Mexico, as well as the voluntary MTL FOPL approach in Saudi Arabia. Continuous, score-based NPMs award points based on various criteria for various nutrients, and a summative healthfulness score is calculated from this score, depending on the NPM’s criteria. To date, this has been used only on voluntary approaches such as Australia’s Health Star Rating and France’s NutriScore labels. The rationale is that foods are composed of many nutrients and a single cutoff would result in the loss of valuable information. However, this argument holds true only when both positive and negative nutrients are considered or when the NPM is being used to underpin a positive logo that focuses only on whole, minimally processed foods. For Saudi Arabia’s NPM to be able to underpin policies that aim to change unhealthy consumption patterns, a cutoff-point model will be most appropriate. It needs to be straightforward and make it easy to identify which products are less healthy and need to be regulated by policy. Continuous models require making a number of different calculations; these models can be human resource heavy and, ultimately, when used together with labels or claims, a cutoff point is

|

139


Turn static files into dynamic content formats.

Create a flipbook

Articles inside

8A.5 Example of UK multiple traffic light front-of-package labeling

5min
pages 177-178

Annex 8A: Case studies of countries with integrated and systems-based strategies Annex 8B: Examples of applied or recommended nutrient

2min
page 172

8.7 Stage 2: Increase the intake of healthy foods in Saudi Arabia 8A.2 Complete set of black seal labels that might be applied on front-of-package

7min
pages 168-170

8A.3 Example of campaign among public health advocates in support of Mexico’s front-of-package labeling regulation 8A.4 Example of cereal before (left) and after (right) Chile’s food labeling and

1min
page 175

labeling for Mexico based on product characteristics

1min
page 174

marketing law

1min
page 176

8A.1 Example of campaign material by advocates for the sugar-sweetened beverages tax to fund drinking fountains in schools

1min
page 173

Applying a Saudi-specific NPM for transforming the food system

2min
page 166

8.6 Stage 1: Reduce the intake of unhealthy foods in Saudi Arabia

2min
page 167

approaches

4min
pages 161-162

in Saudi Arabia and Chile

5min
pages 159-160

References

22min
pages 142-150

healthy diets

2min
page 152

per capita per day), 2010–19

1min
page 154

products

2min
page 153

Conclusions

2min
page 139

reformulation in Saudi Arabia

7min
pages 134-136

7.5 Saudi Arabia’s voluntary traffic light label, 2018

4min
pages 132-133

7A.2 Examples of different tax designs and evidence on their effectiveness

2min
page 141

Key lessons learned from global experiences

2min
page 138

7.3 Trends in carbonated drink volume per capita sales (liters), 2010–18

4min
pages 127-128

Obesity-prevention policies and their effectiveness evidence

2min
page 124

References

17min
pages 114-120

of COVID-19

9min
pages 109-112

Conclusions

2min
page 113

Summary and conclusions

3min
pages 95-96

The impact of obesity on COVID-19

2min
page 102

References

5min
pages 98-100

Estimating the economic burden using the economic growth approach method

2min
page 94

Estimating the economic burden using the value-of-a-statistical-life method

5min
pages 92-93

obesity

5min
pages 90-91

method

2min
page 87

Annex 4B: Supplementary details for intervention assumptions

2min
page 78

5.2 Direct medical costs attributable to overweight

1min
page 88

Key messages

1min
page 85

Results

2min
page 60

risk factors

5min
pages 57-58

Methods

2min
page 55

References

7min
pages 50-52

and obesity

2min
page 44

References

5min
pages 37-38

Socioeconomic and cultural influences

4min
pages 47-48

Dietary behaviors contributing to overweight and obesity Physical inactivity as a risk factor in the development of overweight

8min
pages 41-43

ages 5–9 years, by sex, 1975–2016

1min
page 30

2 Engagement of men and women in sufficient physical activity in

2min
page 23
Issuu converts static files into: digital portfolios, online yearbooks, online catalogs, digital photo albums and more. Sign up and create your flipbook.
Overweight and Obesity in Saudi Arabia by World Bank Publications - Issuu