Overweight and Obesity in Saudi Arabia

Page 154

134

|

Overweight and Obesity in Saudi Arabia

FIGURE 8.2

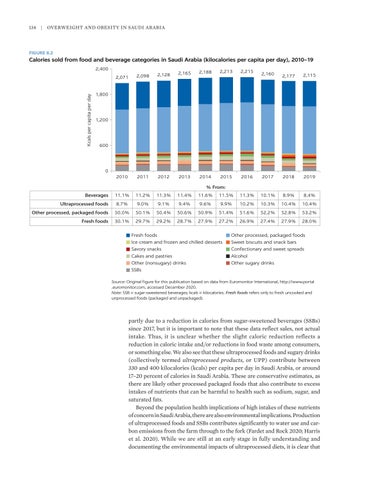
Calories sold from food and beverage categories in Saudi Arabia (kilocalories per capita per day), 2010–19

Kcals per capita per day

2,400 2,098

2,128

2,165

2,188

2,213

2,215

2,071

2010

2011

2012

2013

2014

2015

2016

2,160

2,177

2,115

2017

2018

2019

1,800

1,200

600

0 % From: Beverages Ultraprocessed foods

11.1%

11.2%

11.3%

11.4%

11.6%

11.5%

11.3%

10.1%

8.9%

8.4%

8.7%

9.0%

9.1%

9.4%

9.6%

9.9%

10.2%

10.3%

10.4%

10.4%

Other processed, packaged foods

50.0%

50.1%

50.4%

50.6%

50.9%

51.4%

51.6%

52.2%

52.8%

53.2%

Fresh foods

30.1%

29.7%

29.2%

28.7%

27.9%

27.2%

26.9%

27.4%

27.9%

28.0%

Fresh foods Ice cream and frozen and chilled desserts Savory snacks Cakes and pastries Other (nonsugary) drinks SSBs

Other processed, packaged foods Sweet biscuits and snack bars Confectionary and sweet spreads Alcohol Other sugary drinks

Source: Original figure for this publication based on data from Euromonitor International, http://www.portal​ .euromonitor.com, accessed December 2020. Note: SSB = sugar-sweetened beverages; kcals = kilocalories. Fresh foods refers only to fresh uncooked and unprocessed foods (packaged and unpackaged).

partly due to a reduction in calories from sugar-sweetened beverages (SSBs) since 2017, but it is important to note that these data reflect sales, not actual intake. Thus, it is unclear whether the slight caloric reduction reflects a reduction in caloric intake and/or reductions in food waste among consumers, or something else. We also see that these ultraprocessed foods and sugary drinks (collectively termed ultraprocessed products, or UPP) contribute between 330 and 400 kilocalories (kcals) per capita per day in Saudi Arabia, or around 17–20 percent of calories in Saudi Arabia. These are conservative estimates, as there are likely other processed packaged foods that also contribute to excess intakes of nutrients that can be harmful to health such as sodium, sugar, and saturated fats. Beyond the population health implications of high intakes of these nutrients of concern in Saudi Arabia, there are also environmental implications. Production of ultraprocessed foods and SSBs contributes significantly to water use and carbon emissions from the farm through to the fork (Fardet and Rock 2020; Harris et al. 2020). While we are still at an early stage in fully understanding and documenting the environmental impacts of ultraprocessed diets, it is clear that


Turn static files into dynamic content formats.

Create a flipbook

Articles inside

8A.5 Example of UK multiple traffic light front-of-package labeling

5min
pages 177-178

Annex 8A: Case studies of countries with integrated and systems-based strategies Annex 8B: Examples of applied or recommended nutrient

2min
page 172

8.7 Stage 2: Increase the intake of healthy foods in Saudi Arabia 8A.2 Complete set of black seal labels that might be applied on front-of-package

7min
pages 168-170

8A.3 Example of campaign among public health advocates in support of Mexico’s front-of-package labeling regulation 8A.4 Example of cereal before (left) and after (right) Chile’s food labeling and

1min
page 175

labeling for Mexico based on product characteristics

1min
page 174

marketing law

1min
page 176

8A.1 Example of campaign material by advocates for the sugar-sweetened beverages tax to fund drinking fountains in schools

1min
page 173

Applying a Saudi-specific NPM for transforming the food system

2min
page 166

8.6 Stage 1: Reduce the intake of unhealthy foods in Saudi Arabia

2min
page 167

approaches

4min
pages 161-162

in Saudi Arabia and Chile

5min
pages 159-160

References

22min
pages 142-150

healthy diets

2min
page 152

per capita per day), 2010–19

1min
page 154

products

2min
page 153

Conclusions

2min
page 139

reformulation in Saudi Arabia

7min
pages 134-136

7.5 Saudi Arabia’s voluntary traffic light label, 2018

4min
pages 132-133

7A.2 Examples of different tax designs and evidence on their effectiveness

2min
page 141

Key lessons learned from global experiences

2min
page 138

7.3 Trends in carbonated drink volume per capita sales (liters), 2010–18

4min
pages 127-128

Obesity-prevention policies and their effectiveness evidence

2min
page 124

References

17min
pages 114-120

of COVID-19

9min
pages 109-112

Conclusions

2min
page 113

Summary and conclusions

3min
pages 95-96

The impact of obesity on COVID-19

2min
page 102

References

5min
pages 98-100

Estimating the economic burden using the economic growth approach method

2min
page 94

Estimating the economic burden using the value-of-a-statistical-life method

5min
pages 92-93

obesity

5min
pages 90-91

method

2min
page 87

Annex 4B: Supplementary details for intervention assumptions

2min
page 78

5.2 Direct medical costs attributable to overweight

1min
page 88

Key messages

1min
page 85

Results

2min
page 60

risk factors

5min
pages 57-58

Methods

2min
page 55

References

7min
pages 50-52

and obesity

2min
page 44

References

5min
pages 37-38

Socioeconomic and cultural influences

4min
pages 47-48

Dietary behaviors contributing to overweight and obesity Physical inactivity as a risk factor in the development of overweight

8min
pages 41-43

ages 5–9 years, by sex, 1975–2016

1min
page 30

2 Engagement of men and women in sufficient physical activity in

2min
page 23
Issuu converts static files into: digital portfolios, online yearbooks, online catalogs, digital photo albums and more. Sign up and create your flipbook.