Overweight and Obesity in Saudi Arabia
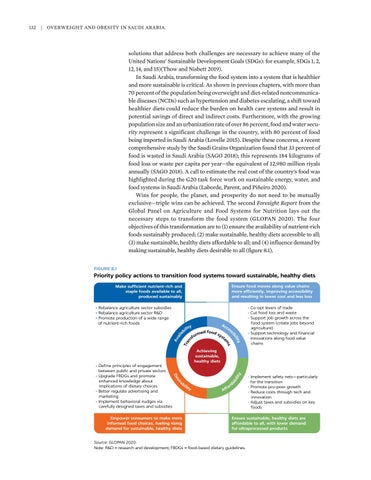
solutions that address both challenges are necessary to achieve many of the United Nations’ Sustainable Development Goals (SDGs): for example, SDGs 1, 2, 12, 14, and 15)(Thow and Nisbett 2019). In Saudi Arabia, transforming the food system into a system that is healthier and more sustainable is critical. As shown in previous chapters, with more than 70 percent of the population being overweight and diet-related noncommunicable diseases (NCDs) such as hypertension and diabetes escalating, a shift toward healthier diets could reduce the burden on health care systems and result in potential savings of direct and indirect costs. Furthermore, with the growing population size and an urbanization rate of over 86 percent, food and water security represent a significant challenge in the country, with 80 percent of food being imported in Saudi Arabia (Lovelle 2015). Despite these concerns, a recent comprehensive study by the Saudi Grains Organization found that 33 percent of food is wasted in Saudi Arabia (SAGO 2018); this represents 184 kilograms of food loss or waste per capita per year—the equivalent of 12,980 million riyals annually (SAGO 2018). A call to estimate the real cost of the country’s food was highlighted during the G20 task force work on sustainable energy, water, and food systems in Saudi Arabia (Laborde, Parent, and Piñeiro 2020). Wins for people, the planet, and prosperity do not need to be mutually exclusive—triple wins can be achieved. The second Foresight Report from the Global Panel on Agriculture and Food Systems for Nutrition lays out the necessary steps to transform the food system (GLOPAN 2020). The four objectives of this transformation are to (1) ensure the availability of nutrient-rich foods sustainably produced; (2) make sustainable, healthy diets accessible to all; (3) make sustainable, healthy diets affordable to all; and (4) influence demand by making sustainable, healthy diets desirable to all (figure 8.1). FIGURE 8.1
Priority policy actions to transition food systems toward sustainable, healthy diets Ensure food moves along value chains more efficiently, improving accessibility and resulting in lower cost and less loss
Make sufficient nutrient-rich and staple foods available to all, produced sustainably • Rebalance agriculture sector subsidies • Rebalance agriculture sector R&D • Promote production of a wide range of nutrient-rich foods
s em
y ilit ib
ed food s ys orm t sf
• Co-opt levers of trade • Cut food loss and waste • Support job growth across the food system (create jobs beyond agriculture) • Support technology and financial innovations along food value chains
y
Achieving sustainable, healthy diets
s ir
ab
Empower consumers to make more informed food choices, fueling rising demand for sustainable, healthy diets
ili t
De
• Define principles of engagement between public and private sectors • Upgrade FBDGs and promote enhanced knowledge about implications of dietary choices • Better regulate advertising and marketing • Implement behavioral nudges via carefully designed taxes and subsidies
Ac ce ss
y lit bi
ili
ab
|
Av ai la Tra n
132
ty
Af
fo
rd
• Implement safety nets—particularly for the transition • Promote pro-poor growth • Reduce costs through tech and innovation • Adjust taxes and subsidies on key foods
Ensure sustainable, healthy diets are affordable to all, with lower demand for ultraprocessed products
Source: GLOPAN 2020. Note: R&D = research and development; FBDGs = food-based dietary guidelines.


