Overweight and Obesity in Saudi Arabia

Page 141

Obesity-Prevention Strategies and Policies for Saudi Arabia

|

121

TABLE 7A.1, continued

EXAMPLES OF SITES WITH EXCISE TAXES

South Africa (since April 2018)

BRIEF DESCRIPTION OF TAX

PRICE CHANGE

VOLUME SALES OR PURCHASES CHANGE OF TAXED PRODUCTS

INTAKE CHANGE OF TAXED PRODUCTS

0.021 South African rand per gram of sugar in 100 milliliters of ready-to-drink SSBs above 4 g sugar excise tax.

OTHER CHANGES

REVENUE USE

OTHER GAPS IN KNOWLEDGE

↓ Sugar and calories

General budget (small percent given to Department of Health)

Impact of reformulations with artificially sweeteners unknown.

Source: Original table for this publication. Note: ↓ decrease; ↔ no effect; ↑ increase. NCDs = noncommunicable diseases; SSB = sugar-sweetened beverages; kcals = kilocalories; TBD = to be determined from ongoing research studies.
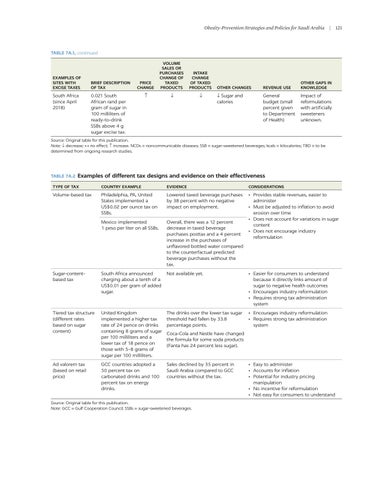
TABLE 7A.2

Examples of different tax designs and evidence on their effectiveness

TYPE OF TAX

COUNTRY EXAMPLE

EVIDENCE

CONSIDERATIONS

Volume-based tax

Philadelphia, PA, United States implemented a US$0.02 per ounce tax on SSBs.

Lowered taxed beverage purchases by 38 percent with no negative impact on employment.

Mexico implemented 1 peso per liter on all SSBs.

Overall, there was a 12 percent decrease in taxed beverage purchases posttax and a 4 percent increase in the purchases of unflavored bottled water compared to the counterfactual predicted beverage purchases without the tax.

• Provides stable revenues, easier to administer • Must be adjusted to inflation to avoid erosion over time • Does not account for variations in sugar content • Does not encourage industry reformulation

Sugar-contentbased tax

South Africa announced charging about a tenth of a US$0.01 per gram of added sugar.

Not available yet.

• Easier for consumers to understand because it directly links amount of sugar to negative health outcomes • Encourages industry reformulation • Requires strong tax administration system

Tiered tax structure (different rates based on sugar content)

United Kingdom implemented a higher tax rate of 24 pence on drinks containing 8 grams of sugar per 100 milliliters and a lower tax of 18 pence on those with 5–8 grams of sugar per 100 milliliters.

The drinks over the lower tax sugar threshold had fallen by 33.8 percentage points.

• Encourages industry reformulation • Requires strong tax administration system

Ad valorem tax (based on retail price)

GCC countries adopted a 50 percent tax on carbonated drinks and 100 percent tax on energy drinks.

Sales declined by 35 percent in Saudi Arabia compared to GCC countries without the tax.

Coca-Cola and Nestle have changed the formula for some soda products (Fanta has 24 percent less sugar).

Source: Original table for this publication. Note: GCC = Gulf Cooperation Council; SSBs = sugar-sweetened beverages.

• Easy to administer • Accounts for inflation • Potential for industry pricing manipulation • No incentive for reformulation • Not easy for consumers to understand


Turn static files into dynamic content formats.

Create a flipbook

Articles inside

8A.5 Example of UK multiple traffic light front-of-package labeling

5min
pages 177-178

Annex 8A: Case studies of countries with integrated and systems-based strategies Annex 8B: Examples of applied or recommended nutrient

2min
page 172

8.7 Stage 2: Increase the intake of healthy foods in Saudi Arabia 8A.2 Complete set of black seal labels that might be applied on front-of-package

7min
pages 168-170

8A.3 Example of campaign among public health advocates in support of Mexico’s front-of-package labeling regulation 8A.4 Example of cereal before (left) and after (right) Chile’s food labeling and

1min
page 175

labeling for Mexico based on product characteristics

1min
page 174

marketing law

1min
page 176

8A.1 Example of campaign material by advocates for the sugar-sweetened beverages tax to fund drinking fountains in schools

1min
page 173

Applying a Saudi-specific NPM for transforming the food system

2min
page 166

8.6 Stage 1: Reduce the intake of unhealthy foods in Saudi Arabia

2min
page 167

approaches

4min
pages 161-162

in Saudi Arabia and Chile

5min
pages 159-160

References

22min
pages 142-150

healthy diets

2min
page 152

per capita per day), 2010–19

1min
page 154

products

2min
page 153

Conclusions

2min
page 139

reformulation in Saudi Arabia

7min
pages 134-136

7.5 Saudi Arabia’s voluntary traffic light label, 2018

4min
pages 132-133

7A.2 Examples of different tax designs and evidence on their effectiveness

2min
page 141

Key lessons learned from global experiences

2min
page 138

7.3 Trends in carbonated drink volume per capita sales (liters), 2010–18

4min
pages 127-128

Obesity-prevention policies and their effectiveness evidence

2min
page 124

References

17min
pages 114-120

of COVID-19

9min
pages 109-112

Conclusions

2min
page 113

Summary and conclusions

3min
pages 95-96

The impact of obesity on COVID-19

2min
page 102

References

5min
pages 98-100

Estimating the economic burden using the economic growth approach method

2min
page 94

Estimating the economic burden using the value-of-a-statistical-life method

5min
pages 92-93

obesity

5min
pages 90-91

method

2min
page 87

Annex 4B: Supplementary details for intervention assumptions

2min
page 78

5.2 Direct medical costs attributable to overweight

1min
page 88

Key messages

1min
page 85

Results

2min
page 60

risk factors

5min
pages 57-58

Methods

2min
page 55

References

7min
pages 50-52

and obesity

2min
page 44

References

5min
pages 37-38

Socioeconomic and cultural influences

4min
pages 47-48

Dietary behaviors contributing to overweight and obesity Physical inactivity as a risk factor in the development of overweight

8min
pages 41-43

ages 5–9 years, by sex, 1975–2016

1min
page 30

2 Engagement of men and women in sufficient physical activity in

2min
page 23
Issuu converts static files into: digital portfolios, online yearbooks, online catalogs, digital photo albums and more. Sign up and create your flipbook.