Overweight and Obesity in Saudi Arabia

Page 127

Obesity-Prevention Strategies and Policies for Saudi Arabia

FIGURE 7.3

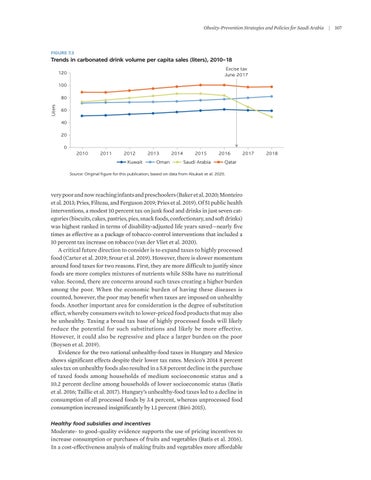
Trends in carbonated drink volume per capita sales (liters), 2010–18 Excise tax June 2017

120 100

Liters

80 60 40 20 0 2010

2011

2012

2013

Kuwait

Oman

2014

2015 Saudi Arabia

2016

2017

Qatar

Source: Original figure for this publication, based on data from Alsukait et al. 2020.

very poor and now reaching infants and preschoolers (Baker et al. 2020; Monteiro et al. 2013; Pries, Filteau, and Ferguson 2019; Pries et al. 2019). Of 51 public health interventions, a modest 10 percent tax on junk food and drinks in just seven categories (biscuits, cakes, pastries, pies, snack foods, confectionary, and soft drinks) was highest ranked in terms of disability-adjusted life years saved—nearly five times as effective as a package of tobacco-control interventions that included a 10 percent tax increase on tobacco (van der Vliet et al. 2020). A critical future direction to consider is to expand taxes to highly processed food (Carter et al. 2019; Srour et al. 2019). However, there is slower momentum around food taxes for two reasons. First, they are more difficult to justify since foods are more complex mixtures of nutrients while SSBs have no nutritional value. Second, there are concerns around such taxes creating a higher burden among the poor. When the economic burden of having these diseases is counted, however, the poor may benefit when taxes are imposed on unhealthy foods. Another important area for consideration is the degree of substitution effect, whereby consumers switch to lower-priced food products that may also be unhealthy. Taxing a broad tax base of highly processed foods will likely reduce the potential for such substitutions and likely be more effective. However, it could also be regressive and place a larger burden on the poor (Boysen et al. 2019). Evidence for the two national unhealthy-food taxes in Hungary and Mexico shows significant effects despite their lower tax rates. Mexico’s 2014 8 percent sales tax on unhealthy foods also resulted in a 5.8 percent decline in the purchase of taxed foods among households of medium socioeconomic status and a 10.2 percent decline among households of lower socioeconomic status (Batis et al. 2016; Taillie et al. 2017). Hungary’s unhealthy-food taxes led to a decline in consumption of all processed foods by 3.4 percent, whereas unprocessed food consumption increased insignificantly by 1.1 percent (Bíró 2015). Healthy food subsidies and incentives

Moderate- to good-quality evidence supports the use of pricing incentives to increase consumption or purchases of fruits and vegetables (Batis et al. 2016). In a cost-effectiveness analysis of making fruits and vegetables more affordable

2018

|

107


Turn static files into dynamic content formats.

Create a flipbook

Articles inside

8A.5 Example of UK multiple traffic light front-of-package labeling

5min
pages 177-178

Annex 8A: Case studies of countries with integrated and systems-based strategies Annex 8B: Examples of applied or recommended nutrient

2min
page 172

8.7 Stage 2: Increase the intake of healthy foods in Saudi Arabia 8A.2 Complete set of black seal labels that might be applied on front-of-package

7min
pages 168-170

8A.3 Example of campaign among public health advocates in support of Mexico’s front-of-package labeling regulation 8A.4 Example of cereal before (left) and after (right) Chile’s food labeling and

1min
page 175

labeling for Mexico based on product characteristics

1min
page 174

marketing law

1min
page 176

8A.1 Example of campaign material by advocates for the sugar-sweetened beverages tax to fund drinking fountains in schools

1min
page 173

Applying a Saudi-specific NPM for transforming the food system

2min
page 166

8.6 Stage 1: Reduce the intake of unhealthy foods in Saudi Arabia

2min
page 167

approaches

4min
pages 161-162

in Saudi Arabia and Chile

5min
pages 159-160

References

22min
pages 142-150

healthy diets

2min
page 152

per capita per day), 2010–19

1min
page 154

products

2min
page 153

Conclusions

2min
page 139

reformulation in Saudi Arabia

7min
pages 134-136

7.5 Saudi Arabia’s voluntary traffic light label, 2018

4min
pages 132-133

7A.2 Examples of different tax designs and evidence on their effectiveness

2min
page 141

Key lessons learned from global experiences

2min
page 138

7.3 Trends in carbonated drink volume per capita sales (liters), 2010–18

4min
pages 127-128

Obesity-prevention policies and their effectiveness evidence

2min
page 124

References

17min
pages 114-120

of COVID-19

9min
pages 109-112

Conclusions

2min
page 113

Summary and conclusions

3min
pages 95-96

The impact of obesity on COVID-19

2min
page 102

References

5min
pages 98-100

Estimating the economic burden using the economic growth approach method

2min
page 94

Estimating the economic burden using the value-of-a-statistical-life method

5min
pages 92-93

obesity

5min
pages 90-91

method

2min
page 87

Annex 4B: Supplementary details for intervention assumptions

2min
page 78

5.2 Direct medical costs attributable to overweight

1min
page 88

Key messages

1min
page 85

Results

2min
page 60

risk factors

5min
pages 57-58

Methods

2min
page 55

References

7min
pages 50-52

and obesity

2min
page 44

References

5min
pages 37-38

Socioeconomic and cultural influences

4min
pages 47-48

Dietary behaviors contributing to overweight and obesity Physical inactivity as a risk factor in the development of overweight

8min
pages 41-43

ages 5–9 years, by sex, 1975–2016

1min
page 30

2 Engagement of men and women in sufficient physical activity in

2min
page 23
Issuu converts static files into: digital portfolios, online yearbooks, online catalogs, digital photo albums and more. Sign up and create your flipbook.
Overweight and Obesity in Saudi Arabia by World Bank Publications - Issuu