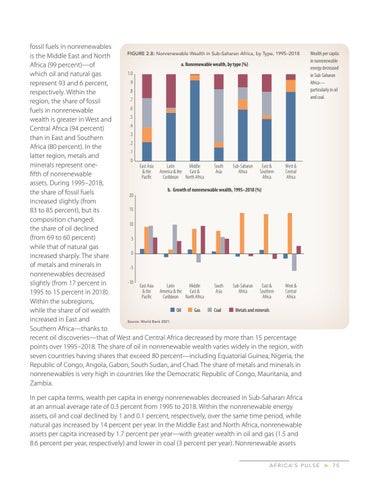
fossil fuels in nonrenewables FIGURE 2.8: Nonrenewable Wealth in Sub-Saharan Africa, by Type, 1995–2018 is the Middle East and North a. Nonrenewable wealth, by type (%) Africa (99 percent)—of 1.0 which oil and natural gas .9 represent 93 and 6 percent, .8 respectively. Within the .7 region, the share of fossil .6 fuels in nonrenewable .5 wealth is greater in West and .4 Central Africa (94 percent) .3 than in East and Southern .2 Africa (80 percent). In the .1 latter region, metals and 0 minerals represent oneEast Asia Latin Middle South Sub-Saharan East & West & & the America & the East & Asia Africa Southern Central fifth of nonrenewable Pacific Caribbean North Africa Africa Africa assets. During 1995–2018, b. Growth of nonrenewable wealth, 1995–2018 (%) the share of fossil fuels 20 increased slightly (from 15 83 to 85 percent), but its composition changed: 10 the share of oil declined (from 69 to 60 percent) 5 while that of natural gas 0 increased sharply. The share of metals and minerals in -5 nonrenewables decreased -10 slightly (from 17 percent in East Asia Latin Middle South Sub-Saharan East & West & & the America & the East & Asia Africa Southern Central 1995 to 15 percent in 2018). Pacific Caribbean North Africa Africa Africa Within the subregions, Oil Gas Coal Metals and minerals while the share of oil wealth increased in East and Source: World Bank 2021. Southern Africa—thanks to recent oil discoveries—that of West and Central Africa decreased by more than 15 percentage points over 1995–2018. The share of oil in nonrenewable wealth varies widely in the region, with seven countries having shares that exceed 80 percent—including Equatorial Guinea, Nigeria, the Republic of Congo, Angola, Gabon, South Sudan, and Chad. The share of metals and minerals in nonrenewables is very high in countries like the Democratic Republic of Congo, Mauritania, and Zambia.
Wealth per capita in nonrenewable energy decreased in Sub-Saharan Africa— particularly in oil and coal.
In per capita terms, wealth per capita in energy nonrenewables decreased in Sub-Saharan Africa at an annual average rate of 0.3 percent from 1995 to 2018. Within the nonrenewable energy assets, oil and coal declined by 1 and 0.1 percent, respectively, over the same time period, while natural gas increased by 14 percent per year. In the Middle East and North Africa, nonrenewable assets per capita increased by 1.7 percent per year—with greater wealth in oil and gas (1.5 and 8.6 percent per year, respectively) and lower in coal (3 percent per year). Nonrenewable assets A F R I C A’ S P U L S E
>
75
