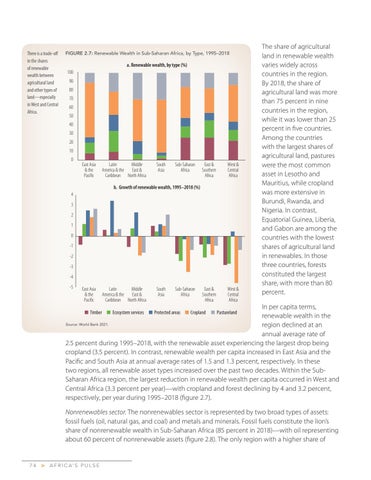
There is a trade-off in the shares of renewable wealth between agricultural land and other types of land—especially in West and Central Africa.
FIGURE 2.7: Renewable Wealth in Sub-Saharan Africa, by Type, 1995–2018
a. Renewable wealth, by type (%) 100 90 80 70 60 50 40 30 20 10 0
East Asia & the Pacific
Latin Middle America & the East & Caribbean North Africa
South Asia
Sub-Saharan Africa
East & Southern Africa
West & Central Africa
East & Southern Africa
West & Central Africa
b. Growth of renewable wealth, 1995–2018 (%) 4 3 2 1 0 -1 -2 -3 -4 -5
East Asia & the Pacific
Latin Middle America & the East & Caribbean North Africa
South Asia
Sub-Saharan Africa
The share of agricultural land in renewable wealth varies widely across countries in the region. By 2018, the share of agricultural land was more than 75 percent in nine countries in the region, while it was lower than 25 percent in five countries. Among the countries with the largest shares of agricultural land, pastures were the most common asset in Lesotho and Mauritius, while cropland was more extensive in Burundi, Rwanda, and Nigeria. In contrast, Equatorial Guinea, Liberia, and Gabon are among the countries with the lowest shares of agricultural land in renewables. In those three countries, forests constituted the largest share, with more than 80 percent.
In per capita terms, renewable wealth in the Source: World Bank 2021. region declined at an annual average rate of 2.5 percent during 1995–2018, with the renewable asset experiencing the largest drop being cropland (3.5 percent). In contrast, renewable wealth per capita increased in East Asia and the Pacific and South Asia at annual average rates of 1.5 and 1.3 percent, respectively. In these two regions, all renewable asset types increased over the past two decades. Within the SubSaharan Africa region, the largest reduction in renewable wealth per capita occurred in West and Central Africa (3.3 percent per year)—with cropland and forest declining by 4 and 3.2 percent, respectively, per year during 1995–2018 (figure 2.7). Timber
Ecosystem services
Protected areas
Cropland
Pastureland
Nonrenewables sector. The nonrenewables sector is represented by two broad types of assets: fossil fuels (oil, natural gas, and coal) and metals and minerals. Fossil fuels constitute the lion’s share of nonrenewable wealth in Sub-Saharan Africa (85 percent in 2018)—with oil representing about 60 percent of nonrenewable assets (figure 2.8). The only region with a higher share of
74
>
A F R I C A’ S P U L S E

