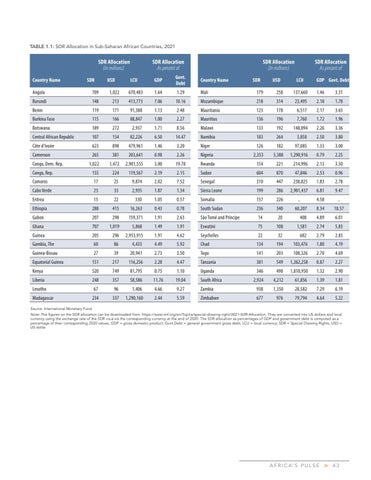
TABLE 1.1: SDR Allocation in Sub-Saharan African Countries, 2021
Country Name
SDR Allocation (In millions) SDR
USD
SDR Allocation As percent of LCU
GDP
Govt. Debt
Country Name
SDR Allocation (In millions) SDR
USD
SDR Allocation As percent of LCU
GDP Govt. Debt
Angola
709
1,022
670,483
1.64
1.29
Mali
179
258
137,660
1.46
3.31
Burundi
148
213
413,773
7.06
10.16
Mozambique
218
314
23,495
2.18
1.78
Benin
119
171
91,388
1.13
2.48
Mauritania
123
178
6,517
2.17
3.65
Burkina Faso
115
166
88,847
1.00
2.27
Mauritius
136
196
7,760
1.72
1.96
Botswana
189
272
2,937
1.71
8.56
Malawi
133
192
148,094
2.26
3.36
Central African Republic
107
154
82,226
6.50
14.47
Namibia
183
264
3,858
2.50
3.80
Côte d’Ivoire
623
898
479,961
1.46
3.20
Niger
126
182
97,085
1.33
3.00
Cameroon
265
381
203,641
0.98
2.26
Nigeria
2,353
3,388
1,290,916
0.79
2.25
Congo, Dem. Rep.
1,022
1,472
2,901,555
3.00
19.78
Rwanda
154
221
214,996
2.13
3.50
Congo, Rep.
155
224
119,567
2.19
2.15
Sudan
604
870
47,846
2.53
0.96
Comoros
17
25
9,874
2.02
7.52
Senegal
310
447
238,825
1.83
2.78
Cabo Verde
23
33
2,935
1.87
1.34
Sierra Leone
199
286
2,901,437
6.81
9.47
..
Eritrea
15
22
330
1.05
0.57
Somalia
157
226
4.58
..
Ethiopia
288
415
16,263
0.43
0.78
South Sudan
236
340
60,207
8.34
18.57
Gabon
207
298
159,371
1.91
2.63
São Tomé and Príncipe
14
20
408
4.89
6.01
Ghana
707
1,019
5,868
1.49
1.91
Eswatini
75
108
1,581
2.74
5.83
Guinea
205
296
2,953,915
1.91
4.62
Seychelles
22
32
682
2.79
2.83
Gambia, The
60
86
4,433
4.49
5.92
Chad
134
194
103,476
1.80
4.19
Guinea-Bissau
27
39
20,941
2.73
3.50
Togo
141
203
108,326
2.70
4.69
Equatorial Guinea
151
217
116,256
2.28
4.47
Tanzania
381
549
1,262,258
0.87
2.27
Kenya
520
749
81,795
0.75
1.10
Uganda
346
498
1,818,950
1.32
2.90
Liberia
248
357
58,586
11.76
19.04
South Africa
2,924
4,212
61,856
1.39
1.81
Lesotho
67
96
1,406
4.66
9.27
Zambia
938
1,350
28,582
7.29
6.19
Madagascar
234
337
1,290,160
2.44
5.59
Zimbabwe
677
976
79,794
4.64
5.22
Source: International Monetary Fund. Note: The figures on the SDR allocation can be downloaded from: https://www.imf.org/en/Topics/special-drawing-right/2021-SDR-Allocation. They are converted into US dollars and local currency using the exchange rate of the SDR vis-à-vis the corresponding currency at the end of 2020. The SDR allocation as percentages of GDP and government debt is computed as a percentage of their corresponding 2020 values. GDP = gross domestic product; Govt.Debt = general government gross debt; LCU = local currency; SDR = Special Drawing Rights, USD = US dollar.
A F R I C A’ S P U L S E
>
43
