From Jobs to Careers

Page 76

36

l

FROM JOBS TO CAREERS

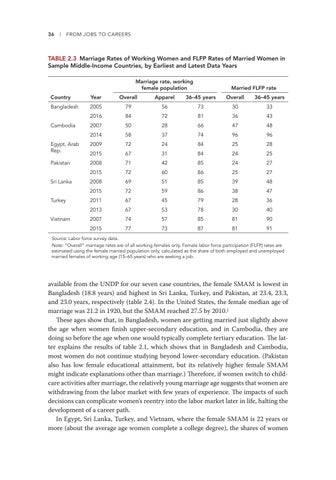
TABLE 2.3 Marriage Rates of Working Women and FLFP Rates of Married Women in Sample Middle-Income Countries, by Earliest and Latest Data Years Marriage rate, working female population

Married FLFP rate

Country

Year

Overall

Apparel

36–45 years

Overall

36–45 years

Bangladesh

2005

79

56

73

30

33

2016

84

72

81

36

43

Cambodia

2007

50

28

66

47

48

2014

58

37

74

96

96

Egypt, Arab Rep.

2009

72

24

84

25

28

2015

67

31

84

24

25

Pakistan

2008

71

42

85

24

27

2015

72

60

86

25

27

Sri Lanka

2008

69

51

85

39

48

2015

72

59

86

38

47

Turkey

2011

67

45

79

28

36

2013

67

53

78

30

40

Vietnam

2007

74

57

85

81

90

2015

77

73

87

81

91

Source: Labor force survey data. Note: “Overall” marriage rates are of all working females only. Female labor force participation (FLFP) rates are estimated using the female married population only, calculated as the share of both employed and unemployed married females of working age (15–65 years) who are seeking a job.

available from the UNDP for our seven case countries, the female SMAM is lowest in Bangladesh (18.8 years) and highest in Sri Lanka, Turkey, and Pakistan, at 23.4, 23.3, and 23.0 years, respectively (table 2.4). In the United States, the female median age of marriage was 21.2 in 1920, but the SMAM reached 27.5 by 2010.1 These ages show that, in Bangladesh, women are getting married just slightly above the age when women finish upper-secondary education, and in Cambodia, they are doing so before the age when one would typically complete tertiary education. The latter explains the results of table 2.1, which shows that in Bangladesh and Cambodia, most women do not continue studying beyond lower-secondary education. (Pakistan also has low female educational attainment, but its relatively higher female SMAM might indicate explanations other than marriage.) Therefore, if women switch to childcare activities after marriage, the relatively young marriage age suggests that women are withdrawing from the labor market with few years of experience. The impacts of such decisions can complicate women’s reentry into the labor market later in life, halting the development of a career path. In Egypt, Sri Lanka, Turkey, and Vietnam, where the female SMAM is 22 years or more (about the average age women complete a college degree), the shares of women


Turn static files into dynamic content formats.

Create a flipbook

Articles inside

A.6 Average Monthly Wages for Females and Both Genders, Manufacturing and All Industries, by Case Country

1min
page 175

A.9 Details of Education Level Data Used for Standardized Analysis, by Case Country

2min
pages 177-178

A.4 Average Monthly Wages in Local Currency, by Industry, in Case Countries

1min
page 173

Education Analysis Issues and Methodology

2min
page 170

A.5 Average Monthly Wages in the Apparel Industry, by Gender, and the Gender Wage Gap in Case Countries

1min
page 174

5.2 North Carolina and Bangladesh: Programs That Spotlight Apparel Careers

2min
page 159

Seven Middle-Income Countries, 2020

6min
pages 161-163

Break Glass Ceilings

2min
page 160

Conclusion

2min
page 164

Increase Access to Education to Promote Female Participation in Careers

4min
pages 157-158

Introduction

4min
pages 150-151

Increase Participation of Female Production Workers in Export-Oriented Apparel Manufacturing and Related Industries

3min
pages 153-154

Key Messages

1min
page 149

Increase the Number of Female Supervisors and Upgrade Apparel Jobs to Manufacturing-Related Services

4min
pages 155-156

Economies, 1995–2015

1min
page 139

Conclusion

1min
page 145

Bangladesh, Cambodia, and Vietnam, 2013

1min
pages 140-141

Can Apparel Exports Increase Jobs and Female Labor Force Participation?

2min
page 136

The Multifiber Arrangement, Export Dependence, and Women

1min
page 132

Conclusion

2min
page 119

of Peak Apparel Exports

4min
pages 134-135

References

3min
pages 122-124

by Scale of Operation

1min
page 131

Notes

4min
pages 120-121

Key Messages

1min
page 125

Middle-Income Countries and the United States

1min
page 118

The Three Female Employment Groups

2min
page 106

The Three Barriers to Career Progression

2min
page 108

Sample Middle-Income Countries, Mid-2010s

4min
pages 116-117

Key Messages

1min
page 101

Selected Industries, 2017

1min
page 105

Global Patterns of Female Labor Intensity

2min
page 103

Introduction

2min
page 102

Annex 2A: Mincerian Equation Results

2min
page 90

Middle-Income Countries, 2000s–2010s

2min
page 78

Sample Middle-Income Countries, by Earliest and Latest Data Years

2min
page 76

Introduction

1min
page 68

Indicator One: Investment in Human Capital

4min
pages 70-71

Indicator Four: Earnings Gaps between Men and Women

4min
pages 79-80

Key Messages

1min
page 67

References

6min
pages 63-66

1.2 Job Classification by ISCO Code, Skill Level, and Education Level

2min
page 61

B1.3.1 Share of Total Female Employment, by Sector and Selected Industries, in Sample Middle-Income Countries, 2017

1min
page 60

Apparel Jobs to Careers

1min
page 55

Feminization U-Shaped Curve

2min
page 50

National Income, 2017

3min
pages 48-49

1.3 Apparel: The Most Important Manufacturing Industry for Female Jobs

1min
page 59

Contributions to Higher Family Income

4min
pages 53-54

Country Cases and Labor Market Classifications

4min
pages 56-57

Middle-Income Countries

1min
page 58

O.4 Returns to Education for Females in Selected Countries, 2007–15 xxvi O.5 Decomposition of Occupations in Women’s and Total Employment Worldwide, by Broad Category and Country Income Level, 2017 xxvii O.6 Relationships of GVC Activities and Country Roles to Occupational Skill and Country Income Levels xxix 1.1 The Path from Jobs to Careers for US Women in the Twentieth Century

4min
pages 46-47
Issuu converts static files into: digital portfolios, online yearbooks, online catalogs, digital photo albums and more. Sign up and create your flipbook.
From Jobs to Careers by World Bank Publications - Issuu