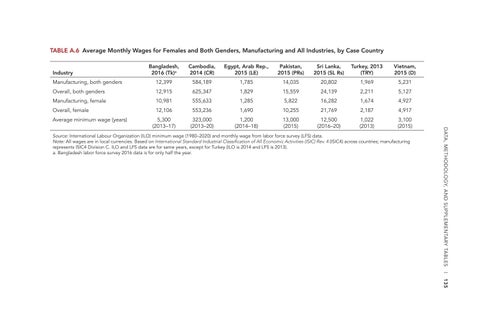
TABLE A.6 Average Monthly Wages for Females and Both Genders, Manufacturing and All Industries, by Case Country Cambodia, 2014 (CR)
Egypt, Arab Rep., 2015 (LE)
Pakistan, 2015 (PRs)
Sri Lanka, 2015 (SL Rs)
Turkey, 2013 (TRY)
Vietnam, 2015 (D)
Manufacturing, both genders
12,399
584,189
1,785
14,035
20,802
1,969
5,231
Overall, both genders
12,915
625,347
1,829
15,559
24,139
2,211
5,127
Manufacturing, female
10,981
555,633
1,285
5,822
16,282
1,674
4,927
Overall, female
12,106
553,236
1,690
10,255
21,769
2,187
4,917
5,300 (2013–17)
323,000 (2013–20)
1,200 (2014–18)
13,000 (2015)
12,500 (2016–20)
1,022 (2013)
3,100 (2015)
Average minimum wage (years)
Source: International Labour Organization (ILO) minimum wage (1980–2020) and monthly wage from labor force survey (LFS) data. Note: All wages are in local currencies. Based on International Standard Industrial Classification of All Economic Activities (ISIC) Rev. 4 (ISIC4) across countries; manufacturing represents ISIC4 Division C. ILO and LFS data are for same years, except for Turkey (ILO is 2014 and LFS is 2013). a. Bangladesh labor force survey 2016 data is for only half the year.
Data, Methodology, and Supplementary Tables l
Bangladesh, 2016 (Tk)a
Industry
135

