Executive Summary
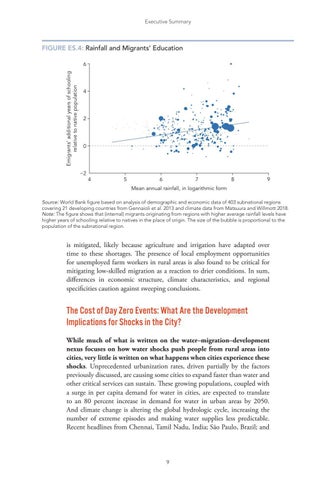
FIGURE ES.4: Rainfall and Migrants’ Education
Emigrants’ additional years of schooling relative to native population
6
4
2
0
−2
4
5
6
7
8
9
Mean annual rainfall, in logarithmic form Source: World Bank figure based on analysis of demographic and economic data of 403 subnational regions covering 21 developing countries from Gennaioli et al. 2013 and climate data from Matsuura and Willmott 2018. Note: The figure shows that (internal) migrants originating from regions with higher average rainfall levels have higher years of schooling relative to natives in the place of origin. The size of the bubble is proportional to the population of the subnational region.
is mitigated, likely because agriculture and irrigation have adapted over time to these shortages. The presence of local employment opportunities for unemployed farm workers in rural areas is also found to be critical for mitigating low-skilled migration as a reaction to drier conditions. In sum, differences in economic structure, climate characteristics, and regional specificities caution against sweeping conclusions.
The Cost of Day Zero Events: What Are the Development Implications for Shocks in the City? While much of what is written on the water–migration–development nexus focuses on how water shocks push people from rural areas into cities, very little is written on what happens when cities experience these shocks. Unprecedented urbanization rates, driven partially by the factors previously discussed, are causing some cities to expand faster than water and other critical services can sustain. These growing populations, coupled with a surge in per capita demand for water in cities, are expected to translate to an 80 percent increase in demand for water in urban areas by 2050. And climate change is altering the global hydrologic cycle, increasing the number of extreme episodes and making water supplies less predictable. Recent headlines from Chennai, Tamil Nadu, India; São Paulo, Brazil; and
9


