41
Landscape of Short-Cycle Programs in Latin America and the Caribbean
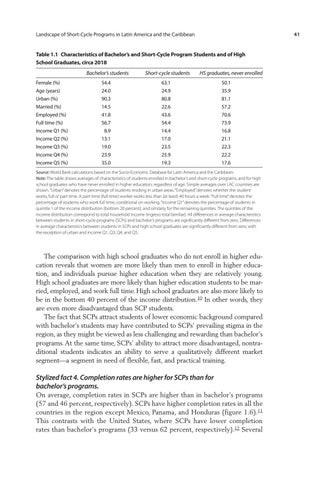
Table 1.1 Characteristics of Bachelor’s and Short-Cycle Program Students and of High School Graduates, circa 2018 Female (%) Age (years) Urban (%) Married (%) Employed (%) Full time (%) Income Q1 (%) Income Q2 (%) Income Q3 (%) Income Q4 (%) Income Q5 (%)
Bachelor’s students
Short-cycle students
54.4 24.0 90.3 14.5 41.8 56.7 8.9 13.1 19.0 23.9 35.0
63.1 24.9 80.8 22.6 43.6 54.4 14.4 17.0 23.5 25.9 19.3
HS graduates, never enrolled 50.1 35.9 81.1 57.2 70.6 73.9 16.8 21.1 22.3 22.2 17.6
Source: World Bank calculations based on the Socio-Economic Database for Latin America and the Caribbean. Note: The table shows averages of characteristics of students enrolled in bachelor’s and short-cycle programs, and for high school graduates who have never enrolled in higher education, regardless of age. Simple averages over LAC countries are shown. “Urban” denotes the percentage of students residing in urban areas. “Employed” denotes whether the student works, full or part time. A part-time (full-time) worker works less than (at least) 40 hours a week. “Full time” denotes the percentage of students who work full time, conditional on working. “Income Q1” denotes the percentage of students in quintile 1 of the income distribution (bottom 20 percent), and similarly for the remaining quintiles. The quintiles of the income distribution correspond to total household income (ingreso total familiar). All differences in average characteristics between students in short-cycle programs (SCPs) and bachelor’s programs are significantly different from zero. Differences in average characteristics between students in SCPs and high school graduates are significantly different from zero, with the exception of urban and income Q1, Q3, Q4, and Q5.
The comparison with high school graduates who do not enroll in higher education reveals that women are more likely than men to enroll in higher education, and individuals pursue higher education when they are relatively young. High school graduates are more likely than higher education students to be married, employed, and work full time. High school graduates are also more likely to be in the bottom 40 percent of the income distribution.10 In other words, they are even more disadvantaged than SCP students. The fact that SCPs attract students of lower economic background compared with bachelor’s students may have contributed to SCPs’ prevailing stigma in the region, as they might be viewed as less challenging and rewarding than bachelor’s programs. At the same time, SCPs’ ability to attract more disadvantaged, nontraditional students indicates an ability to serve a qualitatively different market segment—a segment in need of flexible, fast, and practical training.
Stylized fact 4. Completion rates are higher for SCPs than for bachelor’s programs. On average, completion rates in SCPs are higher than in bachelor’s programs (57 and 46 percent, respectively). SCPs have higher completion rates in all the countries in the region except Mexico, Panama, and Honduras (figure 1.6).11 This contrasts with the United States, where SCPs have lower completion rates than bachelor’s programs (33 versus 62 percent, respectively).12 Several
